Article

Combining Disease Mechanism and Machine Learning to Predict Wheat Fusarium Head Blight

1
School of Mathematical Sciences, Capital Normal University, Beijing 100048, China
2
Key Laboratory of Digital Earth Science, Aerospace Information Research Institute, Chinese Academy of Sciences, Beijing 100094, China
3
University of Chinese Academy of Sciences, Beijing 100049, China
4
Key Laboratory of Earth Observation of Hainan Province, Hainan Research Institute, Aerospace Information Research Institute, Chinese Academy of Sciences, Sanya 572029, China
*
Author to whom correspondence should be addressed.
Remote Sens. 2022, 14(12), 2732; https://doi.org/10.3390/rs14122732
Submission received: 29 April 2022 / Revised: 28 May 2022 / Accepted: 3 June 2022 / Published: 7 June 2022
(This article belongs to the Special Issue Recent Progress in UAV-AI Remote Sensing)

Abstract

:
Wheat Fusarium head blight (FHB) can be effectively controlled through prediction. To address the low accuracy and poor stability of model predictions of wheat FHB, a prediction method of wheat FHB that couples a logistic regression mechanism-based model and k-nearest neighbours (KNN) model is proposed in this paper. First, we selected predictive factors, including remote sensing-based and meteorological factors. Then, we quantitatively expressed the factor weights of the disease occurrence and development mechanisms in the disease prediction model by using a logistic model. Subsequently, we integrated the obtained factor weights into the predictive factors and input the predictive factors with weights into the KNN model to predict the incidence of wheat FHB. Finally, the accuracy and generalizability of the models were evaluated. Wheat fields in Changfeng, Dingyuan, Fengyuan, and Feidong counties, Anhui Province, where wheat FHB often occurs, were used as the study area. The incidences of wheat FHB on 29 April and 10 May 2021 were predicted. Compared with a model that did not consider disease mechanism, the accuracy of our model increased by approximately 13%. The overall accuracies of the models for the two dates were 0.88 and 0.92, and the F1 index was 0.86 and 0.94, respectively. The results show that the predictions made with the logistic-KNN model had higher accuracy and better stability than those made with the KNN model, thus achieving remote sensing-based high-precision prediction of wheat FHB.

Graphical Abstract

1. Introduction

Fusarium head blight (FHB) is a major wheat disease caused by Fusarium graminearum (Gibberella zeae) [1]. In recent years, due to the large-scale promotion of wheat and maize rotation and returning crop straw to the field, as well as the influence of climate change and other factors, wheat FHB in China has gradually spread from the south to the north, and the prevalence and severity of this disease have increased significantly [2]. In addition, wheat varieties planted in most areas in China lack resistance to FHB. After wheat is infected by FHB, toxic substances such as deoxynivalenol (DON), a metabolite of the pathogen, seriously endanger human and animal safety [3,4]. According to previous reports, in epidemic years, FHB can generally cause 5~15% yield loss, with losses of up to 40% in severe cases, which directly affects food security [5,6]. Because of the frequent occurrence and rapid development of wheat FHB, once the disease occurs, the damage to the wheat field is irreversible. Therefore, high-precision prediction plays an important role in the accurate formulation of prevention and control plans.
Selecting and determining important host and habitat factors are necessary for remote sensing-based prediction of crop diseases. At present, scholars worldwide mainly carry out disease prediction based on meteorological information [7,8]. By studying the quantitative relationship between meteorological factors, such as temperature, precipitation, rainy days and wind direction, and disease prevalence, and using these factors as input variables to build prediction models, regional disease prediction can be realized [9]. In recent years, the rapid development of Earth observation technology has provided a new opportunity for crop disease prediction [10]. Remote sensing technology can be used to obtain continuous spatial information of farmland. Many scholars try to monitor and predict crop diseases based on remote sensing. Li Xingrong et al. identified cotton root rot based on a remote sensing spectral vegetation index and achieved high accuracy. Bajwa S G et al. used a remote sensing vegetation index to monitor soybean diseases and achieved good results [11,12]. However, in the field of disease prediction, most studies are based on only meteorological information or remote sensing indexes that cover a single timeframe, and the accuracy and spatial resolution of these predictions are not high [13,14,15]. In this paper, by combining the multiscale meteorological factors of the integrated habitat with temporally varying remote sensing factors, according to the different sensitivities of factors to wheat FHB in different growth stages, factors were selected for timeseries prediction.
In recent studies, machine learning techniques have been extensively explored for plant disease studies due to their rapid and precise measurement capacities. Many scholars have tried to predict diseases based on machine learning models. Elham Khalili et al. predicted soybean carbon rot based on the linear regression of L1 and L2 regularization terms (LR-L1 and LR-L2), Multi-layer Perceptron (MLP), Random Forest (RF), Gradient Boosting Tree (GBT) and support vector machine (SVM) models. The accuracy of these models reached higher than 90%. Among the models, the sensitivity and specificity of GBT were the best, reaching 96.25% and 97.33%, respectively [16]. Diego Bedin Marin et al. predicted coffee leaf rust based on the Logical Model Tree (LMT), Random Tree (RT) and RF models. The results showed that the LMT method contributed the most to the accurate prediction of early and several infection categories [17]. Some scholars have also established mechanistic models to simulate the occurrence and development processes of diseases and have achieved good results [18]. Sarinya Kirtpaiboona et al. used a Susceptible Exposed Infectious Recovered (SEIR) model to simulate the occurrence and development of rice blasts. Then, they predicted the severity of rice blast and achieved good results [19]. Henderson et al. used the logistic regression mechanism model to predict potato late blight. Their results showed that the logistic model could accurately predict the occurrence of late potato blight, with sensitivity and specificity values of 75% and 62.5%, respectively [20]. However, although the prediction accuracy based on the machine learning model was high, it is a black box model [21] that fails to consider the biological mechanism of disease occurrence and development and has poor generalization and stability. The SEIR model requires many parameters, and its accuracy and stability depend on whether the input information is accurate and complete [19,22]. The structure of the logistic mechanism-based model is more suitable for local simulation [18,23]. To address the above-mentioned problems, this paper first quantitatively expressed the factor weight of the disease occurrence and development mechanism in the disease prediction model by using a logistic mechanism-based model, and then, factor weights were fused into the disease prediction factors and input into the KNN model. By inputting the prediction factor of the fusion weight, the prediction accuracy and stability of the KNN model for wheat FHB can be improved, and high-precision prediction of wheat FHB can be realized.
In this paper, a logistic mechanism-based model and KNN model were coupled to study the high-precision prediction of winter wheat FHB. First, we obtained satellite images of the study area with high temporal and spatial resolutions and information about the study area. Then, we extracted the prediction factors by integrating remote sensing and meteorology. Factors were selected according to different wheat growth stages, and the factor weights of disease occurrence and development mechanism in the disease prediction model were quantitatively expressed according to the logistic mechanism-based model. Then, the factor weights were combined with the predictive factors and input into the prediction model to predict wheat Fusarium head blight. Remote sensing-based high-precision prediction of wheat FHB was realized.

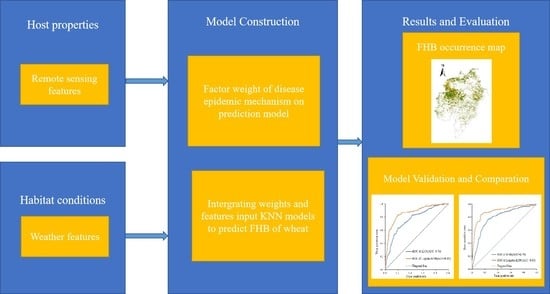
2. Materials and Methods

2.1. Study Area and Data

The study area addressed in this paper is located in Changfeng county, Dingyuan county, Fengyuang county, and Feidong county (29°24′N~34°39′N, 114°53′E~119°39′E), Anhui Province (Figure 1). The area is located in the lower reaches of the Yangtze River. The planting area of winter wheat is approximately 2450 square kilometres, accounting for 30% of the total area. The wheat seeding time in Anhui, including our study area, was in October 2020. The main wheat variety here is Yangmai 25, which is susceptible to FHB. The region has a subtropical humid continental monsoon climate, with an annual precipitation of approximately 1000 mm and an average annual temperature of 15 °C [24,25]. Due to the influence of monsoons, the amount of precipitation is highest in spring and summer. In addition, due to the high planting density of wheat, wheat varieties susceptible to FHB, sufficient bacterial sources, suitable precipitation and temperature, and other conditions, the occurrence of winter wheat FHB is frequent in this area [26].
We obtained ground survey data, satellite images, and meteorological data for the abovementioned study area. To collect reference data for wheat FHB predictions, we conducted two field investigations on 29 April and 10 May 2021. We selected 154 homogenous wheat areas with width, length, and the distance to each one all larger than 30 m were selected. A GNSS receiver was utilized to obtain the longitude and latitude of the centre of the area. In each area, five 1 × 1 m 2 plots were randomly selected out to investigate the number of wheat plants and diseased plants. Subsequently, the average disease incidence of the five plots was calculated to be the disease incidence in the area. Satellite images include Sentinel-2 reflectance products, MODIS reflectance products and Sentinel-3 reflectance products. The Sentinel-2 products have a spatial resolution of 20 m, MODIS products have a spatial resolution of 250 m and Fractional Vegetation Cover (FVC) product from the Copernicus Global Land Service (CCLS) have a spatial resolution of 250 m. The meteorological data include daily temperature, relative humidity and precipitation from ground meteorological stations. Spatial kriging interpolation of the meteorological data was carried out based on data from 47 meteorological stations in and around the study area. The spatial resolution of the interpolated meteorological data is 250 m.

2.2. Construction of a Remote Sensing Prediction Model of Wheat FHB

To solve the problems of low prediction accuracy and poor model stability caused by less consideration of the contribution of disease occurrence and development mechanisms in wheat FHB prediction models and achieve high-precision predictions of wheat FHB, in this paper, a coupled logistic mechanism-based model and KNN machine learning model was proposed to predict wheat FHB. The basic steps of the model are as follows. First, due to the different sensitivities of wheat FHB to disease prediction factors at different stages of wheat growth, we selected potential disease prediction factors and divided them into test and training sets at different stages of growth [13,27]. Second, the factor weights of disease occurrence and development mechanism in the disease prediction model were quantitatively expressed by using a logistic regression mechanism-based model, and the factor weight was fused with the prediction factor. Finally, the prediction factors with weights were input into the KNN model to create high-precision predictions of wheat FHB, and the model was evaluated (Figure 2).

2.2.1. Selection of Disease Prediction Factors

According to the characteristics of wheat FHB, we preliminarily selected the remote sensing factors and meteorological factors. Wheat FHB usually causes changes in leaf morphology, colour, and other aspects of plant morphology, resulting in changes in optical properties [15]. Therefore, when selecting the remote sensing features used to describe the crop growth environment, we mainly considered the features that can reflect crop nutrition and disease stress, for example, the Fractional Vegetation Cover (FVC), Plant Senescence Reflection Index (PSRI), Red-edge Head Blight Index (REHBI), Modified Chlorophyll Absorption Ratio Index (MCARI), Differential Vegetation Index (DVI), Triangular Vegetation Index (TVI), etc. [28,29,30,31,32]. Among these indexes, the PSRI reflects stress in the crop canopy well [28,29], and the TVI describes the radiant energy absorbed by pigments [33].
For meteorological factors, we first investigated the heading stage and flowering stage of wheat in the study area. The heading date of wheat in our study area was 20 April 2021, and the flowering date was 24 April 2021. Then, 3, 5 and 7 days before and after flowering and heading, we calculated the average temperature (TAVG), humidity (RHAVG) and precipitation (PAVG) respectively. We also calculated the number of days with humidity greater than 60%, 70% and 80% (RHT60, RHT70, and RHT80, respectively) and temperature greater than 15 °C and less than 30 °C and the number of days with precipitation (PDAY) [34].
To improve the accuracy of the prediction model and prevent redundancy caused by the inclusion of too many features, at the two time points (29 April and 10 May), we adopted the method of Logistic + L1 regularization and Fisher Score to select the factor library containing 303 remote sensing factors and meteorological factors.

2.2.2. The Factor Weight of the Disease Epidemic Mechanism in the Prediction Model Was Expressed Quantitatively

The logistic regression model is a mechanism model used to describe the progress of wheat FHB [35], and its application and interpretation have been reviewed in detail (Campbell and Madden, 1990). The logistic regression expression is:
y = 1 1 + e β T X
The vector X = ( x 0 , x 1 , x 2 , ... x n )   is the prediction vector and is composed of each disease prediction factor, including both remote sensing-based factors and meteorological factors. β = ( β 0 , β 1 , β 2 , ... , β n ) are the coefficients of each factor, and y is the disease probability of wheat FHB [18,36]. When there was no collinearity among the factors, the logistic regression model that fit with the training set quantitatively expressed the factor weights of disease occurrence and development mechanism in the disease prediction model [37]. The factor weights were expressed quantitatively after the square of the standard regression coefficient of each disease prediction factor was normalized.
There was usually collinearity among disease prediction factors, which affected the standard regression coefficient fitted by the logistic regression; therefore, it was necessary to reduce collinearity among the disease prediction factors [38]. First, the orthogonal representation of the original factors was found by using singular value decomposition to remove the correlation between the disease prediction factors [39], and it was assumed that X was a full rank matrix of disease prediction factors of size N*J, where N is the number of rows, J is the number of columns, and N > J. Then, singular value decomposition was performed on X:
X = P Δ Q T
where P is the feature matrix of XX T , Q is the feature matrix of X T X , and the matrix Δ is composed of the square root of the eigenvalues of X T X . Therefore, the least-squares orthogonal standard of factor X was approximate:
Z = PQ T
Since there was no collinearity between the various characteristic components of Z, we first used Z as the training set. The standard regression coefficient for disease prediction factor Z was fitted using the logistic regression model, and then the standard regression coefficient was converted to a standard regression for disease prediction factor X using the relationship between the original disease prediction factors X and Z [37].
Because the outcome variable of the logistic regression is usually the category, the method of calculating the standardized regression coefficient by multiple linear regression was not applicable to the logistic regression. Menard (2004) proposed a method for calculating the standard regression coefficient with Z as the disease prediction factor, and the expression is:
β M * = ( b ) ( s Z ) ( R 0 ) / ( s y * )
where b is the nonstandardized logistic regression coefficient, s Z is the standard deviation of the disease prediction factor Z, R 0 is the square root of the goodness of fit of the logistic regression, and s y * is the standard deviation of the predicted value y * in the logistic regression [40]. Since the disease prediction factors in Z have no collinearity, β M * 2 can represent the relative importance of the disease prediction factors. Below, we convert β M * 2 into the relative importance coefficient when X is the disease prediction factor. First, we performed a linear regression for each component in X about Z and obtained the linear regression coefficient, the expression of which is as follows:
ω * = ( Z T Z ) 1 Z T X
Using Equations (4) and (5), we obtained the relative importance coefficient ε * 2 of disease prediction factor X [37], expressed as follows:
ε * 2 = ω * 2 β M * 2
Finally, we standardized the value to obtain the factor weight:
ω i = ε * 2 i i = 1 m ε * 2 i

2.2.3. Prediction of Wheat FHB with KNN Coupled with the Logistic Mechanism-Based Model

The selected disease prediction factors from 29 April 2021 and 10 May 2021 were divided into a training set and test set at 7:3. We quantitatively expressed the factor weights of disease occurrence and development mechanism in the prediction model by using a logistic regression model and joined them with the prediction factors. The disease prediction factors with weights were input into the KNN model to predict the incidence of wheat FHB in the study area on 29 April 2021 and 10 May 2021. The prediction accuracy was calculated, and the model was evaluated using the F1 index as well as receiver operating characteristic (ROC) curves.
Although KNN is simple, it can achieve good classification results in many scenarios [41,42,43,44]. However, due to its lack of focus on mechanisms, the KNN model has a relatively general performance in predicting wheat disease [45]. Therefore, we used the logistic mechanism-based model to quantitatively express the factor weights of disease occurrence and development mechanisms in the KNN model, to integrate the weights with the prediction factors, and to input the prediction factors with the weights into the KNN model to obtain a KNN wheat FHB prediction model coupled with a logistic mechanism-based model (logistic-KNN). The distance formula for the logistic-KNN model is as follows:
d sj = i = 1 m ( a si b ji ) 2     ω i i = 1 ,   2 . . . ,   m
where d sj is the Euclidean distance between the sth training sample and the jth test sample, a si is the ith component of the sth training sample, b ji is the ith component of the jth test sample, ω i   is the factor weight of the disease development mechanism in the prediction model, and m is the number of disease prediction factors. In the process of prediction, we randomly divided the set of prediction factors into a training set and a test set at a certain proportion. To ensure the best prediction effect from the model, we used cross-validation to obtain the best k value [46]. Then, to evaluate the performance of the KNN model with the best k value coupled with the logistic mechanism-based model, we tested the predictive ability of the model with the test dataset. We calculated the overall accuracy to evaluate the accuracy of the classification. Then, considering the precision and recall, we calculated the F1 score. The F1 score is defined as follows:
F 1 = 2 P R P + R
where P is the precision value, and R is the recall value. In addition, we used the ROC curve to evaluate the specificity and sensitivity of the model.
Due to the coupling of the logistic mechanism-based model and KNN model compared with traditional KNN models, the model had higher accuracy and better stability. It was more suitable for the high-precision prediction of wheat FHB.

3. Results

3.1. Selection of Remote Sensing-Based Disease Prediction Factors of Wheat FHB

Based on the host and habitat conditions, we created 303 prediction factors, including meteorological factors and remote sensing-based factors. According to the sensitivities of wheat FHB factors at different growth stages, we selected factors at the two time points of 29 April 2021 and 10 May 2021 by using the combination of logistic and L1 regularization and Fisher scores. On 29 April 2021, we obtained eight prediction factors (Table 1), including six meteorological factors and two remote sensing-based factors, and on 10 May 2021, we obtained seven prediction factors (Table 2).

3.2. Quantitative Expression of the Weight of the Prediction Model Based on the Logistic Mechanism-Based Model

The selected disease prediction factors for 29 April and 10 May were divided into a test set and training set at a 3:7 ratio, and then, the disease prediction factors in the training set were decomposed by singular value decomposition to obtain linearly independent disease prediction factors. Then, we obtained the weights of the factors using the linearly independent disease prediction factors (Figure 3).
We found that the weights of meteorological factors were generally larger than those of the remote sensing-based factors on 29 April 2021 and 10 May 2021, and the weights of the meteorological factors related to humidity were larger than those of the remaining meteorological factors. Thus, the weight of disease prediction factors expresses the mechanism of disease occurrence.

3.3. Remote Sensing-Based Prediction of Wheat FHB

Because remote sensing images vary with time, remote sensing factors will change over time. The meteorological factors were based on data acquired at meteorological stations rather than prediction data; thus, the meteorological factors associated with the samples did not change. That is, the factors associated with each sample include remote sensing-based factors and meteorological factors; the remote sensing-based factors change with the acquisition of satellite images, and the meteorological factors are fixed. Based on the characteristics of samples in different periods, the incidence of wheat FHB on 29 April 2021 and 10 May 2021 was predicted. The 154 sample points collected on these two dates were randomly divided into a training set and test set at a 7:3 ratio. The training set was used to determine the parameter values of the logistic-KNN model, and a prediction model was constructed for these two dates to calculate the accuracy of wheat disease predictions on each date. The prediction results were displayed on a map. Then, the total accuracy, classification performance, and generalizability of the models were evaluated with the corresponding test datasets. For comparison, we constructed and evaluated a KNN model in the same way.
First, to optimize the parameter value k, which is the number of nearest neighbours selected in each prediction, in the logistic-KNN model, we conducted a five-fold cross-validation with the training datasets from different dates [46,47]. Taking the prediction for 29 April 2021 as an example, Table 1 shows the accuracy of the coupled logistic-KNN model for different k values. For the prediction based on meteorological and remote sensing-based characteristics on 29 April 2021, the average prediction accuracy results (Table 3) indicate that the accuracy rate was highest when k = 3. The k value of the coupled logistic-KNN model for 10 May 2021 was determined in the same way.
We used the logistic-KNN model with the best k value to predict the occurrence of wheat FHB on 29 April 2021 and 10 May 2021. Moreover, we compared the KNN model with the logistic-KNN model. The prediction results were divided into two states: infected and not infected. As shown in Figure 4, the occurrence of wheat FHB is generally severe in Dingyuan county. The distribution of diseased wheat was approximately the same overall, and the trends were similar between the two models. In general, the prevalence of wheat FHB gradually increased over time. The comparison of the prediction results of the KNN model and logistic-KNN model showed that the KNN model indicated more severe infection on 29 April 2021 and less severe infection on 10 May 2021 than the logistic-KNN model.
To evaluate the advantages of the logistic-KNN model in predicting wheat FHB, we compared the performance of the KNN model with that of the logistic-KNN model. Taking 0 as the threshold of the disease incidence, wheat plots with a disease incidence value of 0 indicated absence of diseased wheat, and wheat plots with a disease incidence greater than 0 indicated diseased wheat. The overall accuracy and F1 index values of the two models on different dates were calculated (Table 4 and Table 5). The results indicate that the logistic-KNN model was better than the KNN model in terms of the overall accuracy and F1 index value. The logistic-KNN model had more advantages in predicting wheat FHB.
In addition, we randomly divided the ground survey points from 29 April 2021 and 10 May 2021 into training and testing sets at a 7:3 ratio. We made 10 predictions, obtained 10 ROC curves, obtained the average ROC curve, and calculated the AUC (Figure 5a,b). The comparison results show that the logistic-KNN model had stronger specificity and sensitivity than the KNN model, and the AUC was greater than 0.5, indicating that the two models were better than a random guess for predicting wheat FHB and thus have reference value. In addition, the logistic-KNN model had a stronger prediction ability and generalizability than the KNN model. As the prediction date neared the onset of wheat FHB, the AUC index value and prediction accuracy increased.

4. Discussion

Researchers have used various methods to predict wheat FHB [1,48,49]. Compared with previous methods, the main advantage of the method proposed in this paper is the use of a logistic mechanism-based model to quantitatively express the factor weights of disease occurrence and development mechanism in disease prediction models. Considering a comprehensive set of meteorological and remote sensing factors, the disease prediction factors of wheat FHB for 29 April 2021 and 10 May 2021 were selected according to the incidence characteristics of wheat FHB in different growth stages. Finally, REHBI and MCARI were selected as the remote sensing-based factors for the 29 April 2021 models, and FVC and PSRI were selected as the remote sensing-based factors for the 10 May 2021 models, reflecting the growth status of wheat. In addition, five meteorological factors before and after heading or flowering were included in the prediction factors selected. Based on the selected disease prediction factors, we predicted the occurrence of wheat FHB on 29 April 2021 and 10 May 2021. In addition, we compared the logistic-KNN model with the KNN model and found that the former had higher classification accuracy and stability for wheat FHB.
Previously, researchers used machine learning models to predict wheat FHB and achieved good results, which proved the feasibility of applying machine learning models in the prediction of wheat FHB [50,51,52]. However, the interpretability of machine learning models is poor; thus, it is difficult to achieve stable predictions of wheat FHB [53]. In this paper, a high-precision model for predicting wheat FHB was constructed by coupling a logistic mechanism-based model with a KNN model. Compared with the KNN model alone, the generalizability and stability were improved in the logistic-KNN model. Although this study has achieved satisfactory results in the prediction of wheat FHB, there are still some deficiencies that need to be improved upon in future research. First, apart from these key meteorological factors that were considered in our methods, numerous other meteorological factors influence the occurrence of FHB infection, and the effect cannot be ignored under certain circumstances. Thus, in future studies, we will try to add predictors such as wind speed to predict wheat FHB. Then, the logistic-KNN model needs to include all the points in the training set when searching for the nearest neighbour; this will result in a large number of calculations in the prediction [54,55,56,57]. Many methods have been used to reduce the number of calculations associated with finding nearest neighbour points, such as constructing a k-d tree [58,59]. To construct a more extensive and effective prediction model of wheat FHB, these methods can be used to reduce the number of calculations in future research. Second, the method proposed in this paper produces binary classifications based on multiple features. To achieve more accurate predictions of wheat FHB, we will try to classify wheat FHB according to the disease grade in future research.
Our method results in a more effective model for predicting wheat FHB. Remote sensing-based and meteorological factors are included in the prediction models as input. As the remote sensing-based factors were more closely related than the meteorological factors to the heading and flowering periods, the performance of the model was better when remote sensing-based factors were included, with accuracies reaching more than 90% and the F1 index reaching approximately 0.9. We evaluated the KNN model and logistic-KNN model, and the results indicated that the former had better model accuracy, stability, and generalizability than the latter, and the prediction accuracy improved by approximately 13% when the logistic-KNN model was used.

5. Conclusions

In this study, a remote sensing-based prediction method for wheat FHB was established. The mechanism of disease occurrence and development plays a key role in the prediction of wheat FHB. By inputting disease prediction factors that integrate host and habitat conditions into the logistic mechanism-based model, the factor weights of disease occurrence and development mechanism in the disease prediction model were quantitatively expressed. The disease prediction factors joined with factor weights, which were input into the KNN model to predict the incidence of wheat FHB in the study area. The results show that the logistic-KNN model can improve the prediction accuracy and stability of machine learning models.
In future research, we will consider some important problems. For example, we will try to use the k-d tree to reduce the computational complexity of the model and make the model more widely used, and we will try to classify the severity of wheat FHB and achieve a more accurate prediction of wheat FHB.

Author Contributions

Data curation, L.L. (Linyi Liu); formal analysis, Y.D., Y.X. and L.L. (Lu Li); funding acquisition, Y.D. and W.H.; investigation, L.L. (Linyi Liu); methodology, L.L. (Lu Li), Y.D., Y.X. and X.Z.; resources, W.H.; writing—original draft, L.L. (Lu Li). All authors have read and agreed to the published version of the manuscript.

Funding

This work was supported by the National Key R&D Program of China (2021YFE0194800), National Natural Science Foundation of China 42071423, Alliance of International Science Organizations (grant no. ANSO-CR-KP-2021-06), Beijing Nova Program of Science and Technology (Z191100001119089), and the Program of Bureau of International Cooperation, Chinese Academy of Sciences (183611KYSB20200080).

Conflicts of Interest

The authors declare no conflict of interest.

References

  1. Dweba, C.C.; Figlan, S.; Shimelis, H.A.; Motaung, T.E.; Sydenham, S.; Mwadzingeni, L.; Tsilo, T.J. Fusarium head blight of wheat: Pathogenesis and control strategies. Crop Prot. 2017, 91, 114–122. [Google Scholar] [CrossRef]
  2. Jia, H.; Zhou, J.; Xue, S.; Li, G.; Yan, H.; Ran, C.; Zhang, Y.; Shi, J.; Jia, L.; Wang, X.; et al. A journey to understand wheat Fusarium head blight resistance in the Chinese wheat landrace Wangshuibai. Crop J. 2018, 6, 48–59. [Google Scholar] [CrossRef]
  3. Wegulo, S.N.; Baenziger, P.S.; Nopsa, J.H.; Bockus, W.W.; Hallen-Adams, H. Management of Fusarium head blight of wheat and barley. Crop Prot. 2015, 73, 100–107. [Google Scholar] [CrossRef]
  4. Ma, H.; Zhang, X.; Yao, J.; Cheng, S. Breeding for the resistance to Fusarium head blight of wheat in China. Front. Agric. Sci. Eng. 2019, 6, 251–264. [Google Scholar]
  5. Shah, L.; Ali, A.; Yahya, M.; Zhu, Y.; Wang, S.; Si, H.; Rahman, H.; Ma, C. Integrated control of fusarium head blight and deoxynivalenol mycotoxin in wheat. Plant Pathol. 2018, 67, 532–548. [Google Scholar] [CrossRef]
  6. Chen, Y.; Zhang, A.F.; Gao, T.C.; Zhang, Y.; Wang, W.X.; Ding, K.J.; Chen, L.; Sun, Z.; Fang, X.Z.; Zhou, M.G. Integrated use of pyraclostrobin and epoxiconazole for the control of Fusarium head blight of wheat in Anhui Province of China. Plant Dis. 2012, 96, 1495–1500. [Google Scholar] [CrossRef] [Green Version]
  7. Guo, X.; Wang, M.T.; Zhang, G.Z. Prediction model of meteorological grade of wheat stripe rust in winter-reproductive area, Sichuan Basin, China. Ying Yong Sheng Tai Xue Bao = J. Appl. Ecol. 2017, 28, 3994–4000. [Google Scholar]
  8. Rodríguez-Moreno, V.M.; Jiménez-Lagunes, A.; Estrada-Avalos, J.; Mauricio-Ruvalcaba, J.E.; Padilla-Ramírez, J.S. Weather-data-based model: An approach for forecasting leaf and stripe rust on winter wheat. Meteorol. Appl. 2020, 27, e1896. [Google Scholar] [CrossRef] [Green Version]
  9. El Jarroudi, M.; Kouadio, L.; Bock, C.H.; El Jarroudi, M.; Junk, J.; Pasquali, M.; Maraite, H.; Delfosse, P. A threshold-based weather model for predicting stripe rust infection in winter wheat. Plant Dis. 2017, 101, 693–703. [Google Scholar] [CrossRef] [Green Version]
  10. Zhang, J.; Yuan, L.; Nie, C.; Wei, L.; Yang, G. Forecasting of powdery mildew disease with multi-sources of remote sensing information. In Proceedings of the 2014 The Third International Conference on Agro-Geoinformatics, Beijing, China, 11–14 August 2014; pp. 1–5. [Google Scholar]
  11. Li, X.; Yang, C.; Huang, W.; Tang, J.; Tian, Y.; Zhang, Q. Identification of cotton root rot by multifeature selection from sentinel-2 images using random forest. Remote Sens. 2020, 12, 3504. [Google Scholar] [CrossRef]
  12. Bajwa, S.G.; Rupe, J.C.; Mason, J. Soybean disease monitoring with leaf reflectance. Remote Sens. 2017, 9, 127. [Google Scholar] [CrossRef] [Green Version]
  13. Xiao, Y.; Dong, Y.; Huang, W.; Liu, L.; Ma, H.; Ye, H.; Wang, K. Dynamic remote sensing prediction for wheat fusarium head blight by combining host and habitat conditions. Remote Sens. 2020, 12, 3046. [Google Scholar] [CrossRef]
  14. Li, W.; Huang, W.; Dong, Y.; Chen, H.; Wang, J.; Shan, J. Estimation on winter wheat scab based on combination of temperature, humidity and remote sensing vegetation index. Trans. Chin. Soc. Agric. Eng. 2017, 33, 203–210. [Google Scholar]
  15. Li, W.; Liu, Y.; Chen, H.; Zhang, C.C. Estimation model of winter wheat disease based on meteorological factors and spectral information. Food Prod. Process. Nutr. 2020, 2, 5. [Google Scholar] [CrossRef]
  16. Khalili, E.; Kouchaki, S.; Ramazi, S.; Ghanati, F. Machine learning techniques for soybean charcoal rot disease prediction. Front. Plant Sci. 2020, 11, 2009. [Google Scholar] [CrossRef] [PubMed]
  17. Marin, D.B.; Santana, L.S.; Barbosa, B.D.S.; Barata, R.A.P.; Osco, L.P.; Ramos, A.P.M.; Guimarães, P.H.S. Detecting coffee leaf rust with UAV-based vegetation indices and decision tree machine learning models. Comput. Electron. Agric. 2021, 190, 106476. [Google Scholar] [CrossRef]
  18. Shah, D.A.; Molineros, J.E.; Paul, P.A.; Willyerd, K.T.; Madden, L.V.; De Wolf, E.D. Predicting Fusarium head blight epidemics with weather-driven pre-and post-anthesis logistic regression models. Phytopathology 2013, 103, 906–919. [Google Scholar] [CrossRef] [PubMed] [Green Version]
  19. Kirtphaiboon, S.; Humphries, U.; Khan, A.; Yusuf, A. Model of rice blast disease under tropical climate conditions. Chaos Solitons Fractals 2021, 143, 110530. [Google Scholar] [CrossRef]
  20. Henderson, D.; Williams, C.J.; Miller, J.S. Forecasting late blight in potato crops of southern Idaho using logistic regression analysis. Plant Dis. 2007, 91, 951–956. [Google Scholar] [CrossRef] [Green Version]
  21. Rudin, C. Stop explaining black box machine learning models for high stakes decisions and use interpretable models instead. Nat. Mach. Intell. 2019, 1, 206–215. [Google Scholar] [CrossRef] [PubMed] [Green Version]
  22. Papastamati, K.; van den Bosch, F. The sensitivity of the epidemic growth rate to weather variables, with an application to yellow rust on wheat. Phytopathology 2007, 97, 202–210. [Google Scholar] [CrossRef] [Green Version]
  23. HarDIan, J.M. A logistic model simulating environmental changes associated with the growth of populations of rice weevils, Sitophilus oryzae, reared in small cells of wheat. J. Appl. Ecol. 1978, 15, 65–87. [Google Scholar] [CrossRef]
  24. Shan, C.; Wang, W.; Liu, C.; Sun, Y.; Hu, Q.; Xu, X.; Tian, Y.; Zhang, H.; Morino, L.; Griffith, D.W.T.; et al. Regional CO emission estimated from ground-based remote sensing at Hefei site, China. Atmos. Res. 2019, 222, 25–35. [Google Scholar] [CrossRef] [Green Version]
  25. Liu, L.; Dong, Y.; Huang, W.; Du, X.; Ren, B.; Huang, L.; Zheng, Q.; Ma, H. A disease index for efficiently detecting wheat fusarium head blight using sentinel-2 multispectral imagery. IEEE Access 2020, 8, 52181–52191. [Google Scholar] [CrossRef]
  26. Chen, Y.; Yang, X.; Gu, C.Y.; Zhang, A.F.; Gao, T.C.; Zhou, M.G. Genotypes and phenotypic characterization of field Fusarium asiaticum isolates resistant to carbendazim in Anhui Province of China. Plant Dis. 2015, 99, 342–346. [Google Scholar] [CrossRef] [Green Version]
  27. Huang, L.; Li, T.; Ding, C.; Zhao, J.; Zhang, D.; Yang, G. Diagnosis of the severity of Fusarium head blight of wheat ears on the basis of image and spectral feature fusion. Siensors 2020, 20, 2887. [Google Scholar] [CrossRef]
  28. Ren, S.; Chen, X.; An, S. Assessing plant senescence reflectance index-retrieved vegetation phenology and its spatiotemporal response to climate change in the Inner Mongolian Grassland. Int. J. Biometeorol. 2017, 61, 601–612. [Google Scholar] [CrossRef]
  29. Hatfield, J.L.; Prueger, J.H. Value of using different vegetative indices to quantify agricultural crop characteristics at different growth stages under varying management practices. Remote Sens. 2010, 2, 562–578. [Google Scholar] [CrossRef] [Green Version]
  30. Zhang, Z.; Liu, M.; Liu, X.; Zhou, G. A new vegetation index based on multitemporal Sentinel-2 images for discriminating heavy metal stress levels in rice. Sensors 2018, 18, 2172. [Google Scholar] [CrossRef] [Green Version]
  31. Guo, A.; Huang, W.; Dong, Y.; Ye, H.; Ma, H.; Liu, B.; Wu, W.; Ren, Y.; Ruan, C.; Geng, Y. Wheat yellow rust detection using UAV-based hyperspectral technology. Remote Sens. 2021, 13, 123. [Google Scholar] [CrossRef]
  32. Wu, C.; Niu, Z.; Tang, Q.; Huang, W. Estimating chlorophyll content from hyperspectral vegetation indices: Modeling and validation. Agric. For. Meteorol. 2008, 148, 1230–1241. [Google Scholar] [CrossRef]
  33. Ren, Y.; Huang, W.; Ye, H.; Zhou, X.; Ma, H.; Dong, Y.; Shi, Y.; Geng, Y.; Huang, Y.; Jiao, Q. Quantitative identification of yellow rust in winter wheat with a new spectral index: Development and validation using simulated and experimental data. Int. J. Appl. Earth Obs. Geoinf. 2021, 102, 102384. [Google Scholar] [CrossRef]
  34. Gilbert, J.; Haber, S. Overview of some recent research developments in Fusarium head blight of wheat. Can. J. Plant Pathol. 2013, 35, 149–174. [Google Scholar] [CrossRef]
  35. Xiangxiang, W.; Quanjiu, W.; Jun, F.; Lijun, S.; Xinlei, S. Logistic model analysis of winter wheat growth on China’s Loess Plateau. Can. J. Plant Sci. 2014, 94, 1471–1479. [Google Scholar] [CrossRef]
  36. King, E.N.; Ryan, T.P. A preliminary investigation of maximum likelihood logistic regression versus exact logistic regression. Am. Stat. 2002, 56, 163–170. [Google Scholar] [CrossRef]
  37. Tonidandel, S.; LeBreton, J.M. Determining the relative importance of disease prediction factors in logistic regression: An extension of relative weight analysis. Organ. Res. Methods 2010, 13, 767–781. [Google Scholar] [CrossRef]
  38. Owen, A.B.; Roediger, P.A. The sign of the logistic regression coefficient. Am. Stat. 2014, 68, 297–301. [Google Scholar] [CrossRef] [Green Version]
  39. de Souza, J.C.S.; Assis, T.M.L.; Pal, B.C. Data compression in smart distribution systems via singular value decomposition. IEEE Trans. Smart Grid 2015, 8, 275–284. [Google Scholar] [CrossRef] [Green Version]
  40. Menard, S. Six approaches to calculating standardized logistic regression coefficients. Am. Stat. 2004, 58, 218–223. [Google Scholar] [CrossRef]
  41. Uddin, S.; Haque, I.; Lu, H.; Moni, M.A.; Gide, E. Comparative performance analysis of K-nearest neighbour (KNN) algorithm and its different variants for disease prediction. Sci. Rep. 2022, 12, 6256. [Google Scholar] [CrossRef]
  42. Noola, D.A.; Basavaraju, D.R. Corn leaf image classification based on machine learning techniques for accurate leaf disease detection. Int. J. Electr. Comput. Eng. 2022, 12, 2088–8708. [Google Scholar] [CrossRef]
  43. Huang, Y.; Zhang, J.; Zhang, J.; Yuan, L.; Zhou, X.; Xu, X.; Yang, G. Forecasting Alternaria Leaf Spot in Apple with Spatial-Temporal Meteorological and Mobile Internet-Based Disease Survey Data. Agronomy 2022, 12, 679. [Google Scholar] [CrossRef]
  44. Mendigoria, C.H.; Concepcion, R.; Bandala, A.; Alajas, O.J.; Aquino, H.; Dadios, E. OryzaNet: Leaf Quality Assessment of Oryza sativa Using Hybrid Machine Learning and Deep Neural Network. In Proceedings of the 2021 IEEE 13th International Conference on Humanoid, Nanotechnology, Information Technology, Communication and Control, Environment, and Management (HNICEM), Manila, Philippines, 28–30 November 2021; pp. 1–6. [Google Scholar]
  45. Ruan, C.; Dong, Y.; Huang, W.; Huang, L.; Ye, H.; Ma, H.; Guo, A.; Ren, Y. Prediction of Wheat Stripe Rust Occurrence with Time Series Sentinel-2 Images. Agriculture 2021, 11, 1079. [Google Scholar] [CrossRef]
  46. Kaabneh, K.; Tarawneh, H. Dynamic Tomato Leaves Disease Detection using Histogram-based K-means Clustering Algorithm with Back-Propagation Neural Network. In Proceedings of the 2021 22nd International Arab Conference on Information Technology (ACIT), Muscat, Oman, 21–23 December 2021; pp. 1–5. [Google Scholar]
  47. Arlot, S.; Celisse, A. A survey of cross-validation procedures for model selection. Stat. Surv. 2010, 4, 40–79. [Google Scholar] [CrossRef]
  48. Weng, S.; Han, K.; Chu, Z.; Zhu, G.; Liu, C.; Zhu, Z.; Zhang, Z.; Zheng, L.; Huang, L. Reflectance images of effective wavelengths from hyperspectral imaging for identification of Fusarium head blight-infected wheat kernels combined with a residual attention convolution neural network. Comput. Electron. Agric. 2021, 190, 106483. [Google Scholar] [CrossRef]
  49. Prandini, A.; Sigolo, S.; Filippi, L.; Battilani, P.; Piva, G. Review of predictive models for Fusarium head blight and related mycotoxin contamination in wheat. Food Chem. Toxicol. 2009, 47, 927–931. [Google Scholar] [CrossRef] [PubMed]
  50. Zhu, Z.; Chen, L.; Zhang, W.; Yang, L.; Zhu, W.; Li, J.; Liu, Y.; Tong, H.; Fu, L.; Liu, J.; et al. Genome-wide association analysis of Fusarium head blight resistance in Chinese elite wheat lines. Front. Plant Sci. 2020, 11, 206. [Google Scholar] [CrossRef] [Green Version]
  51. Ma, H.; Huang, W.; Dong, Y.; Liu, L.; Guo, A. Using UAV-Based Hyperspectral Imagery to Detect Winter Wheat Fusarium Head Blight. Remote Sens. 2021, 13, 3024. [Google Scholar] [CrossRef]
  52. Qiu, M.; Zheng, S.; Tang, L.; Hu, X.; Xu, Q.; Zheng, L.; Weng, S. Raman Spectroscopy and Improved Inception Network for Determination of FHB-Infected Wheat Kernels. Foods 2022, 11, 578. [Google Scholar] [CrossRef]
  53. Borrellas, P.; Unceta, I. The Challenges of Machine Learning and Their Economic Implications. Entropy 2021, 23, 275. [Google Scholar] [CrossRef]
  54. Gao, X.; Li, G. A KNN model based on manhattan distance to identify the SNARE proteins. IEEE Access 2020, 8, 112922–112931. [Google Scholar] [CrossRef]
  55. Ma, C.; Du, X.; Cao, L. Improved KNN Algorithm for Fine-Grained Classification of Encrypted Network Flow. Electronics 2020, 9, 324. [Google Scholar] [CrossRef] [Green Version]
  56. Zhang, S.; Li, X.; Zong, M.; Zhu, X.; Wang, R. Efficient kNN classification with different numbers of nearest neighbors. IEEE Trans. Neural Netw. Learn. Syst. 2017, 29, 1774–1785. [Google Scholar] [CrossRef] [PubMed]
  57. Pujari, M.; Awati, C.; Kharade, S. Efficient Classification with an Improved Nearest Neighbor Algorithm. In Proceedings of the 2018 Fourth International Conference on Computing Communication Control and Automation (ICCUBEA), Pune, India, 16–18 August 2018; pp. 1–5. [Google Scholar]
  58. Shan, Y.; Li, S.; Li, F.; Cui, Y.; Li, S.; Chen, M.; He, X. A density peaks clustering algorithm with sparse search and Kd tree. arXiv 2022, arXiv:2203.00973. [Google Scholar]
  59. Chen, Y.; Zhou, L.; Tang, Y.; Singh, J.P.; Bouguila, N.; Wang, C.; Wang, C.; Du, J. Fast neighbor search by using revised kd tree. Inf. Sci. 2019, 472, 145–162. [Google Scholar] [CrossRef]
Figure 1. Study area and sampling sites.
Remotesensing 14 02732 g001
Figure 2. Flow chart of remote sensing-based prediction of wheat FHB area and samplings.
Remotesensing 14 02732 g002
Figure 3. Weighting results of factors on 29 April 2021 (a) and 10 May 2021 (b).
Remotesensing 14 02732 g003
Figure 4. Predictions of FHB severity (a,b). The results of the logistic-KNN model are shown on the left, and those of the KNN model are shown on the right.
Remotesensing 14 02732 g004
Figure 5. Average ROC curves and their corresponding AUC values: (a) 29 April 2021; (b) 10 May 2021.
Remotesensing 14 02732 g005
Table 1. Feature selection results based on logistic and L1 regularization and Fisher scores (29 April 2021).
IndexDefinition
F_RH70_mid_-11The number of days with RH greater than 70% in the 11 days before and after flowering
H_RH70_-7The number of days with RH greater than 70% in the 7 days before heading
H_RH_+3The average RH in the 3 days after heading
F_P_+11The average precipitation of the 11 days after flowering
H_T1530RH80_mid_-5The number of days with temperature between 15 and 30 °C degrees and RH greater than 80% in the 5 days before and after heading
F_P_-3The average precipitation during the first three days of flowering
0404_REHBIRed-edge head blight index on 4 April 2021
0404_MCARIModified chlorophyll absorption ratio on 4 April 2021
Table 2. Feature selection results based on logistic and L1 regularization and Fisher scores (10 May 2021).
IndexDefinition
H_T1530RH70_+5The number of days with temperatures between 15 and 30 °C degrees and RH greater than 70% in the 5 days after heading
H_RH70_-7The number of days with RH greater than 70% in the 7 days before heading
F_T1530RH80_mid_-7The number of days with temperatures between 15 and 30 °C degrees and RH greater than 80% in the 7 days before and after flowering
H_P_-15The average precipitation of the 15 days before heading
H_P_-7The average precipitation of the 7 days before heading
0501_PSRIPlant senescence absorption ratio on 1 May 2021
0320_FVCFractional Vegetation Cover on 20 March 2021
Table 3. The mean overall accuracy according to fivefold cross-validation for the 29 April 2021 model when the threshold of probability was 0.
Prediction Model29 April 2021
kMean Overall Accuracy
Logistic-KNN30.865
Logistic-KNN50.781
Logistic-KNN70.709
Table 4. Overall accuracies and F1 scores of the two models for 29 April 2021.
Prediction Model29 April 2021
Accuracy F1 Score
Logistic-KNN0.880.86
KNN0.750.68
Table 5. Overall accuracies and F1 scores of the two models for 10 May 2021.
Prediction Model10 May 2021
Accuracy F1 Score
Logistic-KNN0.920.94
KNN0.790.80
Publisher’s Note: MDPI stays neutral with regard to jurisdictional claims in published maps and institutional affiliations.

