Abstract
Inner Mongolia is located in China’s arid and semi-arid regions, with sensitive and fragile ecosystems at risk of increased desertification, necessitating ecological restoration. However, economic resources for large-scale ecological restoration are often scarce, so it is vital to identify key areas for ecological restoration. Previous desertification research has focused mainly on the condition and changes in soil or vegetation. However, not all changes in soil or vegetation directly impact humans. New perspectives are increasingly needed to bridge the gap between biophysical and human well-being. We construct a framework to identify priority restoration areas based on ecosystem services and ecosystem vulnerability over a long time series. The results show that: (1) soil conservation services in northeast and southwest Inner Mongolia have degraded. Sand fixation services in central and eastern Inner Mongolia have shown a degradation trend. Habitat quality has been generally stable and sporadic in the past 20 years. (2) The areas with higher ecosystem vulnerability are concentrated in the northeast, mainly due to higher climate exposure and climate sensitivity but relatively lower climate resilience in the northeast. (3) Compared with the results of ecological restoration areas identified based on the trends of traditional vegetation indicators (fractional vegetation cover and net primary productivity), we found a greater proportion of land in northeastern Inner Mongolia in need of restoration. Additionally, there was identified a decreased restoration proportion in southwestern Inner Mongolia to ensure the self-restoration and regulation of desert ecosystems, which is conducive to realizing nature-based solutions.
1. Introduction
Under the combined pressure of climate change and human activities, two-thirds of the world’s drylands are moderate to severely degraded, with 12 million hectares of new degraded land added each year [1]. Land degradation’s direct or indirect cost to society is approximately USD 300 billion [2]. Desertification is the land degradation of dryland ecosystems, a continuous decline in the ability of dryland ecosystems to provide services over time [3]. China’s arid and semi-arid regions are vast, with sensitive and fragile ecosystems, and the risk of desertification increases under the pressure of climate change and human activities [4,5,6]. Ecological restoration can increase renewable and nurturing natural capital, thereby maintaining biodiversity and improving the quality of ecosystem goods and services on which our health and well-being depend [7,8]. Therefore, ecological restoration is an effective method to mitigate desertification. Ecological restoration has become increasingly important in global and national treaties, coalitions, and UN conventions [9]. The Biodiversity Strategy 2030 program [10] and Convention on Combatting Desertification [11] provide vital support to call for large-scale ecological restoration. These conventions emphasize ecological restoration as an effective and necessary means of reducing greenhouse gas emissions to achieve land degradation neutrality and carbon neutrality [9]. However, economic resources for large-scale ecological restoration are often scarce [12], so we cannot implement ecological restoration projects in every degraded area. At the same time, the degree of degradation in each ecosystem is different, and there should be priorities in ecological restoration. Therefore, it is necessary to find areas with a high risk of desertification. Identifying key ecological restoration areas will help maximize the supply of multiple ecosystem services and enhance human well-being within limited economic conditions.
The more widely accepted definition of ecological restoration is the process of assisting in the recovery of degraded, damaged, or destroyed ecosystems [13]. This definition facilitates understanding the purpose of ecological restoration, and its primary step is to find the degraded areas. Previous Ecological restoration research mainly focuses on single object restoration or single function restoration [14,15]. In addition, biodiversity conservation and ecosystem vulnerability are also important research contents of ecological restoration [15,16,17]. Ecosystem vulnerability (EV) is the risk of damage to ecosystems due to disturbance [18]. Ecosystems possess different vulnerabilities due to their different natural conditions and show different sensitivity and resilience to human activities and climate change [19]. One of the key points of ecological restoration is to restore areas with high vulnerability. In recent years, there has been a growing view that ecological restoration should be approached from the perspective of human wellbeing [20] in order to meet social needs and restore important ecological and social functions.
The ecological restoration under desertification needs to identify areas with a high risk of desertification. Previous desertification studies have mainly focused on the changes in soil or vegetation [21,22]. However, not all changes in soil or vegetation directly impact humans. Ecosystem services are the bridge connecting humans and nature [23], and it is the manifestation of human beings benefiting from nature. A decline in ecosystem services represents an impairment of human wellbeing. However, as defined by a series of global greening studies, vegetation restoration may mask the degradation of ecosystem services, and new perspectives are increasingly needed to bridge the gap between biophysical and ecosystem services. Some researchers have conducted ecological restoration studies based on ecosystem services in recent years. However, these ecological restoration studies are mainly based on ecological security patterns [24,25], the current status of ecosystem services [26], and ecosystem services trade-offs [27,28] to identify ecological restoration areas. Previous studies have not included the dynamic changes of ecosystem services over time in ecological restoration studies.
Overall, we can identify priority areas for ecological restoration from ecosystem services and ecological vulnerability. However, areas with degraded ecosystem services and high ecological vulnerability do not entirely overlap due to meteorological factors and geographical conditions. Therefore, combining long time-series ecosystem service analysis with ecological vulnerability is beneficial for identifying areas with continuously declining ecosystem services and high ecological vulnerability and determining priority areas for ecological restoration.
Inner Mongolia is located in the arid and semi-arid region of China, with typical desertification characteristics, and it is essential to identify priority areas for ecological restoration. We assessed the trends of soil conservation services, sand fixation services, and habitat quality in Inner Mongolia from 2000 to 2020. Then, we classified Inner Mongolia into five degradation categories according to the trends and significance of ecosystem services. At the same time, we calculated the vulnerability of Inner Mongolia to climate change. By combining the degradation trends and ecosystem vulnerability of Inner Mongolia to identify priority areas for desertification restoration, we provide a reference for ecological restoration in the region. Our objectives are: (1) to construct a framework of priority restoration areas based on ecosystem services and ecosystem vulnerability over a long time series, (2) to classify restoration areas (3) to propose ecological restoration recommendations. Identifying ecological restoration priority areas is beneficial to maximize the restoration, which is vital to carbon sequestration [29] and reducing desertification in Inner Mongolia.
2. Materials and Methods
2.1. Study Area
Inner Mongolia is located between 97°12′–126°04′E and 37°24′–53°23′N, in the arid and semi-arid region of China (Figure 1a). The average elevation of Inner Mongolia is 1000 m, and the primary landform type is the plateau. The Daxinganling, Yinshan, and Helen Mountains form the natural ecological barrier between northeast, north, and northwest China. Forests, grasslands, deserts, and wetlands are widely distributed on the northwest side of the mountain line, while arable land and cities are concentrated on the southeast side of the mountain line (Figure 1b,c). The temperate continental monsoon climate dominates the climate of Inner Mongolia, and the wind direction changes significantly with the seasons. Ecological restoration in Inner Mongolia will benefit residents and play an important role in reducing the sand in the interior of China.
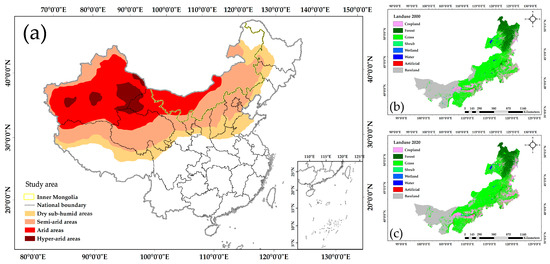
Figure 1.
Study area. (a) Inner Mongolia study area (yellow outline) with shading to reflect the location of Inner Mongolia; (b) the land use of Inner Mongolia in 2000; (c) the land use of Inner Mongolia in 2020.
2.2. Dataset
We used the below data to calculate soil conservation service, sand fixation service, habitat quality, and ecosystem vulnerability (Table 1). Station-based observation data are converted into raster data by simple Kriging interpolation. All data periods are 2000–2020, with a resolution resampling of 1 km.

Table 1.
Data list, types, sources, datasets, and original resolution. International Soil Reference and Information Centre (ISRIC); National Aeronautics and Space Administration (NASA); Cesium (Cs); Land Processes Distributed Active Archive Center (LP DAAC); Shuttle Radar Topography Mission (SRTM); Moderate-Resolution Imaging Spectroradiometer (MODIS); Climate Change Initiative (CCI).
2.3. Key Restoration Areas Framework
We construct a framework for identifying priority restoration areas based on ecosystem services and ecosystem vulnerability over a long time series (Figure 2). In our study, priority is a level of urgency, and ecological restoration funds should be spent where it is most urgent. In this framework, priority ecological restoration in Inner Mongolia is the areas with both ecosystem services degradation and high ecosystem vulnerability. We used the Revised Universal Soil Loss Equation (RUSLE) model to calculate the soil conservation service, the Revised Wind Erosion Equation (RWEQ) model to calculate the sand fixation service, and the Integrated Valuation of Ecosystem Services and Trade-offs (InVEST) model to calculate the habitat quality. Then, we classified each ecosystem service into five degradation categories according to the Theil–Sen procedure and a Mann–Kendall significance test: significant increase, slight increase, insignificant change, slight decrease, and significant decrease. We superimposed the three ecosystem service change trends, which can spatially form the ecosystem service degradation map. In addition, ecosystem vulnerability is classified using the Jenks optimization method to identify extreme vulnerable and vulnerable areas. Finally, the areas with degraded ecosystem services and high vulnerability were superimposed to obtain the key areas for ecological restoration in Inner Mongolia.
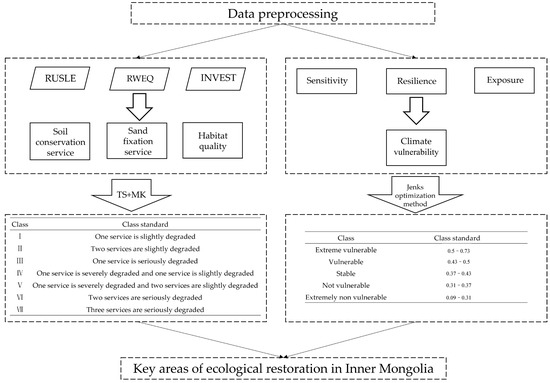
Figure 2.
Key restoration areas framework. The first step is data processing, the second step is calculating ecosystem services and ecosystem vulnerability, the third step is classification, and the last step is identifying key restoration areas. TS + MK (Theil–Sen procedure and a Mann–Kendall significance test) is a method of trend analysis (detailed introduction in Section 2.7); Revised Universal Soil Loss Equation (RUSLE); Revised Wind Erosion Equation (RWEQ); Integrated Valuation of Ecosystem Services and Trade-offs (InVEST).
2.4. Soil Conservation Service
Soil conservation service (SCS) is an ecosystem’s capacity to conserve soil and control erosion [33]. We used the RUSLE model to calculate soil conservation services. The calculation formula was as follows (Equation (1)):
is the plot sediment retention (Mg ha−1 yr−1); R is the rainfall erosivity factor (MJ mm ha−1 h−1 yr−1), calculated from the Xie equation [34]; K is the soil erodibility factor (Mg ha h ha−1 MJ−1 mm−1), calculated using the EPIC model [35]; L is the slope length factor (dimensionless) [36]; S is the slope steepness factor (dimensionless) [37]; C is the vegetation cover and crop management factor [36]; and P is the soil and water conservation measures factor [36].
2.5. Sand Fixation Service
Sand fixation services suppress and fix wind and sand by ecosystem vegetation [38]. We used the RWEQ model to calculate sand fixation services. Sand fixation service is the difference between potential wind erosion and actual wind erosion. Potential wind erosion is soil erosion under bare soil without vegetation, and actual wind erosion is soil erosion under surface vegetation cover [30]. The calculation formula was as follows (Equations (2)–(8)):
Sand fixation capacity:
Potential wind erosion:
Actual wind erosion:
is the sand fixation modulus (kg m−2 yr−1); is the potential wind erosion modulus (kg m−2 yr−1); is the potential maximum amount of wind-transported sediment (kg m−2); is the potential critical plot length (m); is the actual wind erosion modulus (kg m−2); is actual maximum amount of wind-transported sediment (kg m−2); is the critical plot length (m); is the leeward distance of the plot (m), a constant parameter at 100 [39]; WF is the weather factor (kg m−1); is the percentage of soil erodibility (%); is the soil crust factor (dimensionless); is the soil roughness factor (dimensionless); and is the combined crop factor (dimensionless).
2.6. Habitat Quality
Habitat refers to the potential of an ecosystem to provide the conditions necessary for species to survive and reproduce and is an important ecosystem service; habitat quality determines the suitability of habitats and plays an important role in biodiversity conservation [40]. InVEST (Integrated Valuation of Ecosystem Services and Trade-off) model calculates habitat quality. The calculation formula was as follows (Equations (9) and (10)):
is the habitat quality index of x grids in landscape j; is the habitat suitability of landscape j, and the value range is [0, 1]; K is the half-saturation constant, and its size is 1/2 of the raster size, so the paper is set to 500; z is the scale parameter, generally set to 2.5. is the habitat degradation index; R is the number of threatened sources; is the weight; is the number of threat cells; is the number of threat factors on the raster cell; is the influence range of the threat factor; is the accessibility of the threat source to the raster x; is the sensitivity of landscape j to threat factor r.
2.7. Trend Analysis
We used the Theil–Sen procedure and a Mann–Kendall significance test to analyze the trend of ecosystem services from 2000 to 2020. This method has been widely used in annual vegetation growth analysis [41,42]. Then, we classified Inner Mongolia into five degradation categories according to the Theil–Sen procedure and a Mann–Kendall significance test of ecosystem services: significant increase, slight increase, insignificant change, slight decrease, and significant decrease. The calculation formula was as follows (Equations (11)–(15)):
is the trend of ecosystem services from 2000 to 2020, > 0 represents an increase in ecosystem services from 2000 to 2020, and < 0 represents a decrease in ecosystem services from 2000 to 2020; n is the length of the period; and are the observations at the time i and j; |Z| > 1.64 is significant [43].
2.8. Ecosystem Vulnerability
Ecosystem vulnerability is the degree to which an ecosystem is vulnerable or unable to cope with the adverse effects of climate change, including exposure, sensitivity, and resilience [44]. The sensitivity is an ecosystem to remain stable during a disturbance [45]. Resilience is an ecosystem that returns to its original state after a disturbance [19]. Exposure is the capacity of an ecosystem to keep up with climate change [46]. The calculation formula was as follows (Equation (16)):
VI is the vulnerability index, EI is the exposure index, SI is the sensitivity index, and RI is the resilience index [19].
2.9. Ecological Restoration Zoning Standards
We overlayed the trend of ecosystem service changes with the ecosystem vulnerability to obtain different ecological restoration zoning. The zoning criteria are listed in the table below (Table 2).
Table 2.
Ecological restoration zoning standards.
2.10. Model Validation
To evaluate the accuracy of the RUSLE, RWEQ, and InVEST models, we regressed the model results on the observed data. We used sediment transport modulus as observations of soil conservation service [36]. Nuclear explosions produce 137Cs. Wind erosion is one of the main factors contributing to the transport and redistribution of this element in the soil. 137Cs is a mature quantitative assessment method in wind erosion, with the most application cases. We used 137Cs as observations of sand fixation service [30] and forest cover and above-ground biomass carbon as observations of habitat quality [47].
3. Results
3.1. Model Validation
We regressed the model results on the observed data, and the results show that the model results are reliable and can be further analyzed (Figure 3). The results showed that RWEQ model (sand fixation service) (R2 = 0.74, Figure 3c) was more reliable than the RUSLE model (soil conservation service) (R2 = 0.37, Figure 3d) and InVEST model (habitat quality) (R2 = 0.28, Figure 3a; R2 = 0.29, Figure 3b).
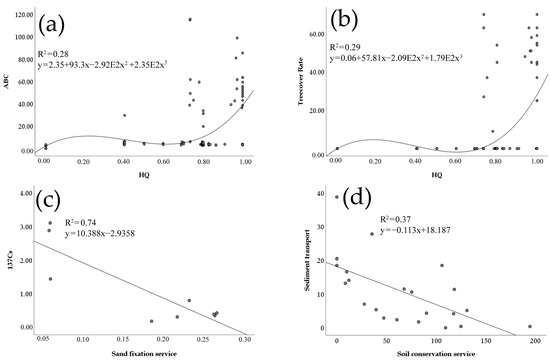
Figure 3.
Validation of (a,b) the InVEST model (habitat quality), (c) the RWEQ model (sand fixation service), (d) the RUSLE models (soil conservation service); habitat quality (HQ), above-ground biomass carbon (ABC), Cesium (Cs), Revised Universal Soil Loss Equation (RUSLE), Revised Wind Erosion Equation (RWEQ), Integrated Valuation of Ecosystem Services and Trade-offs (InVEST).
3.2. The Changing Trend of Soil Conservation Services, Sand Fixation Services, and Habitat Quality
The results show that the soil conservation service in northeastern and southwestern Inner Mongolia had a sporadic degradation trend from 2000 to 2020 (Figure 4a). The sand fixation service in eastern Inner Mongolia had a significant degradation trend from 2000 to 2020 (Figure 4b). Habitat quality in Inner Mongolia had an overall stable trend from 2000 to 2020 (Figure 4c).
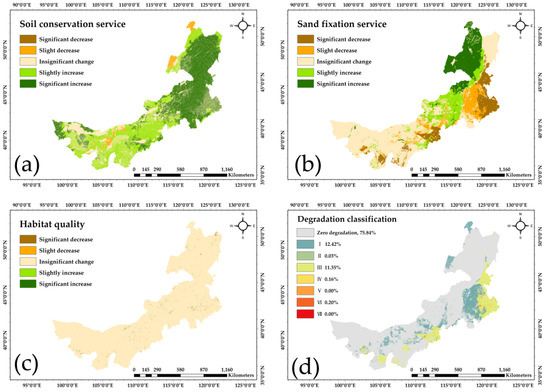
Figure 4.
Ecosystem services change from 2000 to 2020: (a) soil conservation service; (b) sand fixation service; (c) habitat quality; and (d) degradation classification. For Figure 4d: one service is slightly degraded (I), two services are slightly degraded (II), one service is seriously degraded (III), one service is severely degraded and one service is slightly degraded (IV), one service is severely degraded and two services are slightly degraded (V), two services are seriously degraded (VI), three services are seriously degraded (VII).
Among these nine types of degradation (Figure 4d), most areas (75.84%) have no ecosystem service degradation. Besides, class I (12.42%) and III (11.35%) accounted for the largest proportion, representing one type of slight degradation of ecosystem services and one type of severe degradation of ecosystem services in most areas.
3.3. Ecosystem Vulnerability Pattern Analysis in Inner Mongolia
The results showed that the ecosystem vulnerability in northeast Inner Mongolia is high (Figure 5a). In contrast, the exposure was high in the northeast Inner Mongolia area (Figure 5b). The resilience was low in the eastern Inner Mongolia area (Figure 5c), while the sensitivity was high in the northeast part (Figure 5d). Northeastern Inner Mongolia has the highest ecosystem vulnerability, mainly due to the high exposure, sensitivity of these ecosystems.
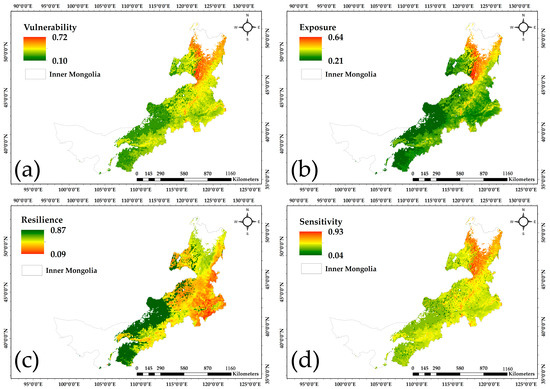
Figure 5.
(a) Ecosystem vulnerability pattern; (b) ecosystem exposure pattern in Inner Mongolia; (c) ecosystem resilience pattern in Inner Mongolia; and (d) ecosystem sensitivity in Inner Mongolia. Blank areas represent no data areas. The color ramp of Figure 5a,b,d from red to green indicate stronger to smaller. The color ramp of Figure 5c from green to red indicate stronger to smaller.
3.4. Key Ecological Restoration Areas in Inner Mongolia
We divided Inner Mongolia into four restoration areas: zero degradation, reserve, ecological restoration, and priority ecological restoration areas. Figure 6a is the final result of the restoration areas. The results show that the protected areas (1931 km2), ecological restoration areas (2211 km2), and priority ecological restoration areas (2212 km2) is basically the same area (Figure 6a). In addition, we found that the restoration pattern is consistent with the degradation distribution of the fractional vegetation cover (FVC) (Figure 6c). We found a less proportion of southwestern Inner Mongolia in need of restoration compared with the degradation distribution of net primary productivity (NPP) (Figure 6b). Large-scale ecological projects (e.g., afforestation) in desert areas ignore the background conditions of desert areas. This may increase the water shortage and aggravate desertification. Reducing the proportion of restoration in desert areas can ensure the self-restoration and regulation of desert ecosystems, conducive to the realization of nature-based solutions.
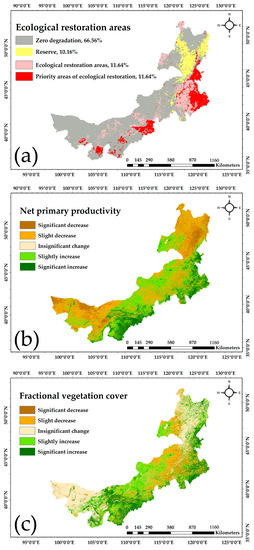
Figure 6.
(a) Key ecological restoration areas in Inner Mongolia; (b) net primary productivity (NPP) change; and (c) fractional vegetation cover (FVC) change.
4. Discussion
4.1. Ecosystem Services Are Influenced by Climate and Human Activities
By analyzing the trends of ecosystem services, we can find that soil conservation services in Inner Mongolia have increased in most areas year by year. Although the frequency and intensity of precipitation in Inner Mongolia have increased in recent decades [48,49], most of the vegetation cover in Inner Mongolia has increased year by year due to ecosystem restoration and afforestation and climate change [50,51,52,53]. The increase in vegetation cover can offset the pressure brought by rainfall on the soil to some extent, reduce the area of soil erosion, and enhance the ability of soil conservation services [53,54,55,56]. Mechanistically, the vegetation cover increases the interception of rainfall by the vegetation canopy [57]. At the same time, the dead leaves of vegetation have a protective effect on the soil, alleviating the pressure on the soil from increased rainfall [58]. Vegetation roots can also promote water infiltration, and soil microorganisms enhance the cohesiveness of soil aggregates [59]. In addition, vegetation enhances evapotranspiration and photosynthesis, reducing the water available for sediment transport [55,60,61,62].
The widespread distribution of barren lands and farmlands in eastern Inner Mongolia has led to a decline in sand fixation services. The land-use patterns in southeastern Inner Mongolia are barren lands and cropland. The wind erosion modulus and intensity of barren lands and croplands have been shown to exceed those of grassland [63,64,65]. Mechanistically, barren lands have no vegetation cover, resulting in direct soil exposure to wind, while croplands are heavily disturbed by anthropogenic and productive activities. Therefore, barren lands and croplands are vulnerable to wind, leading to severe soil and nutrient losses [66,67,68], with reduced sand fixation services capacity.
The changes in vegetation and climate change (precipitation changes in soil conservation services and wind changes in sand fixation services) are coupled processes. For example, in sand fixation services, the wind speed increases for a long time. The vegetation cover remains unchanged for a long time, indicating that this region’s sand fixation capacity is increasing and has not yet reached its peak. Once the wind speed increases to a high level, it will cause a decrease in vegetation cover, and the sand fixation capacity will also decrease. Simultaneously, the decrease in wind speed is generally due to the increase in vegetation. According to the calculation formula of the sand fixation service, the increase of vegetation leads to the increase of 1-C factor and the increase of the sand fixation service.
4.2. High Climate Variability in Northeastern Inner Mongolia and Poor Resilience in Eastern Inner Mongolia
Northeastern Inner Mongolia has the highest ecosystem vulnerability, mainly due to the high climate variability. Ecosystem exposure and sensitivity are mainly quantified through temporal and spatial variability of temperature and precipitation [46]. Precipitation and temperature variability are high in northeastern Inner Mongolia. Therefore, changes in precipitation and temperature can influence the spatial pattern of ecosystem vulnerability through exposure and sensitivity [19]. Resilience is quantified as the abnormally high lag-1 autocorrelation in vegetation dynamics [69]. Eastern Inner Mongolia is an agro-pastoral ecotone. Consistent with previous studies, farmland ecosystems have lower resilience [19]. In addition, farmland is subject to more anthropogenic management, leading to lower resilience of farmland ecosystems [70,71,72]. Drought, overgrazing, and unsustainable land use have reduced the resilience of the eastern Inner Mongolia agro-pastoral area.
4.3. Innovation and Limitations
Our study aims to construct a framework to identify the key areas for ecological restoration in Inner Mongolia. We use a suite of models and data to calculate long-term trends in ecosystem services and ecosystem vulnerability and to develop a classification system with four classes of restoration zones: zero degradation; reserve; ecological restoration areas; and priority areas of ecological restoration. A critical difference between our study and other publications assessing ecosystem services and vulnerability at landscape and regional scales is that we consider longer-term trends to a greater extent. In addition, we also combined long time-series ecosystem service analysis with vulnerability to identify the key areas of ecological restoration in Inner Mongolia.
Although our study identified areas of long-term degradation of ecosystem services, the selection of ecosystem service indicators is not enough, which may affect the accuracy of the analysis results. At the same time, the results are also limited by the model’s accuracy. The RUSLE model is a good compromise between soil conservation service estimates [73,74,75]. In calculating the soil conservation service, we used Xie’s model to calculate the rainfall erosivity, which is better simulated [34]. We used NDVI to calculate the C factor; however, NDVI only reflects the green vegetation information and ignores the information on the soil surface. Therefore, NDVI may overestimate the C factor. The P factor is rarely considered in calculating soil conservation services because it is difficult to estimate [76,77]. We set the P factor to 1 in the calculation of the soil conservation service, so our results do not accurately quantify the amount of soil conservation services. The RWEQ model is excellent for calculating sand fixation service [30,78]. However, we lacked hourly wind speed data during the calculation. Finally, we used the daily average wind speed to obtain hourly wind speed data [78]. To calculate the habitat quality for the long time series, we used the CCI land cover V2 data, but the CCI land cover V2 data could not accurately portray the land use information in China. In addition, we resampled all resolutions to 1 km, which leads to information loss and increases the limitations and uncertainty of the results. Although there are many shortcomings, the results of our model are credible. Moreover, in our study, priority is a level of urgency, and ecological restoration funds should be spent where it is most urgent. However, we did not consider the cost and return ratio. In addition, we also did not consider the ecosystem services supply–demand ratio. These can be further explored in future studies.
4.4. Implications for Land Management
We have to use different measures for different ecological restoration zones. We have to focus on natural restoration for protected areas and follow a nature-based solution for management. For restoration areas and priority restoration areas, we can incorporate artificial interventions to implement ecological restoration by restoring native forests or ecological restoration projects (afforestation). However, ecological restoration projects also have certain limitations and shortcomings. Large-scale afforestation increased vegetation evapotranspiration, groundwater depletion, and water shortage [79], bringing other environmental problems. Meanwhile, the monoculture of afforestation plant species may undermine the benefits brought by biodiversity. In addition, restoration of native forests usually has more significant environmental benefits than afforestation in terms of essential ecosystem services such as biodiversity conservation, carbon sequestration, soil and water conservation, and water supply [80]. To avoid creating new ecological and environmental problems, we suggest that nature-based solutions be adopted, and some sustainable ecological restoration projects should be carried out. For example, when we selected priority ecological restoration sites, long-term trends in ecosystem services should be considered. In choosing ecological restoration methods, we should prioritize native forest restoration with assisted natural regeneration of native species [81,82]. In spring, wind erosion is severe in eastern Inner Mongolia. We should use easily implemented physical sand barriers such as straw checkerboard grids, crop residue barriers, and gravel mulching to slow wind and sand transport and ultimately inhibit desertification [83,84,85,86].
5. Conclusions
This study constructs a framework of priority restoration areas based on ecosystem services and ecosystem vulnerability over a long time series and classifies restoration areas. By combining the degradation trends of ecosystem services and ecosystem vulnerability of Inner Mongolia, we found that: (1) soil conservation services in Inner Mongolia have improved overall in the past 20 years; in the northeast and southwest Inner Mongolia, have degraded; sand fixation services in central and eastern Inner Mongolia have shown a degradation trend in the past 20 years; habitat quality has been generally stable in the past 20 years, showing a sporadic degradation trend. (2) The areas with higher ecosystem vulnerability are concentrated in the northeast, mainly due to higher climate exposure and climate sensitivity but relatively lower climate resilience in the northeast. (3) Compared with the results of ecological restoration areas identified based on the trends of traditional vegetation indicators (fractional vegetation cover and net primary productivity), our results have identified the reduced restoration proportion in the southwestern part of Inner Mongolia and the increased restoration proportion in the northeastern part of Inner Mongolia.
Author Contributions
Conceptualization, S.F. and W.Z.; methodology, S.F. and Y.Y.; software, Y.Y.; validation, S.F. and P.P.; formal analysis, S.F.; investigation, S.F., X.L. (Xin Liu) and A.Z.; resources, X.L. (Xin Liu), Y.Y., A.Z., and X.L. (Xiaoxing Liu); data curation, S.F., Y.Y., A.Z., and X.L. (Xiaoxing Liu); writing—original draft preparation, S.F.; writing—review and editing, W.Z. and P.P.; visualization, S.F.; supervision, W.Z.; project administration, W.Z. and X.L. (Xin Liu); funding acquisition, W.Z. and X.L. (Xin Liu). All authors have read and agreed to the published version of the manuscript.
Funding
This research was funded by the National Natural Science Foundation of China [No. 41991232] and the Fundamental Research Funds for the Central Universities.
Data Availability Statement
The data presented in this study are available on request from the corresponding author.
Conflicts of Interest
The authors declare no conflict of interest.
References
- Hori, Y.; Stuhlberger, C.; Simonett, O. Desertification: A Visual Synthesis. UNCCD, 2011. Available online: https://catalogue.unccd.int/10_Desertification_EN.pdf (accessed on 31 March 2022).
- Nkonya, E.; Anderson, W.; Kato, E.; Koo, J.; Mirzabaev, A.; von Braun, J.; Meyer, S. Global cost of land degradation. In Economics of Land Degradation and Improvement—A Global Assessment for Sustainable Development, 1st ed.; Nkonya, E., Mirzabaev, A., von Braun, J., Eds.; Springer: Cham, Switzerland, 2016; pp. 117–165. [Google Scholar]
- Millennium Ecosystem Assessment. Ecosystems and Human Well-Being: Desertification Synthesis. In The Millennium Ecosystem Assessment; World Resources Institute: Washington, DC, USA, 2005. [Google Scholar]
- Huang, J.P.; Yu, H.P.; Guan, X.D.; Wang, G.Y.; Guo, R.X. Accelerated dryland expansion under climate change. Nat. Clim. Chang. 2016, 6, 166–171. [Google Scholar] [CrossRef]
- Koutroulis, A.G. Dryland changes under different levels of global warming. Sci. Total Environ. 2019, 655, 482–511. [Google Scholar] [CrossRef]
- Feng, S.; Fu, Q. Expansion of global drylands under a warming climate. Atmos. Chem. Phys. 2013, 13, 10081–10094. [Google Scholar] [CrossRef] [Green Version]
- Cheng, Q.; Cheng, X.; Ma, K.X.; Zhao, X.Q.; Qu, J.P. Offering the win-win solutions between ecological conservation and livelihood development: National parks in Qinghai, China. Geogr. Sustain. 2020, 14, 251–255. [Google Scholar] [CrossRef]
- Aronson, J.C.; Blatt, C.M.; Aronson, T.B. Restoring ecosystem health to improve human health and well-being: Physicians and restoration ecologists unite in a common cause. Ecol. Soc. 2016, 21, 39. [Google Scholar] [CrossRef] [Green Version]
- Tolvanen, A.; Aronson, J. Ecological restoration, ecosystem services, and land use: A European perspective. Ecol. Soc. 2016, 21, 47. [Google Scholar] [CrossRef] [Green Version]
- European Commission. The EU Biodiversity Strategy to 2020. European Commission 2011. Available online: http://ec.europa.eu/environment/nature/info/pubs/docs/brochures/2020%20Biod%20brochure%20final%20lowres.pdf (accessed on 31 March 2022).
- UN Convention to Combat Desertification. Land Matters for Climate: Reducing the Gap and Approaching the Target. UNCCD, 2015. Available online: https://www.unccd.int/sites/default/files/documents/2015Nov_Land_matters_For_Climate_ENG_0.pdf (accessed on 31 March 2022).
- Neeson, T.M.; Smith, S.D.P.; Allan, J.D.; McIntyre, P.B. Prioritizing ecological restoration among sites in multi-stressor landscapes. Ecol. Appl. 2016, 26, 1785–1796. [Google Scholar] [CrossRef] [Green Version]
- Balensiefer, M.; Rossi, R.; Ardinghi, N.; Cenni, M.; Ugolini, M. SER International Primer on Ecological Restoration. 2004. Available online: https://floridalivingshorelines.com/wp-content/uploads/2015/05/Clewell.Aronson.Winterhalder.2004-SER-Primer.pdf (accessed on 31 March 2022).
- Strassburg, B.B.N.; Iribarrem, A.; Beyer, H.L.; Cordeiro, C.L.; Crouzeilles, R.; Jakovac, C.C.; Junqueira, A.B.; Lacerda, E.; Latawiec, A.E.; Balmford, A.; et al. Global priority areas for ecosystem restoration. Nature 2020, 586, 724–729. [Google Scholar] [CrossRef]
- Brancalion, P.H.S.; Niamir, A.; Broadbent, E.; Crouzeilles, R.; Barros, F.S.M.; Zambrano, A.M.A.; Baccini, A.; Aronson, J.; Goetz, S.; Reid, J.L.; et al. Global restoration opportunities in tropical rainforest landscapes. Sci. Adv. 2019, 5, eaav3223. [Google Scholar] [CrossRef] [Green Version]
- Li, Q.; Shi, X.Y.; Wu, Q.Q. Effects of protection and restoration on reducing ecological vulnerability. Sci. Total Environ. 2021, 761, 143180. [Google Scholar] [CrossRef]
- Nguyen, K.A.; Liou, Y.A. Global mapping of eco-environmental vulnerability from human and nature disturbances. Sci. Total Environ. 2019, 664, 995–1004. [Google Scholar] [CrossRef] [PubMed]
- Nguyen, A.K.; Liou, Y.A.; Li, M.H.; Tran, T.A. Zoning eco-environmental vulnerability for environmental management and protection. Ecol. Indic. 2016, 69, 100–117. [Google Scholar] [CrossRef]
- Yao, Y.; Liu, Y.X.; Wang, Y.J.; Fu, B.J. Greater increases in China’s dryland ecosystem vulnerability in drier conditions than in wetter conditions. J. Environ. Manag. 2021, 291, 112689. [Google Scholar] [CrossRef]
- Martin, D.M. Ecological restoration should be redefined for the twenty-first century. Restor. Ecol. 2017, 25, 668–673. [Google Scholar] [CrossRef]
- An, H.; Tang, Z.S.; Keesstra, S.; Shangguan, Z.P. Impact of desertification on soil and plant nutrient stoichiometry in a desert grassland. Sci. Rep. 2019, 9, 9422. [Google Scholar] [CrossRef]
- Zong, N.; Shi, P.L.; Sun, J. Estimation of ecological thresholds in plant and soil properties during desertification in an alpine grassland. Arid Zone Res. 2020, 37, 1580–1589. [Google Scholar] [CrossRef]
- Fu, B.; Wang, S.; Su, C.; Forsius, M. Linking ecosystem processes and ecosystem services. Curr. Opin. Environ. Sustain. 2013, 5, 4–10. [Google Scholar] [CrossRef]
- Xu, W.H.; Xiao, Y.; Zhang, J.J.; Yang, W.; Zhang, L.; Hull, V.; Wang, Z.; Zheng, H.; Liu, J.G.; Polasky, S.; et al. Strengthening protected areas for biodiversity and ecosystem services in China. Proc. Natl. Acad. Sci. USA 2017, 114, 1601–1606. [Google Scholar] [CrossRef] [Green Version]
- Kang, P.; Chen, W.P.; Hou, Y.; Li, Y.Z. Linking ecosystem services and ecosystem health to ecological risk assessment: A case study of the Beijing-Tianjin-Hebei urban agglomeration. Sci. Total Environ. 2018, 636, 1442–1454. [Google Scholar] [CrossRef] [PubMed]
- Trabucchi, M.; O’Farrell, P.J.; Notivol, E.; Comin, F.A. Mapping Ecological Processes and Ecosystem Services for Prioritizing Restoration Efforts in a Semi-arid Mediterranean River Basin. Environ. Manag. 2014, 53, 1132–1145. [Google Scholar] [CrossRef]
- del Rio-Mena, T.; Willemen, L.; Tesfamariam, G.T.; Beukes, O.; Nelson, A. Remote sensing for mapping ecosystem services to support evaluation of ecological restoration interventions in an arid landscape. Ecol. Indic. 2020, 113, 106182. [Google Scholar] [CrossRef]
- Feng, Q.; Zhao, W.W.; Duan, B.L.; Hu, X.P.; Cherubini, F. Coupling trade-offs and supply-demand of ecosystem services (ES): A new opportunity for ES management. Geogr. Sustain. 2021, 2, 275–280. [Google Scholar] [CrossRef]
- Fang, M.Z.; Si, G.X.; Yu, Q.; Huang, H.G.; Huang, Y.; Liu, W.; Guo, H.Q. Study on the Relationship between Topological Characteristics of Vegetation Ecospatial Network and Carbon Sequestration Capacity in the Yellow River Basin, China. Remote Sens. 2021, 13, 4926. [Google Scholar] [CrossRef]
- Dai, Y.J.; Tian, L.; Zhu, P.Z.; Dong, Z.; Zhang, R.H. Dynamic aeolian erosion evaluation and ecological service assessment in Inner Mongolia, northern China. Geoderma 2022, 406, 115518. [Google Scholar] [CrossRef]
- Liu, Y.Y.; van Dijk, A.I.J.M.; de Jeu, R.A.M.; Canadell, J.G.; McCabe, M.F.; Evans, J.P.; Wang, G.J. Recent reversal in loss of global terrestrial biomass. Nat. Clim. Chang. 2015, 5, 470–474. [Google Scholar] [CrossRef]
- Hansen, M.C.; Potapov, P.V.; Moore, R.; Hancher, M.; Turubanova, S.A.; Tyukavina, A.; Thau, D.; Stehman, S.V.; Goetz, S.J.; Loveland, T.R.; et al. High-Resolution Global Maps of 21st-Century Forest Cover Change. Science 2013, 342, 850–853. [Google Scholar] [CrossRef] [Green Version]
- Yin, C.C.; Zhao, W.W.; Pereira, P. Soil conservation service underpins sustainable development goals. Glob. Ecol. Conserv. 2022, 33, e01974. [Google Scholar] [CrossRef]
- Chen, Y.H.; Xu, M.H.; Wang, Z.L.; Chen, W.J.; Lai, C.G. Reexamination of the Xie model and spatiotemporal variability in rainfall erosivity in mainland China from 1960 to 2018. Catena 2020, 195, 104837. [Google Scholar] [CrossRef]
- Williams, J.R. The Erosion-Productivity Impact Calculator (Epic) Model: A Case History. Philos. Trans. R. Soc. Lond. Ser. B Biol. Sci. 1990, 329, 421–428. [Google Scholar] [CrossRef]
- Wang, H.; Zhao, W.W.; Li, C.J.; Pereira, P. Vegetation greening partly offsets the water erosion risk in China from 1999 to 2018. Geoderma 2021, 401, 115319. [Google Scholar] [CrossRef]
- Foster, G.R.; Wischmeier, W.H. Evaluating Irregular Slopes for Soil Loss Prediction. Trans. ASAE 1974, 17, 305–309. [Google Scholar] [CrossRef]
- Roels, B.; Donders, S.; Werger, M.J.A.; Dong, M. Relation of wind-induced sand displacement to plant biomass and plant sand-binding capacity. J. Integr. Plant Biol. 2001, 43, 979–982. [Google Scholar]
- Van Pelt, R.S.; Zobeck, T.M.; Potter, K.N.; Stout, J.E.; Popham, T.W. Validation of the wind erosion stochastic simulator (WESS) and the revised wind erosion equation (RWEQ) for single events. Environ. Model. Softw. 2004, 19, 191–198. [Google Scholar] [CrossRef]
- Hou, Y.Z.; Zhao, W.W.; Liu, Y.X.; Yang, S.Q.; Hu, X.P.; Cherubini, F. Relationships of multiple landscape services and their influencing factors on the Qinghai-Tibet Plateau. Landsc. Ecol. 2021, 36, 1987–2005. [Google Scholar] [CrossRef]
- Li, S.S.; Yang, S.N.; Liu, X.F.; Liu, Y.X.; Shi, M.M. NDVI-Based Analysis on the Influence of Climate Change and Human Activities on Vegetation Restoration in the Shaanxi-Gansu-Ningxia Region, Central China. Remote Sens. 2015, 7, 11163–11182. [Google Scholar] [CrossRef] [Green Version]
- Pan, N.Q.; Feng, X.M.; Fu, B.J.; Wang, S.; Ji, F.; Pan, S.F. Increasing global vegetation browning hidden in overall vegetation greening: Insights from time-varying trends. Remote Sens. Environ. 2018, 214, 59–72. [Google Scholar] [CrossRef]
- Liu, Y.X.; Fu, B.J.; Liu, Y.; Zhao, W.W.; Wang, S. Vulnerability assessment of the global water erosion tendency: Vegetation greening can partly offset increasing rainfall stress. Land. Degrad. Dev. 2019, 30, 1061–1069. [Google Scholar] [CrossRef]
- Li, D.L.; Wu, S.Y.; Liu, L.B.; Zhang, Y.T.; Li, S.C. Vulnerability of the global terrestrial ecosystems to climate change. Glob. Chang. Biol. 2018, 24, 4095–4106. [Google Scholar] [CrossRef]
- Seddon, A.W.R.; Macias-Fauria, M.; Long, P.R.; Benz, D.; Willis, K.J. Sensitivity of global terrestrial ecosystems to climate variability. Nature 2016, 531, 229–232. [Google Scholar] [CrossRef] [PubMed] [Green Version]
- Loarie, S.R.; Duffy, P.B.; Hamilton, H.; Asner, G.P.; Field, C.B.; Ackerly, D.D. The velocity of climate change. Nature 2009, 462, 1052–1055. [Google Scholar] [CrossRef]
- Hua, T.; Zhao, W.W.; Cherubini, F.; Hu, X.P.; Pereira, P. Sensitivity and future exposure of ecosystem services to climate change on the Tibetan Plateau of China. Landsc. Ecol. 2021, 36, 3451–3471. [Google Scholar] [CrossRef]
- Guo, B.; Zhang, J.; Meng, X.; Xu, T.; Song, Y. Long-term spatio-temporal precipitation variations in China with precipitation surface interpolated by ANUSPLIN. Sci. Rep. 2020, 10, 81. [Google Scholar] [CrossRef]
- Wang, F.; Yang, S. Regional characteristics of long-term changes in total and extreme precipitations over China and their links to atmospheric-oceanic features. Int. J. Clim. 2017, 37, 751–769. [Google Scholar] [CrossRef] [Green Version]
- Chen, C.; Park, T.; Wang, X.H.; Piao, S.L.; Xu, B.D.; Chaturvedi, R.K.; Fuchs, R.; Brovkin, V.; Ciais, P.; Fensholt, R.; et al. China and India lead in greening of the world through land-use management. Nat. Sustain. 2019, 2, 122–129. [Google Scholar] [CrossRef]
- Lu, Y.; Zhang, L.; Feng, X.; Zeng, Y.; Fu, B.; Yao, X.; Li, J.; Wu, B. Recent ecological transitions in China: Greening, browning, and influential factors. Sci. Rep. 2015, 5, 8732. [Google Scholar] [CrossRef]
- Piao, S.L.; Wang, X.H.; Park, T.; Chen, C.; Lian, X.; He, Y.; Bjerke, J.W.; Chen, A.P.; Ciais, P.; Tommervik, H.; et al. Characteristics, drivers and feedbacks of global greening. Nat. Rev. Earth Environ. 2020, 1, 14–27. [Google Scholar] [CrossRef]
- Zeng, Z.Z.; Peng, L.Q.; Piao, S.L. Response of terrestrial evapotranspiration to Earth’s greening. Curr. Opin. Environ. Sustain. 2018, 33, 9–25. [Google Scholar] [CrossRef]
- Alkama, R.; Cescatti, A. Biophysical climate impacts of recent changes in global forest cover. Science 2016, 351, 600–604. [Google Scholar] [CrossRef] [PubMed] [Green Version]
- Liu, Y.B.; Xiao, J.F.; Ju, W.M.; Xu, K.; Zhou, Y.L.; Zhao, Y.T. Recent trends in vegetation greenness in China significantly altered annual evapotranspiration and water yield. Environ. Res. Lett. 2016, 11, 094010. [Google Scholar] [CrossRef]
- Zhang, Y.Q.; Pena-Arancibia, J.L.; McVicar, T.R.; Chiew, F.H.S.; Vaze, J.; Liu, C.M.; Lu, X.J.; Zheng, H.X.; Wang, Y.P.; Liu, Y.Y.; et al. Multi-decadal trends in global terrestrial evapotranspiration and its components. Sci. Rep. 2016, 6, 19124. [Google Scholar] [CrossRef] [Green Version]
- Liu, Y.; Fu, B.J.; Lu, Y.H.; Wang, Z.; Gao, G.Y. Hydrological responses and soil erosion potential of abandoned cropland in the Loess Plateau, China. Geomorphology 2012, 138, 404–414. [Google Scholar] [CrossRef]
- Bodi, M.B.; Doerr, S.H.; Cerda, A.; Mataix-Solera, J. Hydrological effects of a layer of vegetation ash on underlying wettable and water repellent soil. Geoderma 2012, 191, 14–23. [Google Scholar] [CrossRef]
- Zhou, J.; Fu, B.J.; Gao, G.Y.; Lu, Y.H.; Liu, Y.; Lu, N.; Wang, S. Effects of precipitation and restoration vegetation on soil erosion in a semi-arid environment in the Loess Plateau, China. Catena 2016, 137, 1–11. [Google Scholar] [CrossRef]
- Mankin, J.S.; Seager, R.; Smerdon, J.E.; Cook, B.I.; Williams, A.P.; Horton, R.M. Blue Water Trade-Offs With Vegetation in a CO2-Enriched Climate. Geophys. Res. Lett. 2018, 45, 3115–3125. [Google Scholar] [CrossRef]
- Zeng, Z.Z.; Piao, S.L.; Li, L.Z.X.; Zhou, L.M.; Ciais, P.; Wang, T.; Li, Y.; Lian, X.; Wood, E.F.; Friedlingstein, P.; et al. Climate mitigation from vegetation biophysical feedbacks during the past three decades. Nat. Clim. Chang. 2017, 7, 432–436. [Google Scholar] [CrossRef]
- Nearing, M.A.; Jetten, V.; Baffaut, C.; Cerdan, O.; Couturier, A.; Hernandez, M.; Le Bissonnais, Y.; Nichols, M.H.; Nunes, J.P.; Renschler, C.S.; et al. Modeling response of soil erosion and runoff to changes in precipitation and cover. Catena 2005, 61, 131–154. [Google Scholar] [CrossRef]
- Qi, Y.Q.; Liu, J.Y.; Shi, H.D.; Hu, Y.F.; Zhuang, D.F. Using Cs-137 tracing technique to estimate wind erosion rates in the typical steppe region, northern Mongolian Plateau. Chin. Sci. Bull. 2008, 53, 1423–1430. [Google Scholar] [CrossRef] [Green Version]
- Du, H.Q.; Wang, T.; Xue, X. Potential wind erosion rate response to climate and land-use changes in the watershed of the Ningxia-Inner Mongolia reach of the Yellow River, China, 1986-2013. Earth Surf. Process. Landf. 2017, 42, 1923–1937. [Google Scholar] [CrossRef]
- Zhou, Z.L.; Zhang, Z.D.; Zou, X.Y.; Zhang, K.L.; Zhang, W.B. Quantifying wind erosion at landscape scale in a temperate grassland: Nonignorable influence of topography. Geomorphology 2020, 370, 107401. [Google Scholar] [CrossRef]
- Fu, Q.; Li, B.; Hou, Y.; Bi, X.; Zhang, X.S. Effects of land use and climate change on ecosystem services in Central Asia’s arid regions: A case study in Altay Prefecture, China. Sci. Total Environ. 2017, 607, 633–646. [Google Scholar] [CrossRef] [PubMed]
- Li, D.J.; Xu, D.Y.; Wang, Z.Y.; You, X.G.; Zhang, X.Y.; Song, A.L. The dynamics of sand-Stabilization services in Inner Mongolia, China from 1981 to 2010 and its relationship with climate change and human activities. Ecol. Indic. 2018, 88, 351–360. [Google Scholar] [CrossRef]
- Zhang, H.Y.; Fan, J.W.; Cao, W.; Harris, W.; Li, Y.Z.; Chi, W.F.; Wang, S.Z. Response of wind erosion dynamics to climate change and human activity in Inner Mongolia, China during 1990 to 2015. Sci. Total Environ. 2018, 639, 1038–1050. [Google Scholar] [CrossRef]
- Liu, Y.L.; Kumar, M.; Katul, G.G.; Porporato, A. Reduced resilience as an early warning signal of forest mortality. Nat. Clim. Chang. 2019, 9, 880–885. [Google Scholar] [CrossRef]
- Tscharntke, T.; Klein, A.M.; Kruess, A.; Steffan-Dewenter, I.; Thies, C. Landscape perspectives on agricultural intensification and biodiversity—Ecosystem service management. Ecol. Lett. 2005, 8, 857–874. [Google Scholar] [CrossRef]
- Chapin, F.S.; Zavaleta, E.S.; Eviner, V.T.; Naylor, R.L.; Vitousek, P.M.; Reynolds, H.L.; Hooper, D.U.; Lavorel, S.; Sala, O.E.; Hobbie, S.E.; et al. Consequences of changing biodiversity. Nature 2000, 405, 234–242. [Google Scholar] [CrossRef]
- Grime, J.P.; Brown, V.K.; Thompson, K.; Masters, G.J.; Hillier, S.H.; Clarke, I.P.; Askew, A.P.; Corker, D.; Kielty, J.P. The response of two contrasting limestone grasslands to simulated climate change. Science 2000, 289, 762–765. [Google Scholar] [CrossRef] [PubMed]
- Borrelli, P.; Robinson, D.A.; Fleischer, L.R.; Lugato, E.; Ballabio, C.; Alewell, C.; Meusburger, K.; Modugno, S.; Schutt, B.; Ferro, V.; et al. An assessment of the global impact of 21st century land use change on soil erosion. Nat. Commun. 2017, 8, 2013. [Google Scholar] [CrossRef] [Green Version]
- Ferro, V. Deducing the USLE mathematical structure by dimensional analysis and self-similarity theory. Biosyst. Eng. 2010, 106, 216–220. [Google Scholar] [CrossRef]
- Risse, L.M.; Nearing, M.A.; Nicks, A.D.; Laflen, J.M. Error Assessment in the Universal Soil Loss Equation. Soil Sci. Soc. Am. J. 1993, 57, 825–833. [Google Scholar] [CrossRef]
- Borrelli, P.; Robinson, D.A.; Panagos, P.; Lugato, E.; Yang, J.E.; Alewell, C.; Wuepper, D.; Montanarella, L.; Ballabio, C. Land use and climate change impacts on global soil erosion by water (2015–2070). Proc. Natl. Acad. Sci. USA 2020, 117, 21994–22001. [Google Scholar] [CrossRef]
- Wuepper, D.; Borrelli, P.; Finger, R. Countries and the global rate of soil erosion. Nat. Sustain. 2020, 3, 51–55. [Google Scholar] [CrossRef]
- Guo, Z.; Zobeck, T.M.; Zhang, K.; Li, F. Estimating potential wind erosion of agricultural lands in northern China using the Revised Wind Erosion Equation and geographic information systems. J. Soil Water Conserv. 2013, 68, 13–21. [Google Scholar] [CrossRef]
- Feng, X.M.; Fu, B.J.; Piao, S.; Wang, S.H.; Ciais, P.; Zeng, Z.Z.; Lu, Y.H.; Zeng, Y.; Li, Y.; Jiang, X.H.; et al. Revegetation in China’s Loess Plateau is approaching sustainable water resource limits. Nat. Clim. Chang. 2016, 6, 1019–1022. [Google Scholar] [CrossRef]
- Hua, F.; Bruijnzeel, L.A.; Meli, P.; Martin, P.A.; Zhang, J.; Nakagawa, S.; Miao, X.; Wang, W.; McEvoy, C.; Pena-Arancibia, J.L.; et al. The biodiversity and ecosystem service contributions and trade-offs of forest restoration approaches. Science 2022, 376, eabl4649. [Google Scholar] [CrossRef]
- Chazdon, R.L.; Uriarte, M. Natural regeneration in the context of large-scale forest and landscape restoration in the tropics. Biotropica 2016, 48, 709–715. [Google Scholar] [CrossRef]
- Chazdon, R.L.; Falk, D.A.; Banin, L.F.; Wagner, M.; Wilson, S.J.; Grabowski, R.C.; Suding, K.N. The intervention continuum in restoration ecology: Rethinking the active-passive dichotomy. Restor. Ecol. 2021, e13535. [Google Scholar] [CrossRef]
- McConkey, B.G.; Dyck, F.B. Summerfallow oilseed barrier strips for wind erosion control: Influences on the subsequent crop. Can. J. Plant Sci. 1996, 76, 675–682. [Google Scholar] [CrossRef]
- Liu, B.L.; Zhang, W.M.; Qu, J.J.; Zhang, K.C.; Han, Q.J. Controlling windblown sand problems by an artificial gravel surface: A case study over the Gobi surface of the Mogao Grottoes. Geomorphology 2011, 134, 461–469. [Google Scholar] [CrossRef]
- Dai, Y.J.; Dong, Z.; Li, H.L.; He, Y.X.; Li, J.R.; Guo, J.Y. Effects of checkerboard barriers on the distribution of aeolian sandy soil particles and soil organic carbon. Geomorphology 2019, 338, 79–87. [Google Scholar] [CrossRef]
- Li, S.H.; Li, C.; Yao, D.; Wang, S. Feasibility of microbially induced carbonate precipitation and straw checkerboard barriers on desertification control and ecological restoration. Ecol. Eng. 2020, 152, 105883. [Google Scholar] [CrossRef]
Publisher’s Note: MDPI stays neutral with regard to jurisdictional claims in published maps and institutional affiliations. |
© 2022 by the authors. Licensee MDPI, Basel, Switzerland. This article is an open access article distributed under the terms and conditions of the Creative Commons Attribution (CC BY) license (https://creativecommons.org/licenses/by/4.0/).