Article

Assessment of the Consistency and Stability of CrIS Infrared Observations Using COSMIC-2 Radio Occultation Data over Ocean

1
NOAA National Environmental Satellite, Data, and Information Service, Center for Satellite Applications and Research, College Park, MD 20740, USA
2
Cooperative Institute for Satellite Earth System Studies (CISESS), Earth System Science Interdisciplinary Center, University of Maryland, College Park, MD 20740, USA
*
Author to whom correspondence should be addressed.
Remote Sens. 2022, 14(11), 2721; https://doi.org/10.3390/rs14112721
Submission received: 29 April 2022 / Revised: 1 June 2022 / Accepted: 4 June 2022 / Published: 6 June 2022

Abstract

:
The accuracy of brightness temperature (BT) from the Cross-track Infrared Sounder (CrIS) onboard the Suomi National Polar-orbiting Partnership (S-NPP) satellite and NOAA-20 is estimated using the Constellation Observing System for Meteorology, Ionosphere, and Climate 2 (COSMIC-2) radio occultation (RO) wet retrievals (temperature and water vapor profiles) as input to the Community Radiative Transfer Model (CRTM). The matchup criteria between RO and CrIS observations are time less than 30 min, a distance less than 50 km, and over oceans to reduce the collocation and simulation uncertainty. Based on the information provided in the CrIS and RO observations, only upper temperature sounding channels with weighting function peak height (WFPH) above 200 hPa (~12 km) from the CrIS longwave infrared (LWIR) and shortwave infrared (SWIR) bands and water vapor channels from the CrIS mid-wave infrared (MWIR) band with WFPH above 500 hPa (~6.3 km) are selected for comparison to minimize the impacts from the surface emission, cloud absorption/scattering, and atmospheric gaseous absorption. The absolute differences between CrIS observations and their CRTM simulations using RO data as input are less than 1.0 K for the majority of those selected channels. The double differences between CrIS observations on NOAA-20 and S-NPP using CRTM simulations as transfer references are very stable. They range from −0.05 K to 0.15 K for LWIR channels and −0.20 K to 0.10 K for SWIR channels during the two years from 1 October 2019 to 30 September 2021. For MWIR channels, the double differences range from −0.15 K to 0.25 K but have significant variations in both daily mean and monthly mean time series. The results provide ways to understand the qualities of RO retrieval and CrIS measurements: RO data can be used to assess the consistency and stability of CrIS observations quantitatively, and CrIS measurements have the quality to assess the quality and stability of RO retrievals.

Graphical Abstract

1. Introduction

The Cross-track Infrared Sounder (CrIS) is a Fourier transform spectrometer (FTS) onboard the Suomi National Polar-orbiting Partnership (S-NPP) satellite and NOAA-20 satellite, which were launched on 28 October 2011 and 18 November 2017, respectively. Both CrIS instruments operationally provide sensor data records (SDRs) to user communities. CrIS observes the atmosphere in three infrared (IR) bands simultaneously: a long-wave infrared (LWIR) band at 650–1095 cm−1, a middle-wave infrared (MWIR) band at 1210–1750 cm−1, and a short-wave infrared (SWIR) band at 2155–2550 cm−1. It has 2211 channels in the full spectral resolution (FSR) mode with a spectral resolution of 0.625 cm−1 [1]. For each scan, CrIS collects 30 Earth scene fields of regard (FORs) with an arranged 3 × 3 detector array (or nine fields of view (FOVs)). The CrIS measurements provide global coverage of critical temperature and water vapor information used for improving numerical weather prediction (NWP) forecasts [2] and for quantifying greenhouse gas concentrations primarily in the middle and upper atmosphere [3]. They are now becoming an essential part of the long-term climate record, having provided stable data for more than 10 years [4,5,6,7].
As demonstrated by previous studies, CrIS SDR data have high radiometric calibration accuracy [8,9], high stable spectral calibration [10,11], good geolocation performance [12], and excellent noise performance [13,14]. However, there is no absolute post-launch radiometric calibration reference for infrared sensors such as CrIS. There are three potential methods to assess the CrIS SDR radiometric accuracy: (1) direct comparison of the S-NPP and NOAA-20 radiance observations when both CrIS instruments are in the operational mode for the common Earth scenes within a limited time difference [15] (although there is a 50.7 min orbit separation between S-NPP and NOAA-20 satellites); (2) comparison with other hyperspectral sensors such as Infrared Atmospheric Sounding Interferometer (IASI) and the Atmospheric Infrared Sounder (AIRS) using the simultaneous nadir overpass (SNO) method [16] over polar regions by converting to the common spectral grid; and (3) comparison with simulations from a forward radiative transfer model. The first method could be very useful in radiometric evaluation to quantify the radiometric difference and create a calibration link between SNPP and NOAA-20 CrIS instruments [15], which is crucial for creating CrIS long-term climate data records by combining the same sensors on different satellite platforms. Similar to the first method, the second method could create a calibration link between CrIS and IASI/AIRS to create even longer hyperspectral IR climate data records [7,16]. However, both methods can only evaluate the relative radiometric difference, not the absolute radiometric error or measurement bias, which is important in weather and climate predictions. In this study, we use the third method that treats the simulated radiances as the radiometric reference to investigate the bias characteristics in CrIS data by using Global Navigation Satellite System (GNSS) radio occultation (RO) data from Constellation Observing System for Meteorology, Ionosphere, and Climate 2 (COSMIC-2), and to calculate the double (relative) radiance difference between NOAA-20 and S-NPP using the simulation as an intermediate radiometric transfer.
The GNSS RO raw data are, in principle, International Standard (SI) traceable. The RO observed phase delays due to the atmospheric refraction can be converted to bending angles and refractivity profiles, and then further inverted to the temperature and water vapor profiles [17,18]. Radio occultation is the first technique to provide high accuracy, high precision, high vertical resolution, and all-weather limb sounding measurements without system calibration and having no instrument drift [19,20,21,22,23]. RO data provide critical temperature and water vapor information in NWP models [24,25,26,27] and climate applications [28,29,30,31,32,33,34], and they complement the space-based nadir viewing microwave and infrared sounder measurements, such as Advanced Technology Microwave Sounder (ATMS) and CrIS. RO data have been widely used to characterize the brightness temperature (BT) bias for upper-level microwave temperature sounding channels from Advanced Microwave Sounding Unit (AMSU) and ATMS [35,36,37,38,39]. These temperature sounding channels have mainly observed the radiation emitted from the atmospheric absorber oxygen (O2), whose concentration is very stable compared to other gases such as water vapor (H2O), ozone (O3), carbon dioxide (CO2), nitrous oxide (N2O), carbon monoxide (CO), and methane (CH4) in the atmosphere. Therefore, the temperature sounding channel BT signals from the microwave radiometer can be linked to the atmospheric temperature. Results from [37] suggested that the GNSS RO soundings are critical to monitoring and trending the antenna brightness temperature biases of individual microwave radiometers on different satellite platforms. The study in [38] used RO-derived BT as absolute references to estimate the ATMS scan-angle-dependent bias and then correct the biases in the observations. Results in [39] demonstrated that the quality of COSMIC-2 RO data renders it a well-suited reference sensor to capture the calibration update of S-NPP ATMS.
Compared to the excellent performance reported for validating microwave measurements using RO temperature and water vapor profiles, there are limitations and challenges to validating the infrared observations using the same data. There are more atmospheric absorbers in the infrared region than in the microwave region besides water vapor and oxygen. In the infrared region, the most important absorbers are CO2, H2O, and O3, and other minor absorbers include CO, N2O, and CH4, which have significant contributions to atmospheric absorption and emission. In contrast, only O2 and H2O are the major absorbing gases in the microwave region. There is not enough information provided by the RO data to accurately simulate the infrared radiances using a radiative transfer model such as the Community Radiative Transfer Model (CRTM) [40,41,42]. To overcome this limitation, we first identify and characterize the information content from the CrIS observations and then select the CrIS channels mainly impacted by the information provided by RO data to perform the assessment. These channels include LWIR and SWIR temperature sounding channels and MWIR water vapor channels.
The paper is organized as follows: In Section 2, the information content from CrIS measurements and the COSMIC-2 RO data retrieval uncertainties are described. Section 3 provides the criteria for collocating the COSMIC-2 RO and CrIS observations and selecting CrIS channels used for the comparison. Section 4 compares CrIS observations and CRTM-based simulations using COSMIC-2 RO data and the inter-satellite CrIS difference between NOAA-20 and S-NPP. Section 5 provides the discussion. Finally, Section 6 summarizes our studies.

2. Data Characteristics from CrIS and COSMIC-2 RO Measurement

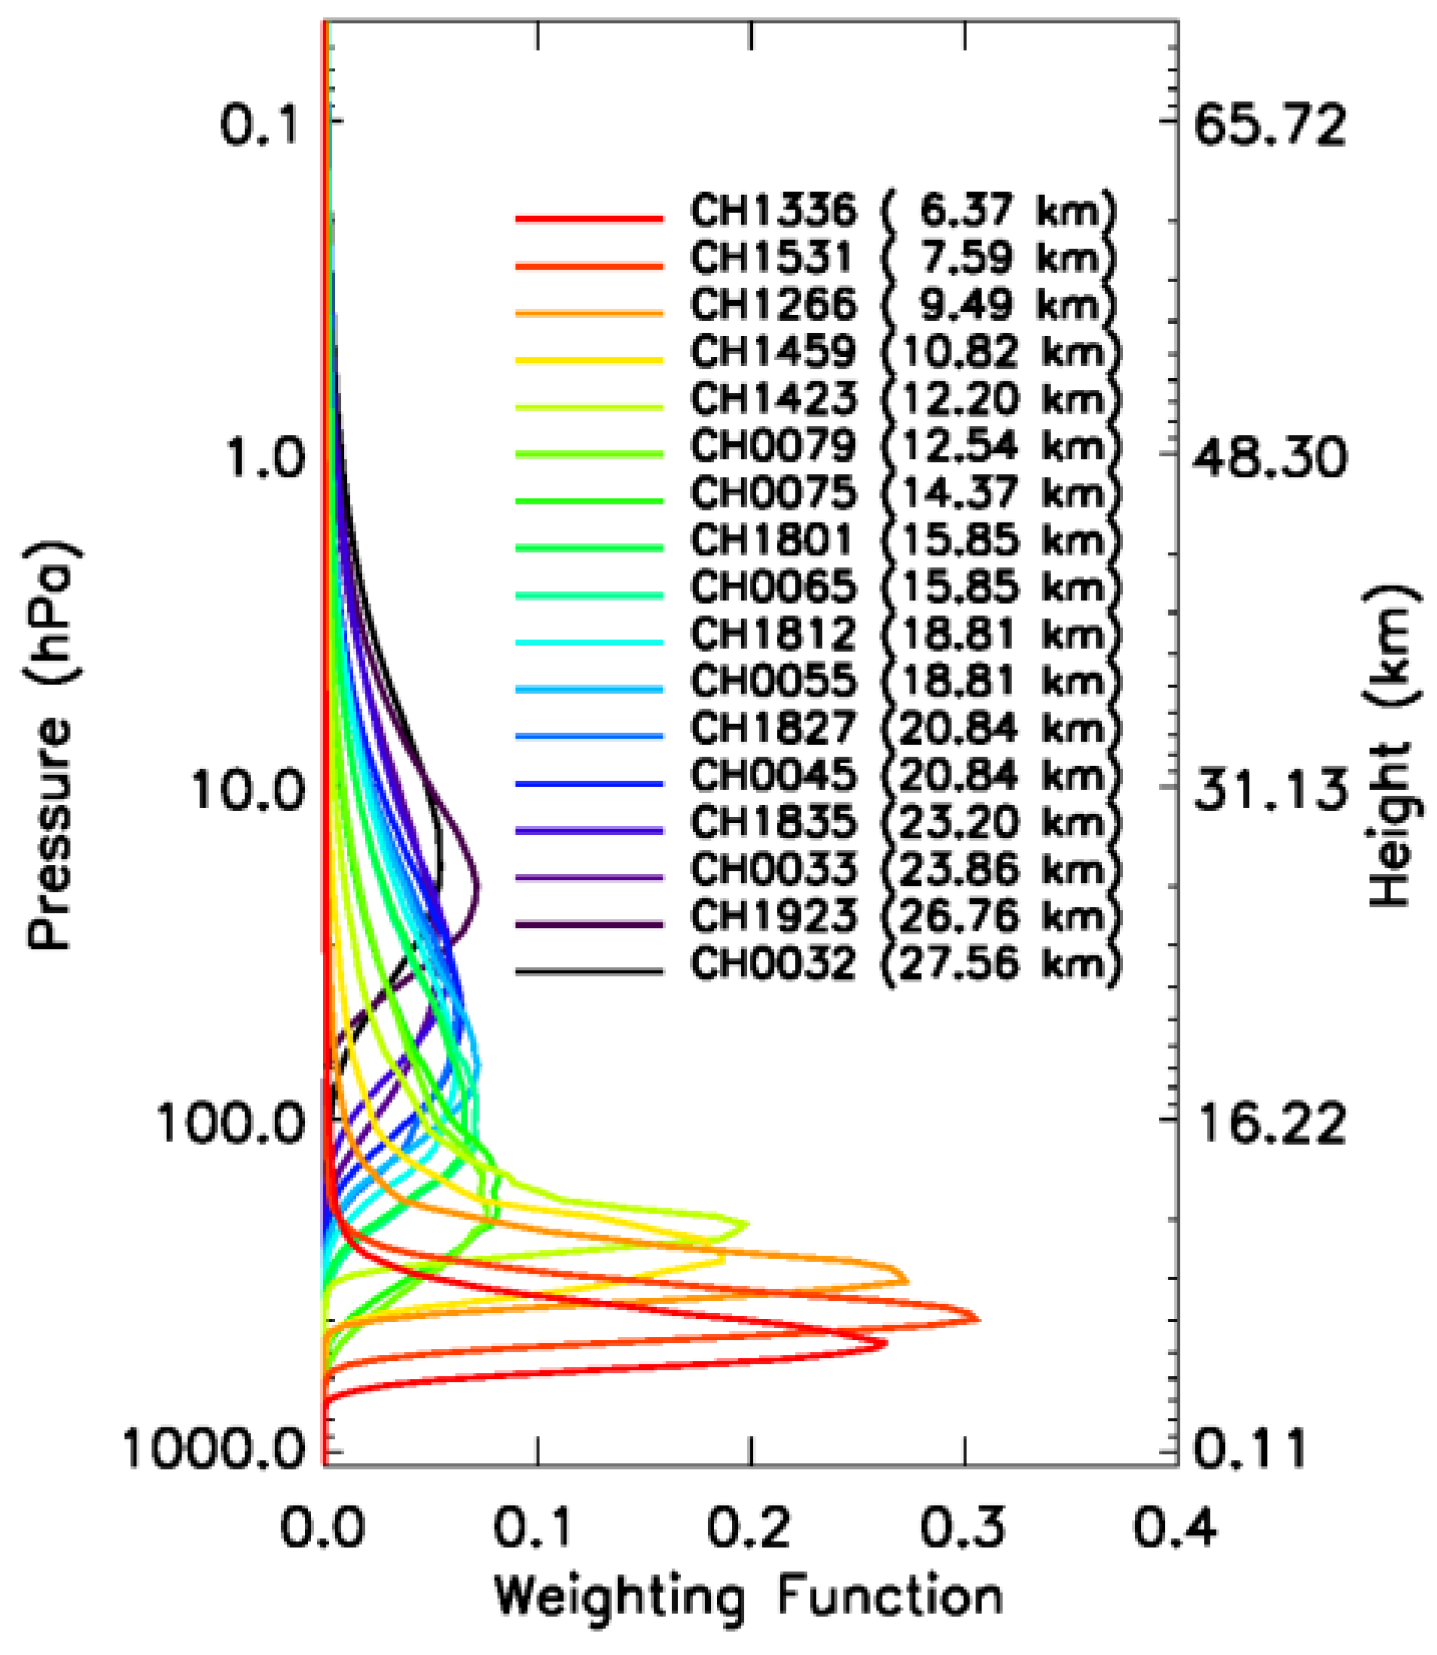
2.1. Information Contents from CrIS Measurement

CrIS is an infrared sounder covering wavenumbers from 650 cm−1 to 2550 cm−1. This sensor’s top-of-atmosphere (TOA) radiances are strongly impacted by the atmospheric temperature, water vapor, and other gases, as well as clouds and surfaces. Figure 1 shows the brightness temperature variation due to changes in atmospheric state variables, such as atmospheric temperature (T), sea surface temperature (SST), water vapor, ozone, carbon dioxide, nitrous oxide, carbon monoxide, and methane in CrIS channels. It clearly shows that when atmospheric temperature increases by 1 K in all layers, almost all of the CrIS channel brightness temperatures increase by about 1 K. By increasing the SST by 1 K, the BT in the atmospheric window channels (800 cm−1 to 1095 cm−1 in the LWIR band and 2400 cm−1 to 2550 cm−1 in the SWIR band) and semi-transparent channels (near 1210 cm−1 and 2155 cm−1) will be greatly impacted. The whole MWIR band from 1210 cm−1 to 1750 cm−1 is strongly impacted by the water vapor absorption centered at 1594.78 cm−1 (fundamental band 6.25 µm). In the LWIR band starting from 750 cm−1, the water vapor line and continuum absorption play an important role. The ozone absorption is mainly located in the 1110 cm−1 to 1043 cm−1 region (the well-known 9.6 µm region) and in the 705 cm−1 region, which is well masked by the strong CO2 15 µm band and appears to be less significant in atmospheric radiative transfer. There are two strong CO2 absorption regions: 15 µm in the LWIR band and 4.3 µm in the SWIR band. Different from other gaseous absorption with negative BT impact when increasing the absorber concentration, numerous channels have positive BT impact when the CO2 amount increases, specifically, from 650 cm−1 to 693.75 cm−1 in the LWIR band and from 2287.5 cm−1 to 2381.25 cm−1 in the SWIR band due to a higher weighting function peak near or above the tropopause. The N2O molecule has a strong absorption centered at 1285.6 cm−1 and 2223.5 cm−1 with a negative BT impact. The CO molecule has an absorption band centered at 4.67 µm in the SWIR band (2155 cm−1 to 2217 cm−1). The CH4 has strong absorption lines centered at 1306.2 cm−1 (1210 cm−1 to 1400 cm−1) and covers the beginning channels in the MWIR band.
The presence of clouds strongly negatively impacts infrared sounder CrIS TOA radiances. Infrared waves usually cannot penetrate clouds as microwave sounders do. The IR radiation below the cloud is mostly absorbed by the cloud and then emitted from the cold cloud top, resulting in cooler TOA brightness temperatures than those from clear sky regions. The effects of possible contamination by clouds in the CrIS observations can be detected by using a hyperspectral IR cloud-detection algorithm [11,43]. Based on the model simulation, we can find the cloud-sensitive height for each channel. The cloud-sensitive height is defined as the level where the energy contribution from the cloud does not exceed 1% of the clear radiance. Figure 2 shows the cloud-sensitive height and weighting function peaking height (WFPH) from CrIS channels. It clearly shows that the cloud-sensitive height is always lower than the WFPH. The cloud-sensitive heights are near the surface for transparent (window) and semi-transparent channels. For CO2 strong absorption bands at 15 µm and 4.3 µm, the cloud sensitive heights are above 200 hPa and above any realistic cloud height, indicating that these channels are not impacted by clouds and are always clear channels. The cloud detection is based on the ranked and sorted channel cloud sensitivity heights (highest channel goes first and lowest channel last) and their channel BT departure between observations and simulations. We search for a ranked channel index where a cloud no longer significantly affects the channel radiance. The BT departure and its local gradient from the ranked channels are less than the predetermined thresholds. All channels above this index are marked as clear and those below as cloudy.
In this study, we used the operational CrIS SDR radiance products for the two years from 1 October 2019 to 30 September 2021. Both S-NPP and NOAA-20 used the same processing system. During this period, there are no major algorithm updates that would significantly impact the data quality and accuracy. However, CrIS on S-NPP had a major anomaly for band 1 (LWIR band) from 21 May 2021 to 12 July 2021 due to the Side-2 electronics failure. The instrument was switched to the Side-1 electronics on 12 July 2021. As a result, band 2 (MWRI band) was lost.
The operational CrIS SDR products have radiometric uncertainty of 0.16%, 0.19%, and 0.40% with respect to a blackbody at 287 K for the three CrIS bands, respectively [6,9]. Converting to brightness temperature, the uncertainty is less than 0.l K for all CrIS channels. However, this uncertainty is dependent on the scene temperature and increases with decreasing scene temperature. For example, at 240 K scene temperature, the uncertainty can be increased up to 0.14 K in LWIR and SWIR bands.

2.2. COSMIC-2 RO Data Measurement Characteristics

The COSMIC-2 RO receiver satellite system was successfully launched into equatorial orbit on 25 June 2019. It consists of six small satellites with a 24-degree inclination on the low Earth orbit (LEO). It provides comprehensive coverage of atmospheric profile soundings in low- and mid-latitude regions from 45°N to 45°S. Although RO raw data are traceable to a unit of time, the derived final environmental variables such as temperature and water vapor from the original raw phase measurements are not. The general error characteristics of RO uncertainties are, in particular, dependent on height [17,44,45]. The main contributions to the neutral atmospheric bending angle uncertainty include the instrument thermal noise in the carrier phase measurements and the residual ionospheric noise that could not be removed. Both error sources place a nearly constant noise floor for bending angle data in the upper atmosphere. Due to the bending angle profile decreasing exponentially with height, the relative errors of bending angles increase exponentially with altitude above 35 km.
Although the signal-to-noise ratio (SNR) is significantly reduced due to the defocusing of the blended rays, the RO receivers can still successfully track the GNSS signals. The most stable and accurate RO observations occur in the middle and lower stratosphere as well as the upper troposphere (typically between 10 and 35 km), where the measurement accuracy is primarily dominated by the atmospheric horizontal gradients (very weak), and the noise from the RO receivers becomes relatively less important to the total error budget of RO observations. The relative bending angle errors are approximately constant with height in this altitude range.
In the lower and middle troposphere, the measured data usually have rapid amplitude and phase variations due to further reduced SNR and the presence of water vapor. In this altitude range, the bending angle error has two additional contributors: (1) the ability of the receivers to track the multitude of signals with very low SNRs and (2) the ability of the bending angle retrieval algorithms to disentangle these signals into a single-valued bending angle profile. With increased levels of water vapor in the middle and lower troposphere, the complexity in the signal propagation increases, and so does the uncertainty of bending angle retrievals.
The error budget of bending angle retrievals in the lower troposphere is not directly dependent on the carrier phase noise (and SNR) but is impacted by the noise data cut-off. Sokolovskiy et al. [44] showed that the carrier phase data cut-off in the Earth’s shadow particularly determined the inversion biases at the bottom of bending angle profiles. In the bending angle retrieval processing, the noise level is estimated by analyzing the lower tail of measurement data. Only data with SNRs above this noise level are kept and used for retrieval. The signal threshold is a tunable parameter in the processing, indicating that bending angle biases immediately above the Earth’s surface mostly result from processing choices rather than from the actual measurement.
To invert the RO observation from the bending angle (or refractivity) to the physical temperature and water vapor profiles in the atmosphere, a one-dimensional variational (1DVAR) inversion approach is needed to resolve the ambiguity of RO refractivity associated with both temperature and water vapor in the lower troposphere. As a RO data processing center, University Corporation for Atmospheric Research (UCAR) developed 1DVAR retrieval algorithms to operationally and optimally retrieve temperature and humidity profiles from COSMIC-2 RO refractivity profiles [46]. The retrieved product, namely the UCAR WETPf2 from the near real-time (NRT), was officially released in October 2019 and made publicly available on the web at https://data.cosmic.ucar.edu/gnss-ro/cosmic2/nrt/, accessed on 3 June 2022. WETPf2 provides the temperature and water vapor profiles up to 60 km altitude with a 0.05 km vertical resolution from mean sea level height up to 20 km and 0.1 km resolution from 20 to 60 km. In this retrieval system, NOAA’s National Centers for Environmental Prediction (NCEP) Global Forecasting System (GFS) model six-hour forecasts are used as the a priori, and the retrieved water vapor profiles may substantially fit the background below 2 km, which could significantly limit the retrieval accuracy of the water vapor profile in that layer. In our comparison between CrIS observations and simulations using COSMIC-2 data, we should be aware of this and avoid the CrIS channels sensitive to the lower-level water vapor. In general, the uncertainty from RO temperature profiles is dependent on the altitudes. The uncertainty estimate is smaller than 0.15 K in the upper troposphere–lower stratosphere and gradually increases into the lower troposphere and the stratosphere.
In this study, we used UCAR COSMIC-2 NRT WETPf2 data products for the two years from 1 October 2019 to 30 September 2021. During this period, the wet retrieval products were impacted by the algorithm updates and background changes in the 1DVAR system. Such changes include: algorithm updates in the 1DVAR algorithm on 25 September 2020 and on 23 March 2021; the European Centre for Medium-Range Weather Forecasts (ECMWF) forecasts replaced GFS forecasts as the a priori on 28 September 2021.

3. Data Collocation and CrIS Channel Selection

In this study, the collocated RO and CrIS data are first collected over the area of interest, which is the [45°S, 45°N] latitude band over oceans. The collocation criteria are set as a time difference of no more than 30 min and a spatial distance of less than 50 km. Such matching criteria ensure that both the RO and CrIS instruments observed a reasonably similar atmospheric state. The spatial distance is defined as the distance between the occultation point location of the RO profile and CrIS observation location to minimize the viewing geometry effect of CrIS. Given the CrIS field of view (FOV) size of 14 km at the nadir and ~50 km at the edge, any CrIS FOVs can meet the distance criterion. We do not limit the nadir FOVs because the CrIS scan-angle-dependent bias is small enough to be negligible compared to the bias characteristics from the cross-track microwave observations [38]. In addition, only good RO profiles (attribute flags ‘bad’ = 0) and CrIS SDR data (QF4_CRISSDR = 0), which pass the data quality control, are used in the collocation. We have applied the matching criteria for two years, from 1 October 2019 to 30 September 2021.
To prepare for the CRTM simulation, collocated time and position data between the CrIS orbital location and the COSMIC-2 RO profiles’ perigee location (i.e., occultation point) are first collected over oceans. These collocation data between CrIS and COSMIC-2 collect S-NPP/NOAA-20 CrIS, COSMIC-2, and ECMWF 6 h forecast data for the simulation and comparison. The surface, atmospheric conditions, and satellite geometry information at the observation location are provided to the CRTM as input to simulate the TOA radiances observed by satellite instruments. The surface conditions from ECMWF forecast data are spatially and temporally interpolated to the collocated CrIS locations. Each CRTM simulation outputs BT data for the corresponding CrIS channels. The simulated BT data from CRTM over collocations are further compared with the CrIS measurements to analyze COSMIC-2 vs. CrIS bias and uncertainty. Figure 3 summarizes the procedure to simulate CrIS radiances using the CrIS SDR and COSMIC-2 RO matchup dataset and inter-comparison between observation and simulation.
This study uses the CRTM (V2.1.3) to perform the forward model simulation for CrIS radiances. The CRTM is a fast radiative transfer model [40,41,42], widely used in instrument calibration and validation; satellite data assimilation; and satellite remote sensing of atmospheric temperature, water vapor, surface temperature, and emissivity. To accurately simulate the hyperspectral infrared sounders such as CrIS, IASI, and AIRS radiances, the CRTM supports up to six gas variables (H2O, O3, CO2, N2O, CO, CH4). However, RO observations do not provide information about these gases except for the H2O profile. Therefore, default reference profiles of the corresponding gases were used in the simulation except for the O3 profile, which was taken from the 1976 U.S. standard model atmosphere profile. This significantly reduced the simulation accuracy for the channels with strong absorption from these gases. Figure 4 shows the mean (black line) and standard deviation (red line) of the brightness temperature difference between NOAA-20 CrIS observations and their simulations generated from the COSMIC-2 RO data for clear channels over oceans during June of 2021. The number of clear observations for each channel is also shown (blue line). There are 6041 COSMIC-2 RO profiles matched with NOAA-20 CrIS observations. It shows that all channels in the strong CO2 absorption at 15 µm and 4.3 µm regions are clear channels and not impacted by clouds since the cloud-sensitive heights are well above the realistic cloud top. For semi-transparent and transparent channels, the number of clear observation cases is dramatically reduced and can be as small as 1300. The BT differences from O3, CH4, CO, and N2O absorption channels are significantly larger than those from other channels, where O3 channels from 1110 cm−1 to 1043 cm−1 region show the largest BT difference and standard deviation. This is understandable since the input O3 profile is from the 1976 U.S. standard model atmosphere, and it cannot represent the current realistic O3 amount in the atmosphere.
Considering the limitations of RO observations only providing the temperature and water vapor profiles and their penetration depth not reaching the surface, it is quite challenging to validate the observations from all the CrIS channels. However, RO observations have advantages over other data sources: very high stability and precision for the temperature profile over the 10–35 km altitude layer. To reduce the uncertainty from the model simulation, and based on the information content and cloudy impacts from the CrIS observations and the limitation from the RO observations, we mainly focus on the temperature sounding channels and water vapor channels with weighting functions peaking relatively high. Specifically, these channels are LWIR CO2 temperature sounding channels (1 to 81) in the 650–700 cm−1 region (with cloud sensitive height above 7 km), MWIR water vapor channels (1155 to 1578) in the 1485.625–1750 cm−1 region (with cloud sensitivity height above ~5 km), and SWIR CO2 temperature sounding channels (1800 to 1931) in the 2293.125–2375.0 cm−1 region (with cloud sensitive height above 11 km). The selected channels in these three CrIS bands are indicated by the vertical dashed lines in Figure 4. The mean BT differences from the majority of the CO2 temperature sounding channels are less than 0.5 K, and standard deviations are around 0.5 K in the LWIR CO2 band and less than 1.4 K in all channels in the SWIR band. For water vapor channels, the BT differences have a large channel-to-channel variation but are less than 1.5 K with a standard deviation of 1.0 K to 2.7 K. The weighting functions from all these selected channels are shown in Figure 5, separated by three CrIS bands. The channel weighting function was ranked by the peak height and indicated by the different colors: black for the highest and red for the lowest. Note that there are four channels having very high weighting function peak height: channels 29 (667.5 cm−1), 30 (668.125 cm−1), 31 (668.75 cm−1), and 32 (669.375 cm−1). The larger negative BT differences and standard deviations from these four channels result from the significant energy contribution coming from above 60 km, where RO data do not provide information. The weighting function from these four channels extends well above 60 km, as shown in Figure 5. In the CRTM simulation, the default climatological profile fills the gap up to the top pressure, set to 0.005 hPa in the CRTM model. The larger BT difference indicates that the default climatological profile cannot accurately provide the atmospheric temperature above 60 km.

4. Results

4.1. Bias and Stability between CrIS Measurements and Simulated BT from COSMIC-2 Retrievals

In this section, the CRTM-simulated BT data using COSMIC-2 wet temperature and specific humidity profiles from UCAR WETPf2 data products as inputs have been analyzed and referred to BTC2. Since a total of 637 channels are included in this study, we only selected 17 channels to show a detailed comparison. These channels are selected based on the WFPH at typical pressure levels. The detailed information about these 17 channels is summarized in Table 1. They include seven LWIR temperature sounding channels with index numbers 32, 33, 45, 55, 65, 75, and 79, corresponding to WFPH at about 20, 30, 50, 70, 100, 150, and 200 hPa; five MWIR water vapor channels with index numbers 1423, 1459, 1266, 1531, and 1336, corresponding to WFPH at about 200, 250, 300, 400, and 500 hPa; and five SWIR temperature channels with index numbers 1923, 1835, 1827, 1812, and 1801, corresponding to the WFPH at about 20, 30, 50, 70, and 100 hPa. The weighting functions from these 17 channels are shown in Figure 6.
Figure 7 shows the brightness temperature difference between CrIS observations and simulations with COSMIC-2 RO data for the selected seven CrIS channels in the LWIR band during the two years from 1 October 2019 to 30 September 2021. The seven panels are arranged from top to bottom based on the WFPH. In each panel, the daily mean BT differences between S-NPP observation and simulation ( Δ B T N P P ( O R O ) ,   black line) and between NOAA-20 observation and simulation ( Δ B T N 20 ( O R O ) , cyan line) are plotted. The inter-satellite differences between NOAA-20 and S-NPP are also included ( Δ B T N 20 ( O R O ) Δ B T N P P ( O R O ) , yellow line). The corresponding 5-day smoothing averages are also plotted to smooth out the day-to-day variation. The double BT difference between NOAA-20 and S-NPP for each channel is highly correlated. It results in a near-constant inter-satellite difference during the two-year study period. This indicates that (1) the CrIS observations from S-NPP and NOAA-20 are stable and closely follow each other and that (2) the results are independent of the matchup RO dataset. Considering that S-NPP and NOAA-20 are about 52 min apart, the matchup time is less than 30 min, and the distance is less than 50 km, it is very rare for the same RO profile to match both S-NPP and NOAA-20 CrIS observations. The inter-satellite mean BT differences during the two-year period are 0.05 K (channel 32), 0.08 K (channel 33), 0.10 K (channel 45), 0.11 K (channel 55), 0.12 K (channel 65), 0.11 K (channel 75), and 0.11 K (channel 79).
Our finding of positive BT differences between NOAA-20 and S-NPP for these CrIS upper CO2 channels is consistent with a previous study [15]. The positive differences could possibly be attributed to the nonlinearity effects in the LWIR band. Note that there is a data gap in S-NPP CrIS band 1 from 21 May 2021 to 12 July 2021 due to the Side-2 electronics failure. A switch to the Side-1 electronics occurred on 12 July 2021, resulting in the loss of the MWIR band. UCAR implemented an update in the WETPf2 1D-Var algorithm around 23 March 2021 and used ECMWF 6 h forecasts as a priori on 28 September 2021, which caused a small jump in the BT difference time series for some channels. The 23 March 2021 update mainly impacted the lower temperature and water vapor channels, whereas the September update greatly impacted the upper temperature sounding channels. For the upper temperature sounding channels with WFPH higher than 70 hPa (~19 km), the day-to-day mean BT difference variations are larger than those with lower WFPH, especially during the COSMIC-2 early mission period. This would be due to three possible reasons: (1) although COSMIC-2 WETPf2 data products provide up to 60 km temperature profiles, the uncertainty from the upper levels is larger; (2) due to the height limitation from the WETPf2 temperature profile, partial temperature information observed by these CrIS channels are missing; and (3) the WETPf2 data quality at the early stage of the mission was gradually improved. For these lower WFPH channels, such as 65, 75, and 79, the day-to-day variation is small and stable for S-NPP and NOAA-20.
Among these seven channels, the upper two channels (32 and 33) and the bottom two channels (75 and 79) show a negative difference (can be large as −0.5 K), which means that observed radiances are less than radiances simulated using COSMIC-2 data. However, the reasons contributing to the negative difference are different. For channels 32 and 33, the negative difference is mainly due to the lack of an accurate temperature profile at the top of the atmosphere. In contrast, for channels 75 and 79, it is due to the default CO2 amount used in the CRTM simulation. The default CO2 amount is about 384 parts per million volume (ppmv) in CRTM.
In comparison, the average CO2 amount in 2021 is around 420 ppmv (https://research.noaa.gov/article/ArtMID/587/ArticleID/2764/Coronavirus-response-barely-slows-rising-carbon-dioxide, accessed on 3 June 2022). From the sensitivity results shown in Figure 1, increasing the CO2 concentration by 10% will reduce the brightness temperature in the simulation for channels 75 and 79 by about 0.3 K if assuming the impact from the CO2 concentration increasing in the atmosphere is linear. For channels 45, 55, and 65, increasing the CO2 concentration by 10% will increase the simulated brightness temperature by about 0.4 K, 0.4 K, and 0.2 K, respectively. After adjusting the brightness temperature impact from the CO2 amount increasing in the atmosphere, the expected BT differences between observations and simulations will be much closer to zero (±0.2 K). There are two notable jumps in the BT difference for both S-NPP and NOAA-20: (1) on 23 March 2021, an update was implemented in the UCAR 1DVAR algorithm, and (2) a significant jump in the BT difference for these upper temperature sounding channels after 28 September 2021 UCAR 1DVAR using ECMWF forecasts as the a priori. Before the first update, a negative trend can be observed from the BT differences for channels 65, 75, and 79, which could be caused by the CRTM simulation using a fixed CO2 concentration. This feature can potentially detect the atmosphere CO2 amount change by combining RO temperature profiles with observations from the hyperspectral IR sensors. The effort would connect the highly accurate RO temperatures in the upper troposphere and lower stratosphere and well-calibrated CrIS SDR data through CRTM simulation. By fixing the CO2 amount in the CRTM simulation, the long-term brightness temperature drifts from observation and simulation can be used to detect the atmospheric CO2 concentration change. To detect the small temperature drift caused by the changes in CO2 amount in the atmosphere, the RO sounding profiles and CrIS SDR data must be highly stable. The CRTM forward model uncertainty also needs to be well understood. This requires reprocessed RO temperature profiles and reprocessed CrIS SDR data. Inter-calibration of the hyperspectral IR sensors’ upper-temperature channels and detecting the atmosphere CO2 amount change using RO data will provide an independent assessment for IR sensors and provide long-term monitoring for CO2 amount change in the atmosphere.
Figure 8 shows the time series results for five selected channels in the MWIR band. These water vapor channels mainly sense the lower stratosphere and middle troposphere, with WFPH ranging from 500 hPa to 200 hPa. Due to the water vapor retrieval accuracy issue, we did not select water vapor channels that sense the atmosphere from 2 km to the surface. For S-NPP, there is a data gap between 21 May 2021 and 30 September 2021. This data gap is caused by the Side-2 electronics failure with loss of LWIR band (used for cloud detection) on 21 May 2021 and a switch to the Side-1 electronics (with loss of MWIR band) on 12 July 2021. Because the cloud detection algorithm mainly relies on the LWIR channel departures between observation and simulation, without information from the LWIR band, the statistics from these water vapor channels are not accurate. The BT differences between CrIS observations and simulations using COSMIC-2 WETPf2 profiles from these five channels are reasonably small, and the 5-day averaged means are well within −0.5 K to 0.5 K. There is a notable jump on 25 September 2020 in the BT difference time series, which is caused by an update in the WETPf2 1DVAR algorithm. Compared to the results in Figure 7, the day-to-day mean BT difference variations significantly increase. The larger daily variation could be due to the atmospheric water vapor inhomogeneity in its vertical and horizontal distribution and too few daily samplings to smooth out the sampling noise. One such period is November 2019. The BT differences from S-NPP observation and simulation show the largest negative bias and largest variation due to the small samples on some days. The averaged inter-satellite differences during the two years for these five channels are given in Figure 8: 0.13 K for channel 1423, 0.03 K for channel 1459, 0.02 K for channel 1266, 0.01 K for channel 1531, and 0.01 K for channel 1336. Except for high WFPH channel 1423, the inter-satellite differences between NOAA-20 and S-NPP from the other four channels are very close to zero and relatively stable without any drifting trends, which indicates that both CrIS observations from S-NPP and NOAA-20 are stable and consistent.
Figure 9 shows the time series results for five selected channels in the CrIS SWIR band for S-NPP and NOAA-20. These temperature sounding channels mainly sensed the upper troposphere and stratosphere with WFPH ranging from 100 hPa to 20 hPa, and they are plotted from bottom to top according to their WFPH. BT differences between observations and simulation from S-NPP and NOAA-20 are very close and follow each other well. The overall channel BT difference increases when the channel’s WFPH is higher and has a strong annual cycle pattern with peaks around the end of January and around the end of June. From Table 1, the five SWIR channels have very similar WFPH related to these from five LWIR channels at around 20, 30, 50, 70, and 100 hPa. However, we do not see an obvious annual cycle pattern in the BT difference for these five LWIR channels from Figure 7 (upper five panels). This strong annual cycle BT difference could come from the forward model simulation of the nonlocal thermodynamic equilibrium (NLTE) effects.
Previous studies indicated that the CRTM simulation has a model bias of about −1.5 K related to the NLTE effects in the shortwave CO2 strong absorption band during daytime [42,47]. Although the CRTM already considered the NLTE effect at daytime for these SWIR CO2 sounding channels, it is still very challenging to use these SWIR channels in satellite data assimilation due to the time-dependent bias. We separated the five SWIR channels results into daytime and nighttime, as shown in Figure 10 and Figure 11. Compared to results from Figure 9 for the corresponding channel, the BT difference increases with stronger annual cycle patterns in the daytime.
The BT difference is much closer to zero at nighttime, and no annual cycle pattern is shown. Due to lower observed BT temperatures and increased instrument noise at night, the day-to-day BT difference variation became larger than that from daytime, especially in the first few months of the COSMIC-2 mission. The CRTM simulations in the five selected SWIR channels are also subject to the bias related to the fixed CO2 amount in the simulation when using COSMIC-2 RO data products as inputs. After adjusting the ~0.3 K positive bias due to the increasing CO2 amount in the real atmosphere, the BT differences for channels 1801, 1812, and 1827 could be closer to zero. Due to the larger day-to-day variation, it is more difficult to derive the CO2 trend using SWIR channels than from the LWIR channels (see Figure 7). The inter-satellite differences between NOAA-20 and S-NPP are also included in Figure 9, Figure 10 and Figure 11. Compared to LWIR channels, except for the highest WFPH channel 1923 (with −0.05 K, compared to the LWIR channel 32 with 0.05 K), the mean double differences are much closer to zero, with −0.06 K for channel 1835, −0.05 K for channel 1827, 0.01 K for channel 1812, and 0.03 K for channel 1801. The inter-satellite differences are slightly dependent on the diurnal cycle, with smaller values in the daytime. The maximum difference between nighttime and daytime is 0.04 K on channel 1812. Other channels are less than 0.03 K.

4.2. BT Monthly Mean Difference for All Selected Channels in CrIS Three Bands

To comprehensively analyze the BT differences between observation and simulation and the inter-satellite difference for all the selected channels in the three CrIS bands to demonstrate the CrIS observation consistency and stability during the two years, the monthly mean BY difference and double difference are shown in Figure 12, Figure 13 and Figure 14 for all data, day, and night, respectively.
Figure 12 shows the monthly mean BT difference between NOAA-20 CrIS observations and simulations with UCAR RO data (left panel) and two CrIS double differences between NOAA-20 and S-NPP using simulations with UCAR RO data as a transfer (right panel) for all the collocated clear radiance data. Note that the data gaps in the LWIR band during June 2021 and the MWIR band after June 2021 are due to S-NPP CrIS electronics failure. S-NPP CrIS operated on the Side-2 electronics after 24 June 2019, when the MWIR band failed on Side 1 [48]. From 21 May to 12 July 2021, the LWIR band failed on Side 2. After July 12, CrIS on S-NPP was switched back to side 1, and there are no MWIR SDR data available. Compared to results from the MWIR and SWIR bands, the time series of the monthly mean BT difference from the channels in the LWIR band is much smoother, with a smaller month-to-month variation. For channels 1 to 66 with wavenumber 650 cm−1 to 690.625 cm−1, the BT differences show positive values (less than 0.8 K), except for channel 21 (662.5 cm−1, with WFPH 26.76 km) and channels 28 to 33 (wavenumber from 666.875 cm−1 to 670.0 cm−1 with WFPHs as 21.39, 41.80, 40.13, 32.27, 27.56, and 23.86 km, respectively) with negative mean values. The most significant negative BT (above −1.5 K) occurred in channel 29, with the highest WFPH over 41.80 km and a significant radiance contribution from above 60 km, where no temperature information is provided in the WETPf2 product. For channels 67 to 81 (wavenumber 691.250 cm−1 to 700.0 cm−1), the BT difference shows negative values and can be as large as −0.6 K. As discussed in the previous section (see Figure 7), the majority of the BT difference can be explained by the use of default CO2 concentrations in the forward simulation. Supposing that we use a more realistic CO2 profile in the simulation, in that case the BT difference can be significantly reduced to within ±0.2 K during this two-year comparison period for those channels with WFPHs from 12 km to 20 km and covering the atmosphere from 7 km to 40 km. The comparison results from those CO2 temperature sounding channels in the LWIR band indicate that the temperature profiles retrieved from the COSMIC-2 observations are very accurate (within ±0.2 K) and can be used as independent and reference data source to evaluate the infrared sensors.
The BT differences from the MWIR water vapor channels (1155 to 1578) in the 1485.625–1750 cm−1 region not only show large channel-to-channel variation (due to the WFPH variation among channels, see Figure 2) but only have large month-to-month variation due to the water vapor small-scale inhomogeneity and heavy dependency on the a priori in 1DVAR retrieval system. There are strong positive BT differences above 1.0 K for water vapor channels from 1305 to 1320 (1579.375 cm−1 to 1588.75 cm−1), which sense the relatively lower levels of the atmosphere (see Figure 2). A clear jump of about 0.2 K for all water vapor channels was observed in October 2020 (due to an update in the UCAR WETPf2 1DVAR algorithm on 25 September 2020).
The right panel in Figure 12 displays the monthly mean CrIS double difference between NOAA-20 and S-NPP. The double differences range from −0.05 K to 0.15 K for these channels in the LWIR. The very small negative double differences only occurred in three channels (channels 29, 30, and 31 with wavenumbers at 667.5 cm−1, 668.125 cm−1, and 668.75 cm−1) with very high WFPHs, and all other channels show small positive double differences. For a given channel, the double difference shows a very small variation as a function of time, indicating that the observations from CrIS on NOAA-20 and S-NPP are stable. The near-constant small double difference from the LWIR CO2 temperature sounding channels in the two CrIS observations is consistent with findings from the previous study [15]. It has very important implications for climate applications. Removing or correcting small differences should be considered during CrIS SDR data reprocessing for climate applications to derive the climate trend by combining these observations from different satellite platforms.
For water vapor channels in the MWIR band, although the overall double differences are in the small range of −0.15 K to 0.25 K, the month-to-month variations are large. Specifically, in November 2019, the double differences are greater than 0.1 K for all the channels, whereas in October and December 2019, the double differences are negative for most of the channels. This pattern changed in January, February, and March 2021. The double differences are mostly negative in February, but the corresponding double differences are positive in the other two months. Given the monthly mean double different results, it is difficult to conclude the consistency and stability between NOAA-20 and S-NPP observations from these water vapor channels. There are two major reasons for this: (1) small sampling size, given that the total numbers of collocated profiles in November are 1978 for NOAA-20 and 1983 for S-NPP compared to over 3000 for other months (except for the S-NPP 1938 case in January 2021) and (2) high vertical and horizontal inhomogeneity of water vapor distribution in the atmosphere.
The monthly mean double differences from these channels in the SWIR band range from −0.2 K to 0.1 K. The most negative mean values (less than −0.1 K) occurred in channels 1927 to 1931 with wavenumber 2372.5 cm−1 to 2375.0 cm−1. For other channels, the double differences are within ±0.1 K. The month-to-month variations from SWIR channels are larger than those from LWIR channels but much smaller than those from MWIR channels.
Figure 13 shows the monthly mean results from the daytime. For LWIR channels, the BT differences between observations and simulations from daytime are very similar to those from all data without notable changes, while the month-to-month variations from the double differences slightly increased. MWIR channels clearly showed that the month-to-month variations from the BT difference and double difference increased due to the daytime water vapor’s high variability. For SWIR channels, the annual cycle pattern from the BT difference is dramatically enhanced compared to that from all data due to the NLTE effects during day time. However, the month-to-month variations from the double difference decreased and became more stable.
Figure 14 shows the monthly mean results from nighttime. For LWIR channels, both the BT and double differences are very similar to those from all data and daytime. For MWIR channels, the month-to-month variations of BT differences are notably reduced compared to those from daytime, while the double differences still have large month-to-month variations. In general, the water vapor profiles in NWP are strongly affected by radiosonde assimilation. Moreover, it is known that the nighttime radiosonde data quality is much better than the daytime [28], which could provide a possible contribution to the better results at nighttime. For SWIR channels, the BT differences for all channels are much closer to zero, with most ranging within ±0.3 K. There is no obvious annual cycle pattern in the BT difference. However, relatively larger values appeared in January. The month-to-month variations from the double differences increased compared to those from all data and daytime partially due to the larger instrument noise relative to the lower scene brightness temperatures during nighttime.

5. Discussion

Currently, there is no absolute reference standard to validate the post-launch hyperspectral infrared CrIS measurements, such as the Climate Absolute Radiance and Refractivity Observatory (CLARREO) for reflective solar band calibration [49]. We have to rely on (1) relative differences by comparing them to observations from other similar instruments and (2) absolute differences by comparing them to simulations from a forward model with inputs that represent the atmospheric and surface conditions. In our study, we mainly used the second method to evaluate the CrIS observation accuracy and stability on both S-NPP and NOAA-20 by comparing the simulations from the CRTM using COSMIC-2 RO data as inputs, but we also indirectly applied the relative comparison (double difference) to evaluate the consistency between NOAA-20 and S-NPP CrIS observations. The bias and uncertainties in the BT difference and double difference for these selected channels associated with the two methods can be due to several factors:
(a)
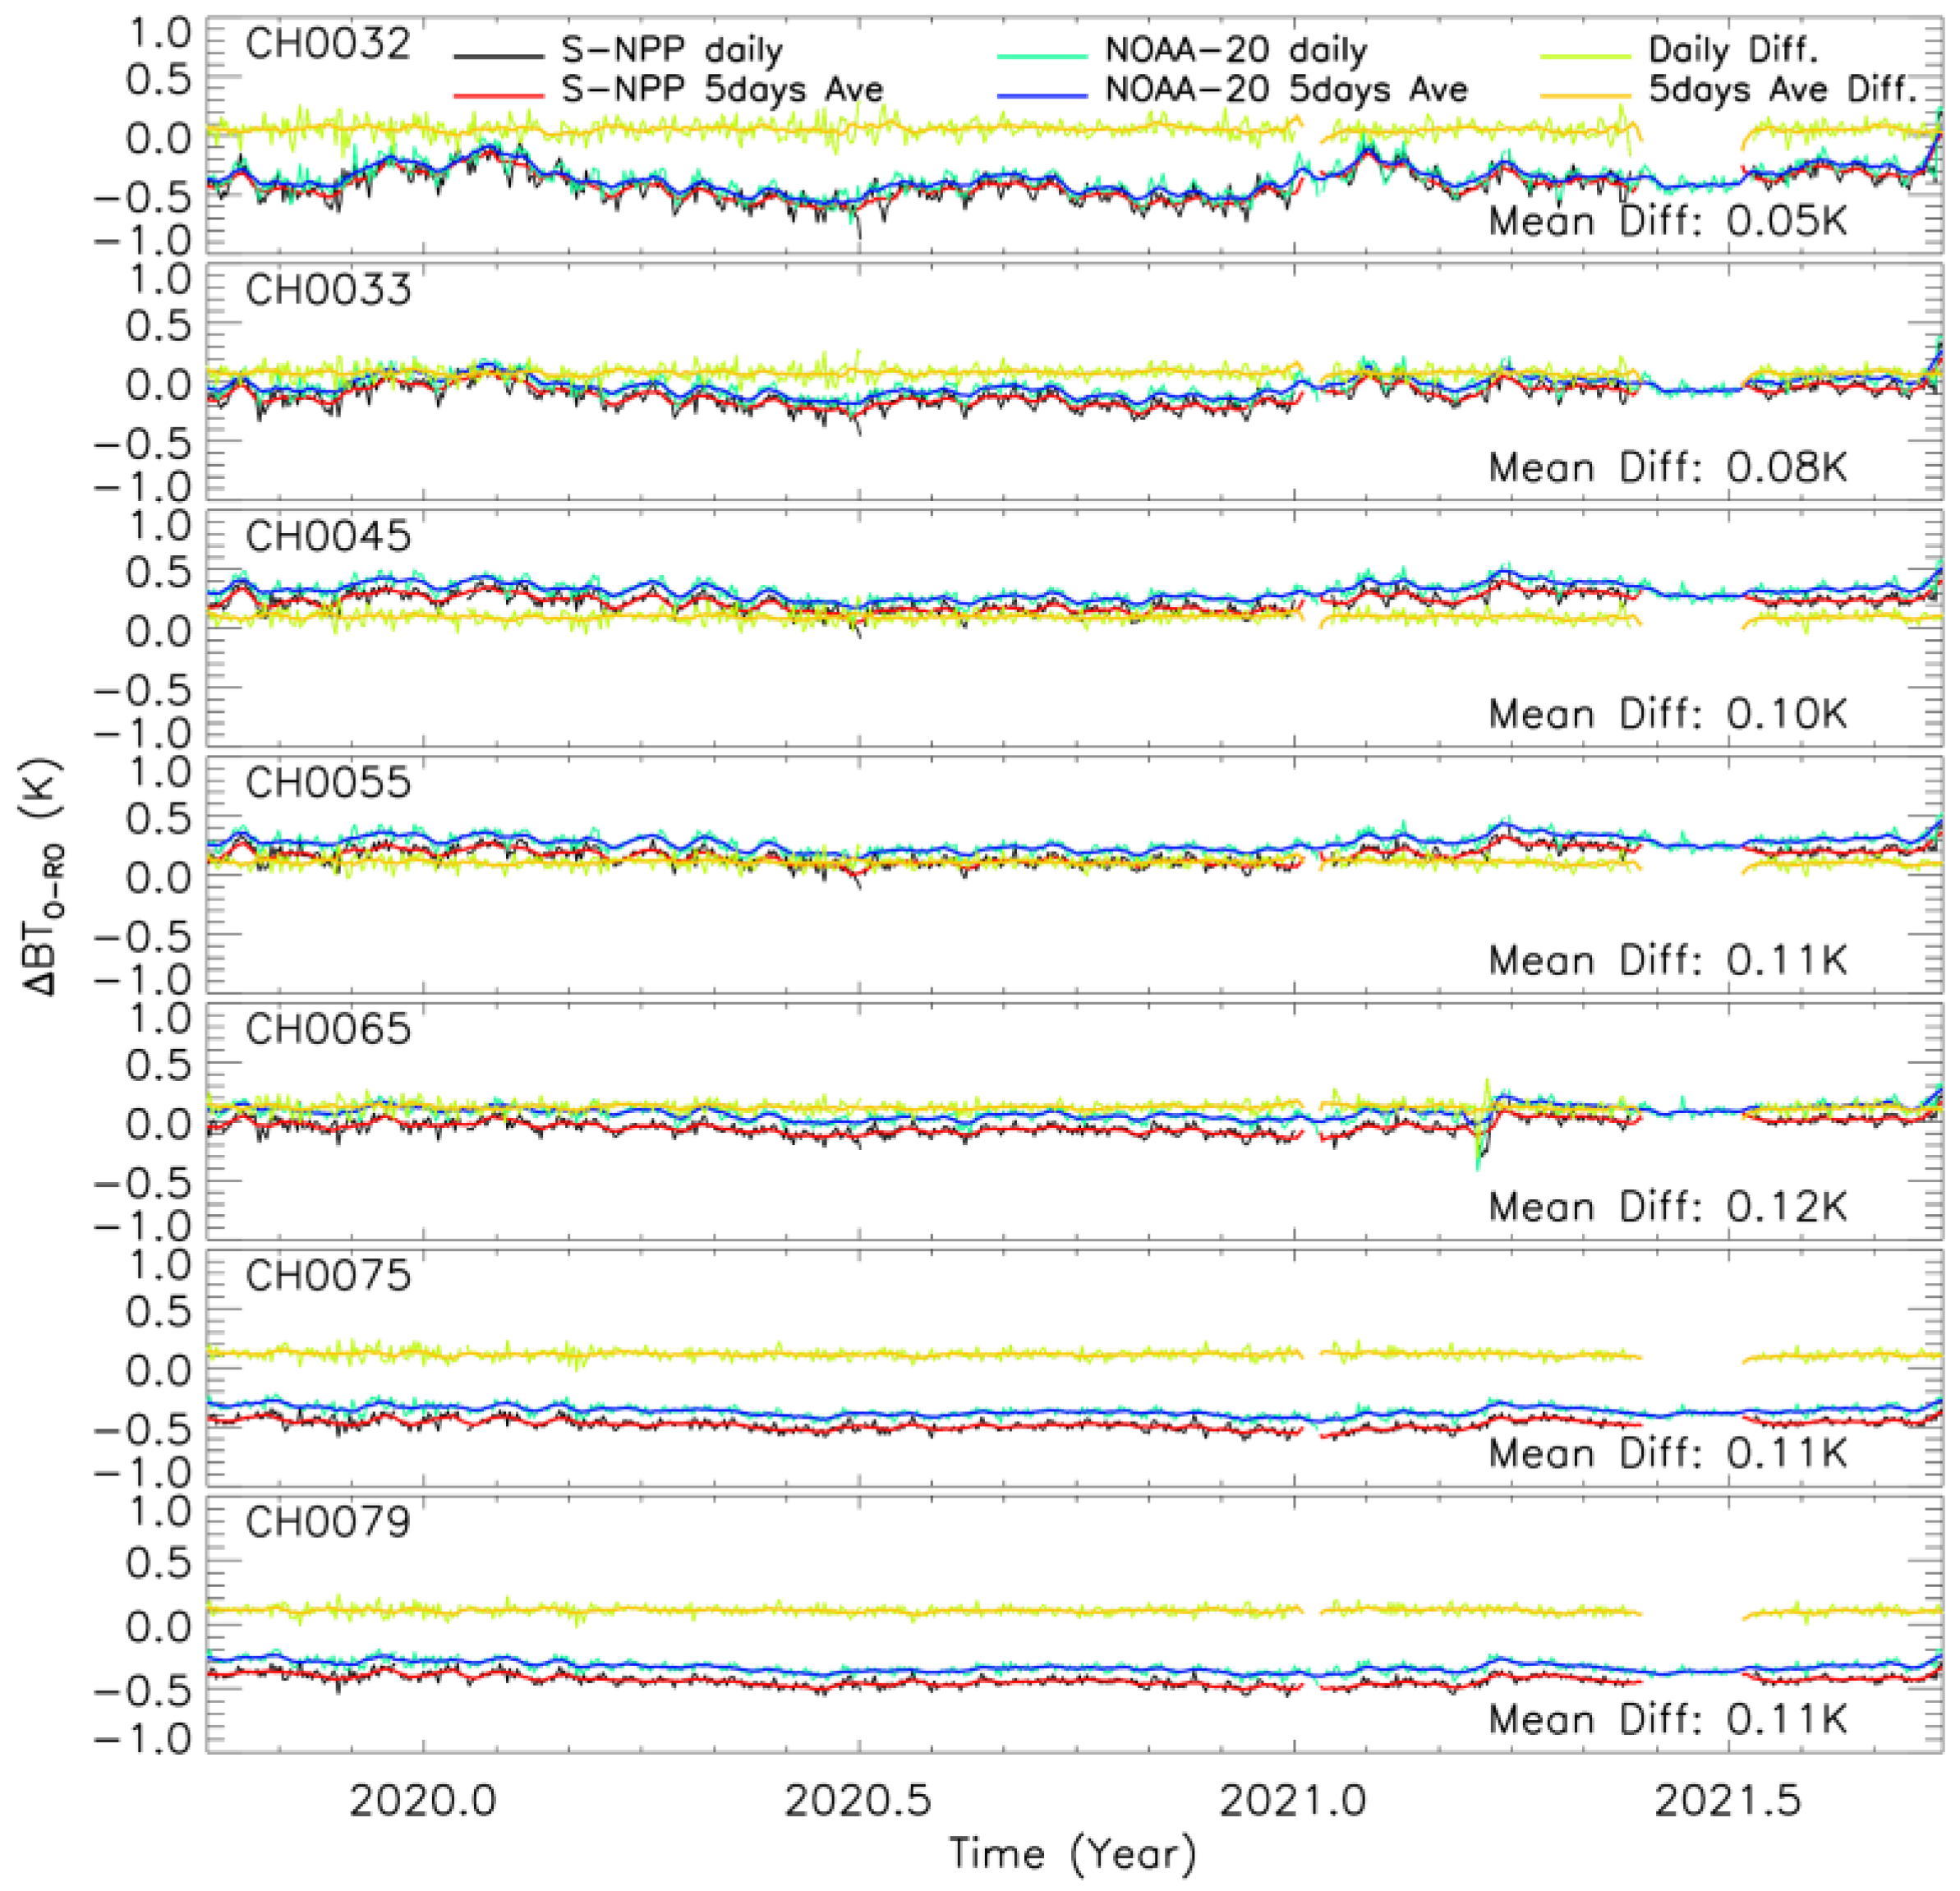
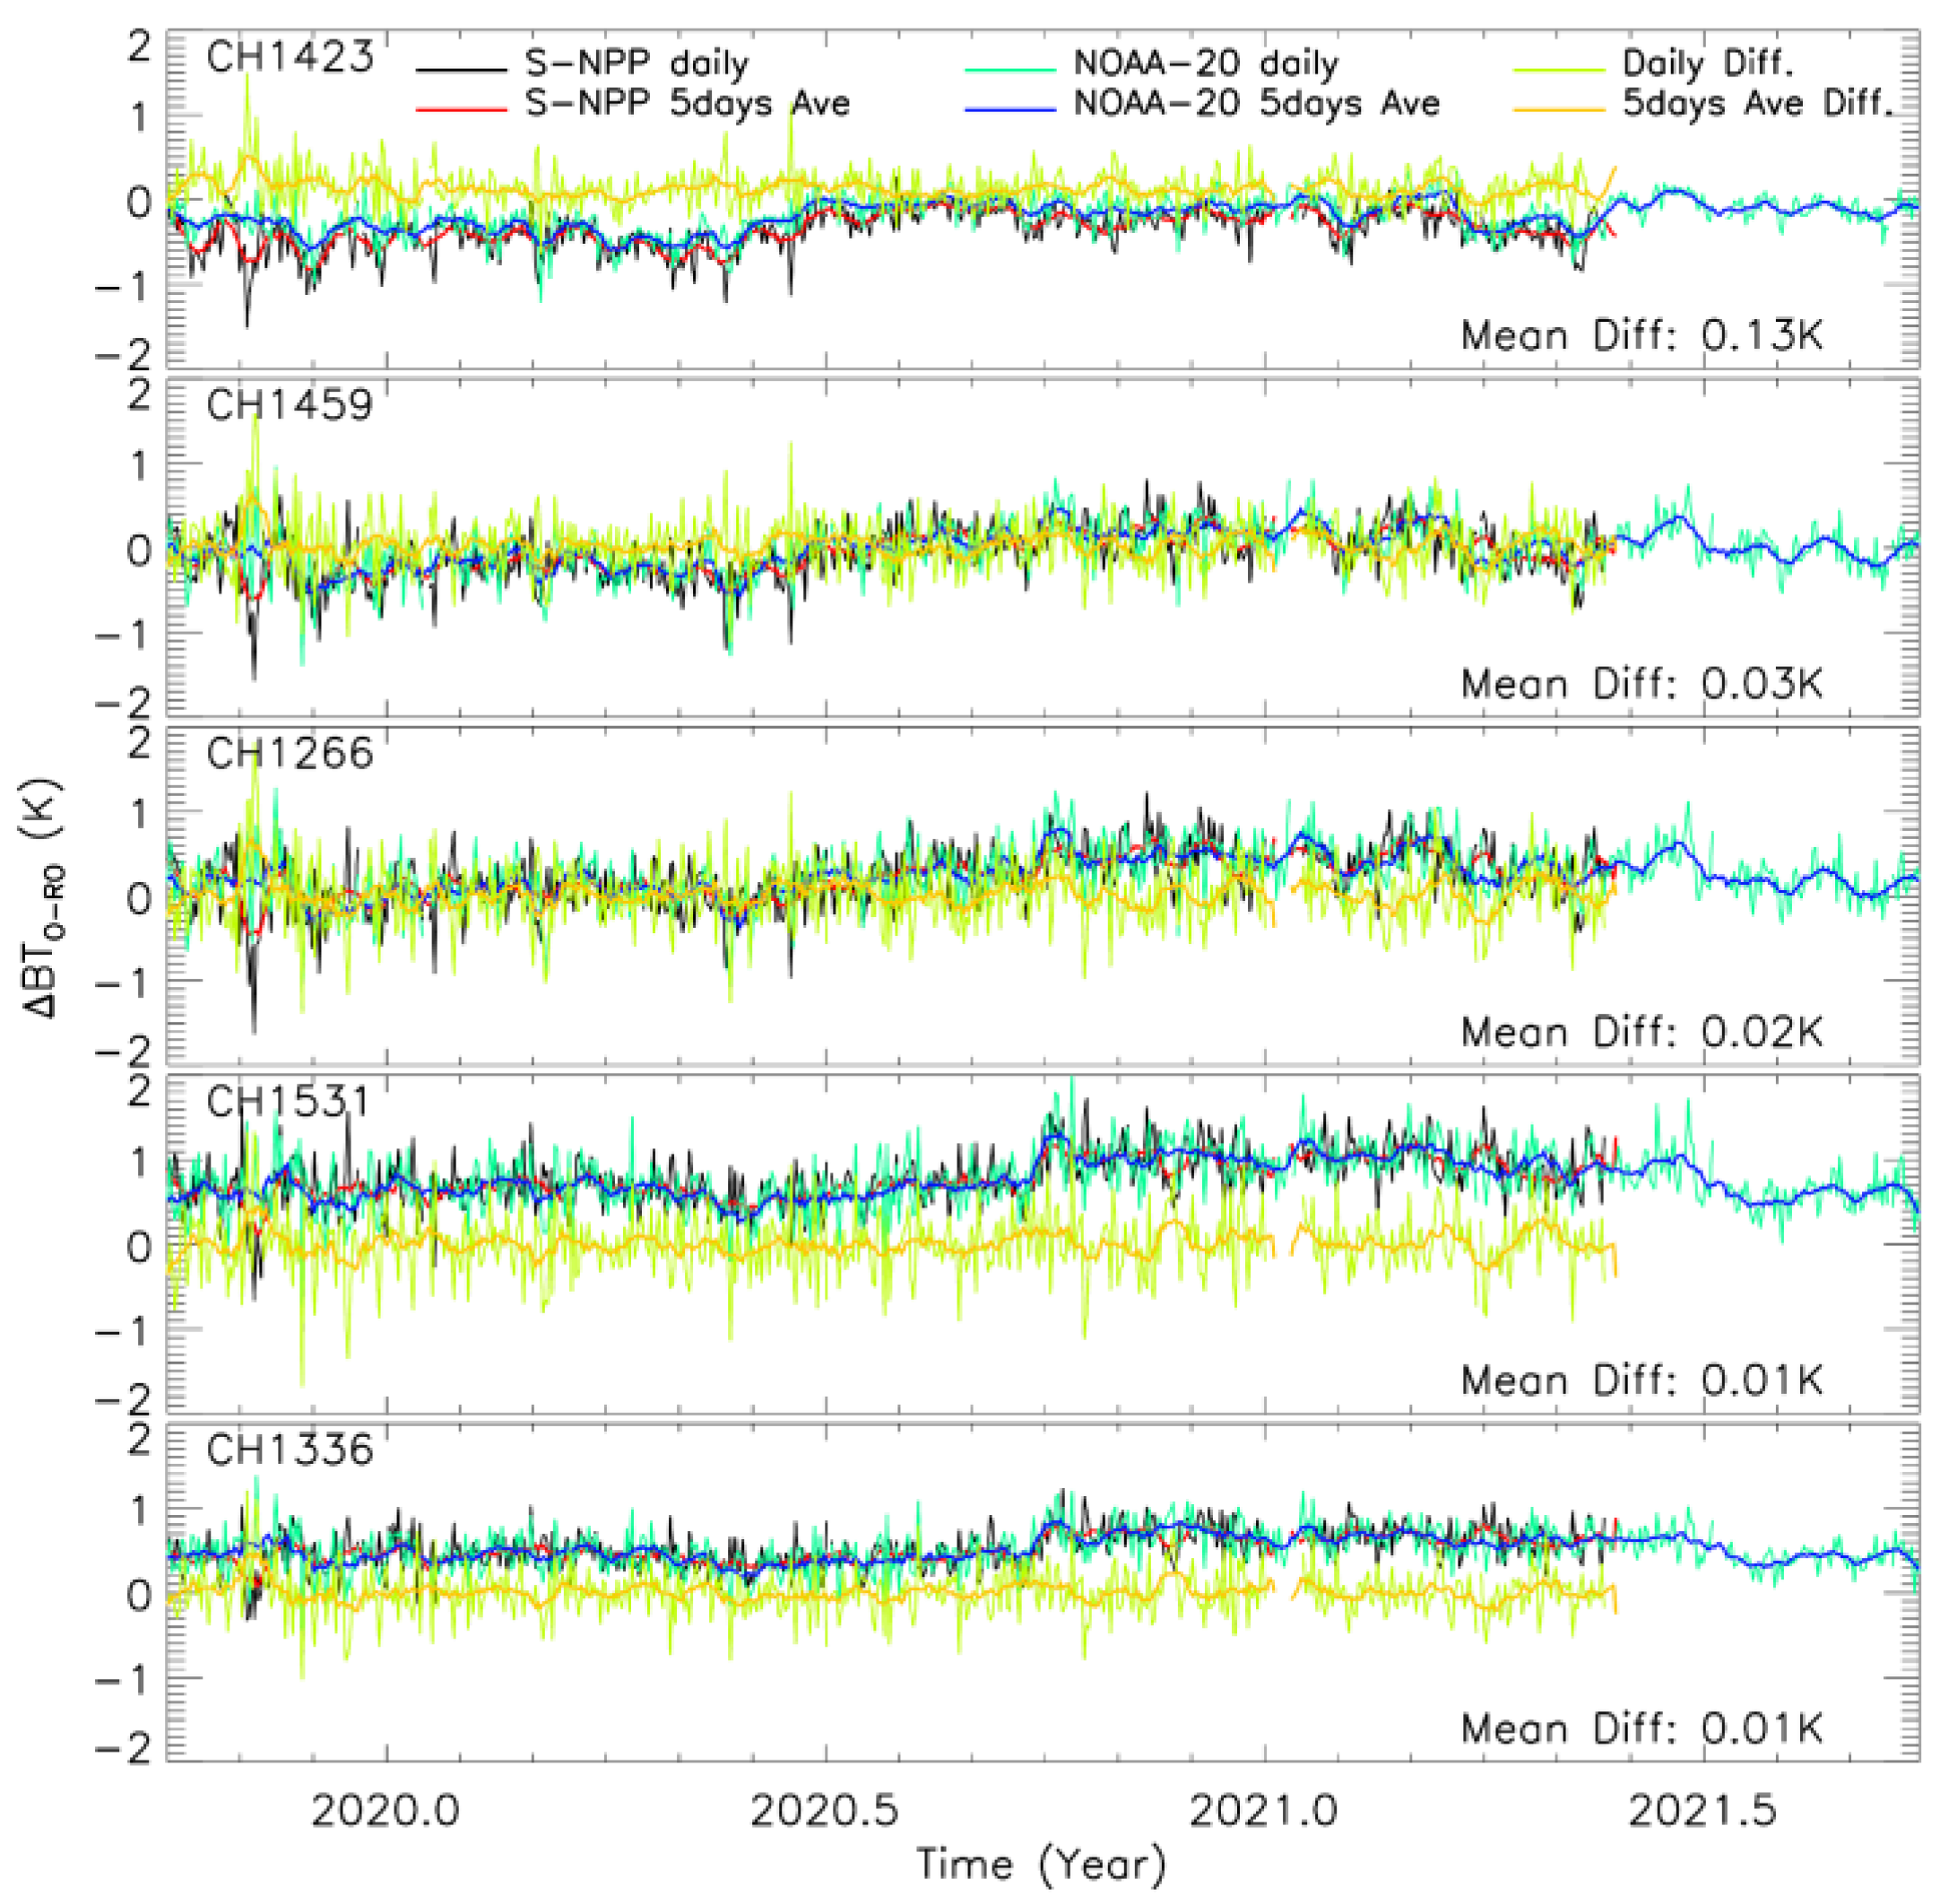
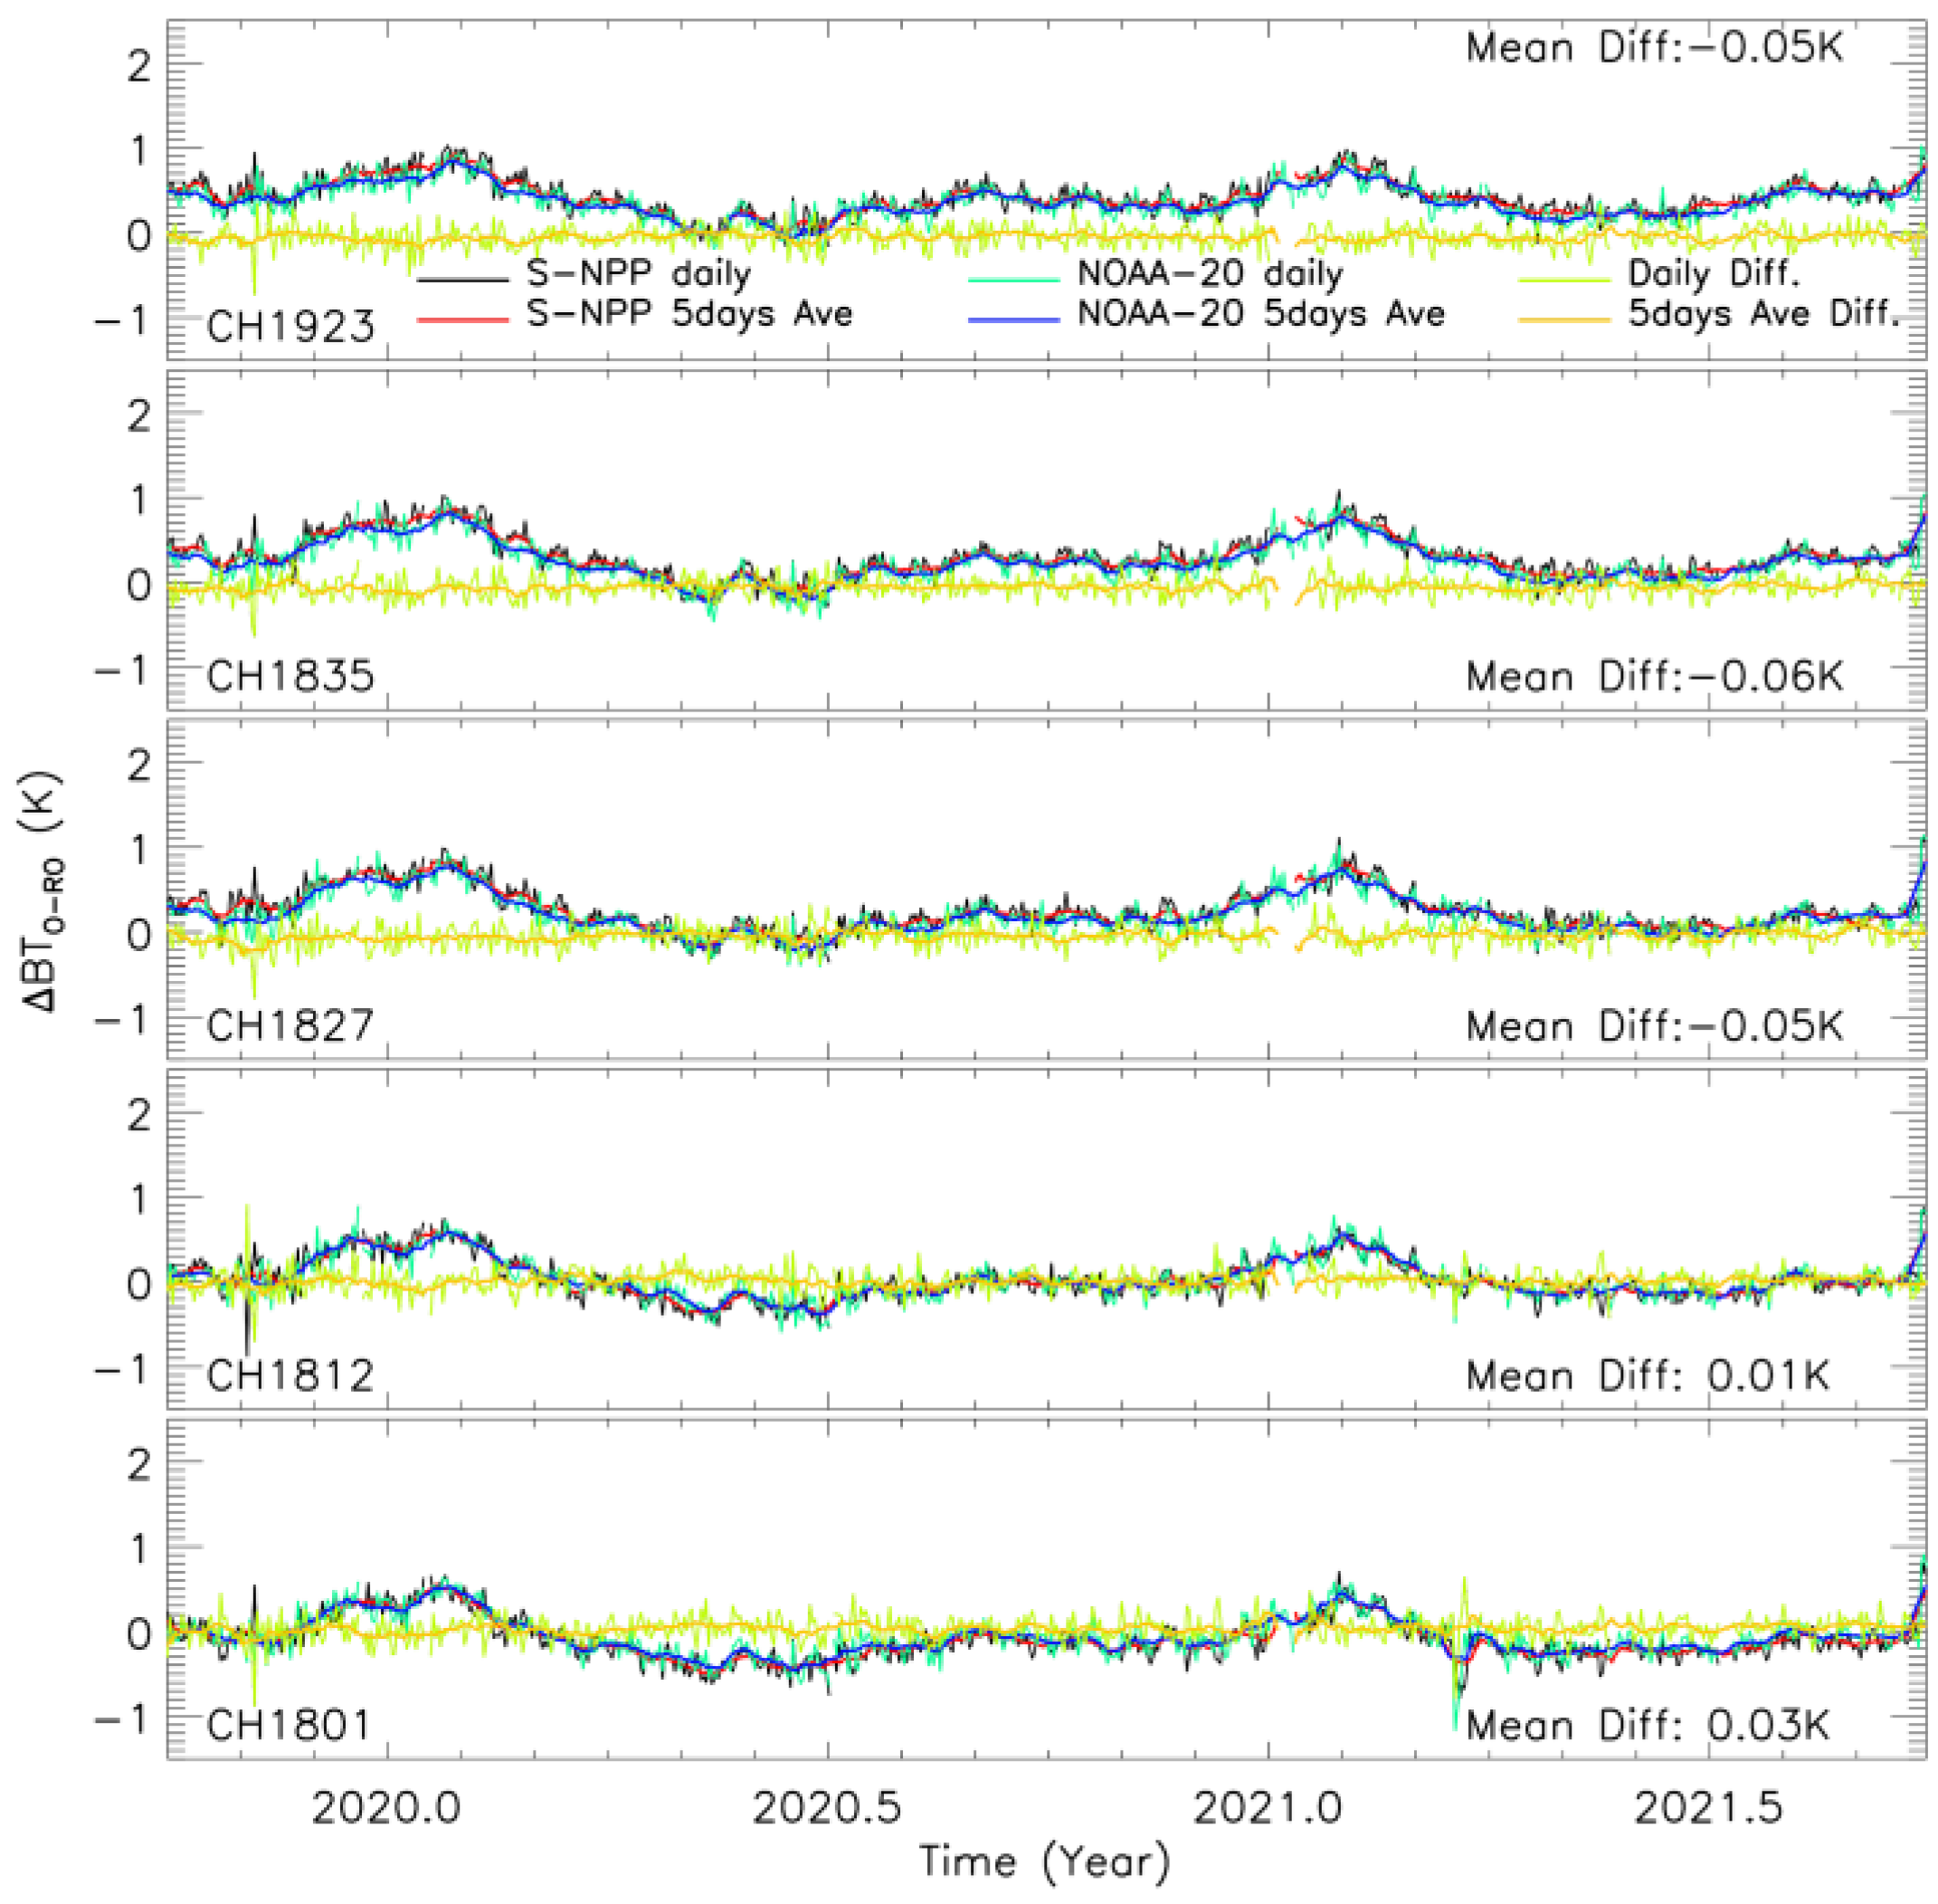
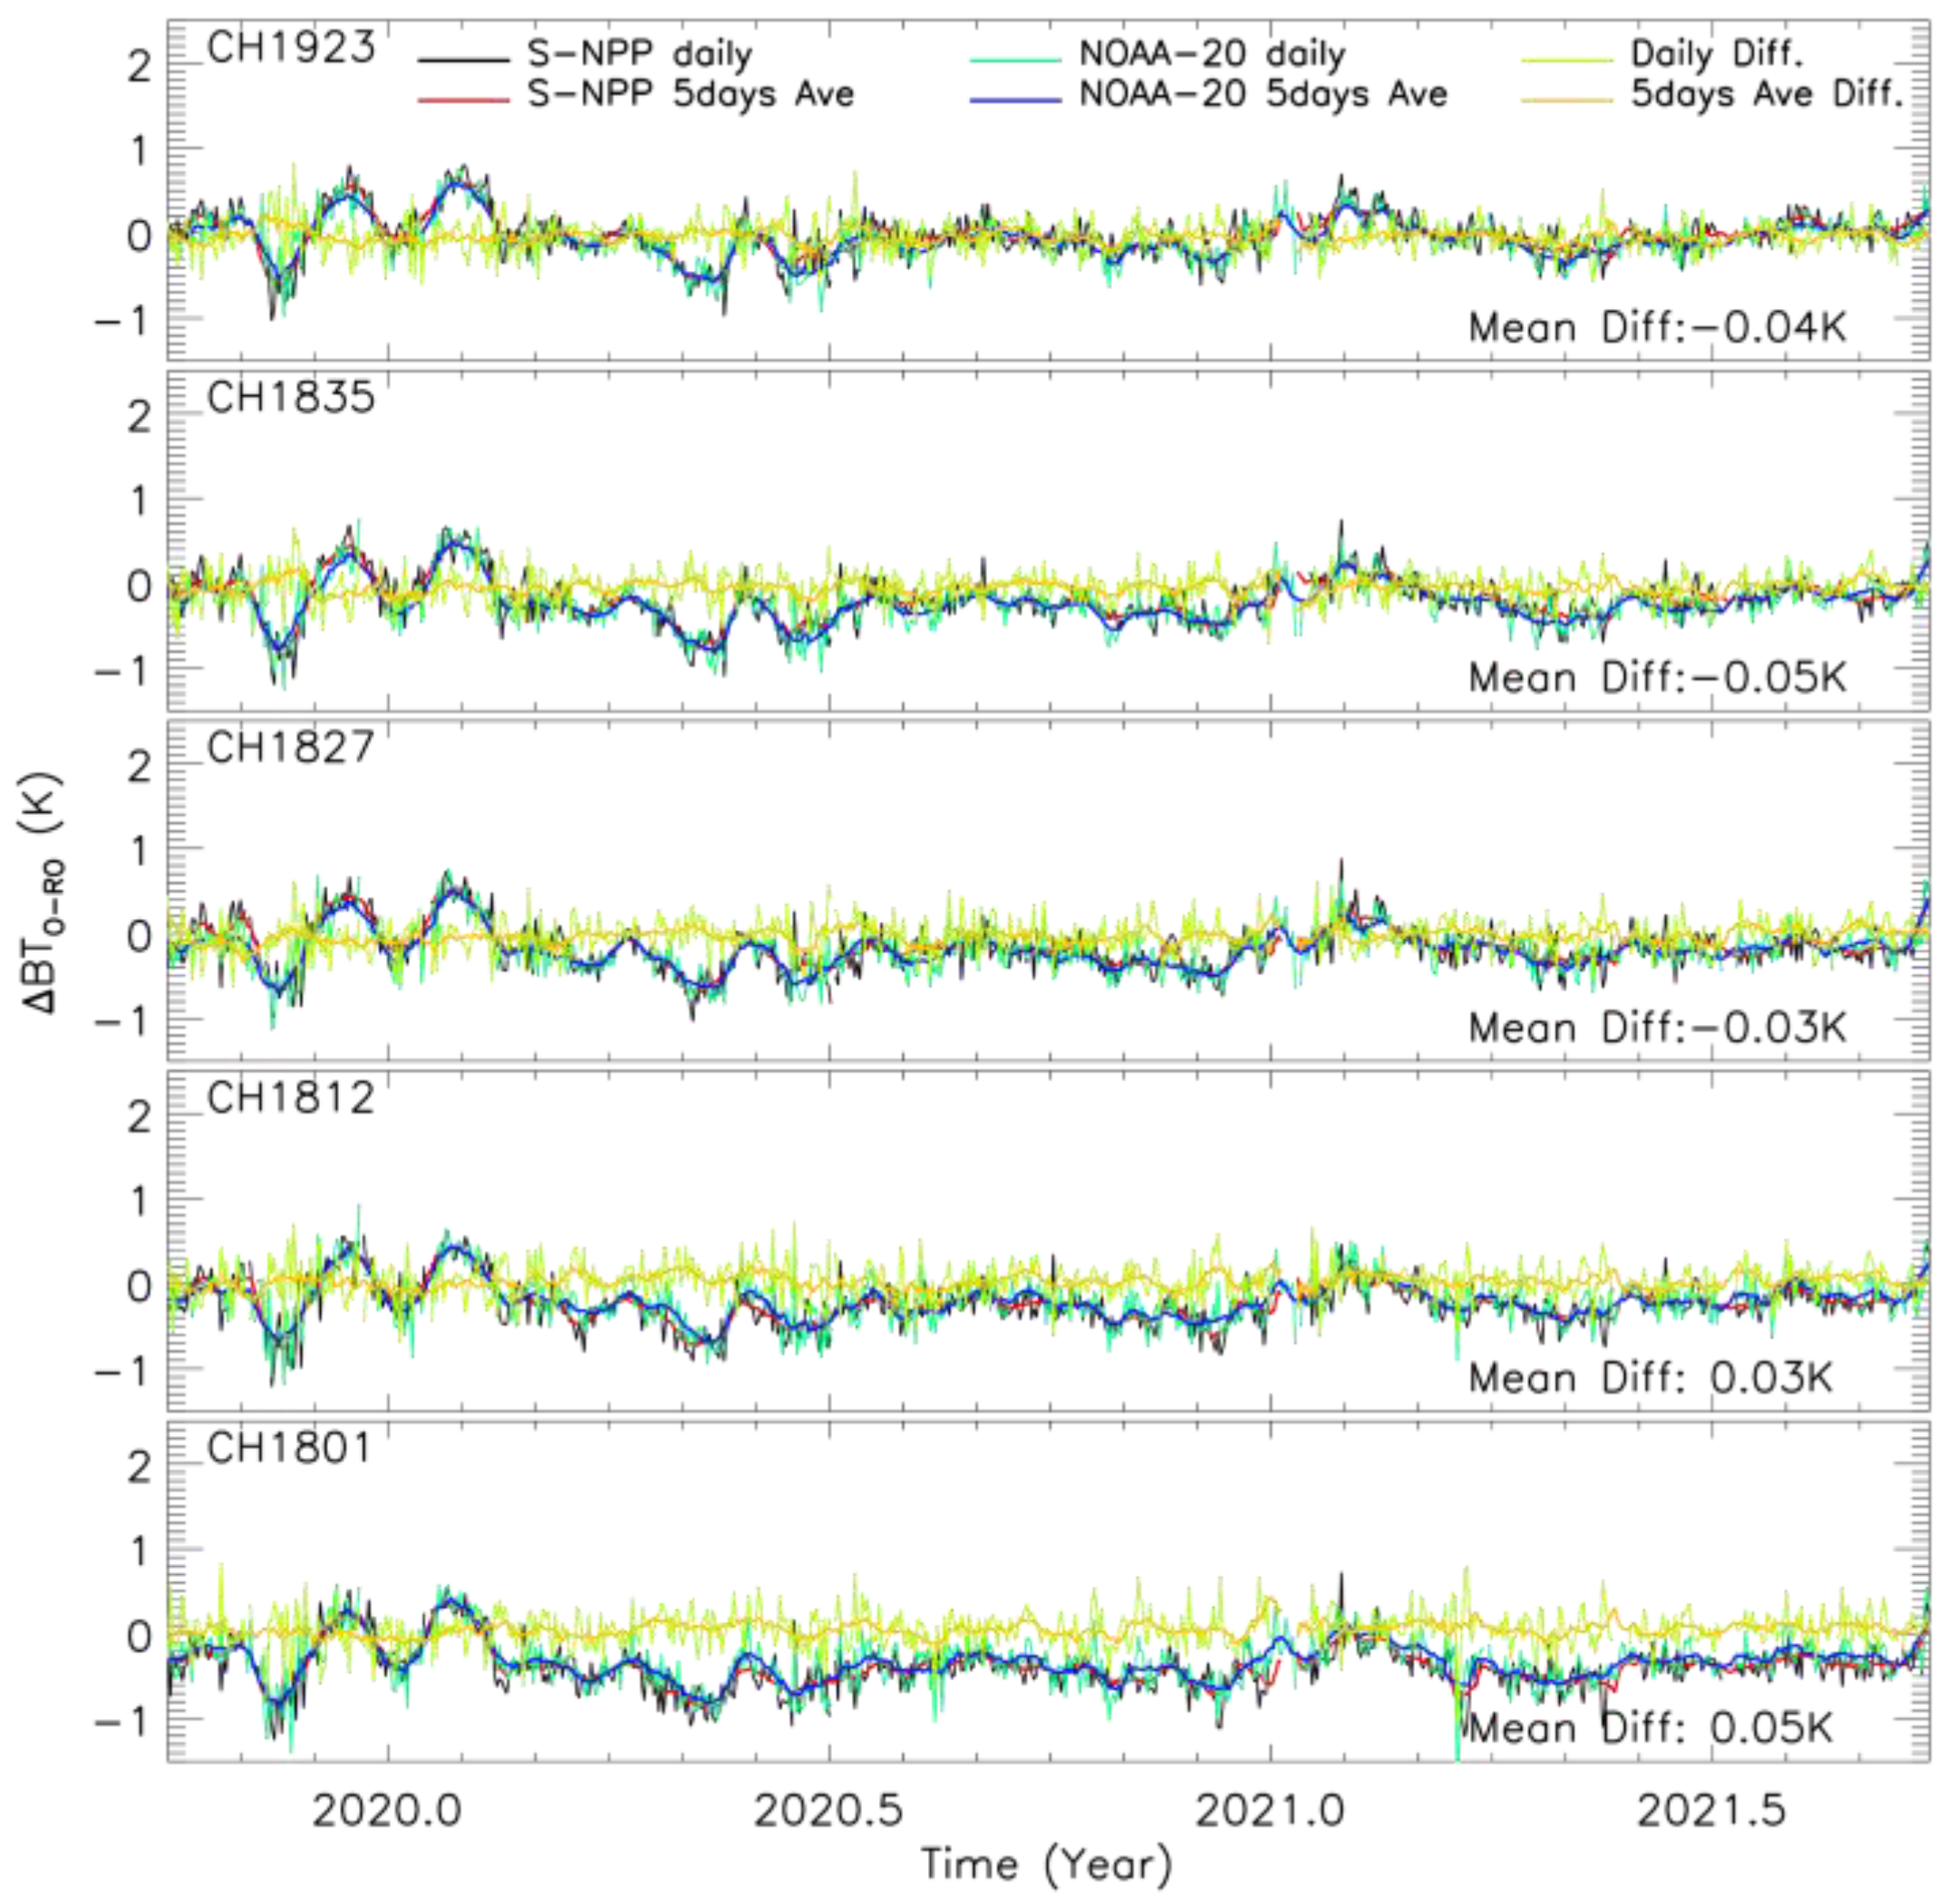
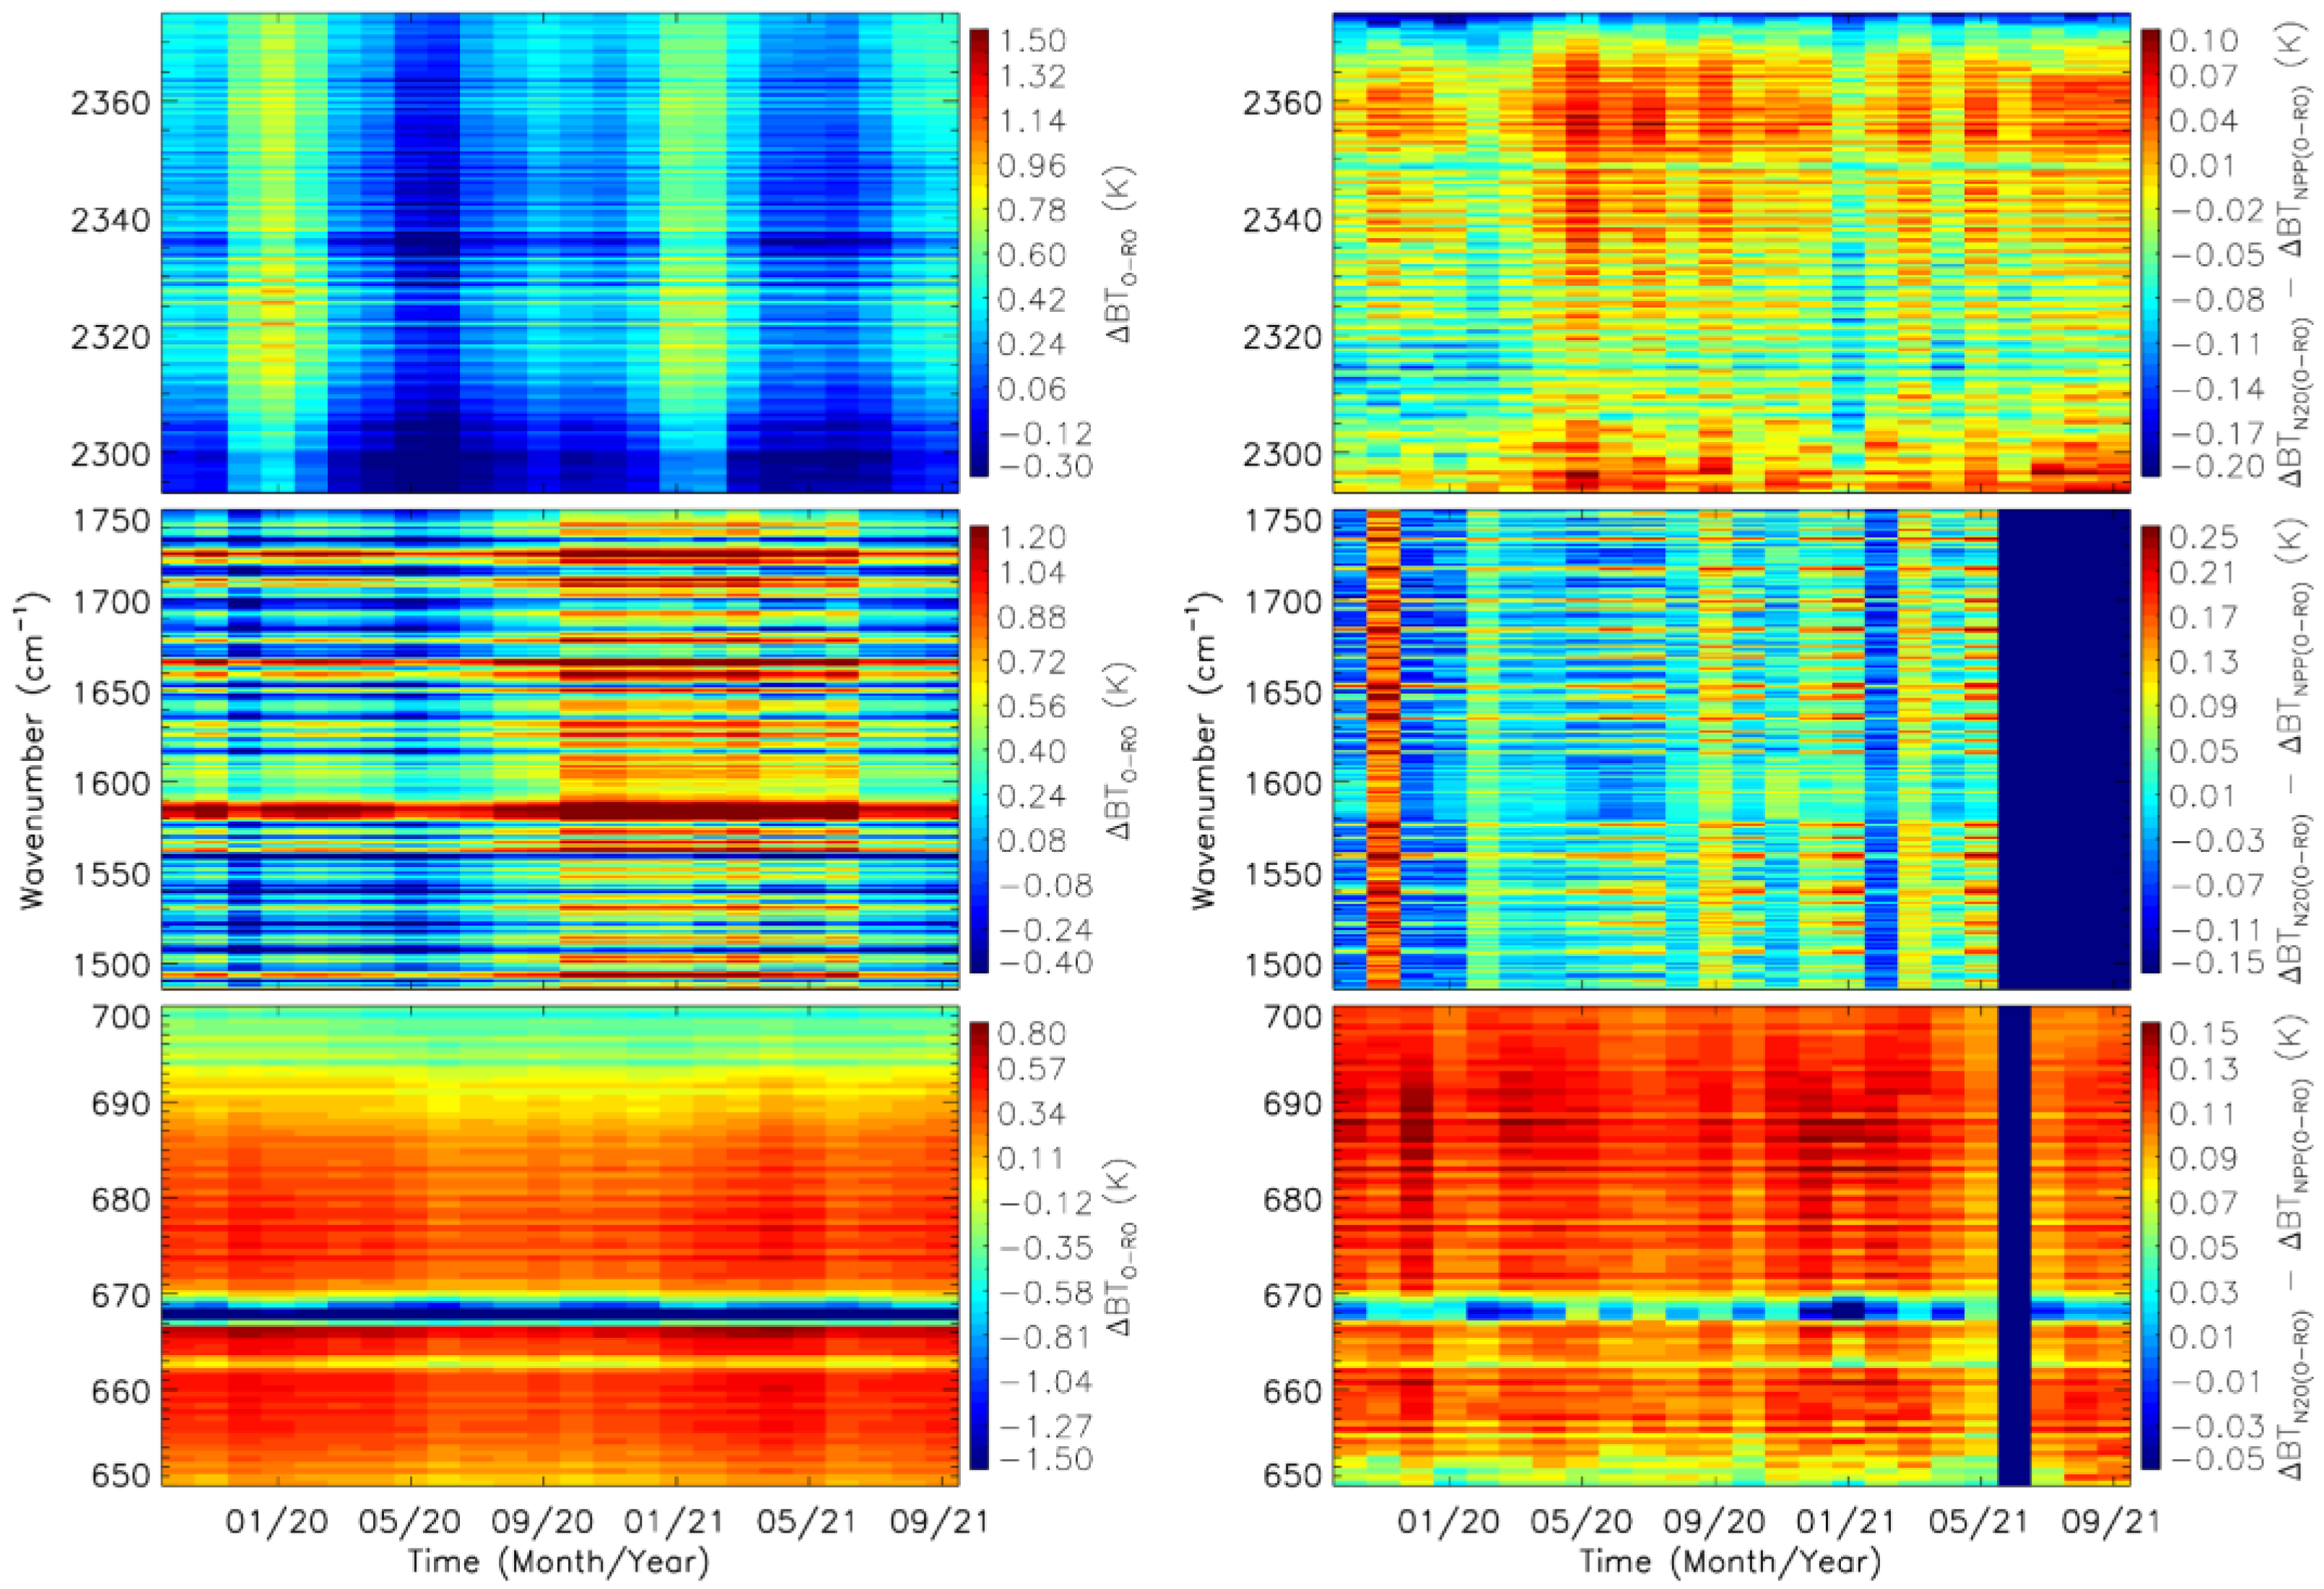
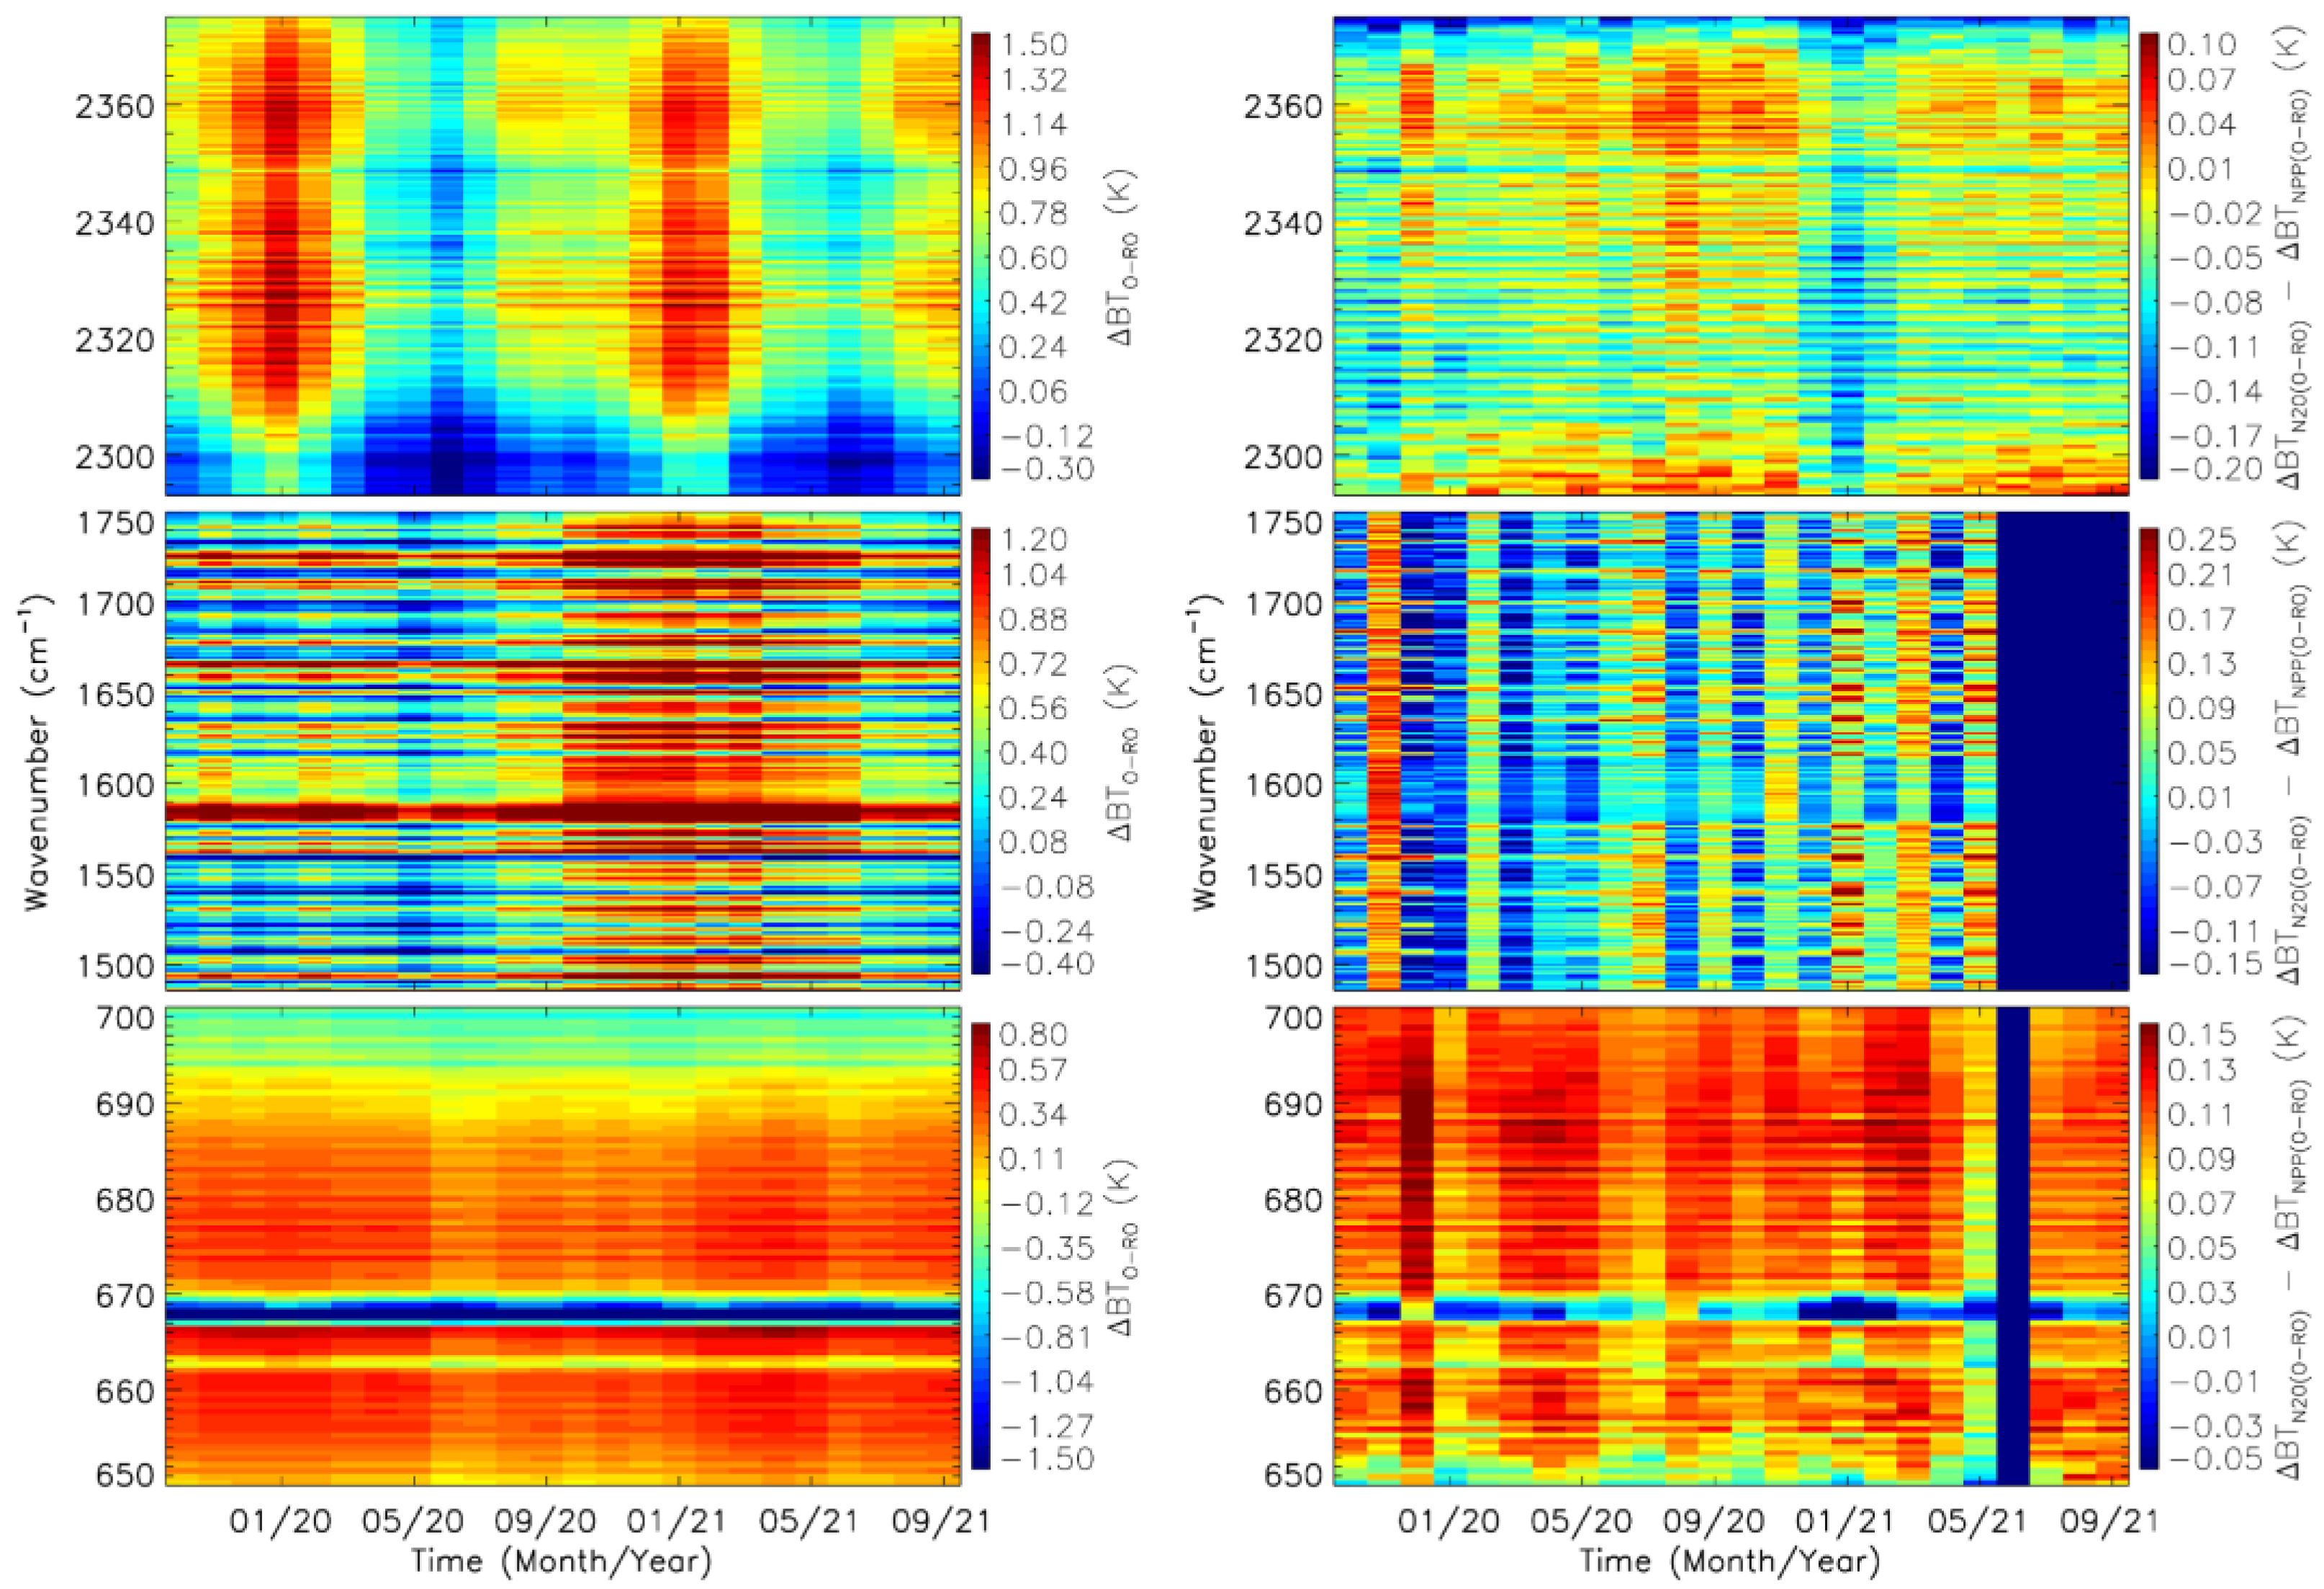
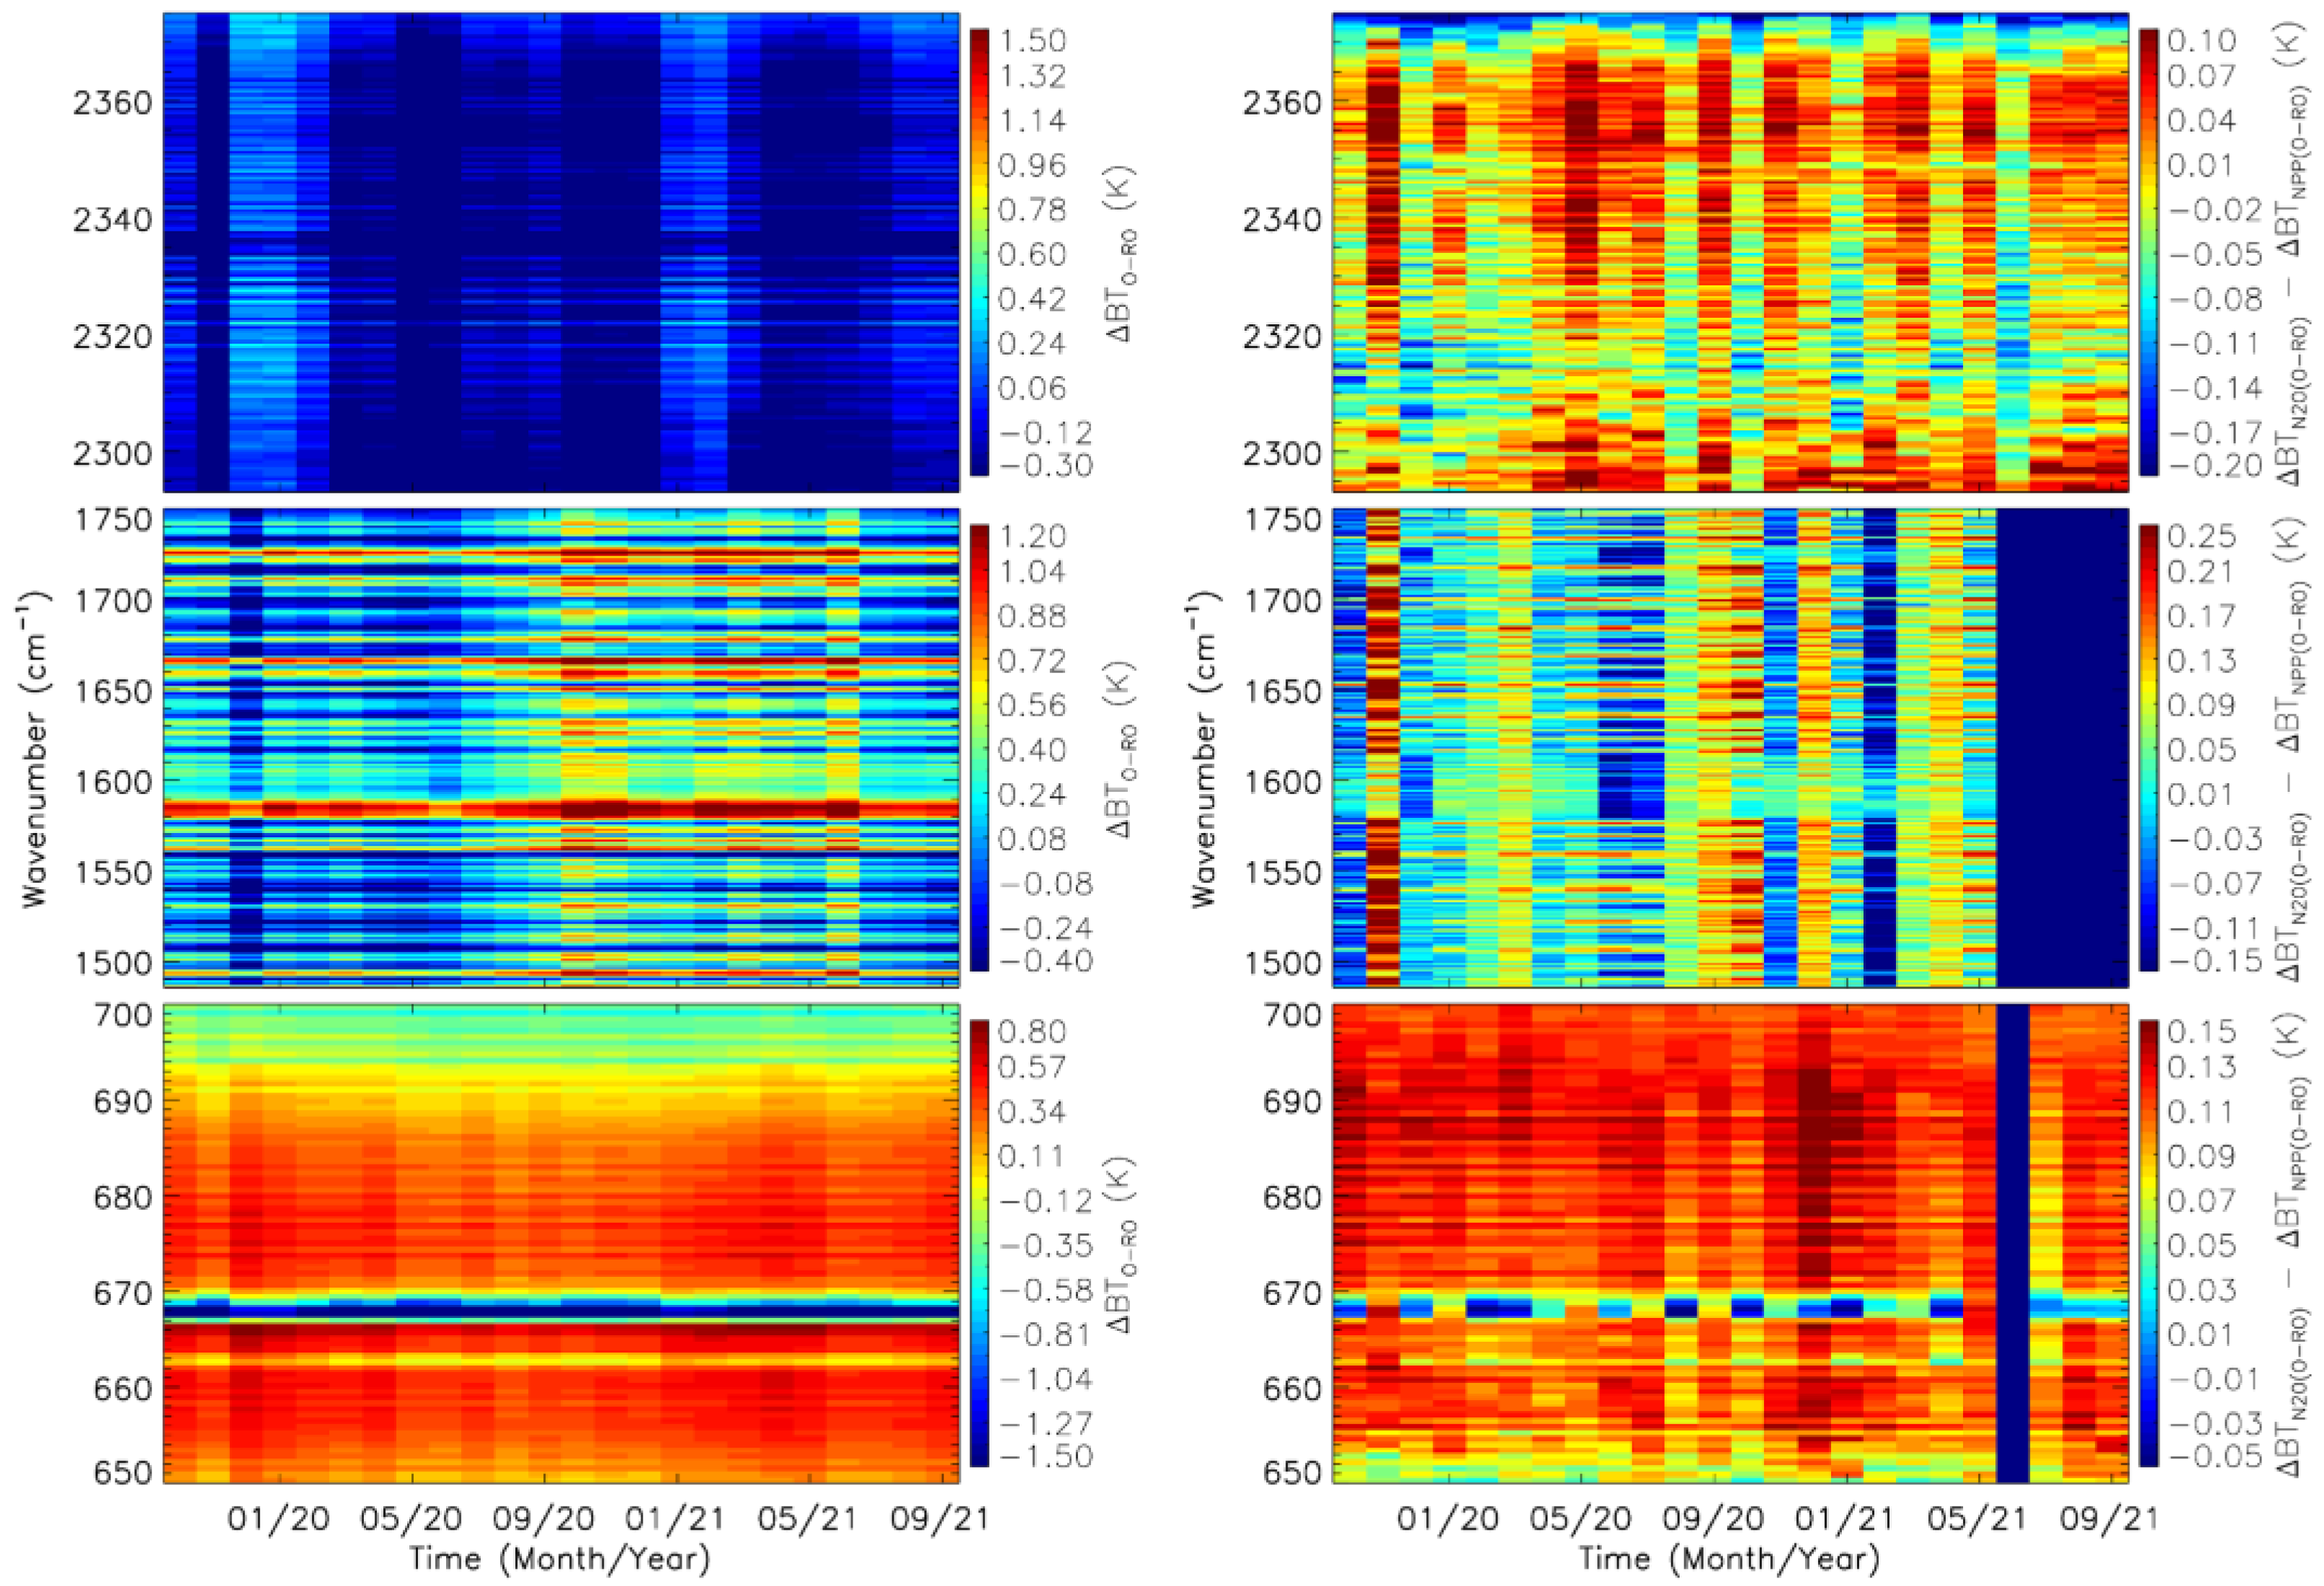
Bias and uncertainty in CrIS SDR data. The double differences, ranging from −0.05 K to 0.15 K in the LWIR temperature sounding channels between CrIS observations on NOAA-20 and on S-NPP using simulations as a transfer, mainly come from the radiometric calibrations, including the nonlinearity correction, ringing artifacts associated with the calibration algorithm and raw interferogram data points used, polarization correction, and the internal calibration target (ICT) model [1,6,9]. These channels also have larger instrument noise due to the CrIS instrument design compared to other LWIR channels [13,14].
(b)
Biases and uncertainties in the COSMIC-2 RO data retrievals. Although RO raw data are traceable to a unit of time, the temperature and water vapor profiles derived from the RO observations are not. As discussed in Section 2.2, the accuracy of the temperature and water vapor profiles depends on (1) how to reduce the instrument thermal noise effectively and the ionospheric noise above 35 km and (2) how to increase the receivers’ ability to track the multitude of signals and the retrieval algorithms’ ability to disentangle these signals below 10 km, during the bending angle/refractivity retrieval process [17,44]. The results shown in Section 3 demonstrated that the times for algorithm updates in the UCAR 1DVAR can be detected in the time series of the BT difference between CrIS observations and simulations using the RO data, resulting in differences in the bias characteristics. It is also shown that the larger BT difference and standard deviation for these selected water vapor channels in the MWIR band (see Figure 4 and Figure 8) than those from the temperature sounding channels in the LWIR and SWIR bands might result from the water vapor profiles in the 1DVAR RO retrieval system significantly fitting to the a priori and being potentially impacted by the super-refraction conditions below 5 km [46,50].
(c)
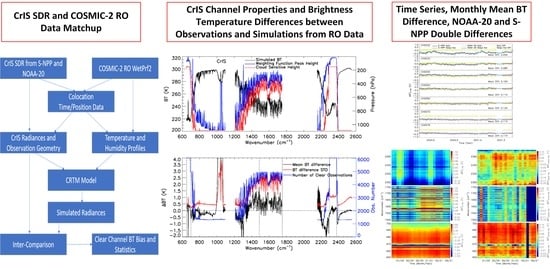
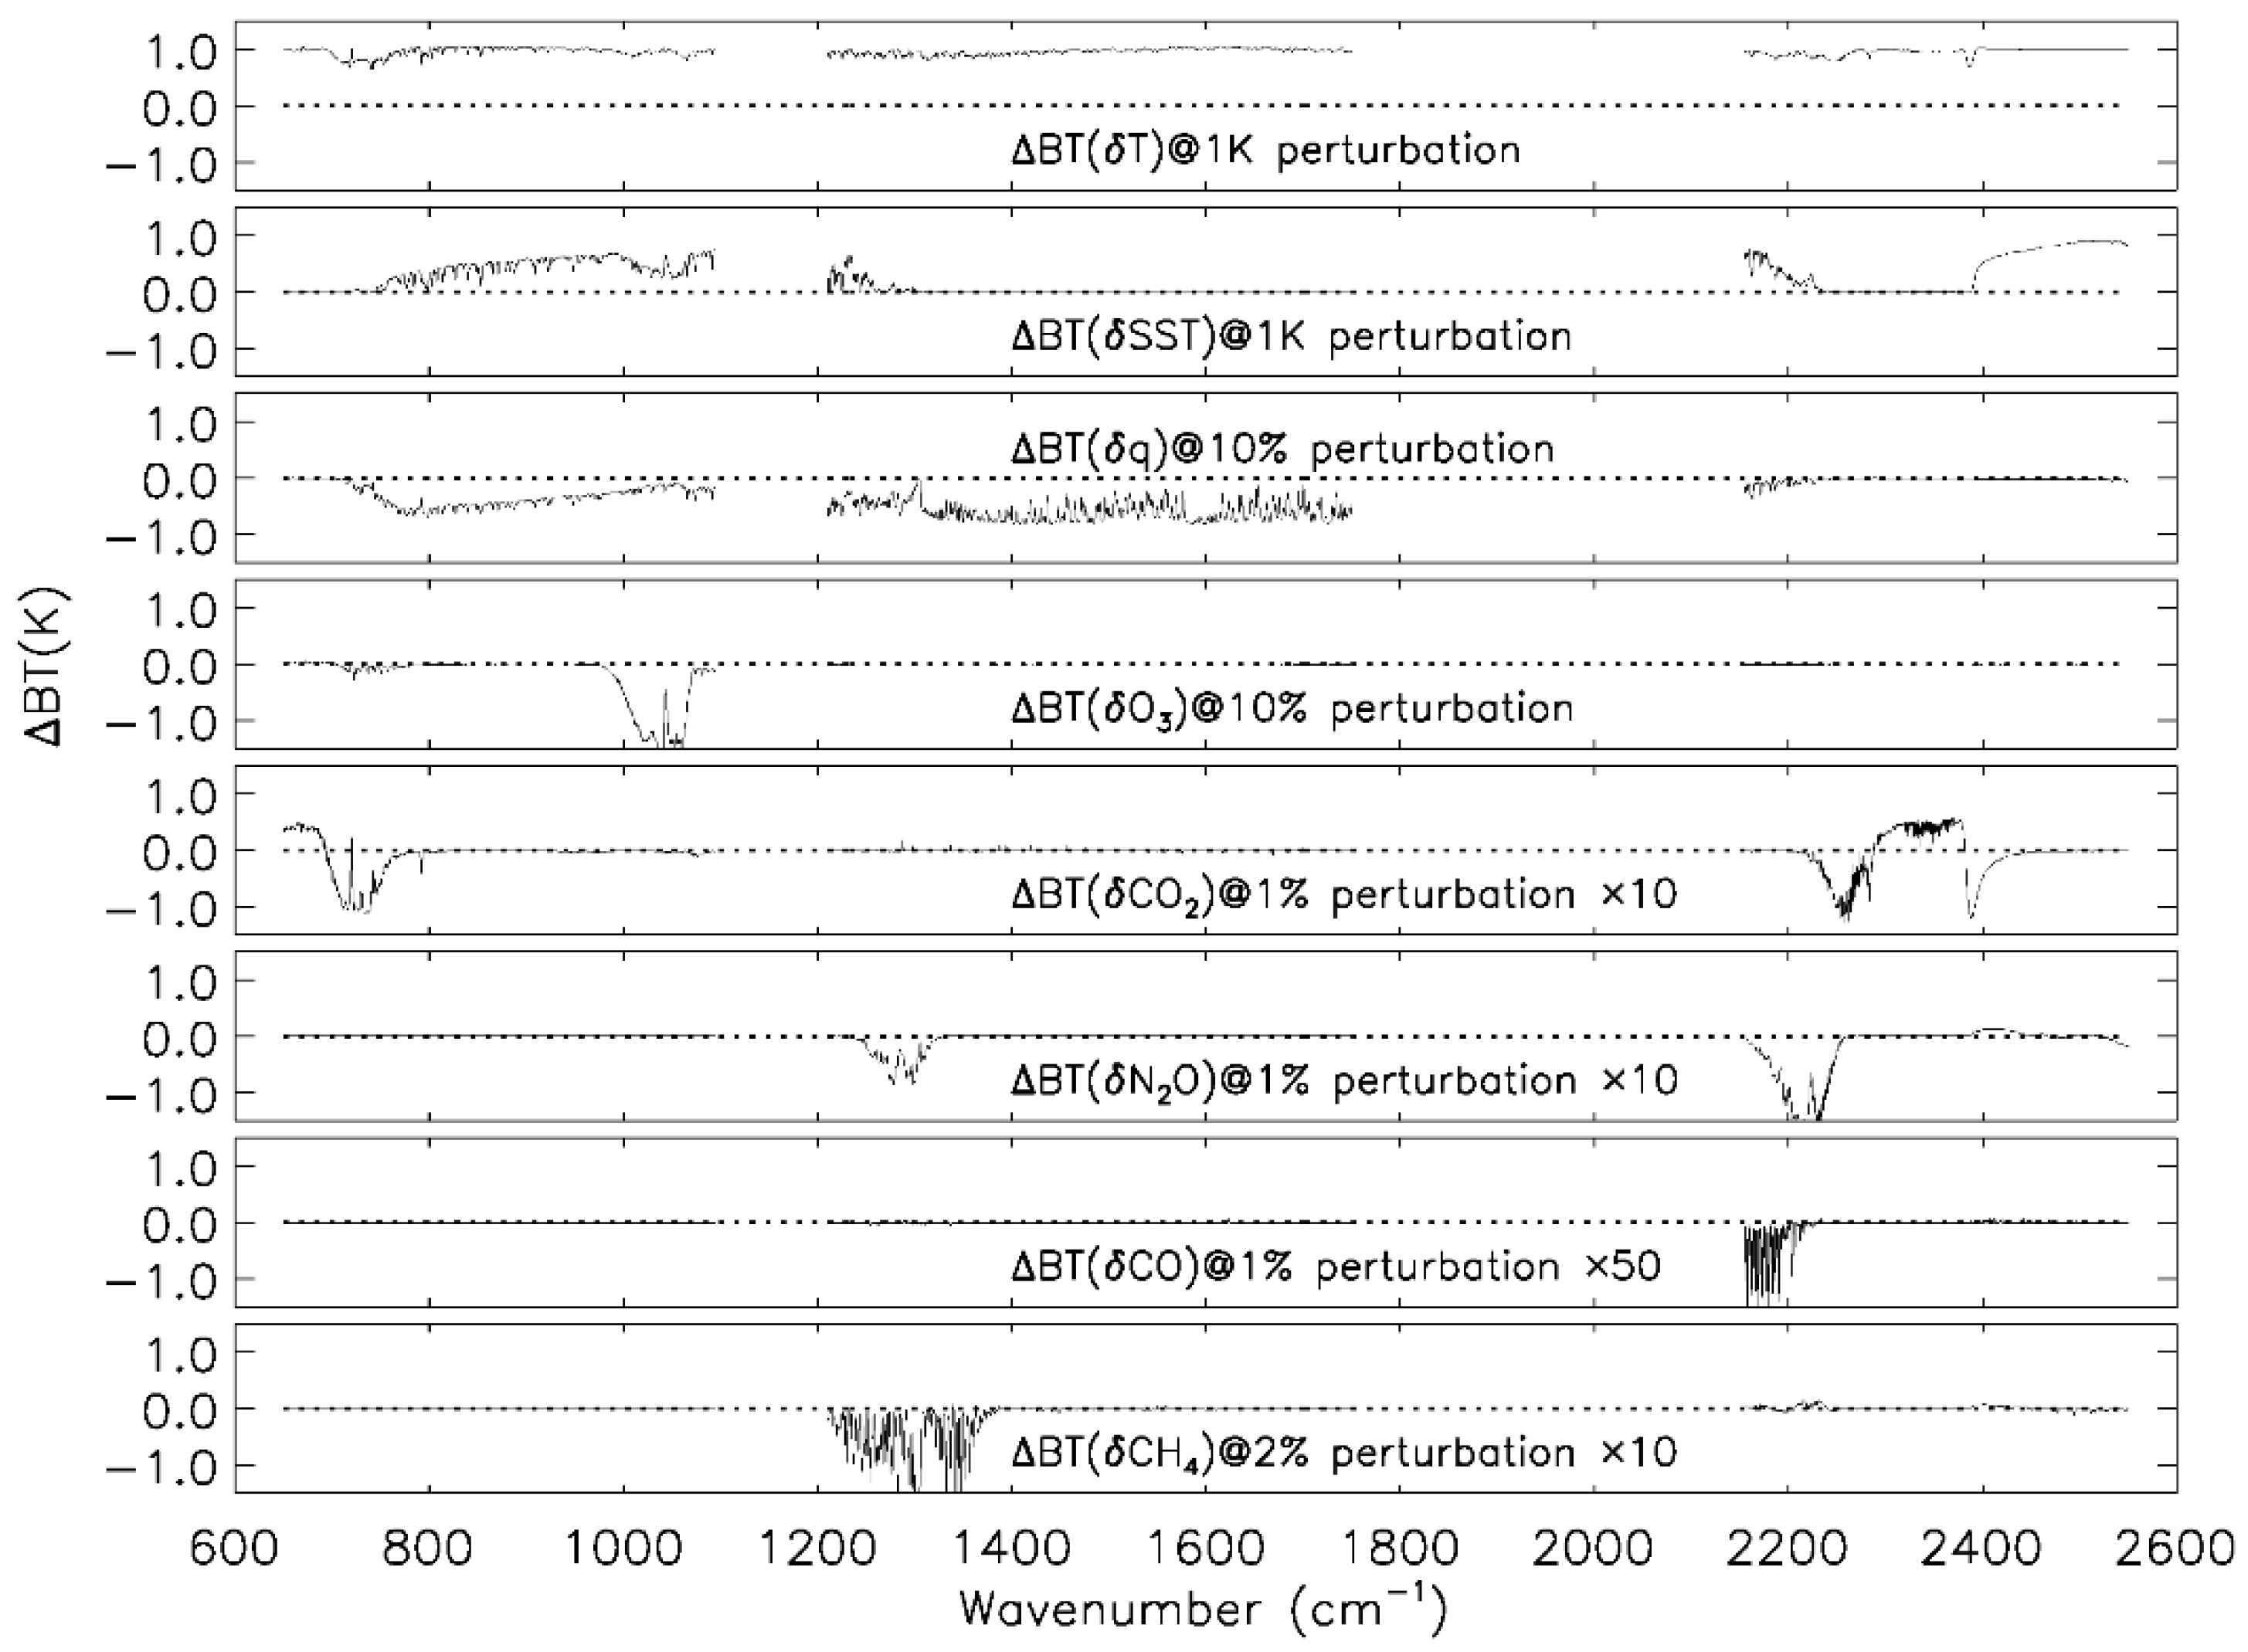
Biases and uncertainties in the CRTM simulation. CRTM is a fast radiative transfer model that uses a regression method to calculate the atmospheric gaseous absorption based on line-by-line simulation with a representative training dataset. The simulation accuracy is highly dependent on the model input atmospheric and surface conditions. Since only temperature and water vapor profiles are available from the COSMIC-2 RO products, the potential CrIS channels evaluated in this study are limited. To reduce the biases and uncertainties from the CRTM simulation, we selected CO2 temperature sounding channels in the CrIS LWIR and SWIR bands with WFPH greater than 10 km, where RO data can provide highly accurate temperature profiles, and water vapor channels in the MWIR band with cloud sensitivity height above ~5 km, with clear conditions and over oceans. However, there still are several residual biases and uncertainties related to the simulation: (1) clear sky detection uncertainties from the detection algorithm, whereby the cloud contamination would greatly impact the radiance simulation for the water channels and low WFPH temperature sounding channels; (2) use of an input CO2 profile with the default concentration (~384 ppmv) which is far less than the amount in the real atmosphere during the two years from October 2019 to September 2021—therefore, the impact cannot be negligible for CO2 temperature sounding channels; (3) daytime NLTE simulation for the CO2 4.3 µm absorption band, which is considered in the CRTM but is not accurate enough to remove the biases and seasonal biases related to solar zenith angles [42,47]; (4) input atmospheric temperature profiles from the RO retrieval not extending high enough (only up to 60 km), which would impact the radiance simulation for these channels with very high WFPH.
(d)
Biases and uncertainties related to the data collocation and sampling size. In this paper, the collocated minimum distance is calculated using the CrIS FOV pixel location and the COSMIC-2 RO profiles’ perigee location (occultation point) instead of the altitude location of the peak weighting function of each channel as was done in [38]. Since we evaluated hundreds of CrIS channels, it is not practical to collocate the CrIS observations and RO profiles by following [38]. Using the occultation point for the collocation would impact the selection of RO profiles, especially for the higher WFPH channels. In this paper, we selected observations over the ocean to ensure the uniformity of the target, which results in a daily collocation sample number of less than 200 per day. The CrIS data are sampled at nadir footprint sizes of 14 km and about 50 km at scan edge, while typical RO profiles have a horizontal resolution of 300 km [17]. These limiting factors in data collocation number and spatial resampling can add to the uncertainty in the BT difference and double-difference analysis, especially for water vapor channels, which are greatly impacted by the high vertical and horizontal water vapor variability in the atmosphere, as shown in the comparison results from water vapor channels.

6. Conclusions

This study estimates the accuracy of CrIS observations onboard S-NPP and NOAA-20 and the consistency between them using COSMIC-2 RO retrieval data as input to the CRTM. To reduce the collocation and simulation uncertainty, the matchup criteria between RO and CrIS observations are (1) time difference less than 30 min, (2) distance between CrIS FOV pixel location and the COSMIC-2 RO profiles perigee location less than 50 km, and (3) only including observations over oceans. Based on the information provided in the CrIS and RO observations, only CO2 temperature sounding channels with WFPH above 200 hPa (~12 km) in CrIS LWIR and SWIR bands and water vapor channels in the MWIR band with WFPH above 500 hPa (~6.3 km) over clear and ocean surfaces are selected for comparison to minimize the impacts from the surface emission, cloud absorption/scattering, and atmospheric gas absorption. The absolute differences between the CrIS observation and simulation using RO data as input are less than 1.0 K for the majority of those selected channels. The double differences between CrIS observations on NOAA-20 and S-NPP using simulations as a transfer are very stable. They range from −0.05 K to 0.15 K for LWIR channels and −0.20 K to 0.10 K for SWIR channels during the two years from 1 October 2019 to 30 September 2021. For MWIR channels, the double differences range from −0.15 K to 0.25 K, but they have large variation in both their daily mean and monthly mean time series due to the water vapor inhomogeneity and the small sample size.
Given the same order of magnitude of uncertainty from the CrIS observations (less than 0.14 K in BT) and RO temperature profiles (less than 0.15 K), we can conclude that the results in this study provide ways to understand the qualities of RO retrieval and CrIS measurements: RO data can be used to assess the consistency and stability of CrIS observations quantitatively, and CrIS measurements have the quality to assess the quality and stability of RO retrievals. Based on the analysis results in this study, we have demonstrated that the comparison approach can quantify the long-term stability for (i) S-NPP CrIS, (ii) NOAA-20 CrIS, and (iii) between S-NPP CrIS and NOAA-20 CrIS. This approach can also quantify the CRTM simulation error in the CO2 4.3 µm band due to the NLTE effects during daytime by using the high accuracy and high stability of the RO temperature profiles. Due to the high accuracy and high stability of the CrIS observations, the BT difference in the daily time series can be used to detect the times for algorithm updates in the UCAR COSMIC-2 1DVAR system, which results in differences in bias characteristics. These detected times are 25 September 2020, 23 March 2021, and 28 September 2021. This study demonstrates that the long-term time series BT difference in the CO2 temperature sounding channels in the LWIR band can be used to potentially detect the atmosphere CO2 amount change by combining highly accurate RO temperature profiles with observations from the hyperspectral IR sensors. To detect the small temperature drift caused by the changes in atmospheric CO2 amounts, the RO temperature profiles and CrIS SDR data must be highly stable. This requires reprocessed RO temperature profiles and reprocessed CrIS SDR data. Inter-calibration of the hyperspectral IR sensors’ upper-temperature channels using simulations from RO data as a transfer and detecting the atmospheric CO2 amount change using RO data will provide an independent assessment for IR sensors and provide long-term monitoring for CO2 concentration changes in the atmosphere. This comparison approach could detect the CrIS instrument drift or radiance product updates if we use the reprocessed RO temperature profiles from the same version of the 1DVAR system and the realistic CO2 amounts in the CRTM simulation. Further research is needed for a more thorough analysis of these topics.

Author Contributions

Conceptualization, Y.C., C.C., X.S. and S.-P.H.; methodology, Y.C. and X.S.; software, Y.C. and X.S.; validation, Y.C.; formal analysis, Y.C.; investigation, Y.C.; resources, S.-P.H.; data curation, Y.C.; writing—original draft preparation, Y.C.; writing—review and editing, Y.C., S.-P.H., X.S. and C.C.; visualization, Y.C.; supervision, C.C. and S.-P.H.; project administration, S.-P.H. and C.C.; funding acquisition, S.-P.H. All authors have read and agreed to the published version of the manuscript.

Funding

This study was supported by NOAA grant NA19NES4320002 (Cooperative Institute for Satellite Earth System Studies (CISESS)) at the University of Maryland/Earth System Science Interdisciplinary Center (ESSIC).

Data Availability Statement

The COSMIC-2 radio occultation WETPf2 data are available at https://data.cosmic.ucar.edu/gnss-ro/cosmic2/nrt/, and CrIS SDR data are available at NOAA Comprehensive Large Array-Data Stewardship System (CLASS) https://www.avl.class.noaa.gov/saa/products/welcome, both accessed on 29 April 2022.

Acknowledgments

The authors would like to thank Kun Zhang for providing some portion of the CrIS SDR data in this manuscript, and thank William Miller for correcting the potential errors in grammar, spelling, punctuation, and phrasing to improve its readability. The scientific results and conclusions as well as any views or opinions expressed herein are those of the author(s) and do not necessarily reflect those of the NOAA or the Department of Commerce.

Conflicts of Interest

The authors declare no conflict of interest.

References

  1. Han, Y.; Chen, Y. Calibration Algorithm for Cross-Track Infrared Sounder Full Spectral Resolution Measurements. IEEE Trans. Geosci. Remote Sens. 2018, 56, 1008–1016. [Google Scholar] [CrossRef]
  2. Eresmaa, R.; Letertre-Danczak, J.; Lupu, C.; Bormann, N.; McNally, A.P. The assimilation of Cross-track Infrared Sounder radiances at ECMWF. Q. J. R. Meteorol. Soc. 2017, 143, 3177–3188. [Google Scholar] [CrossRef]
  3. Nalli, N.R.; Tan, C.; Warner, J.; Divakarla, M.; Gambacorta, A.; Wilson, M.; Zhu, T.; Wang, T.; Wei, Z.; Pryor, K.; et al. Validation of Carbon Trace Gas Profile Retrievals from the NOAA-Unique Combined Atmospheric Processing System for the Cross-Track Infrared Sounder. Remote Sens. 2020, 12, 3245. [Google Scholar] [CrossRef]
  4. Smith, N.; Smith, W.L.; Weisz, E.; Revercomb, H.E. AIRS, IASI, and CrIS Retrieval Records at Climate Scales: An Investigation into the Propagation of Systematic Uncertainty. J. Appl. Meteorol. Climatol. 2015, 54, 1465–1481. [Google Scholar] [CrossRef]
  5. Zou, C.Z.; Zhou, L.; Lin, L.; Sun, N.; Chen, Y.; Flynn, L.E.; Zhang, B.; Cao, C.; Iturbide-Sanchez, F.; Beck, T.; et al. The Reprocessed Suomi NPP Satellite Observations. Remote Sens. 2020, 12, 2891. [Google Scholar] [CrossRef]
  6. Chen, Y.; Iturbide-Sanchez, F.; Tremblay, D.; Tobin, D.; Strow, L.; Wang, L.; Mooney, D.L.; Johnson, D.; Predina, J.; Suwinski, L.; et al. Reprocessing of Suomi NPP CrIS Sensor Data Records to improve the radiometric and spectral long-term accuracy and stability. IEEE Transact. Geosci. Remote Sens. 2021, 60, 1–14. [Google Scholar] [CrossRef]
  7. Strow, L.L.; Hepplewhite, C.; Motteler, H.; Buczkowski, S.; DeSouza-Machado, S.A. Climate Hyperspectral Infrared Radiance Product (CHIRP) Combining the AIRS and CrIS Satellite Sounding Record. Remote Sens. 2021, 13, 418. [Google Scholar] [CrossRef]
  8. Han, Y.; Revercomb, H.; Cromp, M.; Gu, D.; Johnson, D.; Mooney, D.; Scott, D.; Strow, L.; Bingham, G.; Borg, L.; et al. Suomi NPP CrIS measurements, sensor data record algorithm, calibration and validation activities, and record data quality. J. Geophys. Res. Atmos. 2013, 118, 12734–12748. [Google Scholar] [CrossRef]
  9. Tobin, D.; Revercomb, H.; Knuteson, R.; Taylor, J.; Best, F.; Borg, L.; DeSlover, D.; Martin, G.; Buijs, H.; Esplin, M.; et al. Suomi-NPP CrIS radiometric calibration uncertainty. J. Geophys. Res. Atmos. 2013, 118, 10589–10600. [Google Scholar] [CrossRef]
  10. Strow, L.L.; Motteler, H.; Tobin, D.; Revercomb, H.; Hannon, S.; Buijs, H.; Predina, J.; Suwinski, L.; Glumb, R. Spectral calibration and validation of the Cross-track Infrared Sounder on the Suomi NPP satellite. J. Geophys. Res. Atmos. 2013, 118, 12486–12496. [Google Scholar] [CrossRef]
  11. Chen, Y.; Han, Y.; Weng, F. Characterization of long-term stability of Suomi NPP Cross-Track Infrared Sounder spectral calibration. IEEE Trans. Geosci. Remote Sens. 2017, 55, 1147–1159. [Google Scholar] [CrossRef]
  12. Wang, L.; Zhang, B.; Tremblay, D.; Han, Y. Improved scheme for Cross-track Infrared Sounder geolocation assessment and optimization. J. Geophys. Res. Atmos. 2016, 122, 519–536. [Google Scholar] [CrossRef]
  13. Zavyalov, V.; Esplin, M.; Scott, D.; Esplin, B.; Bingham, G.; Hoffman, E.; Lietzke, C.; Predina, J.; Frain, R.; Suwinski, L.; et al. Noise performance of the CrIS instrument. J. Geophys. Res. Atmos. 2013, 118, 13108–13120. [Google Scholar] [CrossRef] [Green Version]
  14. Tremblay, D.; Iturbide-Sanchez, F.; Chen, Y.; Borg, L.; Predina, J.; Jin, X.; Tobin, D.; Strow, L.L.; Mooney, D.; Johnson, D.; et al. Radiometric noise assessment of the Cross-track Infrared Sounder on the NOAA-20 satellite. IEEE Trans. Geosci. Remote Sens. 2021, 60, 1–15. [Google Scholar] [CrossRef]
  15. Wang, L.; Chen, Y. Inter-Comparing SNPP and NOAA20 CrIS toward Measurement Consistency and Climate Data Records. IEEE J. Sel. Top. Appl. Earth Obs. Remote Sens. 2019, 12, 2024–2031. [Google Scholar] [CrossRef]
  16. Wang, L.; Han, Y.; Jin, X.; Chen, Y.; Tremblay, D.A. Radiometric consistency assessment of hyperspectral infrared sounders. Atmos. Meas. Tech. 2015, 8, 4831–4844. [Google Scholar] [CrossRef] [Green Version]
  17. Kursinski, E.R.; Hajj, G.A.; Schofield, J.T.; Linfield, R.P.; Hardy, K.R. Observing Earth’s Atmosphere with Radio Occultation Measurements Using the Global Positioning System. J. Geophys. Res. Atmos. 1997, 102, 23429–23465. [Google Scholar] [CrossRef]
  18. Kursinski, E.R.; Hajj, G.A.; Leroy, S.S.; Herman, B. The GPS Radio Occultation Technique. Terr. Atmos. Ocean. Sci. 2000, 11, 53–114. [Google Scholar] [CrossRef] [Green Version]
  19. Ware, R.; Exner, M.; Feng, D.; Gorbunov, M.; Hardy, K.; Herman, B.; Kuo, Y.; Meehan, T.; Melbourne, W.; Rocken, C.; et al. GPS Sounding of the Atmosphere from Low Earth Orbit: Preliminary Results. Bull. Am. Meteor. Soc. 1996, 77, 19–40. [Google Scholar] [CrossRef] [Green Version]
  20. Zou, X.; Vandenberghe, F.; Wang, B.; Gorbunov, M.E.; Kuo, Y.-H.; Sokolovskiy, S.; Chang, J.C.; Sela, J.G.; Anthes, R.A. A Ray-Tracing Operator and Its Adjoint for the Use of GPS/MET Refraction Angle Measurements. J. Geophys. Res. Atmos. 1999, 104, 22301–22318. [Google Scholar] [CrossRef] [Green Version]
  21. Rocken, C.; Anthes, R.; Exner, M.; Hunt, D.; Sokolovskiy, S.; Ware, R.; Gorbunov, M.; Schreiner, W.; Feng, D.; Herman, B.; et al. Analysis and validation of GPS/MET data in the neutral atmosphere. J. Geophys. Res. 1997, 102, 29849–29866. [Google Scholar] [CrossRef]
  22. Anthes, R.A.; Rocken, C.; Kuo, Y.H. Applications of COSMIC to meteorology and climate. Terr. Atmos. Ocean. Sci. 2000, 11, 115–156. [Google Scholar] [CrossRef] [Green Version]
  23. Lin, L.; Zou, X.; Kuo, Y.H. COSMIC GPS radio occultation temperature profiles in clouds. Mon. Weather Rev. 2010, 138, 1104–1118. [Google Scholar] [CrossRef] [Green Version]
  24. Healy, S.B. Forecast Impact Experiment with a Constellation of GPS Radio Occultation Receivers. Atmos. Sci. Lett. 2008, 9, 111–118. [Google Scholar] [CrossRef]
  25. Cucurull, L.; Derber, J.C.; Purser, R.J. A bending angle forward operator for global positioning system radio occultation measurements. J. Geophys. Res. Atmos. 2013, 118, 14–28. [Google Scholar] [CrossRef]
  26. Ho, S.-P.; Anthes, R.A.; Ao, C.O.; Healy, S.; Horanyi, A.; Hunt, D.; Mannucci, A.J.; Pedatella, N.; Randel, W.J.; Simmons, A.; et al. The COSMIC/FORMOSAT-3 Radio Occultation Mission after 12 Years: Accomplishments, Remaining Challenges, and Potential Impacts of COSMIC-2. Bull. Am. Meteor. Soc. 2020, 101, E1107–E1136. [Google Scholar] [CrossRef] [Green Version]
  27. Ruston, B.; Healy, S. Forecast Impact of FORMOSAT-7/COSMIC-2 GNSS Radio Occultation Measurements. Atmos. Sci. Lett. 2021, 22, e1019. [Google Scholar] [CrossRef]
  28. Ho, S.P.; Peng, L.; Anthes, R.A.; Kuo, Y.H.; Lin, H.C. Marine Boundary Layer Heights and Their Longitudinal, Diurnal, and Inter-seasonal Variability in the Southeastern Pacific Using COSMIC, CALIOP, and Radiosonde Data. J. Clim. 2015, 28, 2856–2872. [Google Scholar] [CrossRef] [Green Version]
  29. Ho, S.-P.; Peng, L.; Mears, C.; Anthes, R.A. Comparison of global observations and trends of total precipitable water derived from microwave radiometers and COSMIC radio occultation from 2006 to 2013. Atmos. Chem. Phys. 2018, 18, 259–274. [Google Scholar] [CrossRef] [Green Version]
  30. Teng, W.H.; Huang, C.-Y.; Ho, S.-P.; Kuo, Y.-H.; Zhou, X.J. Characteristics of Global Precipitable Water in ENSO Events Revealed by COSMIC Measurements. J. Geophys. Res. Atmos. 2013, 118, 8411–8425. [Google Scholar] [CrossRef]
  31. Scherllin-Pirscher, B.; Deser, C.; Ho, S.-P.; Chou, C.; Randel, W.; Kuo, Y.-H. The vertical and spatial structure of ENSO in the upper troposphere and lower stratosphere from GPS radio occultation measurements. Geophys. Res. Lett. 2012, 39, L20801. [Google Scholar] [CrossRef] [Green Version]
  32. Zeng, Z.; Ho, S.-P.; Sokolovskiy, S. The Structure and Evolution of Madden- Julian Oscillation from FORMOSAT-3/COSMIC Radio Occultation Data. J. Geophys. Res. Atmos. 2012, 117, D22108. [Google Scholar] [CrossRef]
  33. Xue, Y.H.; Li, J.; Menzel, P.; Borbas, E.; Ho, S.-P.; Li, Z. Impact of Sampling Biases on the Global Trend of Total Precipitable Water Derived from the Latest 10-Year Data of COSMIC, SSMIS and HIRS Observations. J. Geophys. Res. Atmos. 2018, 124, 6966–6981. [Google Scholar] [CrossRef] [Green Version]
  34. Mears, C.; Ho, S.-P.; Bock, O.; Zhou, X.; Nicolas, J. Total Column Water Vapor, [In “States of the Climate in 2018”]. Bull. Am. Meteor. Sci. 2019, 100, S27–S28. [Google Scholar] [CrossRef] [Green Version]
  35. Ho, S.-P.; He, W.; Kuo, Y.-H. Construction of Consistent Temperature Records in the Lower Stratosphere Using Global Positioning System Radio Occultation Data and Microwave Sounding Measurements. In New Horizons in Occultation Research: Studies in Atmosphere and Climate; Steiner, A., Pirscher, B., Foelsche, U., Kirchengast, G., Eds.; Springer: Berlin/Heidelberg, Germany, 2009; pp. 207–217. ISBN 978-3-642-00321-9. [Google Scholar]
  36. Ho, S.-P.; Kuo, Y.-H.; Zeng, Z.; Peterson, T.C. A Comparison of Lower Stratosphere Temperature from Microwave Measurements with CHAMP GPS RO Data. Geophys. Res. Lett. 2007, 34, L15701. [Google Scholar] [CrossRef] [Green Version]
  37. Iacovazzi, R.; Lin, L.; Sun, N.; Liu, Q. NOAA Operational Microwave Sounding Radiometer Data Quality Monitoring and Anomaly Assessment Using COSMIC GNSS Radio-Occultation Soundings. Remote Sens. 2020, 12, 828. [Google Scholar] [CrossRef] [Green Version]
  38. Zou, X.; Lin, L.; Weng, F. Absolute Calibration of ATMS Upper Level Temperature Sounding Channels Using GPS RO Observations. IEEE Trans. Geosci. Remote Sens. 2014, 52, 1397–1406. [Google Scholar] [CrossRef]
  39. Shao, X.; Ho, S.-P.; Zhang, B.; Cao, C.; Chen, Y. Consistency and Stability of SNPP ATMS Microwave Observations and COSMIC-2 Radio Occultation over Oceans. Remote Sens. 2021, 13, 3754. [Google Scholar] [CrossRef]
  40. Chen, Y.; Weng, F.; Han, Y.; Liu, Q. Validation of the community radiative transfer model by using cloudsat data. J. Geophys. Res., Atmos. 2008, 113, D00A03. [Google Scholar] [CrossRef]
  41. Chen, Y.; Han, Y.; Van Delst, P.; Weng, F. On water vapor Jacobian in fast radiative transfer model. J. Geophys. Res. Atmos. 2010, 115, D12303. [Google Scholar] [CrossRef]
  42. Chen, Y.; Han, Y.; Van Delst, P.; Weng, F. Assessment of shortwave infrared sea surface reflection and nonlocal thermodynamic equilibrium effects in the community radiative transfer model using IASI data. J. Atmos. Ocean. Technol. 2013, 30, 2152–2160. [Google Scholar] [CrossRef]
  43. McNally, A.P.; Watts, P.D. A cloud detection algorithm for high-spectral-resolution infrared sounders. Q. J. R. Meteorol. Soc. 2003, 129, 3411–3423. [Google Scholar] [CrossRef]
  44. Sokolovskiy, S.; Rocken, C.; Schreiner, W.; Hunt, D. On the uncertainty of radio occultation inversions in the lower troposphere. J. Geophys. Res. 2010, 115, 1–19. [Google Scholar] [CrossRef] [Green Version]
  45. Lonitz, K.; Marquardt, C.; Bowler, N.; Healy, S. Impact Assessment of Commercial GNSS-RO Data; Contract Report, ESA Contract No. 4000131086/20/NL/FF/a; European Space Agency: Paris, France, 2021; p. 72. [Google Scholar]
  46. Wee, T.-K. A Variational Regularization of Abel Transform for GPS Radio Occultation. Atmos. Meas. Tech. 2018, 11, 1947–1969. [Google Scholar] [CrossRef] [Green Version]
  47. Li, Z.; Menzel, W.P.; Jung, J.; Lim, A.; Li, J.; Matricardi, M.; López-Puertas, M.; Sergio DeSouza-Machado, S.; Strow, L.L. Improving the Understanding of CrIS Full Spectral Resolution Nonlocal Thermodynamic Equilibrium Radiances Using Spectral Correlation. J. Geophys. Res. Atmos. 2020, 125, e2020JD032710. [Google Scholar] [CrossRef]
  48. Iturbide-Sanchez, F.; Strow, L.; Tobin, D.; Chen, Y.; Tremblay, D.; Knuteson, R.O.; Johnson, D.G.; Buttles, C.; Suwinski, L.; Thomas, B.P.; et al. Recalibration and assessment of the SNPP CrIS Instrument: A successful history of restoration after midwave infrared band anomaly. IEEE Trans. Geosci. Remote Sens. 2022, 60, 1–21. [Google Scholar] [CrossRef]
  49. Wielicki, B.A.; Young, D.F.; Mlynczak, M.G.; Thome, K.J.; Leroy, S.; Corliss, J.; Anderson, J.G.; Ao, C.O.; Bantges, R.; Best, F.; et al. Achieving climate change absolute accuracy in orbit. Bull. Am. Meteorol. Soc. 2013, 94, 1519–1539. [Google Scholar] [CrossRef] [Green Version]
  50. Ho, S.-P.; Shao, X.; Zhang, B.; Adhikari, L.; Zhou, X. NESDIS STAR GNSS RO processing, validation, and monitoring system: Initial validation of the STAR COSMIC-2 data products. Terr. Atmos. Ocean. Sci. 2021; submitted. [Google Scholar]
Figure 1. Information content from CrIS observation: brightness temperature impact due to the change in atmospheric temperature (T), the sea surface temperature (SST), water vapor (q) (H2O), ozone (O3), carbon dioxide (CO2), nitrous oxide (N2O), carbon monoxide (CO), and methane (CH4) in CrIS channels.
Remotesensing 14 02721 g001
Figure 2. CrIS channel cloud sensitivity height and weighting function peak height.
Remotesensing 14 02721 g002
Figure 3. Flow chart for CrIS SDR and COSMIC-2 RO data matchup for radiance simulation and inter-comparison. The matchup criteria are time less than 30 min, a distance less than 50 km, and over the ocean.
Remotesensing 14 02721 g003
Figure 4. The brightness temperature difference between NOAA-20 CrIS observation and simulation with COSMIC-2 RO data for clear channels over oceans during June 2021.
Remotesensing 14 02721 g004
Figure 5. (a) Weighting function for LWIR CO2 temperature sounding channels (1 to 81) 650–700 cm−1 (with cloud sensitivity height above ~6.8 km); (b) weighting function for MWIR water vapor channels (1155 to 1578) 1485.625–1750 cm−1 (with cloud sensitivity height above ~5 km); and (c) weighting function for SWIR CO2 temperature sounding channels (1800 to 1931) 2293.125–2375.0 cm−1 (with cloud sensitivity height above 11 km).
Remotesensing 14 02721 g005
Figure 6. Selected CrIS channels covering temperature and water vapor sounding channels at represented pressures and altitude heights.
Remotesensing 14 02721 g006
Figure 7. Brightness temperature difference time series for selected CrIS channels in LWIR band between CrIS observations and simulations with COSMIC-2 RO data during the two years from 1 October 2019 to 30 September 2021. The inter-satellite differences between NOAA-20 and S-NPP are also included. UCAR implemented an update in the WETPf2 1DVAR algorithm around 23 March 2021, which caused a small jump in the BT difference time series. On 28 September 2021, ECMWF forecasts replaced GFS forecasts as the a priori.
Remotesensing 14 02721 g007
Figure 8. Same as Figure 7, except for results from selected CrIS channels in the MWIR band. UCAR implemented an update in the WETPf2 1DVAR algorithm on 25 September 2020.
Remotesensing 14 02721 g008
Figure 9. Same as Figure 7, except for selected CrIS channels in the SWIR band.
Remotesensing 14 02721 g009
Figure 10. Same as Figure 9, except for results from the daytime.
Remotesensing 14 02721 g010
Figure 11. Same as Figure 9, except for results from the nighttime.
Remotesensing 14 02721 g011
Figure 12. (left) Monthly mean BT difference between NOAA-20 CrIS observations and simulations with UCAR RO data; (right) two CrIS double differences between NOAA-20 and S-NPP using simulations with UCAR RO data as a transfer. Note that the data gaps in the LWIR band during June 2021 and the MWIR band after June 2021 are due to S-NPP CrIS electronics failure. S-NPP CrIS operated on Side-2 electronics after 24 June 2019, when the MWIR band failed on Side 1. From 21 May to 12 July 2021, the LWIR band failed on Side 2. Since then, CrIS on S-NPP has been switched back to Side 1.
Remotesensing 14 02721 g012
Figure 13. Same as Figure 12 except for results from the daytime.
Remotesensing 14 02721 g013
Figure 14. Same as Figure 12, except for results from the nighttime.
Remotesensing 14 02721 g014
Table 1. Time series from selected CrIS channels covering temperature and water vapor sounding channels at represented pressures and altitude heights for comparison purposes.
CrIS Band Channel Index Channel Center Wavenumber (cm−1)Peak Sounding Height (km)Peak Sounding Pressure (hPa)
LWIRCH0032669.37527.5620
CH0033670.00023.8630
CH0045677.50020.8450
CH0055683.75018.8170
CH0065690.00015.85100
CH0075696.25014.37150
CH0079698.75012.54200
MWIRCH12661555.0009.49300
CH13361598.7506.37500
CH14231653.12512.20200
CH14591675.62510.82250
CH15311720.6257.59400
SWIRCH18012293.75015.85100
CH18122300.62518.8170
CH18272310.00020.8450
CH18352315.00023.2030
CH19232370.00026.7620
Publisher’s Note: MDPI stays neutral with regard to jurisdictional claims in published maps and institutional affiliations.

