Article

Accuracy of Code GNSS Receivers under Various Conditions

1
Department of Integrated Geodesy and Cartography, AGH University of Science and Technology, Mickiewicza 30, 30059 Krakow, Poland
2
Institute of Geodesy and Geoinformatics, University of Latvia, Jelgavas 3, LV-1004 Riga, Latvia
3
Department of Mine Areas Protection, Geoinformatics and Mine Surveying, AGH University of Science and Technology, Al. Mickiewicza 30, 30-059 Krakow, Poland
4
Institute of Earth Sciences, University of Silesia in Katowice, Bedzinska 60, 41200 Sosnowiec, Poland
5
Global Justice Program, Yale University, New Haven, CT 06520, USA
6
HNU-ASU Joint International Tourism College, Hainan University, Haikou 570228, China
7
Center for Tourism Research, Wakayama University, Wakayama 640-8510, Japan
*
Author to whom correspondence should be addressed.
Remote Sens. 2022, 14(11), 2615; https://doi.org/10.3390/rs14112615
Submission received: 1 April 2022 / Revised: 26 May 2022 / Accepted: 27 May 2022 / Published: 30 May 2022
(This article belongs to the Special Issue New Insights in InSAR and GNSS Measurements)

Abstract

:
The main objective of this research work was to study the accuracy of GNSS code receivers under poor sky visibility conditions based on measurements on three different objects (point, line, and surface) and additionally to test results on point positioning with good sky visibility conditions. The measurement was based on 3 smartphones (in the same mode to check repeatability) and 2 handheld receivers (working in GPS+GLONASS modes). The methodology was based on the RTK technique, whose coordinates were assumed as a reference. Based on the results, the significant influence of measuring in the vicinity of high trees on the obtained accuracy was observed for both the precise geodetic equipment and the tested code receivers. More favorable results of point positioning were observed when using mobile phones. On the other hand, in the case of measurement in motion, the handheld receivers guaranteed higher accuracy. Moreover, the study showed that handheld receivers might achieve a better accuracy than smartphones, and that position might be determined with a greater accuracy and reliability. Furthermore, handheld receivers were characterized by a smaller number of outliers.

Graphical Abstract

1. Introduction

The GNSS (Global Navigation Satellite System) can determine a person’s position anywhere in the world in navigation mode, while more precise measurements require additional input data (PPP—Precise Point Positioning) or additional reference stations (RTK—Real Time Kinematic). Currently operating GNSS systems include the American GPS system (Global Positioning System), the Russian GLONASS system (Глoбальная навигациoнная спутникoвая система), the Chinese BeiDou system, the Japanese QZSS (Quasi Zenit Satellite System), and the European Galileo system [1,2]. The development of satellite systems is ongoing, which influences the continuous improvement of measurement techniques and accuracy of measurements, including in navigation solutions that use code receivers, in areas such as tourism or car navigation [3,4,5,6].
This study aimed to investigate the accuracy of GNSS code receivers under low-visibility conditions (tree-bounded terrain), in one session on the roof of a building with good sky visibility conditions, and the reliability and accuracy of solutions. This kind of research has not been conducted so far in such a complex and innovative way. To date, there has been no research analyzing the accuracy of the same receivers on three different fields: point, line, and circle. In addition to testing smartphone solutions, this study also assessed handheld GNSS receivers in GPS and GPS+GLONASS mode. Today, due to the widespread availability of smartphones and the growing popularity of watches with GNSS receivers, handheld receivers enjoy less and less interest. Another innovative aspect of the study was the use of a dual-system receiver, which is rare. This type of research can answer questions for professionals and laymen in many fields where the use of such receivers is important, such as land navigation, tourism, or forestry. For example, the study has great innovative potential to be applied to measurements in open-pit mining. In open-pit mines, there is a limitation on the horizon of the sky visibility zone. Therefore, the developed methodology should also be tested in the mining industry. Moreover, the majority of literature studies are based on the geographic/geodetic coordinates φ, λ, h, which is not justified in practical use. The φ, λ, h system refers to geocentric coordinates, which are not natural and, in the field, difficult for the user to define. In this paper, the authors used the NEU system, which is directly related to the user’s location and is easy to define in the field.
For this purpose, a synchronous satellite measurement was performed using a precision geodetic receiver (in RTK mode) and 5 code receivers (3 smartphones, 2 handheld receivers, Figure 1).

2. Background

The rapid technological development and miniaturization of GNSS receivers has made their use in mobile phones possible. The first device of this type was the Benefon ESC! phone, released in 1999, equipped with a GPS positioning system operating on two GSM frequencies of 900 and 1800 MHz [7]. The appearance of a low-cost GNSS chipset after the 2010s has allowed for the development of mobile devices that are accessible almost to everyone [8,9]. For example, the year 2013 started a new era: more smartphones were sold worldwide than any other type of phone [10]. In 2016, Google announced the Android Nougat (version 7) operating system, which allowed smartphones to receive raw GNSS measurements, i.e., pseudorange, carrier-phase, Doppler shift, and carrier-to-noise density ratio (C/N0) observations [11,12]. According to the GNSS Market Report from the European GNSS Agency, in 2019, 1.8 billion GNSS receivers were sold; about 1.6 billion of these units were mass-market devices, costing less than EUR 5, and about 90% of these were mounted in smartphones or wearables (smart watches, fitness trackers, smart glasses) [13]. Smartphones, as navigation or positioning devices, are undergoing constant testing and improvement, and their usefulness and reliability in precision surveying are being tested [14]. Over the past few years, there has been a continuous and rapid development of both handsets and GNSS systems. Moreover, smartphones have been the object of continuous investigation by researchers in different fields of science and for applications, e.g., in terms of power consumption [15], usage of raw GNSS observations [16], or dual-frequency observations [17]. Nowadays, it is possible to achieve an accuracy of 3–5 m using GPS+GLONASS observations [7]. Such tests have shown that using satellite signals in addition to GPS provides more accurate measurements [18]. Tests have also been performed for various weather and environmental conditions [19] as well as regarding relative positioning [20]. Studies conducted using smartphones that record phase measurements offer the possibility of very high accuracy in static measurements: 1–4 cm [21] or even 2 cm for 60 min of measurement [22]. In addition, the use of external clock files and orbits allows the accuracy of the code solutions to be improved, and taking into account multi-tracking gives the possibility to achieve an accuracy of 2–3 m [23,24]. The problem with this type of positioning is the fast TTFF (Time To First Fix), or time to full initialization of the receiver, which is currently as low as 0.5 s [15,25]. Due to the nature and most common use of smartphones, they perform well in areas with high obscuration of the horizon, such as cities, mountainous areas, or forests [26]. In the case of such phones, the use of auxiliary information (IMU—Inertial Measurement Unit—sensors) even enables indoor position determination [27,28]. Moreover, in recent years, raw (RINEX) measurements from Android smart devices have become more and more popular in accurate positioning, e.g., precise point positioning (PPP) [17,29,30,31,32,33]. In addition to satellite techniques, other algorithms are becoming increasingly popular that refine positioning, such as SLAM (simultaneous localization and mapping) [34], stereo vision [35], or mixed algorithms [36].

3. Materials and Methods

3.1. Materials

Measurements were performed on 4 test objects (point, line, circle, and an unobstructed sky static session) with an interval of 1 s. In order to determine the accuracy of determination of horizontal coordinates and altitude coordinates, the transformation of geographic coordinates to XYZ coordinates was carried out, and precise RTK solutions (fix, total phase indeterminacy) were adopted as error-free measurements. The obtained coordinates were transformed to the NEU topocentric system. In conditions of limited visibility, a decrease in accuracy was noticed for both code and precision receivers. It should be noted that the possibilities of simulators available on the market are quite large and low-cost solutions are also available.
An urban park (Figure 2) with heavy forest cover, flat terrain, and paved alleys of regular shape and width was adopted as the study site. It is located in the center of Kraków (center of yellow circle on Figure 2: 50°03′45.9″N 19°55′02.9″E, 204 m). For testing purposes, the following were used:
  • Javad Triumph-1 (chipset 352-TFBGA, 90 nm) precision receiver operating in RTK GPS mode, with reference to a reference station located at a distance of 500 m, which eliminated the influence of the ionosphere.
  • Two Garmin eTrex 30 (chipset STA8088 TESEO II) receivers allowing signals to be recorded in GPS or GPS+GLONASS mode, each receiver operating in a different mode (Table 1).
  • Three Xiaomi Mi 8 (chipset Qualcomm SDM845 Snapdragon 845, 10 nm) phones running the Android 8.1 operating system capable of recording GPS, GLONASS, Galileo, and BeiDou signals. A free GPS Logger application (Geo Stats) was used to measure the smartphones. It was programmed to receive only the GPS signal, so it was not possible to set other signals, although the phones had such a possibility. All smartphones were operating in the same mode. Furthermore, the application did not record altitude. During the study, 4 software applications were tested for measuring smartphones on the move, but only 1 application positioned the device throughout the measurement, while the other 3 terminated after 1 min.
Unfortunately, the geoid model used in the receivers we tested is a “black box”; thus, the authors decided to use the EGM96 model due to its widest use to date and the awareness that Garmin Etrex 30 receivers premiered in 2011. In addition, the differences between the EGM96 and EMG2008 geoid models are not significant and amount to less than the accuracy of the receivers tested, so the impact on the results is negligible.

3.2. Methods

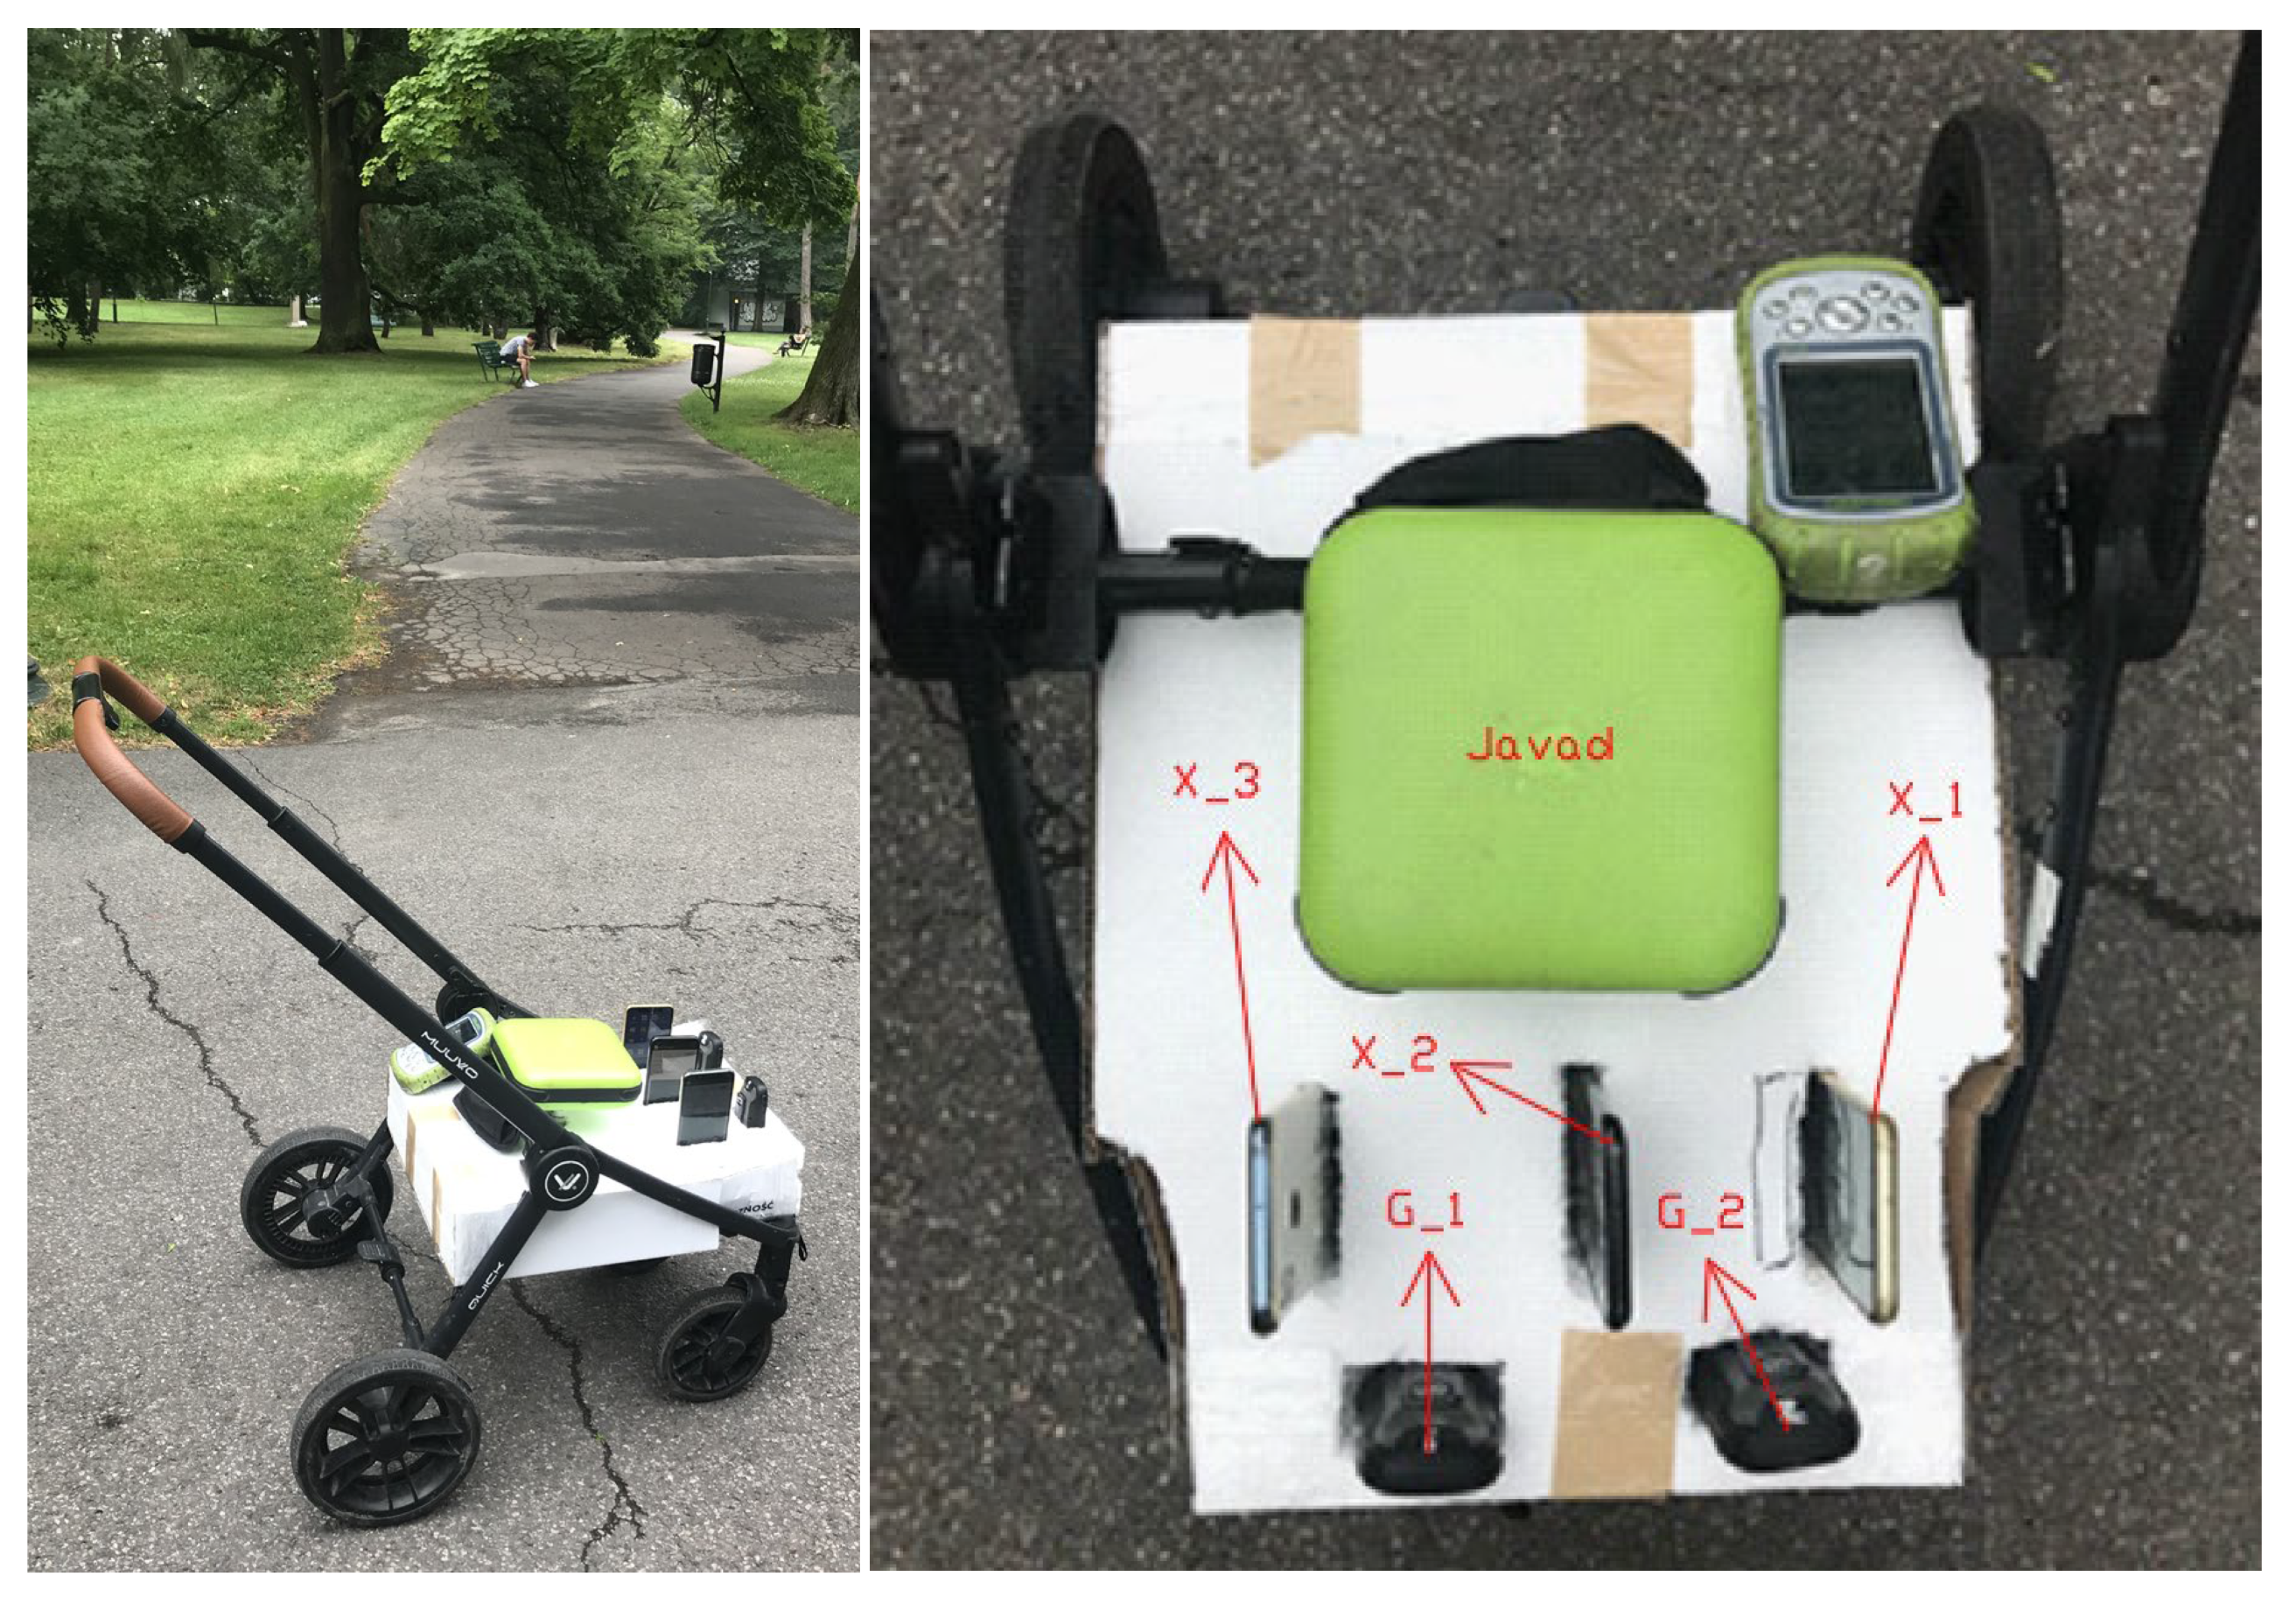
All survey instruments were located on a cart and stabilized in polystyrene in a vertical position at a distance of ~10–15 cm (Figure 3 right), which allowed them to be in a fixed position relative to each other and at a constant height relative to the terrain (Figure 3 left).
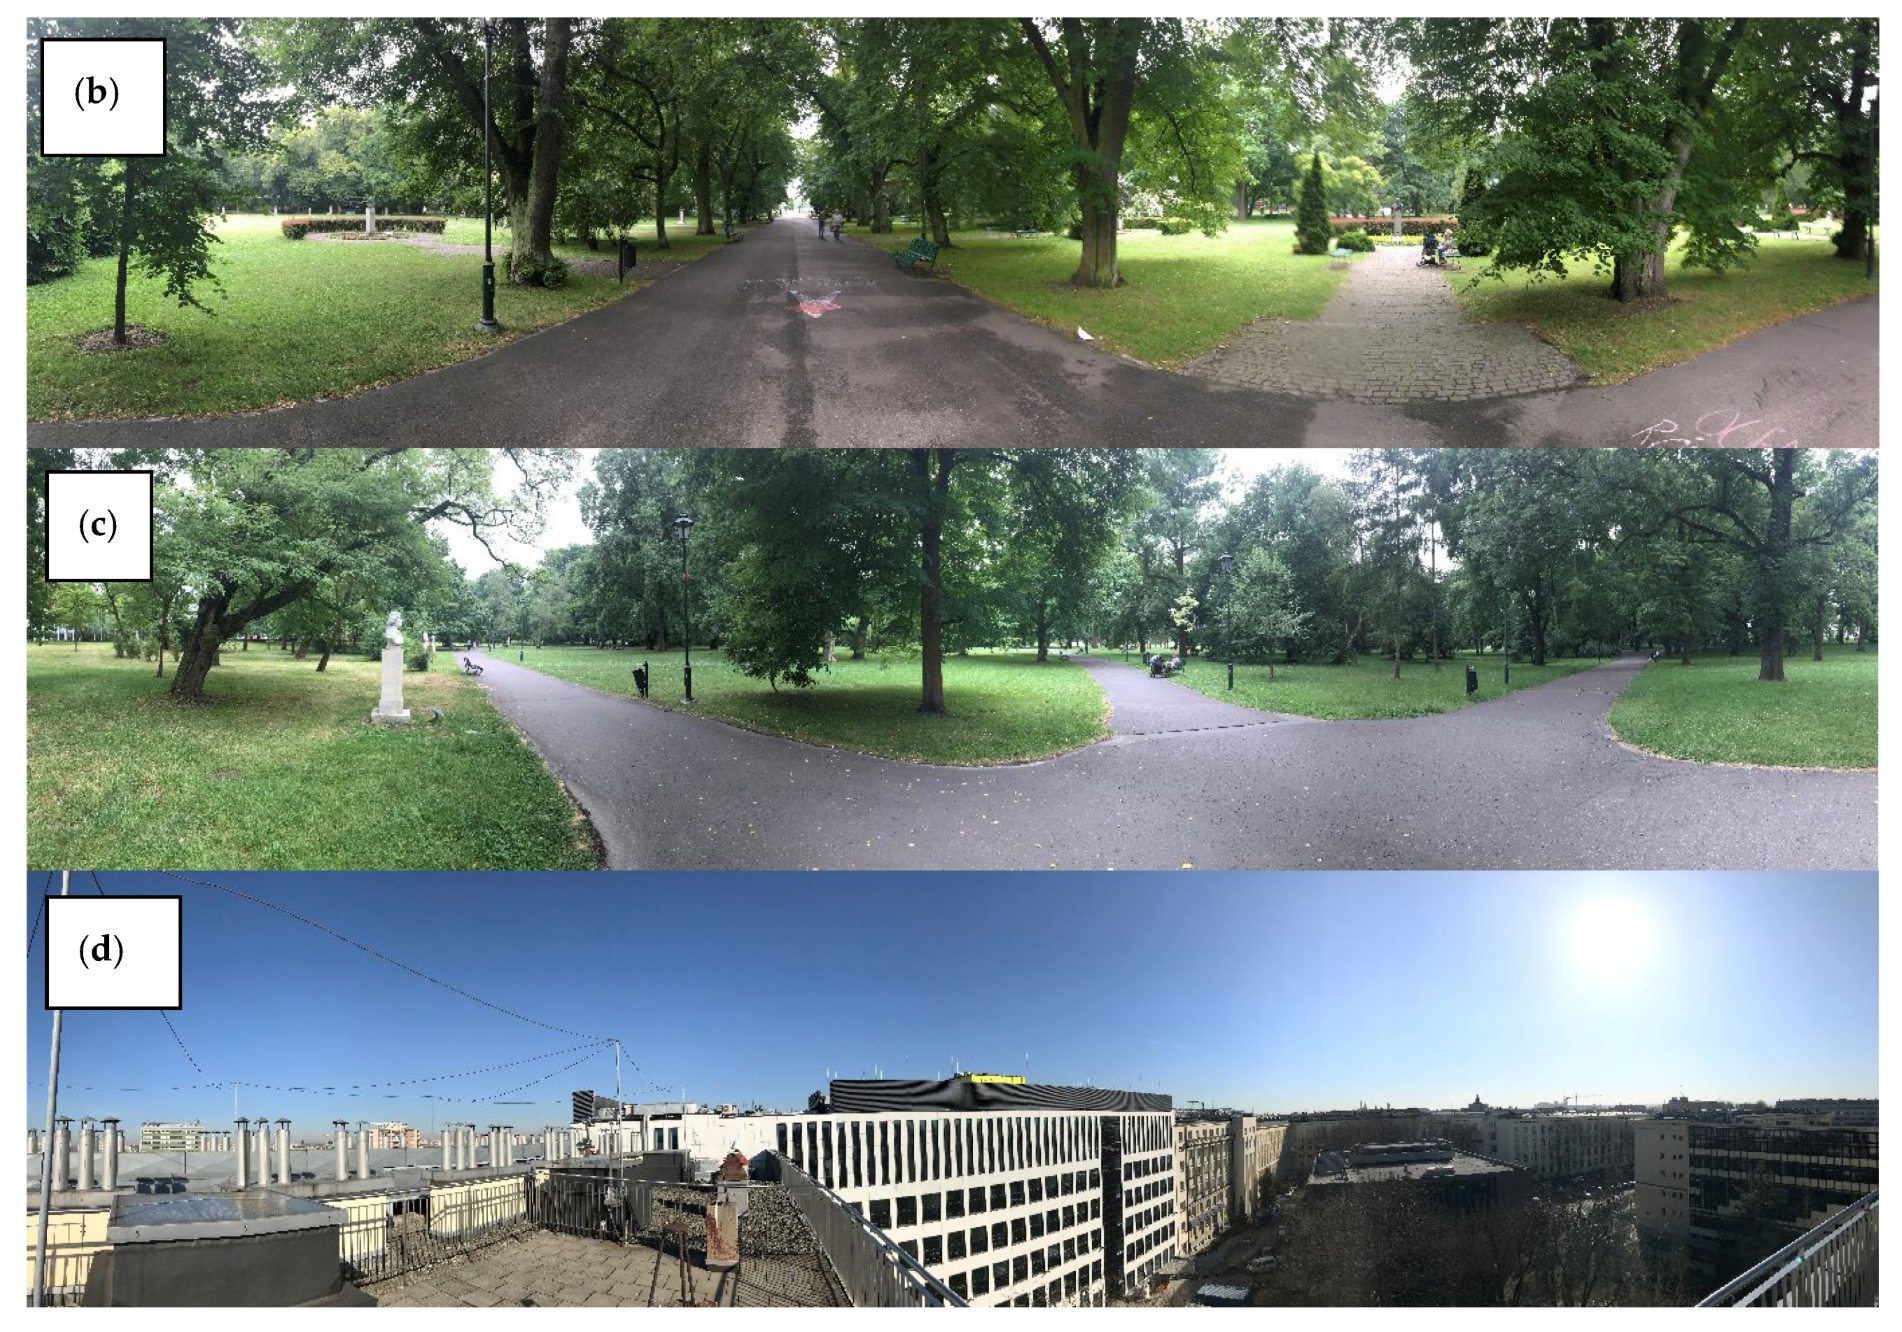
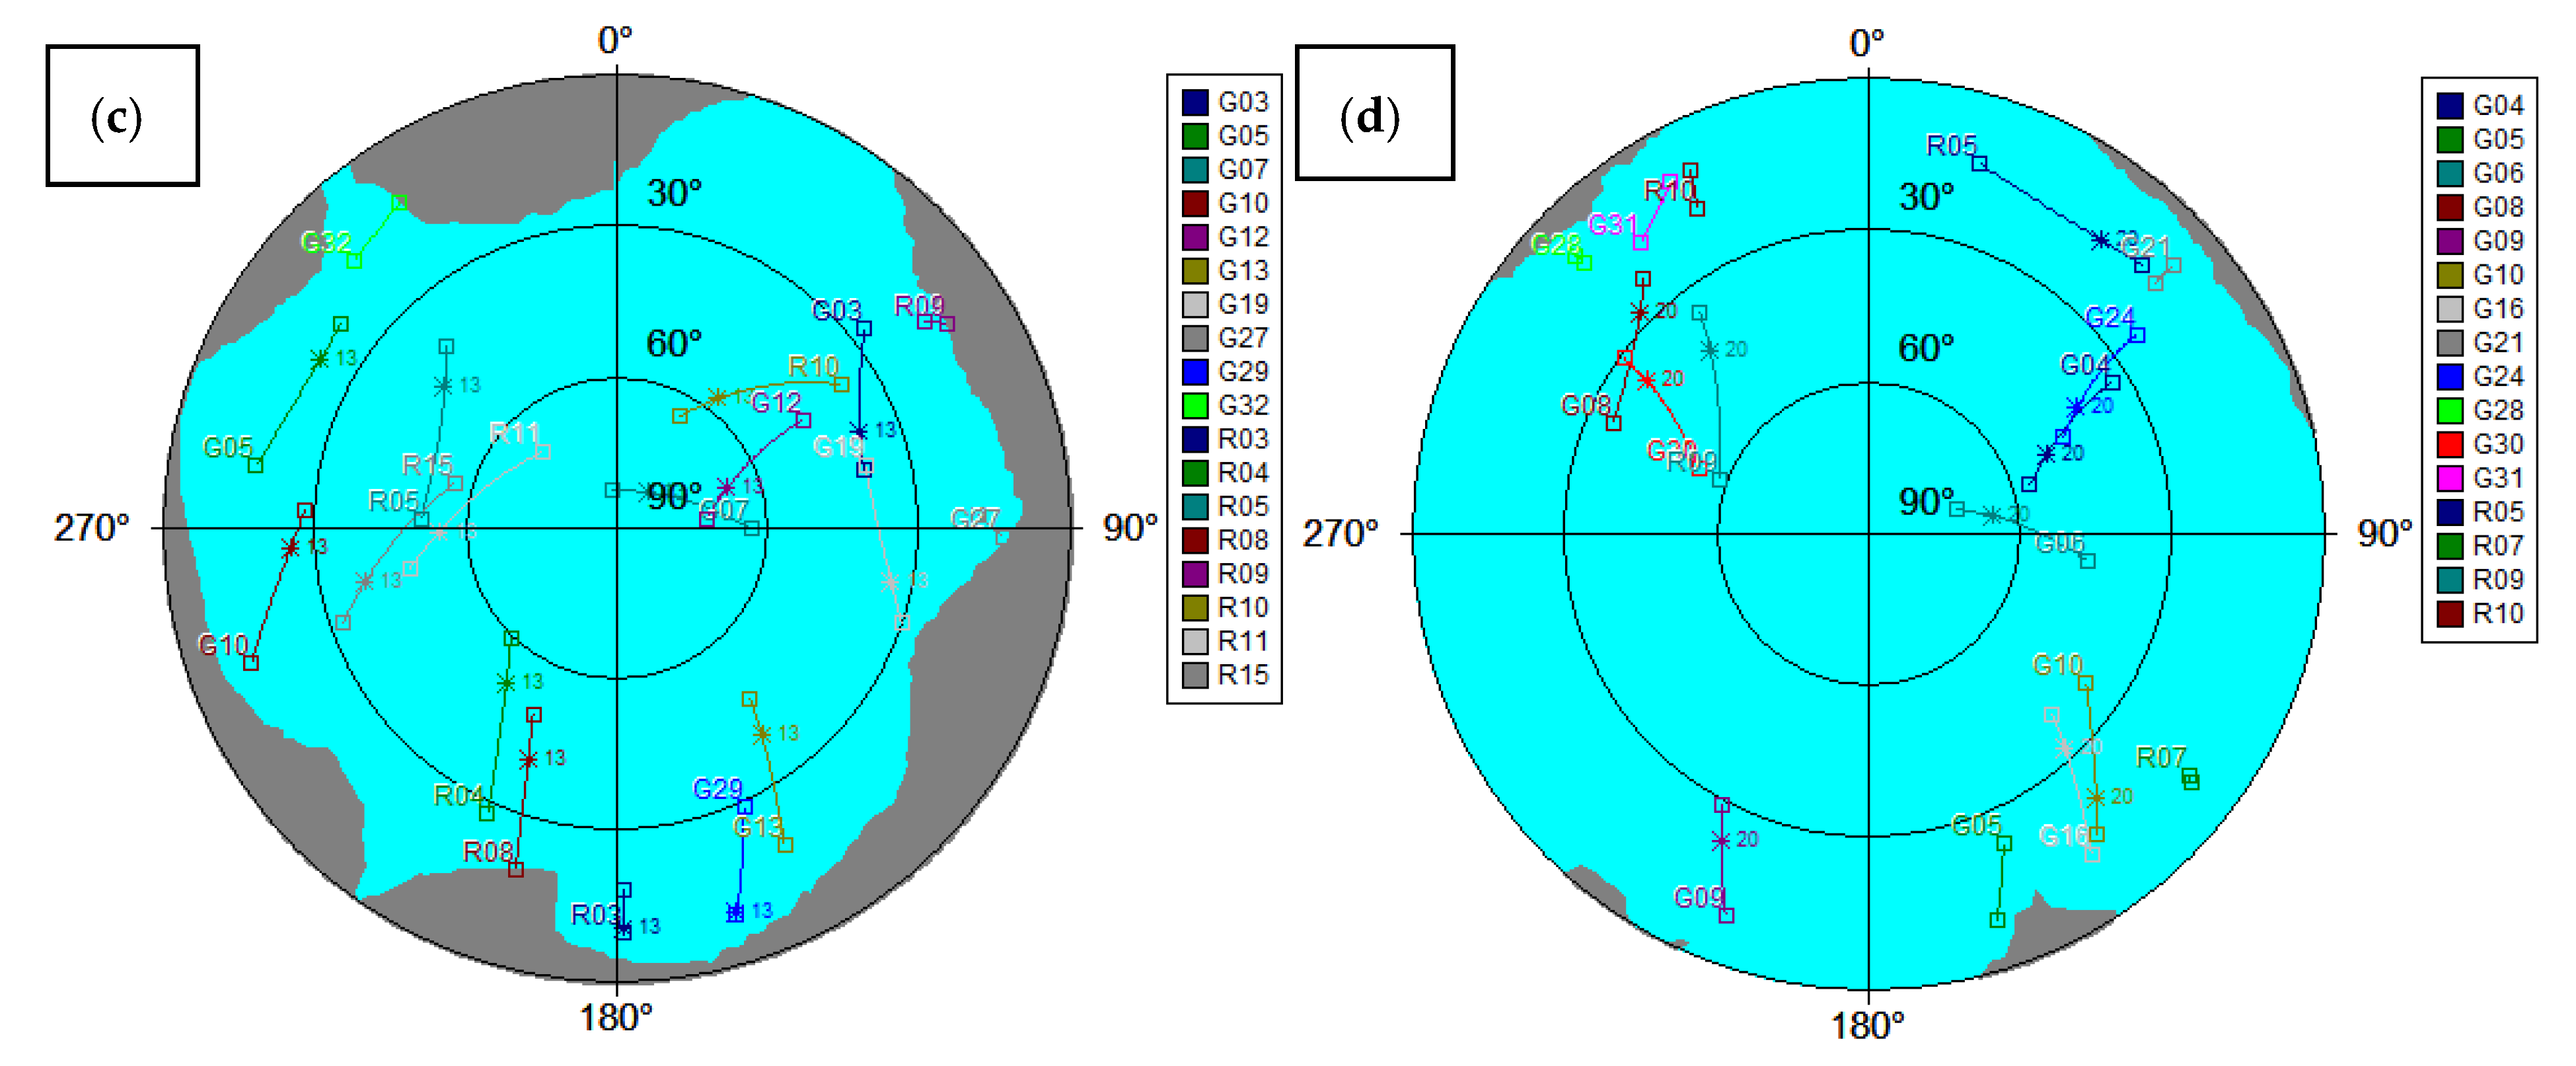
Figure 4 shows a panorama of each site where the measurement was performed and Figure 5 shows sky visibility conditions. The experiment was conducted on 3 test objects. These were a circle with a diameter of 35.5 m forming a surface object (yellow color, Figure 2), a line with a length of 100 m forming a linear object (orange color, Figure 2), and a point (red color, Figure 2), and each measurement lasted 20 min with an interval of 1 s. The circle was measured 10 times, the cart was driven along the line 20 times, while the measurement on the point lasted over 1200 epochs.
The results obtained from the RTK measurement were taken as a reference for further analyses. However, due to significant obscuration of the horizon, only some of the solutions were precise. In the case of the point, the obtained precise solutions were averaged, while for the line and the circle, on the basis of precise solutions, the geometric shape of these figures was determined, and the accuracy of coded solutions was defined as deviations from the line and the circle.
Measurement data from handheld receivers were obtained in gpx format and from phones in csv format. For each measurement object, a list of geographic coordinates was created in decimal format and in degrees/minutes/seconds format, which enabled faster implementation of further stages of work. The Javad receiver recorded geodetic coordinates in the WGS-84 system, while the other receivers recorded φ, λ geodetic coordinates in WGS-84 and elevation with respect to the EGM96 global geoid [37]. All receivers measured coordinates at epochs of measurement. First, geoid heights (H) from code receivers were converted to ellipsoidal heights (h) using the global undulation (N) calculator [38]:
h   =   H   +   N .  
The next stage of the work was the transformation of geodetic coordinates to coordinates in the XYZ system [39]:
X   =   R N   +   h · c o s φ · c o s λ . Y   =   R N   +   h · c o s φ · c o s λ . Z = 1     e 2 R N   +   h · s i n φ .  
where R N is the radius of curvature in the prime vertical and e . is eccentricity. For this purpose, the calculation program Transpol 2.06 was used. Then, the obtained Cartesian coordinates were converted into topocentric NEU according to the formula [40] for the ith number of observations (in this paper, this is ~1200—20 min with a 1 s interval):
[ N E U ]   =   [ sin φ i cos 𝜆 i sin φ i sin 𝜆 i cos φ i sin 𝜆 i cos 𝜆 i 0 cos φ i cos 𝜆 i cos φ i sin 𝜆 i sin φ i ] [ d X i d Y i d Z i ]
where d X i   =   X i     X ¯ , d Y i   =   Y i     Y ¯ , d Z i   =   Z i     Z ¯ ; X ¯ , Y ¯ , and Z ¯ are reference coordinates from RTK measurement; and X i ,   Y i ,   Z i are consecutive coordinate components generated by smartphones or handheld receivers.

4. Results

The obtained fixed solutions were characterized by deviations at the level of 2 cm for the horizontal component and 5 cm for height, so for further analysis, they were assumed as error-free; due to the lower accuracy of the remaining receivers by about 2 orders of accuracy, all measurement points acquired from code receivers were used for analysis. For each of the solutions, deviations in the horizontal components (NE) and a line graph of changes in the height ccomponent (U) were presented from the precise RTK solutions for Garmin receivers. In order to best compare the solutions against each other, the scale in each figure of the NE and U deviations was the same. Moreover, the authors did not find relations between specific models of the antenna in results.

4.1. Point

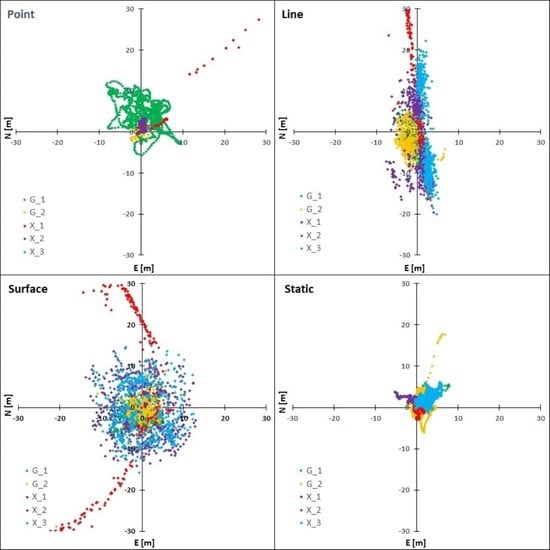
Figure 6 shows the deviations in the NE components for each of the five receivers. The handheld receiver G_1 (GPS) did not exceed 13 m in the code solution for the E component, while the values for the N component were within 10 m. The measurement points were very unevenly distributed. For the G_2 (GPS+GLONASS) receiver, the accuracies presented themselves more consistently, the points were in close proximity to the center of the coordinate system, and both for the NE components, the values did not exceed 3 m. Differences in the G_1 and G_2 might be the effect of the number of visible satellites during measurement. G_2 also registered GLONASS signals; thus, this receiver registered almost twice as many satellites as G_1, which was clearly visible in the obtained accuracy. The solutions obtained from the smartphones were significantly more accurate. The X_1 receiver started recording data with poorer accuracy (from 4 to 6 m), but after a minute, the measurement stabilized to 2.5 m for the N component and to 1 m for the E component. This receiver had quite large single deviations, exceeding even 15 m by the end of the measurement. Smartphone X_2 obtained deviation values close to 1 m for both components, but this value increased to 3 m for the E component in the middle of the measurement. Receiver X_3 recorded one measurement point located at a distance of 2 m for the N component and 1.4 m for E from the reference point. In the case of the point measurement, the worst accuracy was obtained by the handheld receiver G_1 based only on the GPS signal. A significant part of the obtained deviations of the NE components were values in the range of 6 to 13 m. Compared to the G_2 receiver, which used the GPS+GLONASS mode, one can notice the lack of consistency of the data with respect to each other. The point measurement using cell phones proved to be more accurate compared to the Garmin receivers. The results obtained were very similar for all the smartphones tested. The dominant values did not exceed 3 m. The worst results were obtained by the X_1 phone due to the occurrence of single errors with values greater than 15 m.
In the determination of the elevation component using the G_2 (GPS+GLONASS) handheld receiver, it received slightly better accuracies than G_1 (GPS), but the difference was small (Figure 7).
For the G_1 receiver, the deviation was in the range of 7 to 11 m, while for G_2, the range was from 7 to 9 m. For both measuring instruments, the error was constant. When measuring on a point, the receiver operating in GPS+GLONASS mode obtained better accuracies for both NE and U component deviations compared to G_1 based on GPS mode.

4.2. Line

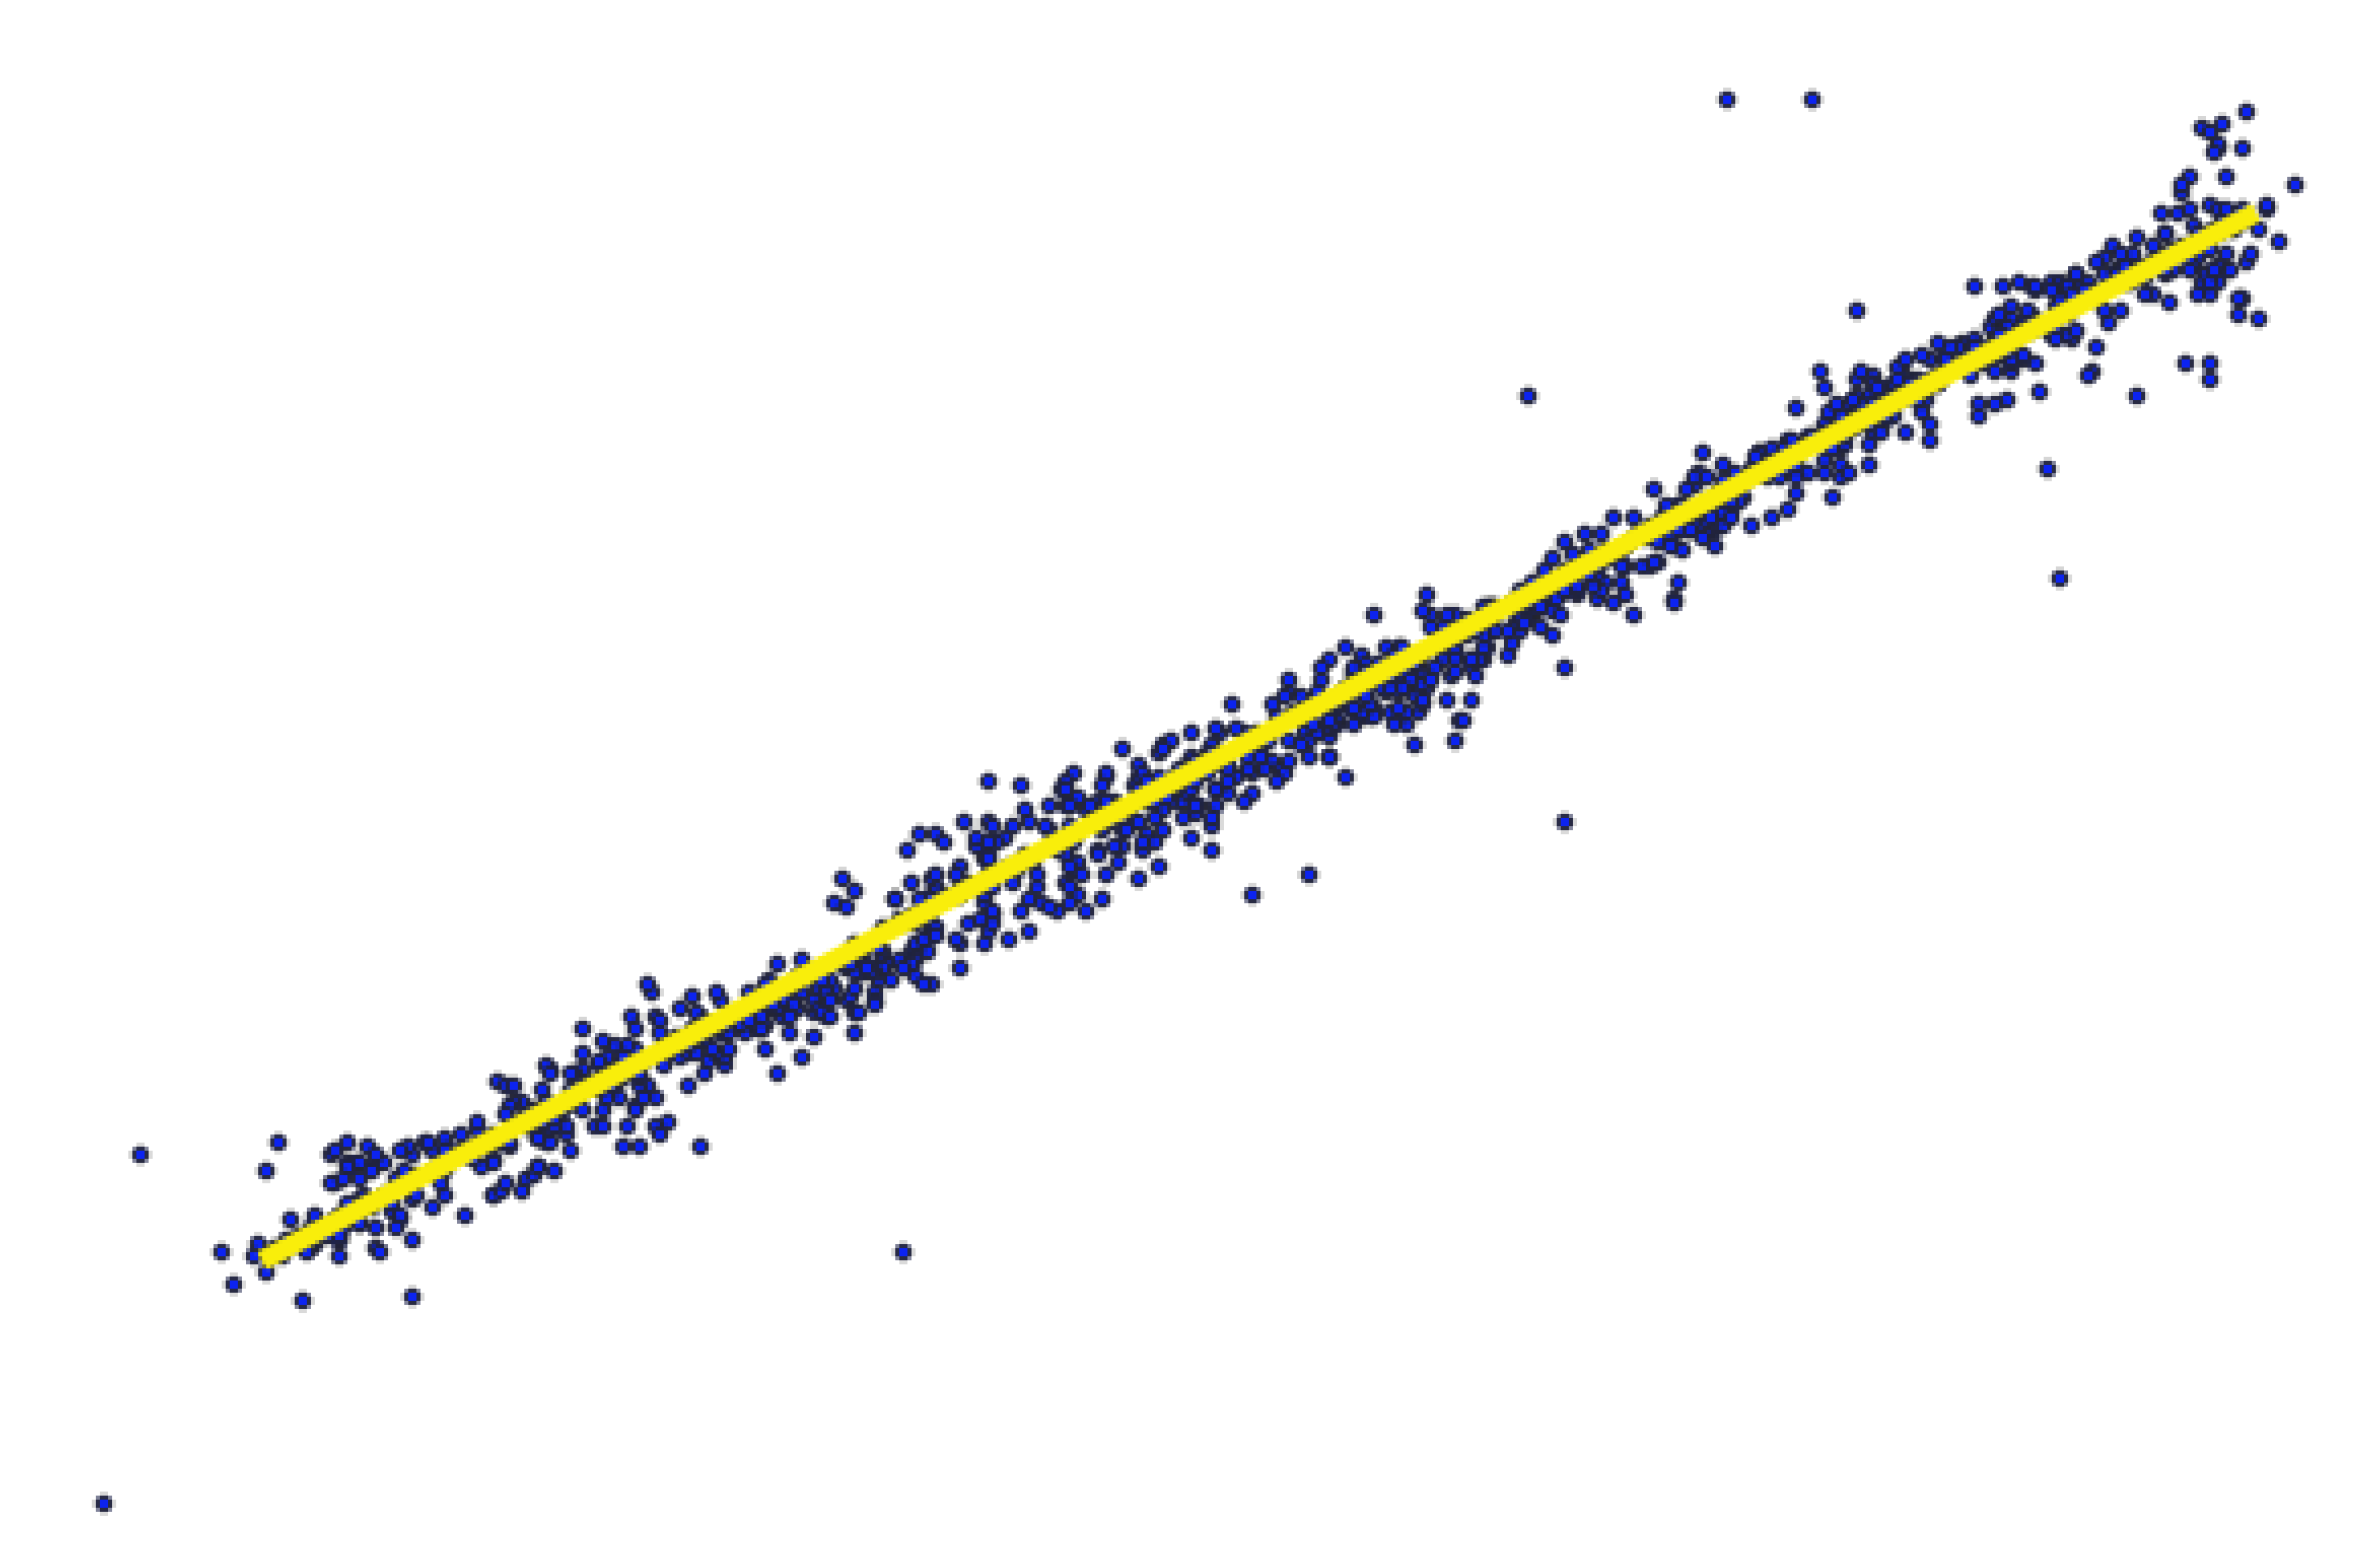
The calculation result of survey points from the surveying instrument was uploaded into QGIS 3.16.14 software and a straight line was fitted (Figure 8). As a result of the interpretation of the accuracy of the measurement points, the straight line was fitted based on the precision solutions.
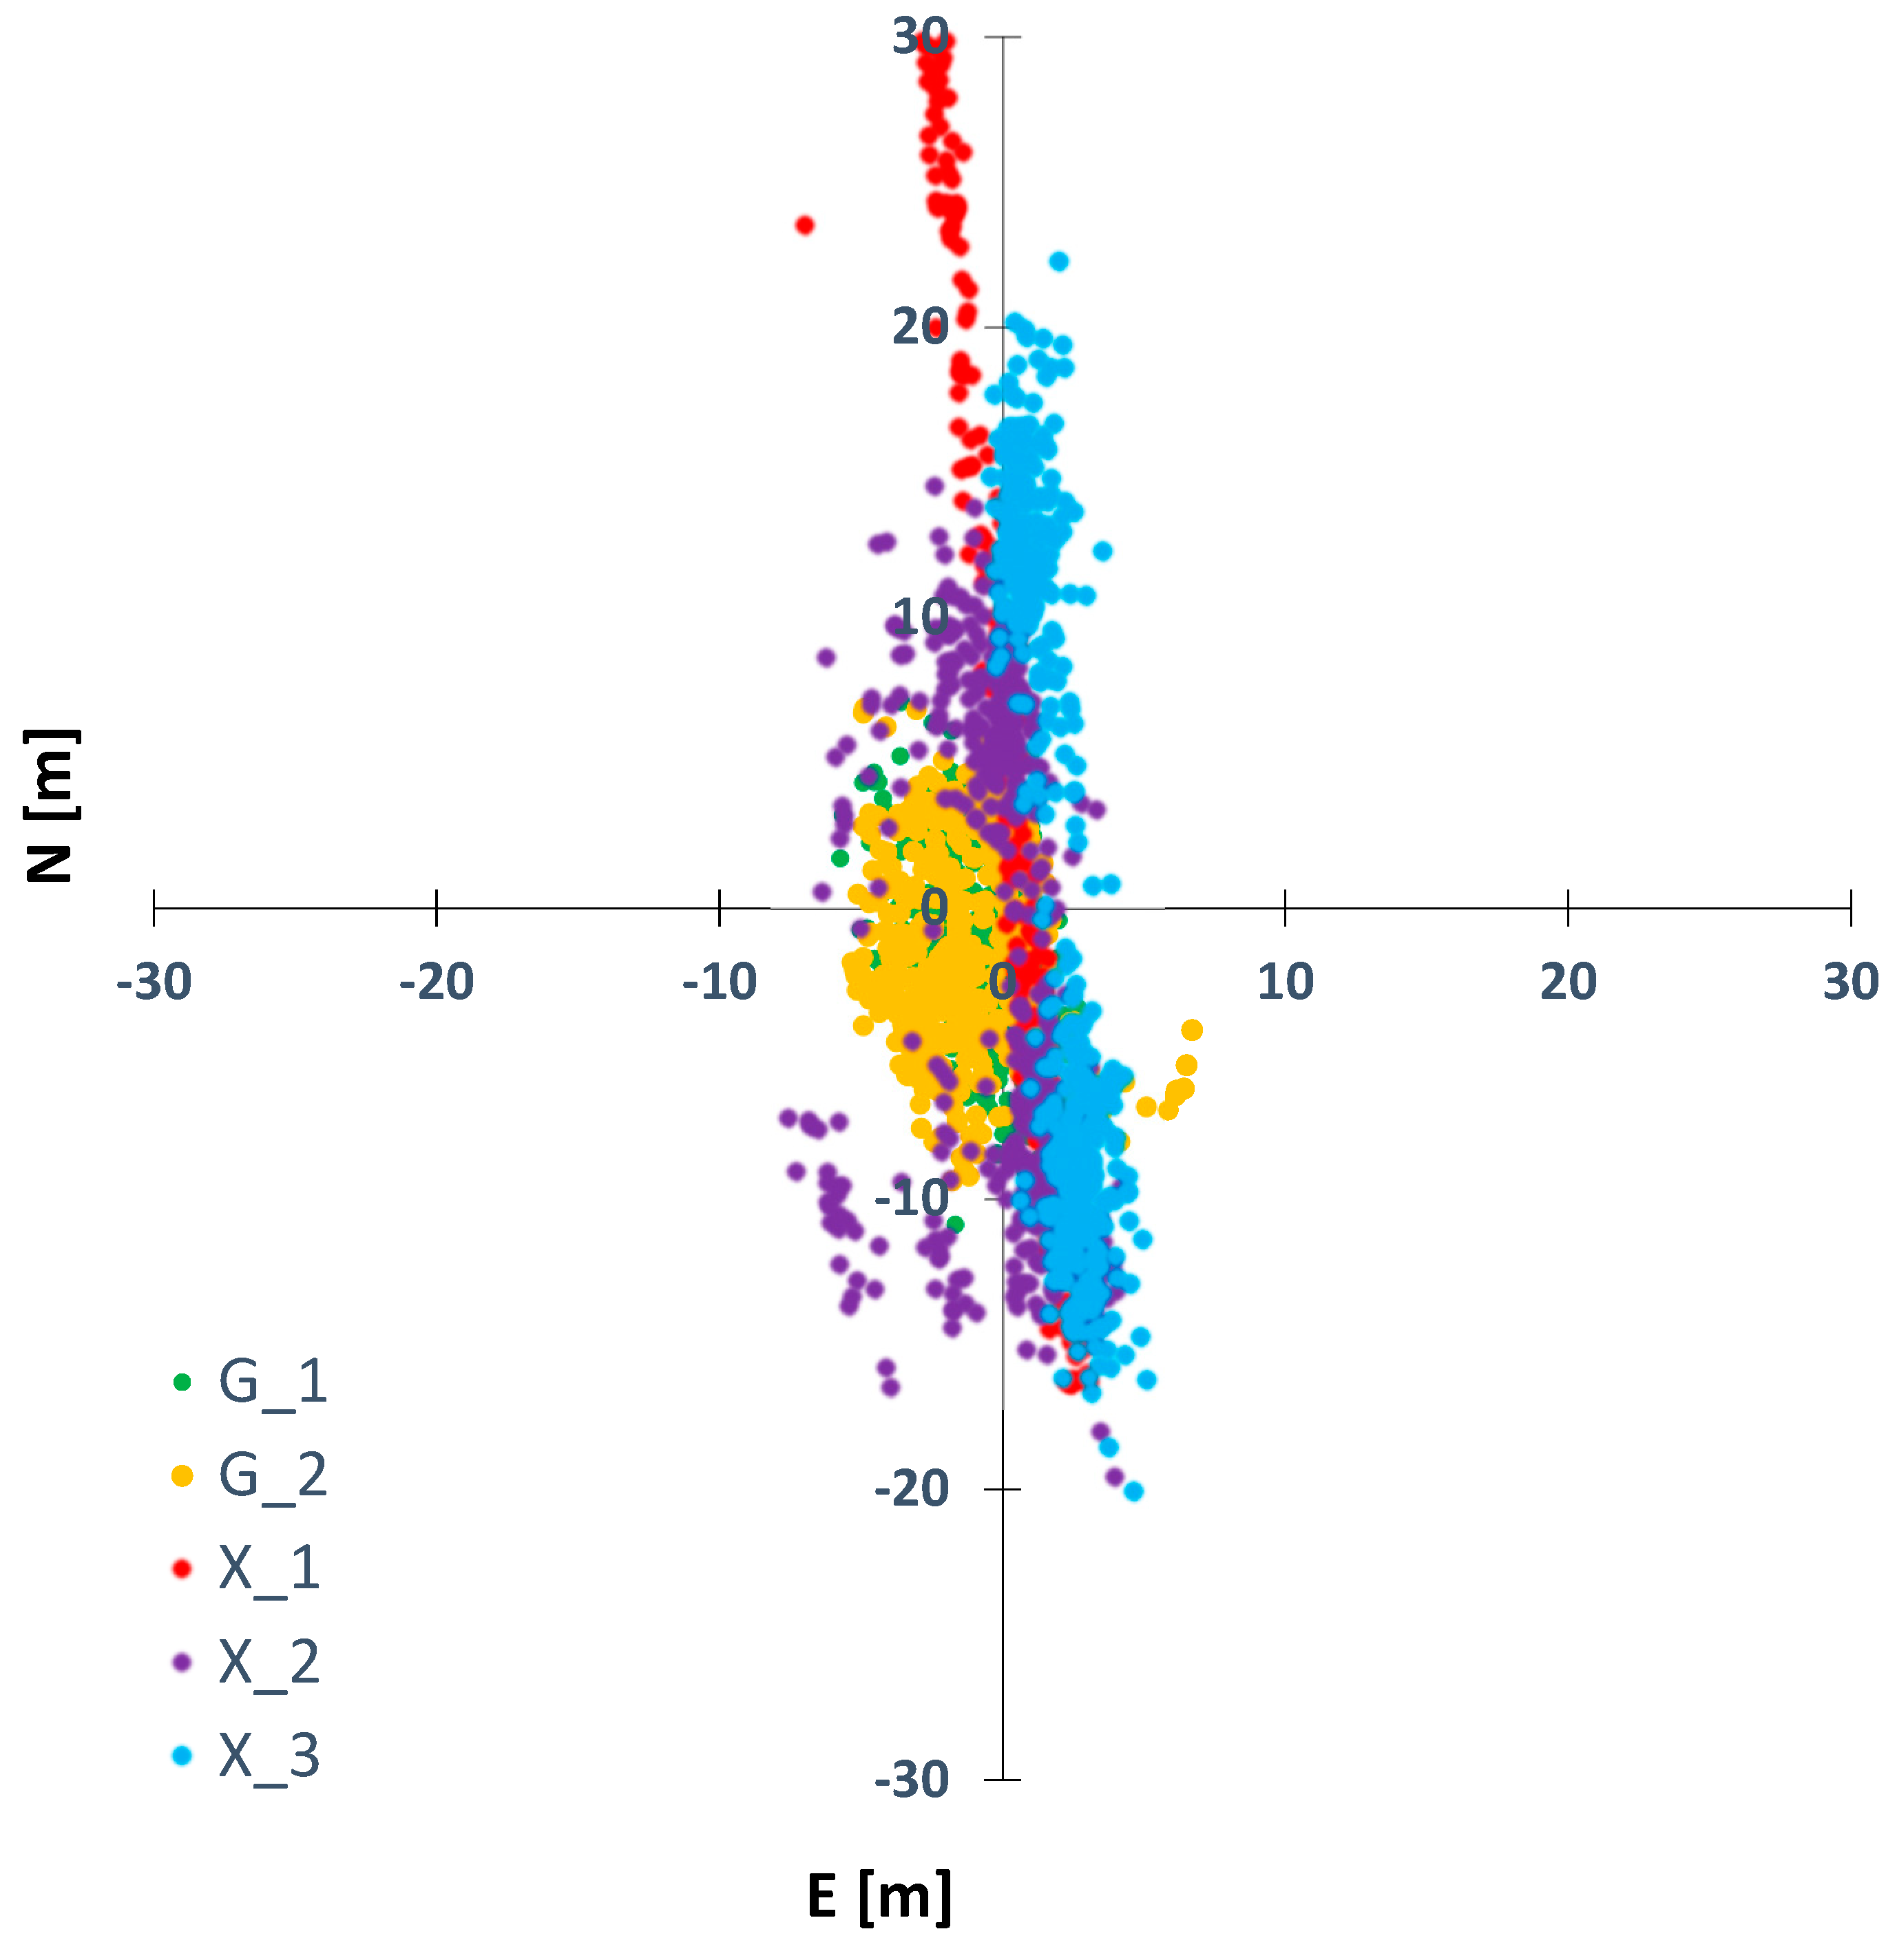
After exporting the reference points, we proceeded to determine the NEU components deviations analogously to the point measurement. Figure 9 shows the deviations in the NE components for each of the five receivers. As a result of the analysis, it was noticed that for the N component, the best accuracy was achieved by the G_2 receiver using the GPS+GLONASS mode. These values were within a 10 m range. For the G_1 receiver, the accuracy did not exceed 11 m. It was observed that smartphone X_1 lost the signal after one minute of measurement and recorded the coordinates that were saved last until the end of the test. Phone X_3 achieved deviations within 19 m, while smartphone X_2 achieved deviations up to 17 m. When measuring a straight line in motion, it was noted that the Garmin receivers produced more consistent results relative to each other than when measuring a point. The graphs were very close to each other. After in-depth analysis, we observed weaker signal receptions for all five receivers at 12:22:32, where error values increased several times for the NE components. For the deviations in the E component of the linear measurement, smaller discrepancies in deviation values were observed than for the N component. The best accuracy was determined by smartphone X_3, whose values did not exceed 5 m. Phone X_2 obtained deviations in the E component in the range of 7 m. Both the Garmin G_1 and G_2 receivers obtained values within 7 m. The values of the E component deviations of the handheld receivers were very similar to each other. In the case of X_2 and X_3 telephones, the similarity of the graphs could be noticed, but divergences appeared at the end of the measurement.
When analyzing the U-component deviation plot of the linear measurement (Figure 10), large error values were noted for receiver G_2. The loss of the signal near 12:22 resulted in the registration of several times larger errors for both devices.
In the case of the G_1 instrument, the error values were within 12 m, while the deviation range of the G_2 receiver was from 28 to 55 m. When determining height on the move, better positioning capability was guaranteed by the receiver using the GPS system (G_1) compared to the receiver using the GPS+GLONASS mode (G_2), which was characterized by a systematic shift.

4.3. Surface

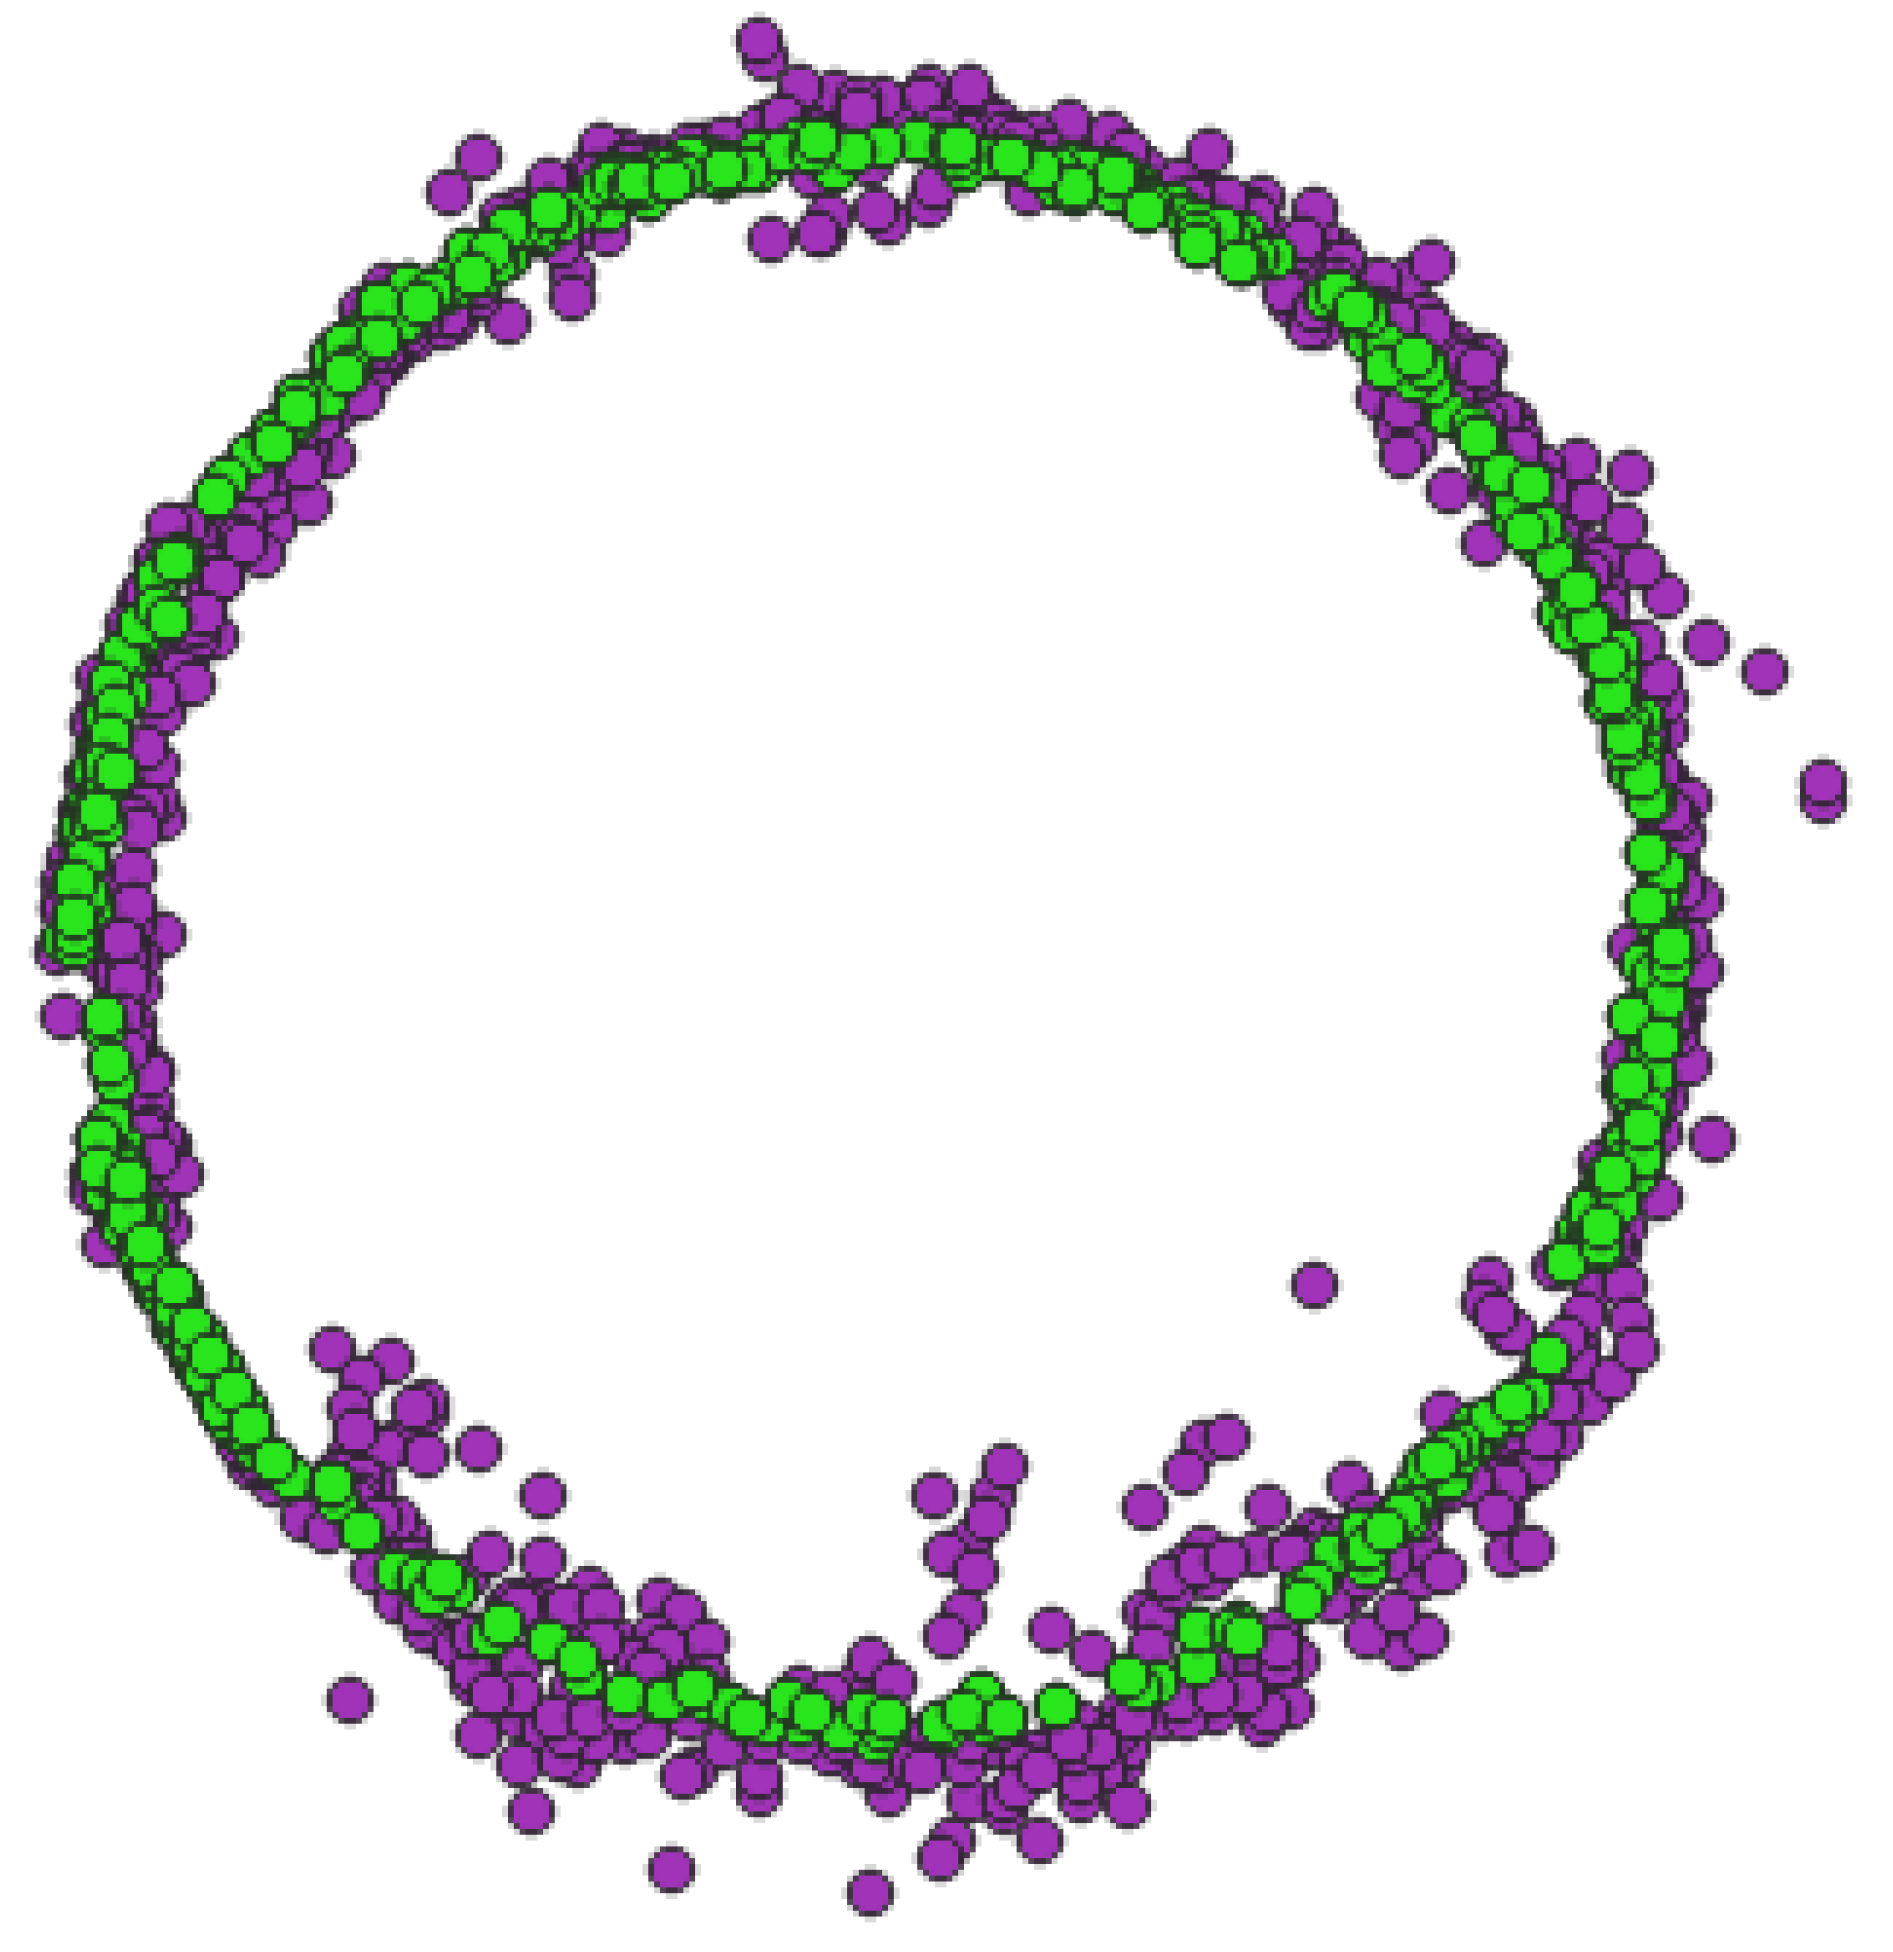
The result of calculating the measurement points from the surveying instrument was loaded into the QGIS 3.16.14 program. As a result of interpreting the accuracy of measurement points, the average value of the circle radius (35.5 m) and the coordinates of the theoretical circle center were calculated based on precise solutions. Considering the conditions and execution of the measurement in motion, a range of ±0.5 m was assumed from the determined (based on the calculated radius and coordinates of the center of the circle) line forming the circle, in which the comparison points should be located. The points were selected to represent the accepted geometric figure of the surface measurement (Figure 11).
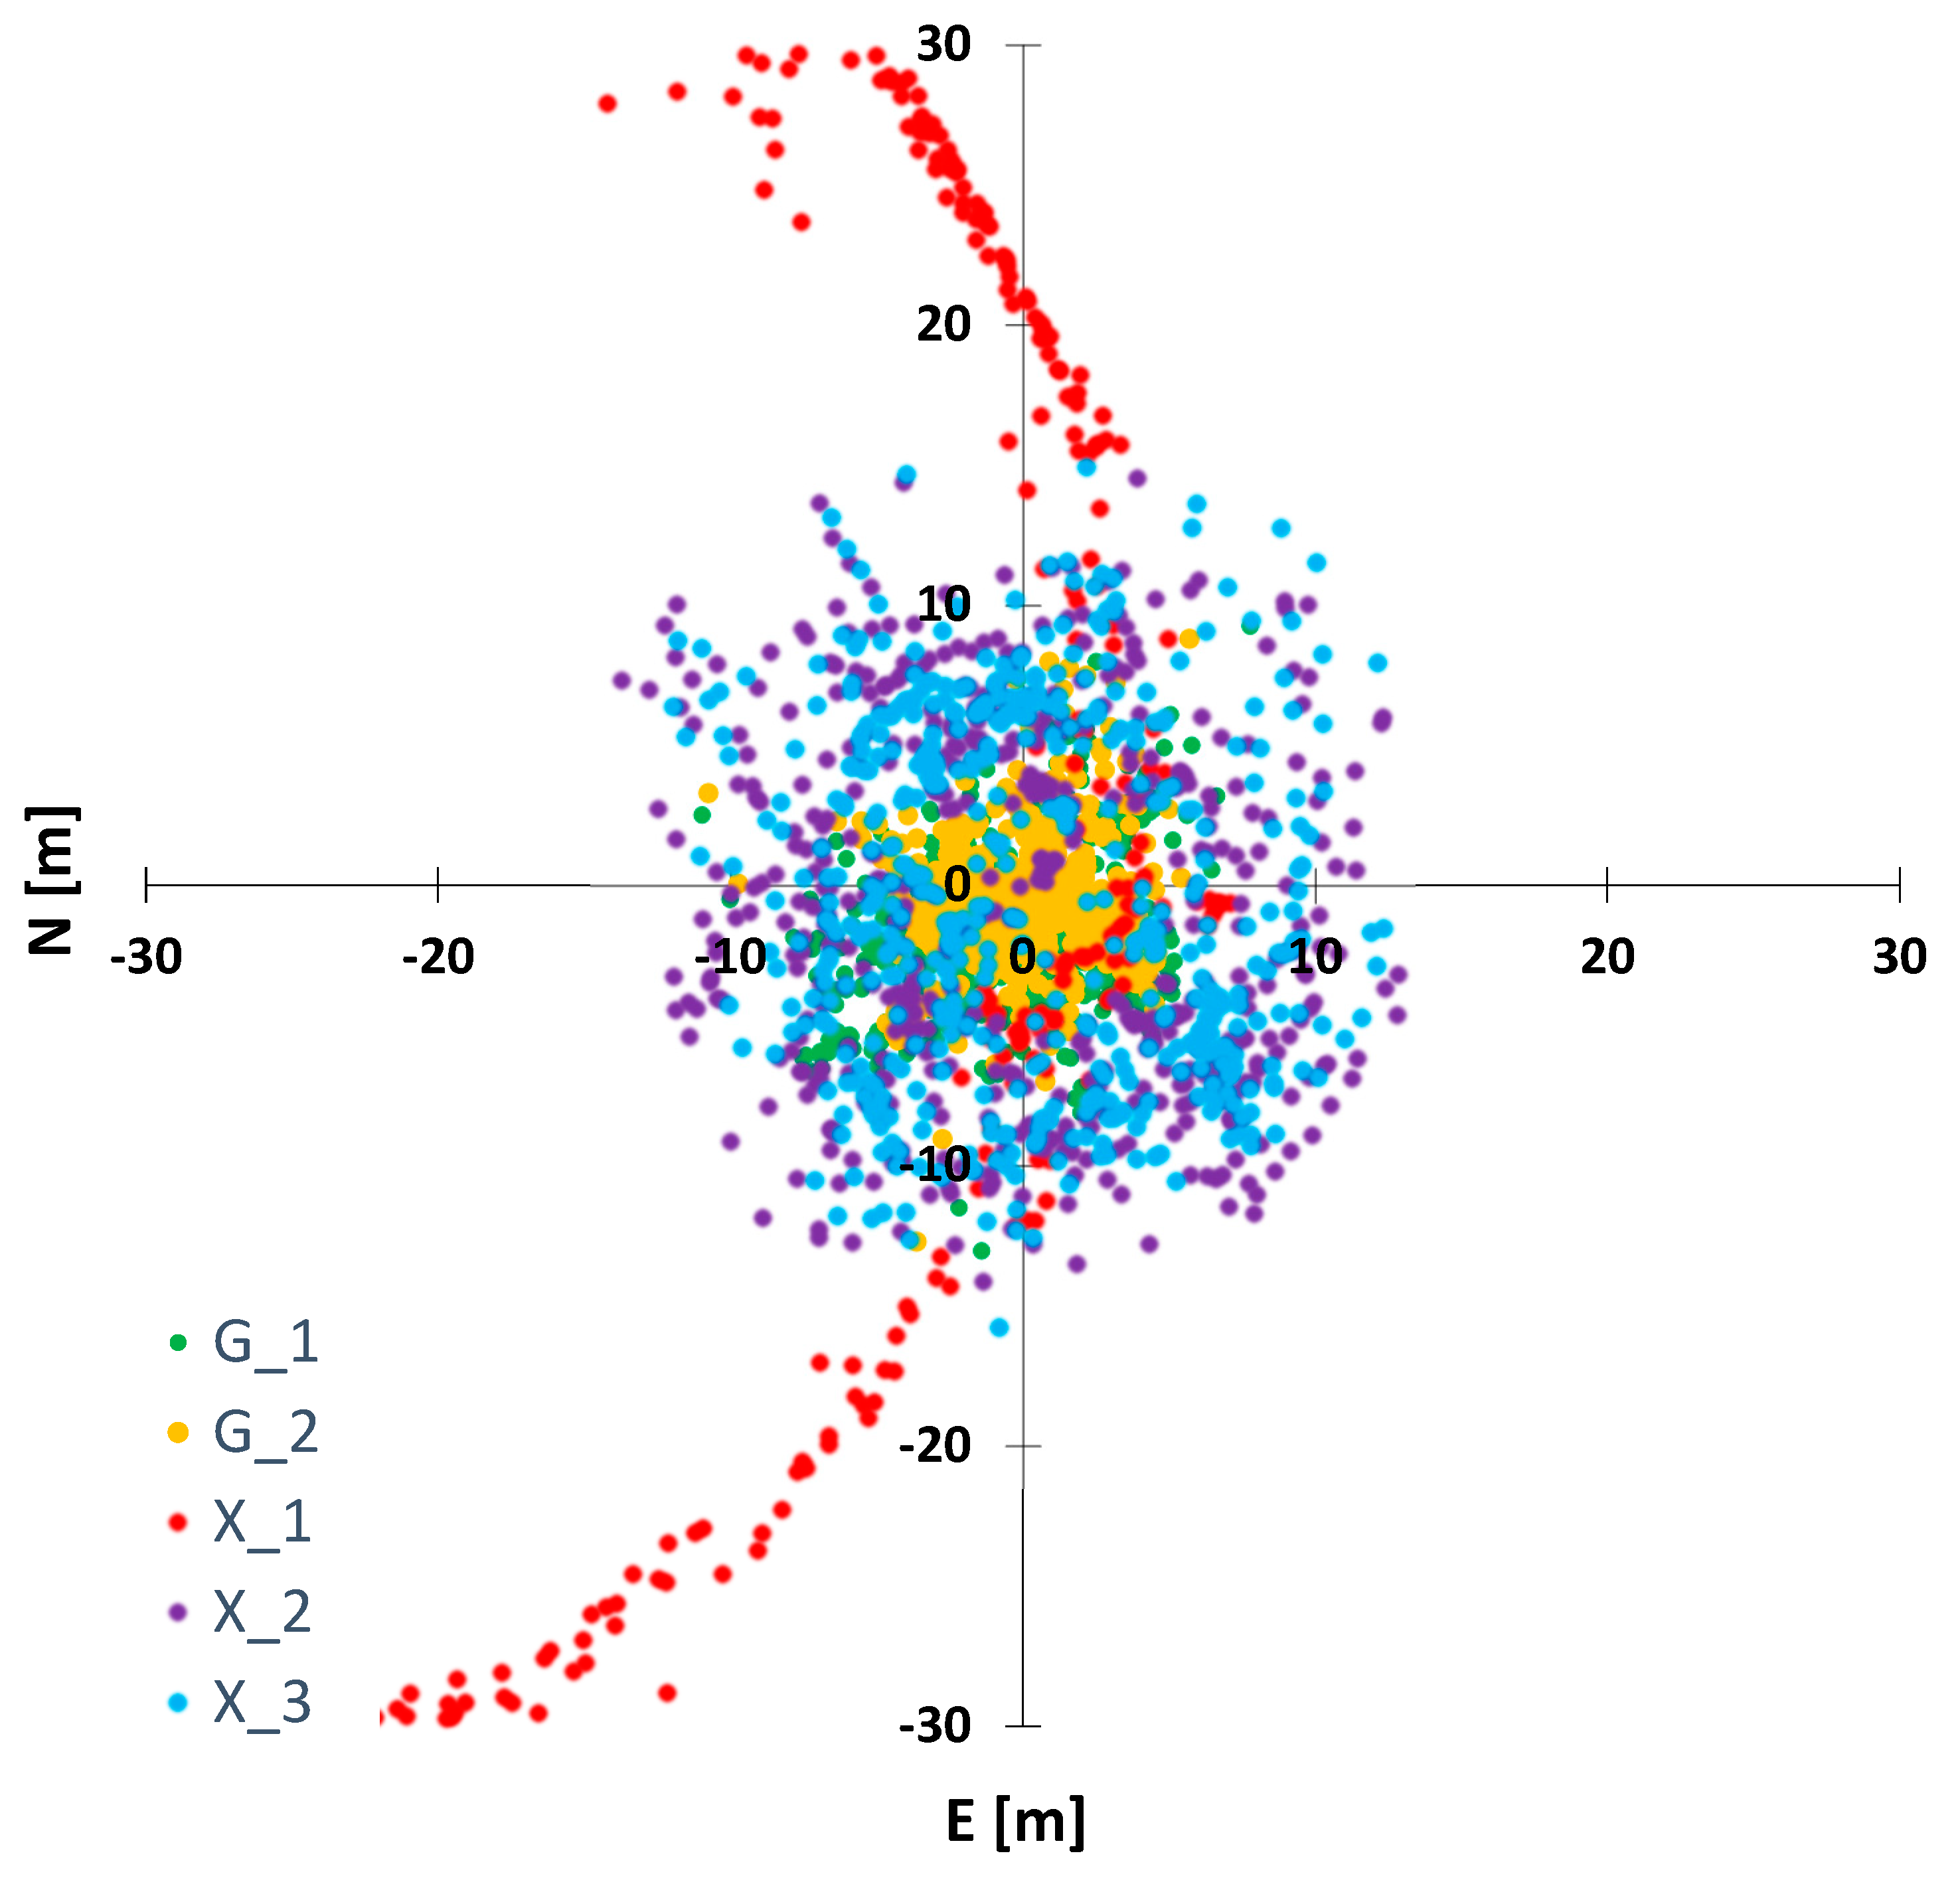
After exporting the reference points, we proceeded to determine the NEU components analogously to the point measurement. Analysis of Figure 12 shows a plot of NE components deviations for the 5 code receivers in which similar accuracies between the handheld receivers were noted. It was observed that smartphone X_1 lost signal after one minute of measurement and recorded the same last recorded coordinates until the end of the survey. The G_1 receiver using the GPS measurement mode was positioned with an accuracy of 9 m for the N component and 8 m for the E component, while the G_2 receiver equipped with the GPS+GLONASS signal recorded horizontal coordinates with an accuracy of 8 m for the N component and 6 m for the E component. Comparing the graphs of G_1 and G_2, one can see the consistency between the handheld receivers in determining the horizontal coordinates while measuring on the move. Phone X_2 obtained deviation values of the N component not exceeding 15 m and of the E component not exceeding 13 m. Smartphone X_3 recorded data with an accuracy up to 15 m, although values less than 9 m for the N component prevailed, and this phone was within 12 m for the E component. The cell phone plots were not consistent with each other, the points could be described as highly scattered, and the accuracies were variable over a short time interval.
When analyzing the U-component deviation plot of the surface measurement (Figure 13), large error values were observed for receiver G_2, which ranged from 25 to 54 m. Receiver G_1 recorded data with an accuracy of 14 m, except for one larger error that reached 25 m. During altitude determination, a better measurement capability was guaranteed by the receiver using GPS (G_1) compared to the receiver using the GPS+GLONASS mode (G_2). This means, as in the measurement across a line (Section 3.2), that in a moving receiver, GLONASS signals underestimated the accuracy, causing artefacts up to even 50 m.
Table 2 shows a statistical summary of obtained accuracies and deviations. The bias is a mean of absolute difference between coordinates gathered by the receiver vs. the RTK result at the same point, according to the equation:
b c   =   i   =   1 n r i     RTK i n .  
where b c is the bias, c   =   N , E ,   or   U   are coordinate components, r i is the coordinate value gathered by either smartphone or handheld receiver, RTK i is the coordinate component gathered from RTK mode, and n is the number of the coordinates. The deviations were calculated as the mean, absolute value of the deviation from the RTK measurement.
σ c   =   i   =   1 n r i     RTK i 2 n .  
where σ c is the standard deviation.
As a result of the analysis of Table 2, it was noted that during the measurement of the point, the smallest average error of the N component with a value of 0.6 m was obtained by the X_2 phone, the E component with a value of 0.9 m by the G_2 receiver, and the standard deviation of the NE components was obtained by the X_2 phone (0.0 m). The recorded data by receiver G_1 had the largest mean error and standard deviation of the E component. A significant difference was observed between the accuracies of handheld receivers operating in two modes (GPS+GLONASS and GPS). Instrument G_2 (GPS+GLONASS) recorded data with a lower mean error of NEU components and better accuracy in comparison to receiver G_1 (GPS).
Smartphone X_1 positioned the user with an error of 1 to 3 m (NE) and a bias of 2.5 m. Phone X_2 determined horizontal coordinates with an error of approximately 1 m. Phone X_1 lost signal during the linear and surface moving measurements, so its errors ranged from 20 to 43 m for horizontal coordinates. When analyzing the average errors and bias of the linear measurement, the best results were observed for receiver G_1. For the N component, the error value was 3.0 m and the standard deviation 2.5 m, while the error was 1.4 m and the standard deviation was 1.1 m for the E component. The G_2 receiver obtained better results when measuring a point and a circle (1.9 m error for NE components) compared to the G_1 receiver (2.6–2.8 error for NE components), but during height determination on the move, the Garmin receiver using only GPS provided less error. During measurements on the move, mobiles X_2, X_3 determined horizontal coordinates with a similar error and standard deviation.

4.4. Static Session

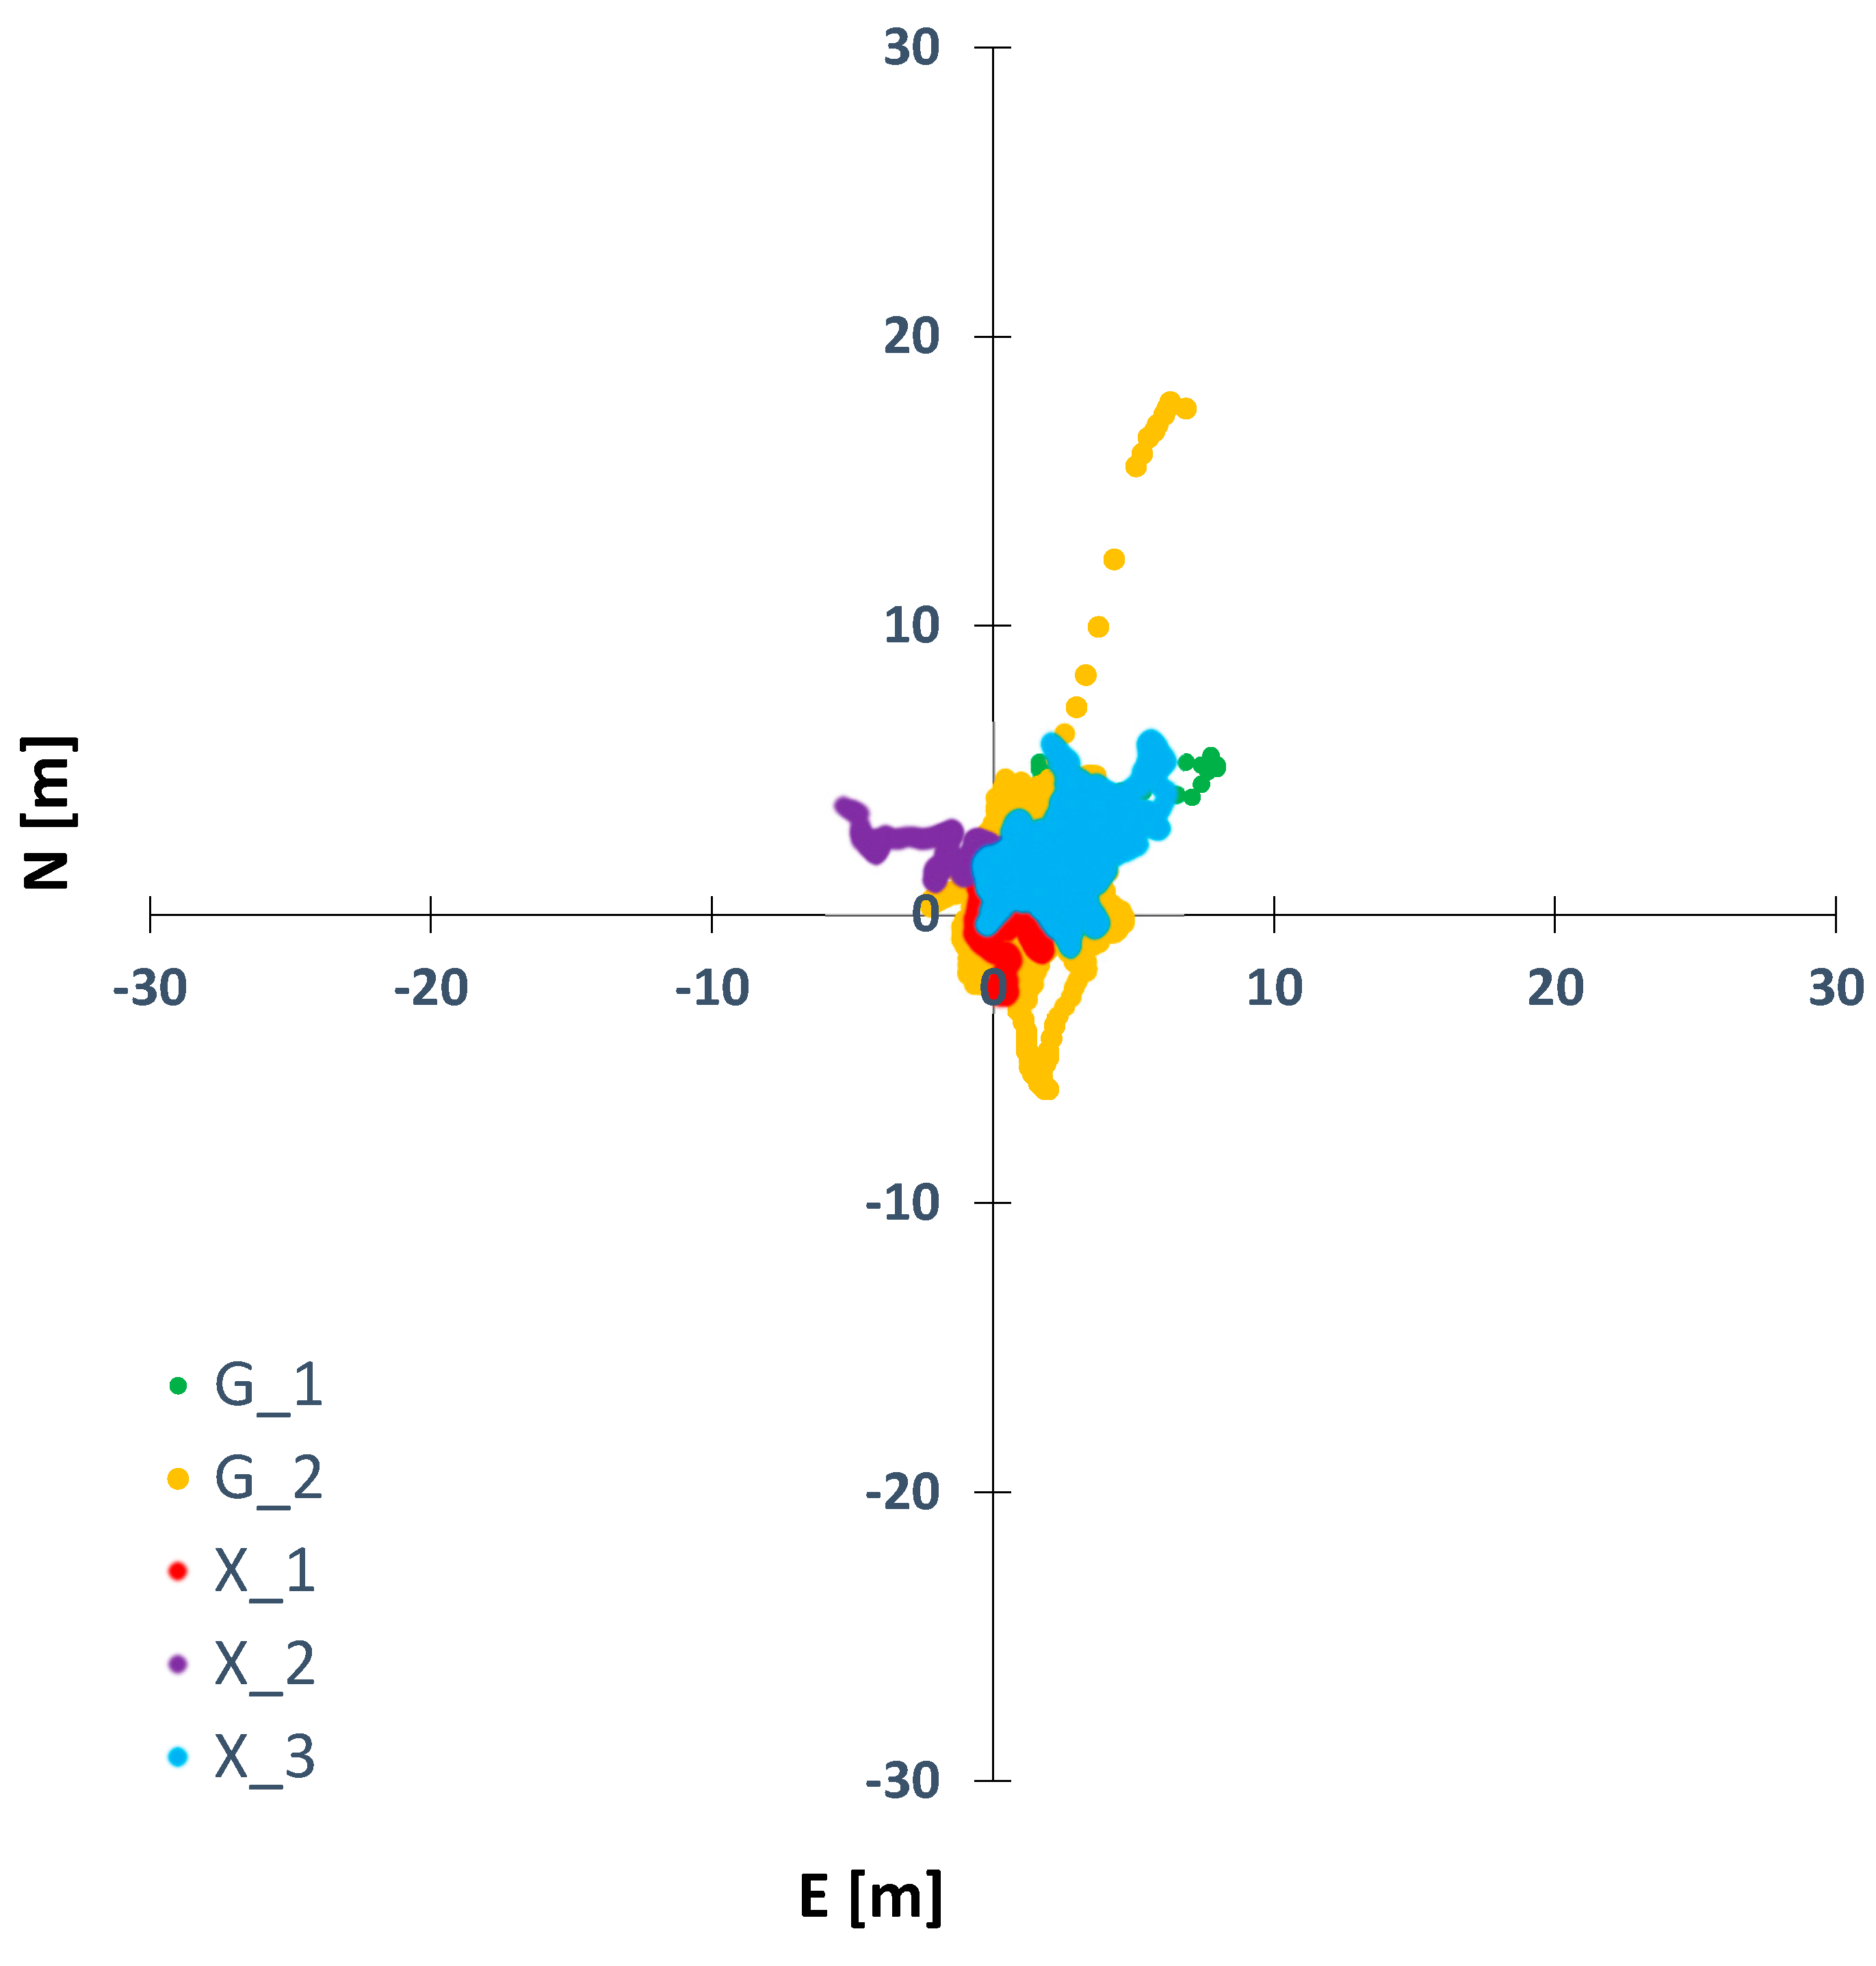
Figure 14 shows an NE graph of the static session on the roof of a building with almost perfect sky visibility conditions (Figure 4d). The true (known) position of the antennas was determined in the same way as in Section 4.1, Section 4.2 and Section 4.3 by using RTK mode on the roof of the building; the coordinates were 50°03′58.54″N, 19°55′13.36″E, 227 m. In the case of the G_2 receiver, some of coordinates had an error larger than 10 m. For better interpretation, the scales of Figure 14 and Figure 15 are the same as the corresponding graphs in Section 4.1, Section 4.2 and Section 4.3. Moreover, the accuracy of G_1 and the smartphones were very close each other.
Figure 15 shows the height error of the Garmin receivers. In this case, the G_1 receiver accuracy varied between −25 m and 25 m of error, while the G_2 error was stable, but much larger, around 40–45 m for the whole period.
This shows how, in this kind of handheld receiver, good initialization is important, in this measurement disturbed by high sky obstructions, which particularly affected the G_2 receiver.

5. Conclusions

The present engineering work was aimed at investigating the accuracy of GNSS code receivers under limited visibility conditions. The obtained measurement data from the survey instruments were compared with the measurement results of a Javad Triumph-1 surveying instrument operating in RTK mode. Due to the limited visibility of the celestial sphere (presence of tall trees and close proximity of high buildings), the number of precision solutions was very low.
As a result of the analysis of the measurement results of the three studied objects, the best accuracies were noticed for the static point measurement. Additionally, in this study, a better reliability of the results obtained from cell phones was noticed than with the Garmin receiver using GPS. The deviation values of the NE components for the smartphone X_1 were predominantly in the range up to 3 m, but compared to the other phones, the measurement was less stable due to the larger errors present (±15 m). Horizontal coordinate errors ranged from 1.2 to 2.8 m, while the standard deviation ranged from 2.4 to 2.5 m. For phone X_2, the NE deviations were within 1 m in the first half of the measurement and within 3 m in the second half. Horizontal coordinate errors ranged from 0.6 to 1.1 m, while the standard deviation ranged from 0.3 to 1.2 m. The X_3 smartphone provided the most stable measurements, maintaining values within 2 m for both horizontal coordinate components throughout the measurement. All phones were running the same software and mode and, apart from a few outlier observations at the beginning of the measurement with the X_1 receiver, they showed a high consistency and potency. They used only the GPS system. The results of measurements with these receivers were similar and the values of deviations in NE components did not exceed 3 m for all tested smartphones. While testing the measurement accuracy with receiver G_1 for NE components, it was noticed that the deviations did not exceed the value of 13 m, while for G_2, the limit was 3 m. The application installed on the smartphones did not record altitude, so only the Garmin receivers were subjected to the U component deviation test. The G_2 receiver obtained 3 times smaller mean horizontal coordinate errors and twice smaller NE standard deviations compared to the G_1 receiver. During the point measurement, the deviations in the elevation component (U) for G_1 ranged from 7 to 11 m, while for G_2, it was from 7 to 10 m. Both receivers recorded a constant error, and its value did not exceed 11 m. For all three NEU components, the G_1 receiver, which operated in GPS mode, received worse accuracies than the G_2 receiver using GPS+GLONASS mode. When measuring the point with the phones, better accuracies were noted for the handheld receivers by up to 10 m.
The worst accuracies were observed during the linear measurement in motion. As a result of the analysis of the results, a drop in the receiving signal was noticed for all tested receivers (at 12:22:32), which affected the accuracy of both the horizontal coordinates and the altitude coordinate. During the measurement, a loss of the measurement signal of receiver X_1 was noticed, which was characterized by the registration of the last recorded point until the end of the measurement. The phone did not stop recording data, probably due to the app being programmed to do so. The other two smartphones (X_2, X_3) produced similar point plots. The deviations in the N component did not exceed 19 m, while for the E component, it was 7 m. The position determination error with the cell phone was 8 to 11 m for the N component and up to 2 m for the E component. Smartphone receivers showed high consistency and repeatability of measurements. The largest errors were in the north-south direction, according to the direction of measured line. During the analysis of the accuracy of the handheld receivers, it was observed that the graphs of the horizontal coordinate components were similar to each other. The deviations for the N component did not exceed 11 m, while for the E component, they were within 7 m. It was also observed that the G_1 receiver using the GPS system obtained a higher accuracy (up to 12 m) during the height survey than the G_2 receiver (GPS+GLONASS), which obtained deviation values ranging from 28 to 55 m. When analyzing the linear measurement results, it was noted that the handheld receivers obtained better results compared to the cell phones. The Garmin G_2 receiver using the GPS+GLONASS mode measured horizontal coordinates with a higher accuracy (by 1 m) compared to the G_1 (GPS) receiver, while in the case of height measurement, the G_1 instrument obtained smaller deviations in the U component.
When analyzing the surface measurement results, smaller deviations in NE components determined by handheld receivers than by cell phones were observed. The measurement route was surrounded by trees more closely than in the case of the point and line objects. During the measurement, the loss of the measurement signal of the X_1 receiver was noticed, which was characterized by the registration of the last recorded point until the end of the measurement. Phone X_2 positioned the user with an error of no more than 15 m for the N component and 12 m for the E component. The horizontal coordinate errors ranged from 5.1 to 5.6 m, while the standard deviation was 3.2 m. The X_3 smartphone received deviation values of up to 15 m for the N component, and up to 13 m for the E component. Horizontal coordinate errors ranged from 4.4 to 5.5 m, while the standard deviation ranged from 2.8 to 3.1 m. The positioning results of the cell phones during the surface measurement were very similar, with high consistency and repeatability; errors were distributed uniformly, as with a random distribution. The G_1 receiver using GPS mode was positioned with an error of no more than 9 m for the NE components and 14 m for the U component. Horizontal coordinate errors ranged from 2.6 to 2.8 m, while the standard deviation ranged from 1.8 to 1.9 m. The receiver using the GPS+GLONASS mode received deviation values of up to 8 m for the N component and up to 6 m for the E component. Horizontal coordinate errors were 1.9 m, while the standard deviation ranged from 1.4 to 1.6 m. The deviation in the elevation component ranged from 25 to 54 m. The Garmin receiver plots for the surface measurement were similar for the NE components, while for the height coordinate, the deviations in the U component of the G_2 receiver were larger by up to 40 m.
The most favorable results were obtained for the static point measurement, and the worst results were obtained for the linear measurement that took place in motion. The results of each measurement are presented in plots of the horizontal component deviations (NE) and a line plot of the altitude component changes (U) for the travel receivers. The mean errors and accuracy of the receivers were also plotted. The tested GNSS code receivers did not allow for accurate measurements in conditions of limited visibility. While during a point measurement, it would be possible to obtain satisfactory results after an appropriate selection of the obtained data, it is not possible in the case of measurements in motion. A better performance of the cell phones was observed during the point measurement than the GPS-only Garmin receiver. The measurement with smartphones was consistent, while, in the case of travel receivers, it was noted that more satisfactory results were obtained by the receiver working in GPS+GLONASS mode. The value of the average error of horizontal coordinates was 3 times smaller compared to the handheld receiver using GPS only. During linear and surface measurements in motion, handheld receivers achieved better accuracies (by about 5 m) than cell phones. The measurement was nonuniform and unstable. For smartphones, the maximum deviations in the N component ranged from 15 to 19 m, while for the E component, it was from 5 to 13 m. The error of cell phones during the linear measurement ranged from 8 to 11 m for the N component, and for the E component, it was about 2 m. On the other hand, during the surface measurement, the error values of NE components were less than 6 m. The G_1 (GPS) and G_2 (GPS+GLONASS) receivers determined the coordinates with an accuracy of 3 m for the NE components. The difference in height determination with the handheld receiver operating in the GPS mode in comparison to GPS+GLONASS reached values of up to 40 m. However, when comparing only the heights obtained using the Garmin receivers, only measurements on the point (Figure 7) gave similar, comparable results. In the case of line (Figure 10) and surface (Figure 13) measurements, the accuracy of the receiver operating in GPS+GLONASS mode was significantly worse than the receiver operating in GPS mode. This is most likely due to imperfections in the computational algorithms for the dual-system receiver, which is underdeveloped in these receivers.

6. Future Works

Future research in this area is planned by extending the number of signals involved in positioning. First, as we wrote in the Methods chapter, there is currently no software available that would allow measurement in kinematic mode using more than just GPS signals and additionally allowing for height measurement. The vast majority of available positioning applications only offer the possibility to view the status of visible satellites, signal strength, or DOP coefficients, generally statistical data. These programs, however, do not offer the possibility of recording the user’s position. Currently, there are programs available that have the possibility of recording raw observations in the RINEX format, e.g., rinex ON (GPS, GLONASS and Galileo constellations) or Geo++ RINEX Logger (GPS/GLONASS/GALILEO/BDS/QZSS). In the future, the authors plan to develop observations using signals other than GPS alone and to see how including these observations will affect the accuracy of the results. Moreover, with the development of GNSS positioning apps, the research will be extended to include additional GNSS signals.

Author Contributions

Conceptualization, W.M. and K.M.; methodology, K.M.; software, W.M. and K.M.; validation, W.M. and K.M.; formal analysis, W.M. and K.M.; investigation, W.M.; data curation, W.M.; writing—original draft preparation, W.M. and K.M.; writing—review and editing, W.M., A.K., B.S., K.M., I.V., I.M., M.A., and G.S.; visualization, W.M. and K.M.; supervision, W.M., A.K., B.S., K.M., I.V., I.M., and G.S.; project administration, K.M.; funding acquisition, A.K., I.V., I.M., G.S., and K.M. Authors contributions: W.M. 35%, A.K. 5%, B.S. 5%, I.V. 5%, I.M. 5%, G.S. 5%, M.A. 5%, K.M. 35%. All authors have read and agreed to the published version of the manuscript.

Funding

This work was funded by research subvention no. 16.16.150.545 at AGH University of Science and Technology and by the National Science Centre as part of Miniatura 5, application No. 2021/05/X/ST10/00058.

Data Availability Statement

Not applicable.

Conflicts of Interest

The authors declare no conflict of interest.

References

  1. Zrinjski, M.; Matika, K.; Barković, Đ. Razvoj i modernizacija GNSS-a. Geod. List 2019, 73, 45–65. [Google Scholar]
  2. Petrovski, I.G. GPS, GLONASS, Galileo, and Beidou for Mobile Devices; Cambridge University Press: Cambridge, UK, 2012; Volume 9781107035. [Google Scholar]
  3. Cutugno, M.; Robustelli, U.; Pugliano, G. Low-Cost GNSS Software Receiver Performance Assessment. Geosciences 2020, 10, 79. [Google Scholar] [CrossRef] [Green Version]
  4. Kudrys, J. Spectral analysis of multi-year GNSS code multipath time-series. Bud. Archit. 2020, 18, 15–22. [Google Scholar] [CrossRef]
  5. Mohammed, I.H.; Ataiwe, T.N.; Al Sharaa, H. Accuracy Assessment of a Variety of GPS Data Processing, Online Services and Software. Geomat. Environ. Eng. 2021, 15, 5–19. [Google Scholar] [CrossRef]
  6. Apollo, M.; Andreychouk, V.; Moolio, P.; Wengel, Y.; Myga-Piątek, U. Does the altitude of habitat influence residents’ attitudes to guests? A new dimension in the residents’ attitudes to tourism. J. Outdoor Recreat. Tour. 2020, 31, 100312. [Google Scholar] [CrossRef]
  7. Gabryszuk, J. The Potential to Use Smartphone-based GNSS Receivers for Surveying. Geomat. Environ. Eng. 2020, 14, 49–57. [Google Scholar] [CrossRef]
  8. Lipatnikov, L.A.; Shevchuk, S.O. Cost Effective Precise Positioning with GNSS; FIG Publication: Copenhagen, Denmark, 2019. [Google Scholar]
  9. Weston, M.D.; Schwieger, V. Cost Effective GNSS Positioning Techniques; FIG Publication: Copenhagen, Denmark, 2010; ISBN 9788790907792. [Google Scholar]
  10. Specht, C.; Dabrowski, P.S.; Pawelski, J.; Specht, M.; Szot, T. Comparative analysis of positioning accuracy of GNSS receivers of Samsung Galaxy smartphones in marine dynamic measurements. Adv. Space Res. 2019, 63, 3018–3028. [Google Scholar] [CrossRef]
  11. Zangenehnejad, F.; Gao, Y. GNSS smartphones positioning: Advances, challenges, opportunities, and future perspectives. Satell. Navig. 2021, 2, 24. [Google Scholar] [CrossRef]
  12. Skorupa, B. The problem of GNSS positioning with measurements recorded using Android mobile devices. Bud. i Archit. 2019, 18, 51–62. [Google Scholar] [CrossRef] [Green Version]
  13. European GNSS Agency. GNSS Market Report; EUSPA: Prague, Czechia, 2019. [Google Scholar]
  14. Psychas, D.; Bruno, J.; Massarweh, L.; Darugna, F. Towards Sub-meter Positioning using Android Raw GNSS Measurements. In Proceedings of the 32nd International Technical Meeting of the Satellite Division of the Institute of Navigation, ION GNSS+, Miami, FL, USA, 16–20 September 2019; pp. 3917–3931. [Google Scholar]
  15. Karki, B.; Won, M. Characterizing Power Consumption of Dual-Frequency GNSS of Smartphone. In Proceedings of the GLOBECOM 2020—2020 IEEE Global Communications Conference, Taipei, Taiwan, 7–11 December 2020; IEEE: New York, NY, USA, 2020; pp. 1–6. [Google Scholar]
  16. Elmezayen, A.; El-Rabbany, A. Precise point positioning using world’s first dual-frequency GPS/galileo smartphone. Sensors 2019, 19, 2593. [Google Scholar] [CrossRef] [Green Version]
  17. Robustelli, U.; Baiocchi, V.; Pugliano, G. Assessment of dual frequency GNSS observations from a Xiaomi Mi 8 android smartphone and positioning performance analysis. Electronics 2019, 8, 91. [Google Scholar] [CrossRef] [Green Version]
  18. Adam, C.; Grzegorz, G. Karolina, Ł. Analiza dokładności pozycjonowania pojazdu w ruchu miejskim za pomocą smartfonów wyposażonych w chipset GPS oraz GPS_GLONASS. Logistyka 2015, 3, 737–743. [Google Scholar]
  19. Merry, K.; Bettinger, P. Smartphone GPS accuracy study in an urban environment. PLoS ONE 2019, 14, e0219890. [Google Scholar] [CrossRef] [PubMed] [Green Version]
  20. Paziewski, J.; Fortunato, M.; Mazzoni, A.; Odolinski, R. An analysis of multi-GNSS observations tracked by recent Android smartphones and smartphone-only relative positioning results. Meas. J. Int. Meas. Confed. 2021, 175, 109162. [Google Scholar] [CrossRef]
  21. Uradziński, M.; Bakuła, M. Assessment of static positioning accuracy using low-cost smartphone GPS devices for geodetic survey points’ determination and monitoring. Appl. Sci. 2020, 10, 5308. [Google Scholar] [CrossRef]
  22. Wanninger, L.; Heßelbarth, A. GNSS code and carrier phase observations of a Huawei P30 smartphone: Quality assessment and centimeter-accurate positioning. GPS Solut. 2020, 24, 64. [Google Scholar] [CrossRef] [Green Version]
  23. Pesyna, K.M.; Heath, R.W.; Humphreys, T.E. Centimeter positioning with a smartphone-Quality GNSS antenna. In Proceedings of the 27th International Technical Meeting of the Satellite Division of the Institute of Navigation, ION GNSS, Tampa, FL, USA, 8–12 September 2014; Volume 2. [Google Scholar]
  24. Ziętala, M. Stability of GPS and GLONASS onboard clocks on a monthly basis. Sci. J. Silesian Univ. Technol. Ser. Transp. 2022, 114, 193–209. [Google Scholar] [CrossRef]
  25. Krasuski, K.; Bakuła, M. Operation and reliability of an onboard GNSS receiver during an in-flight test. Sci. J. Silesian Univ. Technol. Ser. Transp. 2021, 111, 75–88. [Google Scholar] [CrossRef]
  26. Ng, H.F.; Zhang, G.; Hsu, L.T. GNSS NLOS pseudorange correction based on skymask for smartphone applications. In Proceedings of the 32nd International Technical Meeting of the Satellite Division of the Institute of Navigation, ION GNSS+, Miami, FL, USA, 16–20 September 2019; pp. 109–119. [Google Scholar]
  27. Xiao, A.; Chen, R.; Li, D.; Chen, Y.; Wu, D. An indoor positioning system based on static objects in large indoor scenes by using smartphone cameras. Sensors 2018, 18, 2229. [Google Scholar] [CrossRef] [Green Version]
  28. Poulose, A.; Eyobu, O.S.; Han, D.S. An indoor position-estimation algorithm using smartphone IMU sensor data. IEEE Access 2019, 7, 11165–11177. [Google Scholar] [CrossRef]
  29. Shinghal, G.; Bisnath, S. Conditioning and PPP processing of smartphone GNSS measurements in realistic environments. Satell. Navig. 2021, 2, 10. [Google Scholar] [CrossRef] [PubMed]
  30. Wang, G.; Bo, Y.; Yu, Q.; Li, M.; Yin, Z.; Chen, Y. Ionosphere-constrained single-frequency ppp with an android smartphone and assessment of gnss observations. Sensors 2020, 20, 5917. [Google Scholar] [CrossRef] [PubMed]
  31. Tunalioglu, N.; Ocalan, T.; Dogan, A.H. Precise Point Positioning with GNSS Raw Measurements from an Android Smartphone in Marine Environment Monitoring. Mar. Geod. 2022, 45, 274–294. [Google Scholar] [CrossRef]
  32. Lachapelle, G.; Gratton, P.; Horrelt, J.; Lemieux, E.; Broumandan, A. Evaluation of a low cost hand held unit with GNSS raw data capability and comparison with an android smartphone. Sensors 2018, 18, 4185. [Google Scholar] [CrossRef] [PubMed] [Green Version]
  33. Paziewski, J.; Sieradzki, R.; Baryla, R. Signal characterization and assessment of code GNSS positioning with low-power consumption smartphones. GPS Solut. 2019, 23, 98. [Google Scholar] [CrossRef] [Green Version]
  34. Lu, X.; Wang, H.; Tang, S.; Huang, H.; Li, C. DM-SLAM: Monocular SLAM in Dynamic Environments. Appl. Sci. 2020, 10, 4252. [Google Scholar] [CrossRef]
  35. Andriyanov, N.; Khasanshin, I.; Utkin, D.; Gataullin, T.; Ignar, S.; Shumaev, V.; Soloviev, V. Intelligent System for Estimation of the Spatial Position of Apples Based on YOLOv3 and Real Sense Depth Camera D415. Symmetry 2022, 14, 148. [Google Scholar] [CrossRef]
  36. Chaplot, D.S.; Gandhi, D.; Gupta, S.; Gupta, A.; Salakhutdinov, R. Learning to Explore using Active Neural SLAM. arXiv 2020. [Google Scholar] [CrossRef]
  37. Ali, S.H. Technical Report: Determination of the orthometric height inside Mosul University campus by using GPS data and the EGM96 gravity field model. J. Appl. Geod. 2007, 1, 241–247. [Google Scholar] [CrossRef]
  38. Hanagan, C.; Mershon, B. Geoid Height Calculator; UNAVCO: Boulder, CO, USA, 2020. [Google Scholar]
  39. GUGiK. Transpol v.2.06; ALGORES-SOFT Roman Kadaj i Tomasz Świętoń: Warsaw, Poland, 2013. [Google Scholar]
  40. Kuna, D.; Santhosh, N.; Perumalla, N.K. Preliminary Analysis of Standalone Galileo and NavIC in the context of Positioning Performance for Low Latitude Region. Procedia Comput. Sci. 2020, 171, 225–234. [Google Scholar] [CrossRef]
Figure 1. Receivers used in experiments: Garmin Etrex 30 and Xiaomi Mi 8 (Sources: https://www.garmin.com/pl-PL/p/87774/, https://www.gsmarena.com/xiaomi_mi_8-pictures-9065.php: (accessed on 1 April 2022)).
Remotesensing 14 02615 g001
Figure 2. Location of measurement objects. Orange—linear object, yellow—surface object, red—point object, coordinates of the center of the yellow circle: 50°03′45.9″N 19°55′02.9″E, 204 m (background source: Google Earth).
Remotesensing 14 02615 g002
Figure 3. Survey equipment design and GNSS devices used in the study.
Remotesensing 14 02615 g003
Figure 4. Panorama of objects: (a) surface, (b) line, (c) point, (d) static session.
Remotesensing 14 02615 g004aRemotesensing 14 02615 g004b
Figure 5. Sky visibility conditions during each part of the experiment: (a) surface, (b) line, (c) point, (d) static session.
Remotesensing 14 02615 g005aRemotesensing 14 02615 g005b
Figure 6. Plot of NE component deviations, point measurement.
Remotesensing 14 02615 g006
Figure 7. Plot of U-component deviations of point measurements with code receivers.
Remotesensing 14 02615 g007
Figure 8. Points from the RTK measurement (dark blue) and the fitted reference line (yellow).
Remotesensing 14 02615 g008
Figure 9. Plot of NE component deviations of linear measurement with code receivers.
Remotesensing 14 02615 g009
Figure 10. Plot of U-component deviations of linear measurement with code receivers.
Remotesensing 14 02615 g010
Figure 11. Points from the RTK measurement (purple) and the fitted reference circle (green).
Remotesensing 14 02615 g011
Figure 12. Plot of NE component deviations of surface measurements with code receivers.
Remotesensing 14 02615 g012
Figure 13. Plot of U-component deviations of surface measurements with code receivers.
Remotesensing 14 02615 g013
Figure 14. Plot of NE component deviations of static measurements with code receivers.
Remotesensing 14 02615 g014
Figure 15. Plot of U-component deviations of static measurements with code receivers.
Remotesensing 14 02615 g015
Table 1. Summary of receivers used for measurement.
ReceiverModeMarking
Xiaomi Mi 2GPSX_1
GPSX_2
GPSX_3
Garmin eTrex 3GPSG_1
GPS+GLONASSG_2
Table 2. Biases of the results obtained (in meters).
ObjectCoordinate/Error [m]Receiver
G_1G_2X_1X_2X_3
PointN/σN3.0/2.00.8/0.72.8/2.40.6/0.32.0/0.0
E/σE4.8/3.00.9/0.71.2/2.51.1/1.21.4/0.0
U/σU9.1/1.08.7/0.4---
LineN/σN3.0/2.53.4/2.543.0/28.58.1/3.710.5/4.0
E/σE1.4/1.12.0/1.54.1/2.71.8/1.62.0/1.2
U/σU3.0/3.242.1/6.6---
CircleN/σN2.6/1.91.9/1.620.4/11.65.6/3.25.5/3.1
E/σE2.8/1.81.9/1.430.3/25.65.1/3.24.4/2.8
U/σU2.6/2.640.1/7.1---
Publisher’s Note: MDPI stays neutral with regard to jurisdictional claims in published maps and institutional affiliations.