
Beijing Land Subsidence Revealed Using PS-InSAR with Long Time Series TerraSAR-X SAR Data


Abstract
:1. Introduction
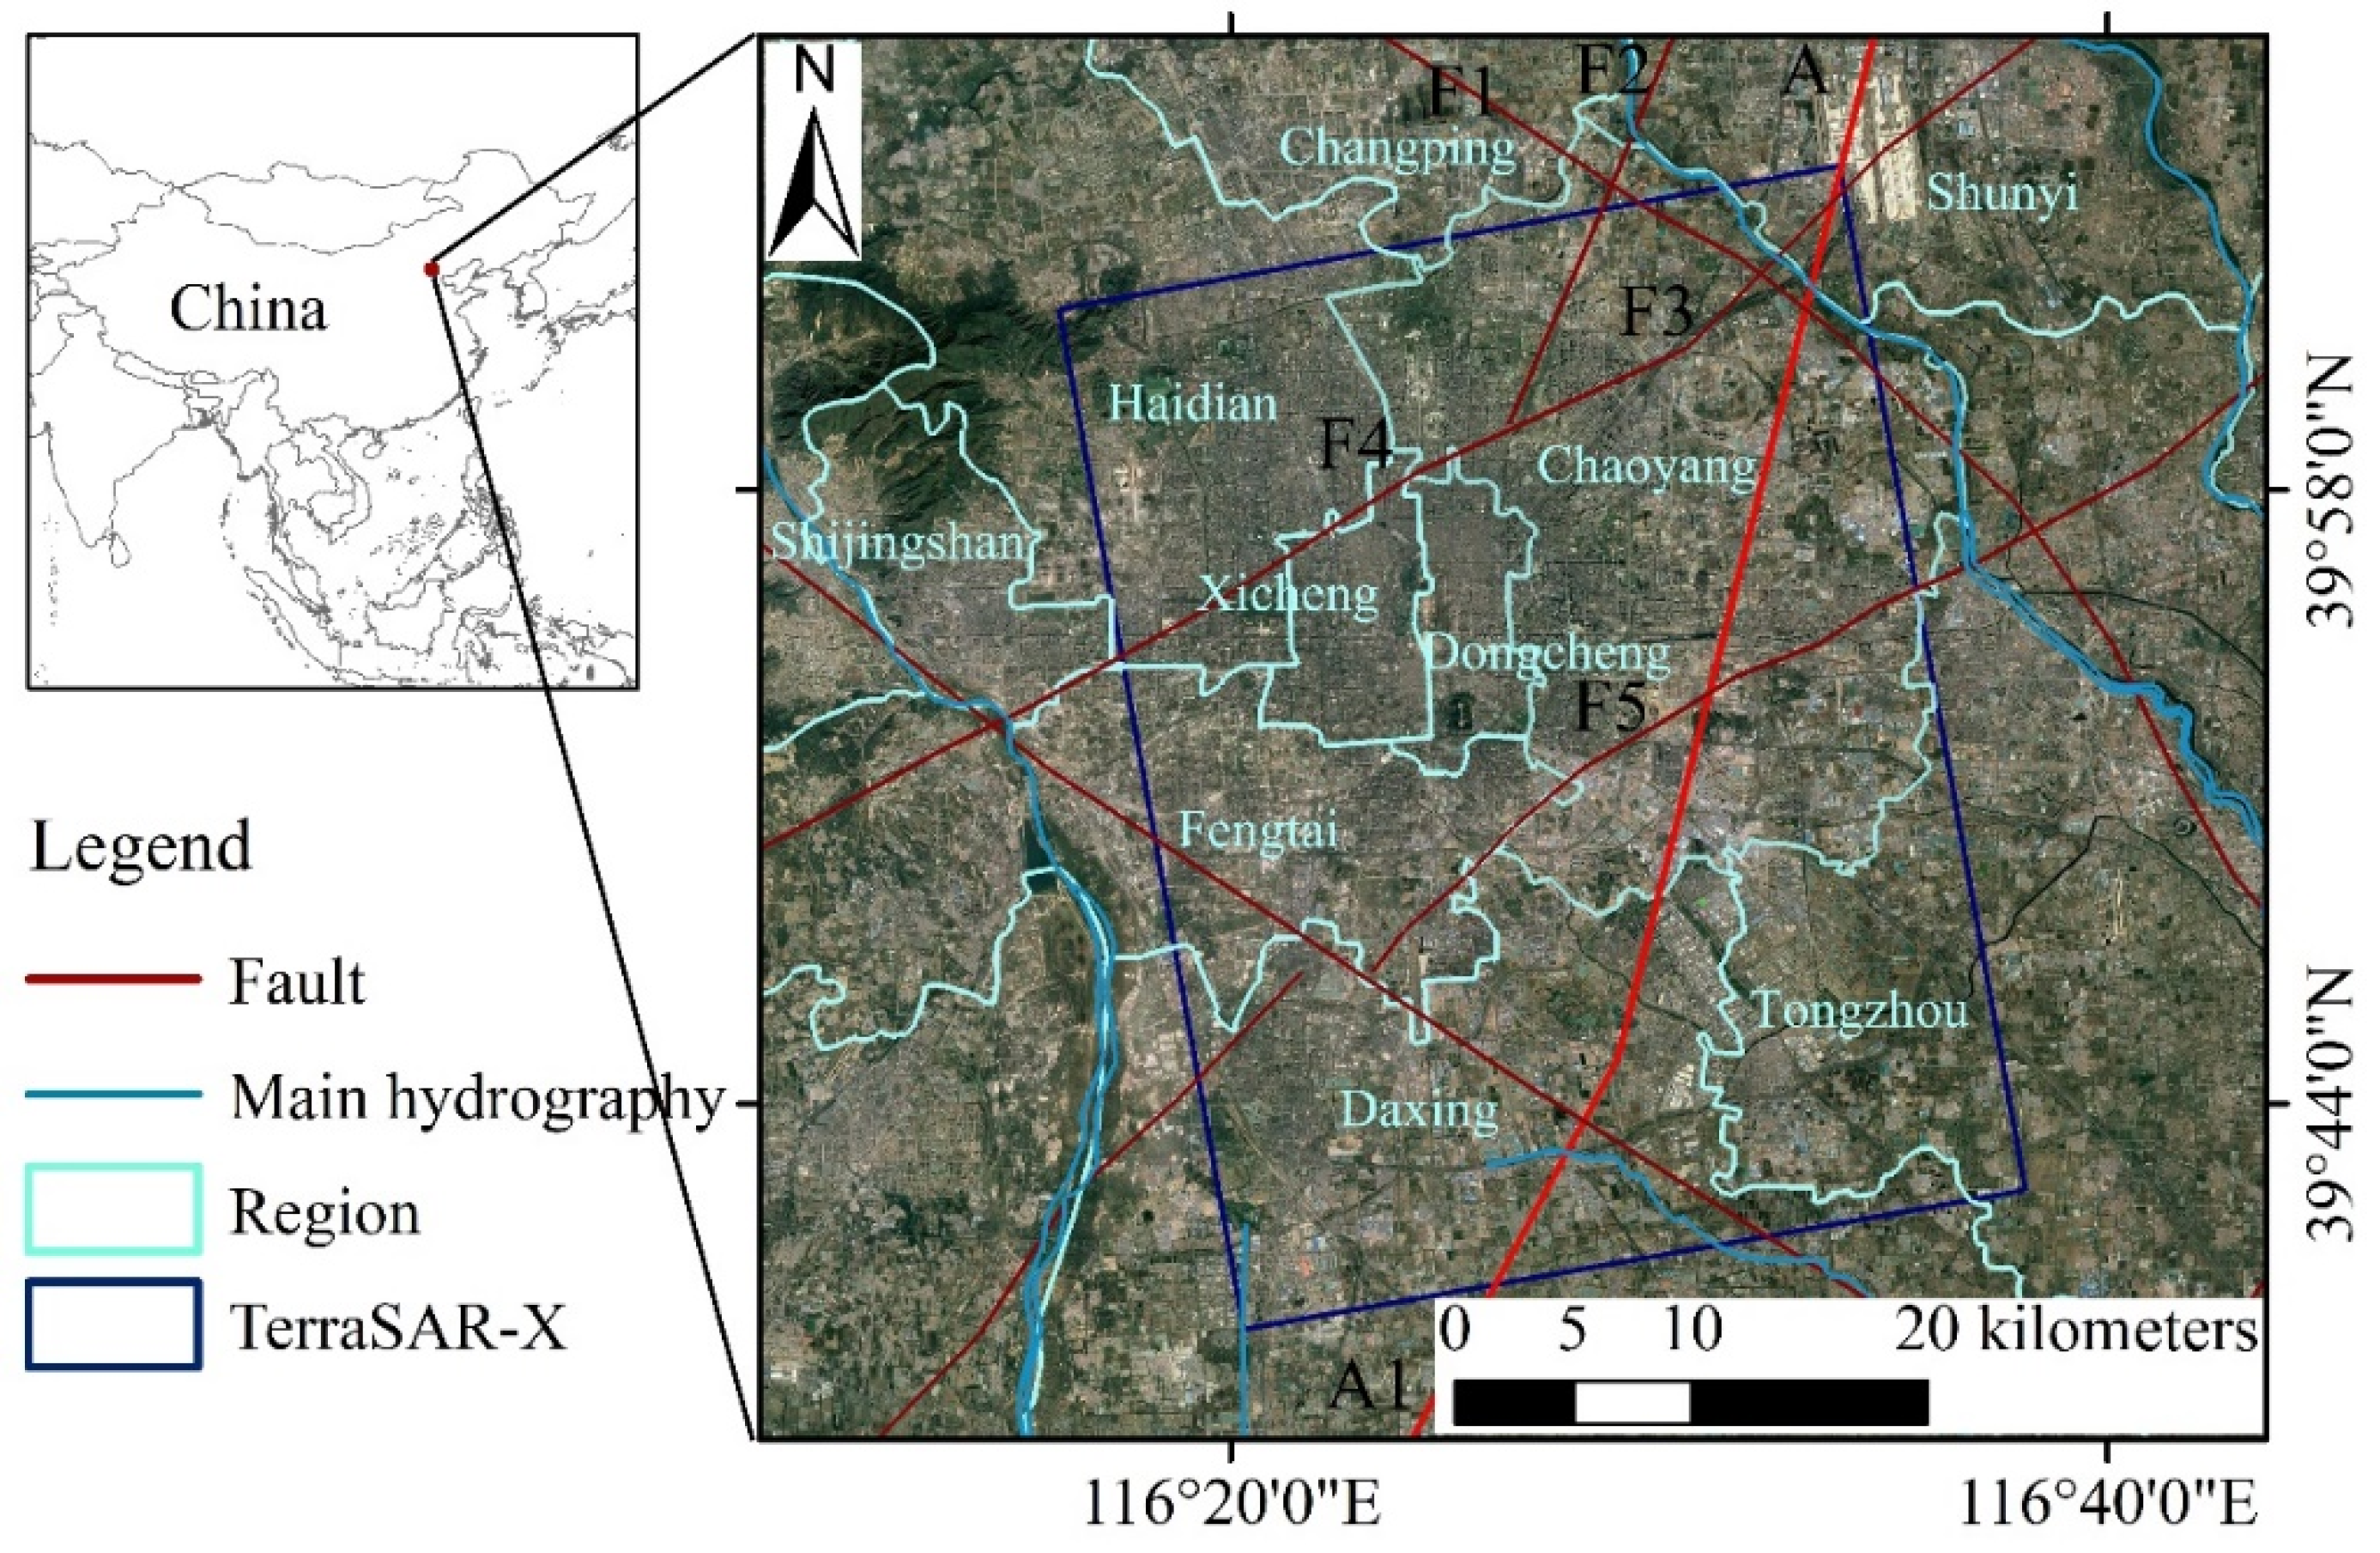
2. Study Area
3. Datasets and Methodology
3.1. Datasets
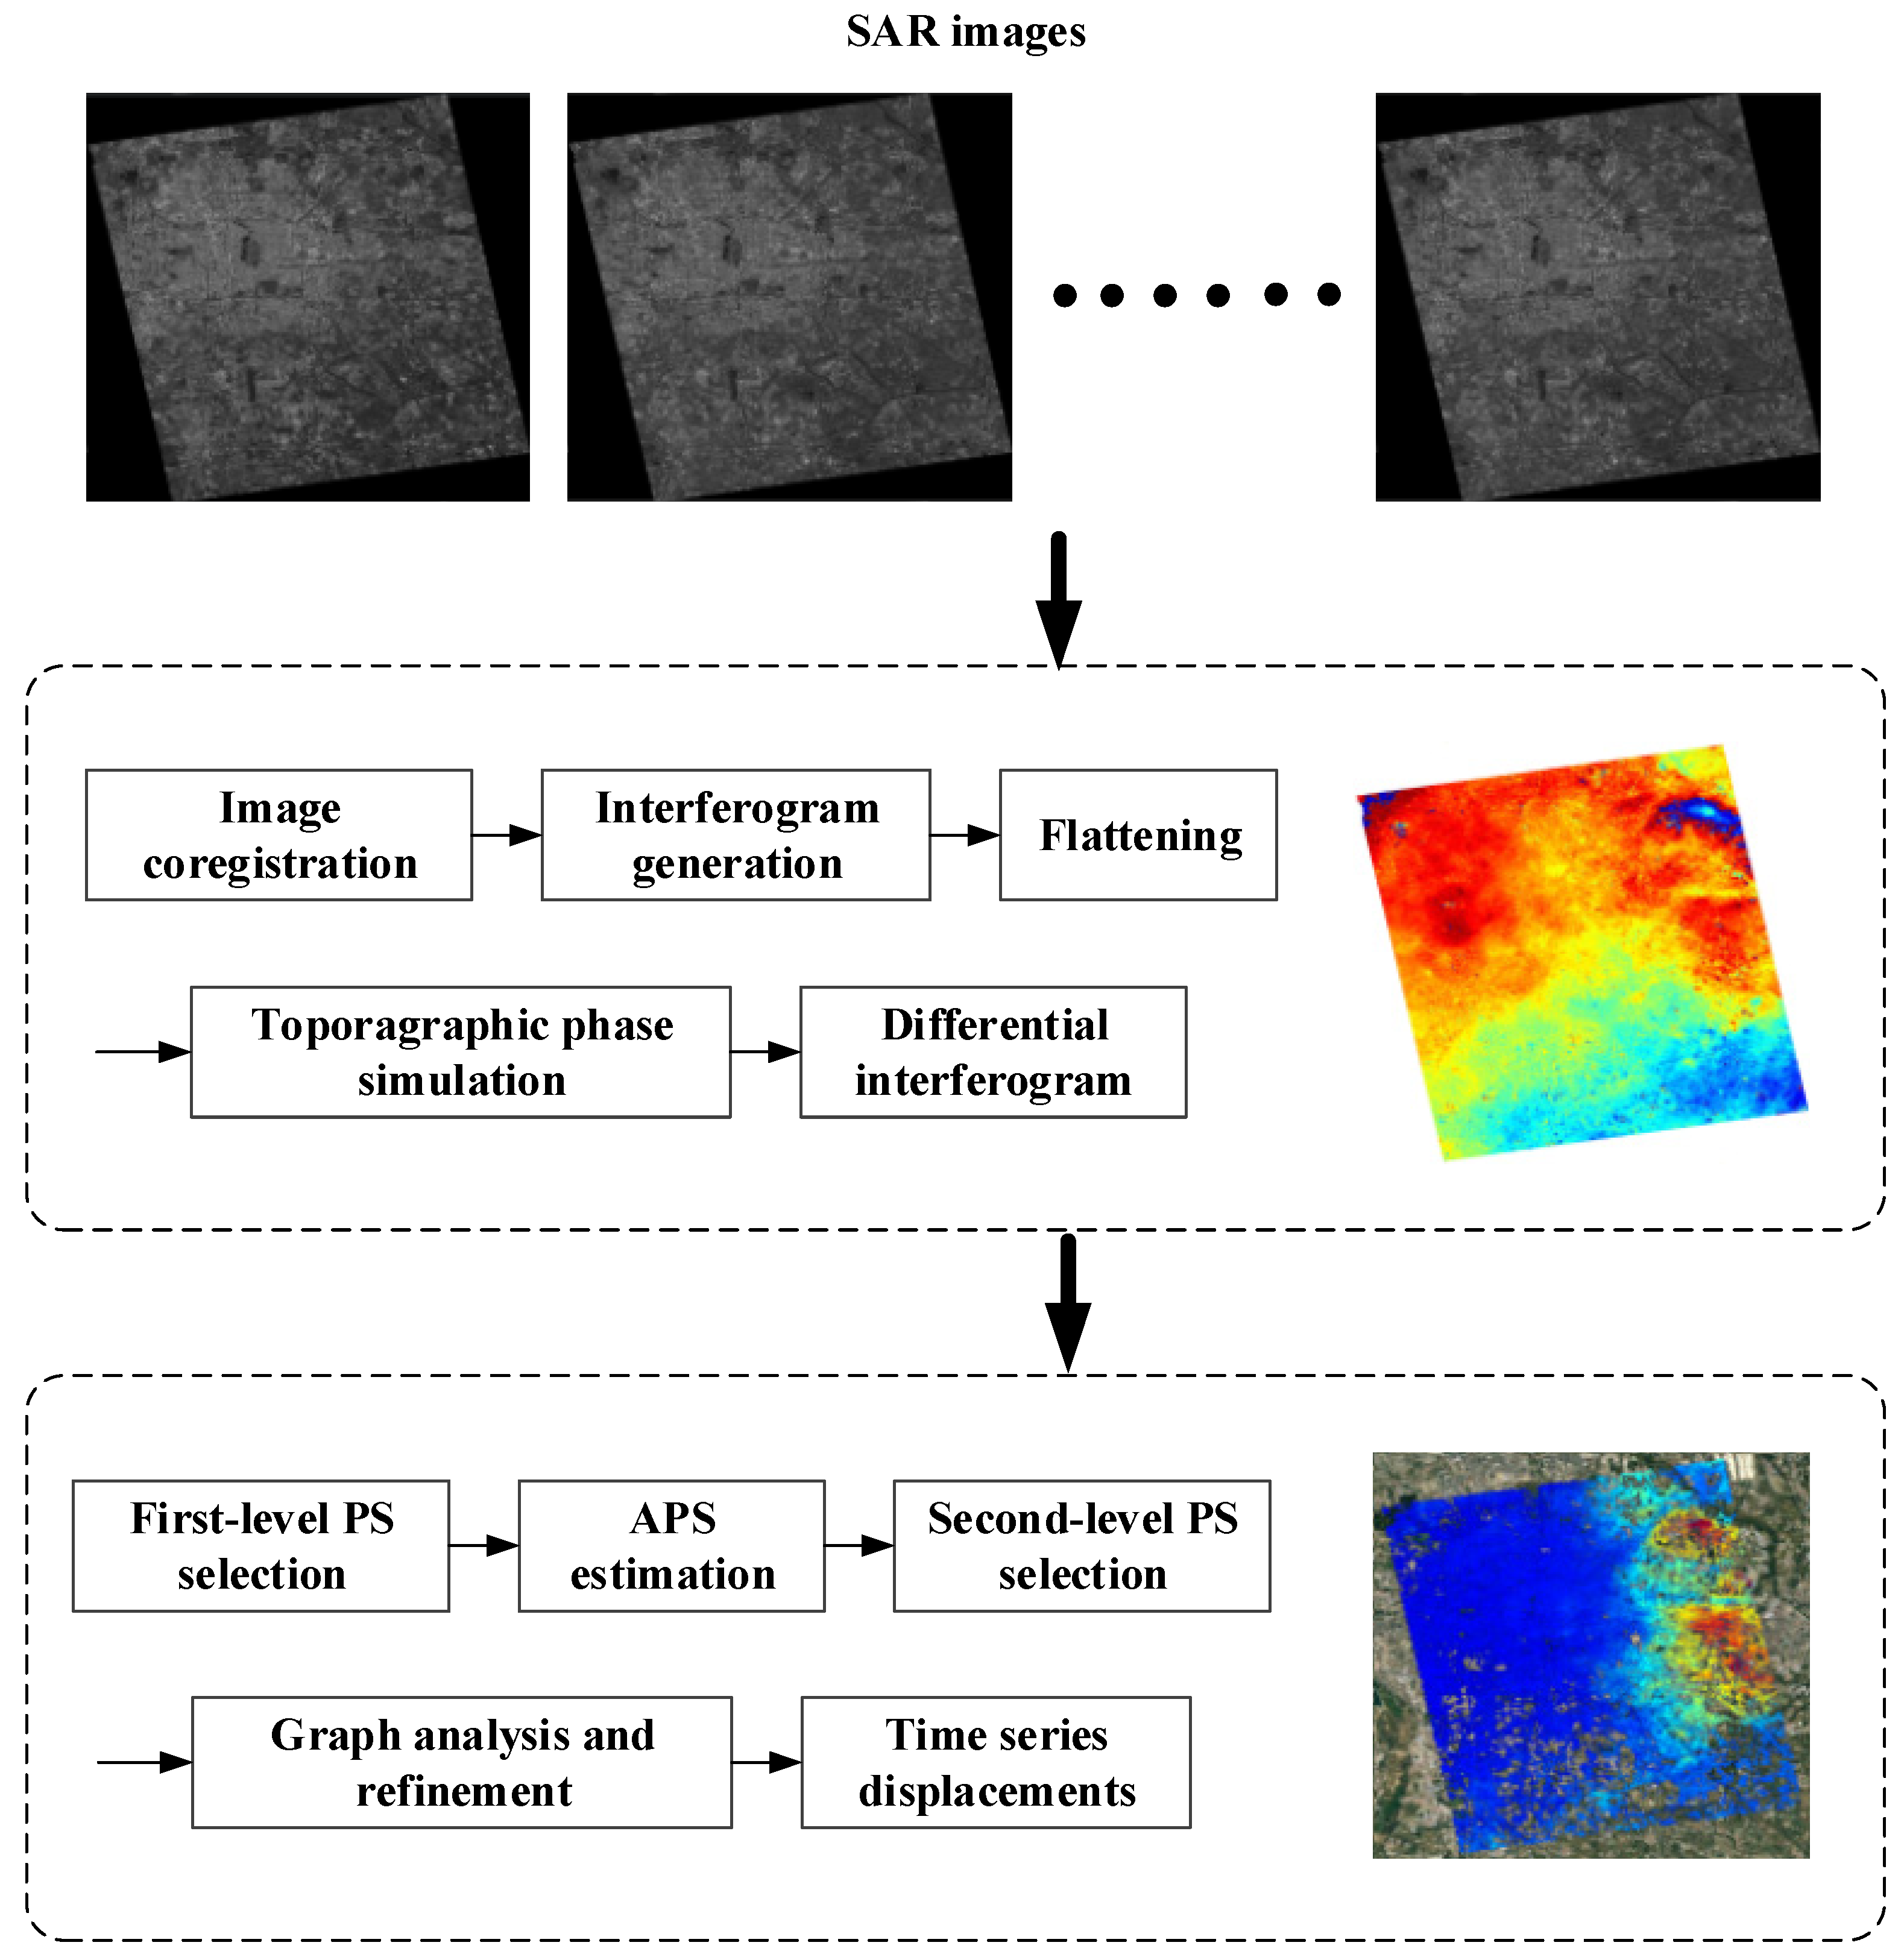
3.2. Methodology
4. Results and Discussion
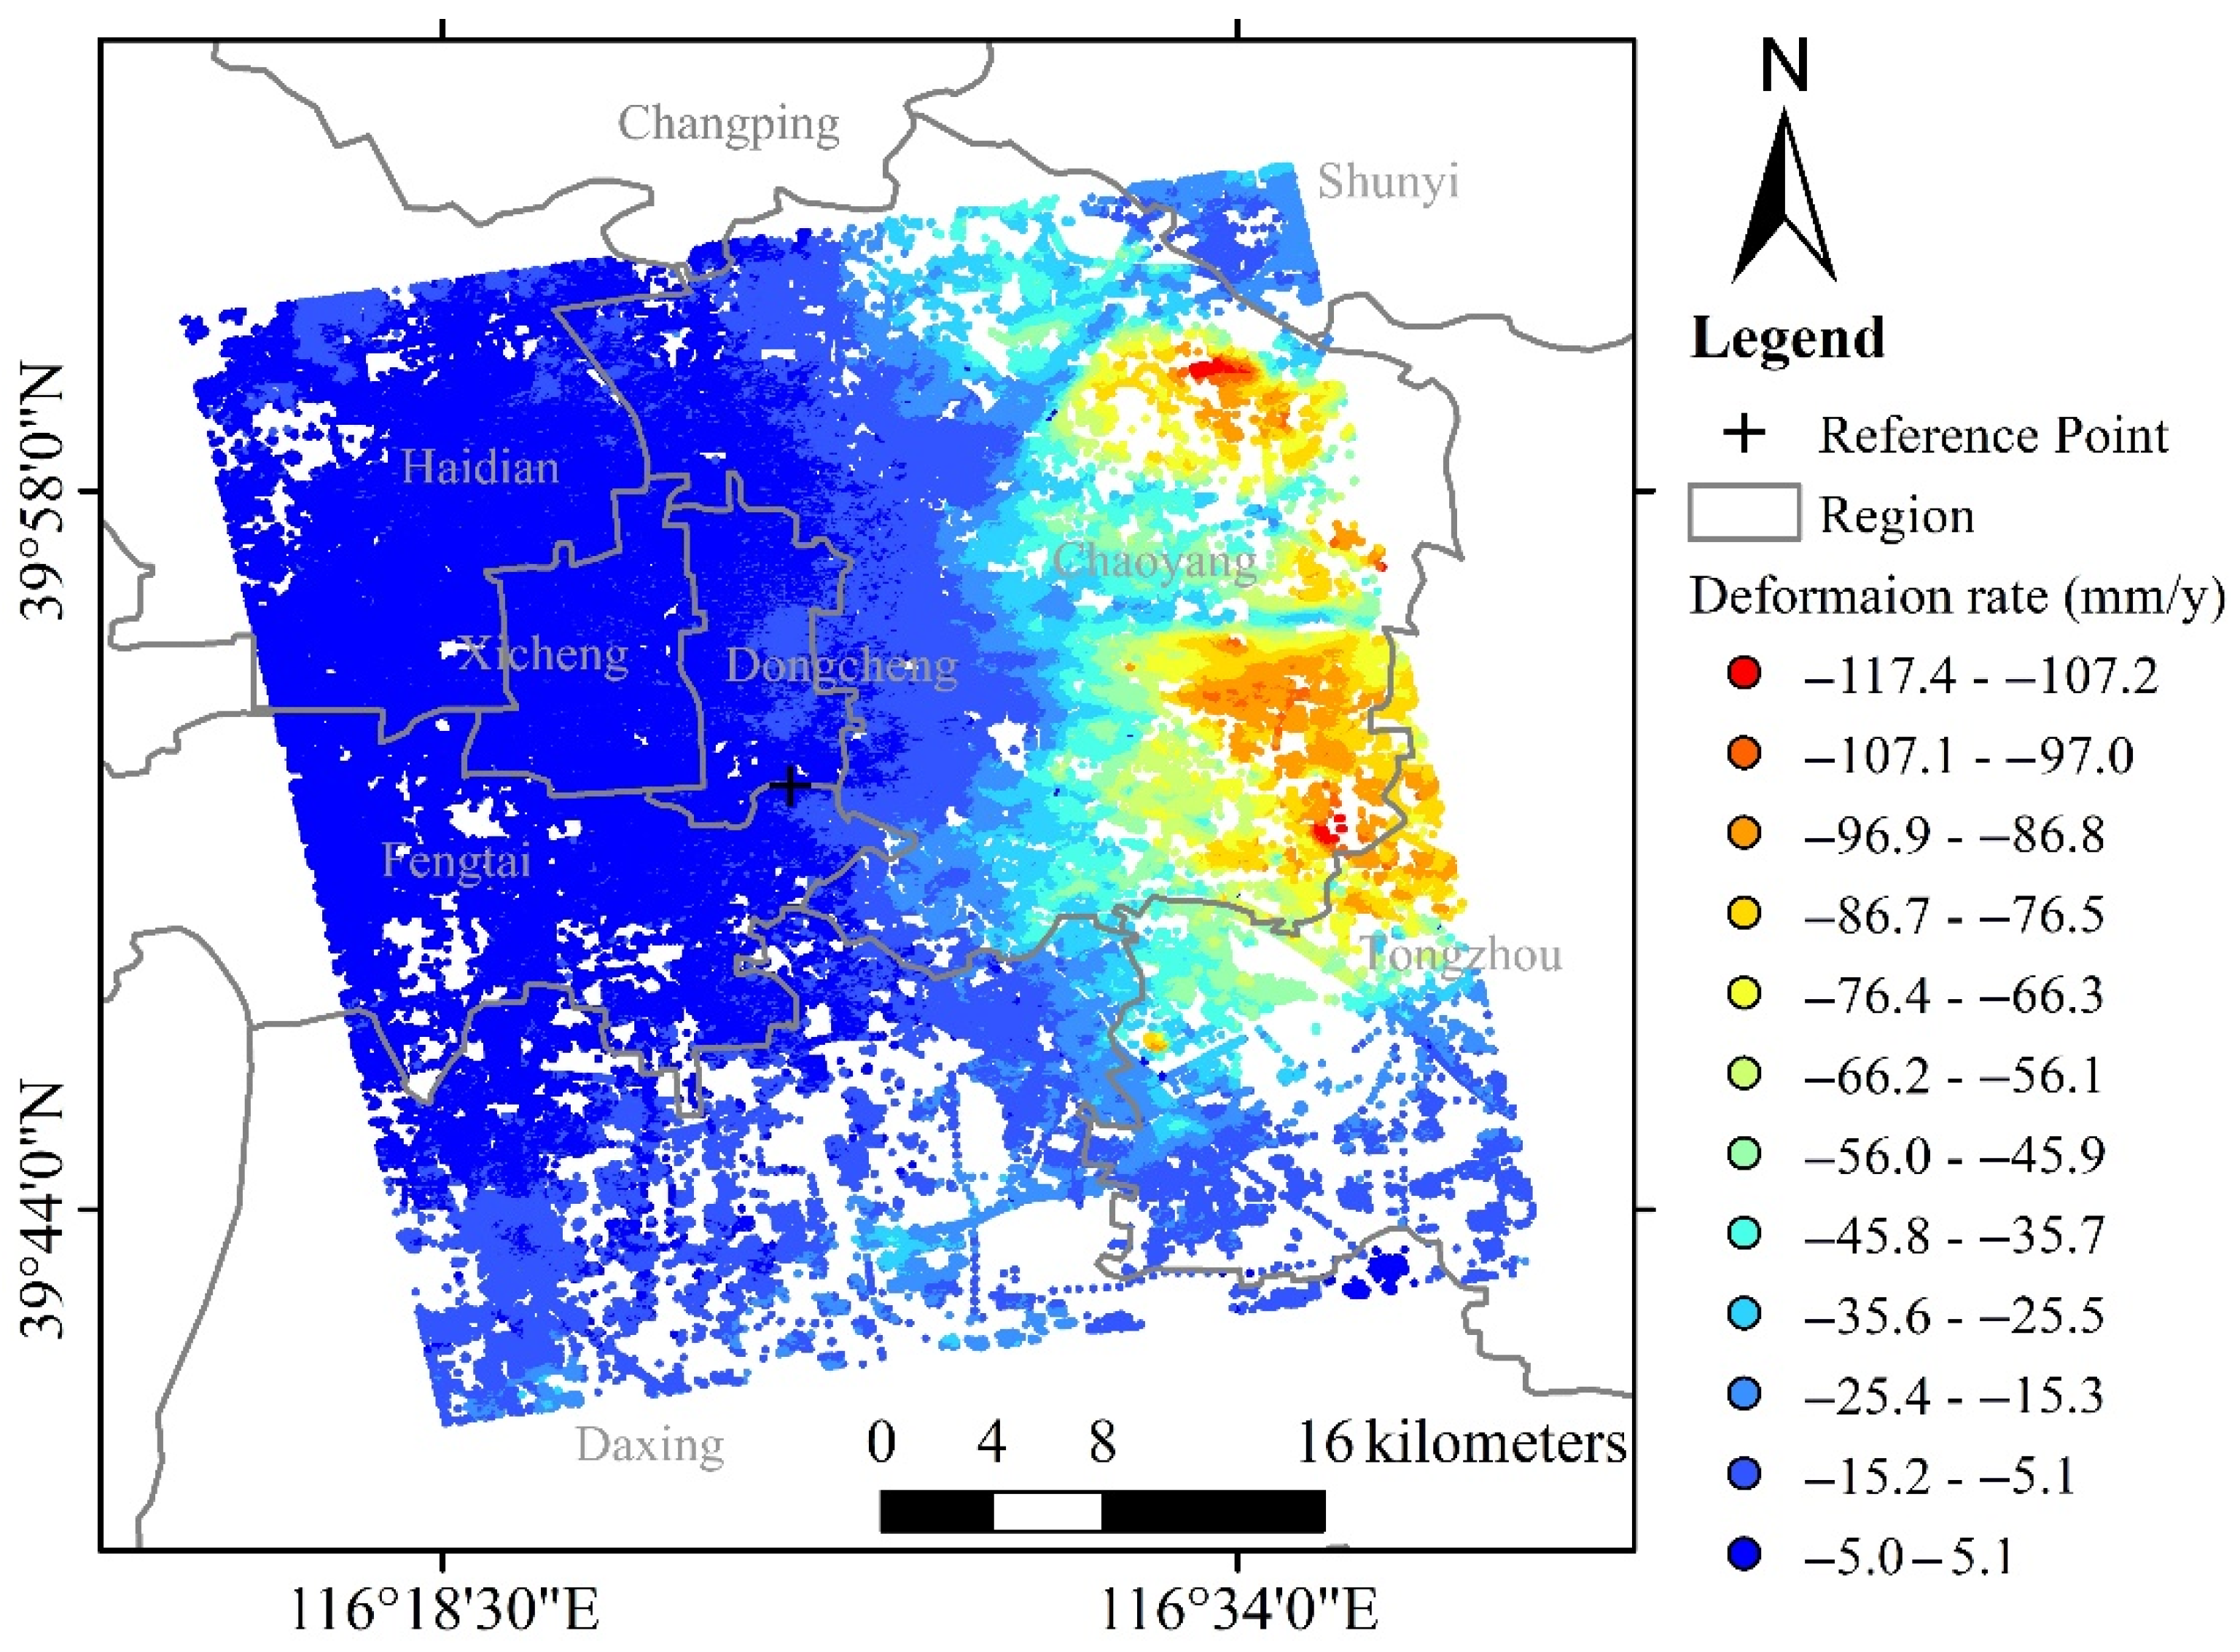
4.1. InSAR-Derived Time Series Displacements
4.2. Groundwater Levels
4.3. Human Activity
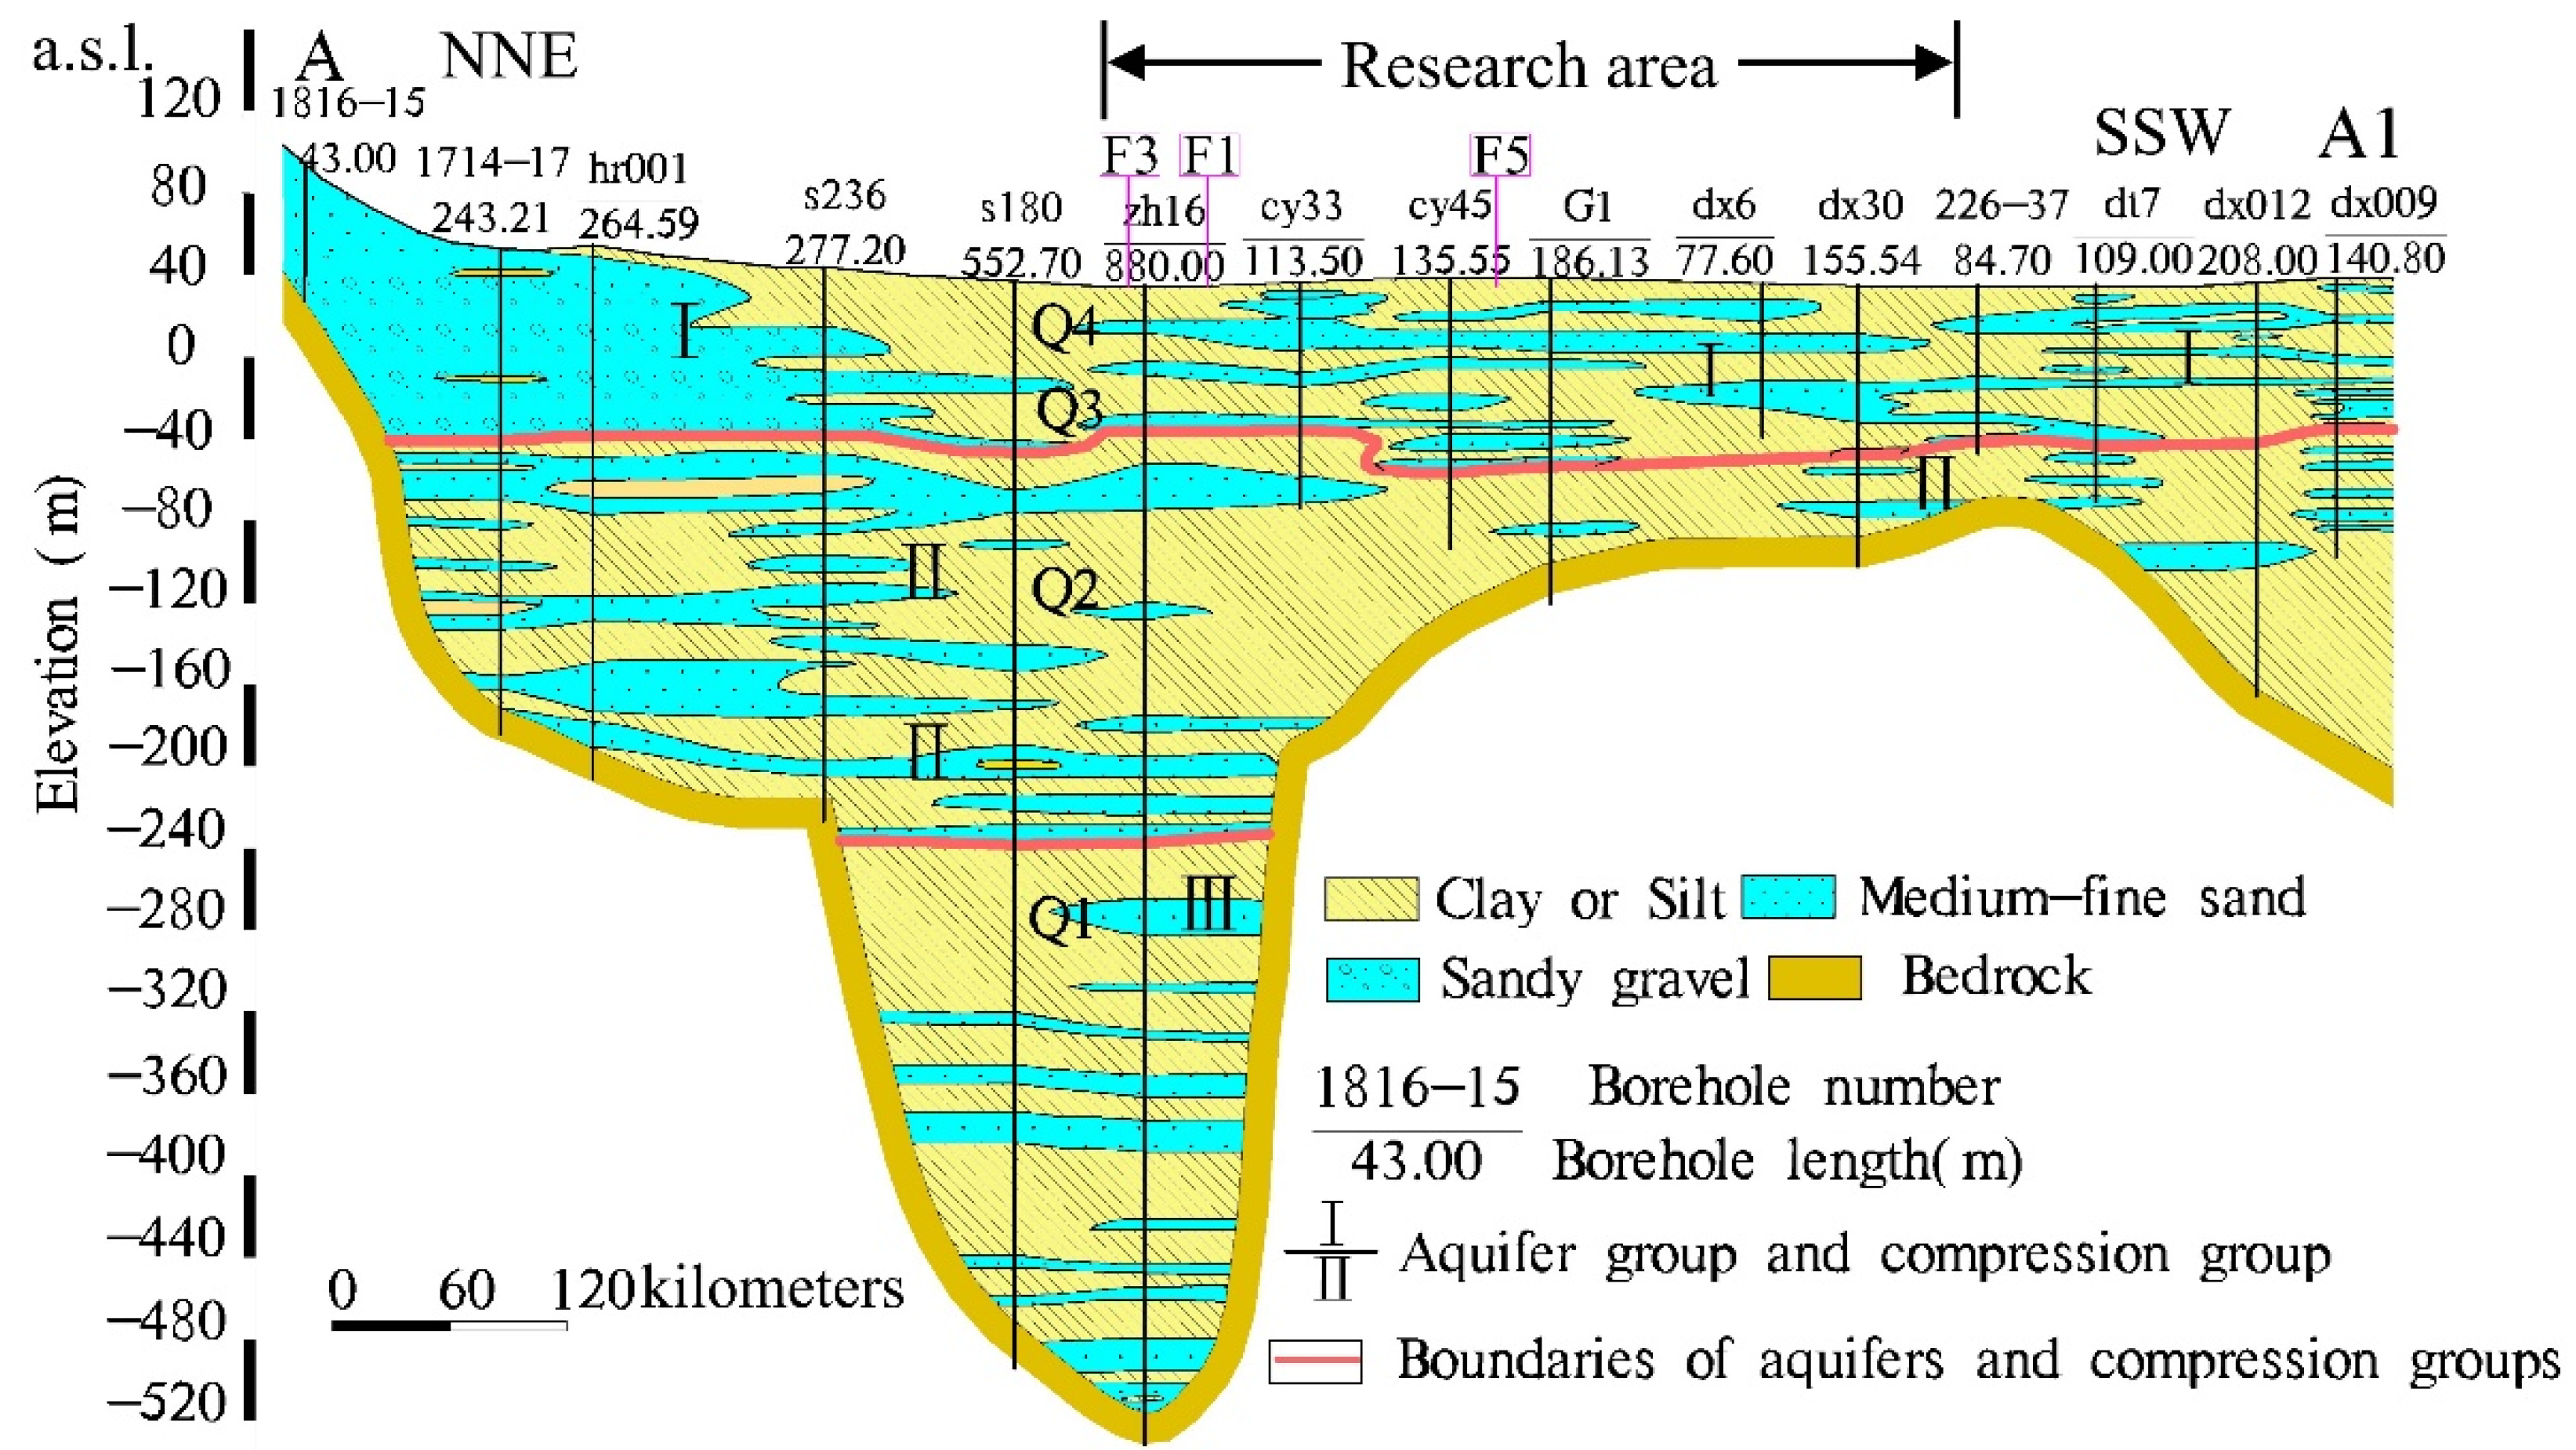
4.4. Surface Geology
4.5. Active Faults
5. Conclusions
- (1)
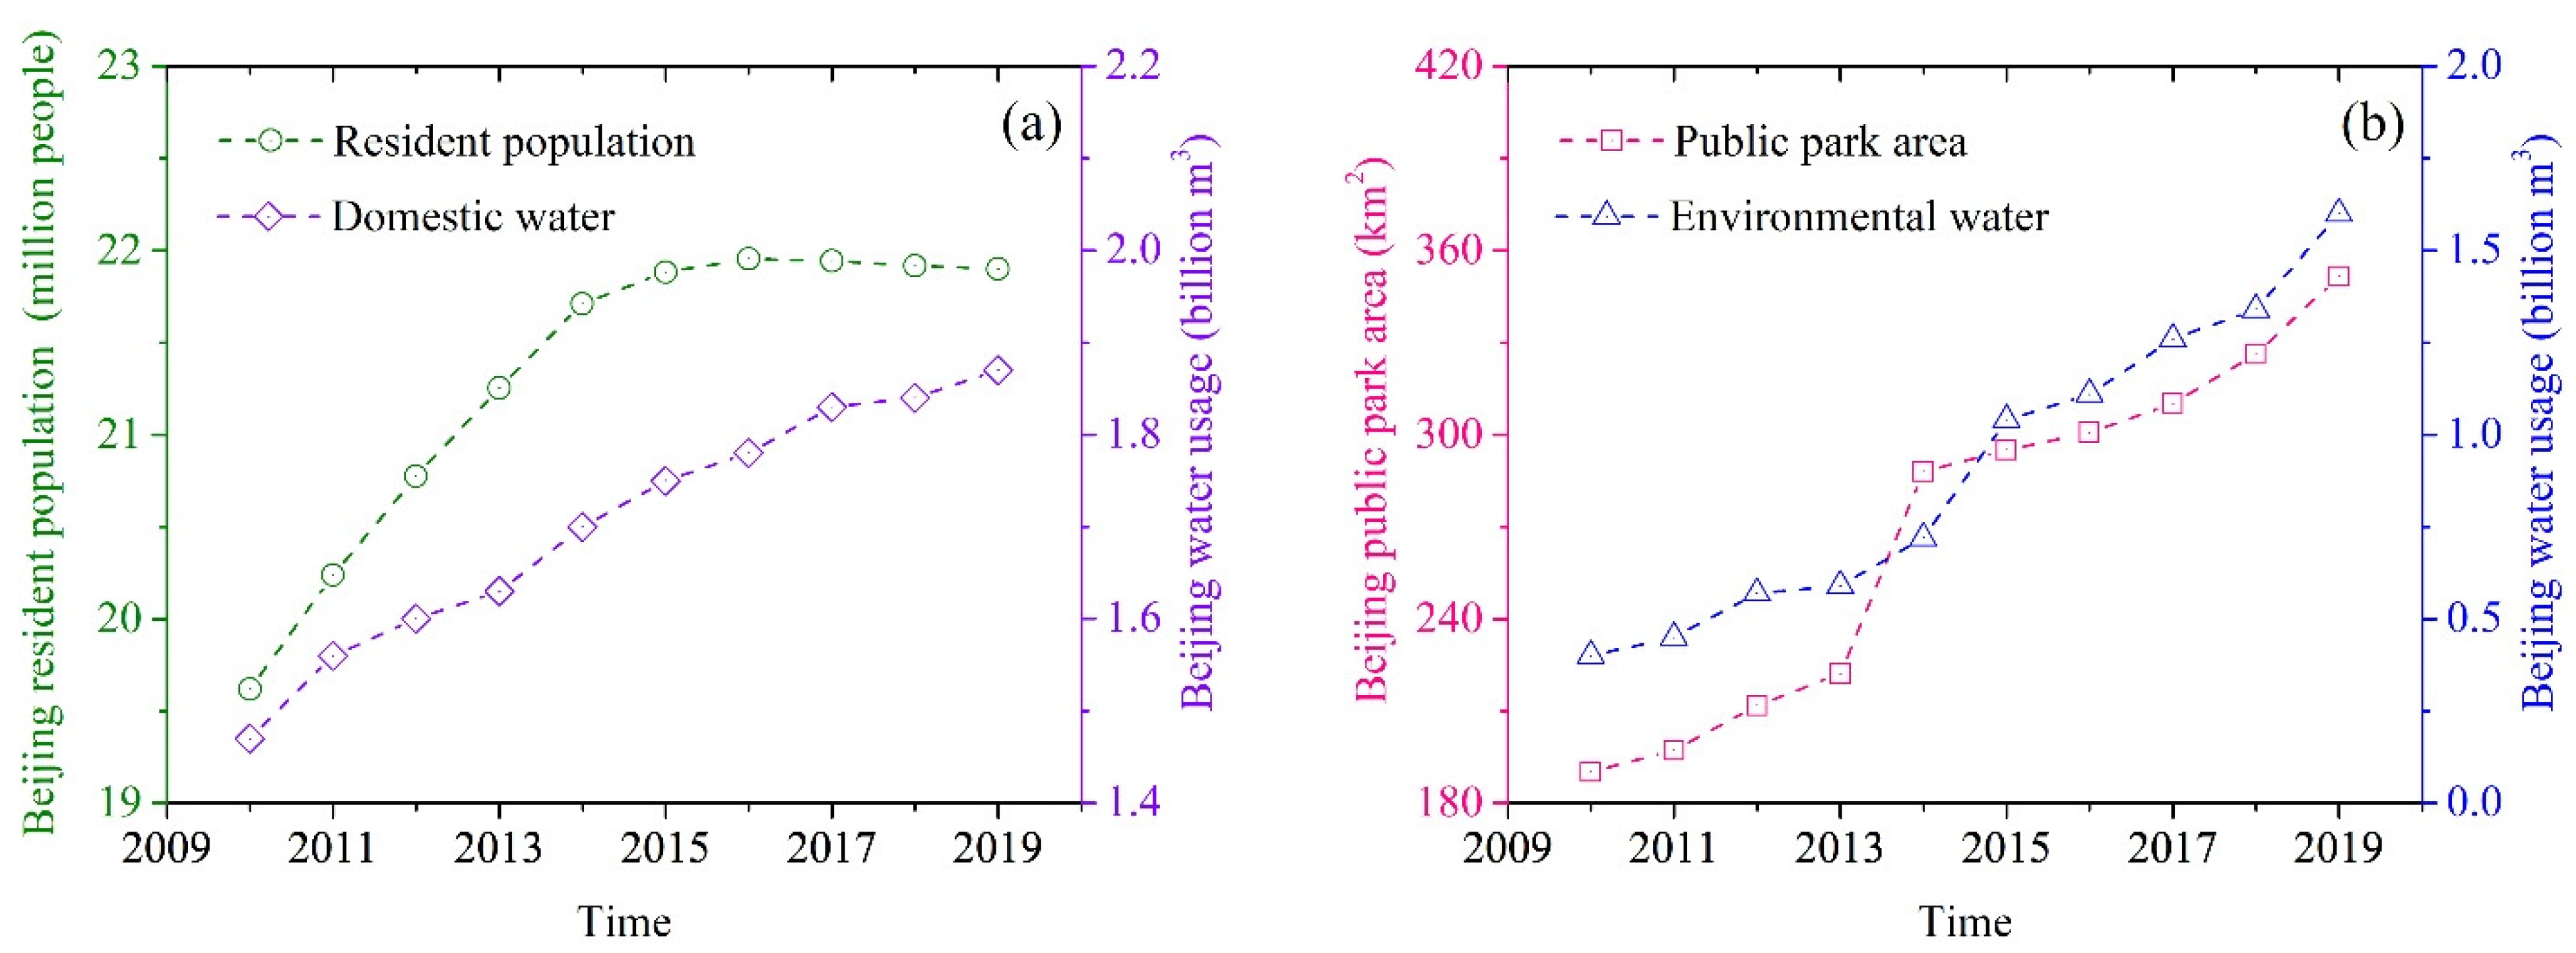
- In the past 10 years, Beijing’s water supply and consumption structure have undergone great changes. Increases in SNWDP water and recycled water have gradually improved the current situation of water resources, making the groundwater level increase year by year. As public park area expanded, environmental water consumption increased year by year. Although the resident population of Beijing has decreased, domestic water consumption has increased year by year due to changes in people’s water usage. With changes in the water supply structure (the increase in SNWDP and recycled water, and the reduction in groundwater exploitation) and the optimization of water consumption (recycled water for environmental water, and the reduction in agricultural water), groundwater levels began to rise after 2015.
- (2)
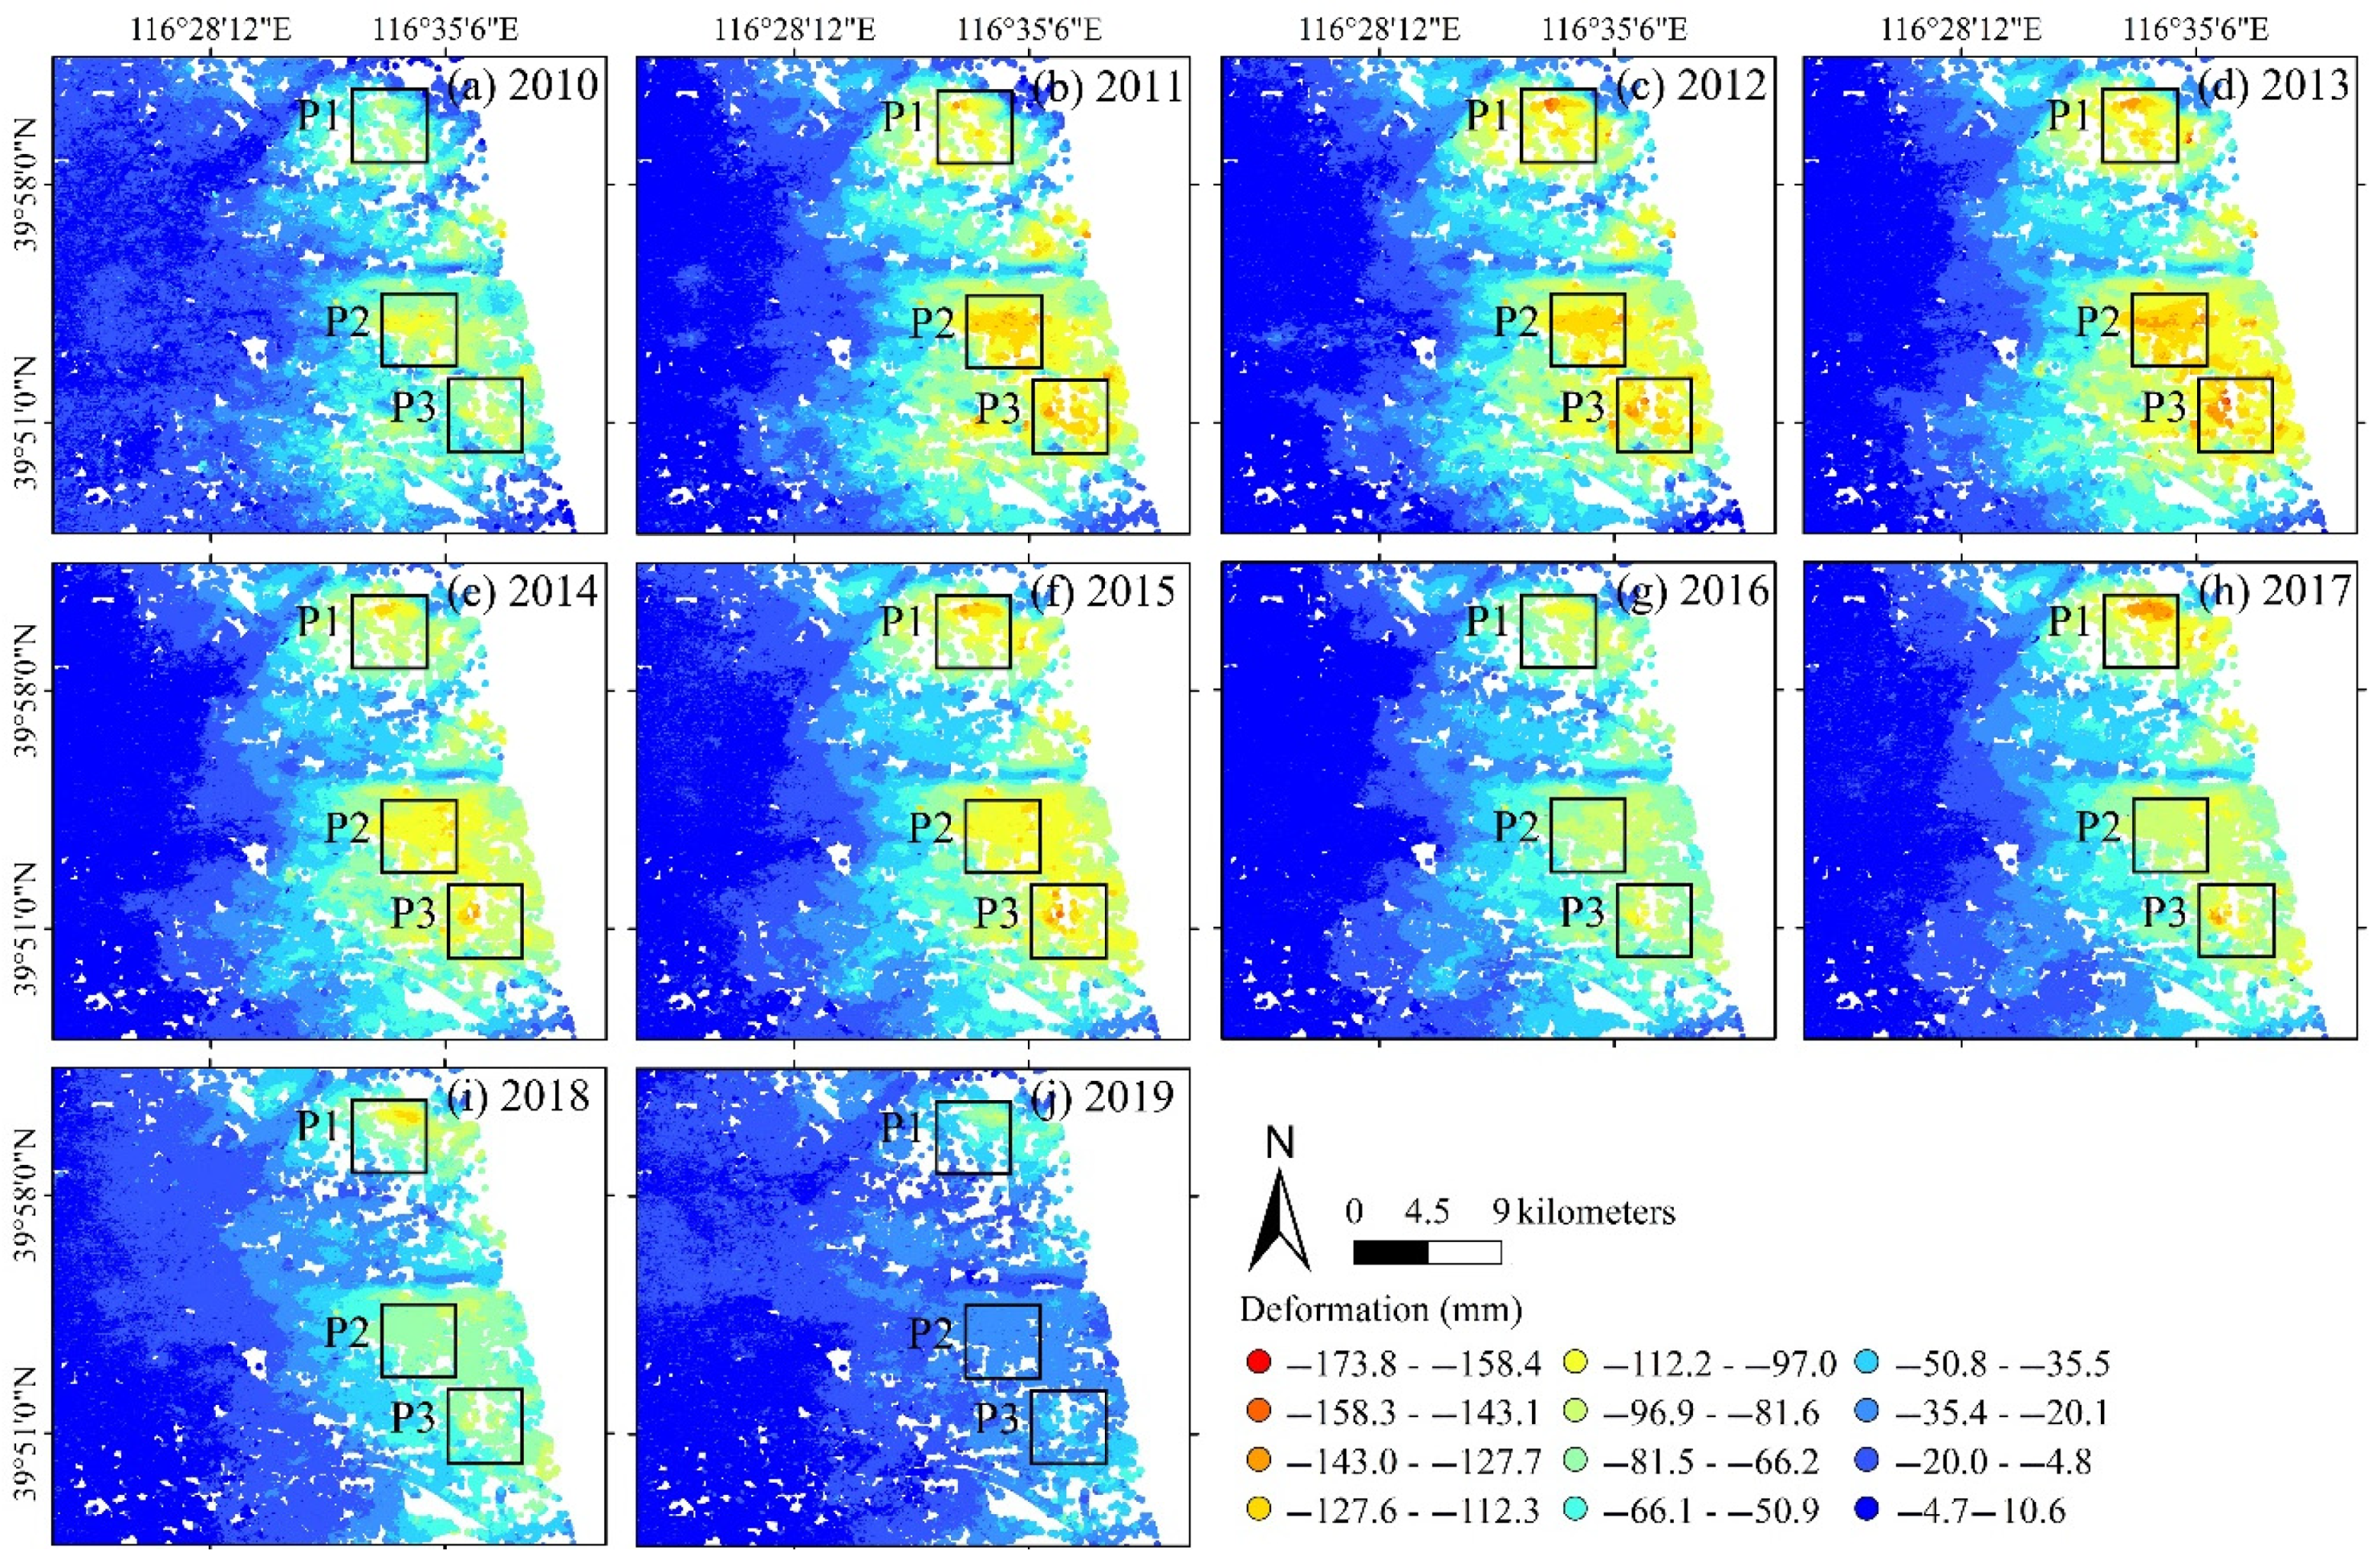
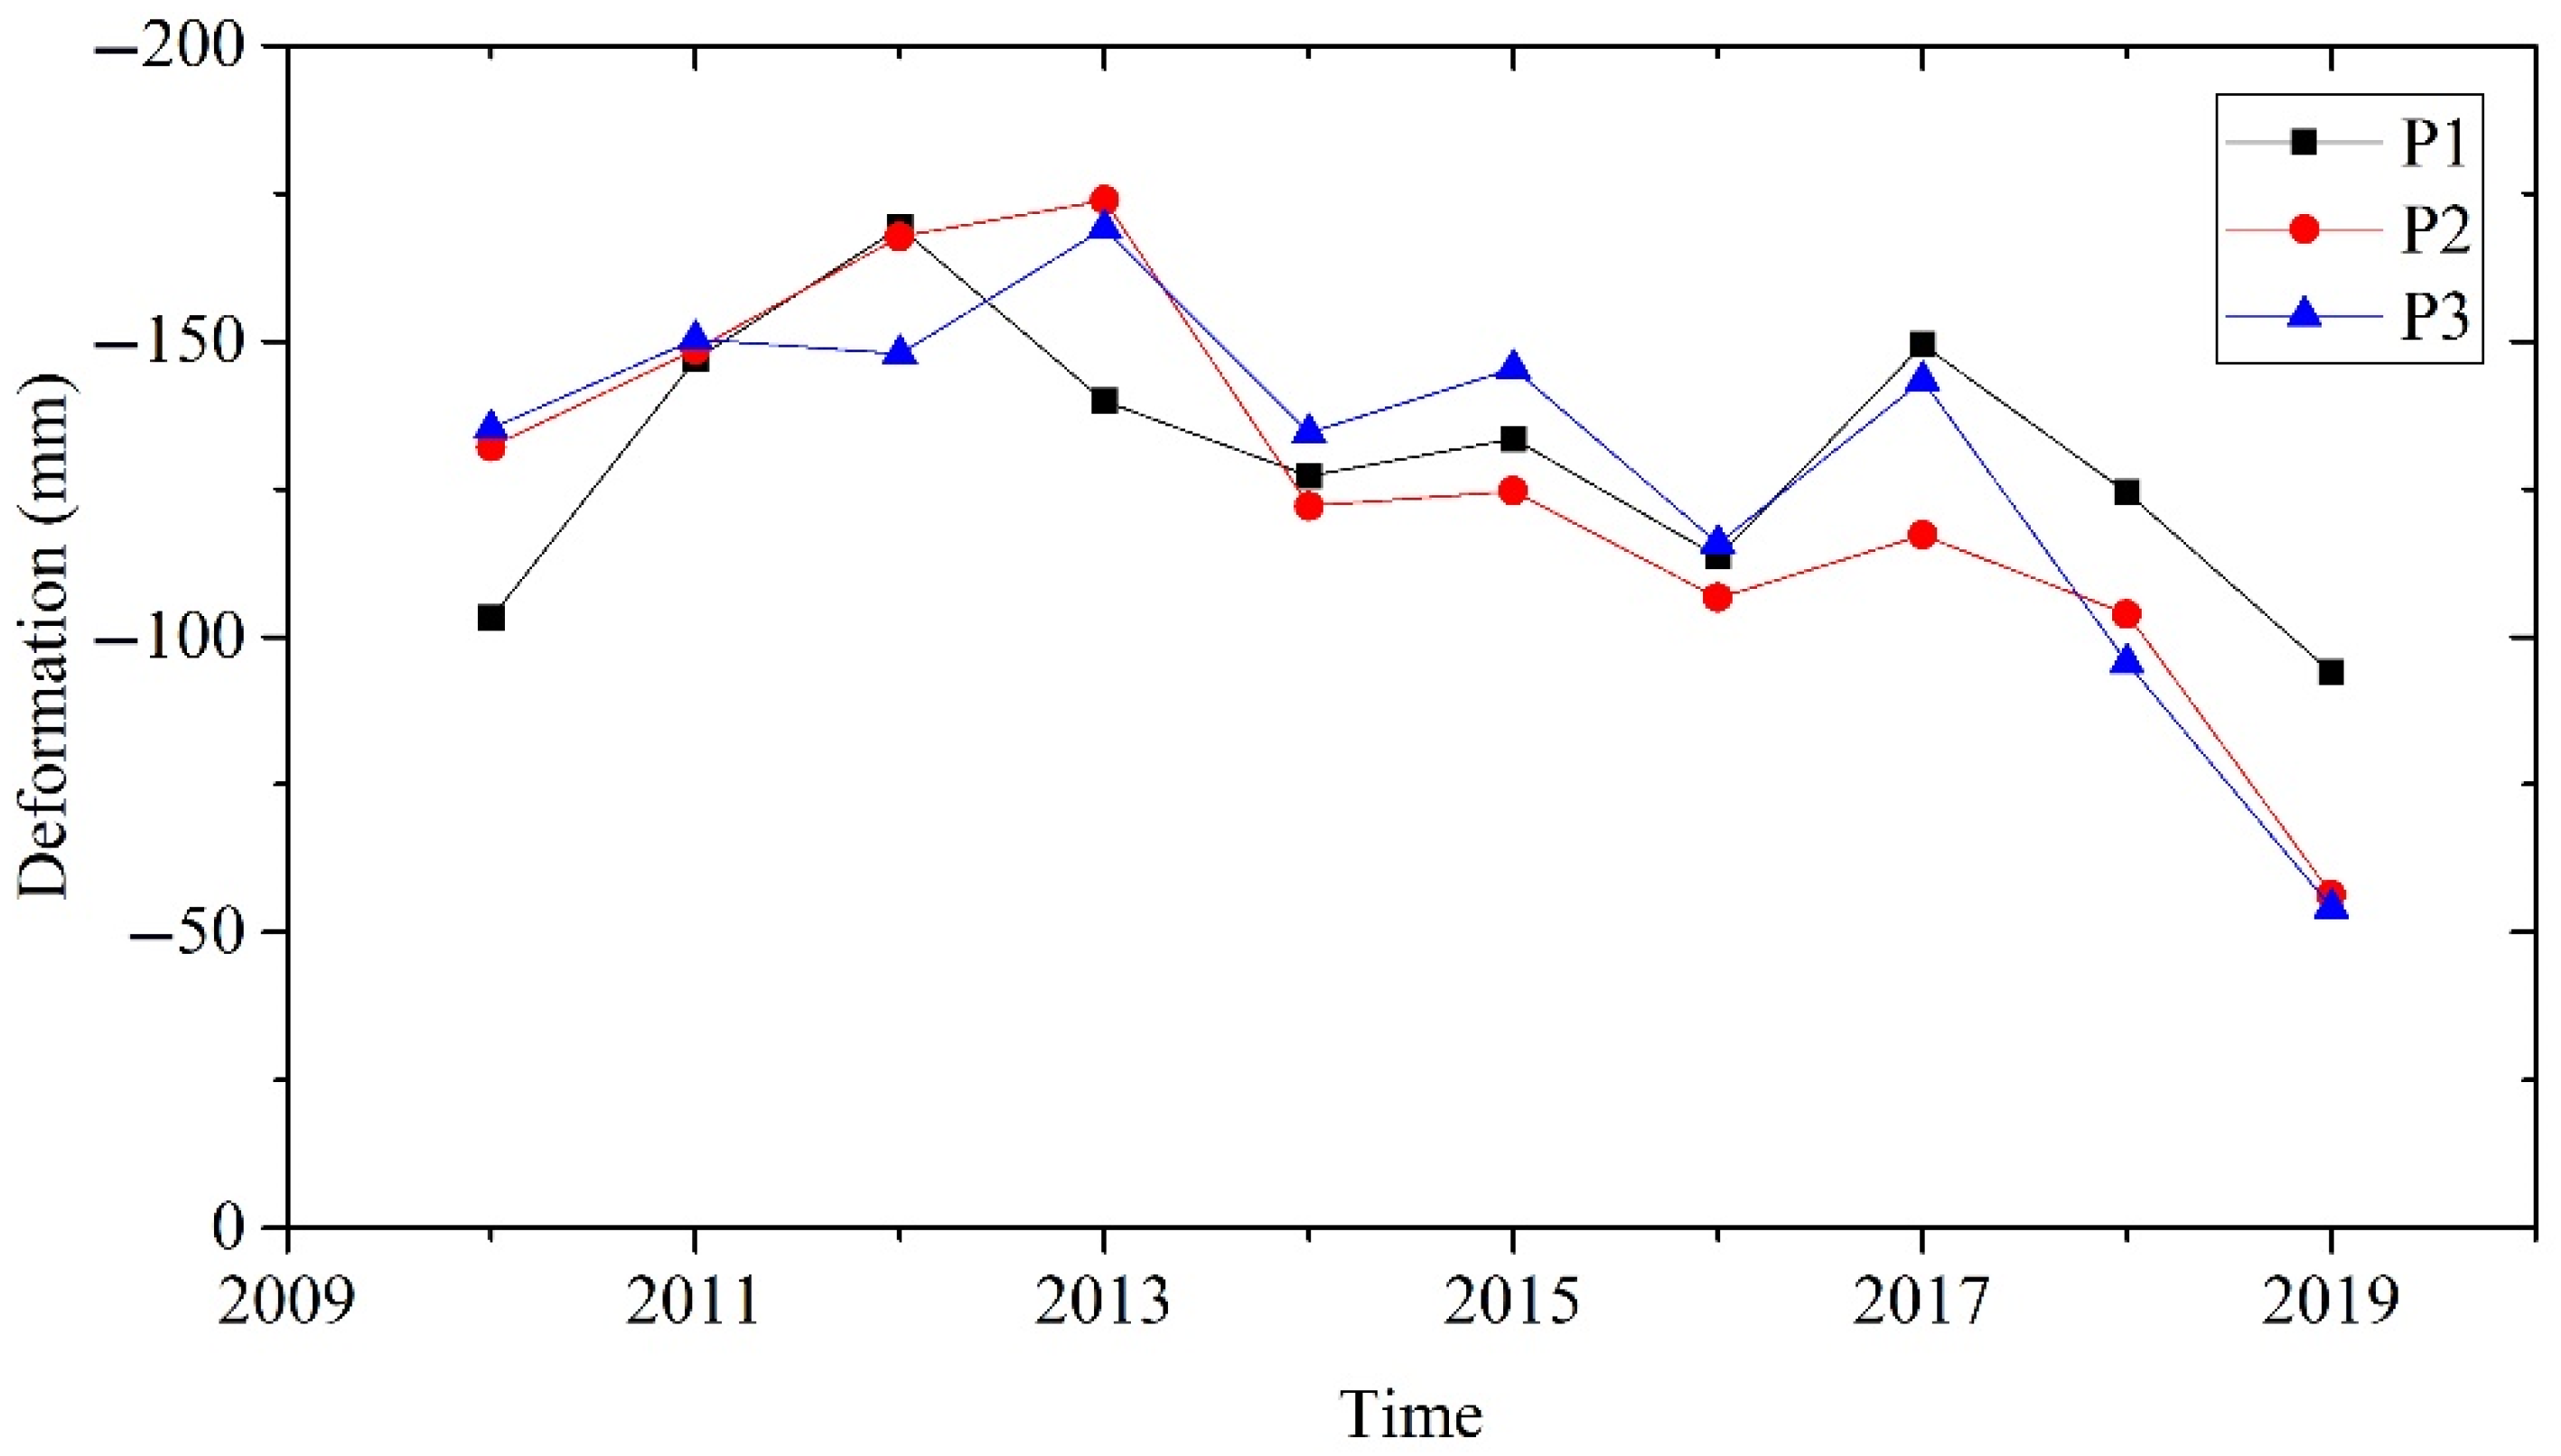
- Groundwater levels have begun to rise, leading to decreases in deformation rates and areas of land subsidence. In discussions of the time series displacement of three deformation centers, we found that land subsidence has decreased since 2017, and reductions in deformation rate lagged behind the time that the SNWDP needed to provide a water source by about two years. In fact, land subsidence lagged behind changes in groundwater levels.
- (3)
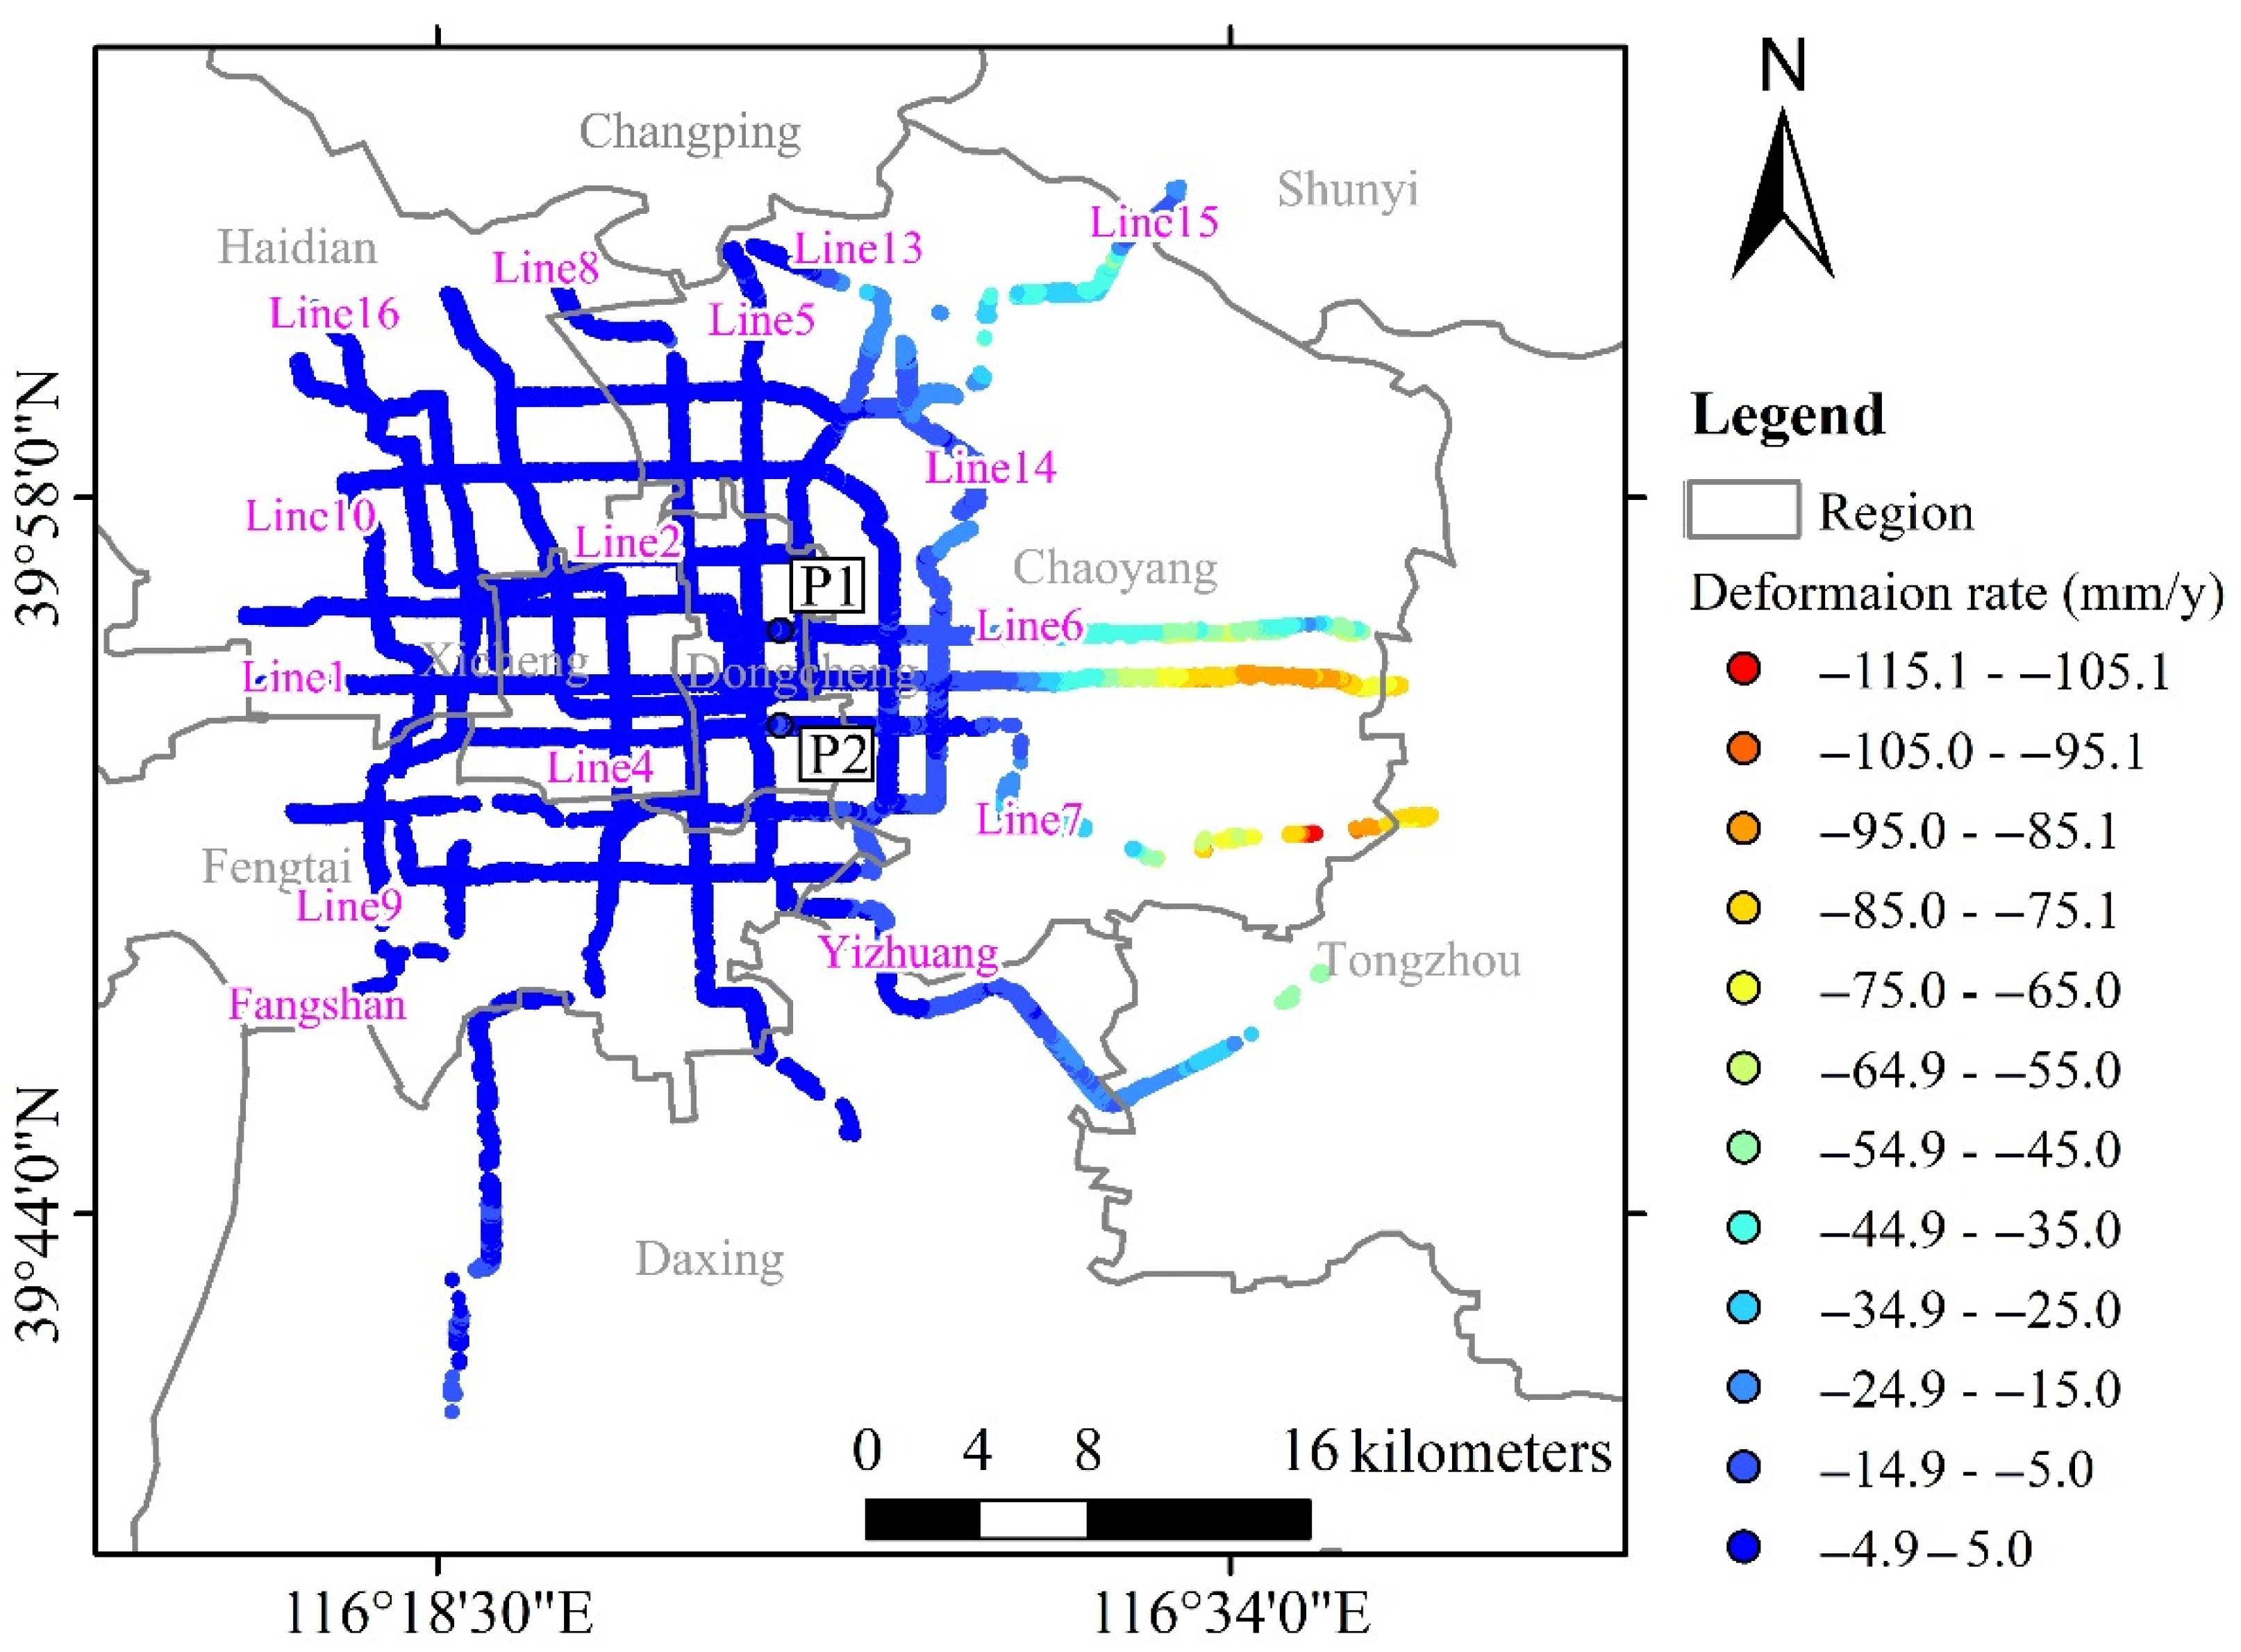
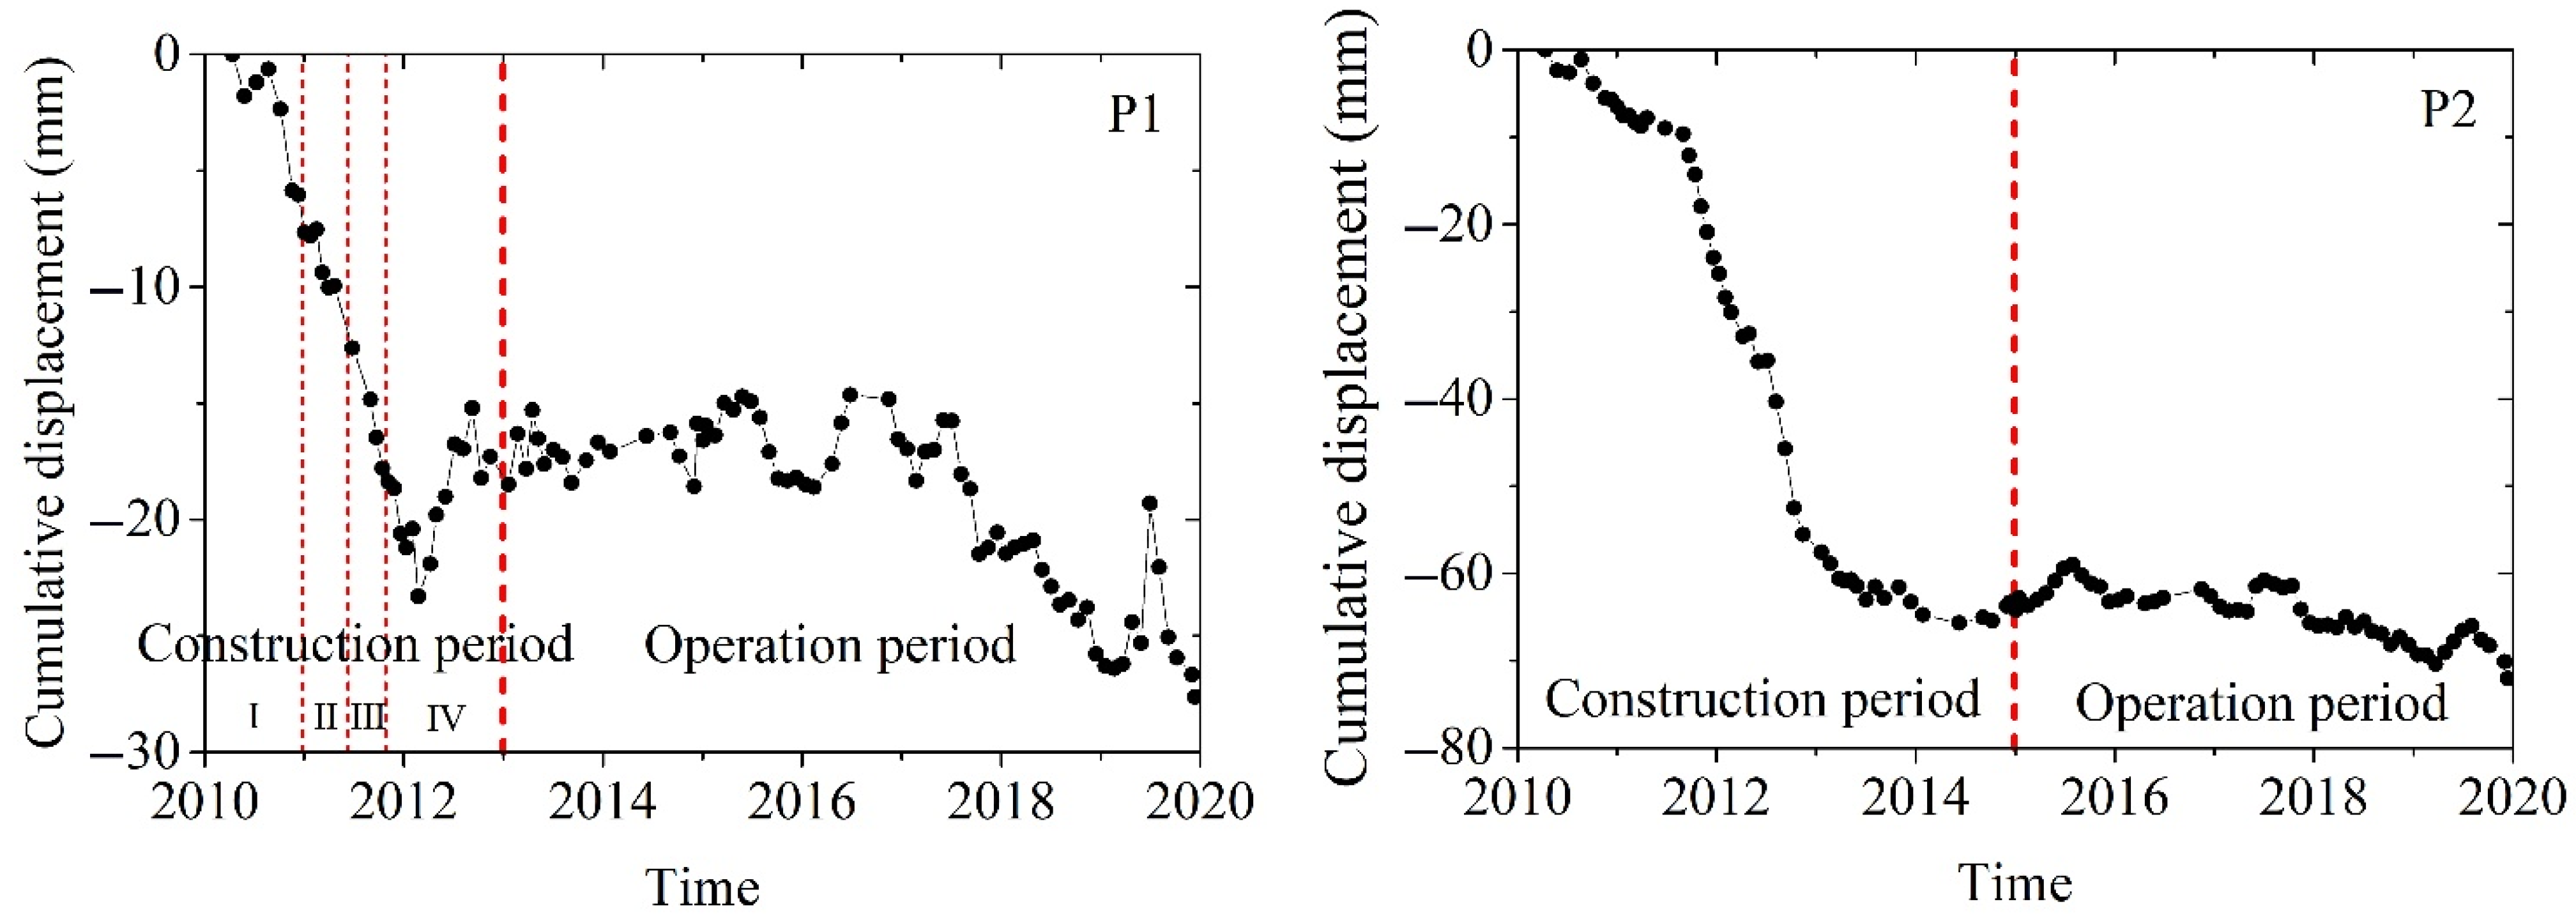
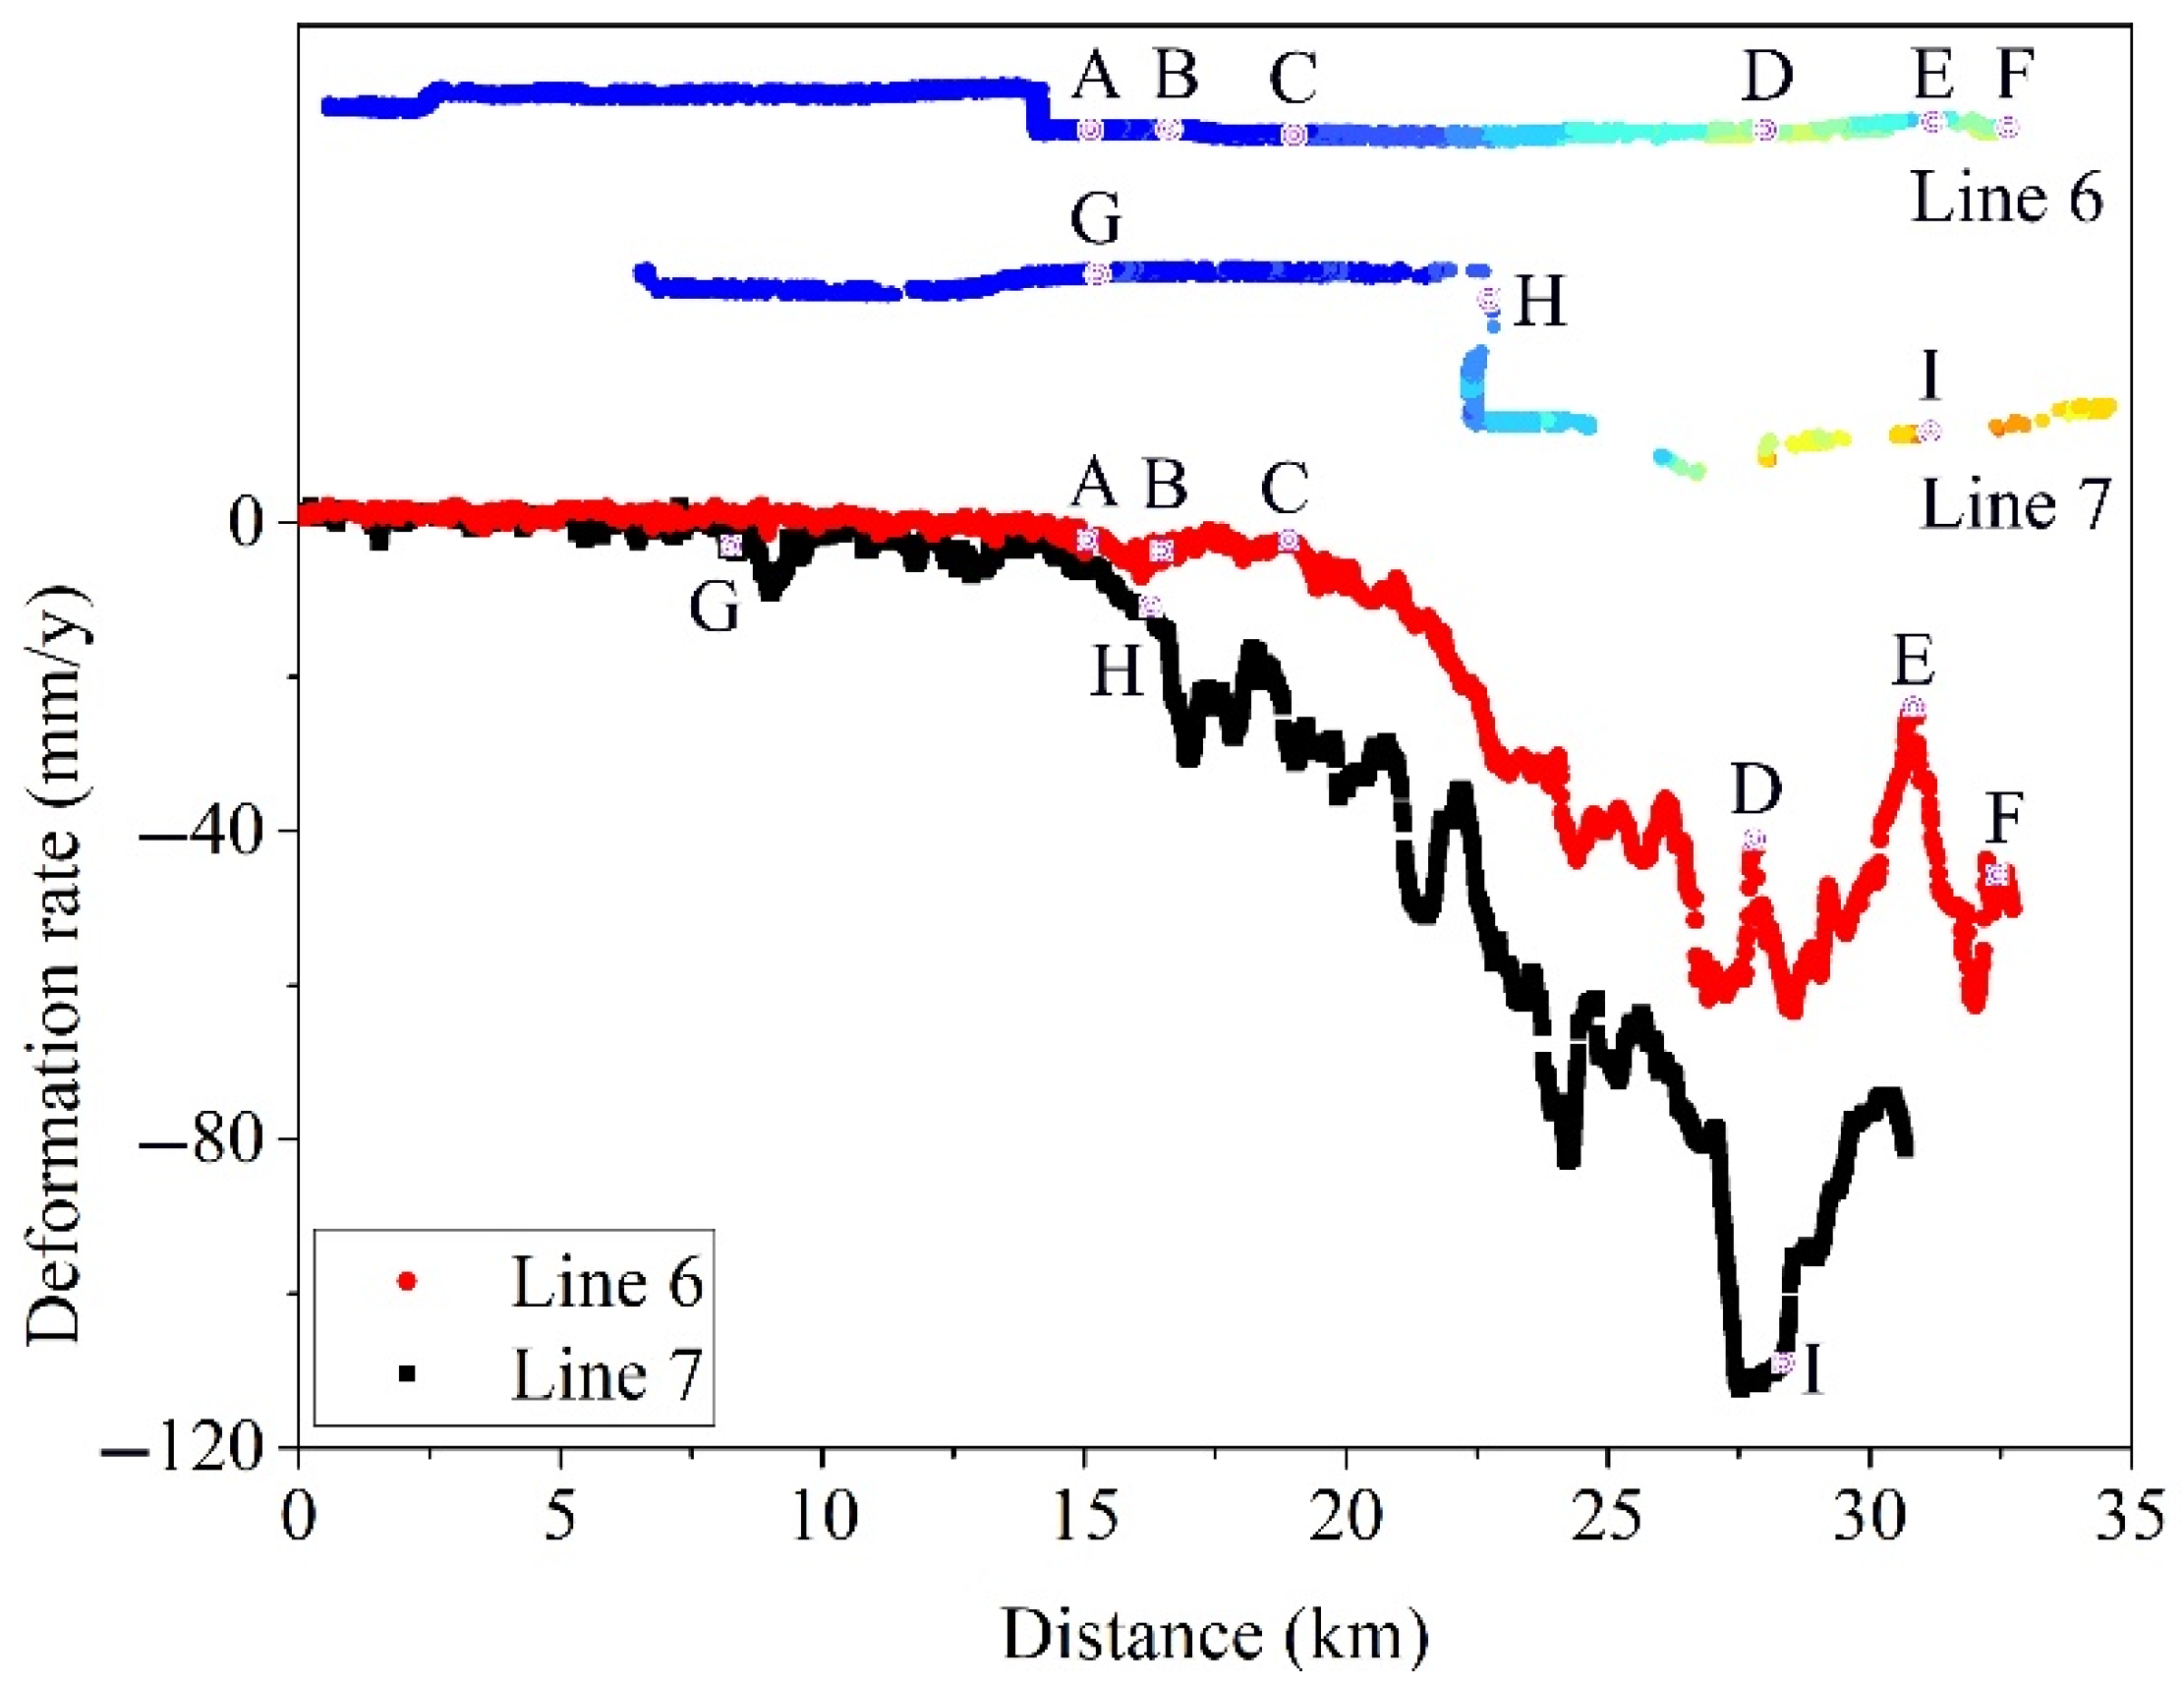
- Uneven and nonlinear land subsidence often causes greater harm. We found that, due to underground soil excavation, the ground around the subway subsided rapidly in a short time during the construction periods of Line 6 and Line 7. About 500 m to the east of the Dongsi station of Line 6, the displacement was −23.3 mm from August 2010 to February 2012. Ciqikou station of Line 7 sank about 48 mm in just 16 months from September 2011 to January 2013. During the construction period, uneven and nonlinear land subsidence needs to be paid more attention.
- (4)
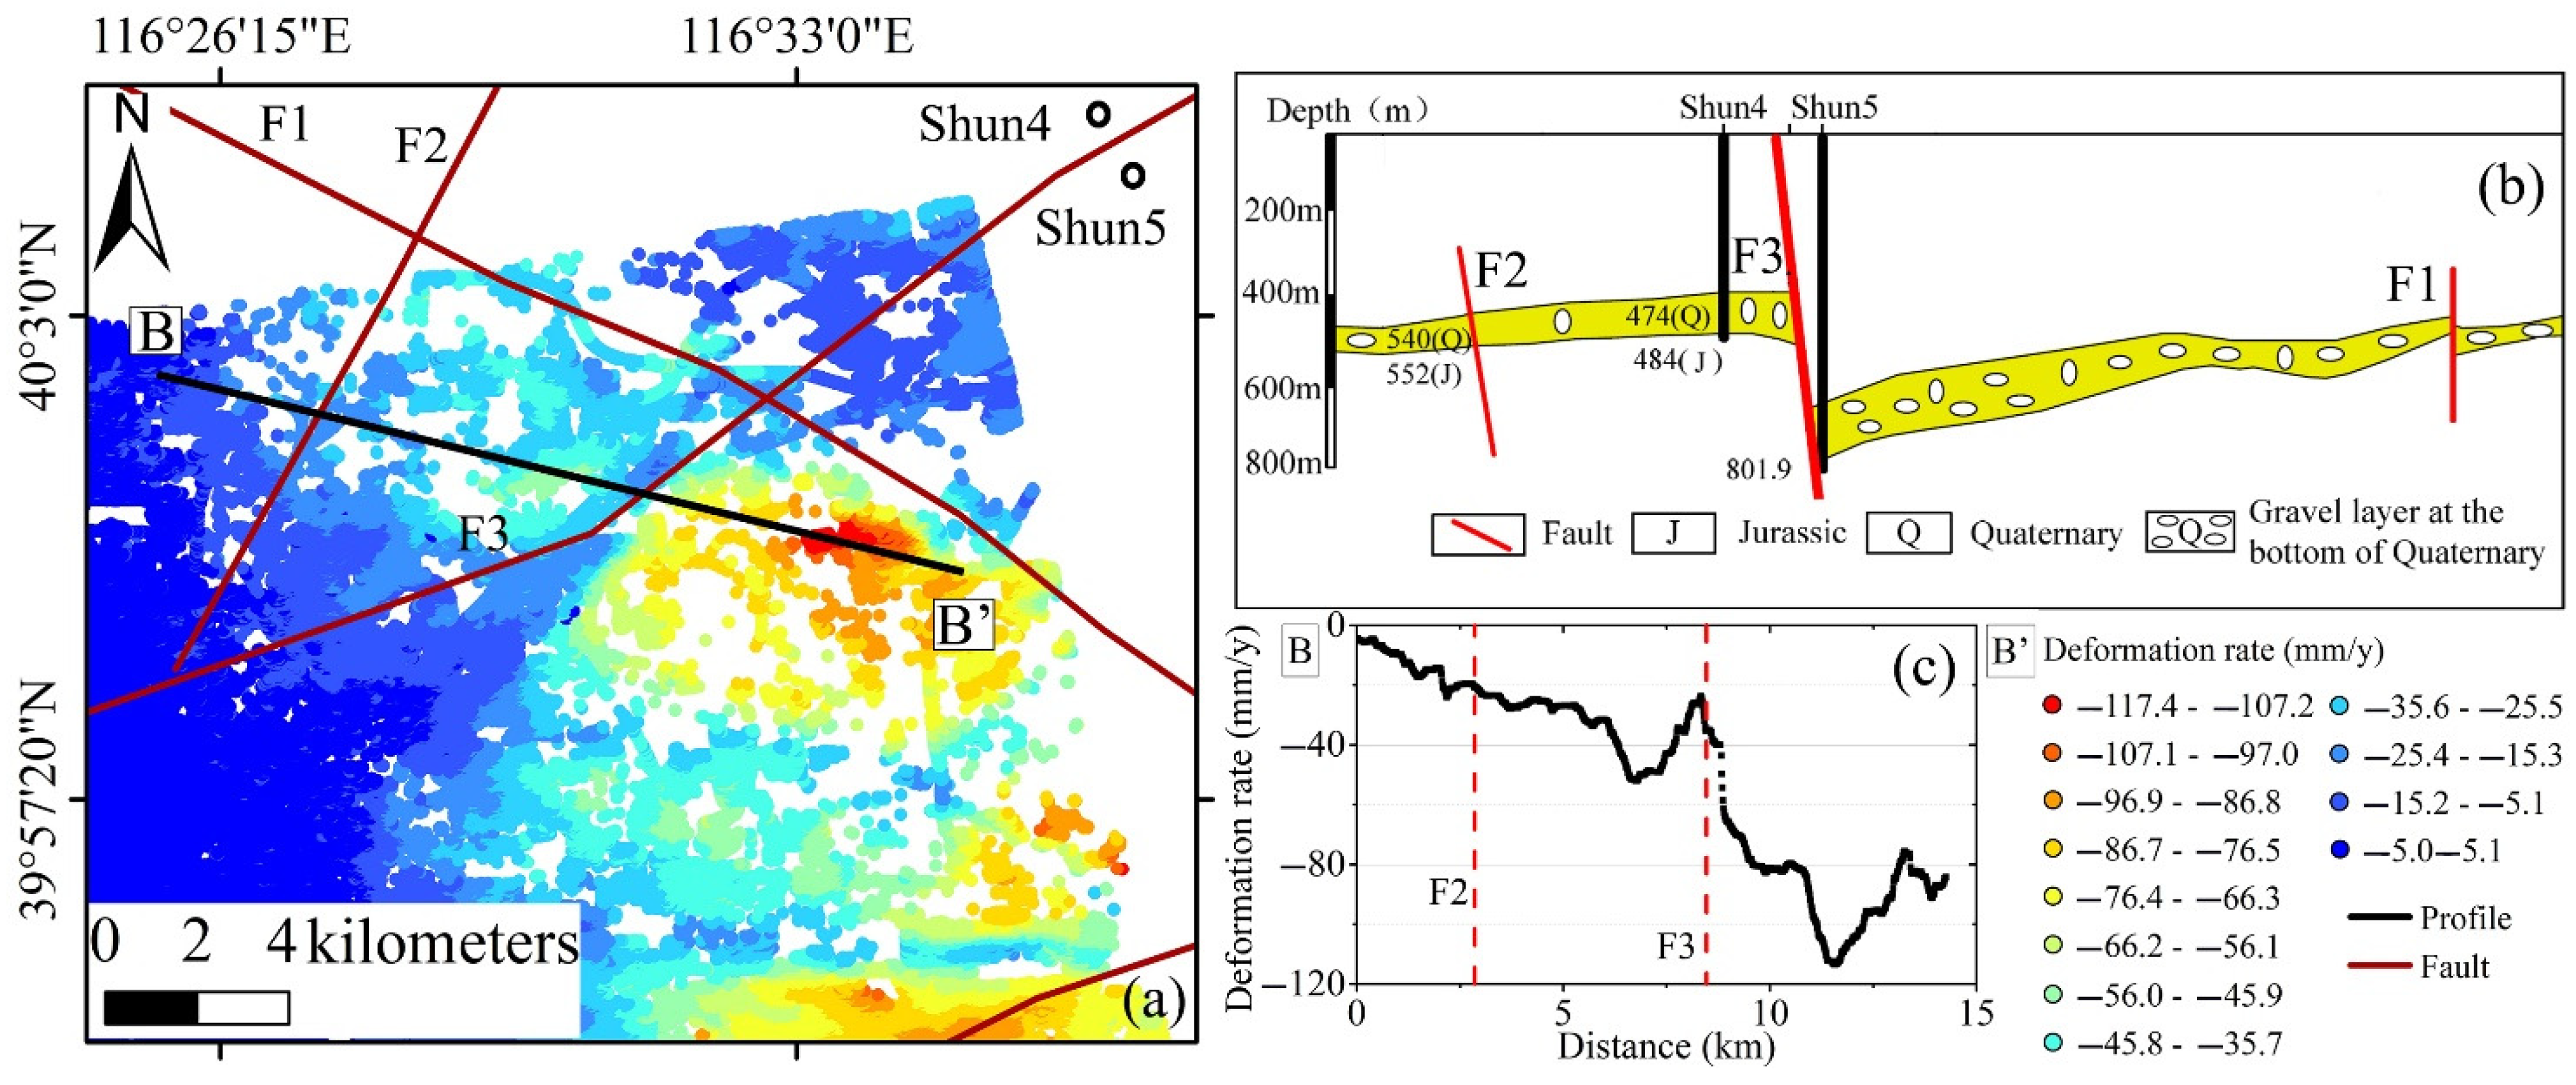
- Active faults affect the sedimentary process, leading to differences in the spatial distribution of Quaternary sedimentary layer thickness, which provides geological conditions for inducing uneven land subsidence. The land subsidence profile shows a clear turning point or sudden change on both sides of the Shunyi fault, and uneven land subsidence is distributed on both sides of the fault.
Author Contributions
Funding
Acknowledgments
Conflicts of Interest
References
- Herrera-García, G.; Ezquerro, P.; Tomás, R.; Béjar-Pizarro, M.; López-Vinielles, J.; Rossi, M.; Mateos, R.M.; Carreón-Freyre, D.; Lambert, J.; Teatini, P.; et al. Mapping the global threat of land subsidence. Science 2021, 371, 34–36. [Google Scholar] [CrossRef] [PubMed]
- Gong, H.; Pan, Y.; Zheng, L.; Li, X.; Zhu, L.; Zhang, C.; Huang, Z.; Li, Z.; Wang, H.; Zhou, C. Long-term groundwater storage changes and land subsidence development in the North China Plain (1971–2015). Appl. Hydrogeol. 2018, 26, 1417–1427. [Google Scholar] [CrossRef] [Green Version]
- Chen, J.; Knight, R.; Zebker, H.A.; Schreüder, W.A. Confined aquifer head measurements and storage properties in the San Luis Valley, Colorado, from spaceborne InSAR observations. Water Resour. Res. 2016, 52, 3623–3636. [Google Scholar] [CrossRef] [Green Version]
- Hu, X.; Lu, Z.; Wang, T. Characterization of Hydrogeological Properties in Salt Lake Valley, Utah, using InSAR. J. Geophys. Res. Earth Surf. 2018, 123, 1257–1271. [Google Scholar] [CrossRef]
- Cigna, F.; Tapete, D. Present-day land subsidence rates, surface faulting hazard and risk in Mexico City with 2014–2020 Sentinel-1 IW InSAR. Remote Sens. Environ. 2021, 253, 112161. [Google Scholar] [CrossRef]
- Du, Z.; Ge, L.; Ng, A.H.M.; Zhu, Q.; Yang, X.; Li, L. Correlating the subsidence pattern and land use in Bandung, Indonesia with both Sentinel-1/2 and ALOS-2 satellite images. Int. J. Appl. Earth Obs. Geoinf. 2018, 67, 54–68. [Google Scholar] [CrossRef]
- Najafabadi, R.M.; Ramesht, M.H.; Ghazi, I.; Khajedin, S.J.; Seif, A.; Nohegar, A.; Mahdavi, A. Identification of natural hazards and classification of urban areas by TOPSIS model (case study: Bandar Abbas city, Iran). Geomat. Nat. Hazards Risk 2016, 7, 85–100. [Google Scholar] [CrossRef]
- El Bastawesy, M.; Cherif, O.H.; Sultan, M. The geomorphological evidences of subsidence in the Nile Delta: Analysis of high resolution topographic DEM and multi-temporal satellite images. J. Afr. Earth Sci. 2017, 136, 252–261. [Google Scholar] [CrossRef]
- Teatini, P.; Baú, D.; Gambolati, G. Water-gas dynamics and coastal land subsidence over Chioggia Mare field, northern Adriatic Sea. Appl. Hydrogeol. 2000, 8, 462–479. [Google Scholar] [CrossRef]
- Brambati, A.; Carbognin, L.; Quaia, T.; Teatini, P.; Tosi, A.L. The Lagoon of Venice: Geological setting, evolution and land subsidence. Episodes 2003, 26, 264–268. [Google Scholar] [CrossRef]
- Teatini, P.; Ferronato, M.; Gambolati, G.; Gonella, M. Groundwater pumping and land subsidence in the Emilia-Romagna coastland, Italy: Modeling the past occurrence and the future trend. Water Resour. Res. 2006, 42, 1–9. [Google Scholar] [CrossRef]
- Tosi, L.; Teatini, P.; Strozzi, T. Natural versus anthropogenic subsidence of Venice. Sci. Rep. 2013, 3, 2710. [Google Scholar] [CrossRef] [PubMed] [Green Version]
- Aucelli, P.P.C.; Di Paola, G.; Incontri, P.; Rizzo, A.; Vilardo, G.; Benassai, G.; Buonocore, B.; Pappone, G. Coastal Inundation Risk Assessment Due to Subsidence and Sea Level Rise in a Mediterranean Alluvial Plain (Volturno Coastal Plain—Southern Italy). Estuar. Coast. Shelf Sci. 2017, 198, 597–609. [Google Scholar] [CrossRef]
- Matano, F.; Sacchi, M.; Vigliotti, M.; Ruberti, D. Subsidence Trends of Volturno River Coastal Plain (Northern Campania, Southern Italy) Inferred by SAR Interferometry Data. Geosciences 2018, 8, 8. [Google Scholar] [CrossRef] [Green Version]
- Busico, G.; Buffardi, C.; Ntona, M.M.; Vigliotti, M.; Colombani, N.; Mastrocicco, M.; Ruberti, D. Actual and Forecasted Vulnerability Assessment to Seawater Intrusion via GALDIT-SUSI in the Volturno River Mouth (Italy). Remote Sens. 2021, 13, 3632. [Google Scholar] [CrossRef]
- Buffardi, C.; Barbato, R.; Vigliotti, M.; Mandolini, A.; Ruberti, D. The Holocene Evolution of the Volturno Coastal Plain (Northern Campania, Southern Italy): Implications for the Understanding of Subsidence Patterns. Water 2021, 13, 2692. [Google Scholar] [CrossRef]
- Herrera, G.; Fernández, J.A.; Tomás, R.; Cooksley, G.; Mulas, J. Advanced interpretation of subsidence in Murcia (SE Spain) using A-DInSAR data—Modelling and validation. Nat. Hazards Earth Syst. Sci. 2009, 9, 647–661. [Google Scholar] [CrossRef] [Green Version]
- Bonì, R.; Herrera, G.; Meisina, C.; Notti, D.; Béjar-Pizarro, M.; Zucca, F.; Gonzalez, P.J.; Palano, M.; Tomás, R.; Fernandez, J.; et al. Twenty-year advanced DInSAR analysis of severe land subsidence: The Alto Guadalentín Basin (Spain) case study. Eng. Geol. 2015, 198, 40–52. [Google Scholar] [CrossRef] [Green Version]
- Muntendam-Bos, A.G.; Kleuskens, M.H.P.; Bakr, M.; de Lange, G.; Fokker, P.A. Unraveling shallow causes of subsidence. Geophys. Res. Lett. 2009, 36. [Google Scholar] [CrossRef]
- Weststrate, T.W. Urban Land Subsidence in the Netherlands. Master’s Thesis, Radboud University, Nijmegen, The Netherlands, 9–11 July 2018. [Google Scholar]
- Ge, L.; Li, X.; Chang, H.-C.; Ng, A.H.M.; Zhang, K.; Hu, Z. Impact of ground subsidence on the Beijing–Tianjin high-speed railway as mapped by radar interferometry. Ann. GIS 2010, 16, 91–102. [Google Scholar] [CrossRef]
- Yang, M.; Yang, T.; Zhang, L.; Lin, J.; Qin, X.; Liao, M. Spatio-Temporal Characterization of a Reclamation Settlement in the Shanghai Coastal Area with Time Series Analyses of X-, C-, and L-Band SAR Datasets. Remote Sens. 2018, 10, 329. [Google Scholar] [CrossRef] [Green Version]
- Qu, F.; Zhang, Q.; Lu, Z.; Zhao, C.; Yang, C.; Zhang, J. Land subsidence and ground fissures in Xi’an, China 2005–2012 revealed by multi-band InSAR time-series analysis. Remote Sens. Environ. 2014, 155, 366–376. [Google Scholar] [CrossRef]
- Jiang, H.; Balz, T.; Cigna, F.; Tapete, D. Land Subsidence in Wuhan Revealed Using a Non-Linear PSInSAR Approach with Long Time Series of COSMO-SkyMed SAR Data. Remote Sens. 2021, 13, 1256. [Google Scholar] [CrossRef]
- Ai, J.; Mao, Y.; Luo, Q.; Jia, L.; Xing, M. SAR Target Classification Using the Multikernel-Size Feature Fusion-Based Convolutional Neural Network. IEEE Trans. Geosci. Remote Sens. 2022, 60, 5214313. [Google Scholar] [CrossRef]
- Ai, J.; Tian, R.; Luo, Q.; Jin, J.; Tang, B. Multi-Scale Rotation-Invariant Haar-Like Feature Integrated CNN-Based Ship Detection Algorithm of Multiple-Target Environment in SAR Imagery. IEEE Trans. Geosci. Remote Sens. 2019, 57, 10070–10087. [Google Scholar] [CrossRef]
- Minh, D.H.T.; Hanssen, R.; Rocca, F. Radar Interferometry: 20 Years of Development in Time Series Techniques and Future Perspectives. Remote Sens. 2020, 12, 1364. [Google Scholar] [CrossRef]
- Mora, O.; Lanari, R.; Mallorqui, J.J.; Berardino, P.; Sansosti, E. Landslide failures detection and mapping using Synthetic Aperture Radar: Past, present and future. Earth Sci. Rev. 2021, 216, 103574. [Google Scholar] [CrossRef]
- Ferretti, A.; Prati, C.; Rocca, F. Nonlinear Subsidence Rate Estimation Using permanent scatterers in differential SAR interferometry. IEEE Trans. Geosci. Remote Sens. 2000, 38, 2202–2212. [Google Scholar] [CrossRef] [Green Version]
- Berardino, P.; Fornaro, G.; Lanari, R.; Sansosti, E. A new algorithm for surface deformation monitoring based on small baseline differential SAR interferograms. IEEE Trans. Geosci. Remote Sens. 2002, 40, 2375–2383. [Google Scholar] [CrossRef] [Green Version]
- Zhang, L.; Lu, Z.; Ding, X.; Jung, H.-S.; Feng, G.; Lee, C.-W. Mapping ground surface deformation using temporarily coherent point SAR interferometry: Application to Los Angeles Basin. Remote Sens. Environ. 2012, 117, 429–439. [Google Scholar] [CrossRef]
- Perissin, D.; Wang, T. Repeat-Pass SAR Interferometry with Partially Coherent Targets. IEEE Trans. Geosci. Remote. Sens. 2011, 50, 271–280. [Google Scholar] [CrossRef]
- Zhu, X.X.; Wang, Y.; Montazeri, S.; Ge, N. A Review of Ten-Year Advances of Multi-Baseline SAR Interferometry Using TerraSAR-X Data. Remote Sens. 2018, 10, 1374. [Google Scholar] [CrossRef] [Green Version]
- Chen, B.; Gong, H.; Li, X.; Lei, K.; Zhang, Y.; Li, J.; Gu, Z.; Dang, Y. Spatial-temporal characteristics of land subsidence corresponding to dynamic groundwater funnel in Beijing Municipality, China. Chin. Geogr. Sci. 2011, 21, 753–764. [Google Scholar] [CrossRef]
- Ng, A.H.-M.; Ge, L.; Li, X.; Zhang, K. Monitoring ground deformation in Beijing, China with persistent scatterer SAR interferometry. J. Geod. 2012, 86, 375–392. [Google Scholar] [CrossRef]
- Hu, B.; Wang, H.-S.; Sun, Y.-L.; Hou, J.-G.; Liang, J. Long-Term Land Subsidence Monitoring of Beijing (China) Using the Small Baseline Subset (SBAS) Technique. Remote Sens. 2014, 6, 3648–3661. [Google Scholar] [CrossRef] [Green Version]
- Zhu, L.; Gong, H.; Li, X.; Wang, R.; Chen, B.; Dai, Z.; Teatini, P. Land subsidence due to groundwater withdrawal in the northern Beijing plain, China. Eng. Geol. 2015, 193, 243–255. [Google Scholar] [CrossRef]
- Chen, M.; Tomás, R.; Li, Z.; Motagh, M.; Li, T.; Hu, L.; Gong, H.; Li, X.; Yu, J.; Gong, X. Imaging Land Subsidence Induced by Groundwater Extraction in Beijing (China) Using Satellite Radar Interferometry. Remote Sens. 2016, 8, 468. [Google Scholar] [CrossRef] [Green Version]
- Gao, M.; Gong, H.; Chen, B.; Zhou, C.; Chen, W.; Liang, Y.; Shi, M.; Si, Y. InSAR time-series investigation of long-term ground displacement at Beijing Capital International Airport, China. Tectonophysics 2016, 691, 271–281. [Google Scholar] [CrossRef]
- Zhang, Y.; Wu, H.; Kang, Y.; Zhu, C. Ground Subsidence in the Beijing-Tianjin-Hebei Region from 1992 to 2014 Revealed by Multiple SAR Stacks. Remote Sens. 2016, 8, 675. [Google Scholar] [CrossRef] [Green Version]
- Chen, B.; Gong, H.; Li, X.; Lei, K.; Zhu, L.; Gao, M.; Zhou, C. Characterization and causes of land subsidence in Beijing, China. Int. J. Remote Sens. 2017, 38, 808–826. [Google Scholar] [CrossRef]
- Zhou, C.; Gong, H.; Chen, B.; Li, J.; Gao, M.; Zhu, F.; Chen, W.; Liang, Y. InSAR Time-Series Analysis of Land Subsidence under Different Land Use Types in the Eastern Beijing Plain, China. Remote Sens. 2017, 9, 380. [Google Scholar] [CrossRef] [Green Version]
- Gao, M.; Gong, H.; Chen, B.; Li, X.; Zhou, C.; Shi, M.; Si, Y.; Chen, Z.; Duan, G. Regional Land Subsidence Analysis in Eastern Beijing Plain by InSAR Time Series and Wavelet Transforms. Remote Sens. 2018, 10, 365. [Google Scholar] [CrossRef] [Green Version]
- Yang, Q.; Ke, Y.; Zhang, D.; Chen, B.; Gong, H.; Lv, M.; Zhu, L.; Li, X. Multi-Scale Analysis of the Relationship between Land Subsidence and Buildings: A Case Study in an Eastern Beijing Urban Area Using the PS-InSAR Technique. Remote Sens. 2018, 10, 1006. [Google Scholar] [CrossRef] [Green Version]
- Zhou, C.; Gong, H.; Zhang, Y.; Warner, T.A.; Wang, C. Spatiotemporal Evolution of Land Subsidence in the Beijing Plain 2003–2015 Using Persistent Scatterer Interferometry (PSI) with Multi-Source SAR Data. Remote Sens. 2018, 10, 552. [Google Scholar] [CrossRef] [Green Version]
- Gao, M.; Gong, H.; Li, X.; Chen, B.; Zhou, C.; Shi, M.; Guo, L.; Chen, Z.; Ni, Z.; Duan, G. Land Subsidence and Ground Fissures in Beijing Capital International Airport (BCIA): Evidence from Quasi-PS InSAR Analysis. Remote Sens. 2019, 11, 1466. [Google Scholar] [CrossRef] [Green Version]
- Zhou, C.; Lan, H.; Gong, H.; Zhang, Y.; Warner, T.A.; Clague, J.J.; Wu, Y. Reduced rate of land subsidence since 2016 in Beijing, China: Evidence from Tomo-PSInSAR using RadarSAT-2 and Sentinel-1 datasets. Int. J. Remote Sens. 2020, 41, 1259–1285. [Google Scholar] [CrossRef]
- Duan, L.; Gong, H.; Chen, B.; Zhou, C.; Lei, K.; Gao, M.; Yu, H.; Cao, Q.; Cao, J. An Improved Multi-Sensor MTI Time-Series Fusion Method to Monitor the Subsidence of Beijing Subway Network During the Past 15 Years. Remote Sens. 2020, 12, 2125. [Google Scholar] [CrossRef]
- Shi, M.; Gong, H.; Gao, M.; Chen, B.; Zhang, S.; Zhou, C. Recent Ground Subsidence in the North China Plain, China, Revealed by Sentinel-1A Datasets. Remote Sens. 2020, 12, 3579. [Google Scholar] [CrossRef]
- Lyu, M.; Ke, Y.; Li, X.; Zhu, L.; Guo, L.; Gong, H. Detection of Seasonal Deformation of Highway Overpasses Using the PS-InSAR Technique: A Case Study in Beijing Urban Area. Remote Sens. 2020, 12, 3071. [Google Scholar] [CrossRef]
- Zhao, X.; Chen, B.; Gong, H.; Zhou, C.; Li, X.; Lei, K.; Ke, Y. Land subsidence along the Beijing–Tianjin Intercity Railway during the period of the South-to-North Water Diversion Project. Int. J. Remote Sens. 2020, 41, 4447–4469. [Google Scholar] [CrossRef]
- Zhou, C.; Gong, H.; Chen, B.; Gao, M.; Cao, Q.; Cao, J.; Duan, L.; Zuo, J.; Shi, M. Land Subsidence Response to Different Land Use Types and Water Resource Utilization in Beijing-Tianjin-Hebei, China. Remote Sens. 2020, 12, 457. [Google Scholar] [CrossRef] [Green Version]
- Chen, B.; Gong, H.; Chen, Y.; Li, X.; Zhou, C.; Lei, K.; Zhu, L.; Duan, L.; Zhao, X. Land subsidence and its relation with groundwater aquifers in Beijing Plain of China. Sci. Total Environ. 2020, 735, 139111. [Google Scholar] [CrossRef] [PubMed]
- Chen, B.; Gong, H.; Chen, Y.; Lei, K.; Zhou, C.; Si, Y.; Li, X.; Pan, Y.; Gao, M. Investigating land subsidence and its causes along Beijing high-speed railway using multi-platform InSAR and a maximum entropy model. Int. J. Appl. Earth Obs. Geoinf. ITC J. 2021, 96, 102284. [Google Scholar] [CrossRef]
- Wang, Y.; Bai, Z.; Zhang, Y.; Qin, Y.; Lin, Y.; Li, Y.; Shen, W. Using TerraSAR X-Band and Sentinel-1 C-Band SAR Interferometry for Deformation Along Beijing-Tianjin Intercity Railway Analysis. IEEE J. Sel. Top. Appl. Earth Obs. Remote Sens. 2021, 14, 4832–4841. [Google Scholar] [CrossRef]
- Du, Z.; Ge, L.; Ng, A.H.-M.; Lian, X.; Zhu, Q.; Horgan, F.G.; Zhang, Q. Analysis of the impact of the South-to-North water diversion project on water balance and land subsidence in Beijing, China between 2007 and 2020. J. Hydrol. 2021, 603, 126990. [Google Scholar] [CrossRef]
- Lei, K.; Ma, F.; Chen, B.; Luo, Y.; Cui, W.; Zhou, Y.; Liu, H.; Sha, T. Three-Dimensional Surface Deformation Characteristics Based on Time Series InSAR and GPS Technologies in Beijing, China. Remote Sens. 2021, 13, 3964. [Google Scholar] [CrossRef]
- Milillo, P.; Giardina, G.; Perissin, D.; Milillo, G.; Coletta, A.; Terranova, C. Pre-Collapse Space Geodetic Observations of Critical Infrastructure: The Morandi Bridge, Genoa, Italy. Remote Sens. 2019, 11, 1403. [Google Scholar] [CrossRef] [Green Version]
- Moreira, A.; Prats-Iraola, P.; Younis, M.; Krieger, G.; Hajnsek, I.; Papathanassiou, K.P. A tutorial on synthetic aperture radar. IEEE Geosci. Remote Sens. Mag. 2013, 1, 6–43. [Google Scholar] [CrossRef] [Green Version]
- Xu, Y.; Gong, H.; Chen, B.; Zhang, Q.; Li, Z. Long-term and seasonal variation in groundwater storage in the North China Plain based on GRACE. Int. J. Appl. Earth Obs. Geoinf. ITC J. 2021, 104, 102560. [Google Scholar] [CrossRef]


| Study | Method | Dataset | Key Results |
|---|---|---|---|
| Zhu et al., 2015 [37] | PS-InSAR | 37 ENVISAT ASAR (200306-201001) | The thickness of compressible sediments is related to the distribution of uneven land subsidence. |
| Zhang et al., 2016 [40] | MCTSB-InSAR | 21 ERS-1/2 (199205-200006) 24 ENVISAT ASAR (200306-201009) 19 RADARSAR-2 (201201-201407) | There are differences in spatial distribution and intensity of land subsidence within the monitoring time. |
| Zhou et al., 2018 [45] | PS-InSAR | 48 ENVISAT ASAR (200306-201008) 51 TerraSAR-X (201004-201512) 40 RADARSAR-2 (201106-201512) | The subsidence area is related to the groundwater depression area. |
| Gao et al., 2019 [46] | QPS-InSAR | 63 TerraSAR-X (201004-201712) | The uneven land subsidence distribution is affected by the faults. |
| Chen et al., 2021 [54] | PS-InSAR | 46 ENVISAT ASAR (200306-201008) 48 TerraSAR-X (201005-201511) | The thickness of compressible sediments and groundwater levels are related to the distribution of land subsidence. |
| Wang et al., 2021 [55] | PS-InSAR | 31 Sentinel-1 (201506-201703) 49 TerraSAR-X (201501-201703) | There is differential deformation in the Beijing Tianjin Intercity Railway. |
| Parameter | TerraSAR-X |
|---|---|
| Band | X |
| Wavelength (cm) | 3.1 |
| Incident angle (°) | 33.2 |
| Product type | SLC |
| Polarization | HH |
| Sensor mode | Stripmap |
| Orbit direction | Ascending |
| Spatial resolution (m) | 3 |
| No. of images | 100 |
| Time range | April 2010–December 2019 |
| Year | Average Groundwater Level (m) | Change in Groundwater Storage Volume (×109 m3) | Water Volume of the SNWDP Brought into Beijing (× 109 m3) |
|---|---|---|---|
| 2010 | 24.92 | −0.440 | |
| 2011 | 24.94 | −0.010 | |
| 2012 | 24.27 | +0.340 | |
| 2013 | 24.52 | −0.128 | |
| 2014 | 25.66 | −0.580 | 0.084 |
| 2015 | 25.75 | −0.050 | 0.881 |
| 2016 | 25.23 | +0.270 | 1.063 |
| 2017 | 24.97 | +0.130 | 1.077 |
| 2018 | 23.03 | +0.990 | 1.192 |
| 2019 | 22.71 | +0.160 | 0.985 |
| Name | First Opening Date | Average Deformation Rate (mm/y) | Maximum Deformation Rate (mm/y) |
|---|---|---|---|
| Line 1 and Batong | 1971 | −22.5 | −96.1 |
| Line 2 | 1971 | −0.1 | −6.8 |
| Line 4 | 2009 | 0.1 | −14.4 |
| Line 5 | 2007 | −1.4 | −7.9 |
| Line 6 | 2012 | −13.8 | −70.4 |
| Line 7 | 2014 | −10.0 | −115.1 |
| Line 8 | 2008 | −0.1 | −13.0 |
| Line 9 | 2011 | 1.5 | −4.1 |
| Line 10 | 2008 | −0.6 | −11.6 |
| Line 13 | 2002 | −1.8 | −26.6 |
| Line 14 | 2013 | −5.3 | −25.0 |
| Line 15 | 2010 | −8.2 | −48.2 |
| Line 16 | 2016 | 0.4 | −9.2 |
| Fangshan | 2010 | 1.4 | −2.9 |
| Yizhuang | 2010 | −11.8 | −50.9 |
Publisher’s Note: MDPI stays neutral with regard to jurisdictional claims in published maps and institutional affiliations. |
© 2022 by the authors. Licensee MDPI, Basel, Switzerland. This article is an open access article distributed under the terms and conditions of the Creative Commons Attribution (CC BY) license (https://creativecommons.org/licenses/by/4.0/).
Share and Cite
Bai, Z.; Wang, Y.; Balz, T. Beijing Land Subsidence Revealed Using PS-InSAR with Long Time Series TerraSAR-X SAR Data. Remote Sens. 2022, 14, 2529. https://doi.org/10.3390/rs14112529
Bai Z, Wang Y, Balz T. Beijing Land Subsidence Revealed Using PS-InSAR with Long Time Series TerraSAR-X SAR Data. Remote Sensing. 2022; 14(11):2529. https://doi.org/10.3390/rs14112529
Chicago/Turabian StyleBai, Zechao, Yanping Wang, and Timo Balz. 2022. "Beijing Land Subsidence Revealed Using PS-InSAR with Long Time Series TerraSAR-X SAR Data" Remote Sensing 14, no. 11: 2529. https://doi.org/10.3390/rs14112529
APA StyleBai, Z., Wang, Y., & Balz, T. (2022). Beijing Land Subsidence Revealed Using PS-InSAR with Long Time Series TerraSAR-X SAR Data. Remote Sensing, 14(11), 2529. https://doi.org/10.3390/rs14112529