
Sentinel-1 SAR Backscatter Response to Agricultural Drought in The Netherlands


Abstract
:1. Introduction
2. Data and Methods
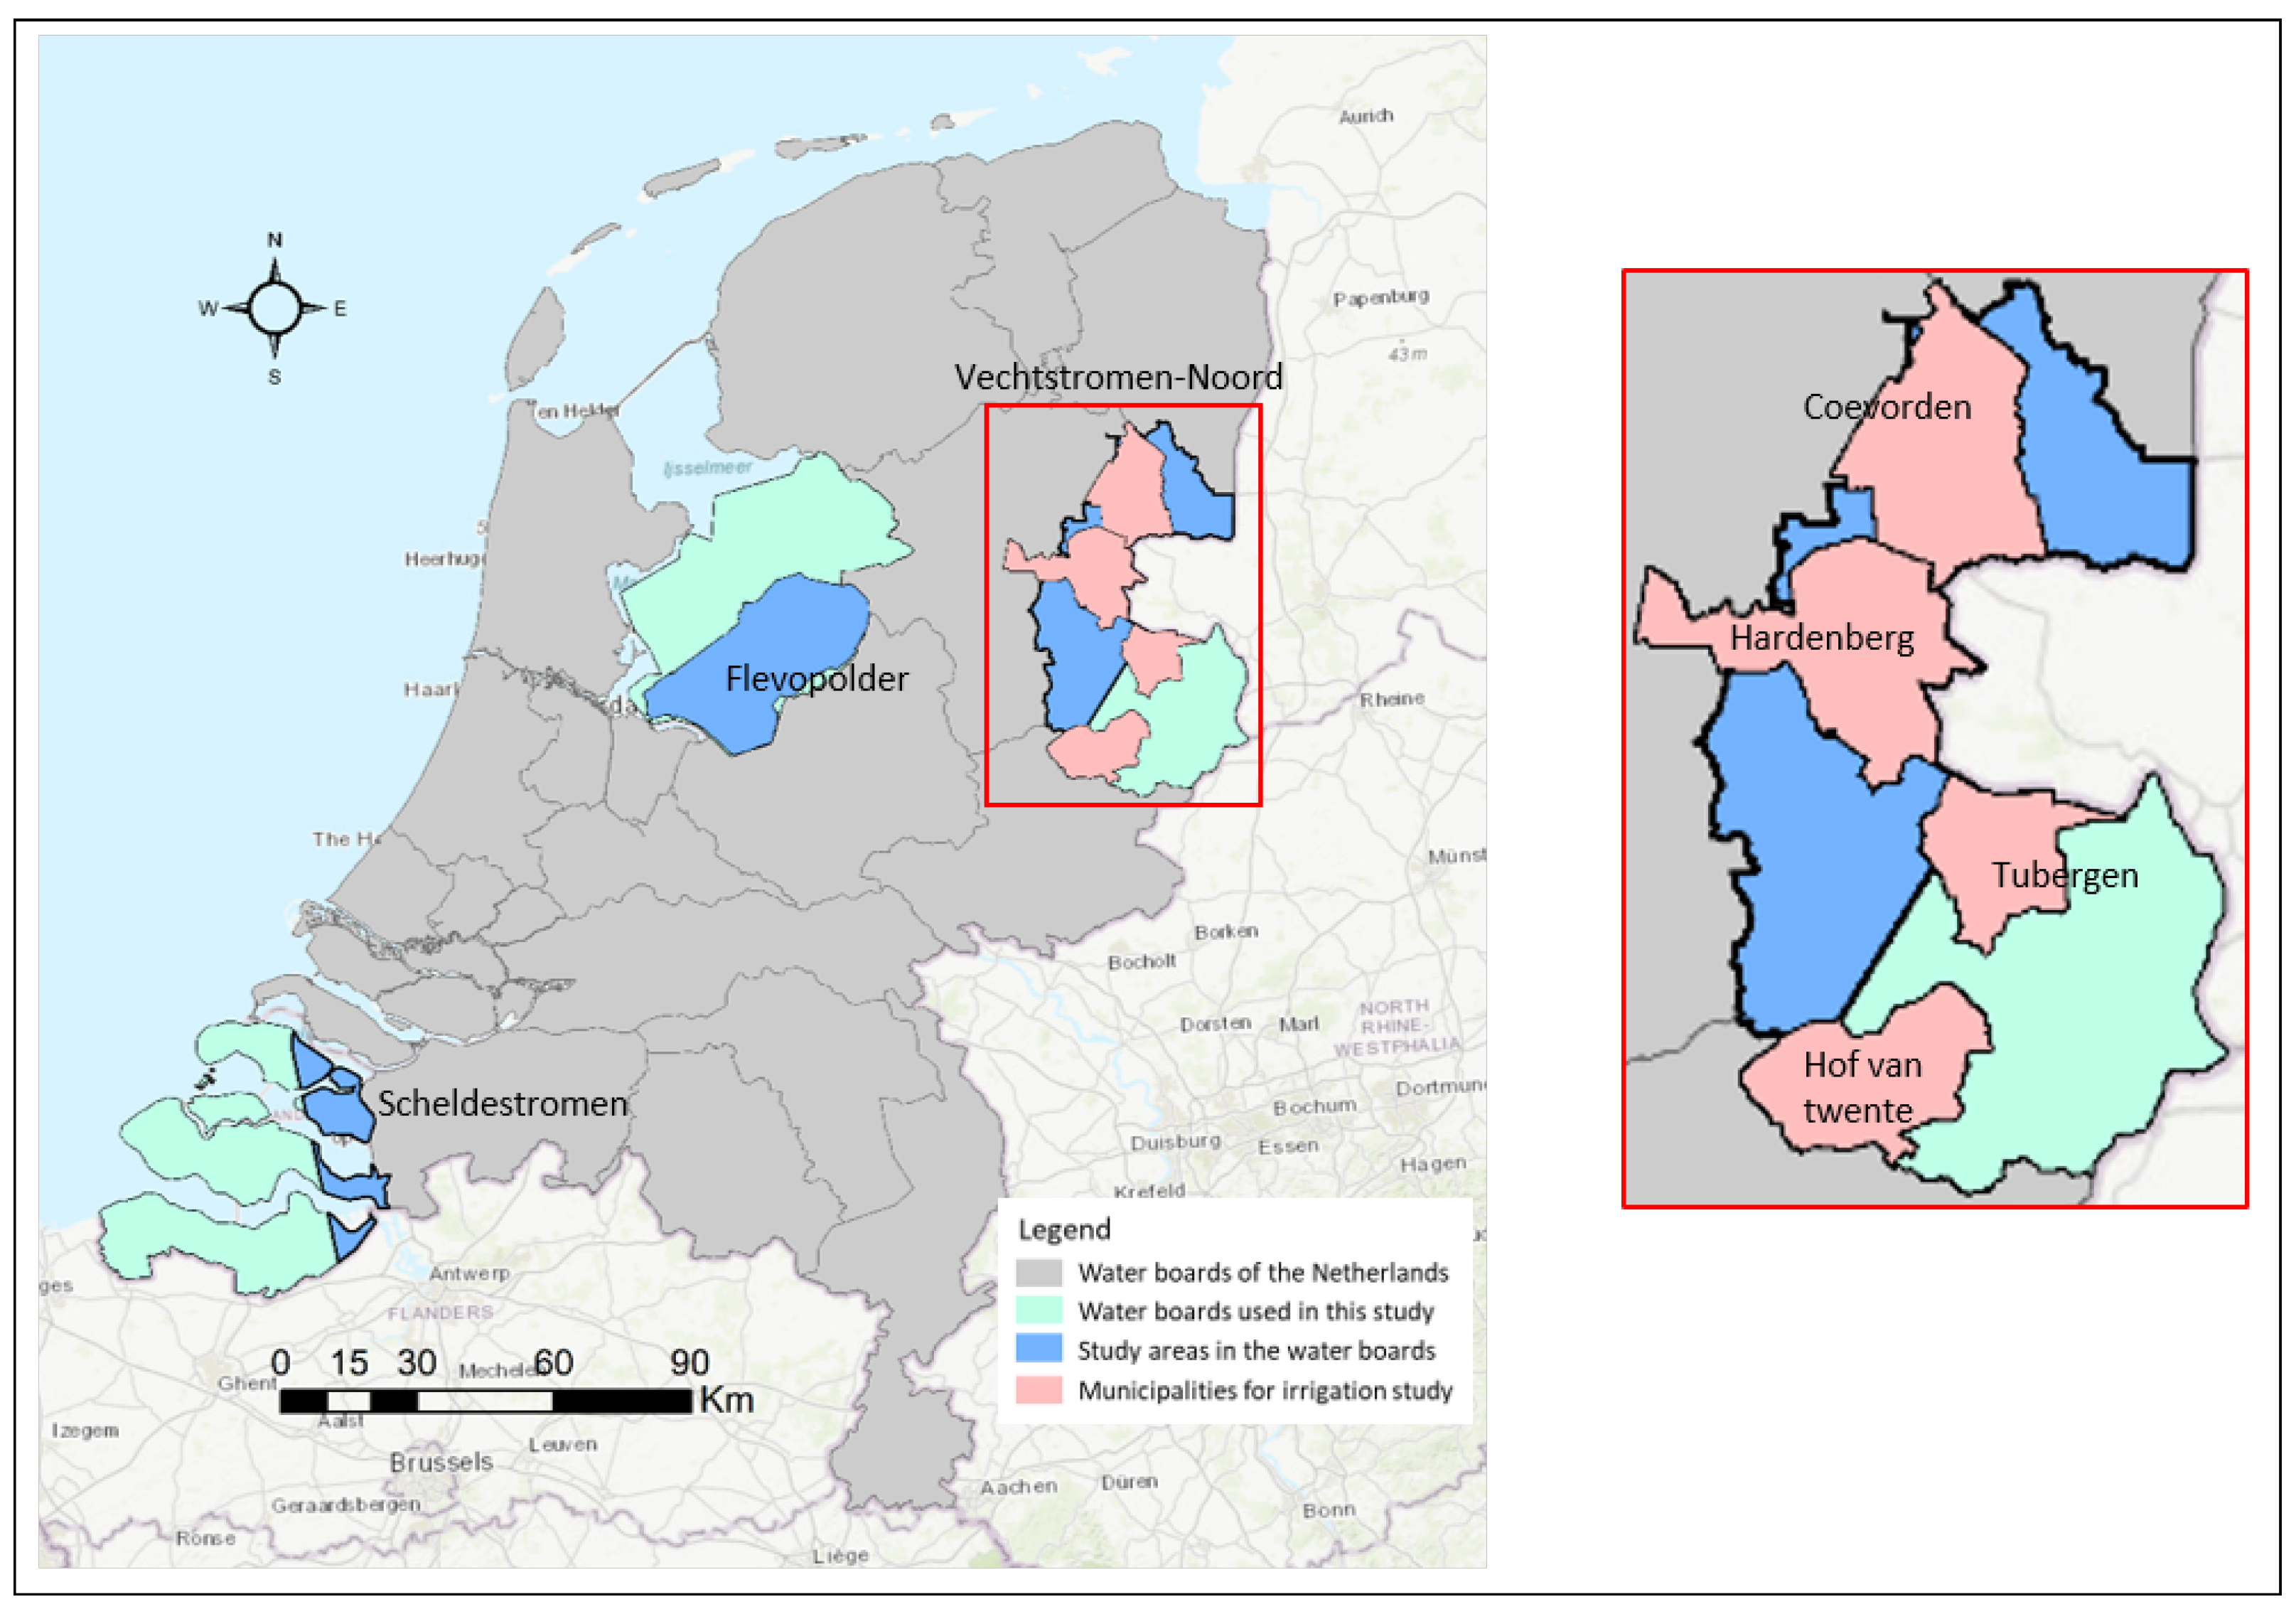
2.1. Study Area
2.2. Crop, Soil Moisture and Meteorological Data
2.3. Sentinel-1 SAR Data
2.4. Analysis
3. Results
3.1. Influence of Drought on the Seasonal Cycle of Sentinel-1 SAR Data over Agricultural Crops
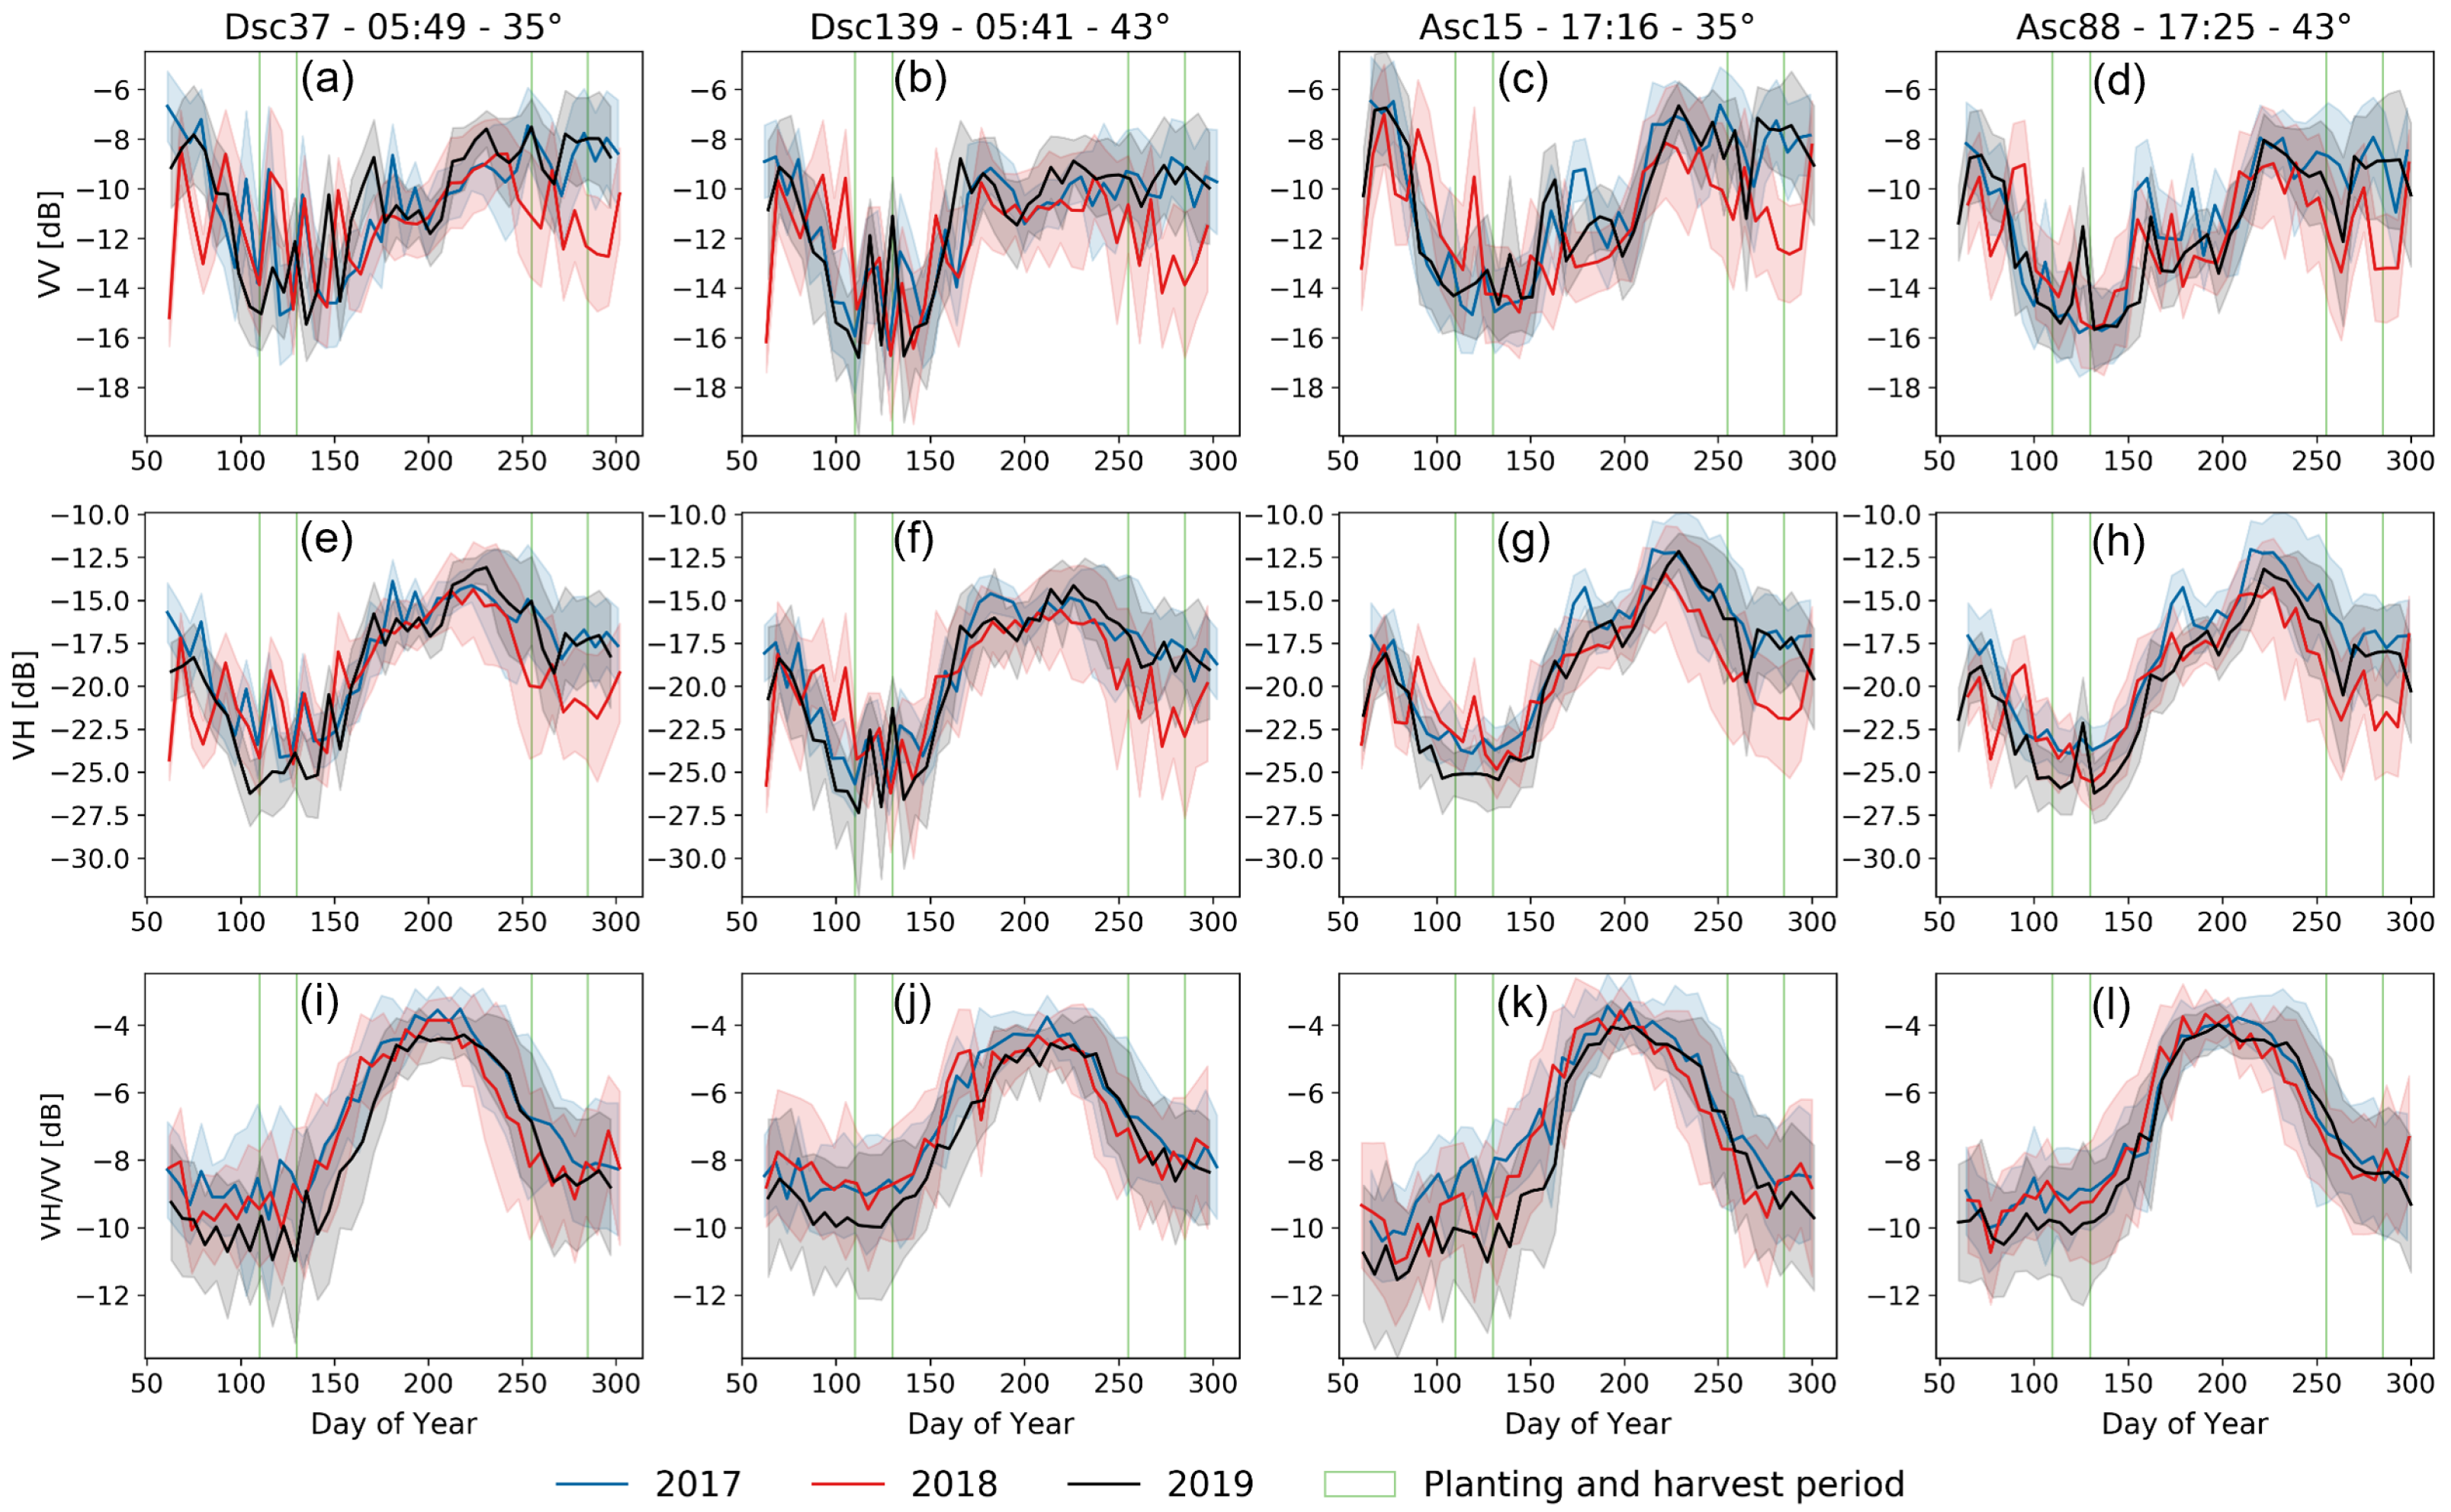
3.1.1. Maize
3.1.2. Onion
3.2. Regional Variability in the Drought Response Observed Using Sentinel-1
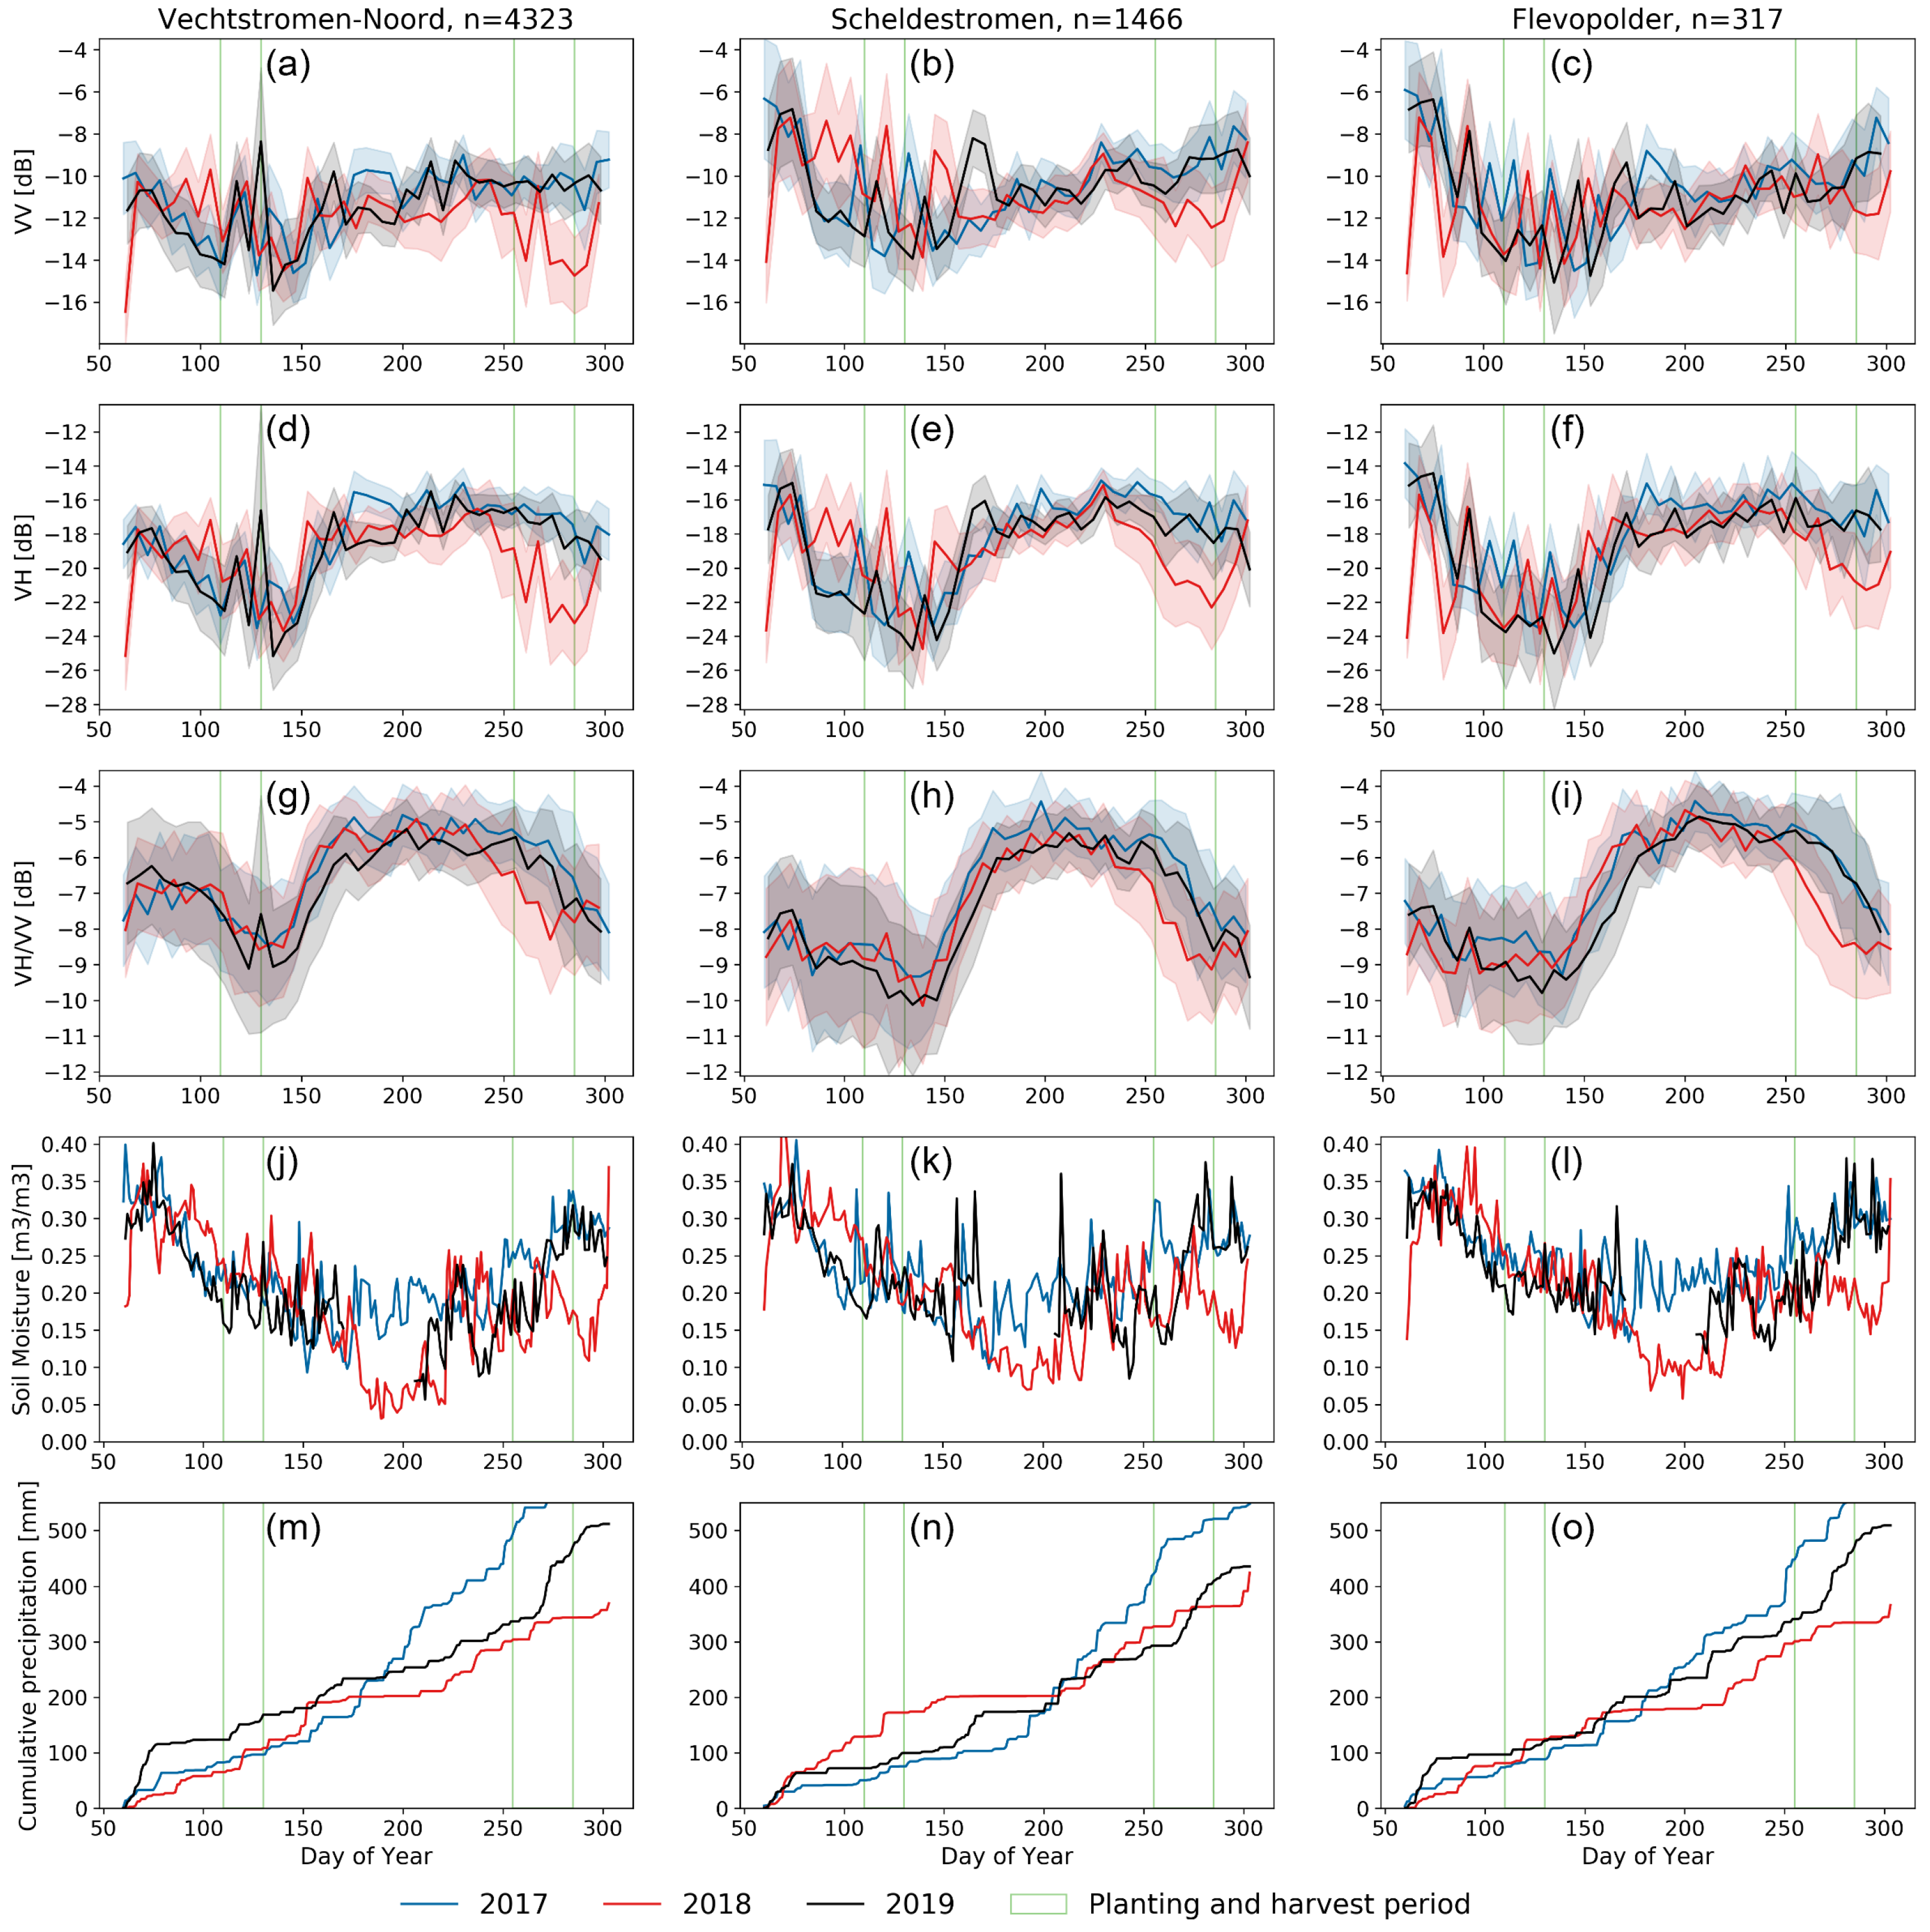
3.2.1. Maize
3.2.2. Onion
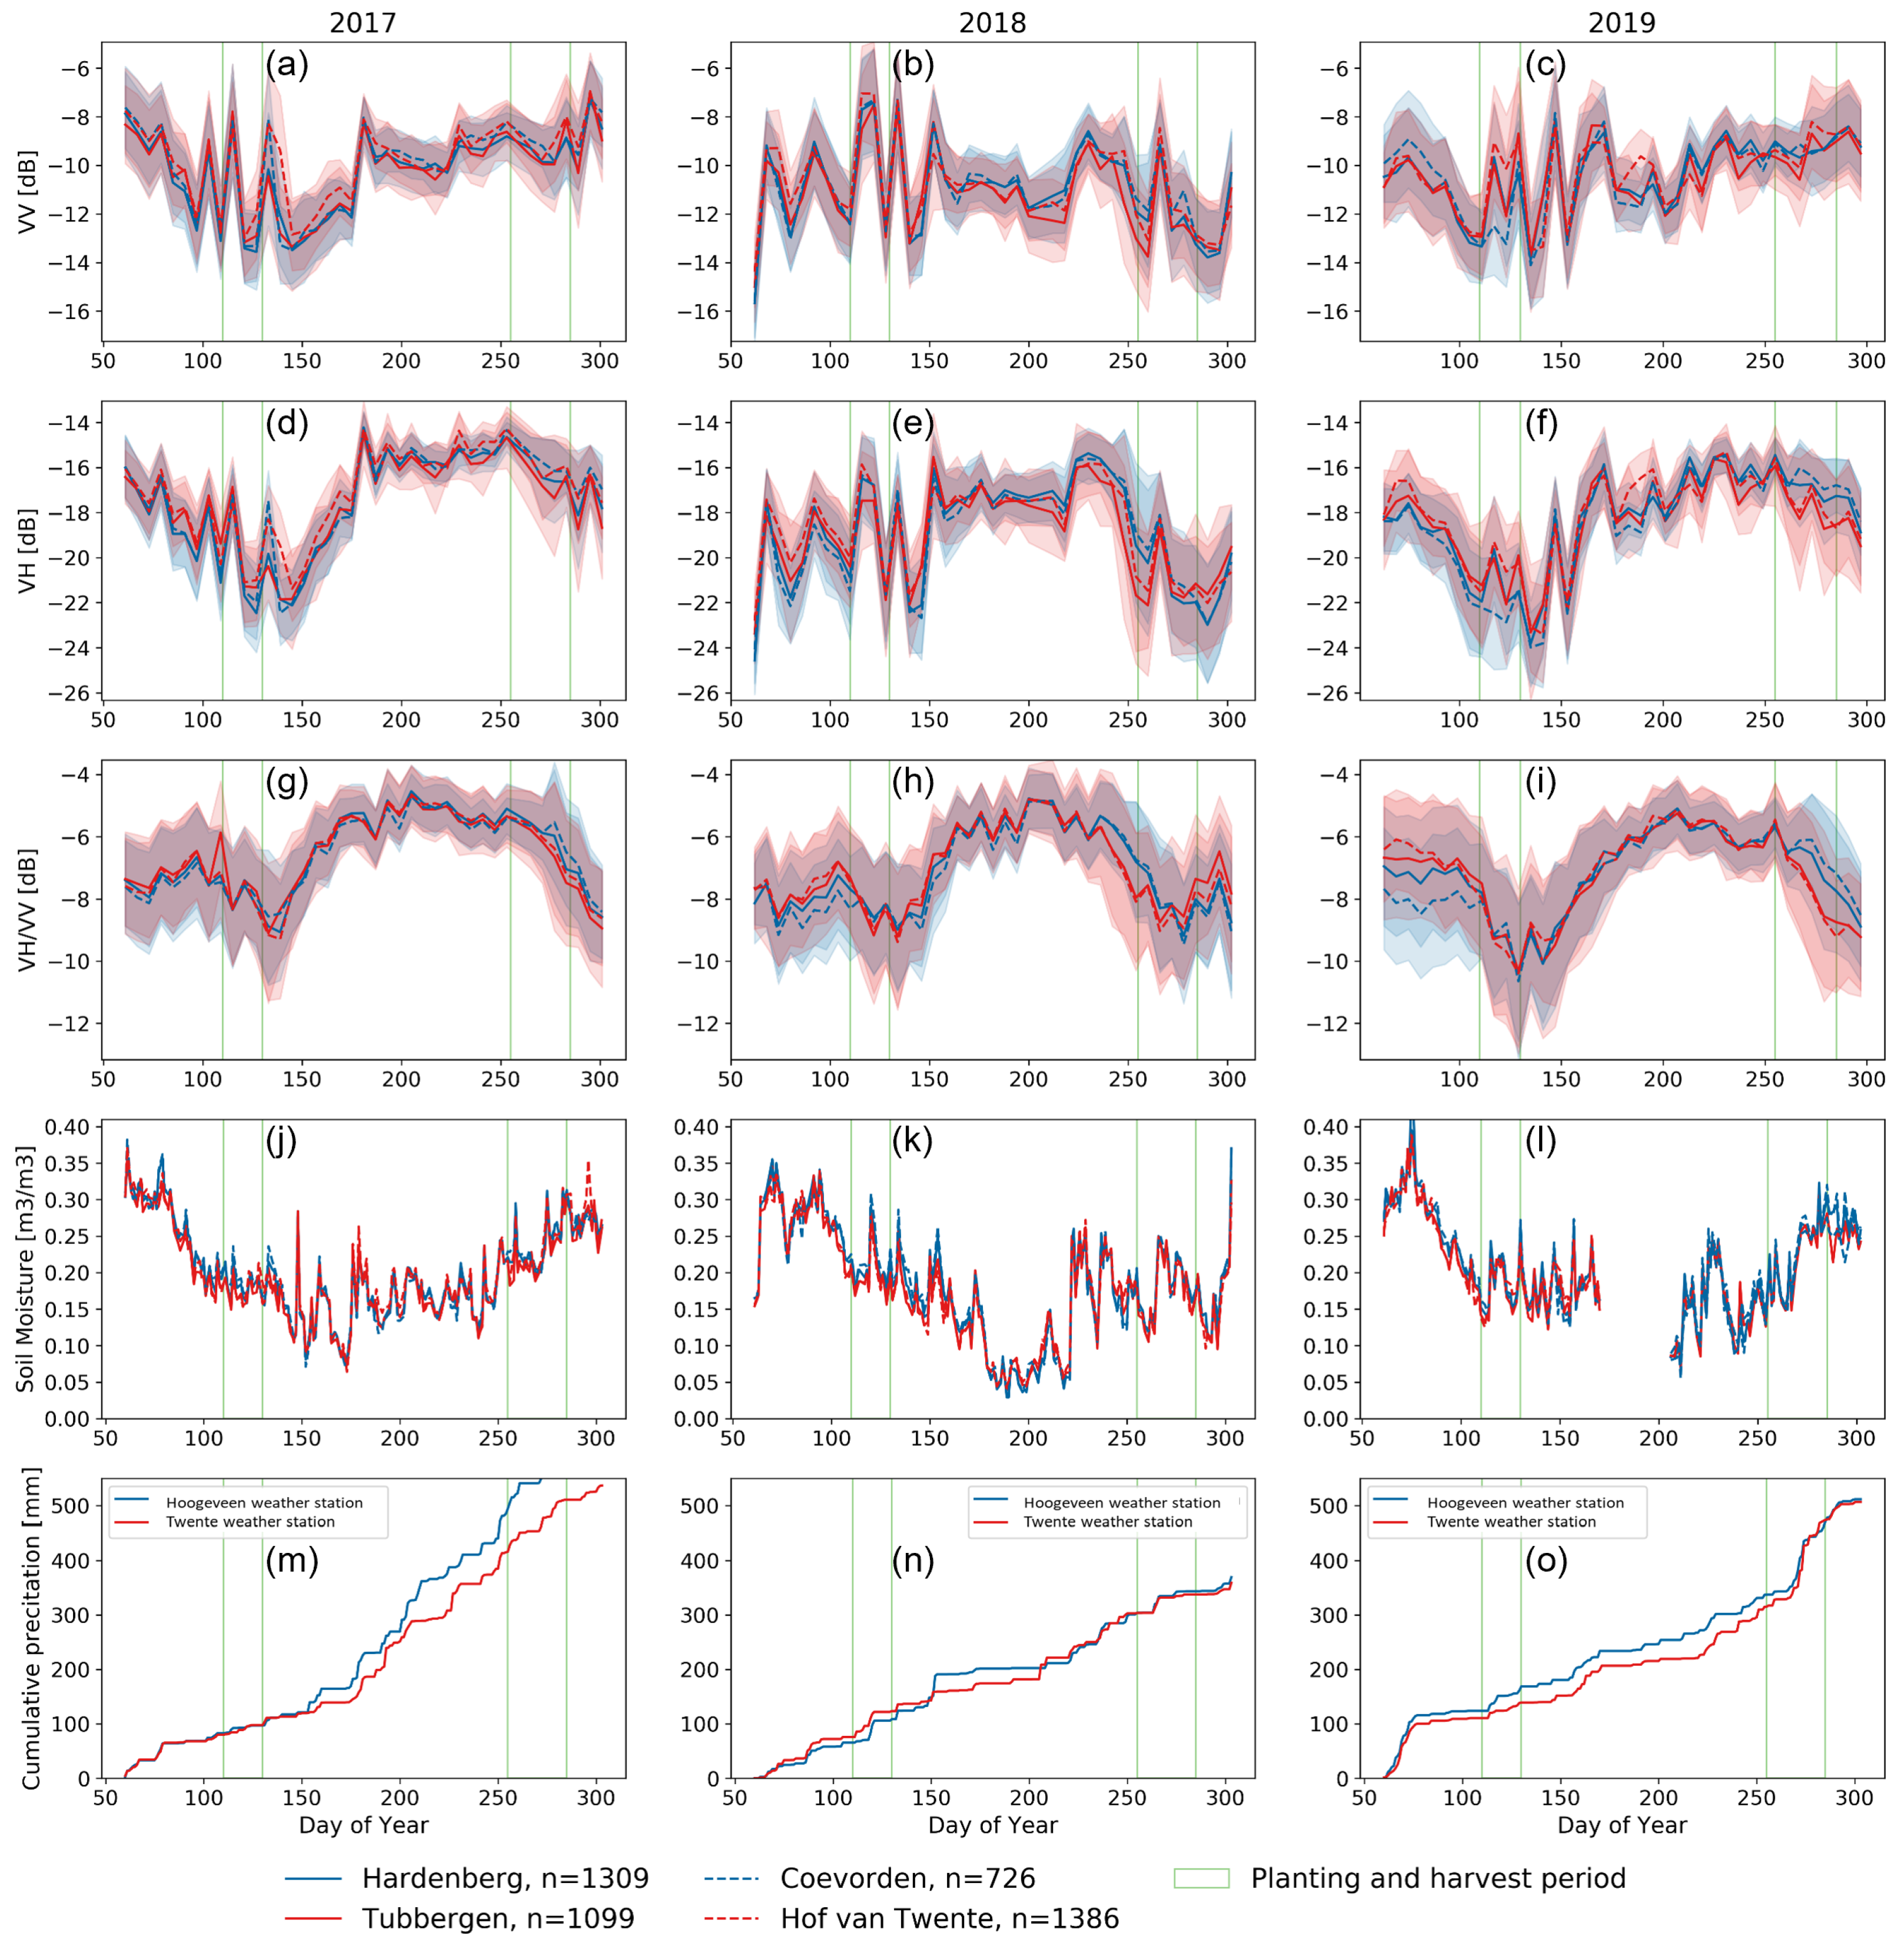
3.3. Observing the Impact of Water Management Decisions
3.3.1. Maize
3.3.2. Potato
4. Discussion
5. Conclusions
Limitations
- Although Sentinel-1 SAR ensures data availability through the crop growing season, it is not without limitations. Results presented here show the potential value of parcel-level Sentinel-1 backscatter. However, data need to be integrated or synergistically used with high-resolution optical satellite observations to understand within parcel heterogeneity.
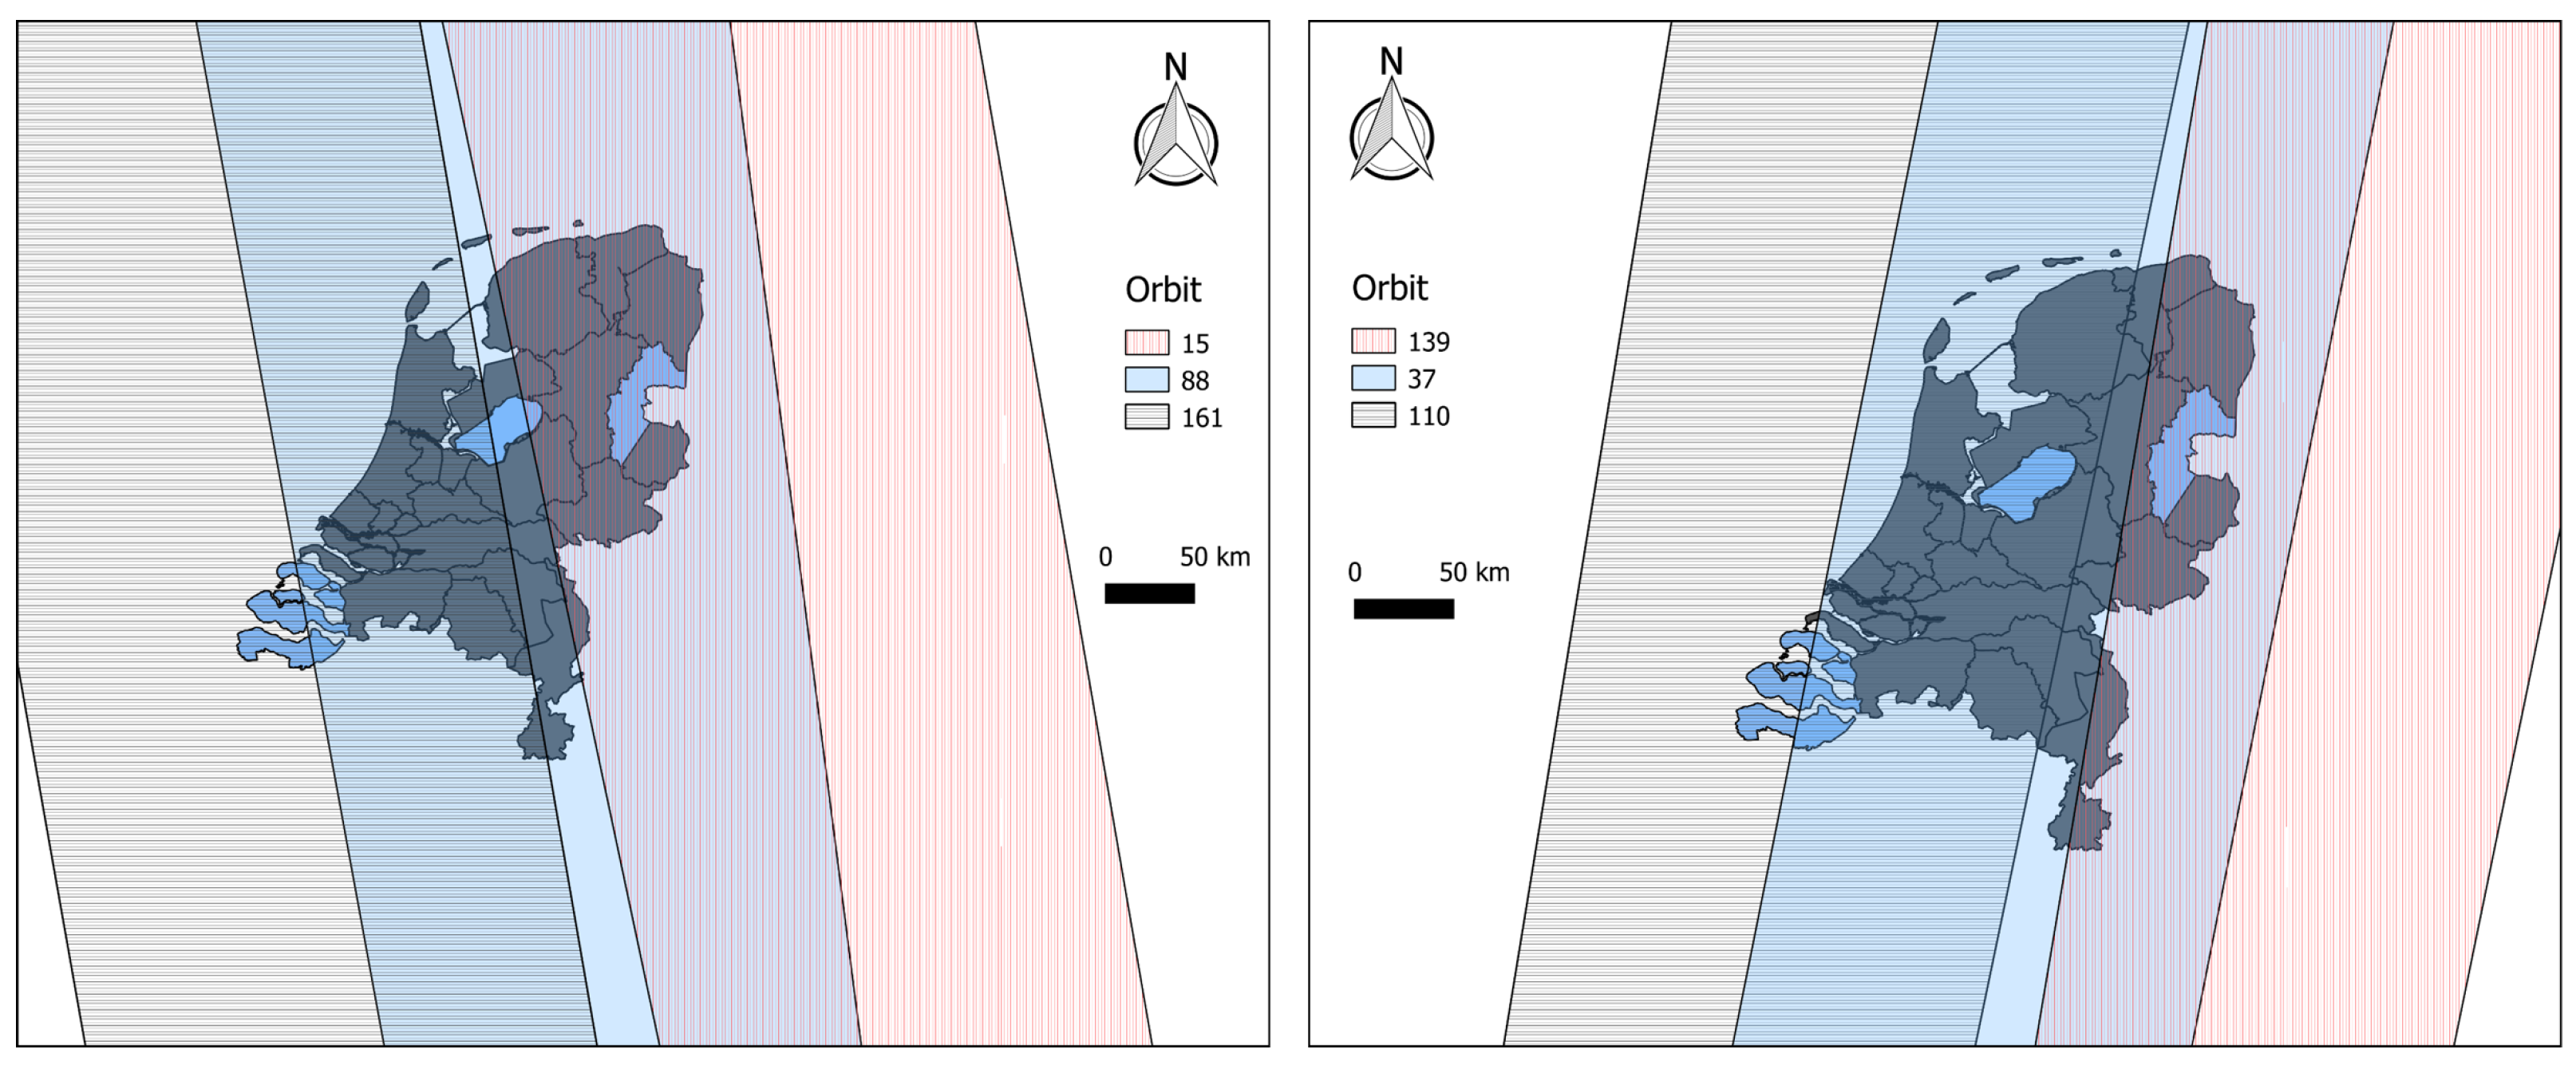
- This study also suggests that Sentinel-1 observation geometry (incidence angle and overpass time) influences the backscatter response from different crop types which is relevant for the interpretation of SAR signals. This warrants attention when data from multiple orbits are combined to create a dense time series for near-real monitoring of the crops.
- Previous studies have reported the saturation of C-band SAR signal response to high biomass crops during the peak vegetative stage [71,72,73]. This could be a potential limitation of using C-band SAR data for seasonal drought observations. However, using a longer wavelength (L-band), SAR data partially overcomes penetration depth limitations. Planned future SAR missions such as NISAR, BIOMASS, ROSE-L will operate at a longer wavelength compared to C-band Sentinel-1 SAR.
Supplementary Materials
Author Contributions
Funding
Acknowledgments
Conflicts of Interest
References
- Godfray, H.C.J.; Beddington, J.R.; Crute, I.R.; Haddad, L.; Lawrence, D.; Muir, J.F.; Pretty, J.; Robinson, S.; Thomas, S.M.; Toulmin, C. Food security: The challenge of feeding 9 billion people. Science 2010, 327, 812–818. [Google Scholar] [CrossRef] [PubMed] [Green Version]
- Schmidhalter, U.; Evequoz, M.; Camp, K.H.; Studer, C. Sequence of drought response of maize seedlings in drying soil. Physiol. Plant. 1998, 104, 159–168. [Google Scholar] [CrossRef]
- Wilhite, D.A.; Glantz, M.H. Understanding: The drought phenomenon: The role of definitions. Water Int. 1985, 10, 111–120. [Google Scholar] [CrossRef] [Green Version]
- Li, Y.; Ye, W.; Wang, M.; Yan, X. Climate change and drought: A risk assessment of crop-yield impacts. Clim. Res. 2009, 39, 31–46. [Google Scholar] [CrossRef]
- Hlavinka, P.; Trnka, M.; Semerádová, D.; Dubrovský, M.; Žalud, Z.; Možný, M. Effect of drought on yield variability of key crops in Czech Republic. Agric. For. Meteorol. 2009, 149, 431–442. [Google Scholar] [CrossRef]
- Salehi-Lisar, S.Y.; Bakhshayeshan-Agdam, H. Drought Stress in Plants: Causes, Consequences, and Tolerance. In Drought Stress Tolerance in Plants, Vol. 1: Physiology and Biochemistry; Hossain, M.A., Wani, S.H., Bhattacharjee, S., Burritt, D.J., Tran, L.S.P., Eds.; Springer International Publishing: Cham, Switzerland, 2016; pp. 1–16. [Google Scholar]
- Lee, J.H.; Kim, C.J. A multimodel assessment of the climate change effect on the drought severity–duration–frequency relationship. Hydrol. Process. 2013, 27, 2800–2813. [Google Scholar] [CrossRef]
- Sheffield, J.; Wood, E.F. Projected changes in drought occurrence under future global warming from multi-model, multi-scenario, IPCC AR4 simulations. Clim. Dyn. 2008, 31, 79–105. [Google Scholar] [CrossRef]
- Hari, V.; Rakovec, O.; Markonis, Y.; Hanel, M.; Kumar, R. Increased future occurrences of the exceptional 2018–2019 Central European drought under global warming. Sci. Rep. 2020, 10, 1–10. [Google Scholar] [CrossRef]
- Spinoni, J.; Vogt, J.V.; Naumann, G.; Barbosa, P.; Dosio, A. Will drought events become more frequent and severe in Europe? Int. J. Climatol. 2018, 38, 1718–1736. [Google Scholar] [CrossRef] [Green Version]
- Palmer, W.C. Meteorological Drought; US Department of Commerce, Weather Bureau: Silver Spring, MD, USA, 1965; Volume 30. [Google Scholar]
- McKee, T.B.; Doesken, N.J.; Kleist, J. The relationship of drought frequency and duration to time scales. In Proceedings of the 8th Conference on Applied Climatology, Anaheim, CA, USA, 17–22 January 1993; Volume 17, pp. 179–183. [Google Scholar]
- Bazrafshan, J.; Hejabi, S.; Rahimi, J. Drought monitoring using the multivariate standardized precipitation index (MSPI). Water Resour. Manag. 2014, 28, 1045–1060. [Google Scholar] [CrossRef]
- Van de Giesen, N.; Hut, R.; Selker, J. The trans-African hydro-meteorological observatory (TAHMO). Wiley Interdiscip. Rev. Water 2014, 1, 341–348. [Google Scholar] [CrossRef] [Green Version]
- Trenberth, K.E.; Dai, A.; Van Der Schrier, G.; Jones, P.D.; Barichivich, J.; Briffa, K.R.; Sheffield, J. Global warming and changes in drought. Nat. Clim. Chang. 2014, 4, 17–22. [Google Scholar] [CrossRef]
- Zhong, R.; Chen, X.; Lai, C.; Wang, Z.; Lian, Y.; Yu, H.; Wu, X. Drought monitoring utility of satellite-based precipitation products across mainland China. J. Hydrol. 2019, 568, 343–359. [Google Scholar] [CrossRef]
- Tucker, C.J.; Choudhury, B.J. Satellite remote sensing of drought conditions. Remote Sens. Environ. 1987, 23, 243–251. [Google Scholar] [CrossRef]
- West, H.; Quinn, N.; Horswell, M. Remote sensing for drought monitoring & impact assessment: Progress, past challenges and future opportunities. Remote Sens. Environ. 2019, 232, 111291. [Google Scholar]
- AghaKouchak, A.; Farahmand, A.; Melton, F.; Teixeira, J.; Anderson, M.; Wardlow, B.D.; Hain, C. Remote sensing of drought: Progress, challenges and opportunities. Rev. Geophys. 2015, 53, 452–480. [Google Scholar] [CrossRef] [Green Version]
- Rhee, J.; Im, J.; Carbone, G.J. Monitoring agricultural drought for arid and humid regions using multi-sensor remote sensing data. Remote Sens. Environ. 2010, 114, 2875–2887. [Google Scholar] [CrossRef]
- Kogan, F. World droughts in the new millennium from AVHRR-based vegetation health indices. Eos Trans. Am. Geophys. Union 2002, 83, 557–563. [Google Scholar] [CrossRef]
- Wieland, M.; Martinis, S. Large-scale surface water change observed by Sentinel-2 during the 2018 drought in Germany. Int. J. Remote Sens. 2020, 41, 4742–4756. [Google Scholar] [CrossRef]
- Zhou, X.; Wang, P.; Tansey, K.; Zhang, S.; Li, H.; Wang, L. Developing a fused vegetation temperature condition index for drought monitoring at field scales using Sentinel-2 and MODIS imagery. Comput. Electron. Agric. 2020, 168, 105144. [Google Scholar] [CrossRef]
- Varghese, D.; Radulović, M.; Stojković, S.; Crnojević, V. Reviewing the Potential of Sentinel-2 in Assessing the Drought. Remote Sens. 2021, 13, 3355. [Google Scholar] [CrossRef]
- McNairn, H.; Shang, J. A review of multitemporal synthetic aperture radar (SAR) for crop monitoring. In Multitemporal Remote Sensing; Springer: New York, NY, USA, 2016; pp. 317–340. [Google Scholar]
- Steele-Dunne, S.C.; McNairn, H.; Monsivais-Huertero, A.; Judge, J.; Liu, P.; Papathanassiou, K. Radar remote sensing of agricultural canopies: A review. IEEE J. Sel. Top. Appl. Earth Obs. Remote Sens. 2017, 10, 2249–2273. [Google Scholar] [CrossRef] [Green Version]
- Torres, R.; Snoeij, P.; Geudtner, D.; Bibby, D.; Davidson, M.; Attema, E.; Potin, P.; Rommen, B.; Floury, N.; Brown, M.; et al. GMES Sentinel-1 mission. Remote Sens. Environ. 2012, 120, 9–24. [Google Scholar] [CrossRef]
- Google Earth Engine Sentinel-1 Algorithms. Available online: https://developers.google.com/earth-engine/guides/sentinel1?hl=nl (accessed on 20 November 2020).
- Khabbazan, S.; Vermunt, P.; Steele-Dunne, S.; Ratering Arntz, L.; Marinetti, C.; van der Valk, D.; Iannini, L.; Molijn, R.; Westerdijk, K.; van der Sande, C. Crop monitoring using Sentinel-1 data: A case study from The Netherlands. Remote Sens. 2019, 11, 1887. [Google Scholar] [CrossRef] [Green Version]
- Vreugdenhil, M.; Wagner, W.; Bauer-Marschallinger, B.; Pfeil, I.; Teubner, I.; Rüdiger, C.; Strauss, P. Sensitivity of Sentinel-1 backscatter to vegetation dynamics: An Austrian case study. Remote Sens. 2018, 10, 1396. [Google Scholar] [CrossRef] [Green Version]
- Veloso, A.; Mermoz, S.; Bouvet, A.; Le Toan, T.; Planells, M.; Dejoux, J.F.; Ceschia, E. Understanding the temporal behavior of crops using Sentinel-1 and Sentinel-2-like data for agricultural applications. Remote Sens. Environ. 2017, 199, 415–426. [Google Scholar] [CrossRef]
- Mercier, A.; Betbeder, J.; Baudry, J.; Le Roux, V.; Spicher, F.; Lacoux, J.; Roger, D.; Hubert-Moy, L. Evaluation of Sentinel-1 & 2 time series for predicting wheat and rapeseed phenological stages. ISPRS J. Photogramm. Remote Sens. 2020, 163, 231–256. [Google Scholar]
- Mandal, D.; Kumar, V.; Lopez-Sanchez, J.M.; Bhattacharya, A.; McNairn, H.; Rao, Y. Crop biophysical parameter retrieval from Sentinel-1 SAR data with a multi-target inversion of Water Cloud Model. Int. J. Remote Sens. 2020, 41, 5503–5524. [Google Scholar] [CrossRef]
- Urban, M.; Berger, C.; Mudau, T.E.; Heckel, K.; Truckenbrodt, J.; Onyango Odipo, V.; Smit, I.P.J.; Schmullius, C. Surface Moisture and Vegetation Cover Analysis for Drought Monitoring in the Southern Kruger National Park Using Sentinel-1, Sentinel-2, and Landsat-8. Remote Sens. 2018, 10, 1482. [Google Scholar] [CrossRef] [Green Version]
- Ghazaryan, G.; Dubovyk, O.; Graw, V.; Kussul, N.; Schellberg, J. Local-scale agricultural drought monitoring with satellite-based multi-sensor time-series. GISci. Remote Sens. 2020, 57, 704–718. [Google Scholar] [CrossRef]
- Buras, A.; Rammig, A.; Zang, C.S. Quantifying impacts of the 2018 drought on European ecosystems in comparison to 2003. Biogeosciences 2020, 17, 1655–1672. [Google Scholar] [CrossRef] [Green Version]
- Peters, W.; Bastos, A.; Ciais, P.; Vermeulen, A. A historical, geographical and ecological perspective on the 2018 European summer drought. Philos. Trans. R. Soc. B 2020, 375, 20190505. [Google Scholar] [CrossRef] [PubMed]
- Schuldt, B.; Buras, A.; Arend, M.; Vitasse, Y.; Beierkuhnlein, C.; Damm, A.; Gharun, M.; Grams, T.E.; Hauck, M.; Hajek, P.; et al. A first assessment of the impact of the extreme 2018 summer drought on Central European forests. Basic Appl. Ecol. 2020, 45, 86–103. [Google Scholar] [CrossRef]
- Van Hateren, T.C.; Chini, M.; Matgen, P.; Teuling, A.J. Ambiguous Agricultural Drought: Characterising Soil Moisture and Vegetation Droughts in Europe from Earth Observation. Remote Sens. 2021, 13, 1990. [Google Scholar] [CrossRef]
- Philip, S.; Kew, S.F.; van der Wiel, K.; Wanders, N.; van Oldenborgh, G.J. Regional differentiation in climate change induced drought trends in the Netherlands. Environ. Res. Lett. 2020, 15, 094081. [Google Scholar] [CrossRef]
- Buitink, J.; Swank, A.M.; van der Ploeg, M.; Smith, N.E.; Benninga, H.J.F.; van der Bolt, F.; Carranza, C.D.U.; Koren, G.; van der Velde, R.; Teuling, A.J. Anatomy of the 2018 agricultural drought in The Netherlands using in situ soil moisture and satellite vegetation indices. Hydrol. Earth Syst. Sci. Discuss. 2020, 24, 6021–6031. [Google Scholar] [CrossRef]
- Brakkee, E.; van Huijgevoort, M.; Bartholomeus, R.P. Spatiotemporal development of the 2018–2019 groundwater drought in the Netherlands: A data-based approach. Hydrol. Earth Syst. Sci. Discuss. 2021, 2021, 1–26. [Google Scholar]
- CBS. Arable Crops: Production to Region. Available online: https://opendata.cbs.nl/#/CBS/en/dataset/7100eng/table?ts=1599577672463 (accessed on 22 May 2020).
- De Loor, G.P.; Hoogeboom, P.; Attema, E.W. The dutch ROVE program. IEEE Trans. Geosci. Remote Sens. 1982, GE-20, 3–11. [Google Scholar] [CrossRef]
- Satalino, G.; Balenzano, A.; Mattia, F.; Davidson, M.W. C-band SAR data for mapping crops dominated by surface or volume scattering. IEEE Geosci. Remote Sens. Lett. 2013, 11, 384–388. [Google Scholar] [CrossRef]
- Gels, H.; van der Toorn, L. Extreme Droogte 2018: ‘Vechtstromen Snakt (Nog Steeds) Naar Water’. 2019. Available online: https://www.stowa.nl/sites/default/files/assets/AGENDA/Agenda202018/2018112220NHI20dag/4.20Hans20Gels-Droogte202018-201920Oost.pdf (accessed on 24 October 2020).
- PDOK. Dataset: Basisregistratie Gewaspercelen (BRP). Available online: https://www.pdok.nl/introductie/-/article/basisregistratie-gewaspercelen-brp- (accessed on 23 January 2020).
- De Jeu, R.A.M.; De Nijs, A.H.A.; Van Klink, M.H.W. Method and System for Improving the Resolution of Sensor Data. US Patent 10,643,098, 5 May 2020. [Google Scholar]
- Van der Schalie, R.; Parinussa, R.; Renzullo, L.J.; Van Dijk, A.; Su, C.H.; de Jeu, R.A. SMOS soil moisture retrievals using the land parameter retrieval model: Evaluation over the Murrumbidgee Catchment, southeast Australia. Remote Sens. Environ. 2015, 163, 70–79. [Google Scholar] [CrossRef]
- Van der Schalie, R.; Kerr, Y.H.; Wigneron, J.P.; Rodríguez-Fernández, N.J.; Al-Yaari, A.; de Jeu, R.A. Global SMOS soil moisture retrievals from the land parameter retrieval model. Int. J. Appl. Earth Obs. Geoinf. 2016, 45, 125–134. [Google Scholar]
- Owe, M.; de Jeu, R.; Holmes, T. Multisensor historical climatology of satellite-derived global land surface moisture. J. Geophys. Res. Earth Surf. 2008, 113, F01002. [Google Scholar] [CrossRef]
- Kumar, V.; Huber, M.; Rommen, B.; Steele-Dunne, S.C. Agricultural Sandbox NL: A national-scale database of parcel-level, processed Sentinel-1 SAR data. EarthArXiv Preprint 2021. [Google Scholar] [CrossRef]
- Kumar, V.; Huber, M.; Shorachi, M.; Rommen, B.; Steele-Dunne, S.C. Agricultural SandboxNL: A crop parcel level database using Sentinel-1 SAR and google earth engine. In Proceedings of the 2021 IEEE International Geoscience and Remote Sensing Symposium IGARSS, Brussels, Belgium, 11–16 July 2021; pp. 6284–6287. [Google Scholar]
- Steur, G. De Bodemkaart van Nederland, schaal 1:50,000. Enkele aspecten van de legenda-indeling en de nomenclatuur van de kaarteenheden. Boor Spade XV 1966, 15, 43–59. [Google Scholar]
- Hartemink, A.; Sonneveld, M. Soil maps of the Netherlands. Geoderma 2013, 204, 1–9. [Google Scholar] [CrossRef]
- KNMI Maandsommen Neerslag, Normalen, Anomalieën. Available online: https://www.knmi.nl/nederland-nu/klimatologie/geografische-overzichten/archief/maand/rd (accessed on 24 November 2020).
- VanderSat. Recovery from the 2018 Drought in the Netherlands. 2019. Available online: http://vandersat.com/blog/recovery-from-the-2018-drought-in-the-netherlands/ (accessed on 29 September 2020).
- Commissie Samenstelling Aanbevelende Rassenlijst—CSAR. De Aanbevelende Rassenlijst Akkerbouw en Veehouderij 2020. Available online: https://rassenlijst.info/ (accessed on 5 January 2021).
- Wesselink, M.; Kroonen, B.; de Haan, J. Toekomst van de Maisteelt op Zandgrond: Overzicht van Huidige Situatie en Mogelijke Maatregelen om de Maisteelt te Verduurzamen; Technical Report; Stichting Wageningen Research, Wageningen Plant Research, Business unit Open Teelten: Wageningen, The Netherlands, 2019. [Google Scholar]
- Thelen, K. Assessing Drought Stress Effects on Corn Yield. 2007. Available online: https://www.canr.msu.edu/news/assessing_drought_stress_effects_on_corn_yield (accessed on 9 September 2020).
- Anami, S.; De Block, M.; Machuka, J.; Van Lijsebettens, M. Molecular Improvement of Tropical Maize for Drought Stress Tolerance in Sub-Saharan Africa. Crit. Rev. Plant Sci. 2009, 28, 16–35. [Google Scholar] [CrossRef]
- Zaaiuien—Akkerbouwbedrijf Mts. Hoogterp. Available online: http://www.mtshoogterp.nl/zaaiuien.php (accessed on 28 October 2020).
- Moran, M.S.; Alonso, L.; Moreno, J.F.; Cendrero Mateo, M.P.; de la Cruz, D.F.; Montoro, A. A RADARSAT-2 Quad-Polarized Time Series for Monitoring Crop and Soil Conditions in Barrax, Spain. IEEE Trans. Geosci. Remote Sens. 2012, 50, 1057–1070. [Google Scholar] [CrossRef]
- Mascolo, L. Polarimetric SAR for the Monitoring of Agricultural Crops. Ph.D. Thesis, Università degli Studi di Cagliari, Cagliari, Italy, 2015. [Google Scholar]
- Lis, B.R.d.; Ponce, I.; Cavagnaro, J.B.; Tizio, R.M. Studies of Water Requirements of Horticultural Crops: II. Influence of Drought at Different Growth Stages of Onion1. Agron. J. 1967, 59, 573–576. [Google Scholar] [CrossRef]
- Gedam, P.A.; Thangasamy, A.; Shirsat, D.V.; Ghosh, S.; Bhagat, K.P.; Sogam, O.A.; Gupta, A.J.; Mahajan, V.; Soumia, P.S.; Salunkhe, V.N.; et al. Screening of Onion (Allium cepa L.) Genotypes for Drought Tolerance Using Physiological and Yield Based Indices Through Multivariate Analysis. Front. Plant Sci. 2021, 12, 122. [Google Scholar] [CrossRef]
- Van Hussen, K.; van de Velde, I.; Läkamp, R.; van der Kooij, S. Economische Schade Door Droogte in 2018. 2019. Available online: https://www.rijksoverheid.nl/documenten/rapporten/2019/08/31/economische-schade-door-droogte-in-2018 (accessed on 15 September 2020).
- Zhao, L.; Yang, J.; Li, P.; Huang, X.; Shi, L.; Zhang, L. Characterization of the coherent scattering induced by ridging patterns in agriculture by the use of polarimetric SAR imagery. Int. J. Remote Sens. 2017, 38, 3502–3518. [Google Scholar] [CrossRef]
- Harfenmeister, K.; Spengler, D.; Weltzien, C. Analyzing temporal and spatial characteristics of crop parameters using Sentinel-1 backscatter data. Remote Sens. 2019, 11, 1569. [Google Scholar] [CrossRef] [Green Version]
- Vreugdenhil, M.; Navacchi, C.; Bauer-Marschallinger, B.; Hahn, S.; Steele-Dunne, S.; Pfeil, I.; Dorigo, W.; Wagner, W. Sentinel-1 Cross Ratio and Vegetation Optical Depth: A Comparison over Europe. Remote Sens. 2020, 12, 3404. [Google Scholar] [CrossRef]
- Ferrazzoli, P.; Paloscia, S.; Pampaloni, P.; Schiavon, G.; Sigismondi, S.; Solimini, D. The potential of multifrequency polarimetric SAR in assessing agricultural and arboreous biomass. IEEE Trans. Geosci. Remote Sens. 1997, 35, 5–17. [Google Scholar] [CrossRef]
- Blaes, X.; Defourny, P.; Wegmuller, U.; Della Vecchia, A.; Guerriero, L.; Ferrazzoli, P. C-band polarimetric indexes for maize monitoring based on a validated radiative transfer model. IEEE Trans. Geosci. Remote Sens. 2006, 44, 791–800. [Google Scholar] [CrossRef]
- Kraatz, S.; Torbick, N.; Jiao, X.; Huang, X.; Robertson, L.; Davidson, A.; McNairn, H.; Cosh, M.; Siqueira, P. Comparison between Dense L-Band and C-Band Synthetic Aperture Radar (SAR) Time Series for Crop Area Mapping over a NISAR Calibration-Validation Site. Agronomy 2021, 11, 273. [Google Scholar] [CrossRef]


| Crop | Vechtstromen Noord | Scheldestromen | Flevopolder |
|---|---|---|---|
| Silage Maize | 4084 | 1394 | 300 |
| Sugar Beet | 817 | 2413 | 660 |
| Potato | 541 | 2722 | 882 |
| Onion | 71 | 879 | 767 |
| Relative Orbit | Pass Type | UTC | |||
|---|---|---|---|---|---|
| 15 | asc | 17:16 | 33.8–36.3 | - | - |
| 37 | des | 05:49 | 34.7–36.1 | 44.4–45.1 | 39.5–41.6 |
| 88 | asc | 17:25 | 42.4–44.0 | 30.1–31.1 | 36.3–39.5 |
| 110 | des | 05:58 | - | 35.7–41.0 | 30.4–33.7 |
| 139 | des | 05:41 | 42.5–44.4 | - | - |
| 161 | asc | 17:33 | - | 36.4–40.2 | - |
| Data | Data Usage in this Study | Scale | Source(s) |
|---|---|---|---|
| BRP (Crop Parcel Base Register) | To attribute parcel-level crop type information and extract Sentinel-1 backscatter values | Parcel-level | PDOK [47] |
| Crop yield | To support intra-annual drought observation in time series of Sentinel-1 data | Aggregated at province scale | CBS [43] |
| Soil type | Information on soil types of the study areas | 1:50,000 | Steur, 1966 [54]; Hartemink et al., 2013 [55] |
| Soil moisture | To infer inter-annual variation surface soil moisture over the study areas | Aggregated at municipality scale | VanderSat (Planet) [48] |
| Precipitation | To infer inter-annual cumulative precipitation over the study areas | Weather stations within the vicinity of study areas | KNMI [56] |
| Sentinel-1 SAR | To understand drought impact on VH, VV and VH/VV (CR) SAR backscatter data over the study areas | Extracted at parcel level further aggregated over the no. of crop parcels in study areas | Agricultural SandboxNL [52] |
Publisher’s Note: MDPI stays neutral with regard to jurisdictional claims in published maps and institutional affiliations. |
© 2022 by the authors. Licensee MDPI, Basel, Switzerland. This article is an open access article distributed under the terms and conditions of the Creative Commons Attribution (CC BY) license (https://creativecommons.org/licenses/by/4.0/).
Share and Cite
Shorachi, M.; Kumar, V.; Steele-Dunne, S.C. Sentinel-1 SAR Backscatter Response to Agricultural Drought in The Netherlands. Remote Sens. 2022, 14, 2435. https://doi.org/10.3390/rs14102435
Shorachi M, Kumar V, Steele-Dunne SC. Sentinel-1 SAR Backscatter Response to Agricultural Drought in The Netherlands. Remote Sensing. 2022; 14(10):2435. https://doi.org/10.3390/rs14102435
Chicago/Turabian StyleShorachi, Maurice, Vineet Kumar, and Susan C. Steele-Dunne. 2022. "Sentinel-1 SAR Backscatter Response to Agricultural Drought in The Netherlands" Remote Sensing 14, no. 10: 2435. https://doi.org/10.3390/rs14102435
APA StyleShorachi, M., Kumar, V., & Steele-Dunne, S. C. (2022). Sentinel-1 SAR Backscatter Response to Agricultural Drought in The Netherlands. Remote Sensing, 14(10), 2435. https://doi.org/10.3390/rs14102435