
The Characteristics of Raindrop Size Distribution at Windward and Leeward Side over Mountain Area


Abstract
1. Introduction
2. Observational Data and Methodology
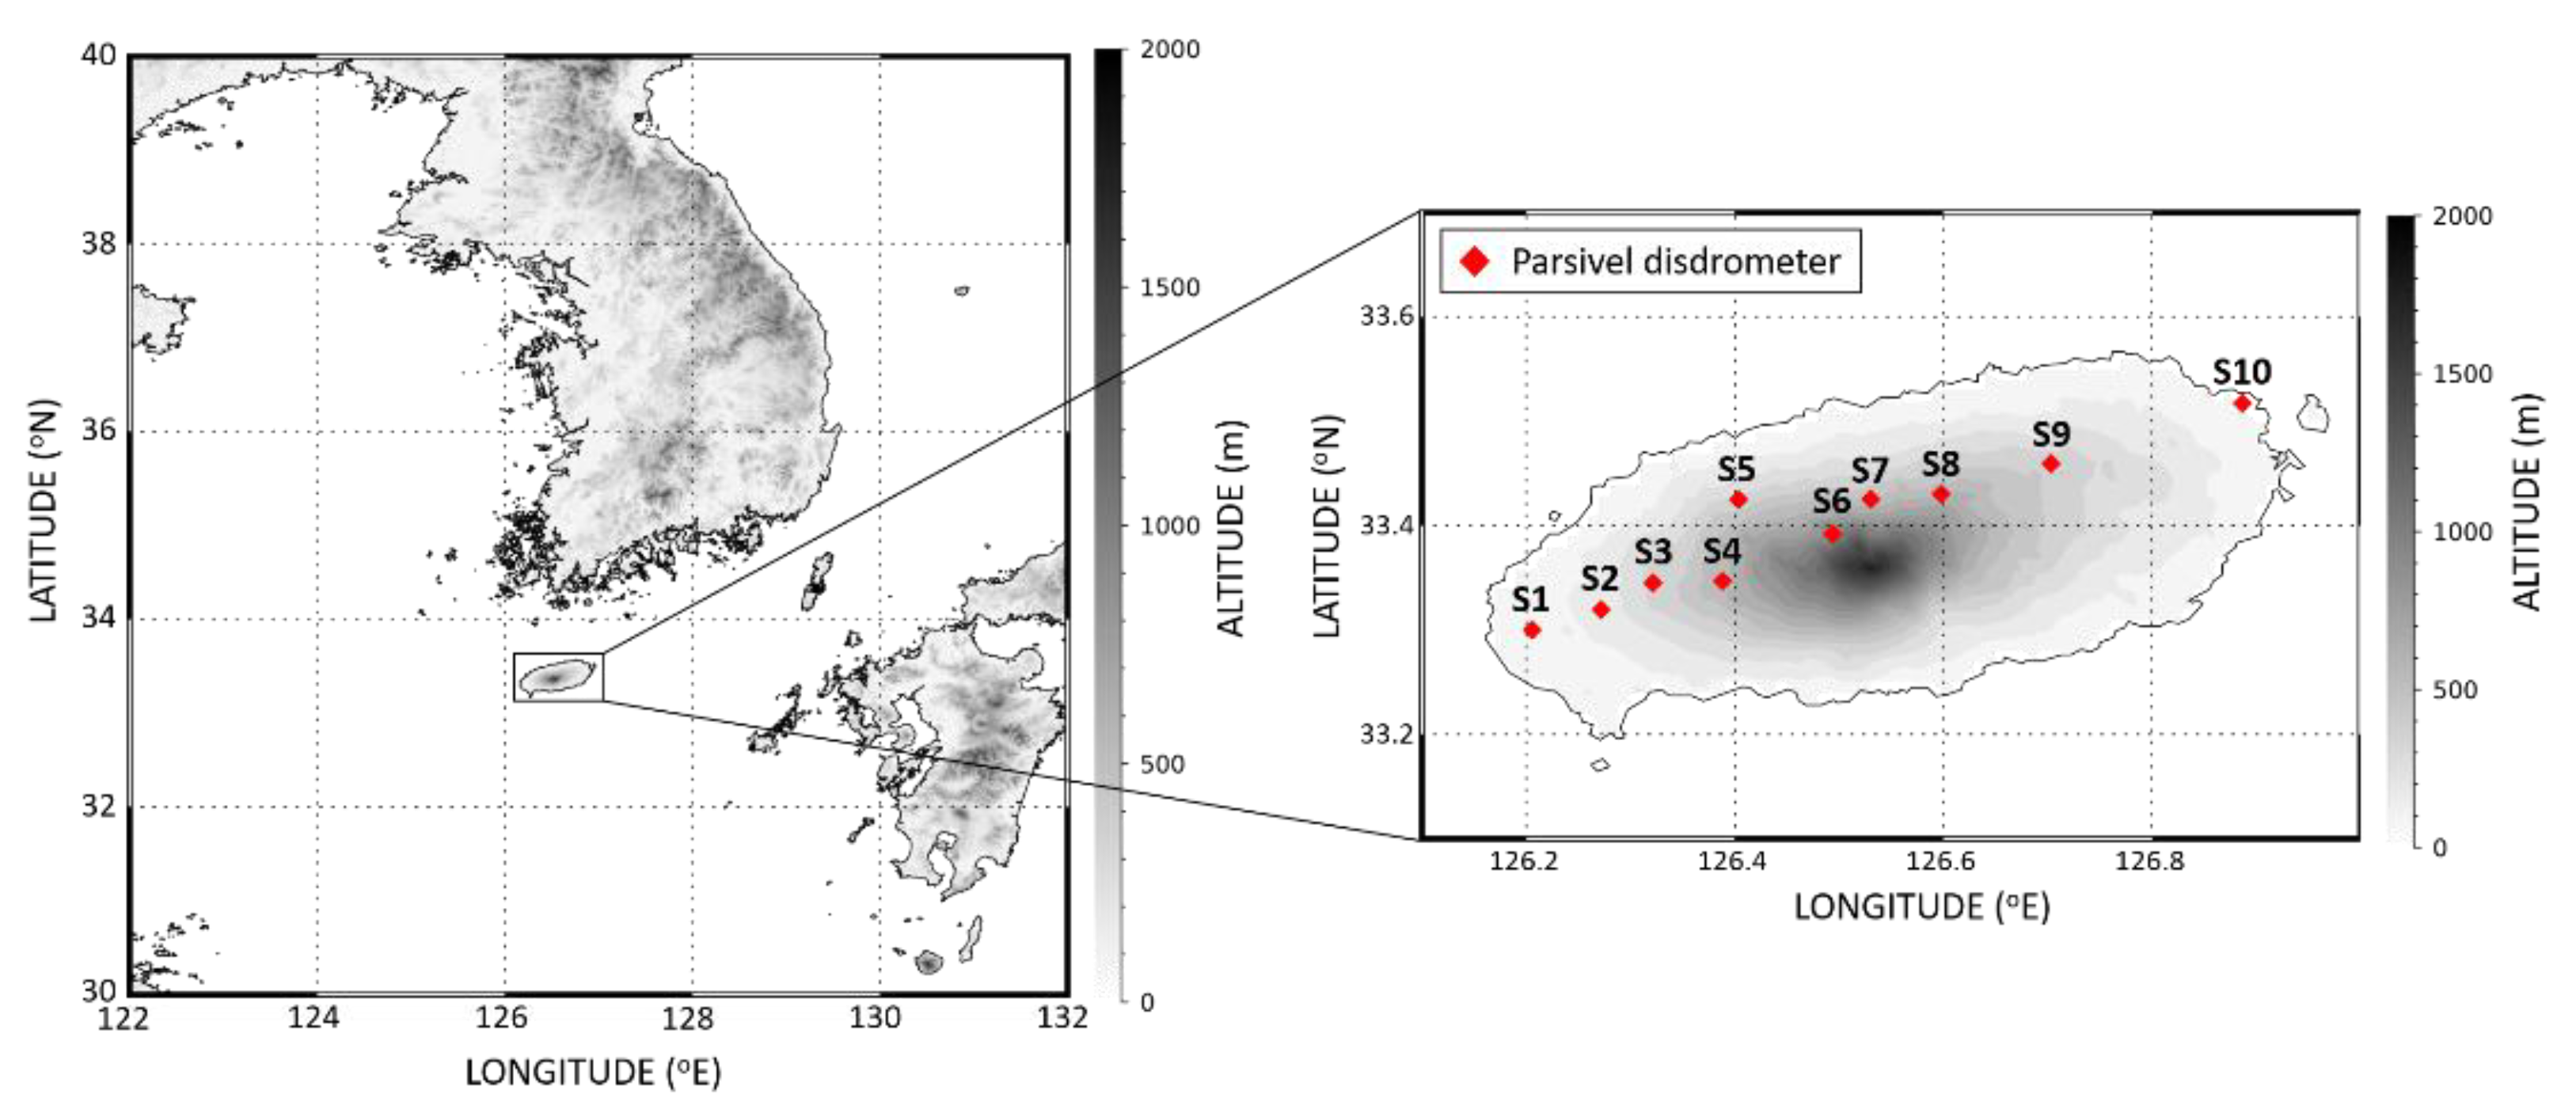
2.1. Disdrometer Observation on the Mountain
2.2. Number Concentration and DSD Parameters
2.3. Dual-Polarization Radar Parameters with T-Matrix
3. Results
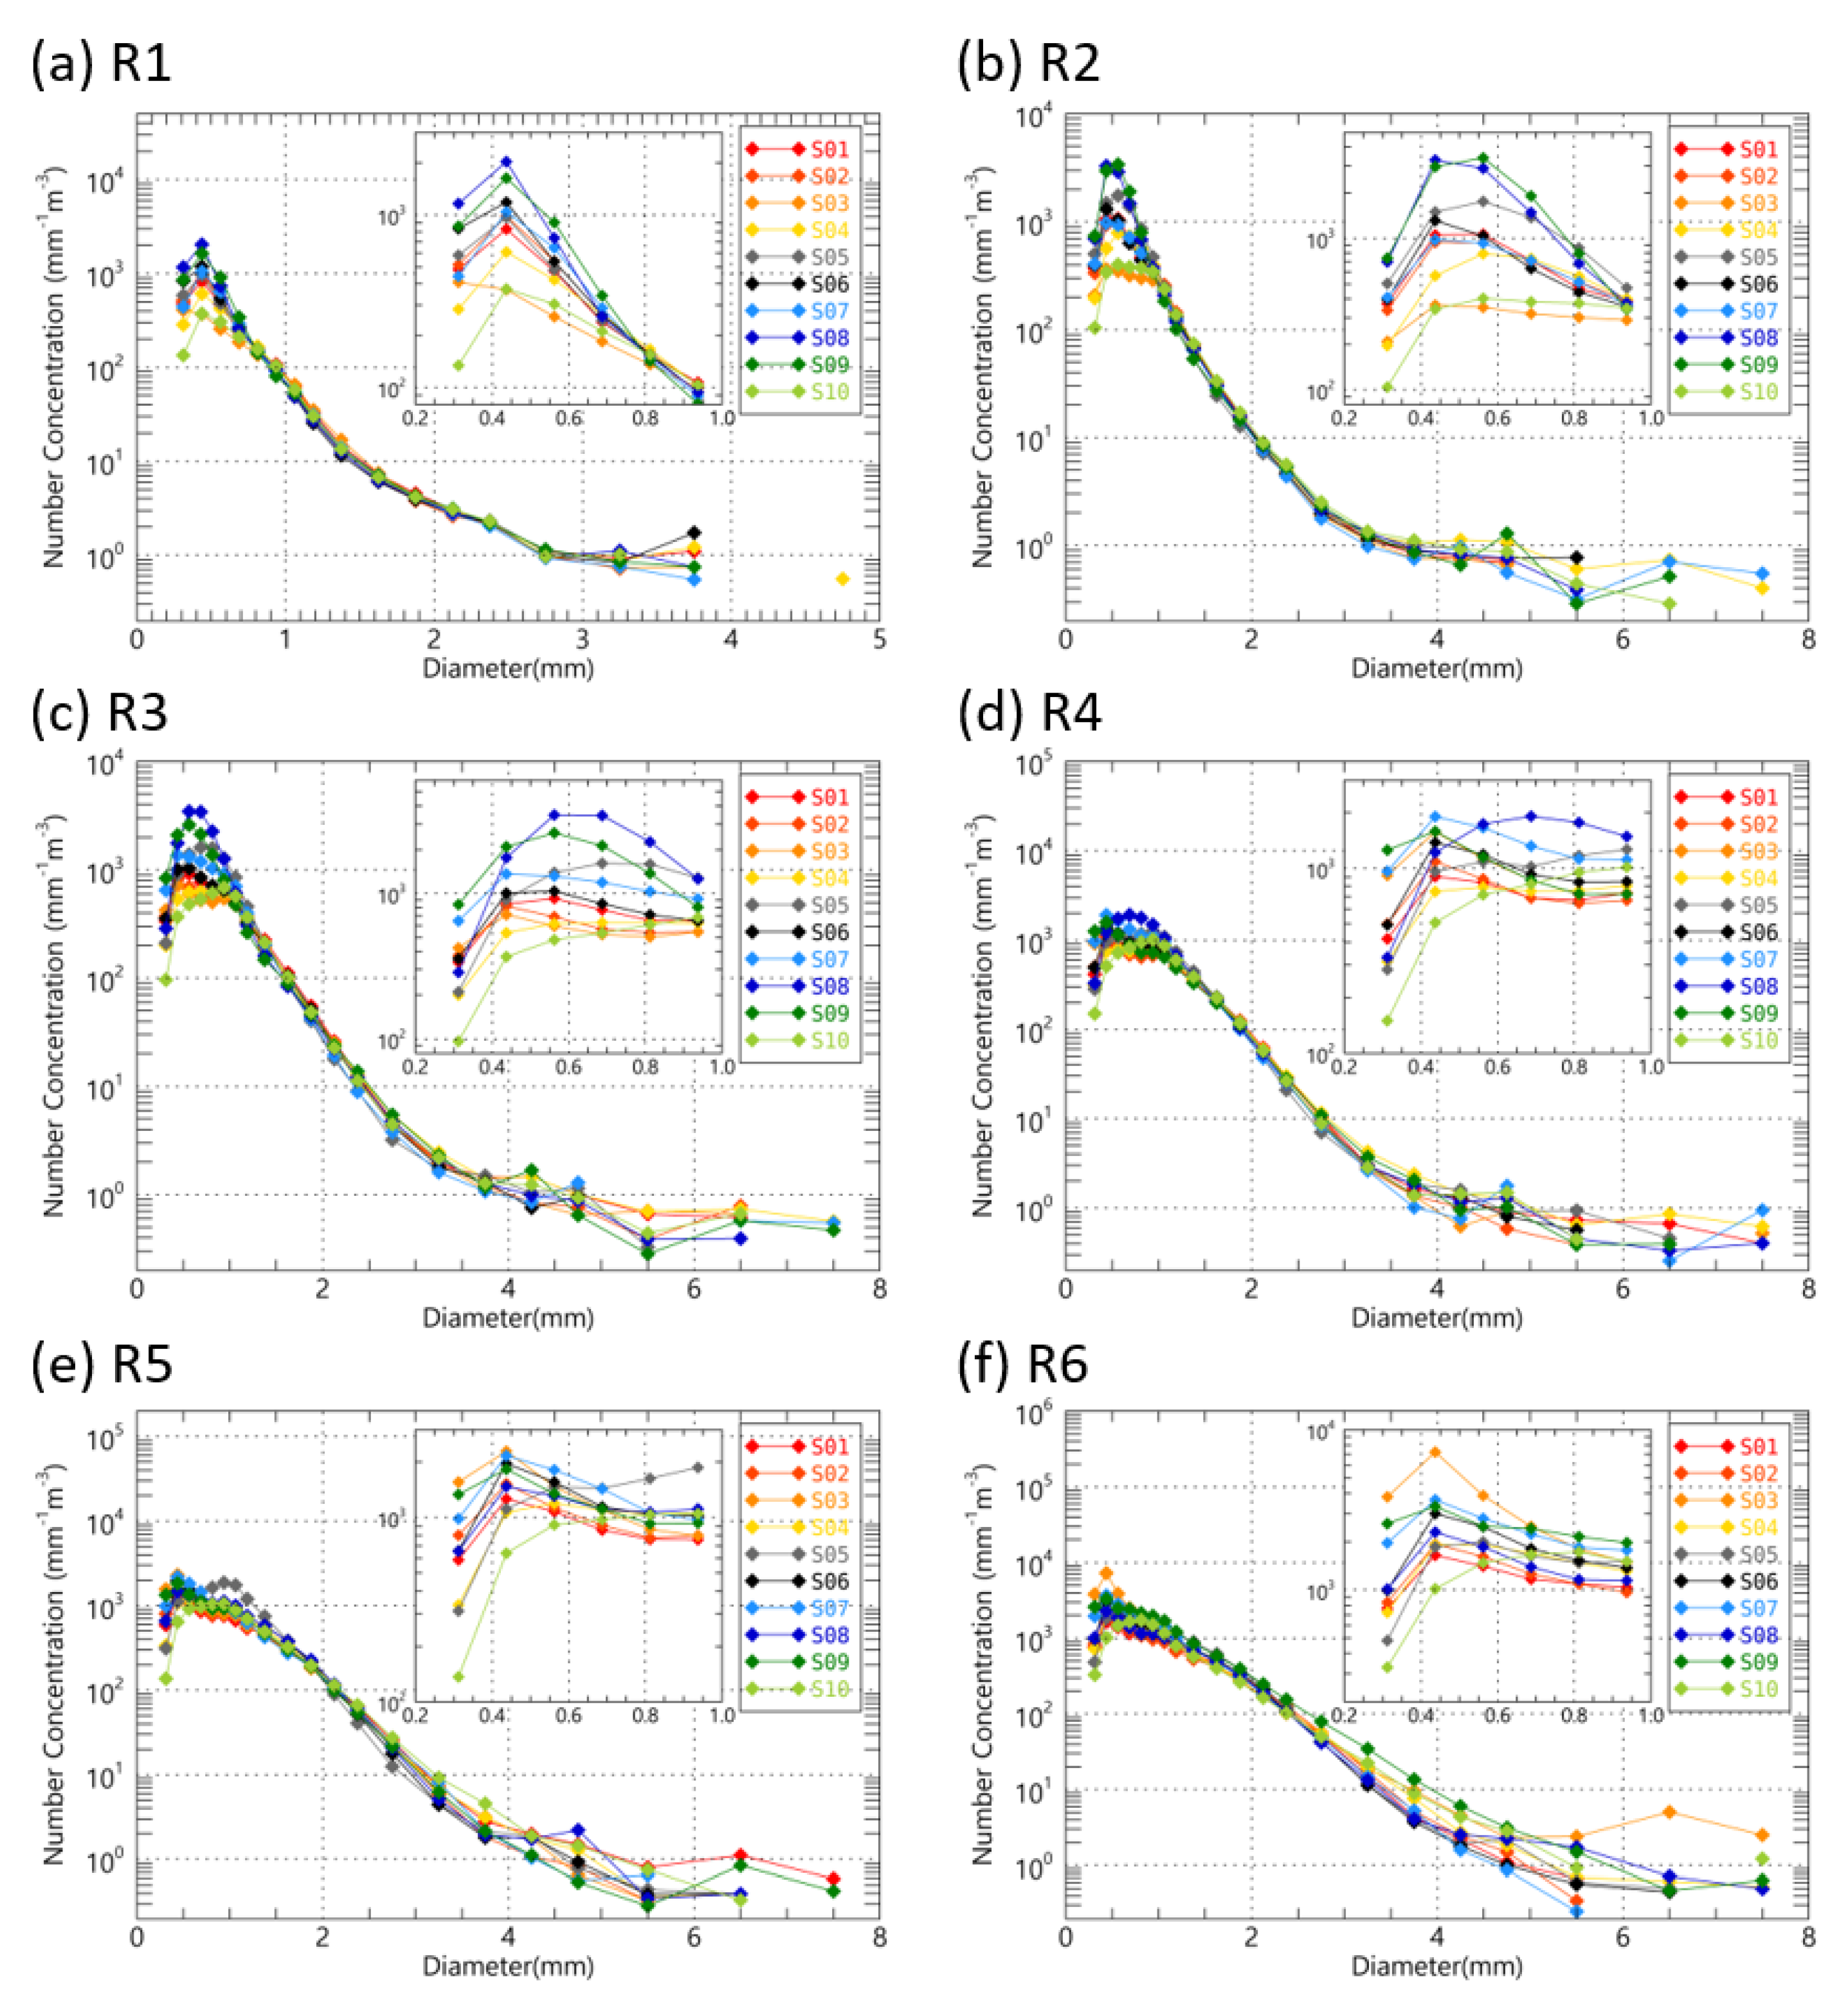
3.1. Raindrop Size Distribution
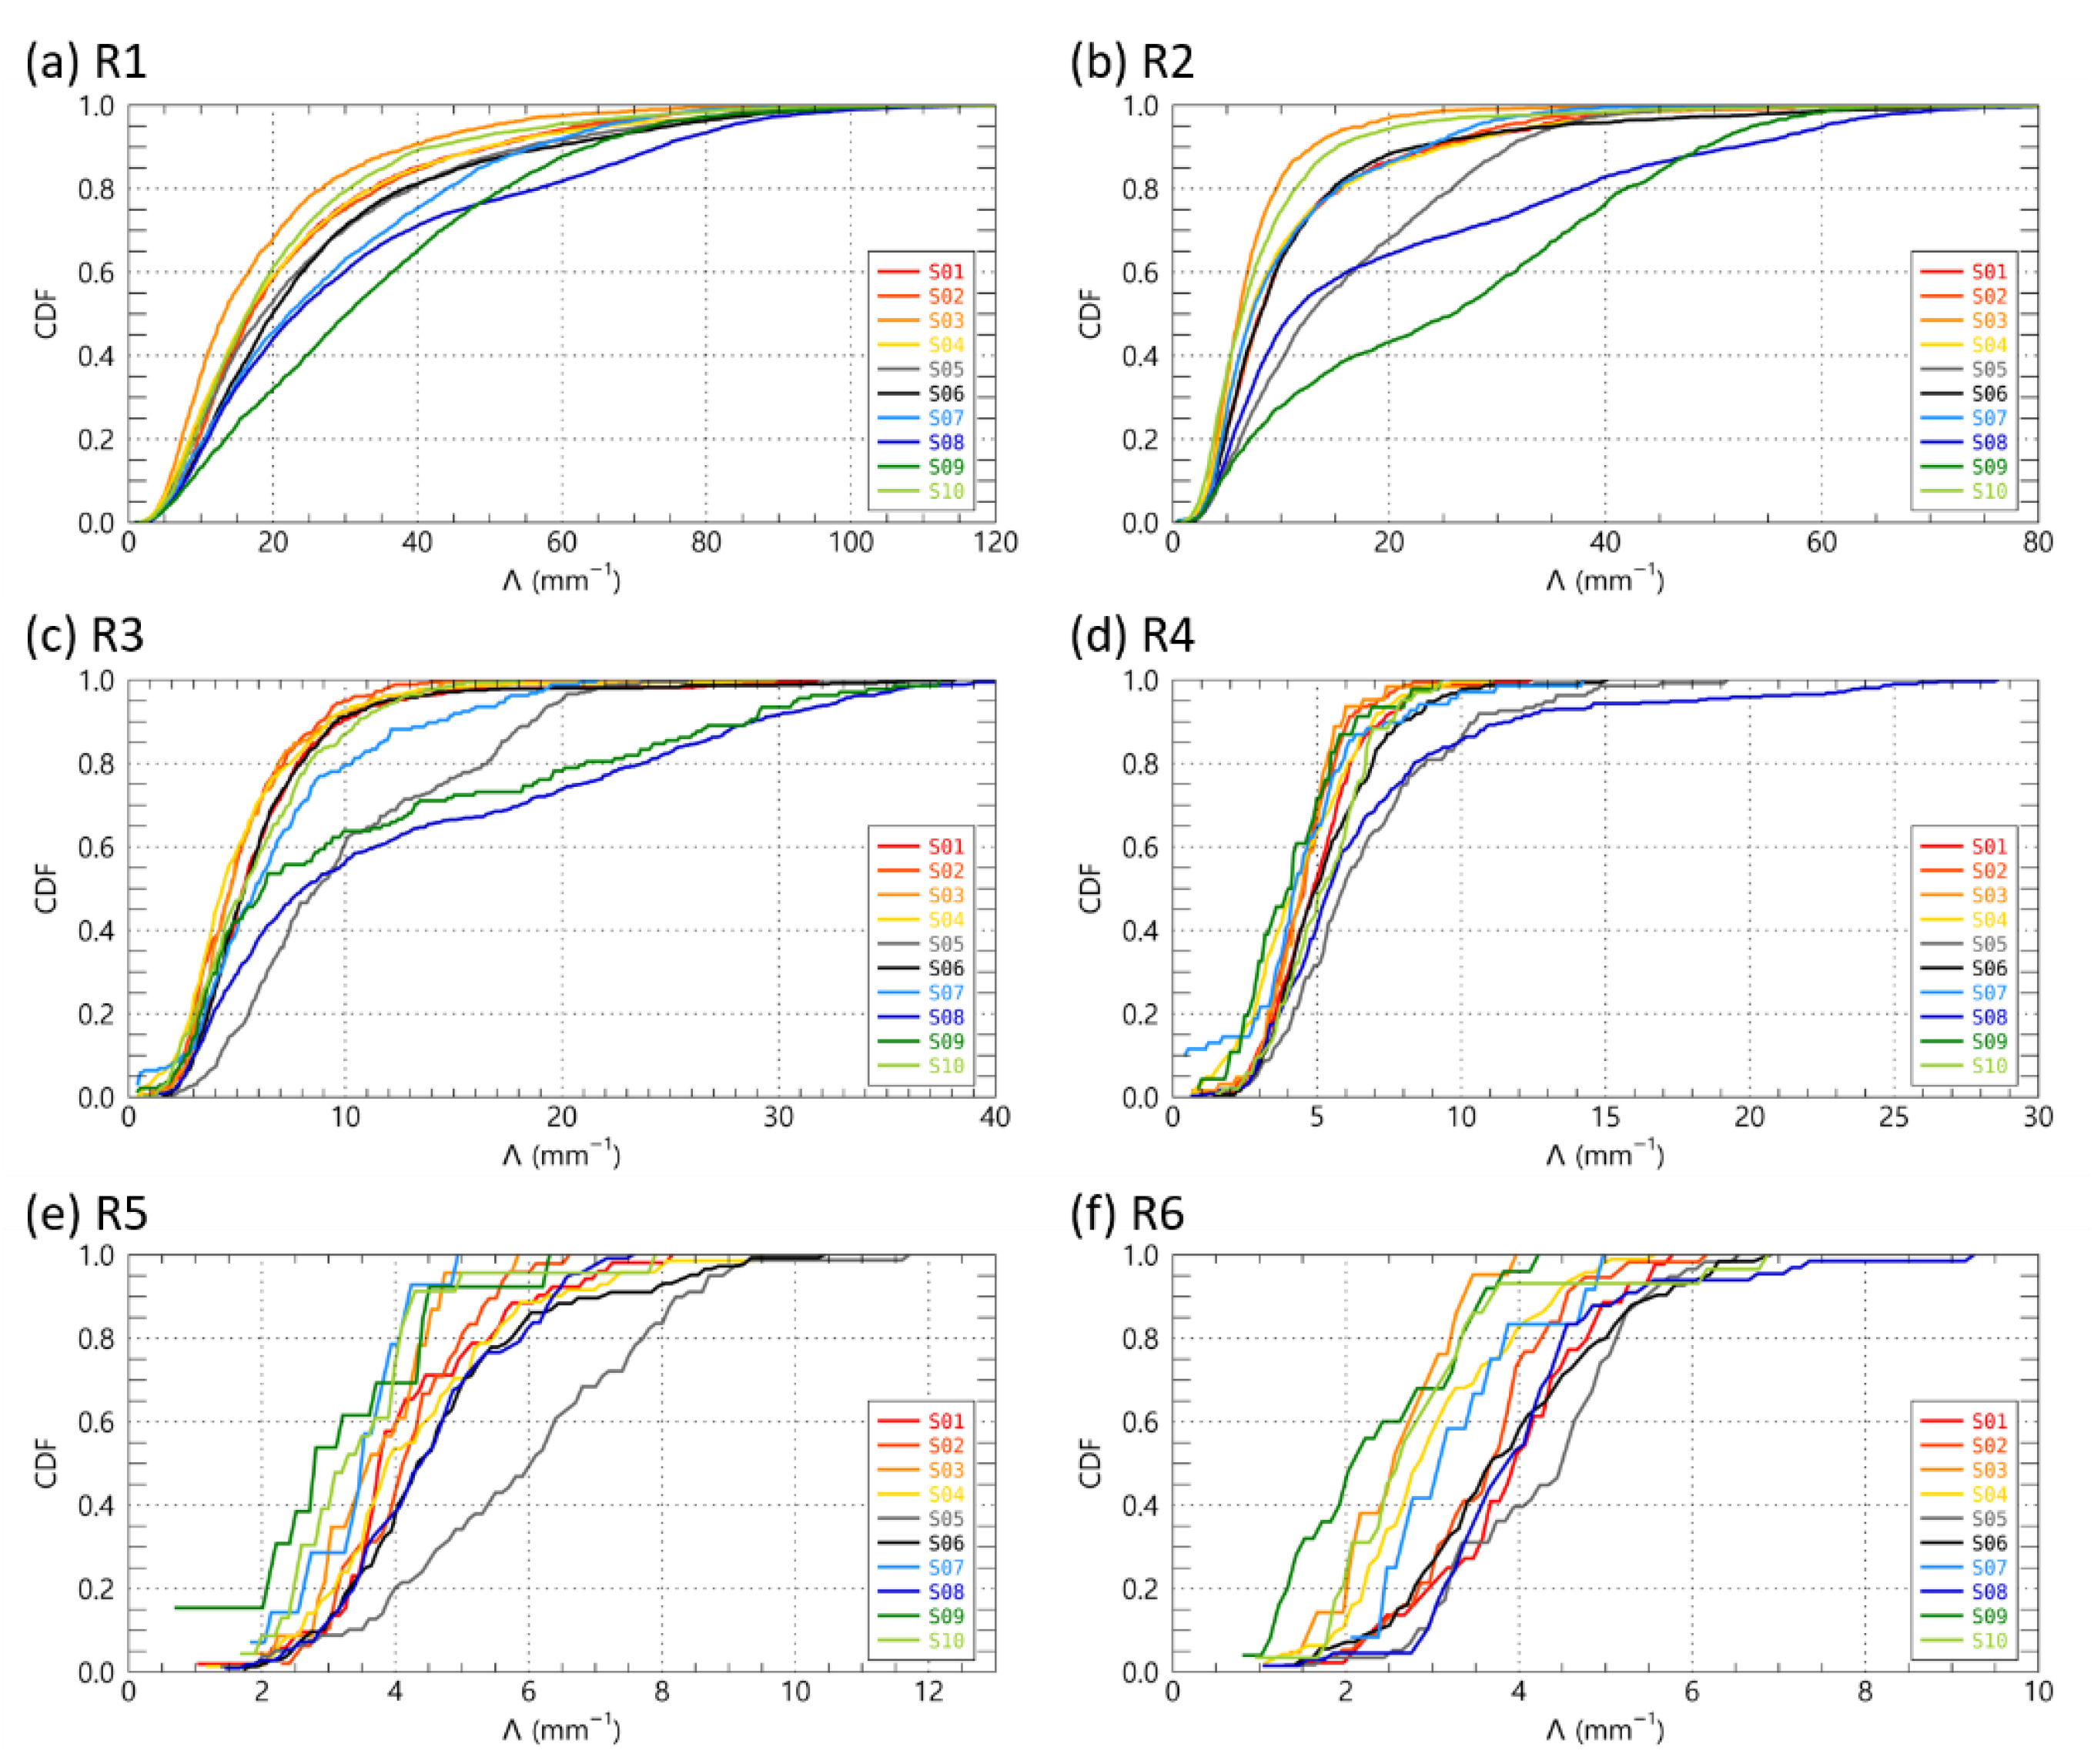
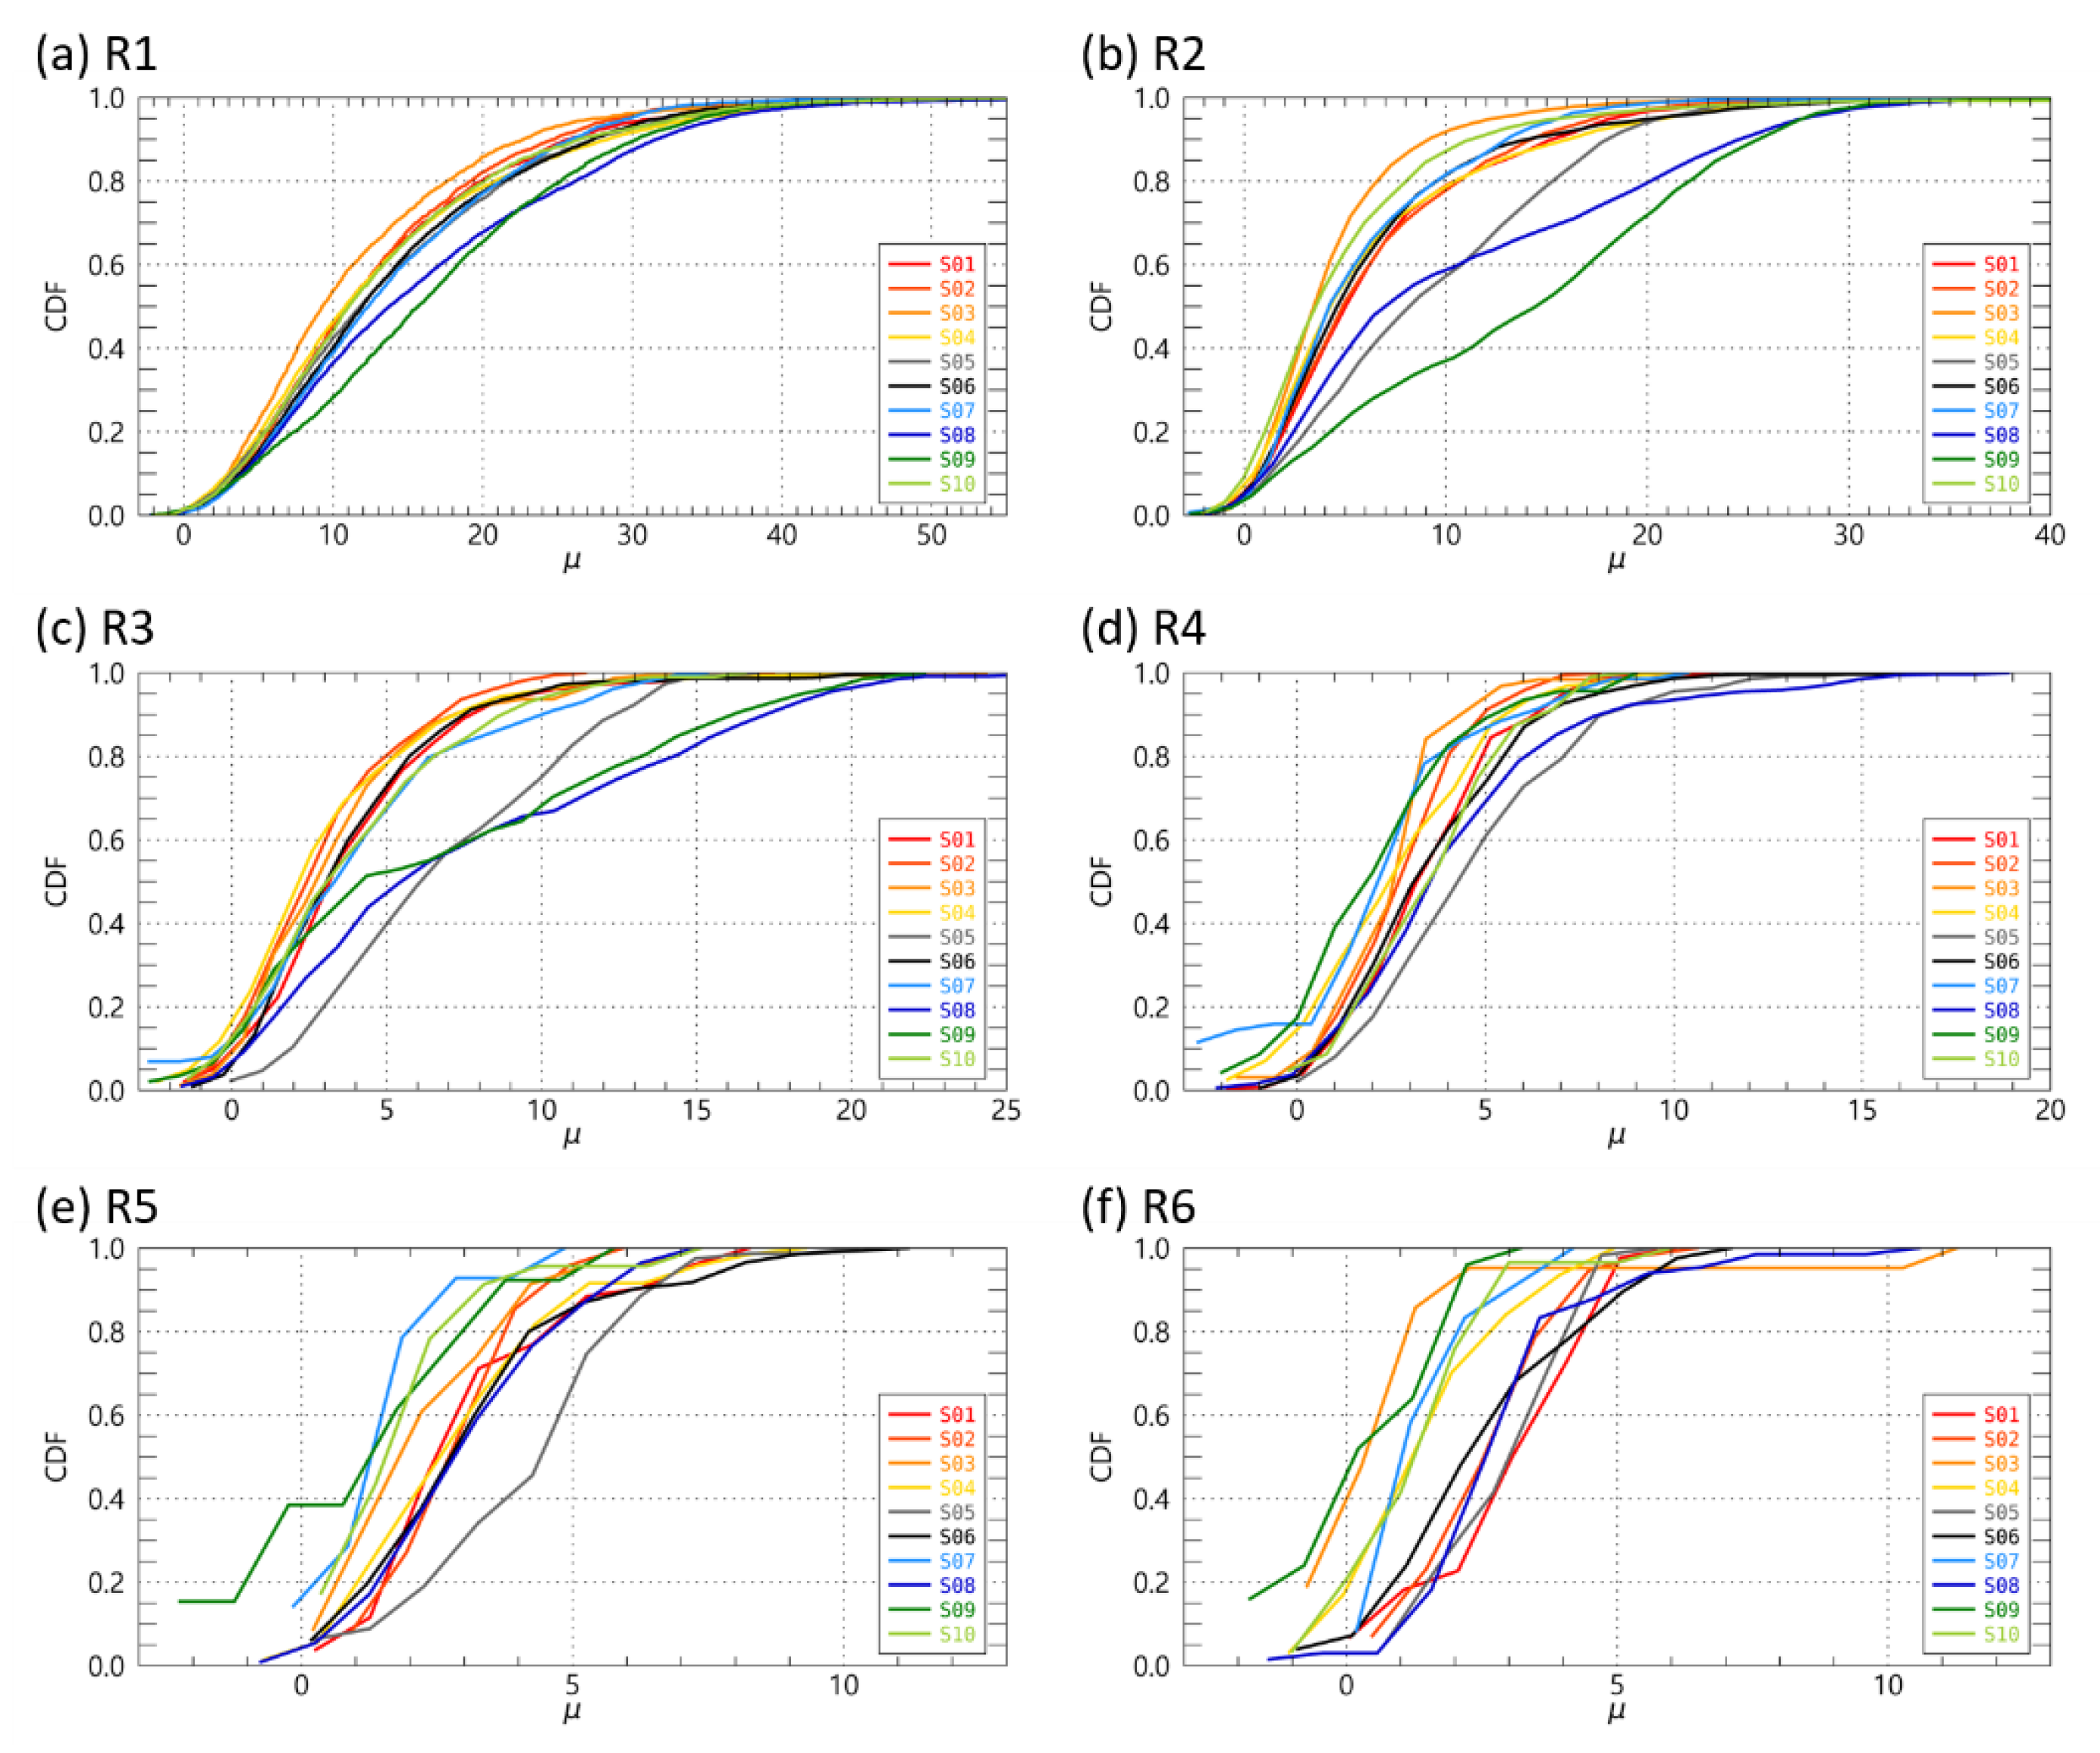
3.2. DSD Parameter Characteristics
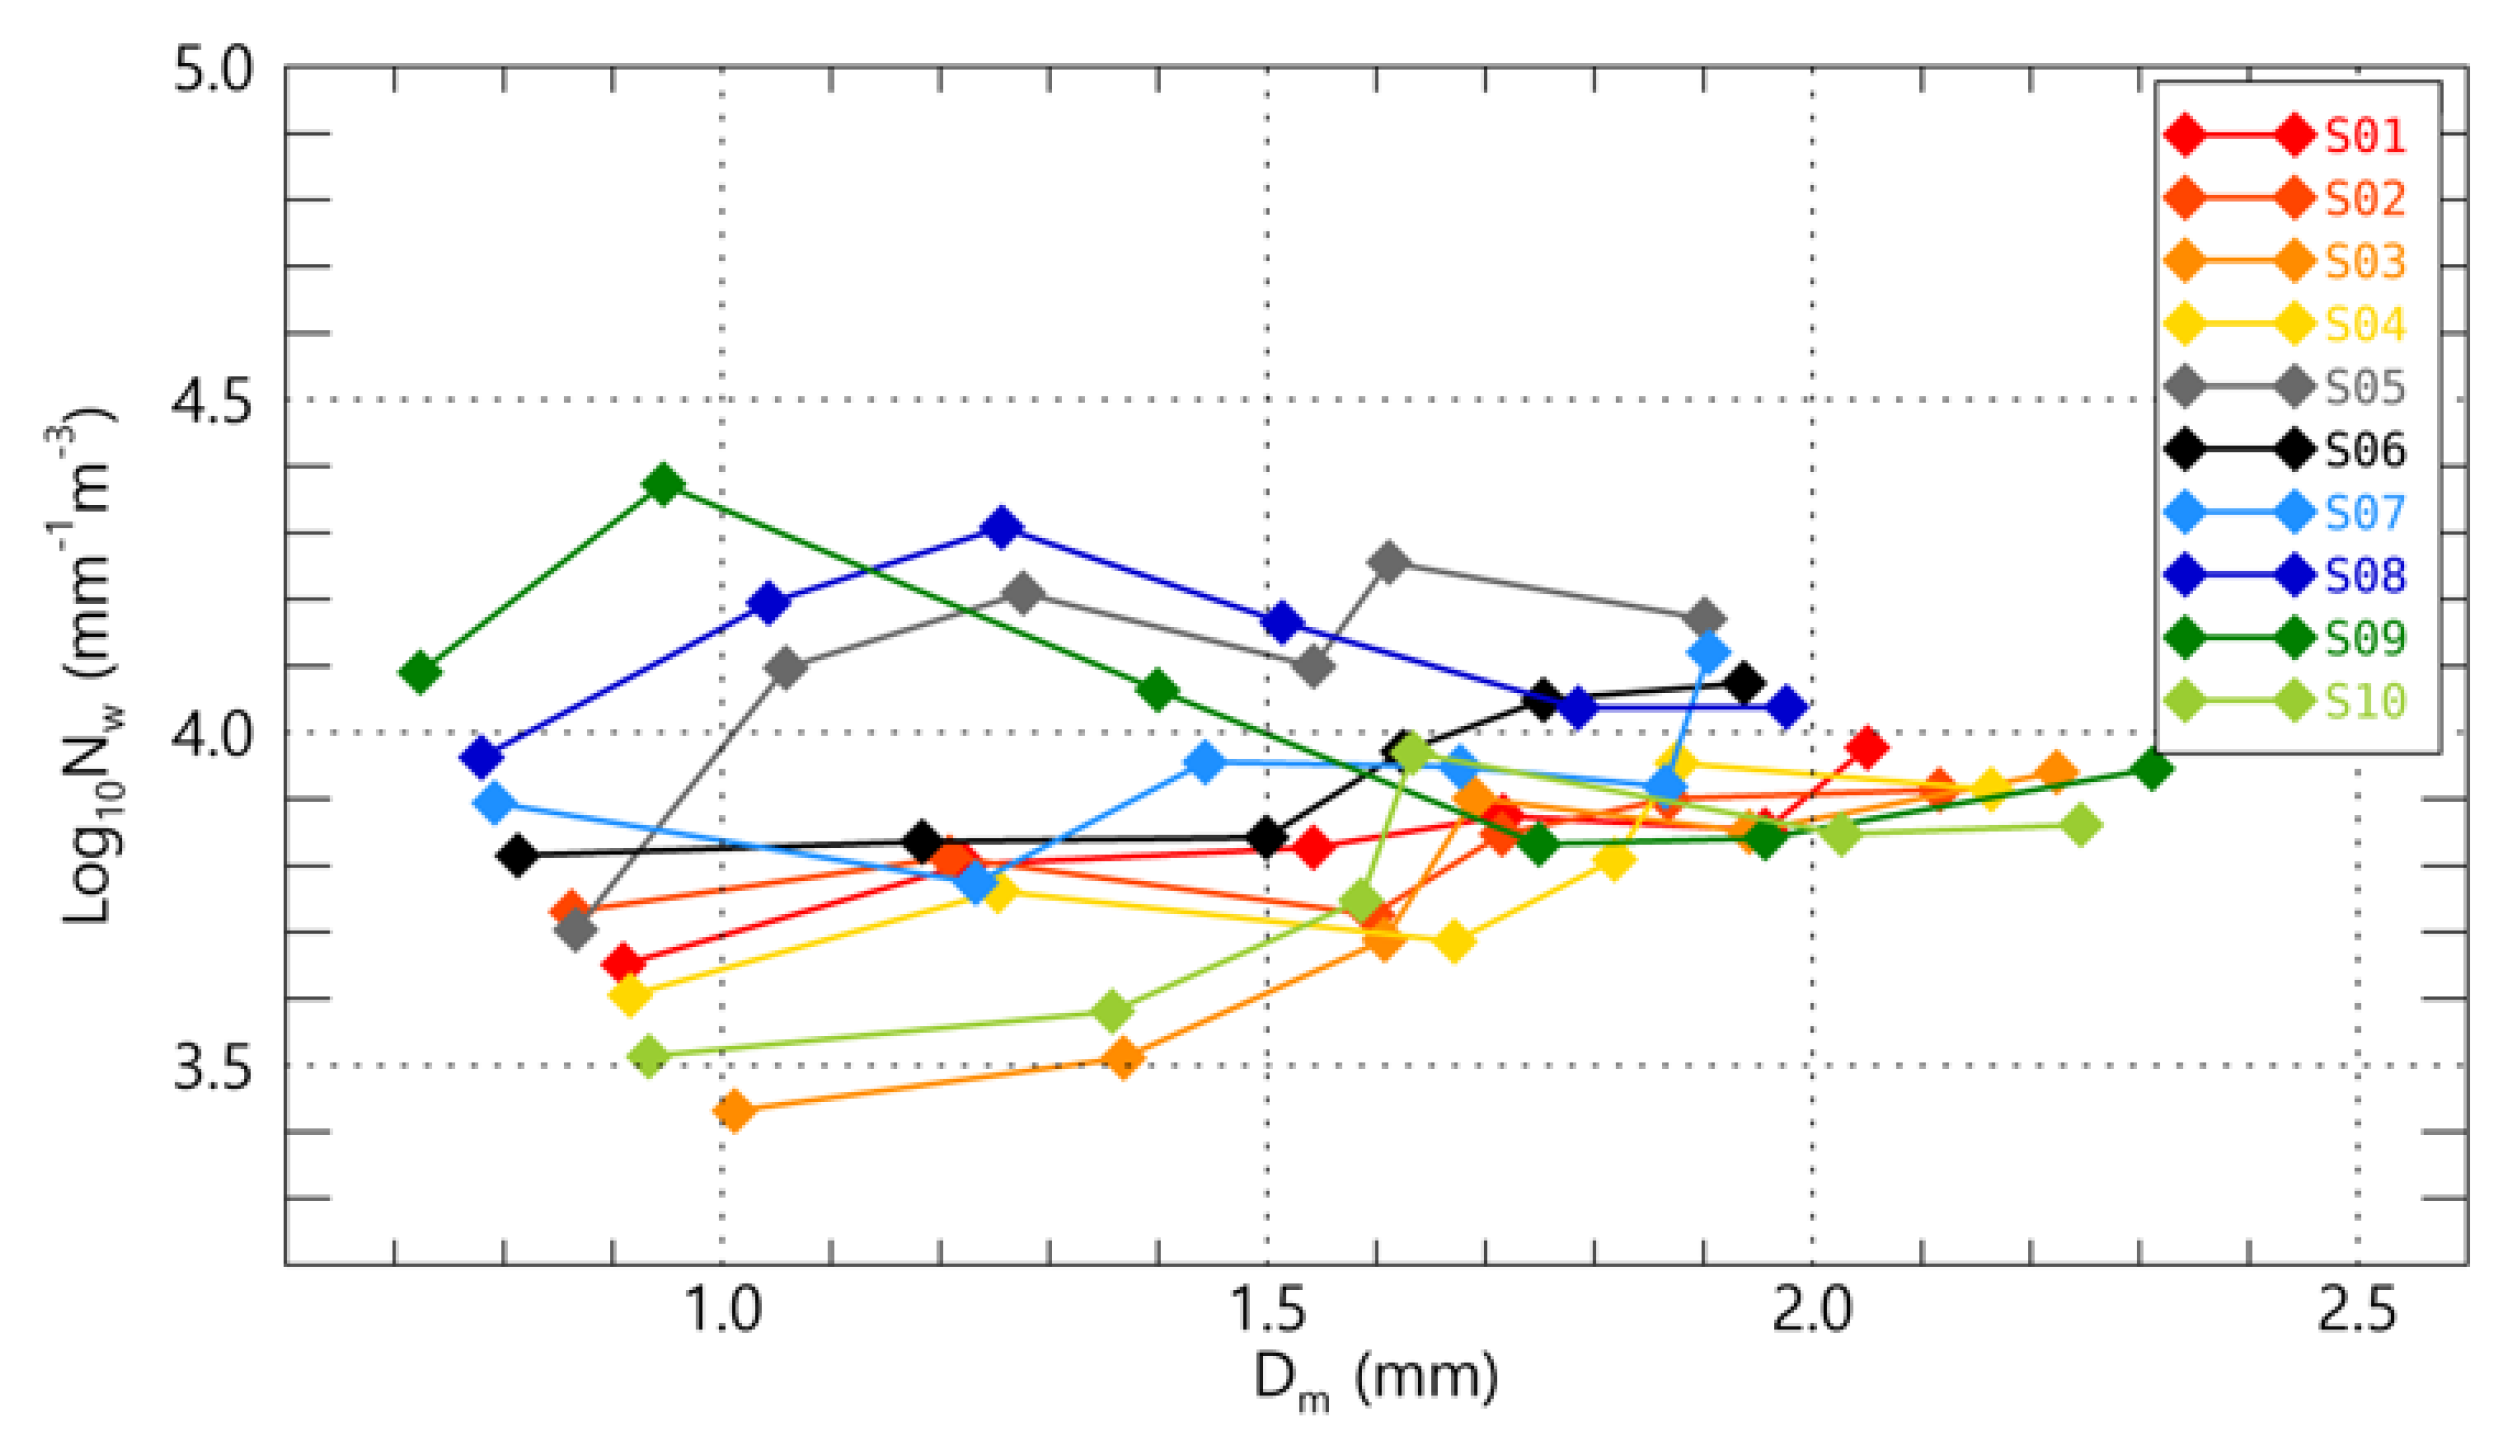
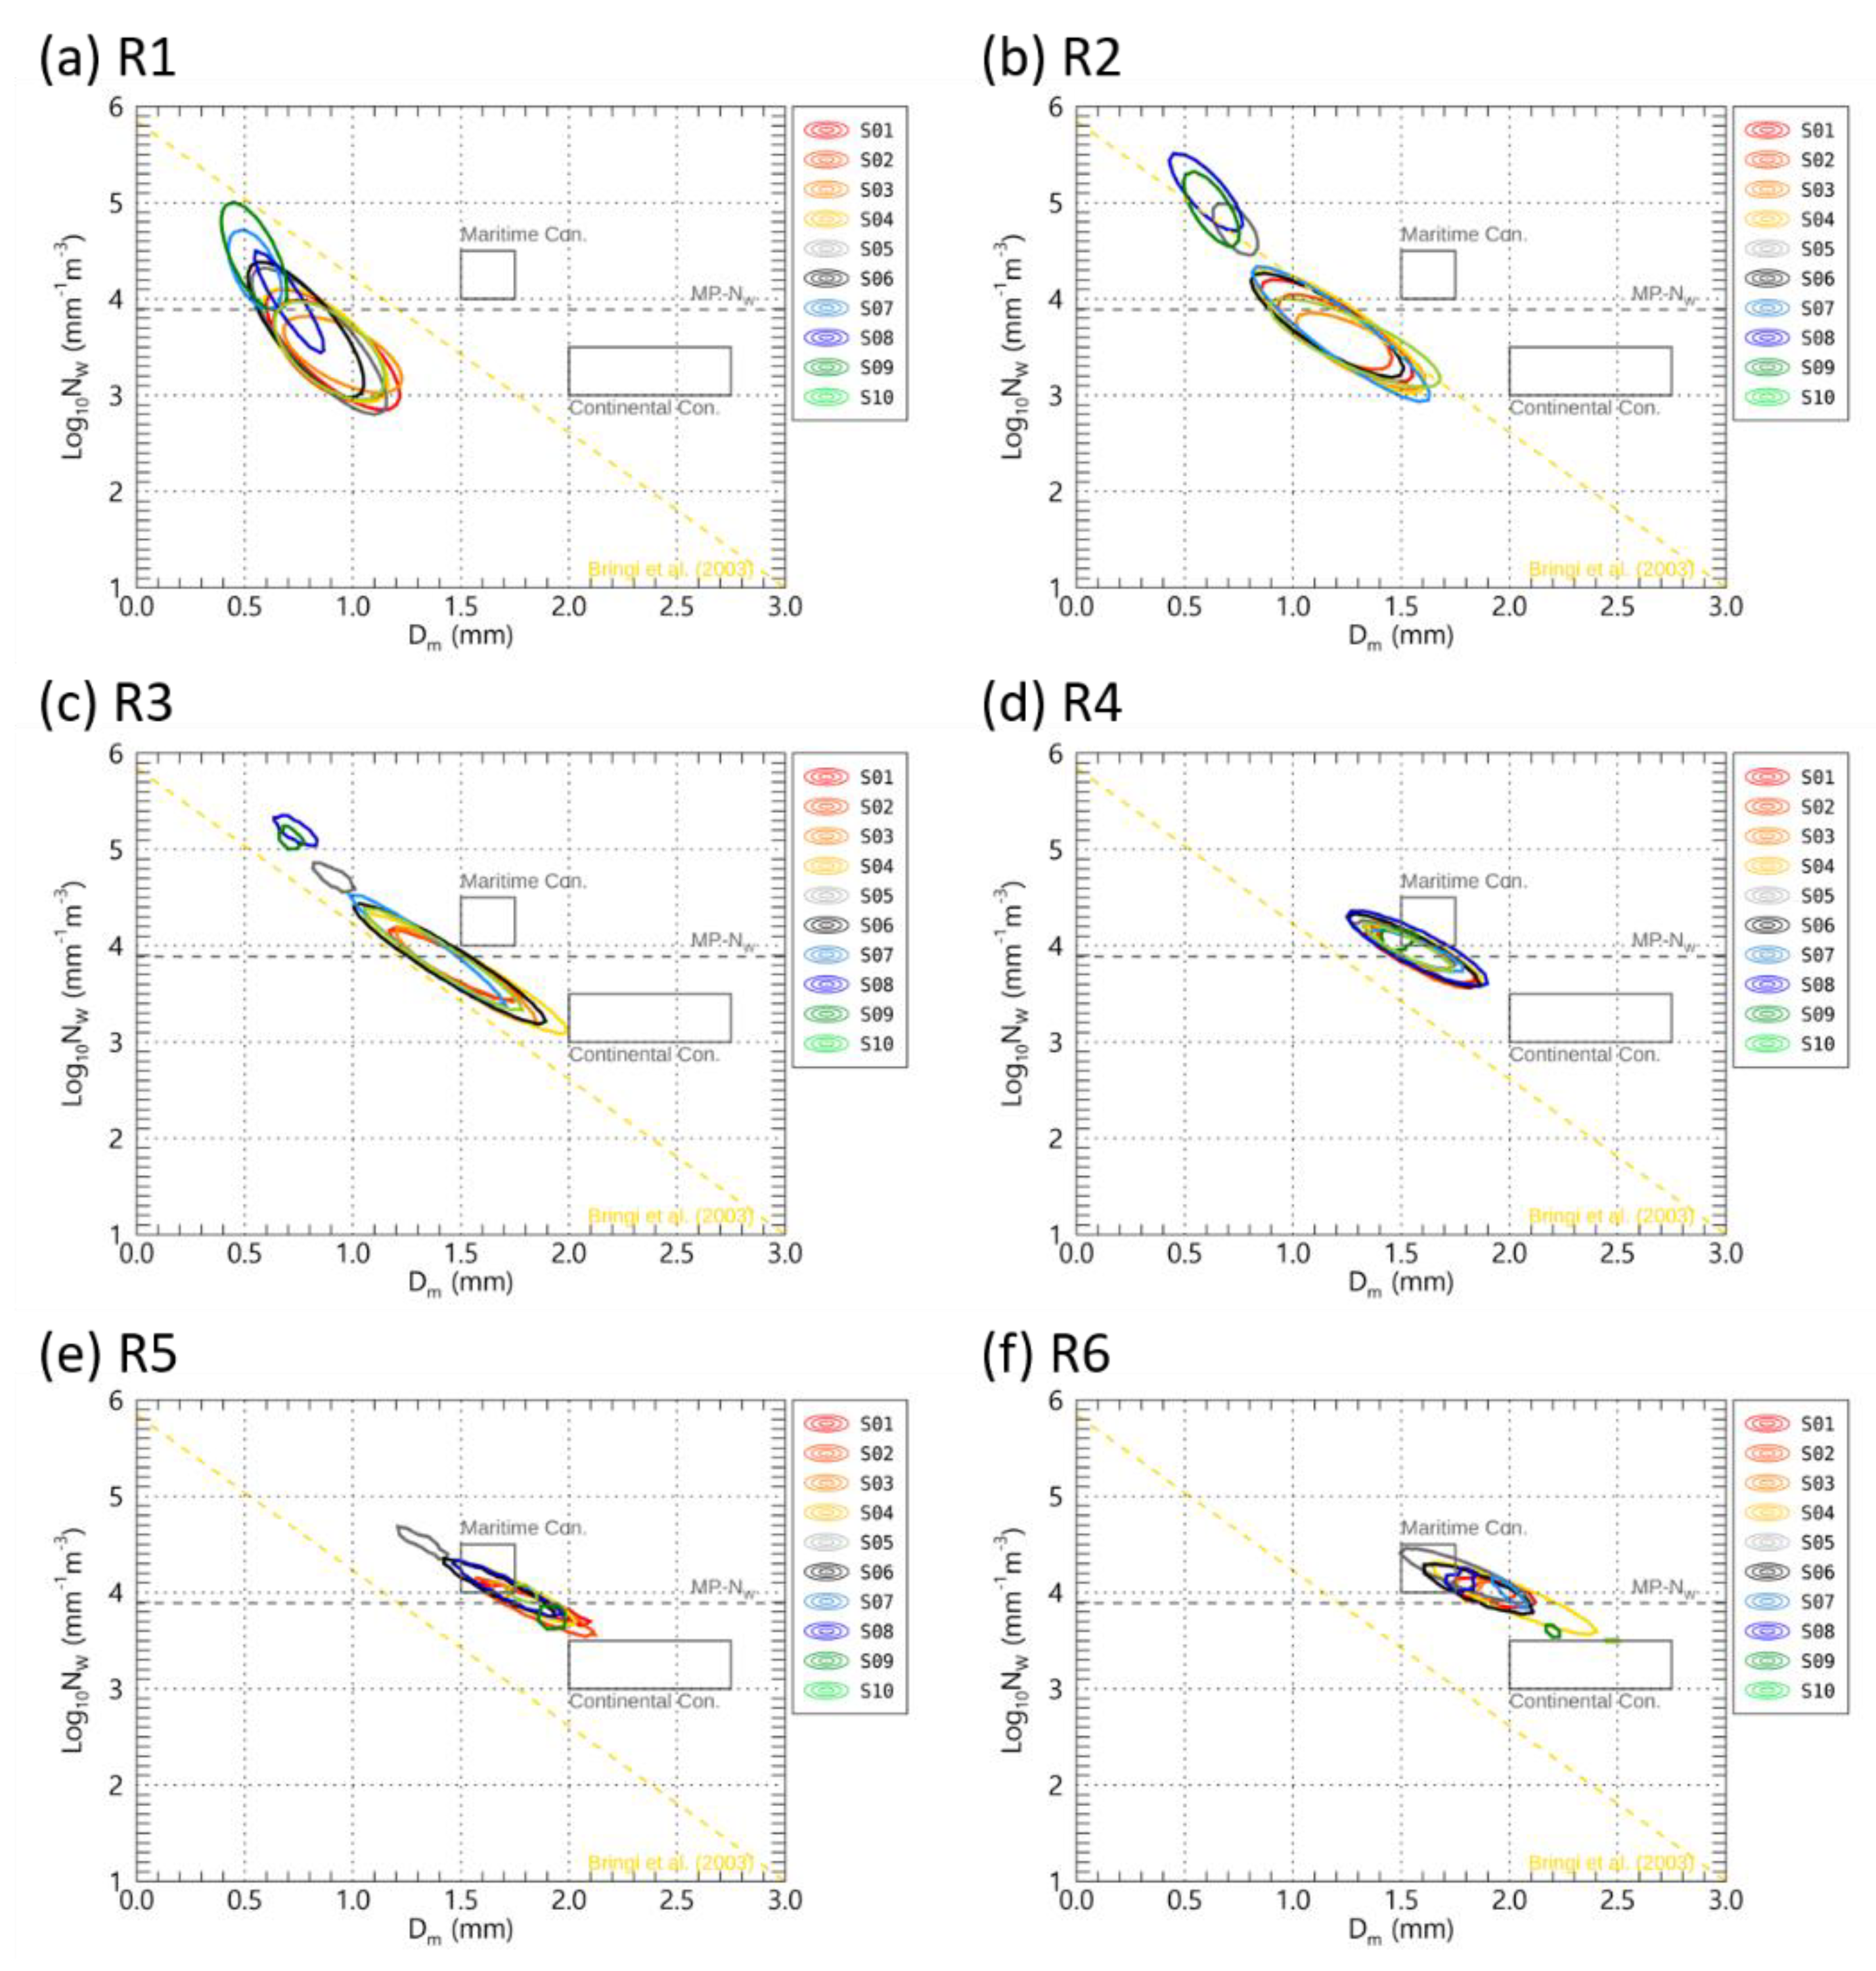
3.3. Representative Raindrop Size Distribution
3.4. Relation of DSD Parameters with Rain Rate
4. Discussion
5. Conclusions
- (1)
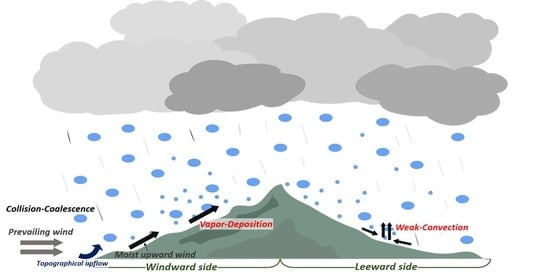
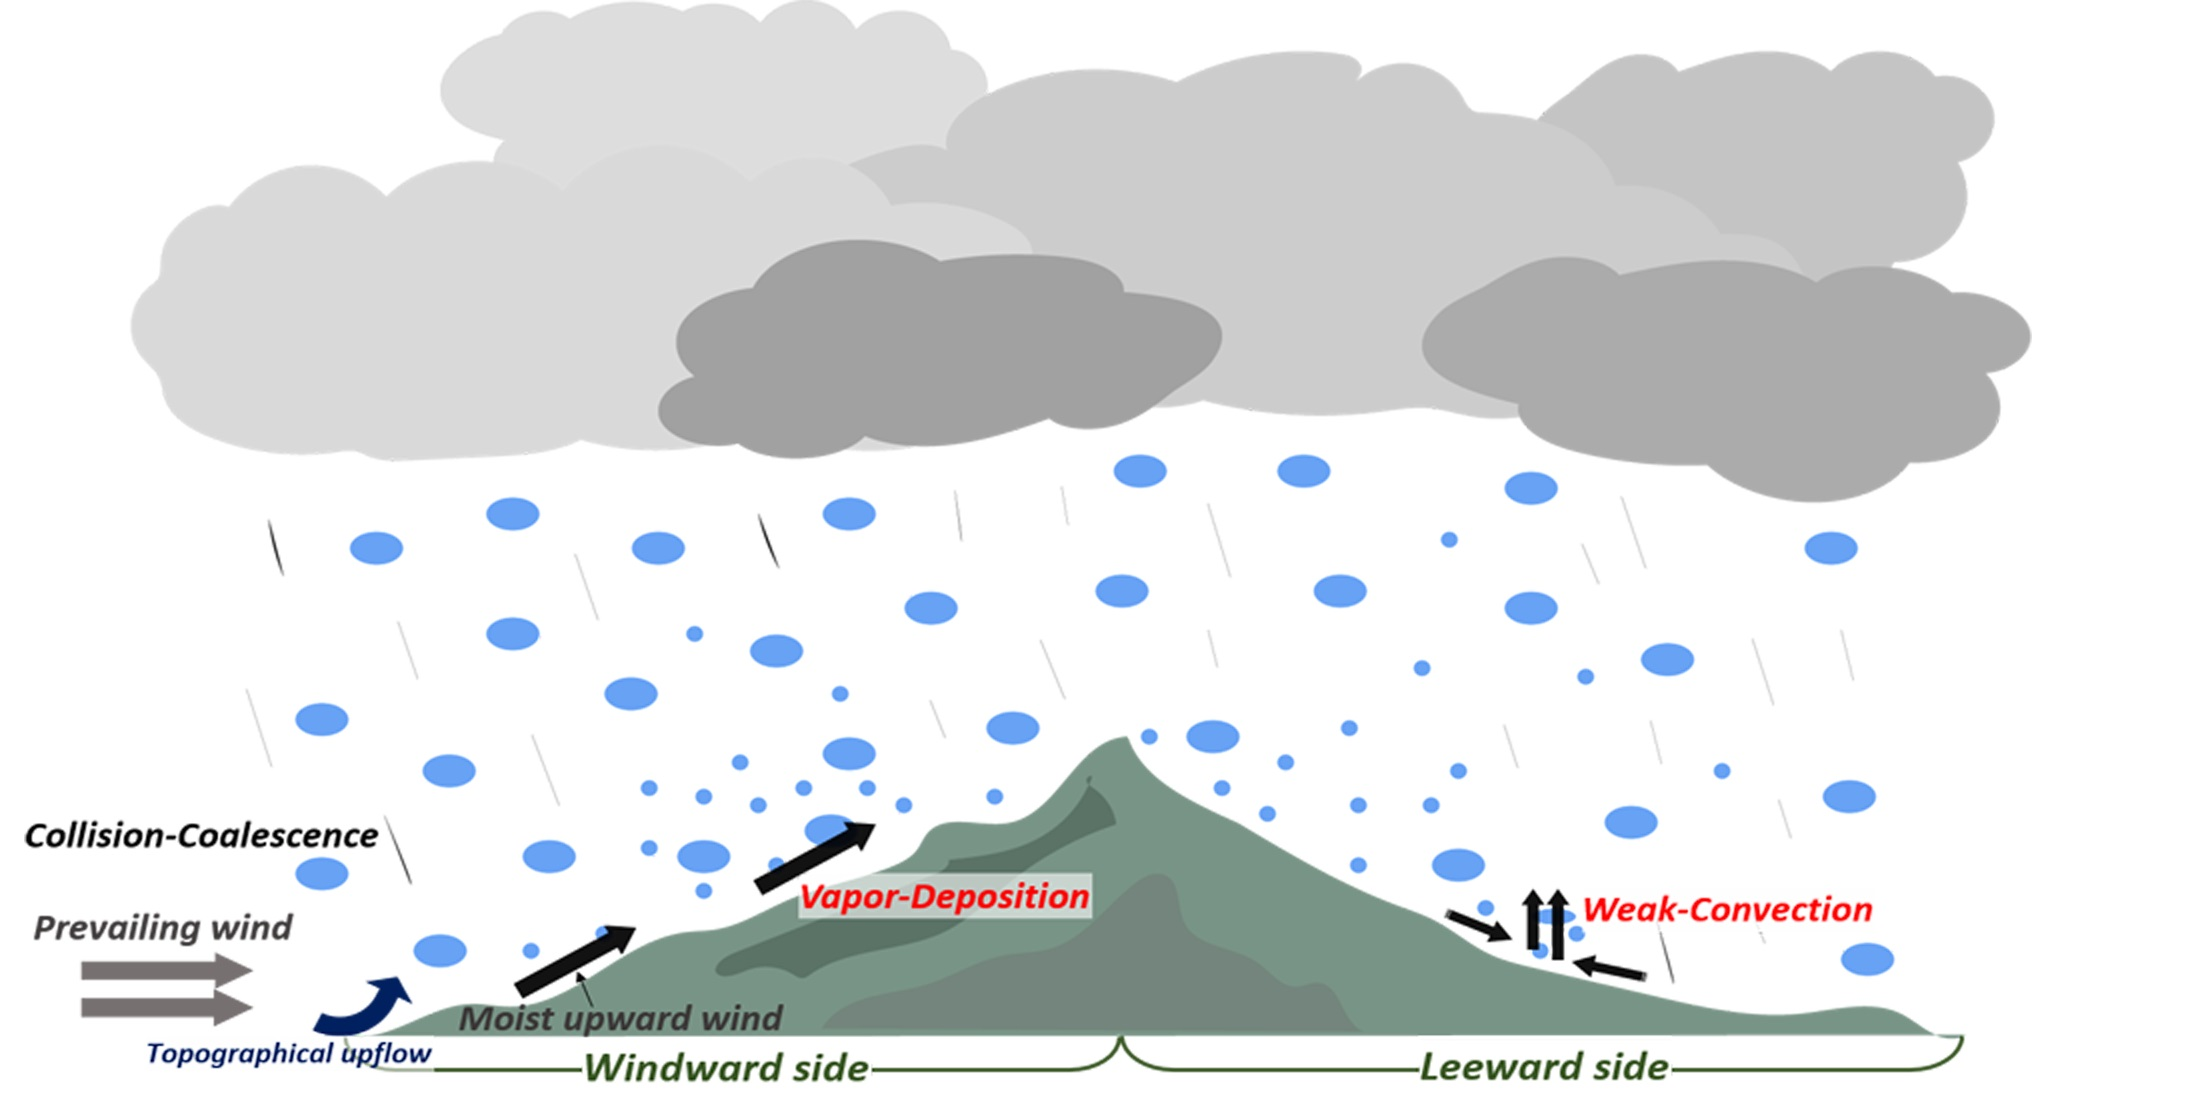
- On the windward slope, the concentration of small raindrops increases due to the influence of the forcible topographical rise of water vapor flowing from the sea at a low level, which can affect the increase in the rain rate. The high N(D) characteristics of small raindrops appeared at higher altitudes than LCL in mountainous terrain.
- (2)
- On the leeward slope, the concentration of large raindrops over 3 mm was lower, and the Nw was relatively high compared to the windward slope. These characteristics can be seen as a result of the weak convection of the low level. On the leeward slope, as the rain rate increased, the N(D) of raindrops decreased, and the diameter increased.
- (3)
- In the coastal area, large raindrops could develop at a low level due to the influence of the updraft developed over the coastline, and a low N(D) of small raindrops and relatively high concentration of large raindrops were shown on the ground.
Author Contributions
Funding
Data Availability Statement
Conflicts of Interest
References
- Ryzhkov, A.V.; Zrnić, D.S. Comparison of dual-polarization radar estimators of rain. J. Atmos. Ocean. Technol. 1995, 12, 249–256. [Google Scholar] [CrossRef]
- Abel, S.J.; Boutle, I.A. An improved representation of the raindrop size distribution for single-moment microphysics schemes. Q. J. R. Meteorol. Soc. 2012, 138, 2151–2162. [Google Scholar] [CrossRef]
- McFarquhar, G.M.; Hsieh, T.L.; Freer, M.; Mascio, J.; Jewett, B.F. The characterization of ice hydrometeor gamma size distributions as volumes in N0–λ–μ phase space: Implications for microphysical process modeling. J. Atmos. Sci. 2015, 72, 892–909. [Google Scholar] [CrossRef]
- Saleeby, S.M.; Cotton, W.R. A large-droplet mode and prognostic number concentration of cloud droplets in the Colorado State University Regional Atmospheric Modeling System (RAMS). Part I: Module descriptions and supercell test simulations. J. Appl. Meteorol. 2004, 43, 182–195. [Google Scholar] [CrossRef]
- Uijlenhoet, R.; Steiner, M.; Smith, J.A. Variability of raindrop size distributions in a squall line and implications for radar rainfall estimation. J. Hydrometeorol. 2003, 4, 43–61. [Google Scholar] [CrossRef]
- Jaffrain, J.; Berne, A. Quantification of the small-scale spatial structure of the raindrop size distribution from a network of disdrometers. J. Appl. Meteorol. Climatol. 2012, 51, 941–953. [Google Scholar] [CrossRef]
- Munchak, S.J.; Kummerow, C.D.; Elsaesser, G. Relationships between the raindrop size distribution and properties of the environment and clouds inferred from TRMM. J. Clim. 2012, 25, 2963–2978. [Google Scholar] [CrossRef]
- Cotton, W.R.; Bryan, G.; van den Heever, S.C. Cumulonimbus clouds and severe convective storms. Int. Geophys. 2011, 99, 87–142. [Google Scholar]
- Dolan, B.; Fuchs, B.; Rutledge, S.A.; Barnes, E.A.; Thompson, E.J. Primary modes of global drop size distributions. J. Atmos. Sci. 2018, 75, 1453–1476. [Google Scholar] [CrossRef]
- Kumjian, M.R.; Ryzhkov, A.V. The impact of size sorting on the polarimetric radar variables. J. Atmos. Sci. 2012, 69, 2042–2060. [Google Scholar] [CrossRef]
- Rutledge, S.A.; Houze, R.A., Jr. A diagnostic modelling study of the trailing stratiform region of a midlatitude squall line. J. Atmos. Sci. 1987, 44, 2640–2656. [Google Scholar] [CrossRef][Green Version]
- Houze, R.A., Jr. Stratiform precipitation in regions of convection: A meteorological paradox? Bull. Amer. Meteor. 1997, 78, 2179–2196. [Google Scholar] [CrossRef]
- Rosenfeld, D.; Ulbrich, C.W. Cloud microphysical properties, processes, and rainfall estimation opportunities. In Radar and Atmospheric Science: A Collection of Essays in Honor of David Atlas; American Meteorological Society: Boston, MA, USA, 2003; pp. 237–258. [Google Scholar]
- Bringi, V.N.; Chandrasekar, V.; Hubbert, J.; Gorgucci, E.; Randeu, W.L.; Schoenhuber, M. Raindrop size distribution in different climatic regimes from disdrometer and dual-polarized radar analysis. J. Atmos. Sci. 2003, 60, 354–365. [Google Scholar] [CrossRef]
- Atlas, D.; Ulbrich, C.W. An observationally based conceptual model of warm oceanic convective rain in the tropics. J. Appl. Meteorol. 2000, 39, 2165–2181. [Google Scholar] [CrossRef]
- Ulbrich, C.W.; Atlas, D. Microphysics of raindrop size spectra: Tropical continental and maritime storms. J. Appl. Meteorol. Climatol. 2007, 46, 1777–1791. [Google Scholar] [CrossRef]
- Thurai, M.; Bringi, V.N.; May, P.T. CPOL radar-derived drop size distribution statistics of stratiform and convective rain for two regimes in Darwin, Australia. J. Atmos. Ocean. Technol. 2010, 27, 932–942. [Google Scholar] [CrossRef]
- You, C.H.; Lee, D.I.; Jang, S.M.; Jang, M.; Uyeda, H.; Shinoda, T.; Kobayashi, F. Characteristics of rainfall systems accompanied with Changma front at Chujado in Korea. Asia-Pac. J. Atmos. Sci. 2010, 46, 41–51. [Google Scholar] [CrossRef]
- Yu, T.; Chandrasekar, V.; Xiao, H.; Joshil, S.S. Characteristics of Snow Particle Size Distribution in the PyeongChang Region of South Korea. Atmosphere 2020, 11, 1093. [Google Scholar] [CrossRef]
- Janapati, J.; Seela, B.K.; Lin, P.L.; Lee, M.T.; Joseph, E. Microphysical features of typhoon and non-typhoon rainfall observed in Taiwan, an island in the northwestern Pacific. Hydrol. Earth Syst. Sci. 2021, 25, 4025–4040. [Google Scholar] [CrossRef]
- Jung, S.A.; Lee, D.I.; Jou, B.J.D.; Uyeda, H. Microphysical properties of maritime squall line observed on June 2, 2008 in Taiwan. J. Meteorol. Soc. Jpn. Ser. II 2012, 90, 833–850. [Google Scholar] [CrossRef]
- Seela, B.K.; Janapati, J.; Lin, P.L.; Wang, P.K.; Lee, M.T. Raindrop size distribution characteristics of summer and winter season rainfall over north Taiwan. J. Geophys. Res. Atmos. 2018, 123, 11–602. [Google Scholar] [CrossRef]
- Chang, W.Y.; Wang, T.C.C.; Lin, P.L. Characteristics of the raindrop size distribution and drop shape relation in typhoon systems in the western Pacific from the 2D video disdrometer and NCU C-band polarimetric radar. J. Atmos. Ocean. Technol. 2009, 26, 1973–1993. [Google Scholar] [CrossRef]
- Oue, M.; Uyeda, H.; Lee, D.I. Raindrop size distribution parameters estimated from polarimetric radar variables in convective cells around Okinawa Island during the Baiu period. Asia-Pac. J. Atmos. Sci. 2011, 47, 33–44. [Google Scholar] [CrossRef]
- Hashimoto, A.; Harimaya, T. Characteristics of raindrop size distribution dependent on the life stage of a convective precipitation cloud in the Baiu season. J. Meteorol. Soc. Jpn. Ser. II 2005, 83, 641–649. [Google Scholar] [CrossRef]
- Chen, G.; Zhao, K.; Wen, L.; Wang, M.; Huang, H.; Wang, M.; Yang, Z.; Zhang, G.; Zhang, P.; Lee, W.C. Microphysical characteristics of three convective events with intense rainfall observed by polarimetric radar and disdrometer in eastern China. Remote Sens. 2019, 11, 2004. [Google Scholar] [CrossRef]
- Ji, L.; Chen, H.; Li, L.; Chen, B.; Xiao, X.; Chen, M.; Zhang, G. Raindrop size distributions and rain characteristics observed by a PARSIVEL disdrometer in Beijing, Northern China. Remote Sens. 2019, 11, 1479. [Google Scholar] [CrossRef]
- Wen, L.; Zhao, K.; Wang, M.; Zhang, G. Seasonal variations of observed raindrop size distribution in East China. Adv. Atmos. Sci. 2019, 36, 346–362. [Google Scholar] [CrossRef]
- Bringi, V.N.; Williams, C.R.; Thurai, M.; May, P.T. Using dual-polarized radar and dual-frequency profiler for DSD characterization: A case study from Darwin, Australia. J. Atmos. Ocean. Technol. 2009, 26, 2107–2122. [Google Scholar] [CrossRef]
- Maeso, J.; Bringi, V.N.; Cruz-Pol, S.; Chandrasekar, V. DSD characterization and computations of expected reflectivity using data from a two-dimensional video disdrometer deployed in a tropical environment. In Proceedings of the 2005 IEEE International Geoscience and Remote Sensing Symposium, IGARSS’05, Seoul, Korea, 29 July 2005; Volume 7, pp. 5073–5076. [Google Scholar]
- Tokay, A.; Bashor, P.G.; Habib, E.; Kasparis, T. Raindrop size distribution measurements in tropical cyclones. Mon. Weather Rev. 2008, 136, 1669–1685. [Google Scholar] [CrossRef]
- Le Loh, J.; Lee, D.I.; You, C.H. Inter-comparison of DSDs between Jincheon and Miryang at South Korea. Atmos. Res. 2019, 227, 52–65. [Google Scholar] [CrossRef]
- Suh, S.H.; Kim, H.J.; Lee, D.I.; Kim, T.H. Geographical characteristics of raindrop size distribution in the southern parts of South Korea. J. Appl. Meteorol. Climatol. 2021, 60, 157–169. [Google Scholar] [CrossRef]
- Ma, Y.; Ni, G.; Chandra, C.V.; Tian, F.; Chen, H. Statistical characteristics of raindrop size distribution during rainy seasons in the Beijing urban area and implications for radar rainfall estimation. Hydrol. Earth Syst. Sci. 2019, 23, 4153–4170. [Google Scholar] [CrossRef]
- Krishna, U.M.; Reddy, K.K.; Seela, B.K.; Shirooka, R.; Lin, P.L.; Pan, C.J. Raindrop size distribution of easterly and westerly monsoon precipitation observed over Palau islands in the Western Pacific Ocean. Atmos. Res. 2016, 174, 41–51. [Google Scholar] [CrossRef]
- Suh, S.H.; You, C.H.; Lee, D.I. Climatological characteristics of raindrop size distributions in Busan, Republic of Korea. Hydrol. Earth Syst. Sci. 2016, 20, 193–207. [Google Scholar] [CrossRef]
- Jwa, M.; Jin, H.G.; Lee, J.; Moon, S.; Baik, J.J. Characteristics of raindrop size distribution in Seoul, South Korea according to rain and weather types. Asia-Pac. J. Atmos. Sci. 2021, 57, 605–617. [Google Scholar] [CrossRef]
- Loh, J.L.; Lee, D.I.; Kang, M.Y.; You, C.H. Classification of rainfall types using parsivel disdrometer and S-band polarimetric radar in central Korea. Remote Sens. 2020, 12, 642. [Google Scholar] [CrossRef]
- Kozu, T.; Reddy, K.K.; Mori, S.; Thurai, M.; Ong, J.T.; Rao, D.N.; Shimomai, T. Seasonal and diurnal variations of raindrop size distribution in Asian monsoon region. J. Meteorol. Soc. Jpn. Ser. II 2006, 84, 195–209. [Google Scholar] [CrossRef]
- You, C.H.; Lee, D.I. Decadal variation in raindrop size distributions in Busan, Korea. Adv. Meteorol. 2015, 2015, 329327. [Google Scholar] [CrossRef]
- Kim, H.J.; Lee, K.O.; You, C.H.; Uyeda, H.; Lee, D.I. Microphysical characteristics of a convective precipitation system observed on July 04, 2012, over Mt. Halla in South Korea. Atmos. Res. 2019, 222, 74–87. [Google Scholar] [CrossRef]
- Feng, Y.C.; Wang, T.C.C. Precipitation characteristics of an autumn torrential rainfall event in northern Taiwan as determined from dual-polarization radar data. J. Meteorol. Soc. Jpn. Ser. II 2011, 89, 133–150. [Google Scholar] [CrossRef]
- Lee, K.O.; Shimizu, S.; Maki, M.; You, C.H.; Uyeda, H.; Lee, D.I. Enhancement mechanism of the 30 June 2006 precipitation system observed over the northwestern slope of Mt. Halla, Jeju Island, Korea. Atmos. Res. 2010, 97, 343–358. [Google Scholar] [CrossRef]
- Lee, K.O.; Uyeda, H.; Shimizu, S.; Lee, D.I. Dual-Doppler radar analysis of the enhancement of a precipitation system on the northern side of Mt. Halla, Jeju Island, Korea on 6 July 2007. Atmos. Res. 2012, 118, 133–152. [Google Scholar] [CrossRef]
- Lee, K.O.; Uyeda, H.; Lee, D.I. Microphysical structures associated with enhancement of convective cells over Mt. Halla, Jeju Island, Korea on 6 July 2007. Atmos. Res. 2014, 135, 76–90. [Google Scholar] [CrossRef]
- Atlas, D.; Srivastava, R.C.; Sekhon, R.S. Doppler radar characteristics of precipitation at vertical incidence. Rev. Geophys. 1973, 11, 1–35. [Google Scholar] [CrossRef]
- Friedrich, K.; Kalina, E.A.; Masters, F.J.; Lopez, C.R. Drop-size distributions in thunderstorms measured by optical disdrometers during VORTEX2. Mon. Weather Rev. 2013, 141, 1182–1203. [Google Scholar] [CrossRef]
- Bao, X.; Wu, L.; Tang, B.; Ma, L.; Wu, D.; Tang, J.; Chen, H.; Wu, L. Variable raindrop size distributions in different rainbands associated with Typhoon Fitow (2013). J. Geophys. Res. Atmos. 2019, 124, 12262–12281. [Google Scholar] [CrossRef]
- Jaffrain, J.; Berne, A. Experimental quantification of the sampling uncertainty associated with measurements from PARSIVEL disdrometers. J. Hydrometeorol. 2011, 12, 352–370. [Google Scholar] [CrossRef]
- Löffler-Mang, M.; Joss, J. An optical disdrometer for measuring size and velocity of hydrometeors. J. Atmos. Ocean. Technol. 2000, 17, 130–139. [Google Scholar] [CrossRef]
- Beard, K.V. Terminal velocity and shape of cloud and precipitation drops aloft. J. Atmos. Sci. 1976, 33, 851–864. [Google Scholar] [CrossRef]
- Ulbrich, C.W. Natural variations in the analytical form of the raindrop size distribution. J. Clim. Appl. Meteorol. 1983, 22, 1764–1775. [Google Scholar] [CrossRef]
- Marshall, J.S. The distribution of raindrops with size. J. Meteor. 1948, 5, 165–166. [Google Scholar] [CrossRef]
- Vivekanandan, J.; Zhang, G.; Brandes, E. Polarimetric radar estimators based on a constrained gamma drop size distribution model. J. Appl. Meteorol. 2004, 43, 217–230. [Google Scholar] [CrossRef]
- Smith, P.L. Raindrop size distributions: Exponential or gamma—Does the difference matter? J. Appl. Meteorol. Climatol. 2003, 42, 1031–1034. [Google Scholar] [CrossRef]
- Yuter, S.E.; Houze, R.A., Jr. Measurements of raindrop size distributions over the Pacific warm pool and implications for Z–R relations. J. Appl. Meteorol. 1997, 36, 847–867. [Google Scholar] [CrossRef]
- Seliga, T.A.; Bringi, V.N. Potential use of radar differential reflectivity measurements at orthogonal polarizations for measuring precipitation. J. Appl. Meteorol. Climatol. 1976, 15, 69–76. [Google Scholar] [CrossRef]
- Tokay, A.; Short, D.A. Evidence from tropical raindrop spectra of the origin of rain from stratiform versus convective clouds. J. Appl. Meteorol. Climatol. 1996, 35, 355–371. [Google Scholar] [CrossRef]
- Testud, J.; Oury, S.; Black, R.A.; Amayenc, P.; Dou, X. The concept of “normalized” distribution to describe raindrop spectra: A tool for cloud physics and cloud remote sensing. J. Appl. Meteorol. 2001, 40, 1118–1140. [Google Scholar] [CrossRef]
- Waterman, P.C. Symmetry, unitarity, and geometry in electromagnetic scattering. Phys. Rev. D 1971, 3, 825. [Google Scholar] [CrossRef]
- Leinonen, J. High-level interface to T-matrix scattering calculations: Architecture, capabilities and limitations. Opt. Express 2014, 22, 1655–1660. [Google Scholar] [CrossRef]
- Thurai, M.; Huang, G.J.; Bringi, V.N.; Randeu, W.L.; Schönhuber, M. Drop shapes, model comparisons, and calculations of polarimetric radar parameters in rain. J. Atmos. Ocean. Technol. 2007, 24, 1019–1032. [Google Scholar] [CrossRef]
- Testik, F.Y.; Pei, B. Wind effects on the shape of raindrop size distribution. J. Hydrometeorol. 2017, 18, 1285–1303. [Google Scholar] [CrossRef]
- Lee, K.O.; Uyeda, H.; Lee, D.I. Effect of an isolated elliptical terrain (Jeju Island) on rainfall enhancement in a moist environment. Tellus A Dyn. Meteorol. Oceanogr. 2014, 66, 20484. [Google Scholar] [CrossRef]


| Observation Year | Observation Period |
|---|---|
| 2012 | 27 June–13 July |
| 2013 | 18 June–14 July |
| 2014 | 19 June–14 July |
| Site | Latitude (°, N) | Longitude (°, E) | Altitude (m) | Location |
|---|---|---|---|---|
| S1 | 33.3000 | 126.2056 | 37 | Windward |
| S2 | 33.1394 | 126.2717 | 140 | Windward |
| S3 | 33.3450 | 126.3214 | 324 | Windward |
| S4 | 33.3469 | 126.3883 | 551 | Windward |
| S5 | 33.4250 | 126.4036 | 330 | Windward |
| S6 | 33.3919 | 126.4939 | 975 | Windward |
| S7 | 33.4253 | 126.5303 | 571 | Leeward |
| S8 | 33.4303 | 126.5978 | 590 | Leeward |
| S9 | 33.4594 | 126.7033 | 332 | Leeward |
| S10 | 33.5172 | 126.8869 | 57 | Leeward |
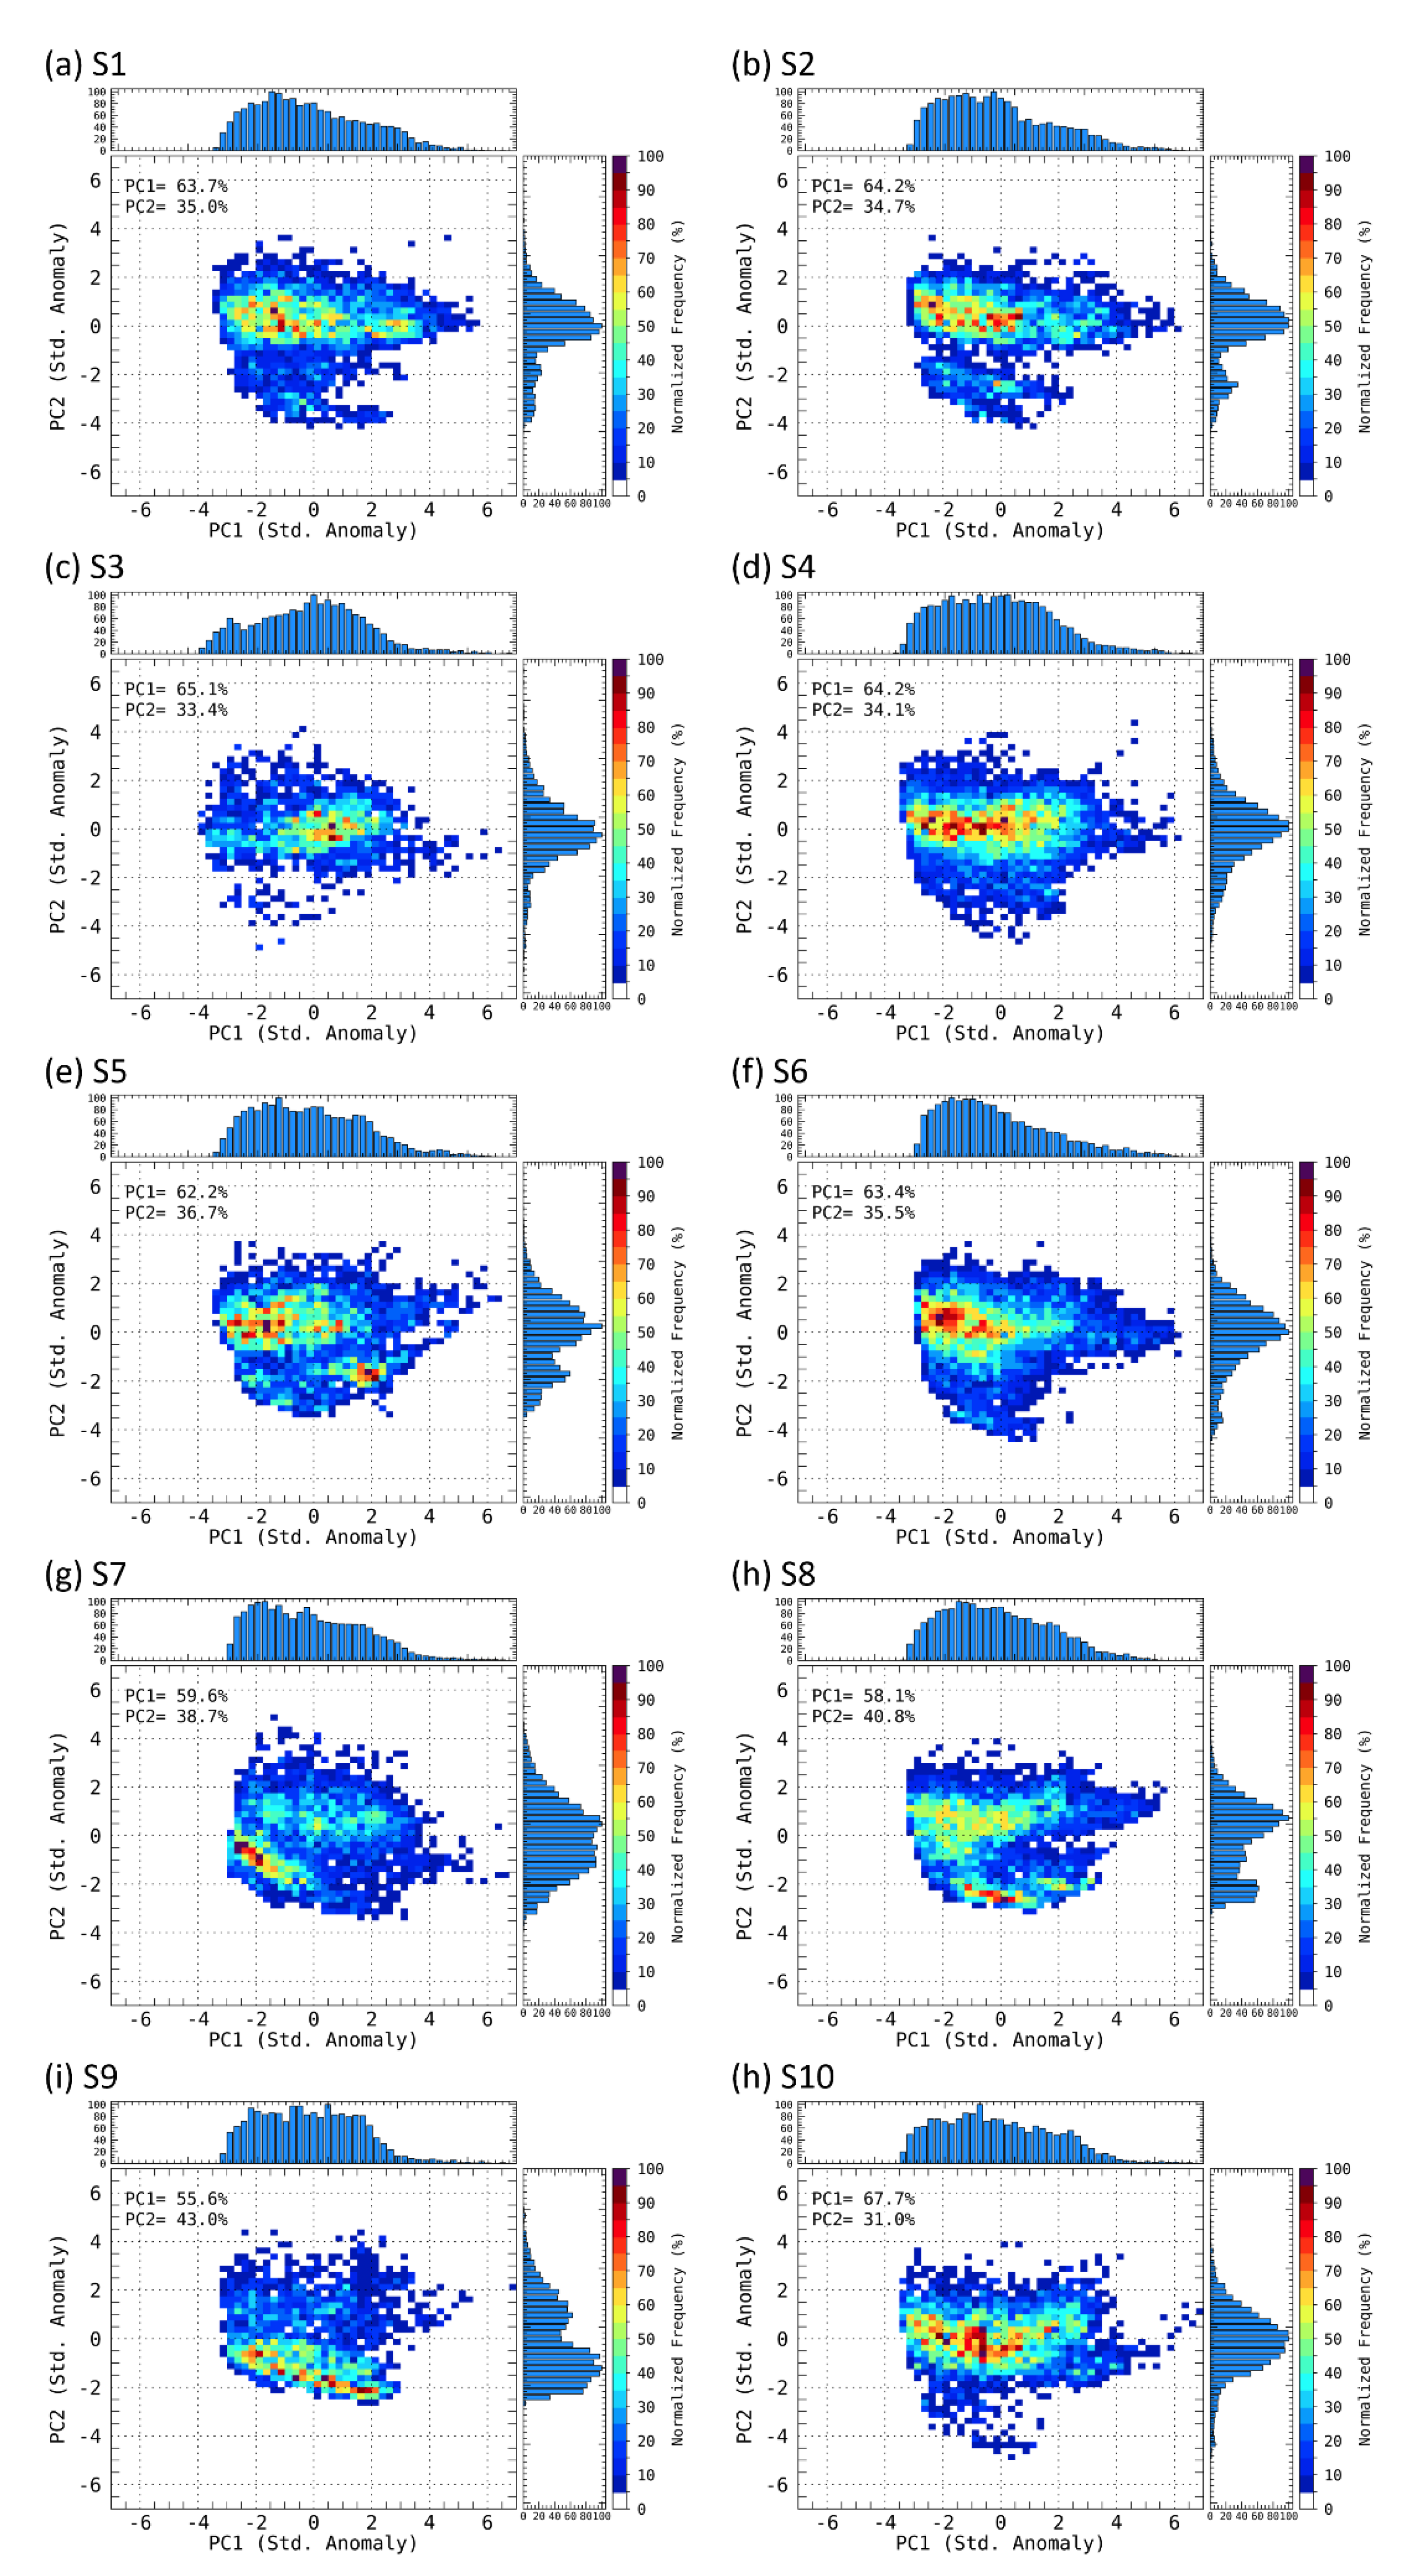
| Site | EOF1 | EOF2 | Total |
|---|---|---|---|
| S1 | 63.7 | 35.0 | 98.7 |
| S2 | 64.2 | 34.7 | 98.9 |
| S3 | 65.1 | 33.4 | 98.5 |
| S4 | 64.2 | 34.1 | 98.3 |
| S5 | 62.2 | 36.7 | 98.9 |
| S6 | 63.4 | 35.5 | 98.9 |
| S7 | 59.6 | 38.7 | 98.3 |
| S8 | 58.1 | 40.8 | 98.9 |
| S9 | 55.6 | 43.0 | 98.6 |
| S10 | 67.7 | 31.0 | 98.7 |
Publisher’s Note: MDPI stays neutral with regard to jurisdictional claims in published maps and institutional affiliations. |
© 2022 by the authors. Licensee MDPI, Basel, Switzerland. This article is an open access article distributed under the terms and conditions of the Creative Commons Attribution (CC BY) license (https://creativecommons.org/licenses/by/4.0/).
Share and Cite
Kim, H.-J.; Jung, W.; Suh, S.-H.; Lee, D.-I.; You, C.-H. The Characteristics of Raindrop Size Distribution at Windward and Leeward Side over Mountain Area. Remote Sens. 2022, 14, 2419. https://doi.org/10.3390/rs14102419
Kim H-J, Jung W, Suh S-H, Lee D-I, You C-H. The Characteristics of Raindrop Size Distribution at Windward and Leeward Side over Mountain Area. Remote Sensing. 2022; 14(10):2419. https://doi.org/10.3390/rs14102419
Chicago/Turabian StyleKim, Hyeon-Joon, Woonseon Jung, Sung-Ho Suh, Dong-In Lee, and Cheol-Hwan You. 2022. "The Characteristics of Raindrop Size Distribution at Windward and Leeward Side over Mountain Area" Remote Sensing 14, no. 10: 2419. https://doi.org/10.3390/rs14102419
APA StyleKim, H.-J., Jung, W., Suh, S.-H., Lee, D.-I., & You, C.-H. (2022). The Characteristics of Raindrop Size Distribution at Windward and Leeward Side over Mountain Area. Remote Sensing, 14(10), 2419. https://doi.org/10.3390/rs14102419