Combined Assimilation of Doppler Wind Lidar and Tail Doppler Radar Data over a Hurricane Inner Core for Improved Hurricane Prediction with the NCEP Regional HWRF System
Abstract
1. Introduction
2. Materials and Methods
2.1. HWRF Model and Data Assimilation System
2.2. DWL and TDR Observation Data
3. Results
3.1. Configurations of Data Assimilation Experiments
3.2. Impacts of DWL on Hurricane Analysis and Forecast
3.2.1. Wind Speed vs. Wind Components
3.2.2. The Impact of Data Thinning
3.3. TDR Radial Wind Assimilation: Impact of Data Thinning
3.4. Combined Assimilation of DWL Wind Speed and TDR Radial Wind
3.4.1. Initial Data Impact Evaluation
3.4.2. Influence of TDR Data Quality Control
4. Discussions
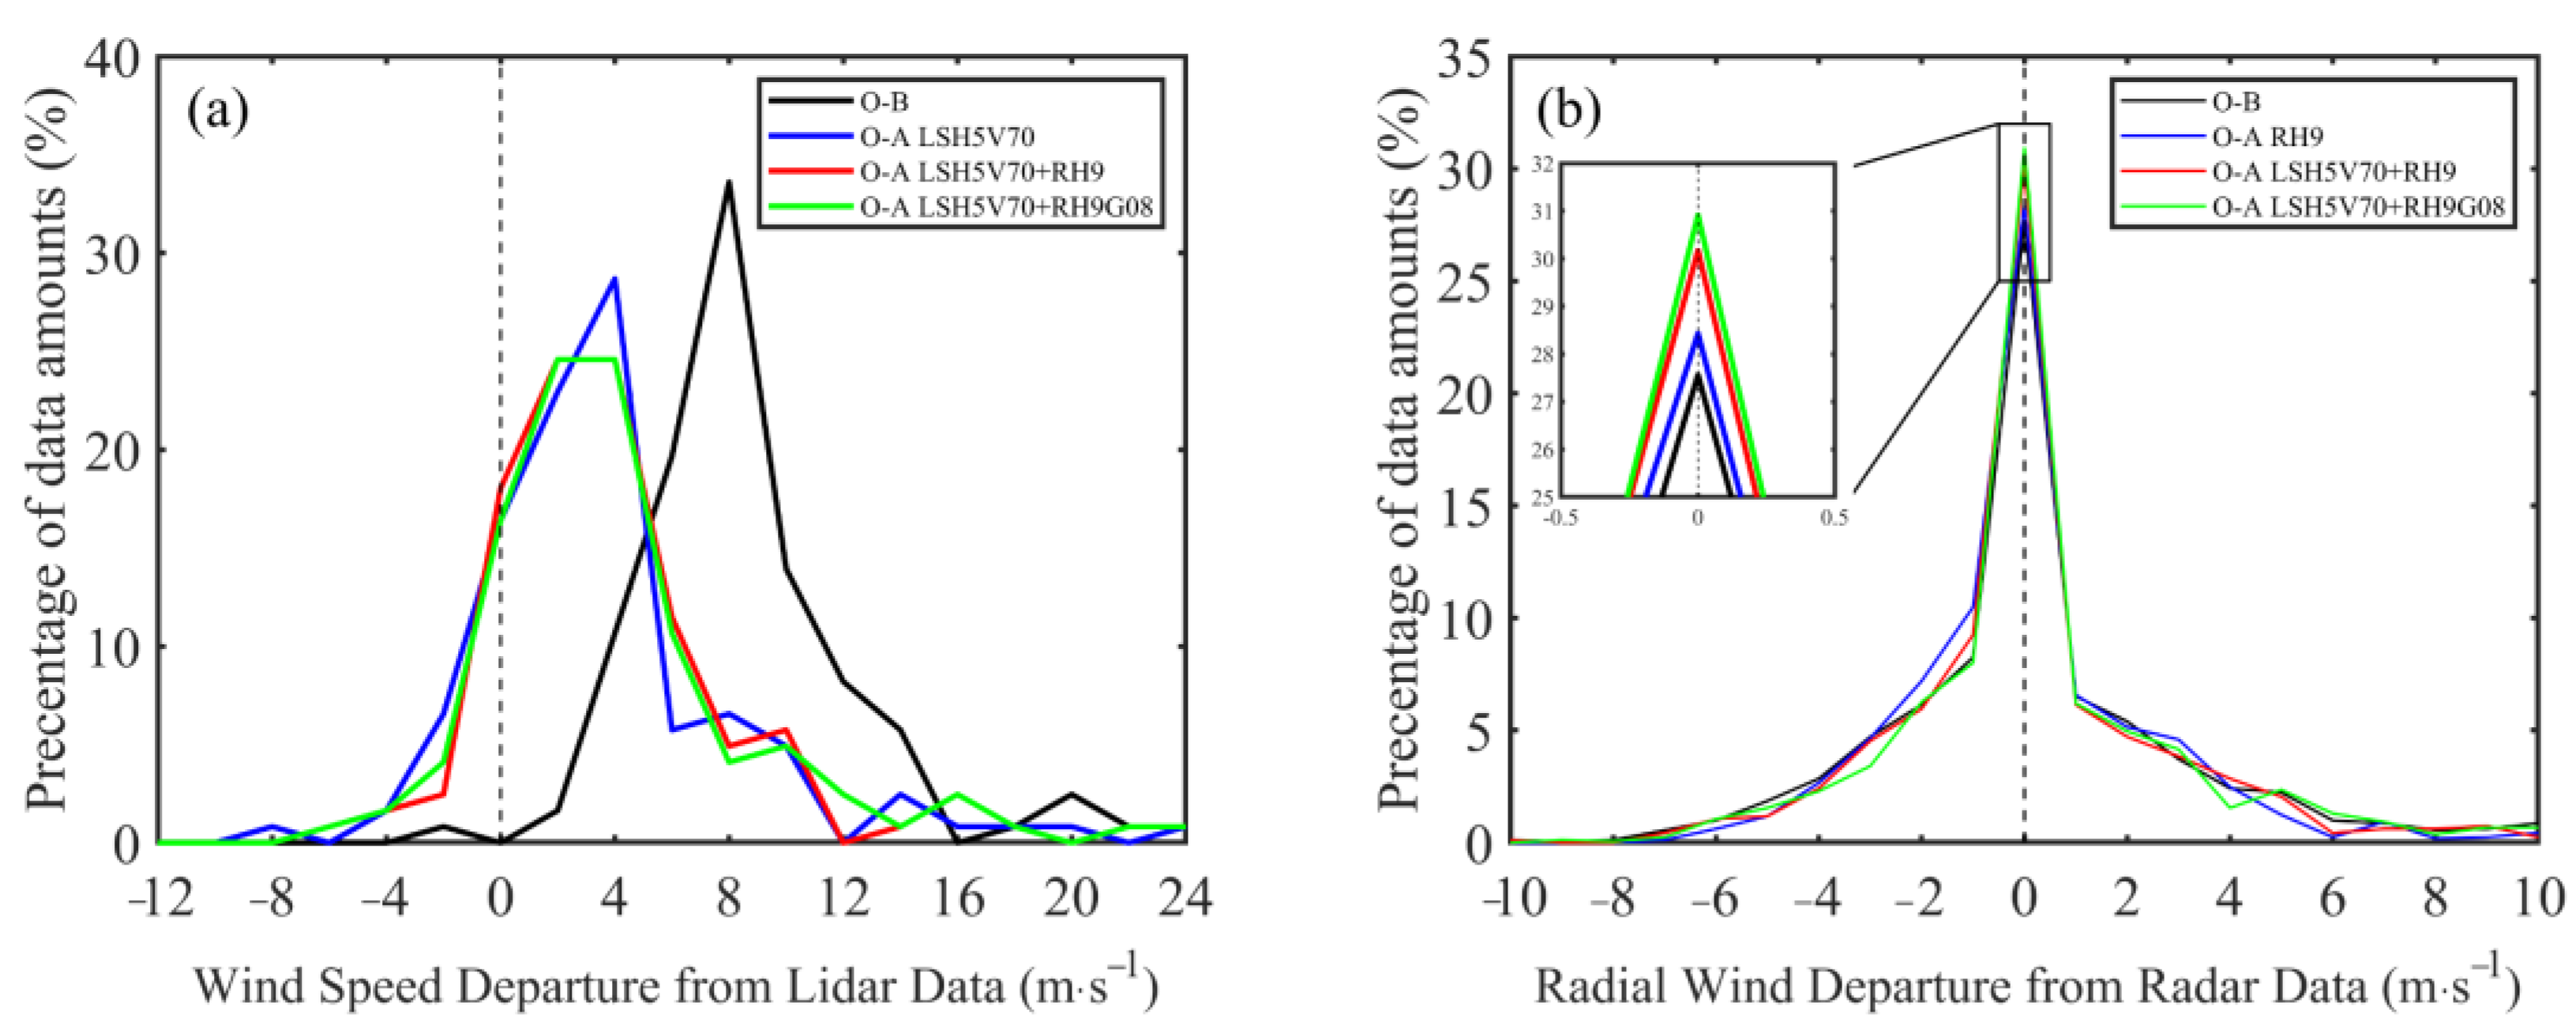
4.1. Distribution of O-B and O-A
4.2. Impact on Hurricane Inner-Core Structure
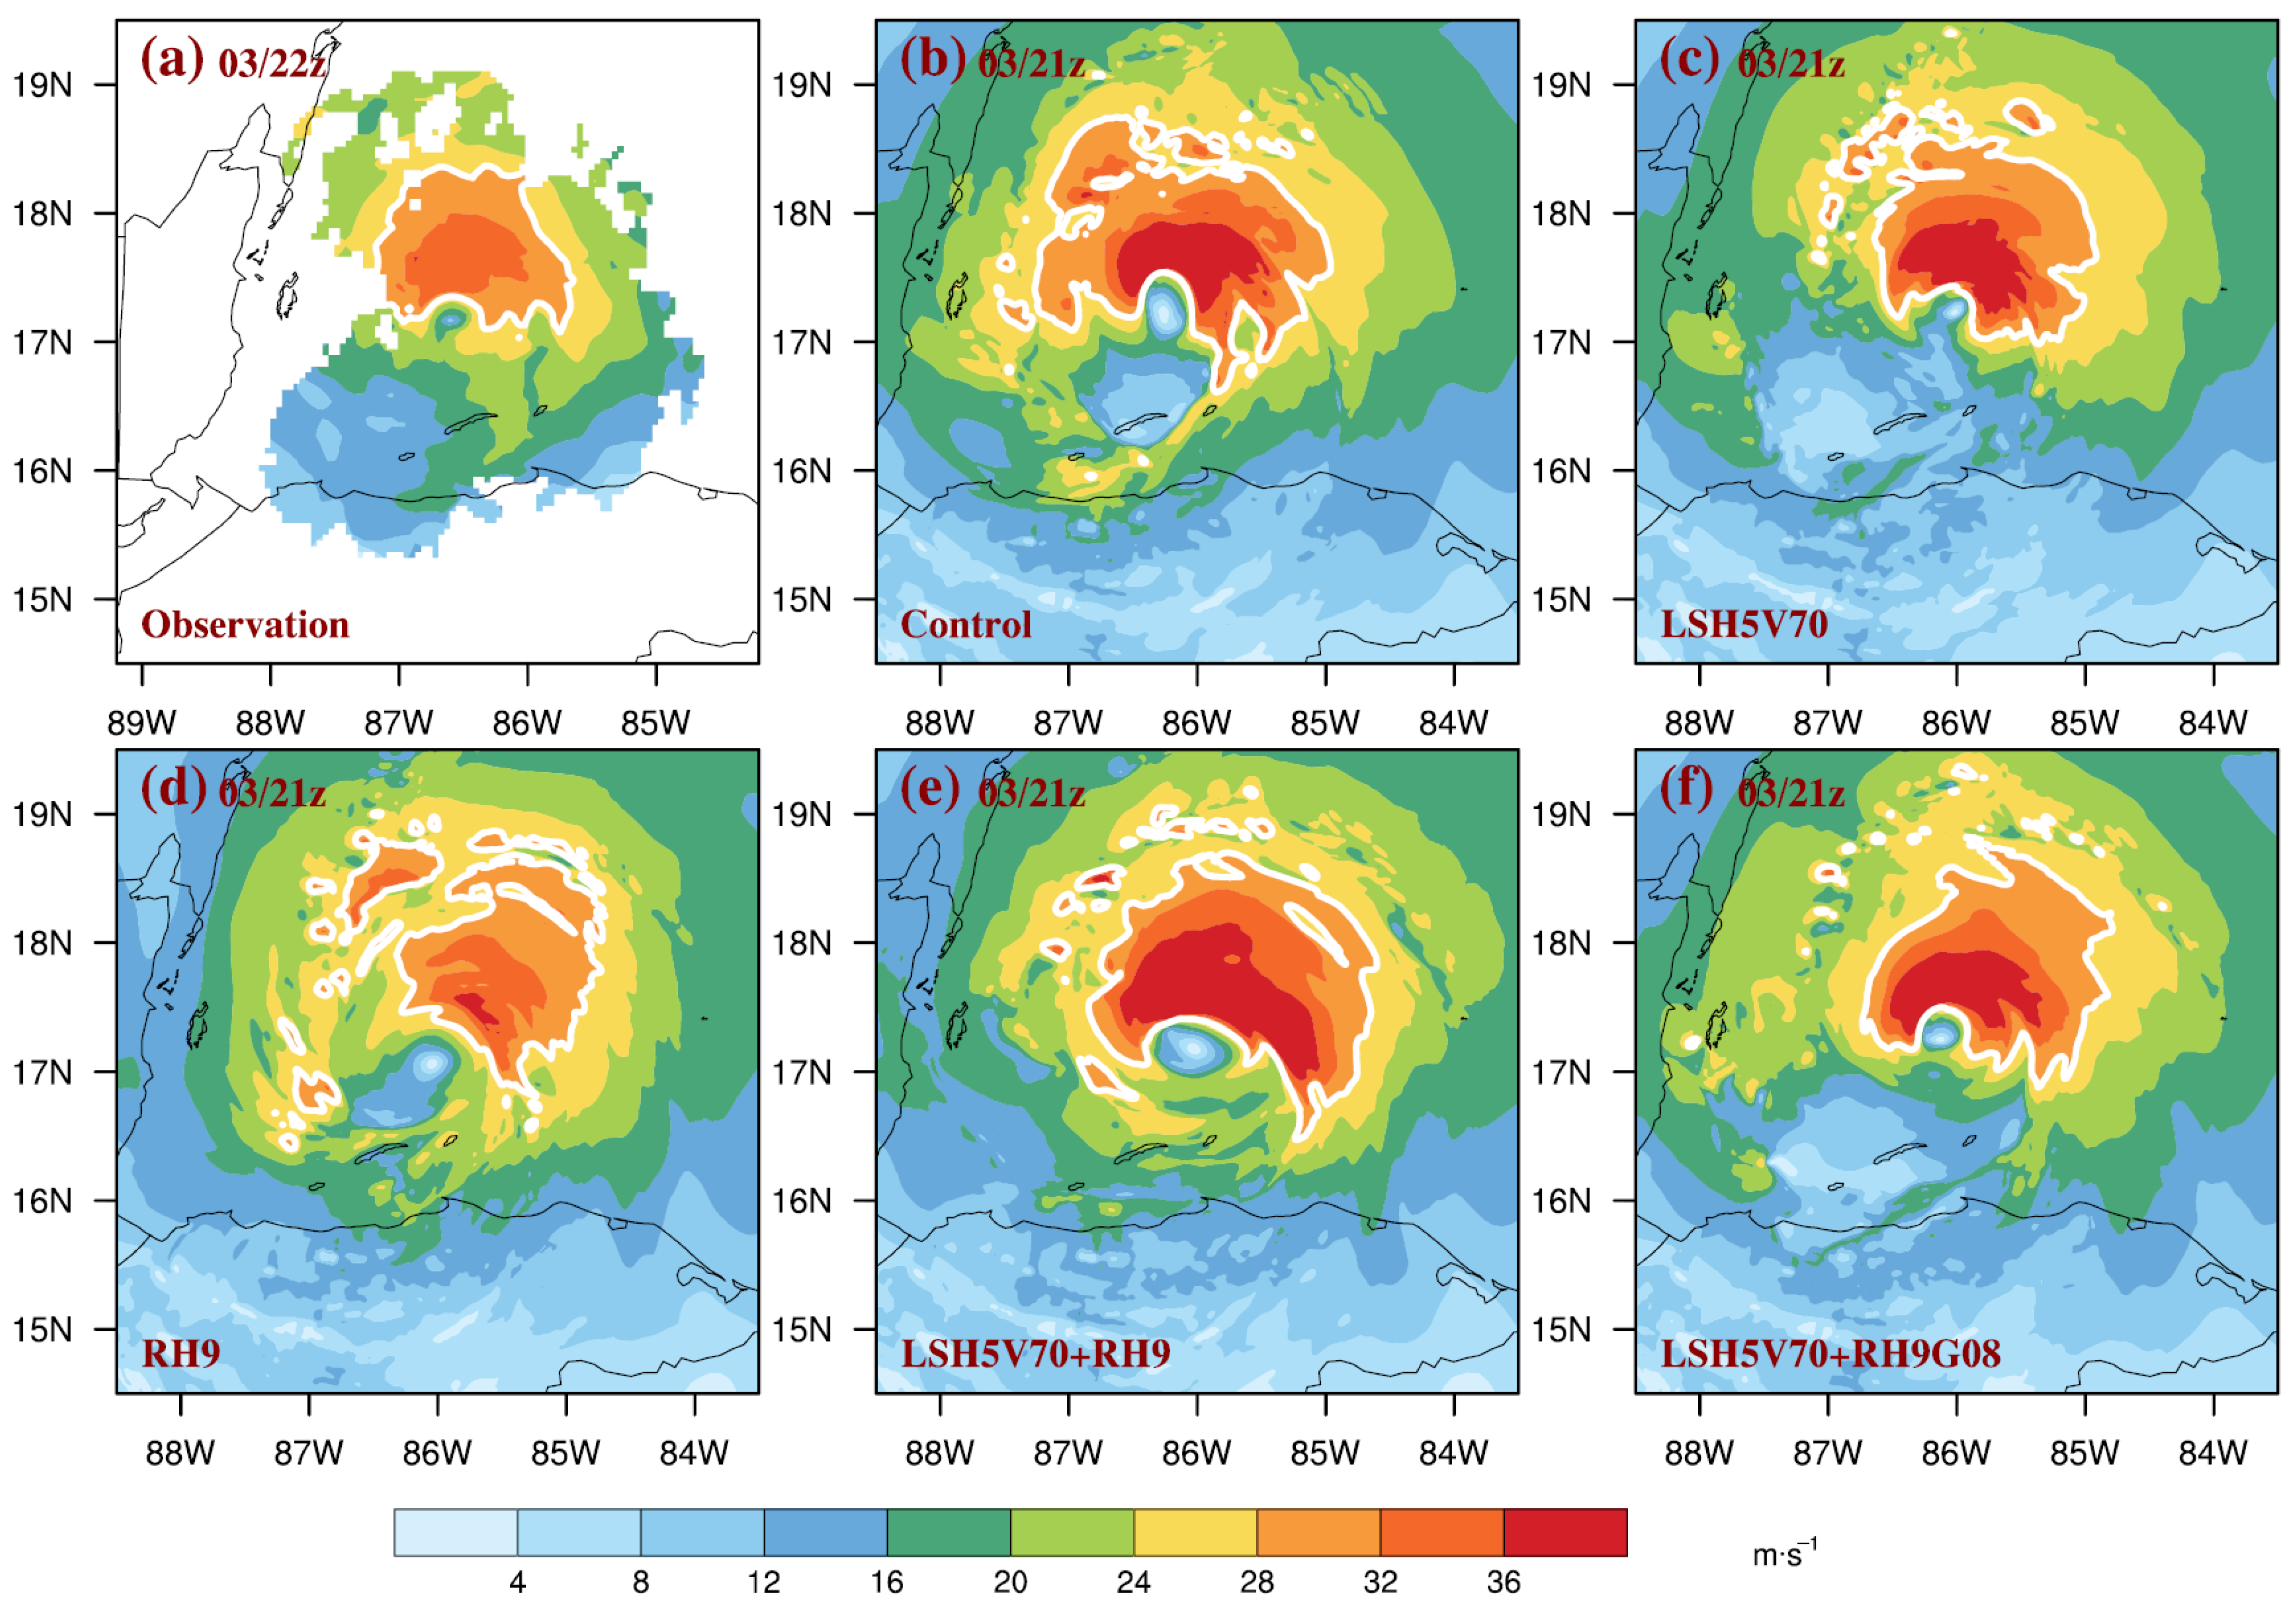
4.2.1. Horizontal Wind Field
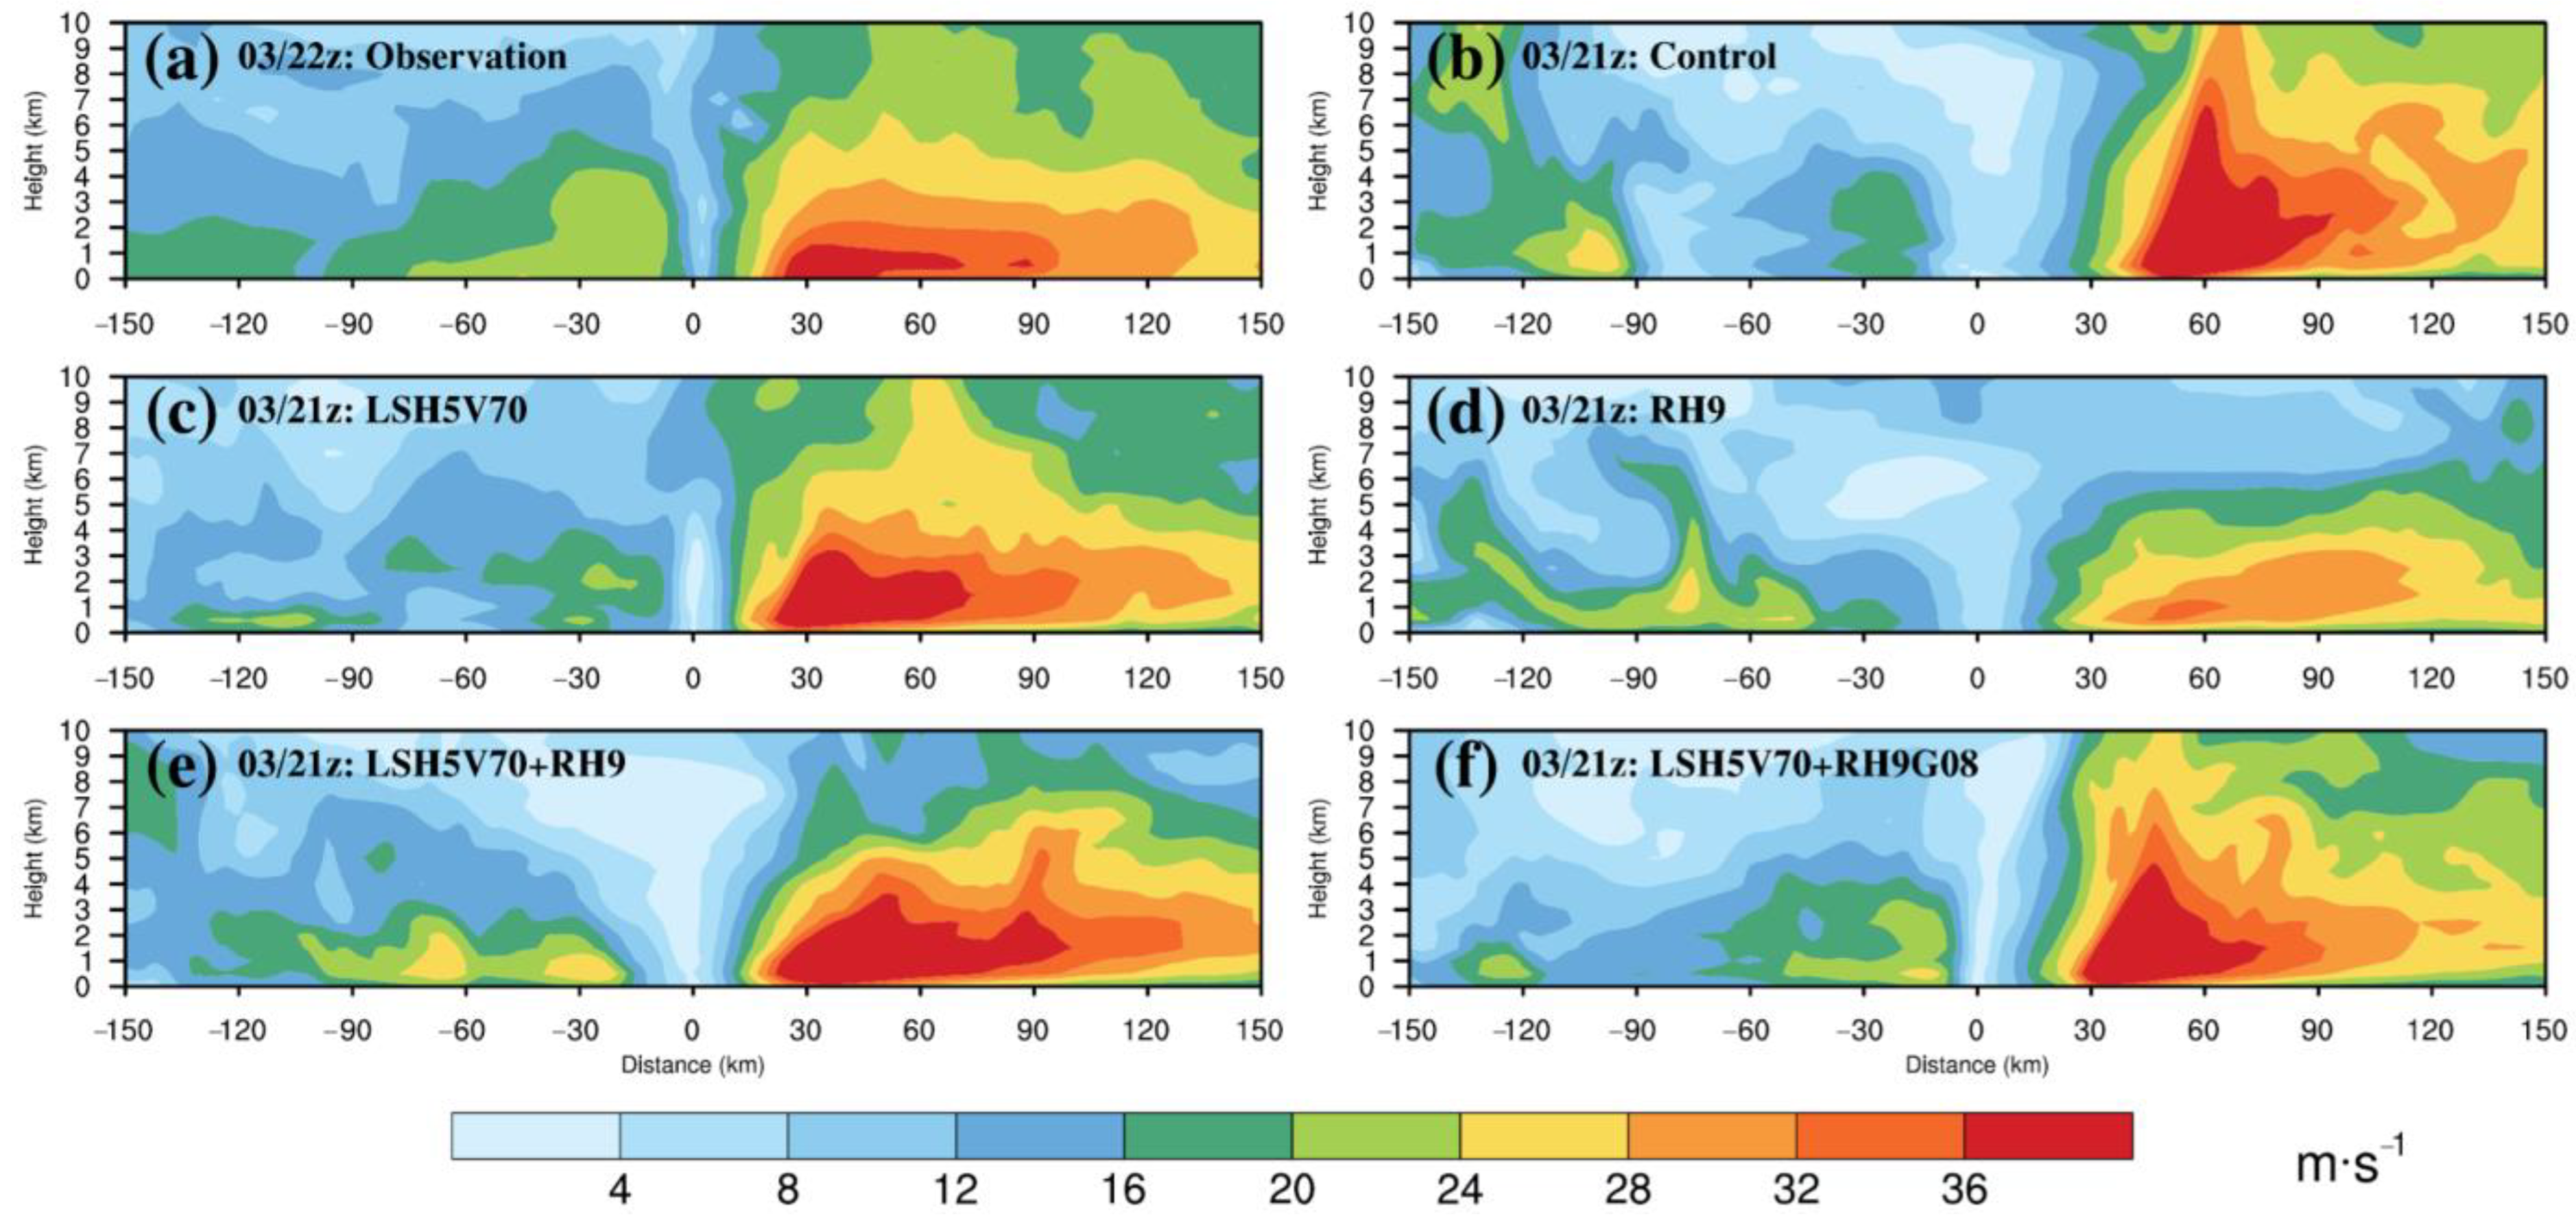
4.2.2. Vertical Wind Profile
5. Conclusions
Author Contributions
Funding
Data Availability Statement
Acknowledgments
Conflicts of Interest
References
- Pielke, R.A., Jr.; Landsea, C.W. Normalized hurricane damages in the United States: 1925–95. Weather Forecast 1998, 13, 621–631. [Google Scholar] [CrossRef]
- Klotzbach, P.J.; Bowen, S.G.; Pielke, R.; Bell, M. Continental US hurricane landfall frequency and associated damage: Observations and future risks. Bull. Am. Meteorol. Soc. 2018, 99, 1359–1376. [Google Scholar] [CrossRef]
- Atlas, R.; Tallapragada, V.; Gopalakrishnan, S.P. Advances in tropical cyclone intensity forecasts. Mar. Technol. Soc. J. 2015, 49, 149–160. [Google Scholar] [CrossRef]
- Tallapragada, V.; Bernardet, L.; Biswas, M.K.; Gopalakrishnan, S.; Kwon, Y.; Liu, Q.; Marchok, T.; Sheinin, D.; Tong, M.; Trahan, S.; et al. Hurricane Weather Research and Forecasting (HWRF) Model: 2013 Scientific Documentation; HWRF Development Testbed Center Tech. Report; Developmental Testbed Center: Boulder, CO, USA, 2014; 99p. [Google Scholar]
- Tallapragada, V.; Kieu, C.; Trahan, S.; Liu, Q.; Wang, W.; Zhang, Z.; Tong, M.; Zhang, B.; Zhu, L.; Strahl, B. Forecasting tropical cyclones in the western North Pacific basin using the NCEP operational HWRF Model: Model upgrades and evaluation of real-time performance in 2013. Weather Forecast 2016, 31, 877–894. [Google Scholar] [CrossRef]
- Gopalakrishnan, S.G.; Goldenberg, S.; Quirino, T.; Zhang, X.; Marks, F., Jr.; Yeh, K.S.; Atlas, R.; Tallapragada, V. Toward improving high-resolution numerical hurricane forecasting: Influence of model horizontal grid resolution, initialization, and physics. Weather Forecast 2012, 27, 647–666. [Google Scholar] [CrossRef]
- Gall, R.; Franklin, J.; Marks, F.; Rappaport, E.N.; Toepfer, F. The hurricane forecast improvement project. Bull. Am. Meteorol. Soc. 2013, 94, 329–343. [Google Scholar] [CrossRef]
- Toepfer, F.; Tolman, H.; Schneider, T.L.; Stajner, I.; Warren, S. The Next Generation Global Prediction System (NGGPS) program update. In Proceedings of the 8th Conference on Transition of Research to Operations, Austin, TX, USA, 7 January 2019. [Google Scholar]
- Liu, Z.; Schwartz, C.S.; Snyder, C.; Ha, S.Y. Impact of assimilating AMSU-A radiances on forecasts of 2008 Atlantic tropical cyclones initialized with a limited-area ensemble Kalman filter. Mon. Weather Rev. 2012, 140, 4017–4034. [Google Scholar] [CrossRef]
- Zou, X.; Weng, F.; Zhang, B.; Lin, L.; Qin, Z.; Tallapragada, V. Impacts of assimilation of ATMS data in HWRF on track and intensity forecasts of 2012 four landfall hurricanes. J. Geophys. Res. Atmos. 2013, 118, 11558–11576. [Google Scholar] [CrossRef]
- Yang, C.; Liu, Z.; Bresch, J.; Rizvi, S.R.H.; Huang, X.Y.; Min, J. AMSR2 all-sky radiance assimilation and its impact on the analysis and forecast of Hurricane Sandy with a limited-area data assimilation system. Tellus 2016, 68, 30917. [Google Scholar] [CrossRef]
- Xu, D.; Min, J.; Shen, F.; Ban, J.; Chen, P. Assimilation of MWHS radiance data from the FY-3B satellite with the WRF Hybrid-3DVAR system for the forecasting of binary typhoons. J. Adv. Model. Earth Syst. 2016, 8, 1014–1028. [Google Scholar] [CrossRef]
- Pu, Z.; Li, X.; Sun, J. Impact of airborne Doppler radar data assimilation on the numerical simulation of intensity changes of Hurricane Dennis near a landfall. J. Atmos. Sci. 2009, 66, 3351–3365. [Google Scholar] [CrossRef]
- Wang, Y.; Pu, Z. Assimilation of Radial Velocity from Coastal NEXRAD into HWRF for Improved Forecasts of Landfalling Hurricanes. Weather Forecast. 2021, 36, 587–599. [Google Scholar] [CrossRef]
- Zhang, F.; Weng, Y.; Gamache, J.F.; Marks, F.D. Performance of convection-permitting hurricane initialization and prediction during 2008–2010 with ensemble data assimilation of inner-core airborne Doppler radar observations. Geophys. Res. Lett. 2011, 38, L15810. [Google Scholar] [CrossRef]
- Pu, Z.; Zhang, S.; Tong, M.; Tallapragada, V. Influence of the self-consistent regional ensemble background error covariance on hurricane inner-core data assimilation with the GSI-based hybrid system for HWRF. J. Atmos. Sci. 2016, 73, 4911–4925. [Google Scholar] [CrossRef]
- Zhang, J.A.; Atlas, R.; Emmitt, G.D.; Bucci, L.; Ryan, K. Airborne Doppler wind lidar observations of the tropical cyclone boundary layer. Remote Sens. 2018, 10, 825. [Google Scholar] [CrossRef]
- Pu, Z.; Zhang, L.; Emmitt, G.D. Impact of airborne Doppler wind lidar profiles on numerical simulations of a tropical cyclone. Geophys. Res. Lett. 2010, 37, L05801. [Google Scholar] [CrossRef]
- Zhang, L.; Pu, Z. Four-dimensional Assimilation of Multi-time Wind Profiles Over a Single Station and Numerical Simulation of a Mesoscale Convective System Observed During IHOP_2002. Mon. Weather Rev. 2011, 139, 3369–3388. [Google Scholar] [CrossRef][Green Version]
- Pu, Z.; Zhang, L.; Zhang, S.; Gentry, B.; Emmitt, D.; Demoz, B.; Atlas, R. The impact of Doppler wind lidar measurements on high-impact weather forecasting: Regional OSSE and data assimilation studies. In Data Assimilation for Atmospheric, Oceanic and Hydrologic Applications (Vol. III); Park, S.K., Xu, L., Eds.; Springer: Cham, Switzerland, 2017; pp. 259–283. [Google Scholar]
- Bucci, L.R.; O’Handley, C.; Emmitt, G.D.; Zhang, J.A.; Ryan, K.; Atlas, R. Validation of an airborne Doppler wind lidar in tropical cyclones. Sensors 2018, 18, 4288. [Google Scholar] [CrossRef]
- Janjic, Z.; Gall, R.; Pyle, M.E. Scientific Documentation for the NMM Solver (No. NCAR/TN-477+STR); National Center for Atmospheric Research University Corporation for Atmospheric Research: Boulder, CO, USA, 2010. [Google Scholar]
- Yablonsky, R.M.; Ginis, I.; Thomas, B.; Tallapragada, V.; Sheinin, D.; Bernardet, L. Description and analysis of the ocean component of NOAA’s operational Hurricane Weather Research and Forecasting Model (HWRF). J. Atmos. Ocean. Technol. 2015, 32, 144–163. [Google Scholar] [CrossRef]
- Kleist, D.T.; Parrish, D.F.; Derber, J.C.; Treadon, R.; Wu, W.S.; Lord, S. Introduction of the GSI into the NCEP global data assimilation system. Weather Forecast. 2009, 24, 1691–1705. [Google Scholar] [CrossRef]
- Ferrier, B.S.; Jin, Y.; Lin, Y.; Black, T.; Rogers, E.; DiMego, G. Implementation of a new grid-scale cloud and precipitation scheme in the NCEP Eta model. In Proceedings of the 19th Conference on Weather Analysis and Forecasting/15th Conference on Numerical Weather Prediction, San Antonio, TX, USA, 11–16 August 2002; Volume 19, pp. 280–283. [Google Scholar]
- Aligo, E.; Ferrier, B.; Carley, J.R. Modified NAM microphysics for forecasts of deep convective storms. Mon. Weather Rev. 2018, 146, 4115–4153. [Google Scholar] [CrossRef]
- Pan, H.L.; Wu, W.S. Implementing a Mass Flux Convection Parameterization Package for the NMC Medium-Range Forecast Model; Office Note 409; National Centers for Environmental Prediction (U.S.): College Park, MD, USA, 1995. [Google Scholar]
- Hong, S.Y.; Pan, H.L. Nonlocal boundary layer vertical diffusion in a medium-range forecast model. Mon. Weather Rev. 1996, 124, 2322–2339. [Google Scholar] [CrossRef]
- Schwarzkopf, M.D.; Fels, S.B. The simplified exchange method revisited: An accurate, rapid method for computation of infrared cooling rates and fluxes. J. Geophys. Res. Atmos. 1991, 96, 9075–9096. [Google Scholar] [CrossRef]
- Lacis, A.A.; Hansen, J. A parameterization for the absorption of solar radiation in the earth’s atmosphere. J. Atmos. Sci. 1974, 31, 118–133. [Google Scholar] [CrossRef]
- Sirutis, J.; Miyakoda, K. Subgrid scale physics in 1-month forecasts. Part I: Experiment with four parameterization packages. Mon. Weather Rev. 1990, 118, 1043–1064. [Google Scholar] [CrossRef]
- Kurihara, Y.; Tuleya, R.E. Structure of a tropical cyclone developed in a three-dimensional numerical simulation model. J. Atmos. Sci. 1974, 31, 893–919. [Google Scholar] [CrossRef]
- Ek, M.B.; Mitchell, K.E.; Lin, Y.; Rogers, E.; Grunmann, P.; Koren, V.; Gayno, G.; Tarpley, J.D. Implementation of Noah land surface model advancements in the National Centers for Environmental Prediction operational mesoscale Eta model. J. Geophys. Res. 2003, 108, 8851. [Google Scholar]
- Gopalakrishnan, S.G.; Marks, F., Jr.; Zhang, J.A.; Zhang, X.; Bao, J.W.; Tallapragada, V. A study of the impacts of vertical diffusion on the structure and intensity of the tropical cyclones using the high-resolution HWRF system. J. Atmos. Sci. 2013, 70, 524–541. [Google Scholar] [CrossRef]
- Wang, W.; Sippel, J.A.; Abarca, S.; Zhu, L.; Liu, B.; Zhang, Z.; Mehra, A.; Tallapragada, V. Improving NCEP HWRF simulations of surface wind and inflow angle in the eyewall area. Weather Forecast 2018, 33, 887–898. [Google Scholar] [CrossRef]
- Zhang, J.A.; Kalina, E.A.; Biswas, M.K.; Rogers, R.F.; Zhu, P.; Marks, F.D. A Review and Evaluation of Planetary Boundary Layer Parameterizations in Hurricane Weather Research and Forecasting Model Using Idealized Simulations and Observations. Atmosphere 2020, 11, 1091. [Google Scholar] [CrossRef]
- Kalina, E.A.; Biswas, M.K.; Zhang, J.A.; Newman, K.M. Sensitivity of an Idealized Tropical Cyclone to the Configuration of the Global Forecast System–Eddy Diffusivity Mass Flux Planetary Boundary Layer Scheme. Atmosphere 2021, 12, 284. [Google Scholar] [CrossRef]
- Biswas, M.K.; Abarca, S.; Bernardet, L.; Ginis, I.; Grell, E.; Iacono, M.; Kalina, E.; Liu, B.; Liu, Q.; Marchok, T.; et al. Hurricane Weather Research and Forecasting (HWRF) Model: 2018 Scientific Documentation; HWRF Developmental Testbed Center: Boulder, CO, USA, 2014. [Google Scholar]
- Dando, M.L.; Thorpe, A.J.; Eyre, J.R. The optimal density of atmospheric sounder observations in the Met Office NWP system. Q. J. R. Meteorol. Soc. 2007, 133, 1933–1943. [Google Scholar] [CrossRef]
- Reale, O.; McGrath-Spangler, E.L.; McCarty, W.; Holdaway, D.; Gelaro, R. Impact of Adaptively Thinned AIRS Cloud-Cleared Radiances on Tropical Cyclone Representation in a Global Data Assimilation and Forecast System. Weather Forecast 2018, 33, 909–931. [Google Scholar] [CrossRef] [PubMed]
- Hoffman, R.N. The Effect of Thinning and Superobservations in a Simple One-Dimensional Data Analysis with Mischaracterized Error. Mon. Weather Rev. 2018, 146, 1181–1195. [Google Scholar] [CrossRef]
- Pu, Z.X.; Kalnay, E.; Sela, J.; Szunyogh, I. Sensitivity of forecast errors to initial conditions with a quasi-inverse linear method. Mon. Weather Rev. 1997, 125, 2479–2503. [Google Scholar] [CrossRef]
- Rabier, F.; Klinker, E.; Courtier, P.; Hollingsworth, A. Sensitivity of forecast errors to initial conditions. Q. J. R. Meteorol. Soc. 1996, 122, 121–150. [Google Scholar] [CrossRef]
- Zhang, S.; Pu, Z. Numerical simulation of rapid weakening of Hurricane Joaquin with assimilation of high-definition sounding system dropsondes during the tropical cyclone intensity experiment: Comparison of 3DEnVar and 4DEnVar. Weather Forecast 2019, 34, 521–538. [Google Scholar] [CrossRef]
- Cui, Z.; Pu, Z.; Tallapragada, V.; Atlas, R.; Ruf, C. A Preliminary Impact Study of CYGNSS Ocean Surface Wind Speeds on Numerical Simulations of Hurricanes. Geophys. Res. Lett. 2019, 46, 2984–2992. [Google Scholar] [CrossRef]
- Kumar, N.; Voulgaris, G.; Warner, J.C.; Olabarrieta, M. Implementation of the vortex force formalism in the coupled ocean-atmosphere-wave-sediment transport (COAWST) modeling system for inner shelf and surf zone applications. Ocean Model. 2012, 47, 65–95. [Google Scholar] [CrossRef]
- Zambon, J.B.; He, R.; Warner, J.C. Investigation of hurricane Ivan using the coupled ocean–atmosphere–wave–sediment transport (COAWST) model. Ocean Dynam. 2014, 64, 1535–1554. [Google Scholar] [CrossRef]
- Ricchi, A.; Miglietta, M.M.; Bonaldo, D.; Cioni, G.; Rizza, U.; Carniel, S. Multi-physics ensemble versus atmosphere–ocean coupled model simulations for a tropical-like cyclone in the Mediterranean Sea. Atmosphere 2019, 10, 202. [Google Scholar] [CrossRef]
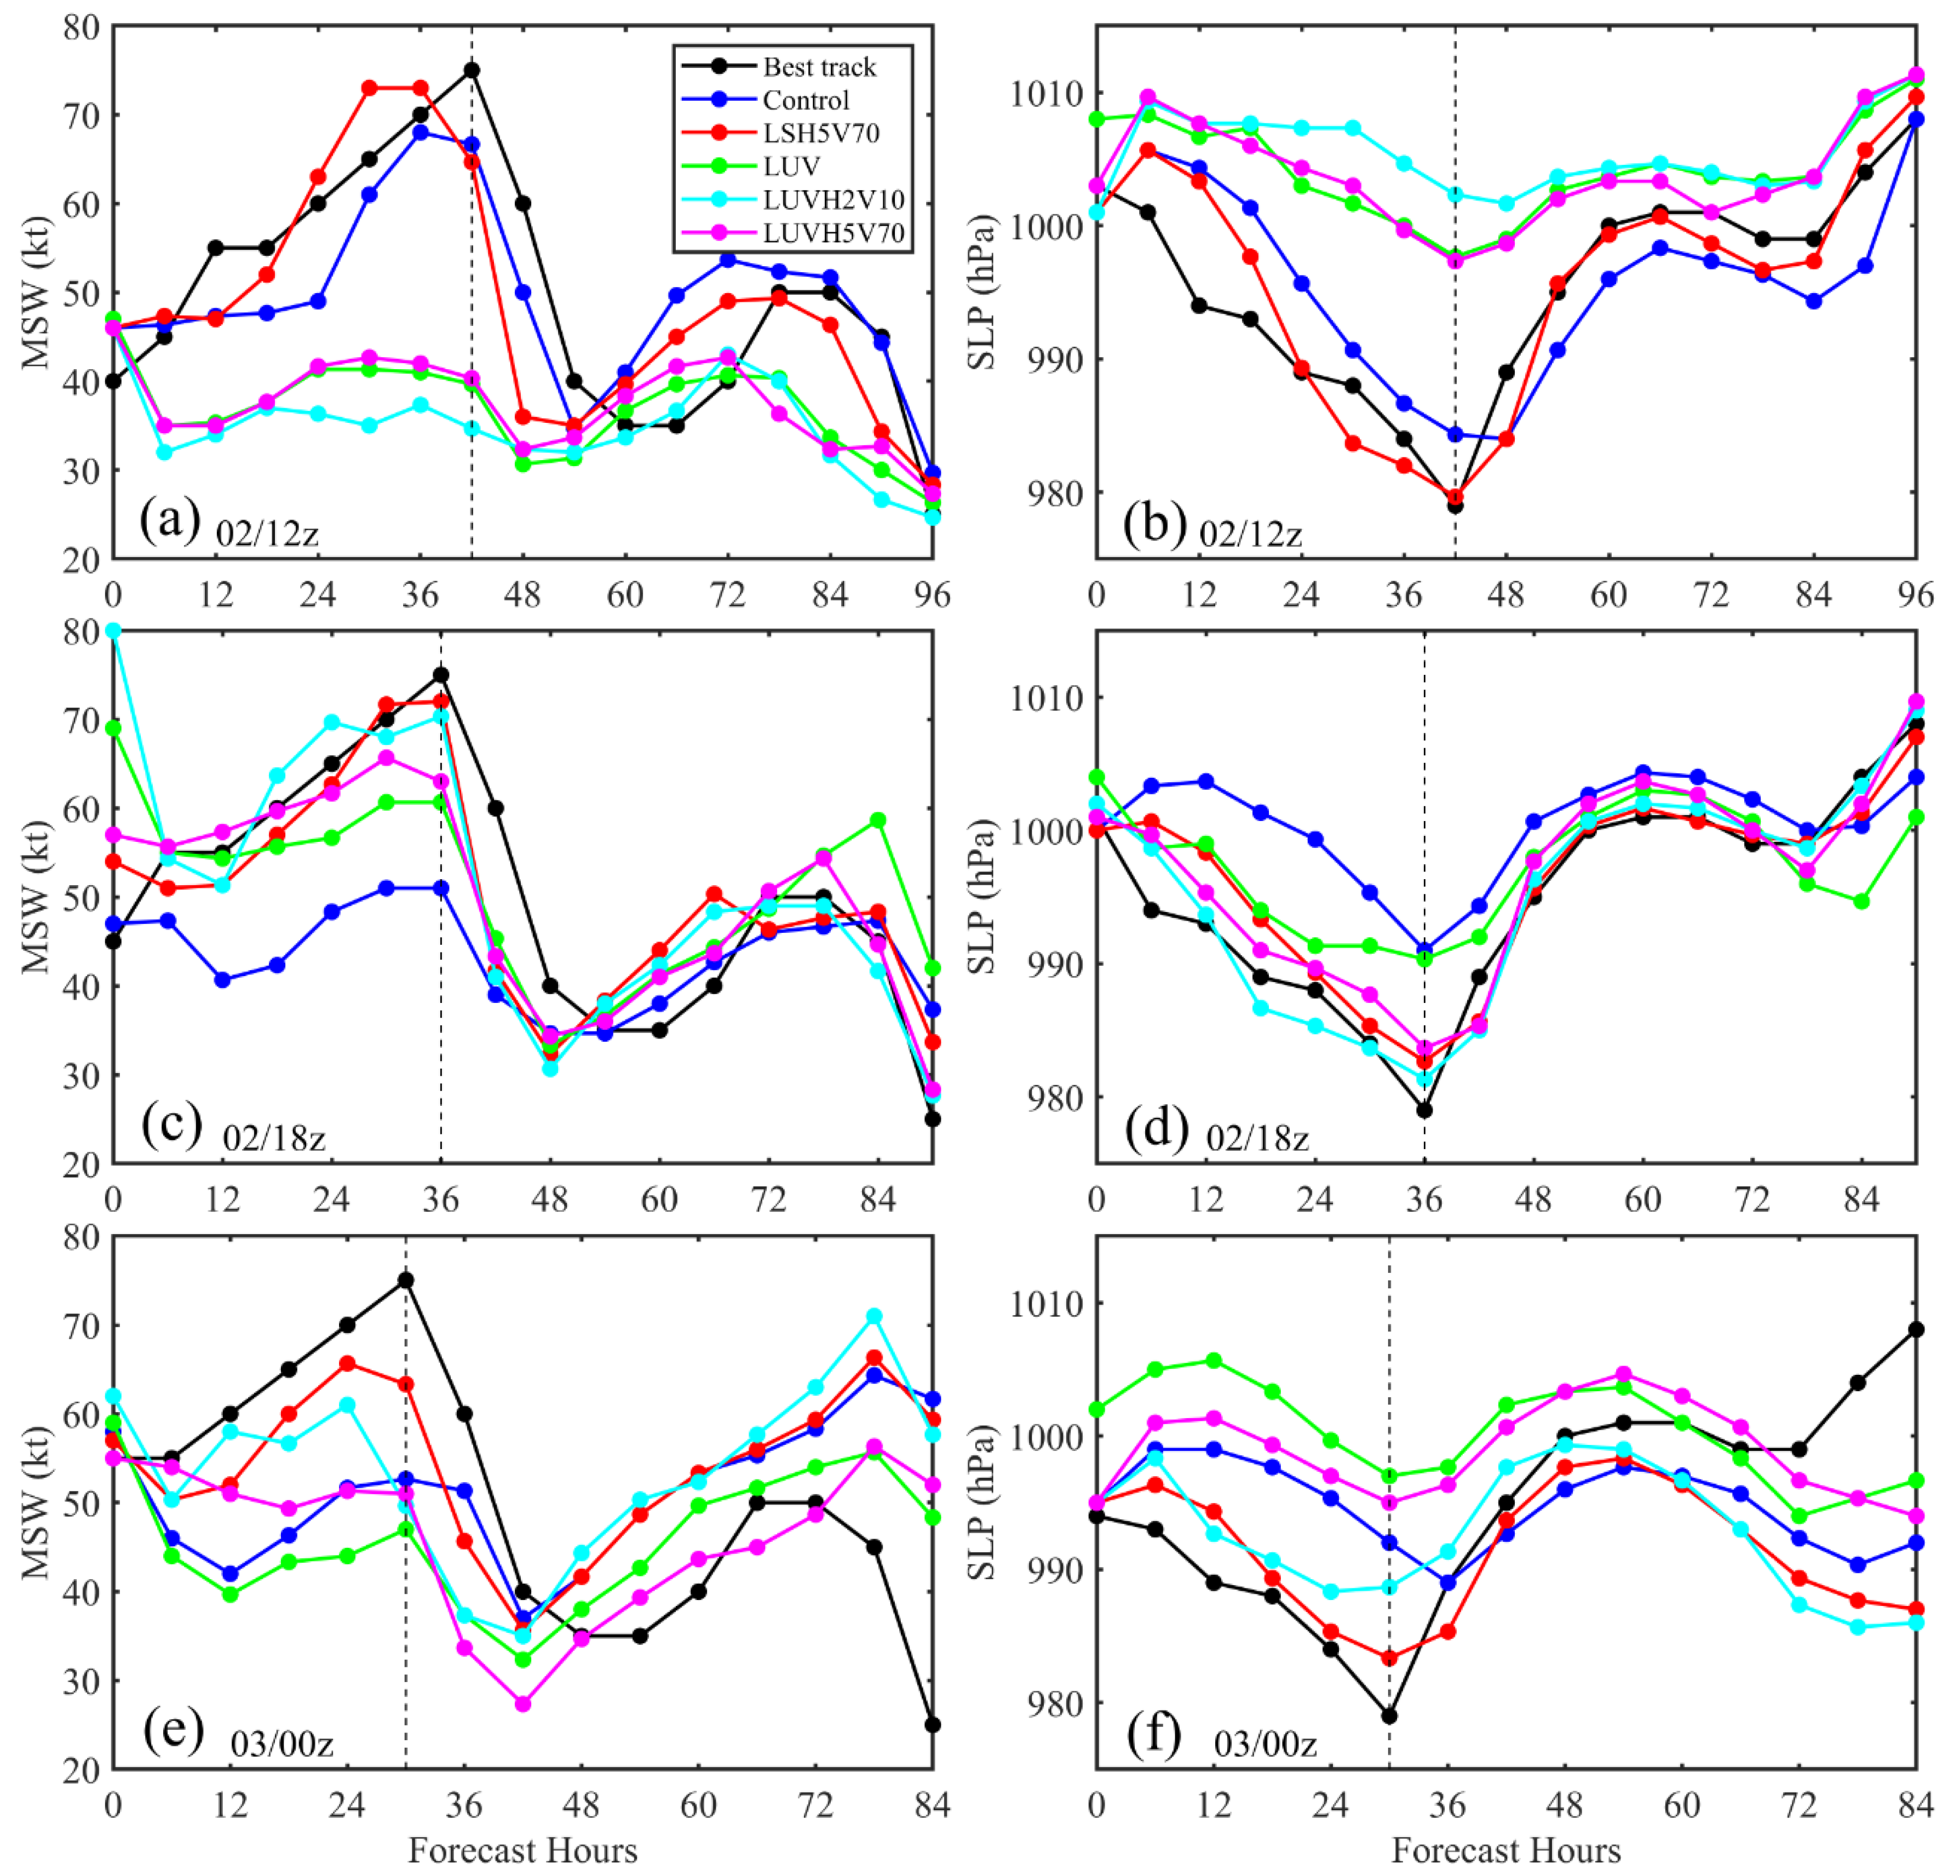
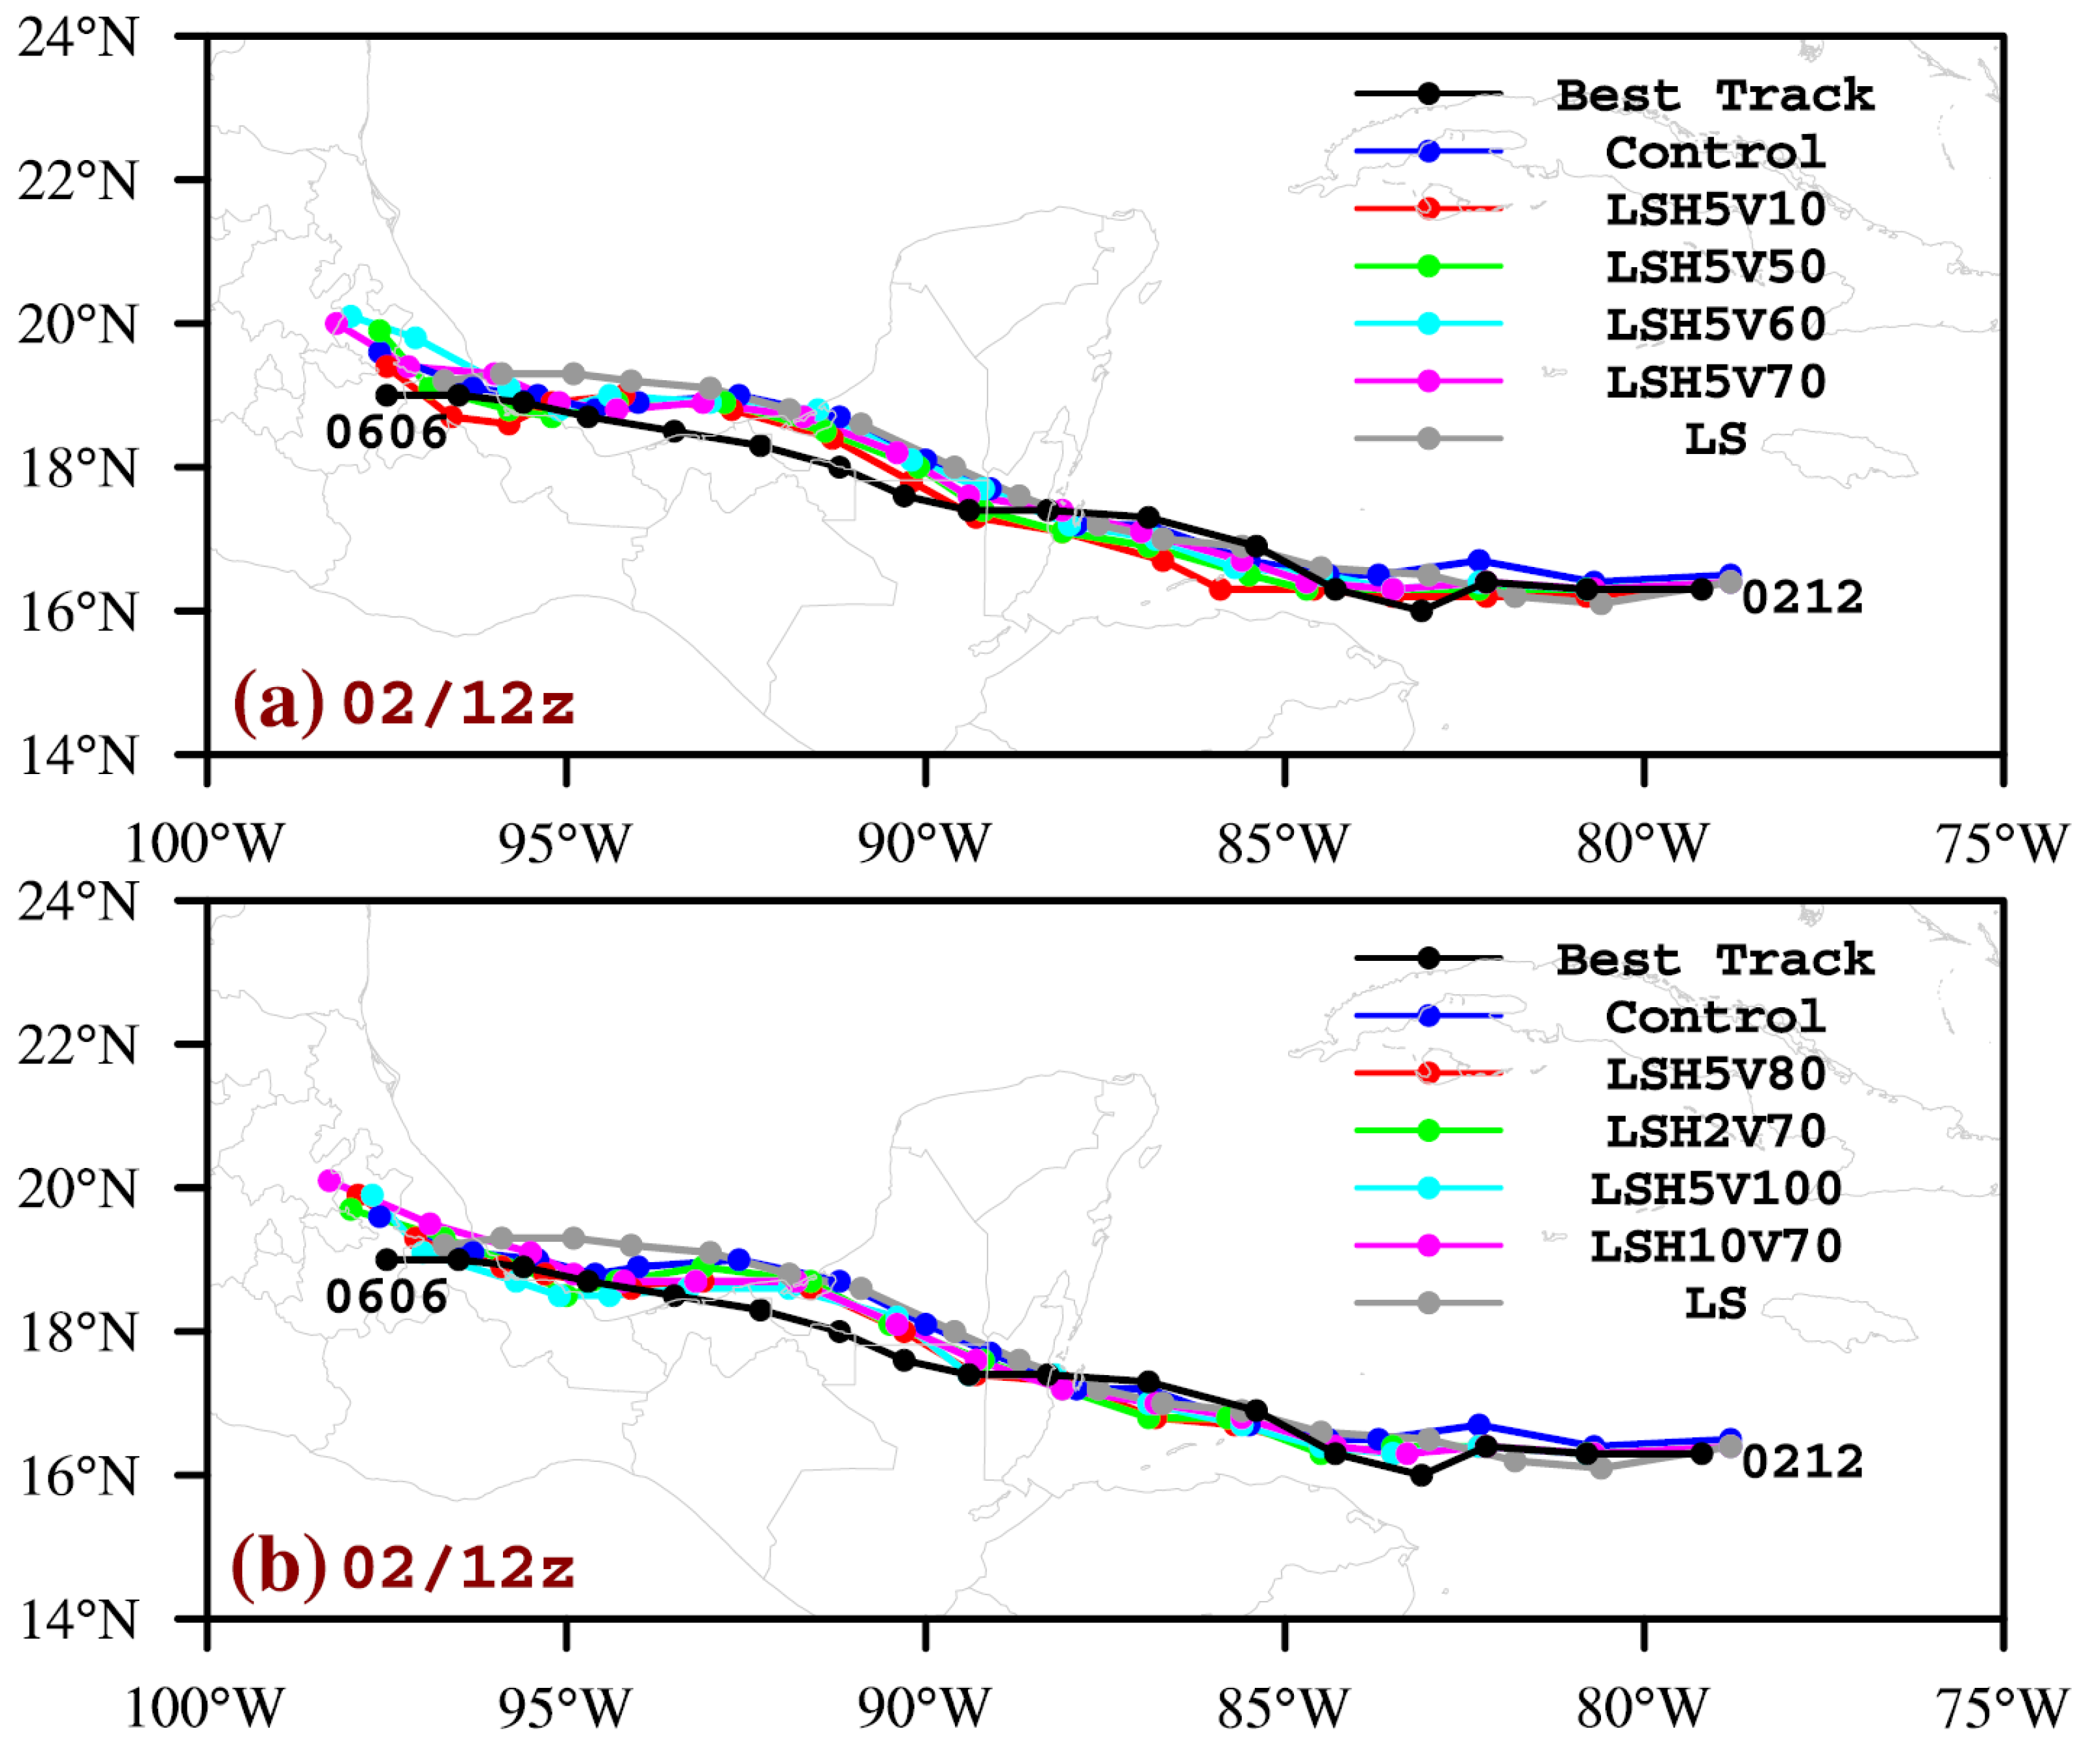
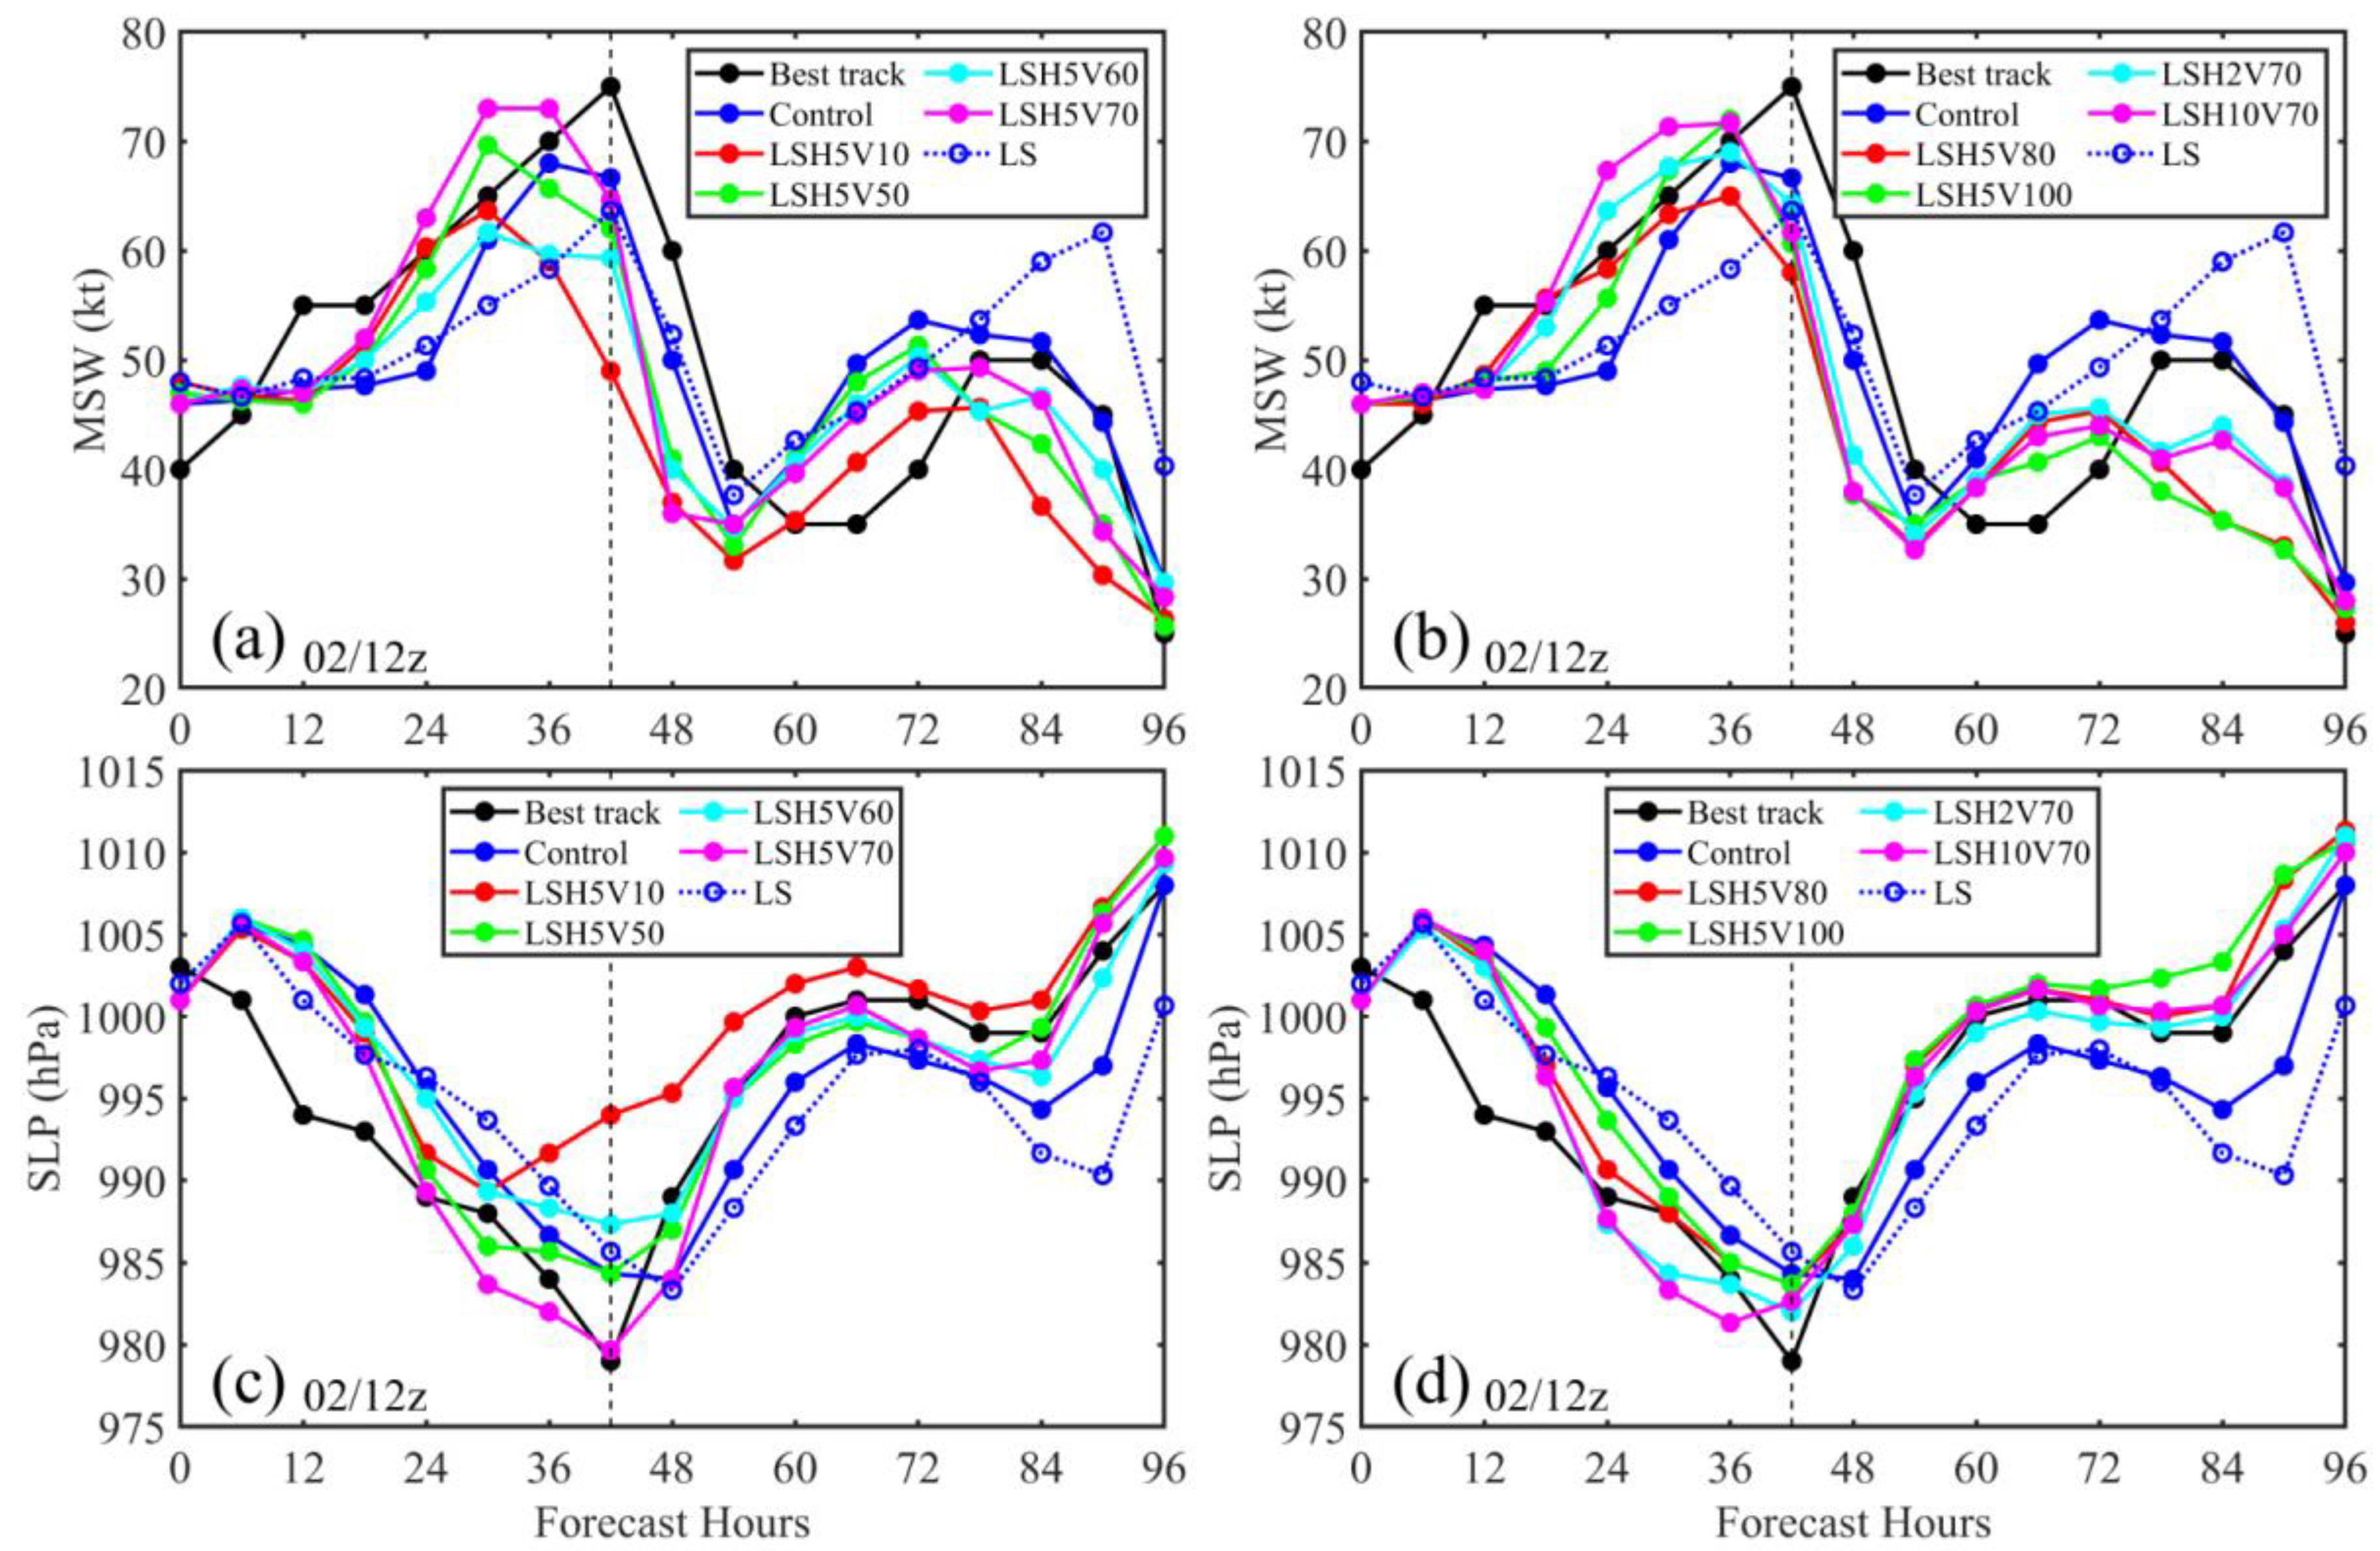
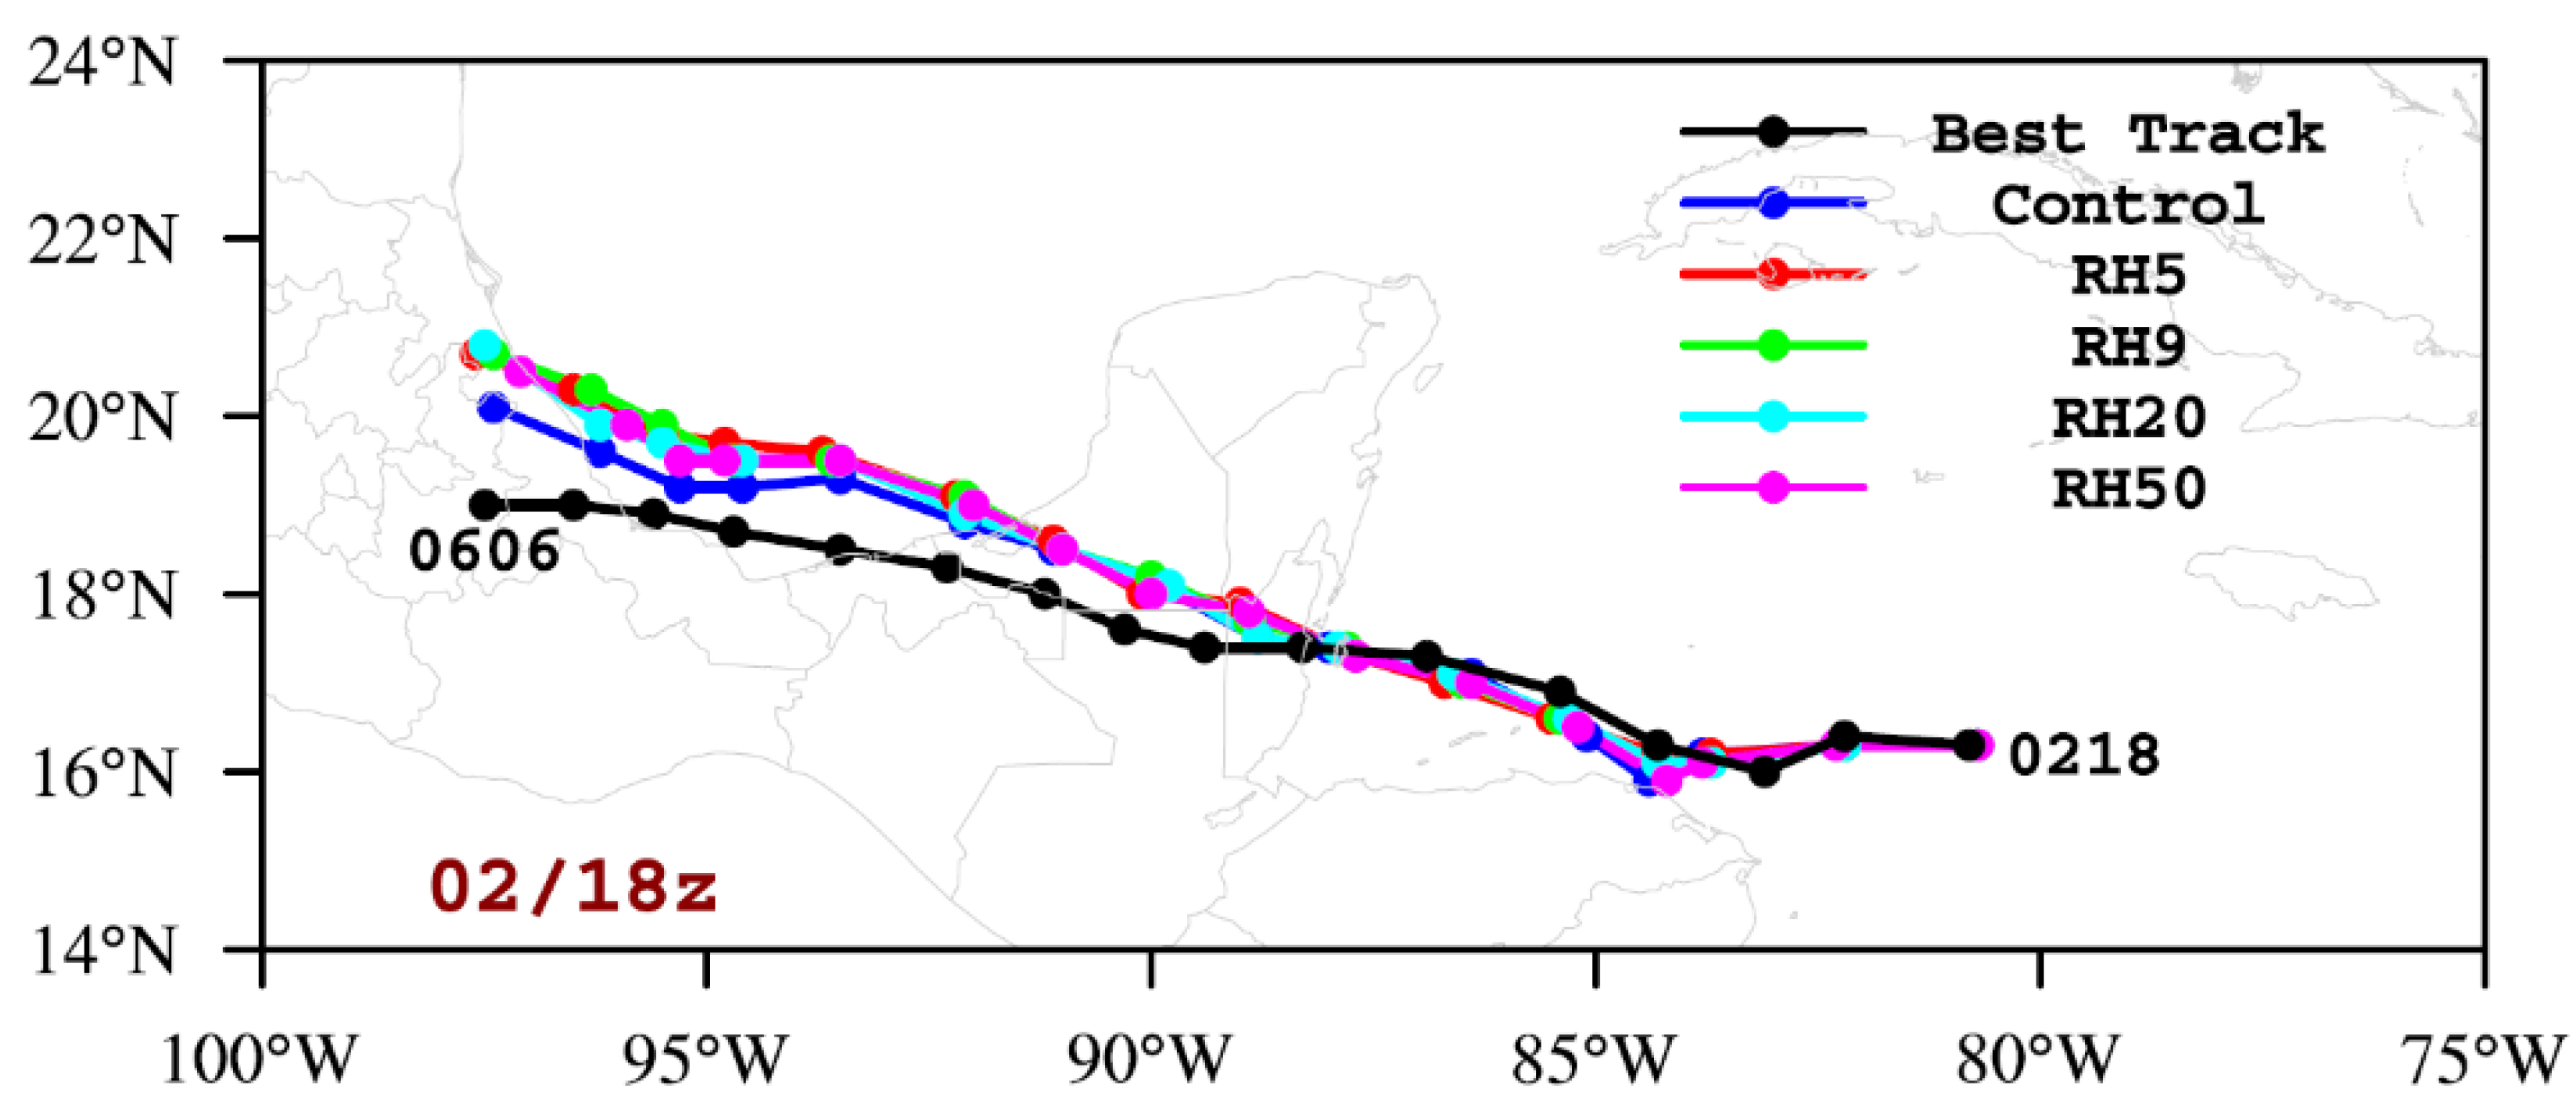
| Experiments | DWL | ADP | TDR | ||||||
|---|---|---|---|---|---|---|---|---|---|
| u | v | Wind Speed | Horizontal Thinning Distance | Vertical Thinning Distance | Radial Wind | Horizontal Thinning | Gross Error | ||
| Control | X | ||||||||
| LUV | X | X | X | ||||||
| LUVH2V10 | X | X | 2 km | 10 hPa | X | ||||
| LUVH5V70 | X | X | 5 km | 70 hPa | X | ||||
| LSH5V10 | X | 5 km | 10 hPa | X | |||||
| LSH5V50 | X | 5 km | 50 hPa | X | |||||
| LSH5V60 | X | 5 km | 60 hPa | X | |||||
| LSH5V70 | X | 5 km | 70 hPa | X | |||||
| LSH5V80 | X | 5 km | 80 hPa | X | |||||
| LSH5V100 | X | 5 km | 100 hPa | X | |||||
| LSH2V70 | X | 2 km | 70 hPa | X | |||||
| LSH10V70 | X | 10 km | 70 hPa | X | |||||
| RH5 | X | X | 5 km | 2.0 | |||||
| RH9 | X | X | 9 km | 2.0 | |||||
| RH20 | X | X | 20 km | 2.0 | |||||
| RH50 | X | X | 50 km | 2.0 | |||||
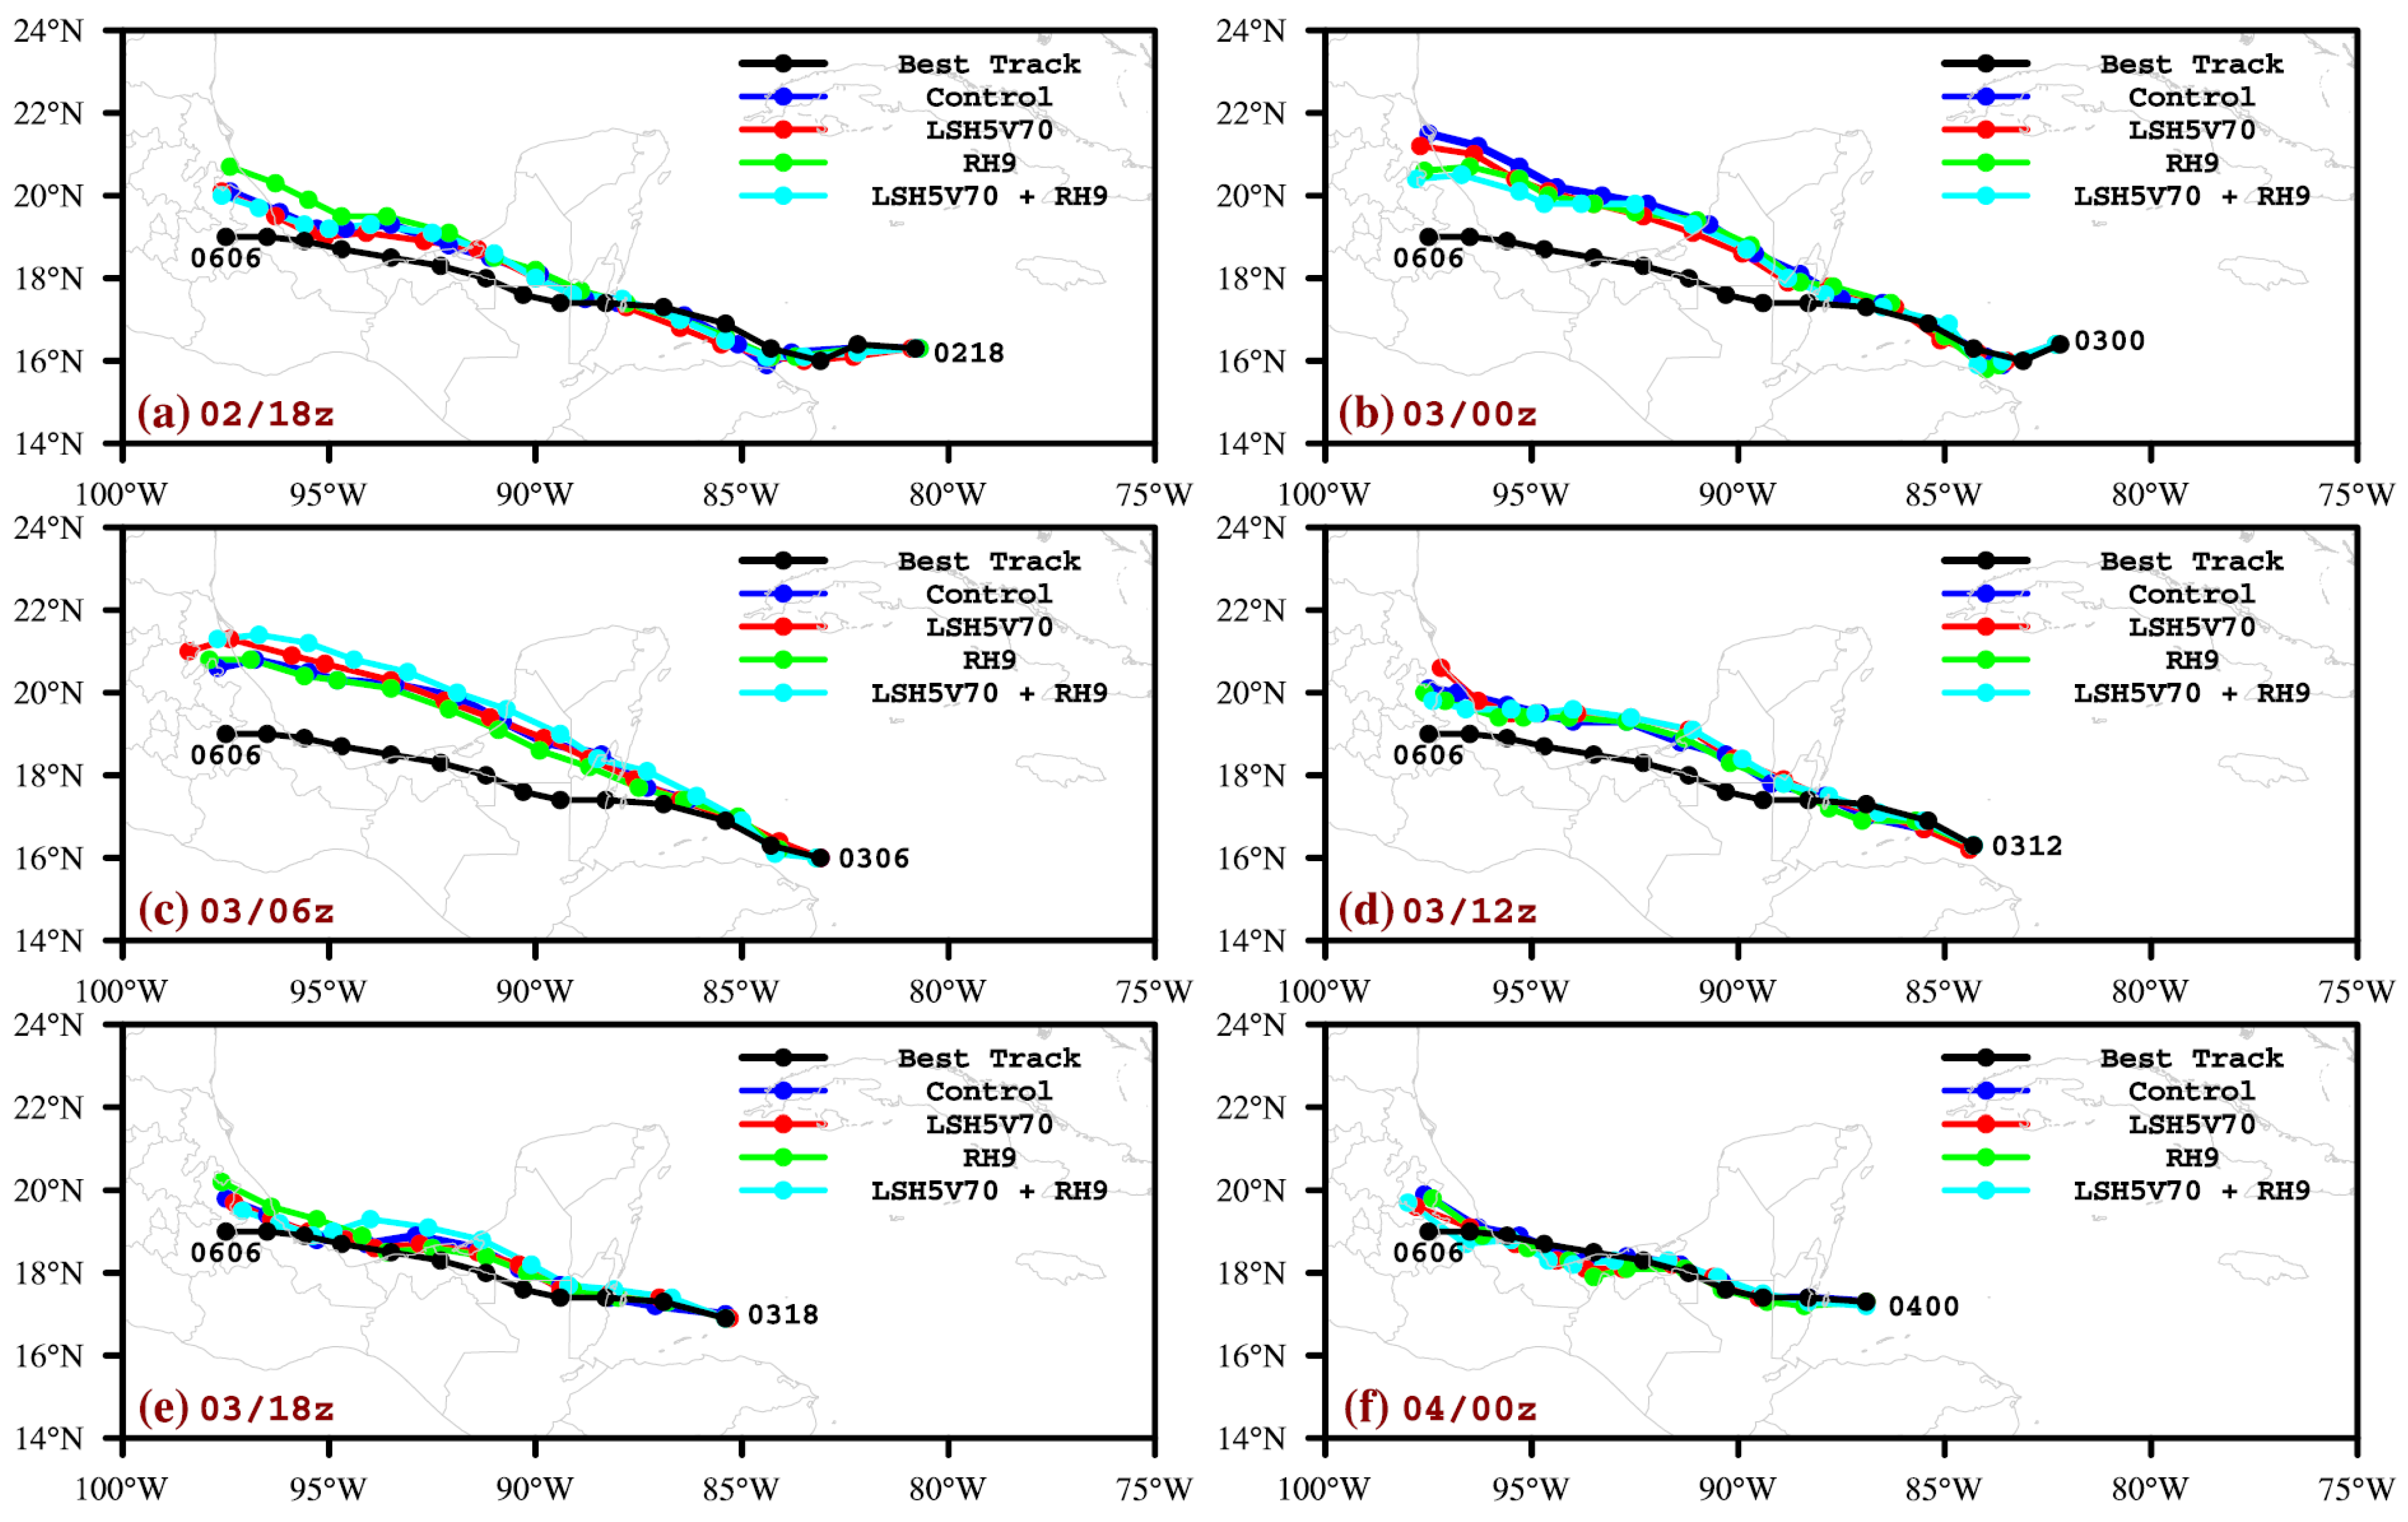
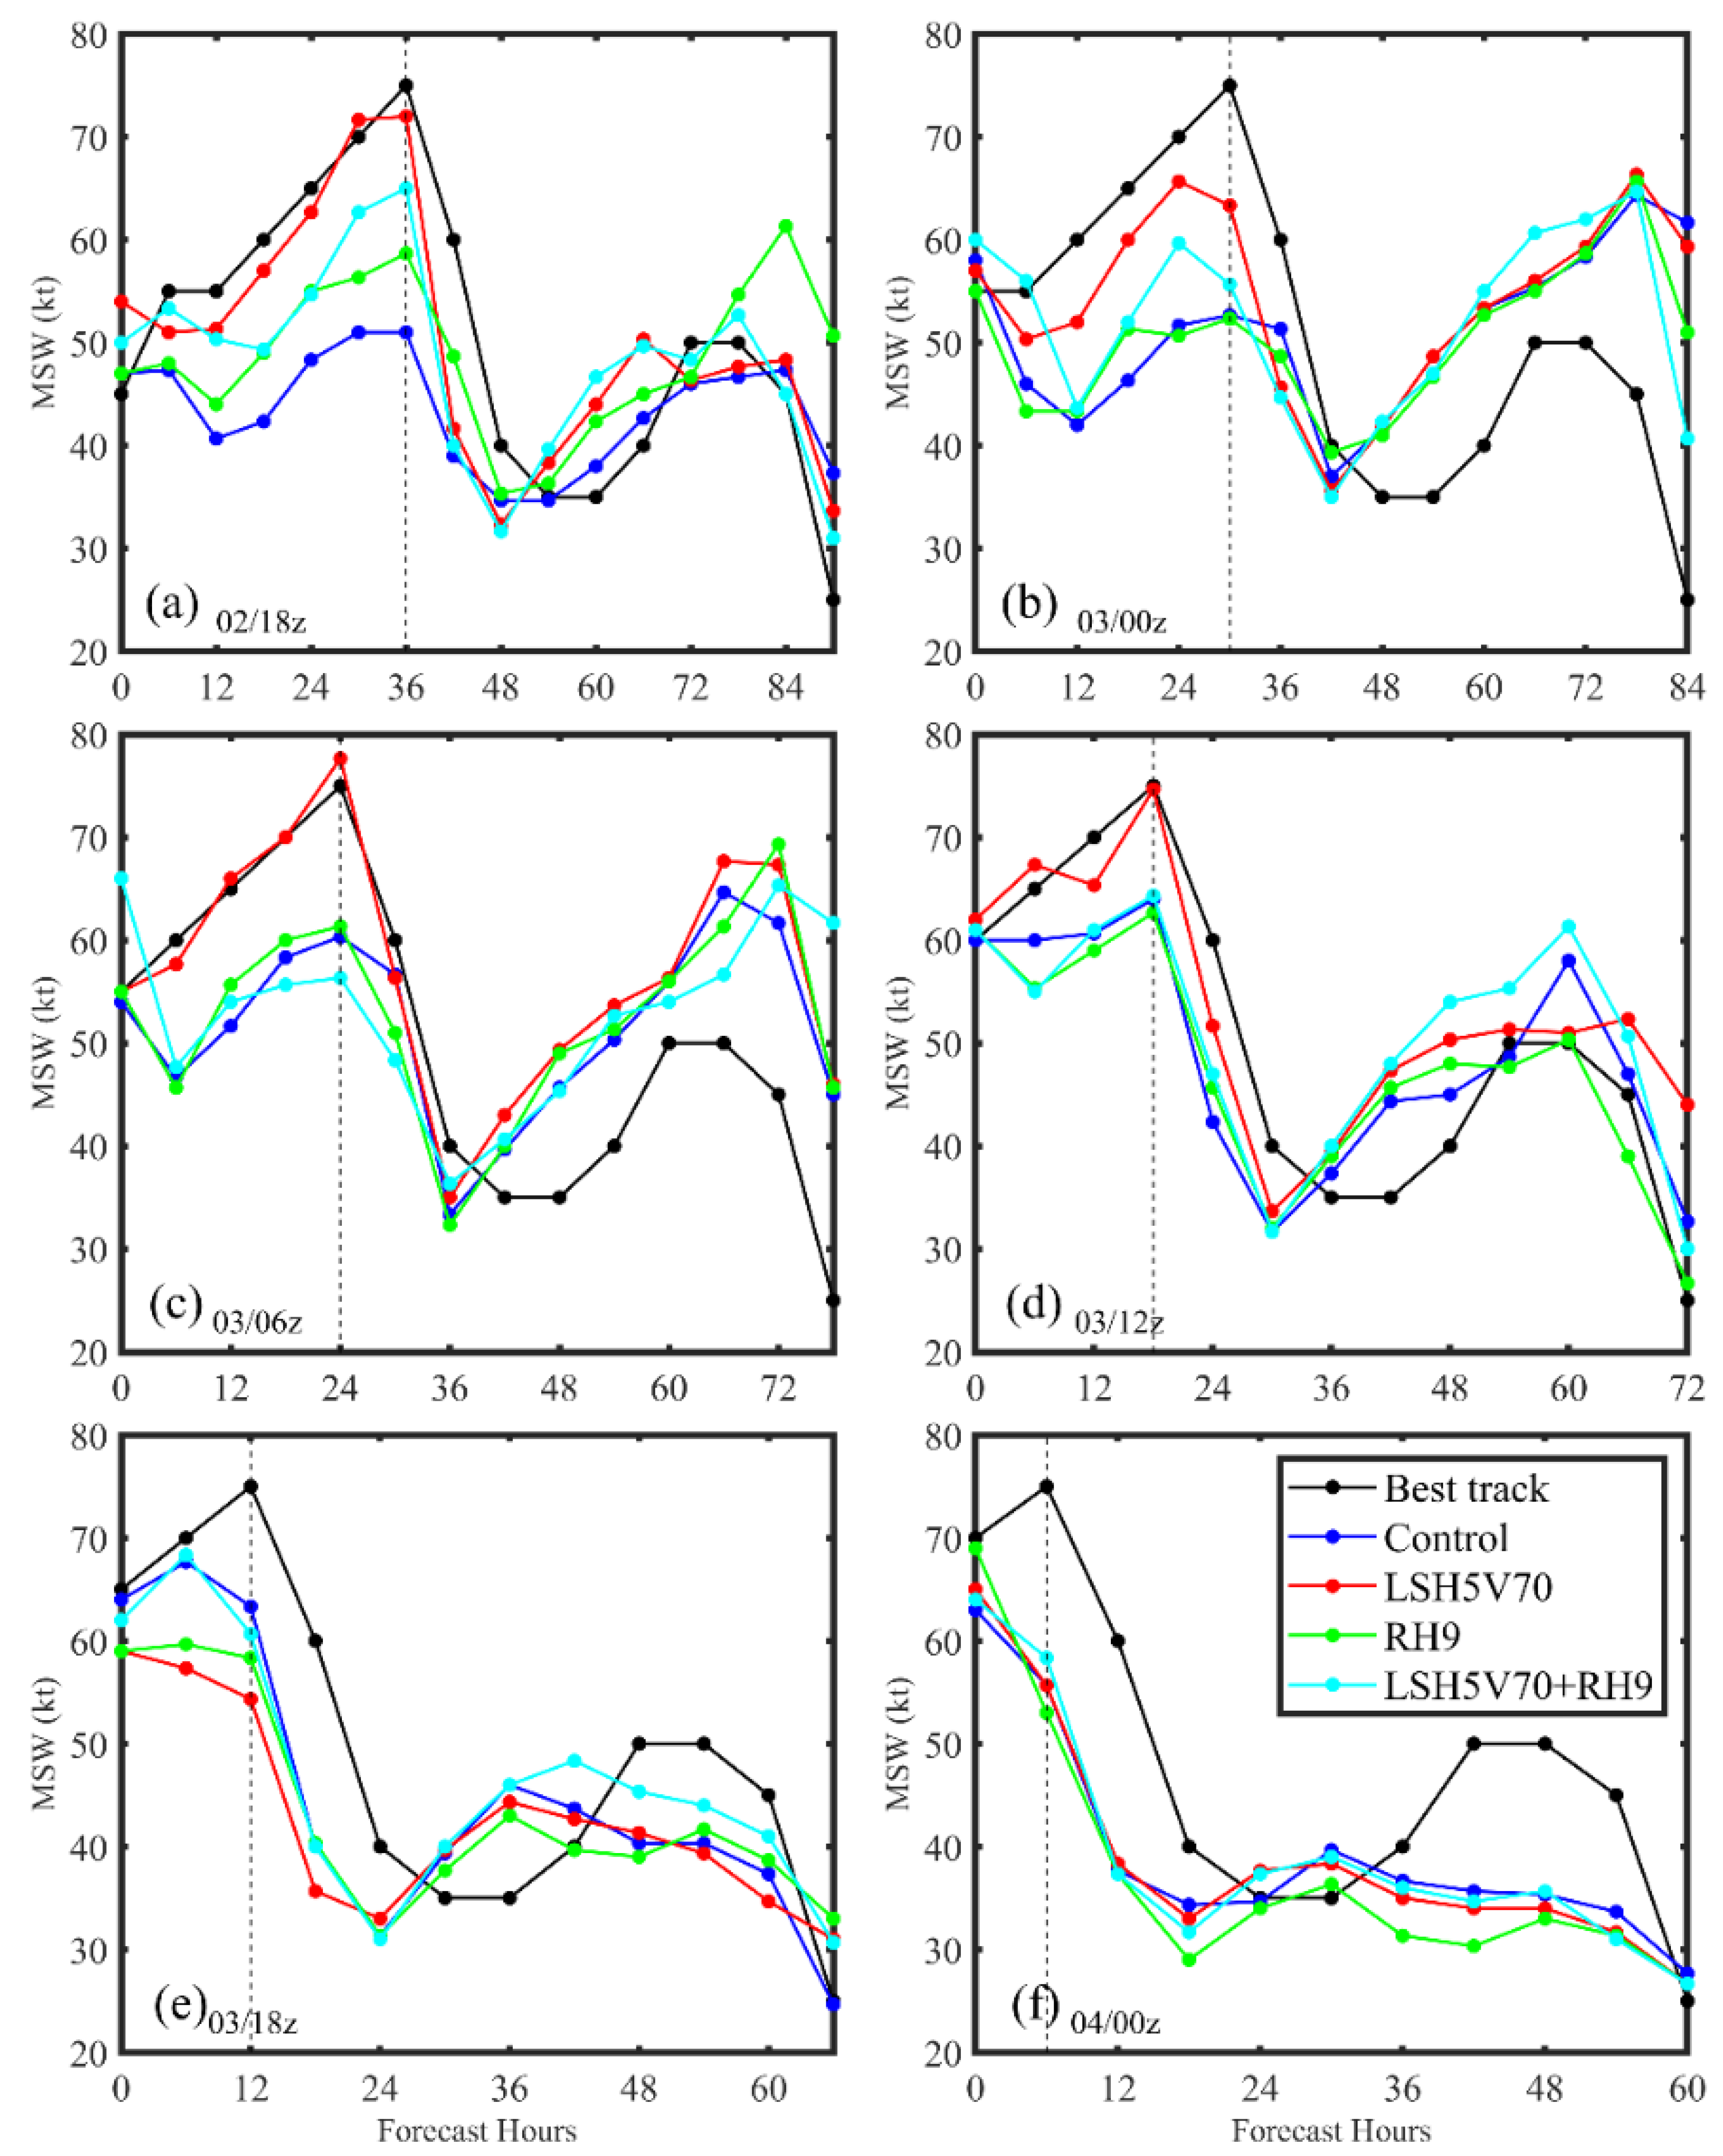
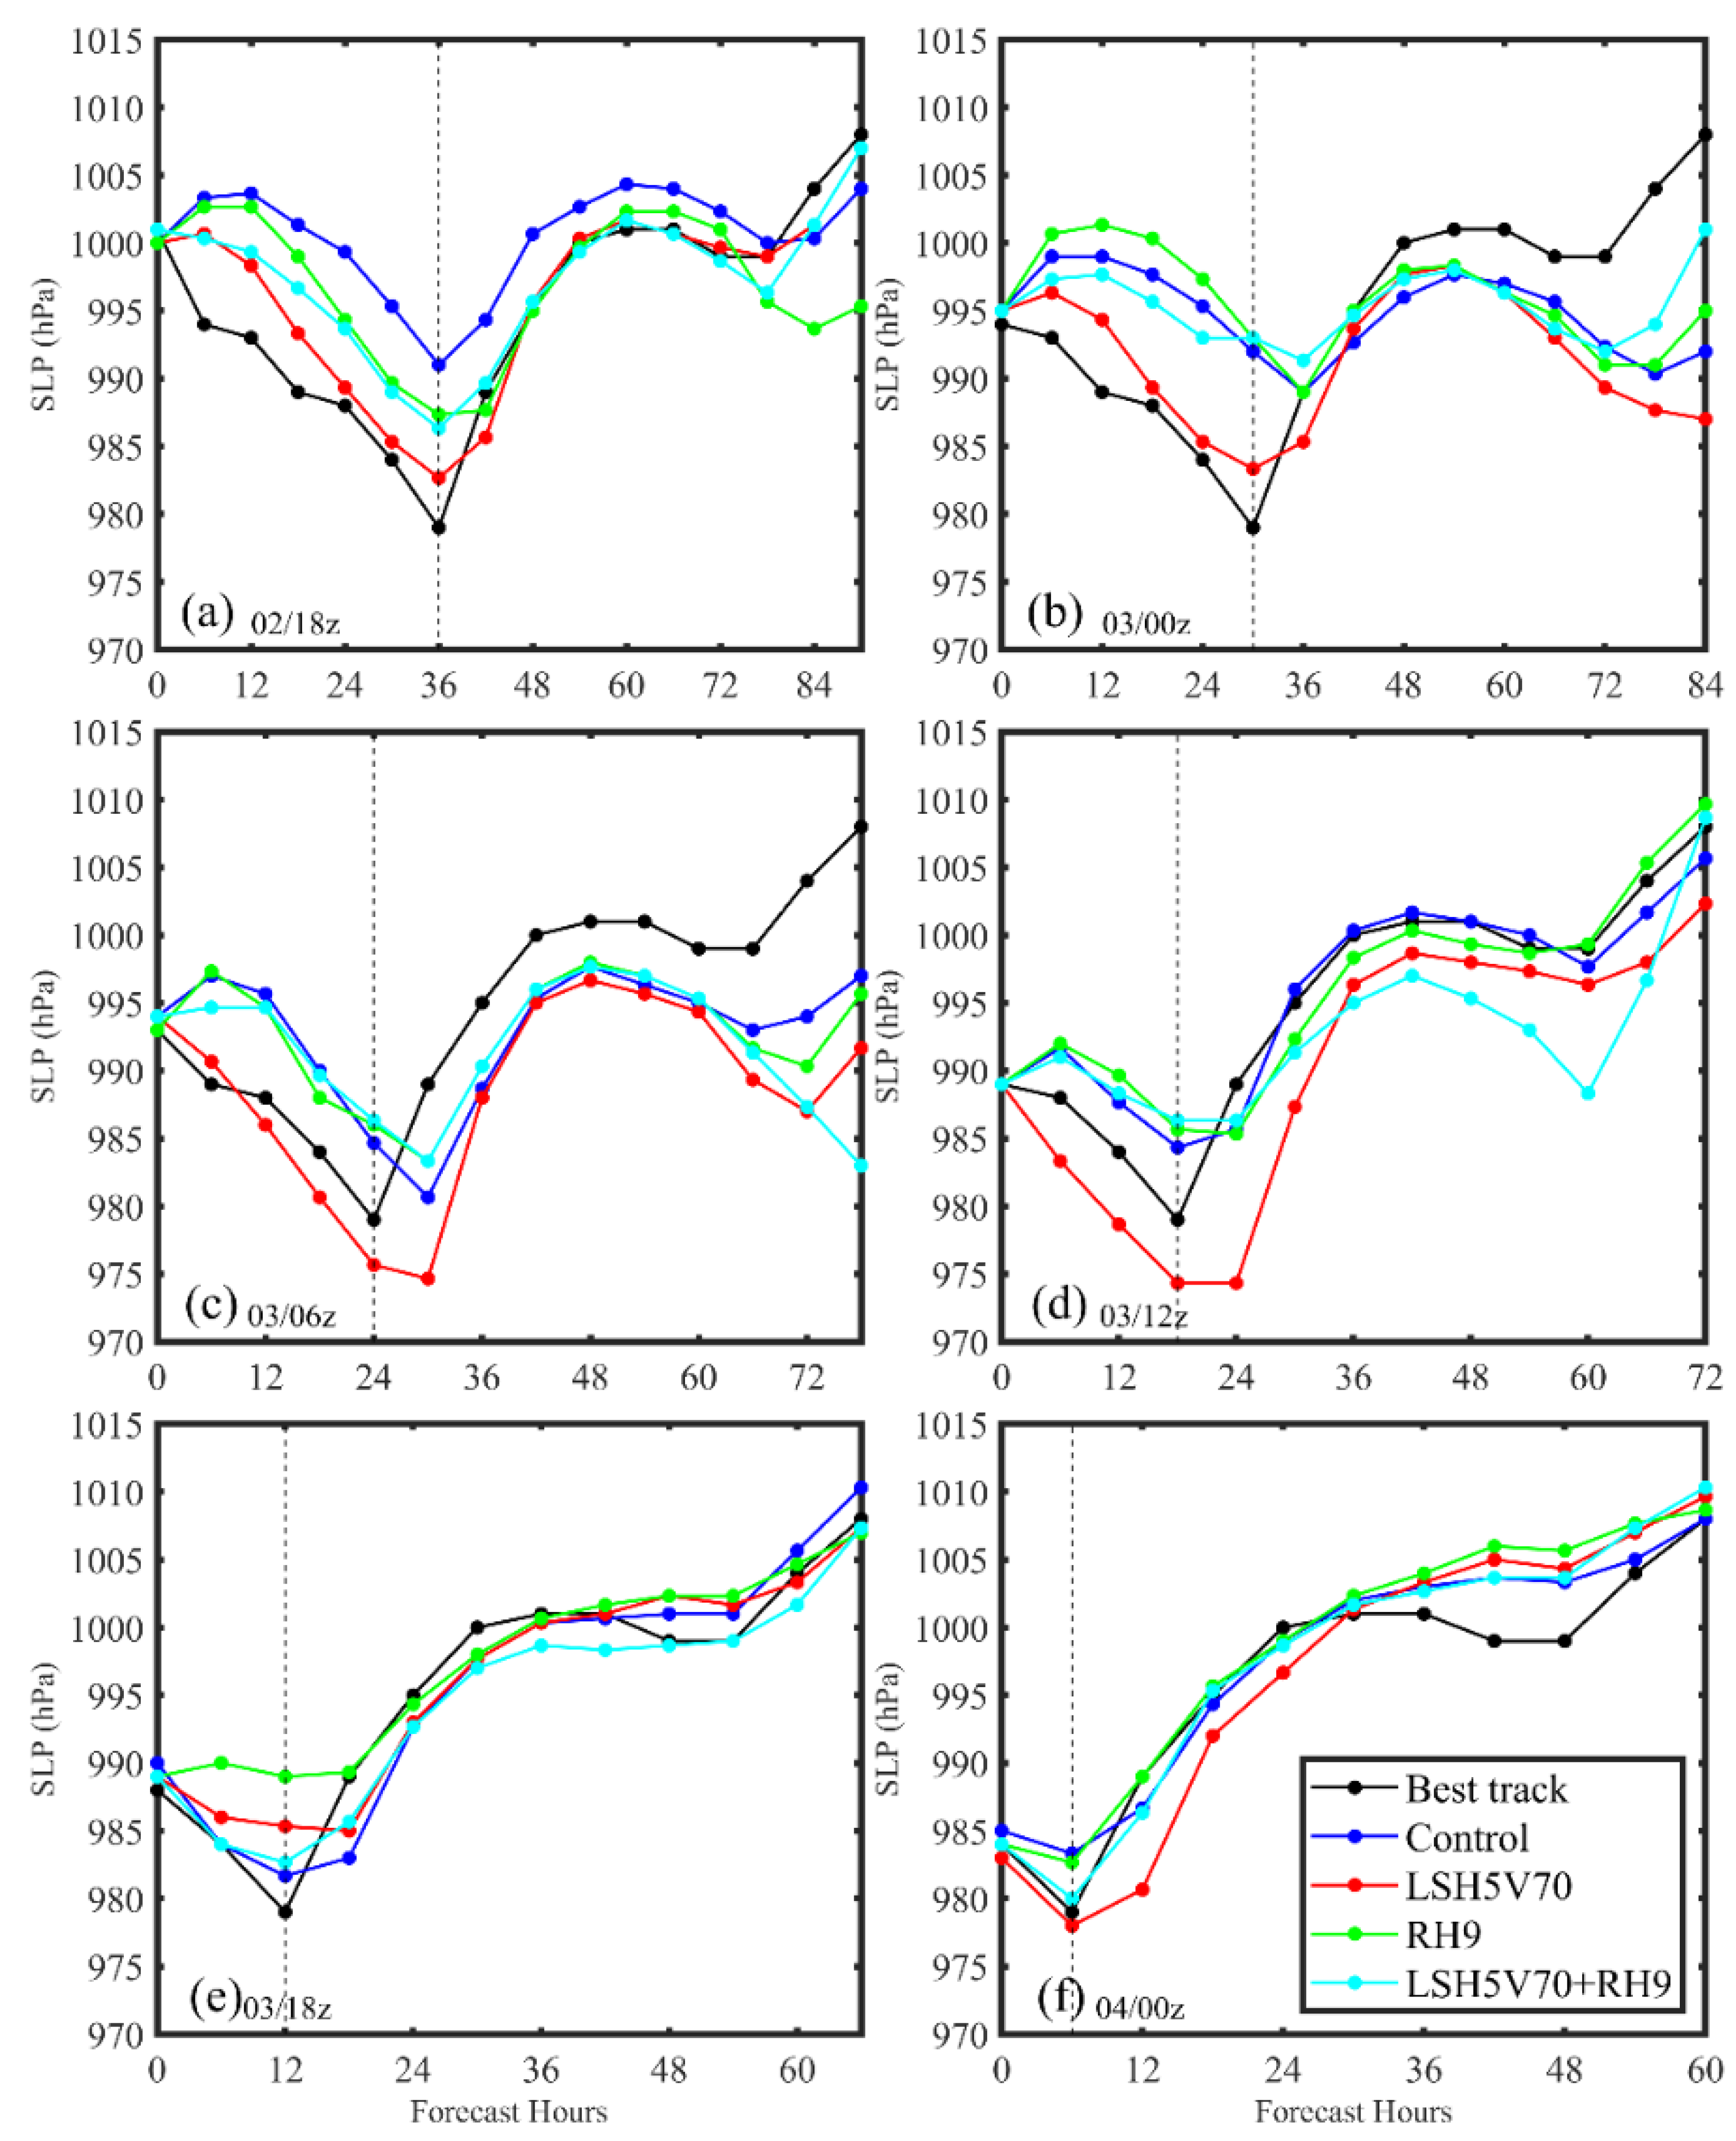
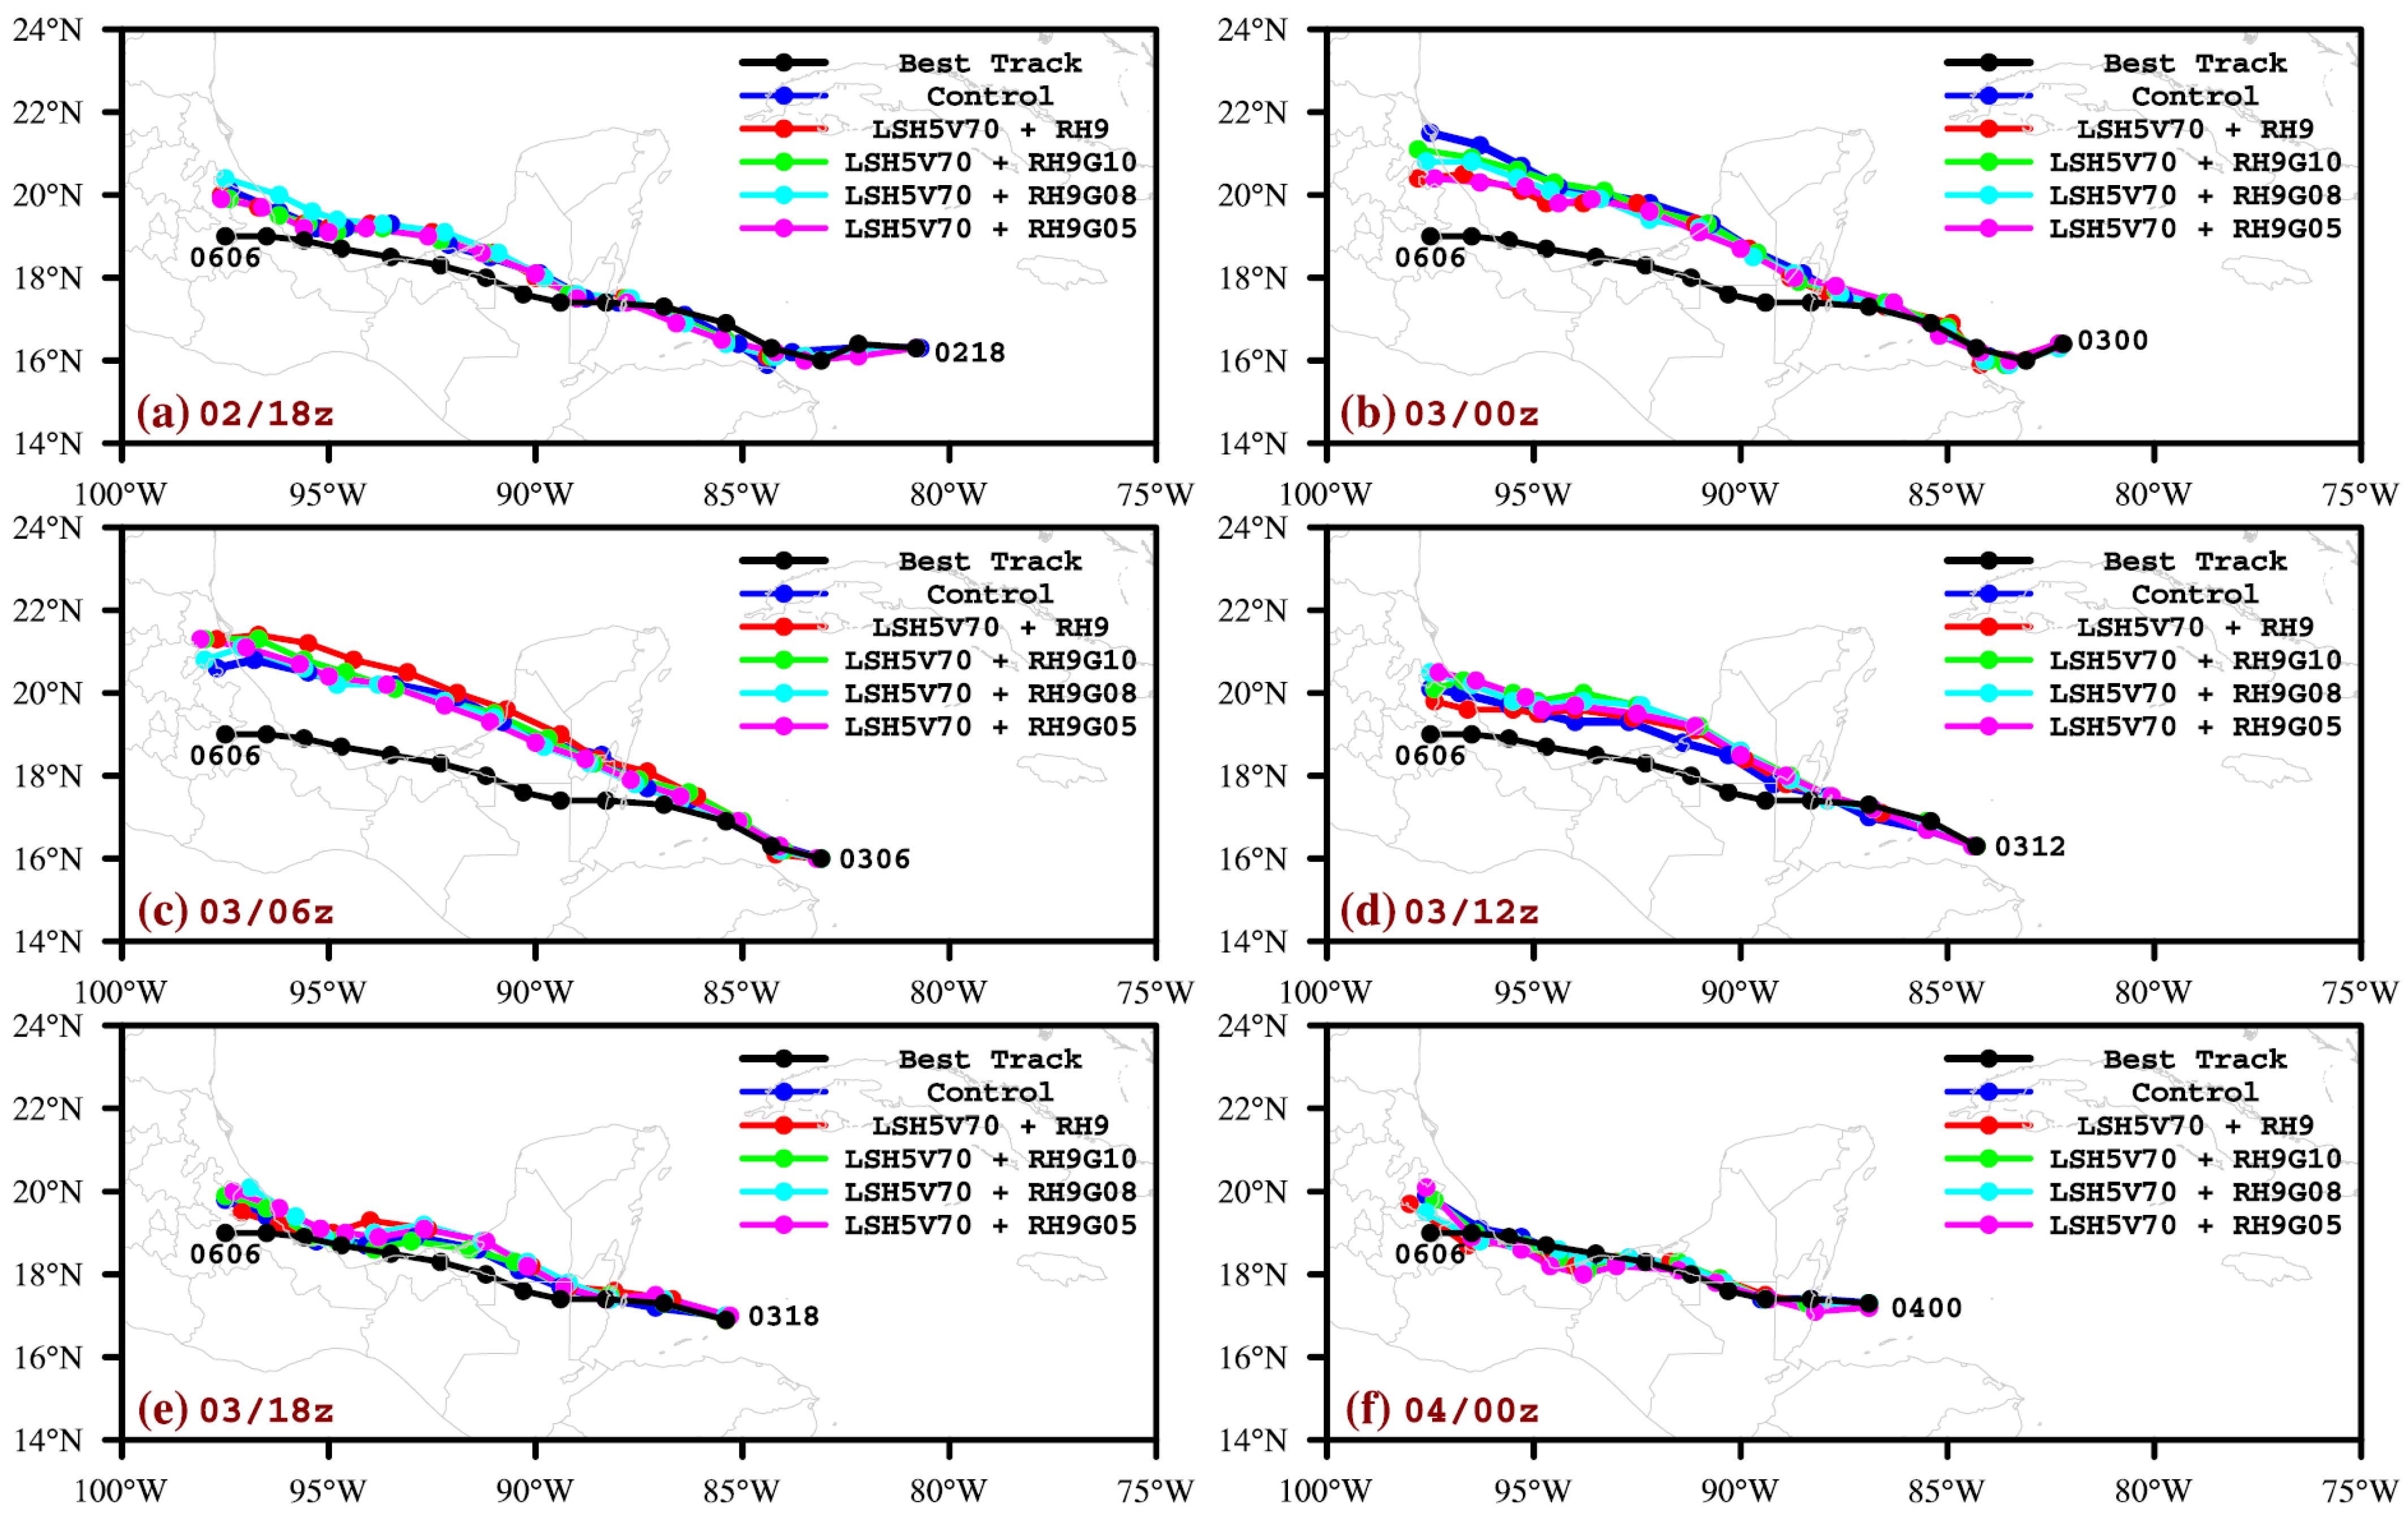
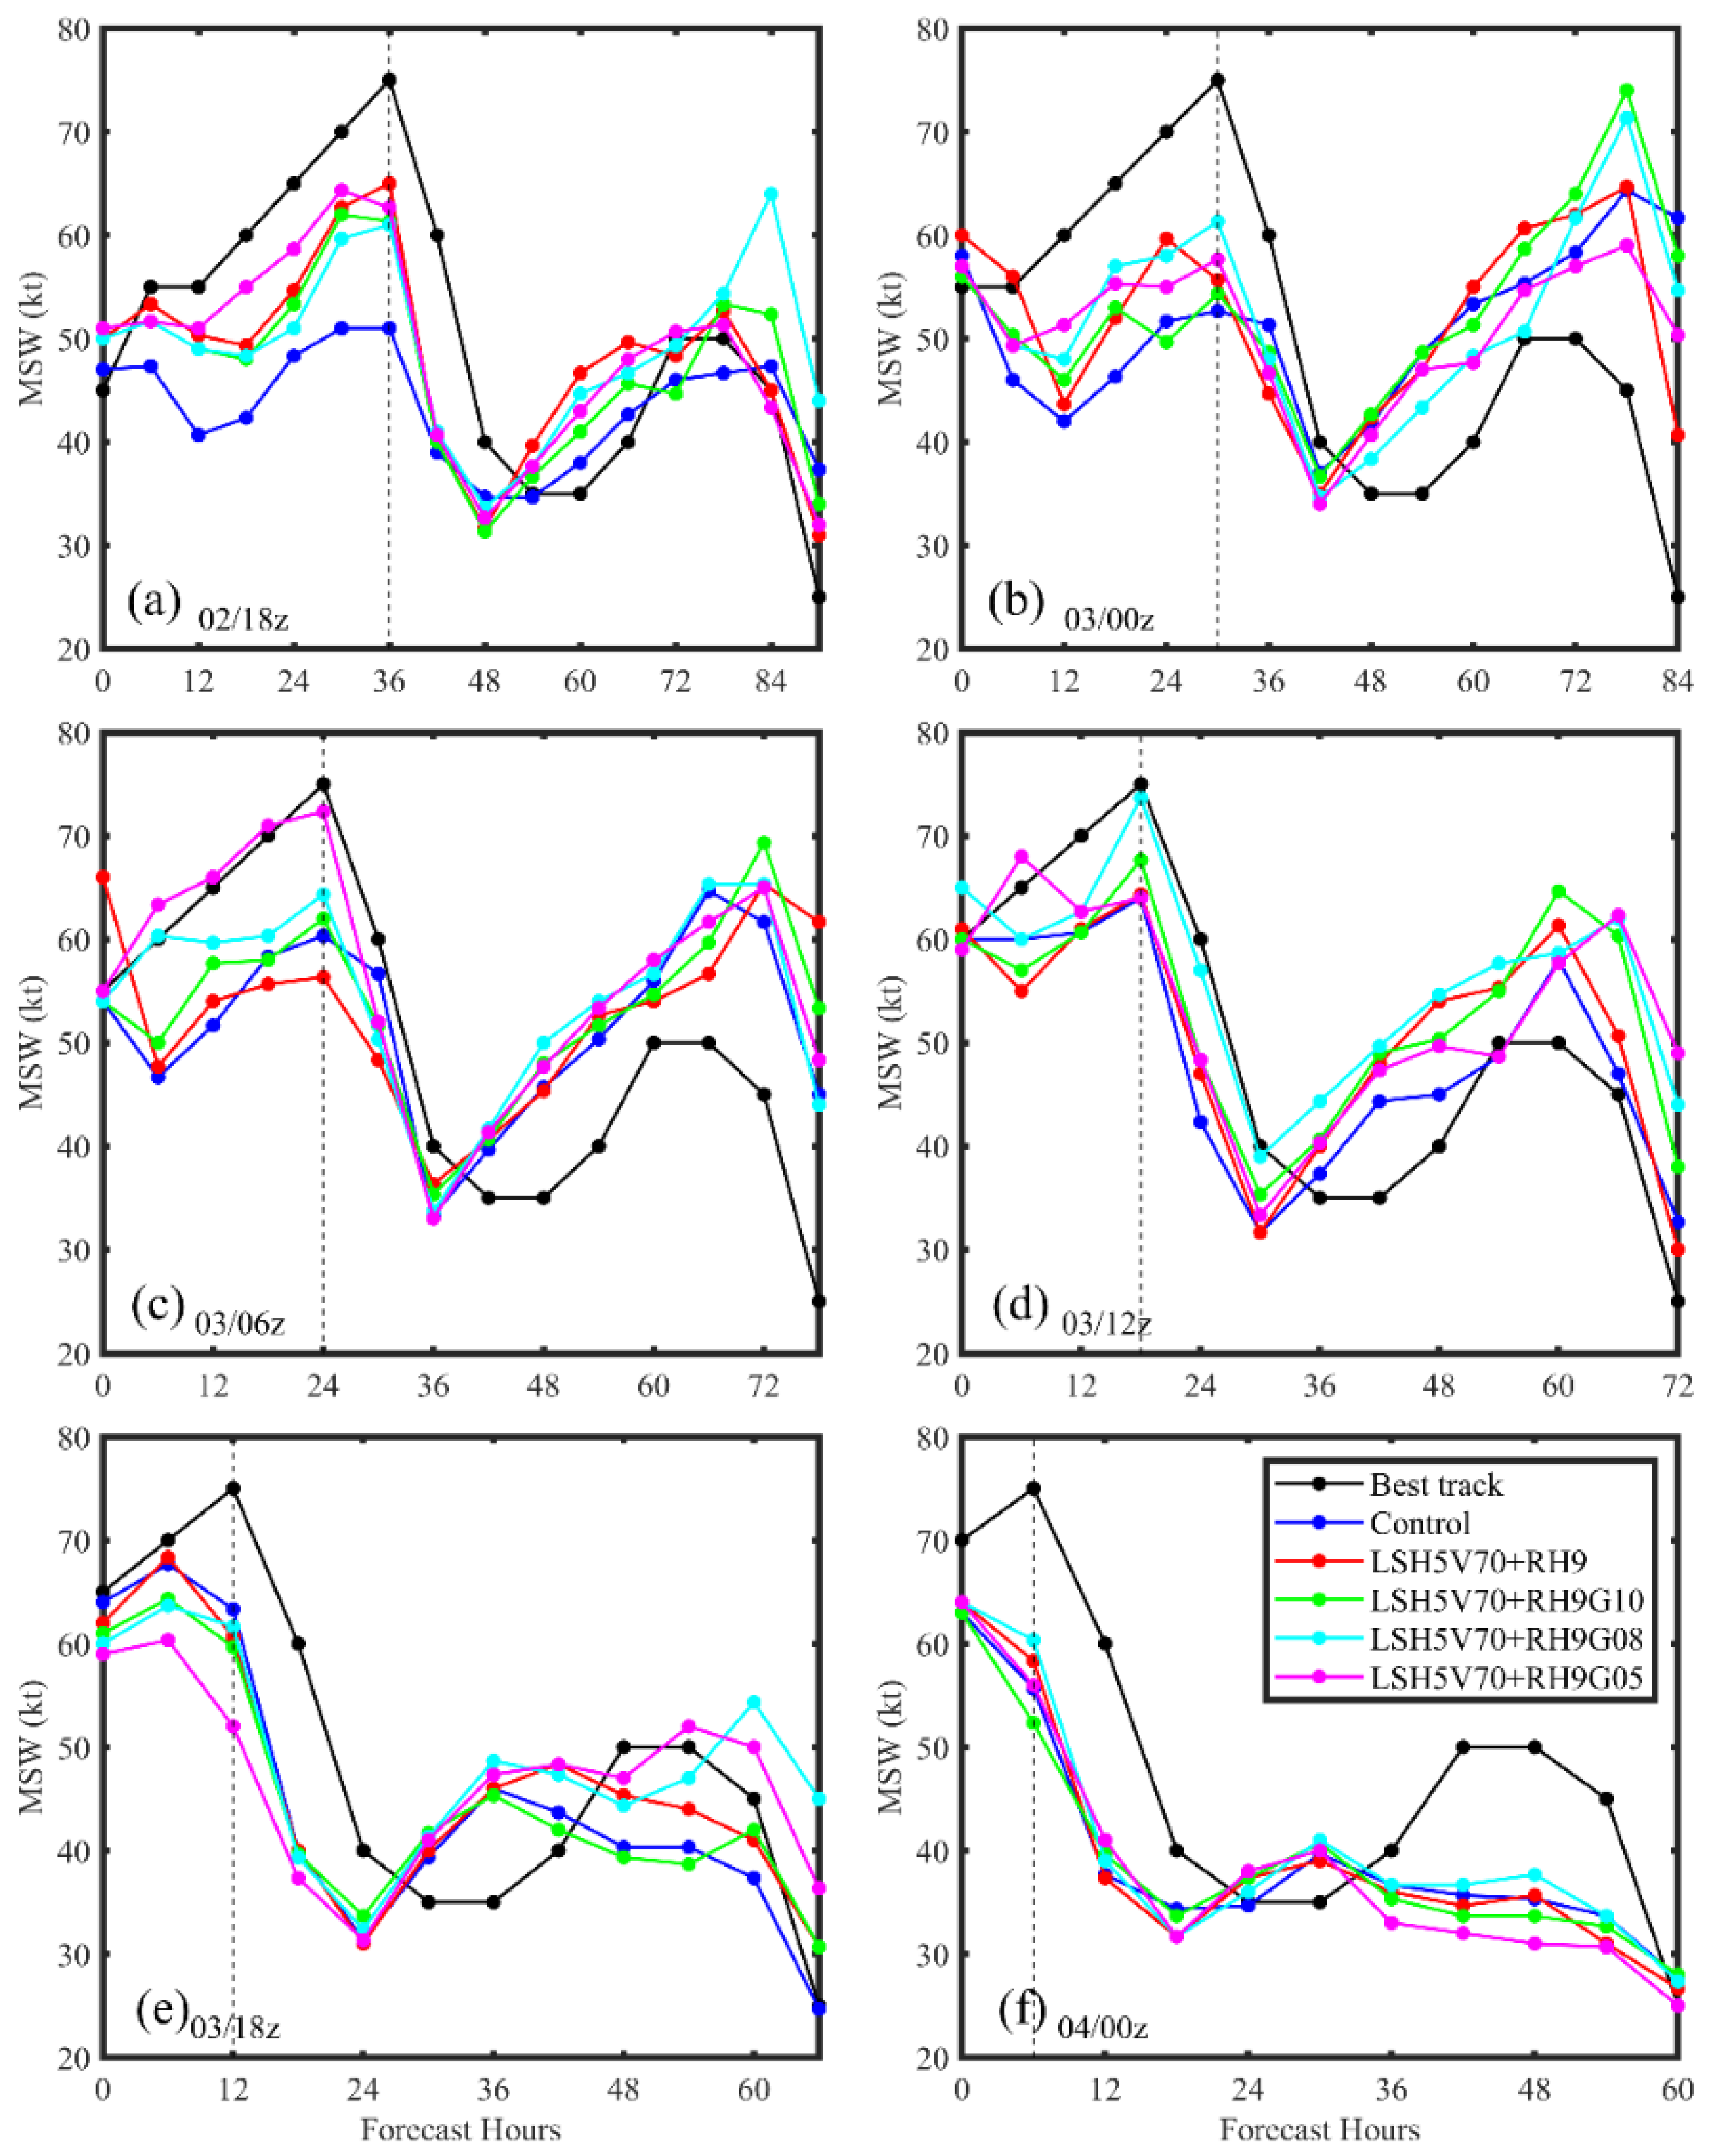
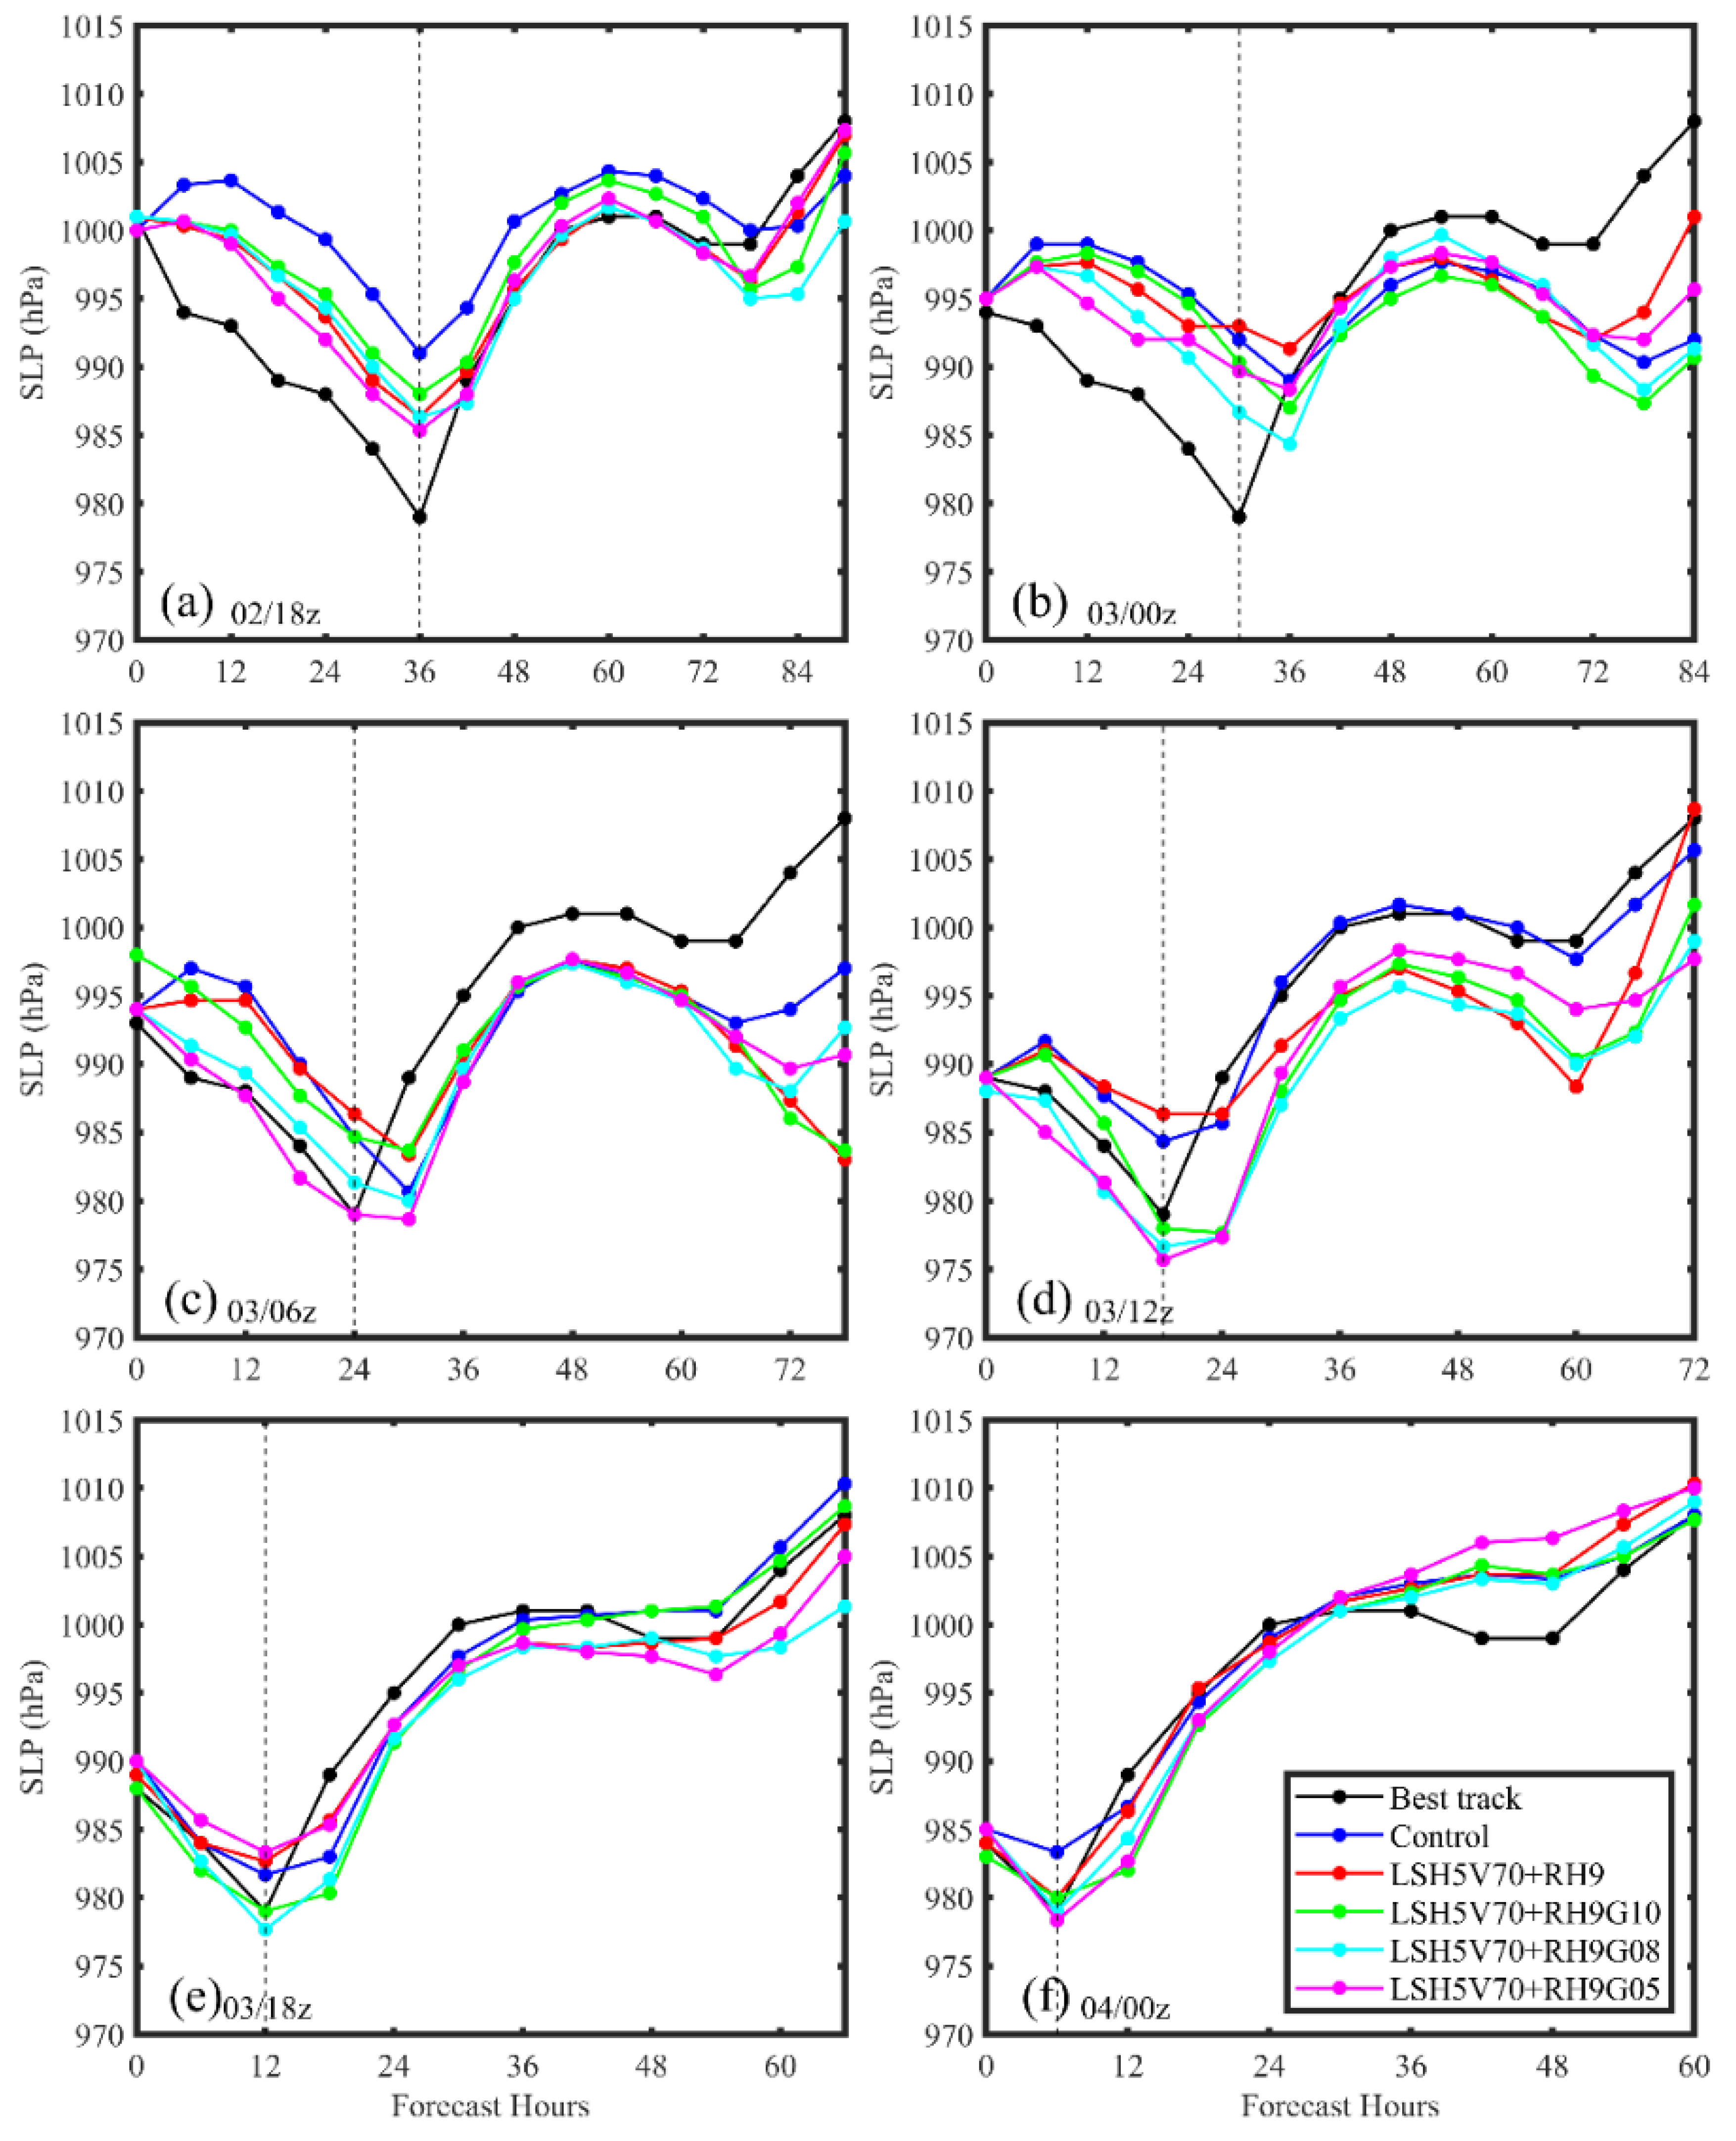
| LSH5V70 + RH9 | X | 5 km | 70 hPa | X | X | 9 km | 2.0 | ||
| LSH5V70 + RH9G10 | X | 5 km | 70 hPa | X | X | 9 km | 1.0 | ||
| LSH5V70 + RH9G08 | X | 5 km | 70 hPa | X | X | 9 km | 0.8 | ||
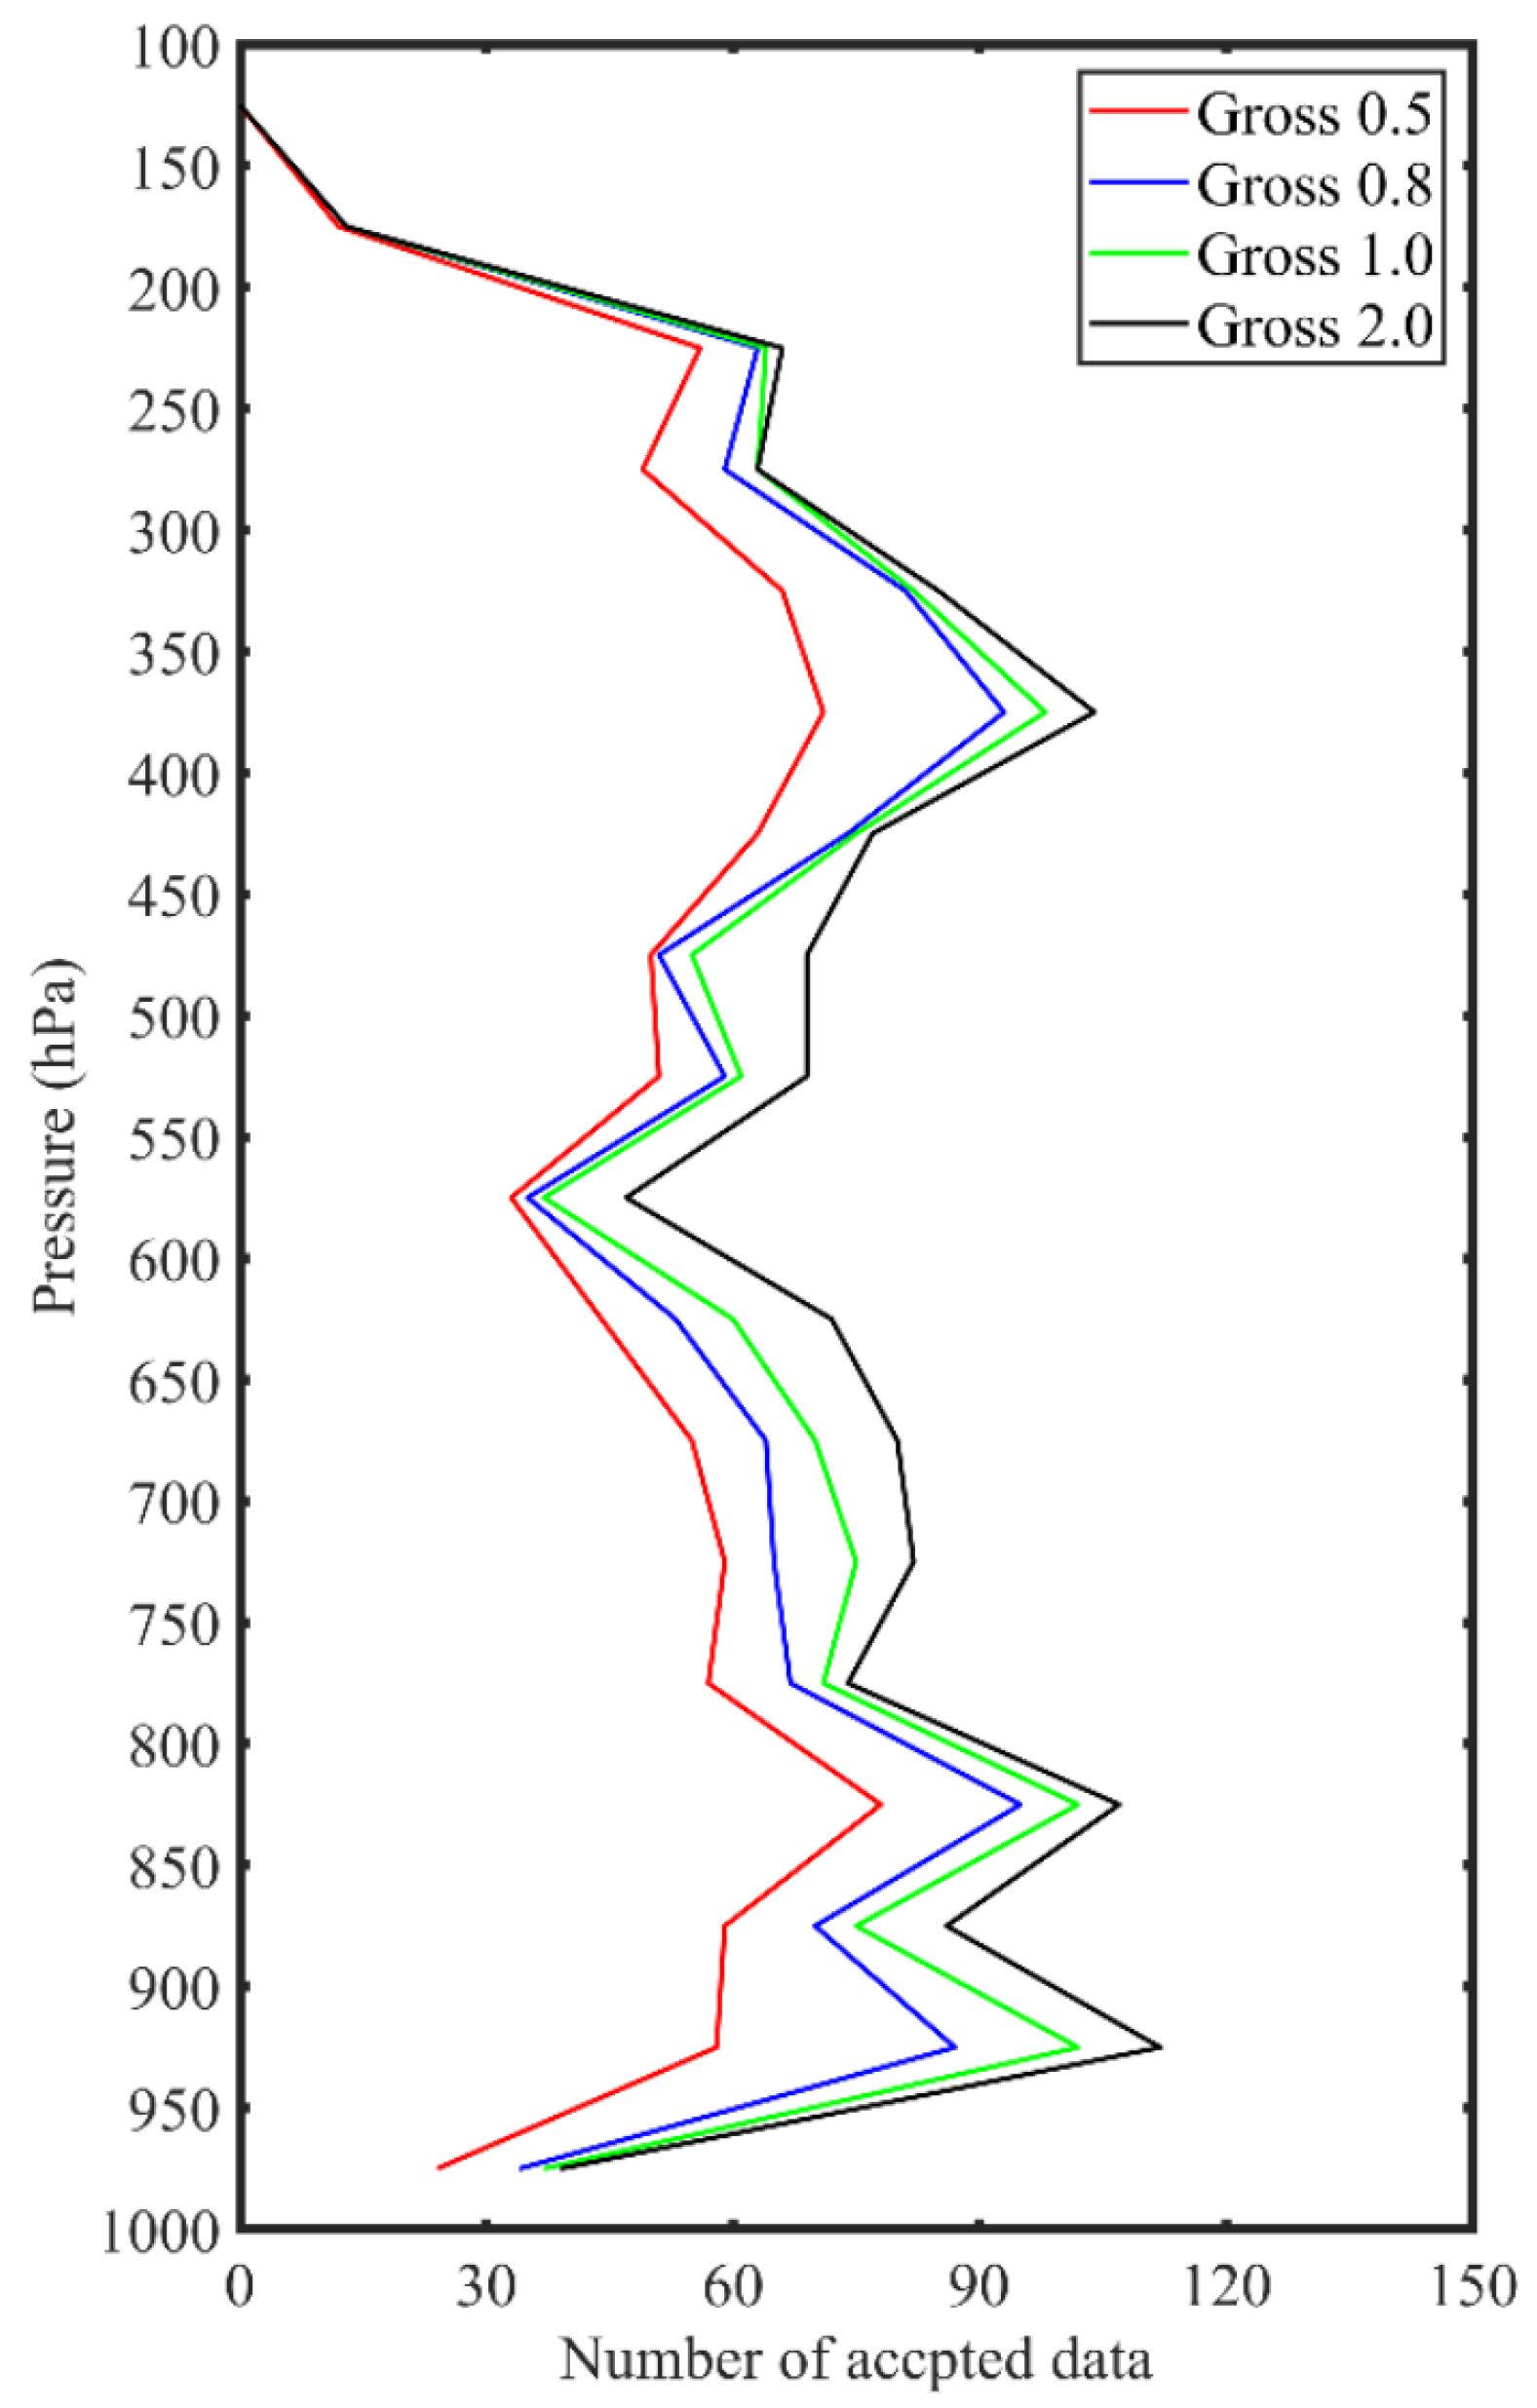
| LSH5V70 + RH9G05 | X | 5 km | 70 hPa | X | X | 9 km | 0.5 |
| 36 h Errors | Control | LUV | LUVH2V10 | LUVH5V70 | LSH5V70 |
|---|---|---|---|---|---|
| Track errors (km) | 45.1 | 76.0 | 81.1 | 72.4 | 40.6 |
| MSW errors (knot) | −10.2 | −11.9 | −7.9 | −10.0 | −1.9 |
| SLP errors (hPa) | 7.2 | 10.4 | 6.0 | 8.1 | 2.2 |
| 36 h Errors | Control | LSH5V10 | LSH5V50 | LSH5V60 | LSH5V70 |
|---|---|---|---|---|---|
| Track errors (km) | 34.8 | 44.7 | 35.2 | 31.6 | 29.8 |
| MSW errors (knot) | −3.5 | −2.1 | −1.0 | −3.2 | 1.6 |
| SLP errors (hPa) | 4.8 | 4.2 | 3.1 | 4.4 | 1.5 |
| LSH5V80 | LSH5V100 | LSH2V70 | LSH10V70 | LS | |
| Track errors (km) | 32.7 | 28.2 | 33.9 | 23.5 | 40.0 |
| MSW errors (knot) | −1.0 | −0.8 | 0.5 | 2.3 | −4.9 |
| SLP errors (hPa) | 2.7 | 3.7 | 1.3 | 1.1 | 4.9 |
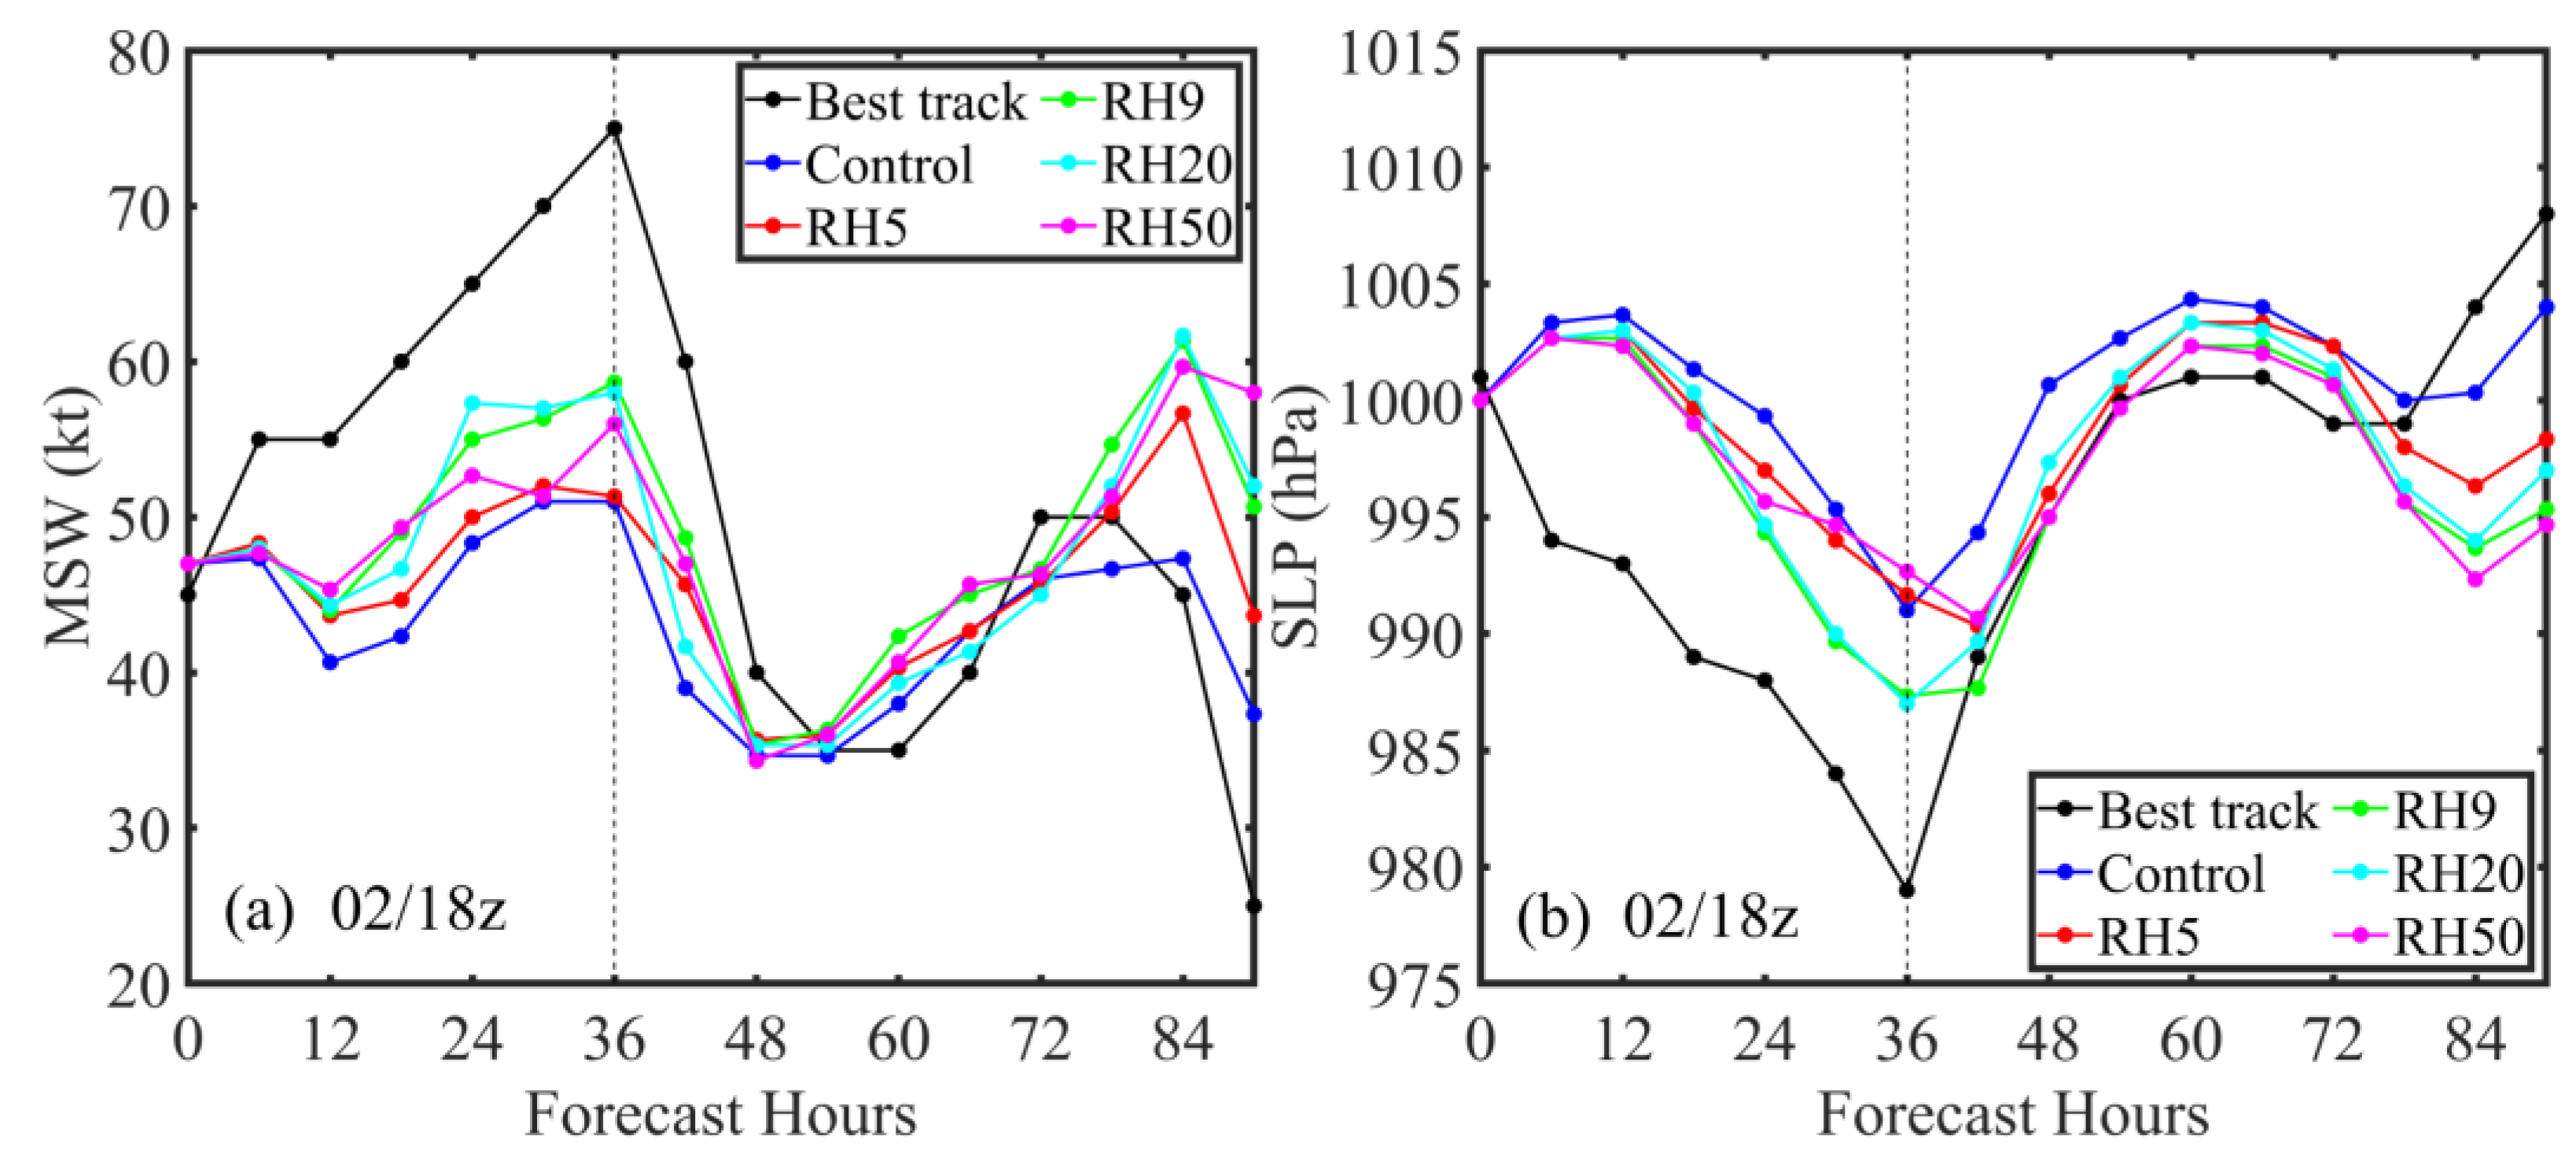
| 36 h Errors | Control | RH5 | RH9 | RH20 | RH50 |
|---|---|---|---|---|---|
| Track errors (km) | 42.7 | 34.3 | 35.6 | 32.2 | 46.3 |
| MSW errors (knot) | −13.9 | −12.6 | −9.6 | −9.5 | −10.8 |
| SLP errors (hPa) | 9.4 | 8.6 | 6.8 | 7.1 | 8.4 |
| 36 h Errors | Control | LSH5V70 | R9 | LSH5V70 + R9 | LSH5V70 + R9G10 |
|---|---|---|---|---|---|
| Track errors (km) | 63.3 | 61.8 | 45.7 | 52.8 | 49.9 |
| MSW errors (knot) | −9.1 | −4.2 | −9.3 | −7.1 | −7.4 |
| SLP errors (hPa) | 3.3 | −1.1 | 3.7 | 2.3 | 1.3 |
Publisher’s Note: MDPI stays neutral with regard to jurisdictional claims in published maps and institutional affiliations. |
© 2022 by the authors. Licensee MDPI, Basel, Switzerland. This article is an open access article distributed under the terms and conditions of the Creative Commons Attribution (CC BY) license (https://creativecommons.org/licenses/by/4.0/).
Share and Cite
Li, X.; Pu, Z.; Zhang, J.A.; Emmitt, G.D. Combined Assimilation of Doppler Wind Lidar and Tail Doppler Radar Data over a Hurricane Inner Core for Improved Hurricane Prediction with the NCEP Regional HWRF System. Remote Sens. 2022, 14, 2367. https://doi.org/10.3390/rs14102367
Li X, Pu Z, Zhang JA, Emmitt GD. Combined Assimilation of Doppler Wind Lidar and Tail Doppler Radar Data over a Hurricane Inner Core for Improved Hurricane Prediction with the NCEP Regional HWRF System. Remote Sensing. 2022; 14(10):2367. https://doi.org/10.3390/rs14102367
Chicago/Turabian StyleLi, Xin, Zhaoxia Pu, Jun A. Zhang, and George David Emmitt. 2022. "Combined Assimilation of Doppler Wind Lidar and Tail Doppler Radar Data over a Hurricane Inner Core for Improved Hurricane Prediction with the NCEP Regional HWRF System" Remote Sensing 14, no. 10: 2367. https://doi.org/10.3390/rs14102367
APA StyleLi, X., Pu, Z., Zhang, J. A., & Emmitt, G. D. (2022). Combined Assimilation of Doppler Wind Lidar and Tail Doppler Radar Data over a Hurricane Inner Core for Improved Hurricane Prediction with the NCEP Regional HWRF System. Remote Sensing, 14(10), 2367. https://doi.org/10.3390/rs14102367


