1. Introduction
Ionospheric scintillation has significant impacts on space-based radio communication, wave propagation, and navigation system performance. The main effects of scintillation on the transionospheric radio system are signal loss and/or phase cycle slips, which cause difficulties in regard to locking the receiver signal. There is no doubt that satellite radio signal scintillation is a consequence of a scattering mechanism, as radio waves are propagating through random electron density (
Ne) fluctuations, especially within the F-region ionosphere, where the irregularity layer is sufficiently thick. Many excellent ionospheric scintillation theory and observation reviews have been published [
1,
2,
3,
4]. Comprehensive studies on the physics and theories of ionospheric irregularities and scintillations can also be found in books by [
5,
6].
The effects of ionospheric scintillation are most intense in the equatorial region, moderate at high latitudes, and minimum at middle latitudes [
7]. At equatorial latitudes and the time near and/or soon after sunset, the zonal neutral wind and conductivity gradient caused by the sunset terminator interact develop an enhanced eastward electric field, called pre-reversal enhancement (PRE), generally at F-region heights [
5,
8,
9]. As a result, the ionosphere moves upward, develops steep density gradients and large-scale plasma depletions in the bottom side F-region, and becomes unstable, triggering the Rayleigh–Taylor (R–T) instability. The plasma depletions, called plasma bubbles, become populated with mesoscale or small-scale irregularities and rise to great heights. These plasma bubbles, extended in altitude, also map out along magnetic field lines to the north and south of the magnetic equator, i.e., higher magnetic latitudes. These structured irregularities generally move eastward by the action of a vertical oriented polarization electric field. Undergoing a non-linear cascade process of electric field driving and wave-wave coupling [
10], irregular structures drift and vary from large- to small-scale. The spectral distribution of irregularities includes a broad component associated with waves. Equatorial spread-F (ESF) thus stems from high-frequency radar observations of the “spread” of the ionospheric echoes in ionograms and can be used to describe equatorial and low-latitude F-region instability phenomena. Scintillation and ESF activities attain a maximum value during high sunspot activity periods, especially during equinoxes (March, April, September, and October), owing to the increased value of the background ionization density [
11]. In particular, low-latitude scintillation can be dictated by solar transients, such as magnetic storms [
11].
Several techniques have been used to observe and study ionospheric irregularities and scintillations. These include sounder, radar backscatter, in-situ measurements onboard rockets or satellites, ground-based satellite beacon signal observations, space-based navigation beacon observations using radio occultation (RO) techniques, etc. Earlier investigations [
12] developed an operational system, named the SCIntillation Network Decision Aid (SCINDA), to nowcast and forecast scintillation. At the operator terminal, the SCINDA data were combined with an empirical plasma bubble model to generate three-dimensional maps of irregularity structures and two-dimensional outage maps for the equatorial region in the American sector. In this study, another multi-station and multi-instrument system, developed for ionospheric scintillation and ESF specification in the Taiwan–Philippines sector, is outlined. The issues related to the scintillation and ESF event observed on 26 October 2021, are presented and discussed. We shall first indicate the existence of a plasma bubble in the Taiwan–Philippines sector using the FS7/COSMIC2 Global Positioning System (GPS) or GLObal NAvigation Satellite System (GLONASS) RO observations. We shall verify the latitudinal extent of the tracked plasma bubble using the recorded ionograms from the Vertical Incidence Pulsed Ionospheric Radar (VIPIR) located at Hualien (23.89°N, 121.55°E, dip latitude 17°N), Taiwan. We further discuss the spatial and temporal variabilities of two-dimensional scintillation index maps based on the simultaneous GPS L1-band signal measurements from 133 ground-based receivers located in Taiwan and the surrounding islands. We also operate two high-sampling, software-defined GPS receivers and characterize the targeted plasma irregularities by carrying out spectrum analyses of the received signal. Overall, we summarize the derived plasma irregularity and ESF characteristics and point out a potential precursor for post-sunset scintillation and ESF events.
3. Results
This section presents the multi-station and multi-instrument observations of a scintillation event that occurred in the Taiwan–Philippines sector on 26 October 2021, which was at magnetic quiet conditions, referring to Kp indexes between 0+ and 2+.
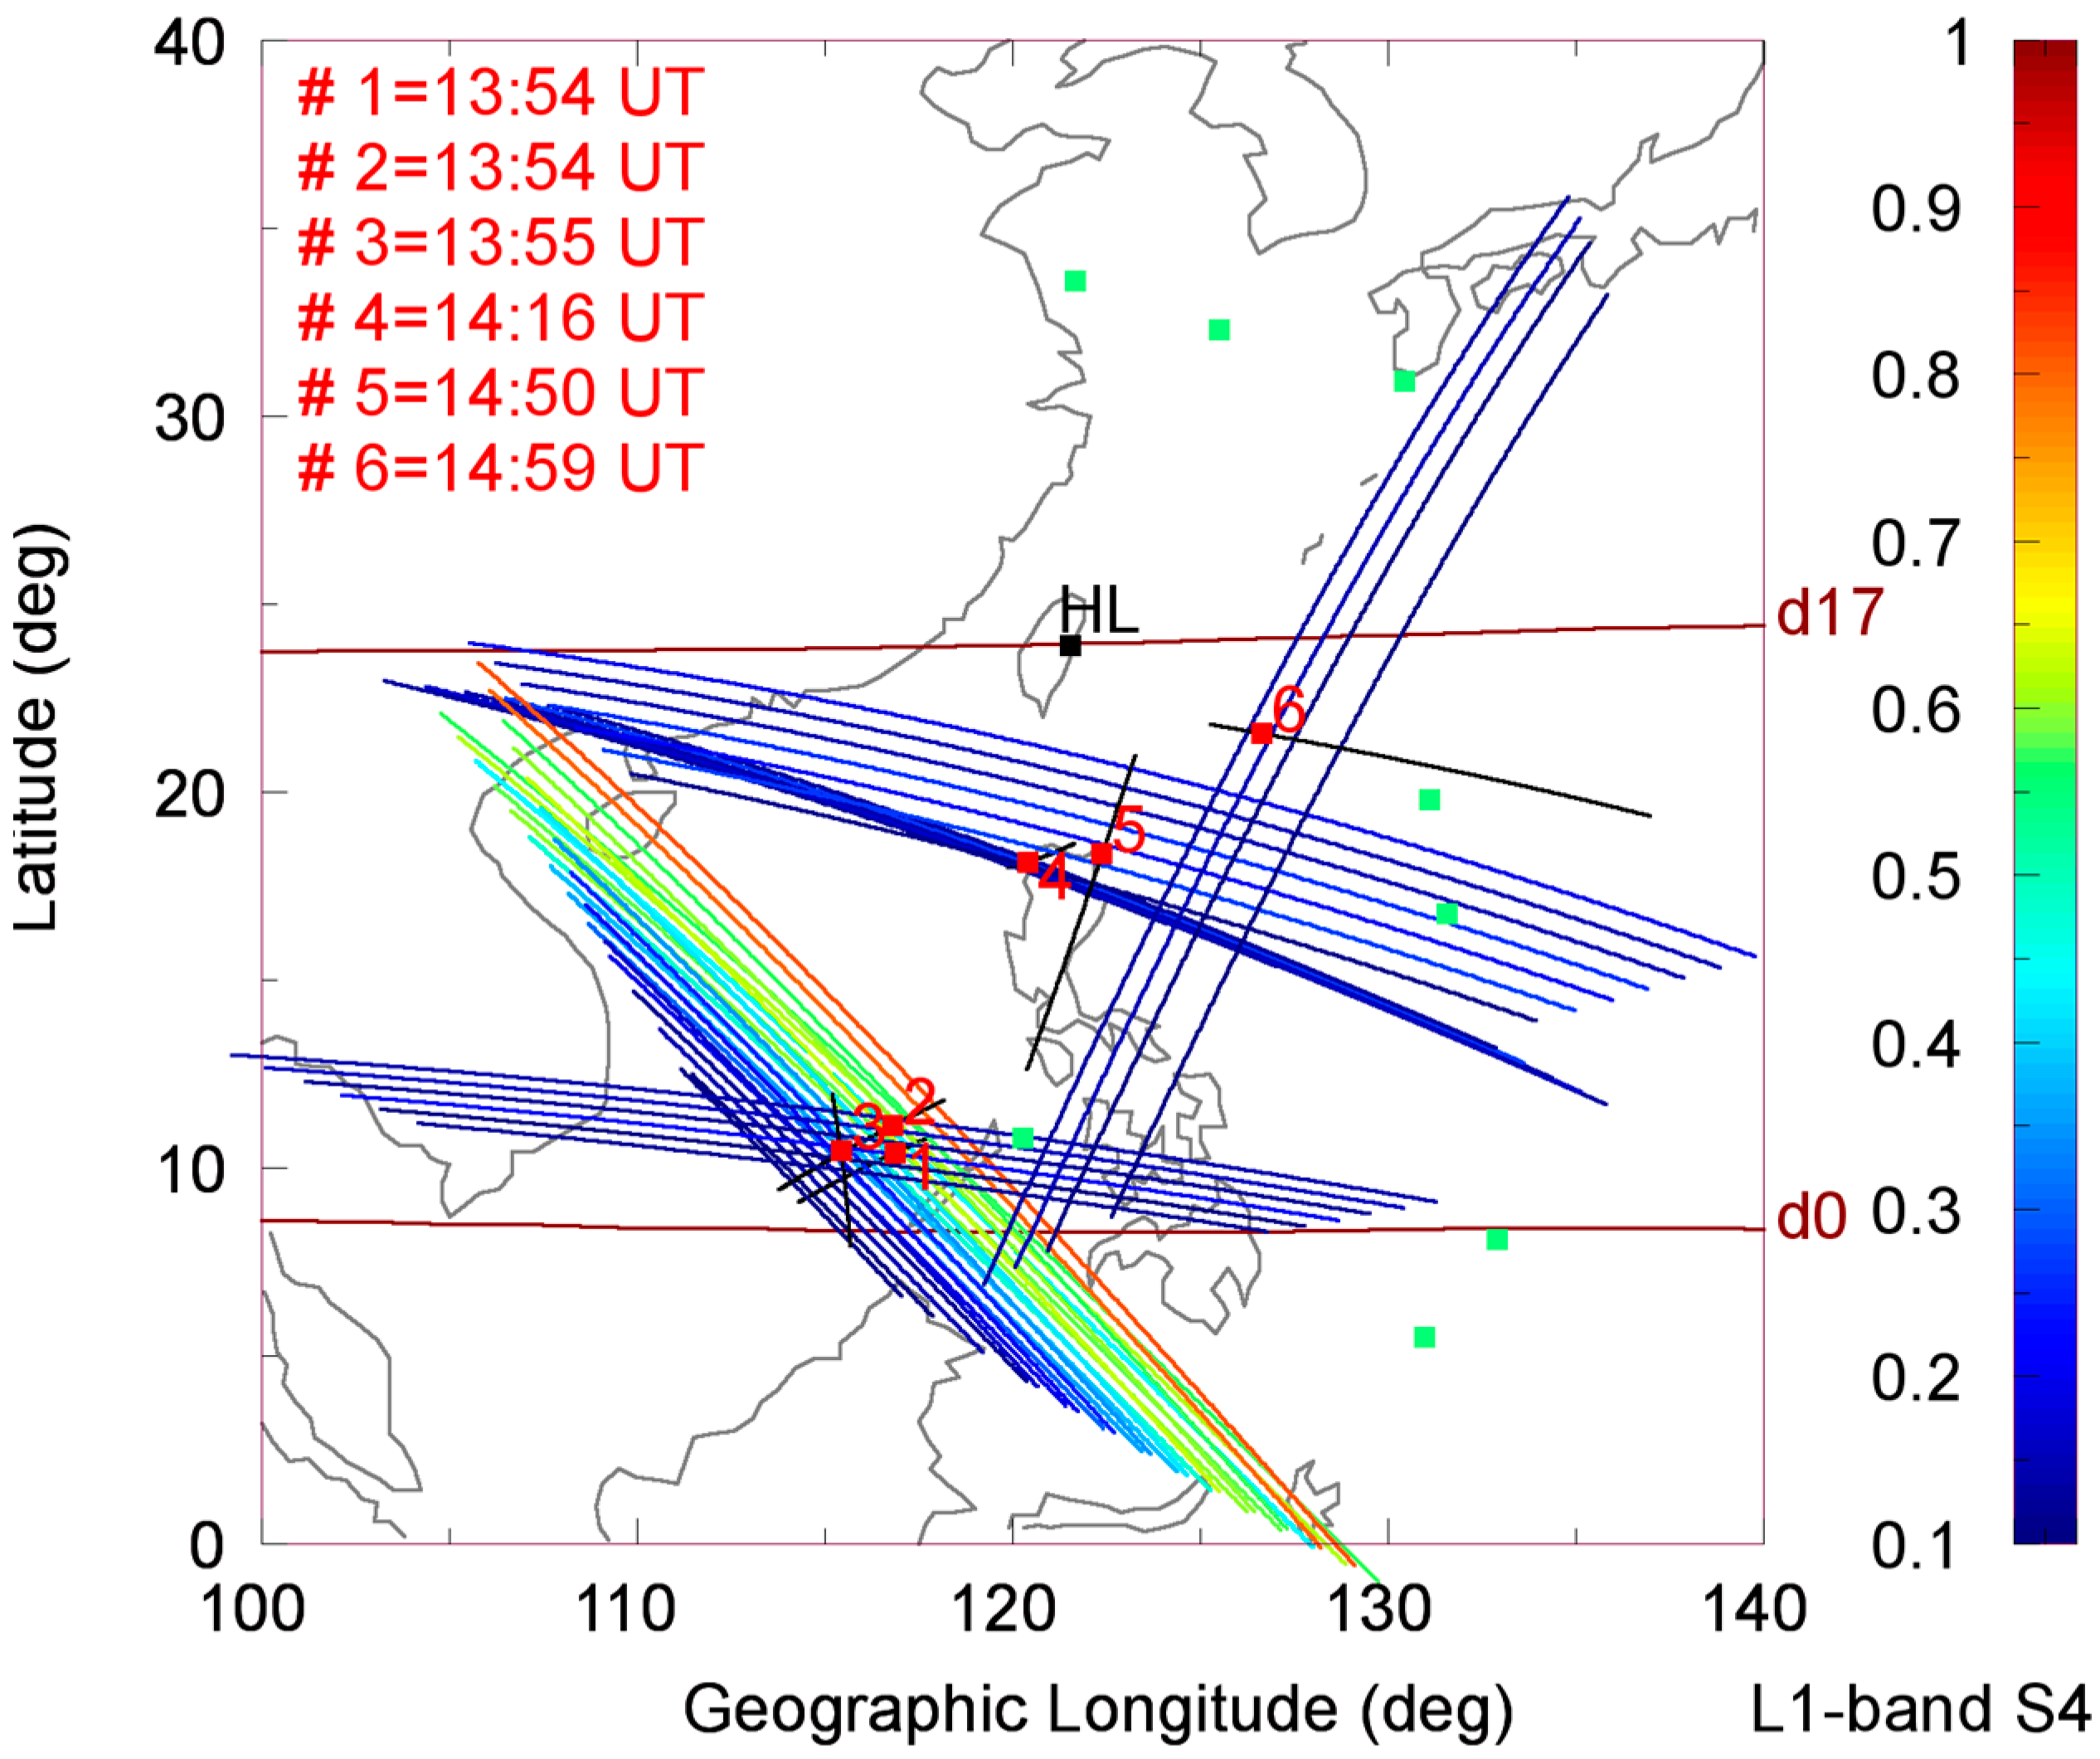
Figure 1 shows the geographical geometry of the F-layer irregularity observations obtained during 13:00~15:30 UT, i.e., 21:00~23:30 LT in Taiwan, on 26 October 2021, by the FS7/COSMIC2 GPS/GLONASS RO sounding experiment. Six (#1 to #6 observations) out of fourteen RO observations were recorded and classified as scintillation observations according to their maximum limb-viewing L1-band
S4 values larger than 0.1 [
14]. Their recording times, which are the FS7/COSMIC2 LEO satellite orbiting times at the peak altitudes of RO observations, are used to identify the scintillation event period, at least from 13:54 to 14:59 UT. For each RO scintillation observation, a set of RO limb-viewing links at a 15 s sampling rate (between 150 and 450 km altitudes), which connects the occultation points to their conjugate points, is shown in coded colors of L1-band
S4 values to present the possible projection area of ionospheric irregularities, and the trace of perigee points (or tangent points) is also shown. We note that the first three (#1, #2, and #3) RO observations are located near the magnetic equator and experience strong scintillations. The later three (#4, #5, and #6) RO observations are located in the northeast directions of the observations #1, #2, and #3 and could be their latitudinal mapping-out cases; thus, they experience weaker scintillations. In contrast, as shown in
Figure 1, the peak tangent point positions of the other eight RO observations without definable scintillations are located outside of the aimed scintillation area covering observations #1 to #6.
Figure 2 shows the RO scintillation observations #1 and #4 with more information, including the limb-viewing L1-band signal-noise-ratio (SNR) amplitude profiles at both the occulting and calibrating sides, the resulting undersampling
S4 profiles, and the retrieved
Ne profile. We note that the L2-band signals are much weaker and thus do not have enough sensitivity to derive reliable
S4 values to be shown in this paper. On the other hand, the derived
S4 values are from “undersampling” measurements because
S4 values become saturated and completed when a sampling spatial scale is less than the FFZ, but otherwise,
S4 values could be underestimated at undersampling conditions [
17]. The FFZ is defined by
where
λ is the radio wavelength and
L is the distance from the irregularity position, which is assumed to be the tangent point position along a limb-viewing GPS/GLONASS-LEO ray, to an LEO satellite position in this study. For those tangent-point altitudes from 400 to 200 km, the FFZ scale sizes for the L1-band signals are between 516 and 643 m. Therefore, the Fresnel frequency can be obtained via
where
v is the relative radio-scanning speed to the ionosphere. The derived Fresnel frequency is thus approximately 2.1 (2.6) Hz at 400 (200) km altitude for a frozen ionosphere. We note that the upward drift velocity of plasma irregularities is usually less than 50 m/s [
4], which is much lower than the vertical component (~2 km/s) of LEO satellite velocity at F-region altitudes and can be ignored to estimate the corresponding Fresnel frequency. We conclude that the sampling rate of FS7/COSMIC2 RO observations on the ionosphere is 1 Hz and less than the possible Fresnel frequencies of plasma irregularities, and thus the derived
S4 values should be underestimated at undersampling conditions.
As shown in
Figure 2, strong and moderate fluctuations occur in the L1-band SNR amplitudes of observations #1 and #4, respectively, from the occulting-side observations but not from the calibrating-side observations. It indicates that the amplitude fluctuations are induced by the ionospheric irregularities, which are located along the limb-viewing links between the occultation points and their conjugate points, as shown in
Figure 1. We note that the strong amplitude fluctuations, i.e., large undersampling
S4 values, as well as the
Ne fluctuations from observation #1, were distributed over a wider altitude region up to the LEO orbiting altitude than those from observation #4, and the peak scintillations and
Ne irregularities happened around the F-layer electron density peaks. This is consistent with the observations from the theoretic descriptions in the Introduction section.
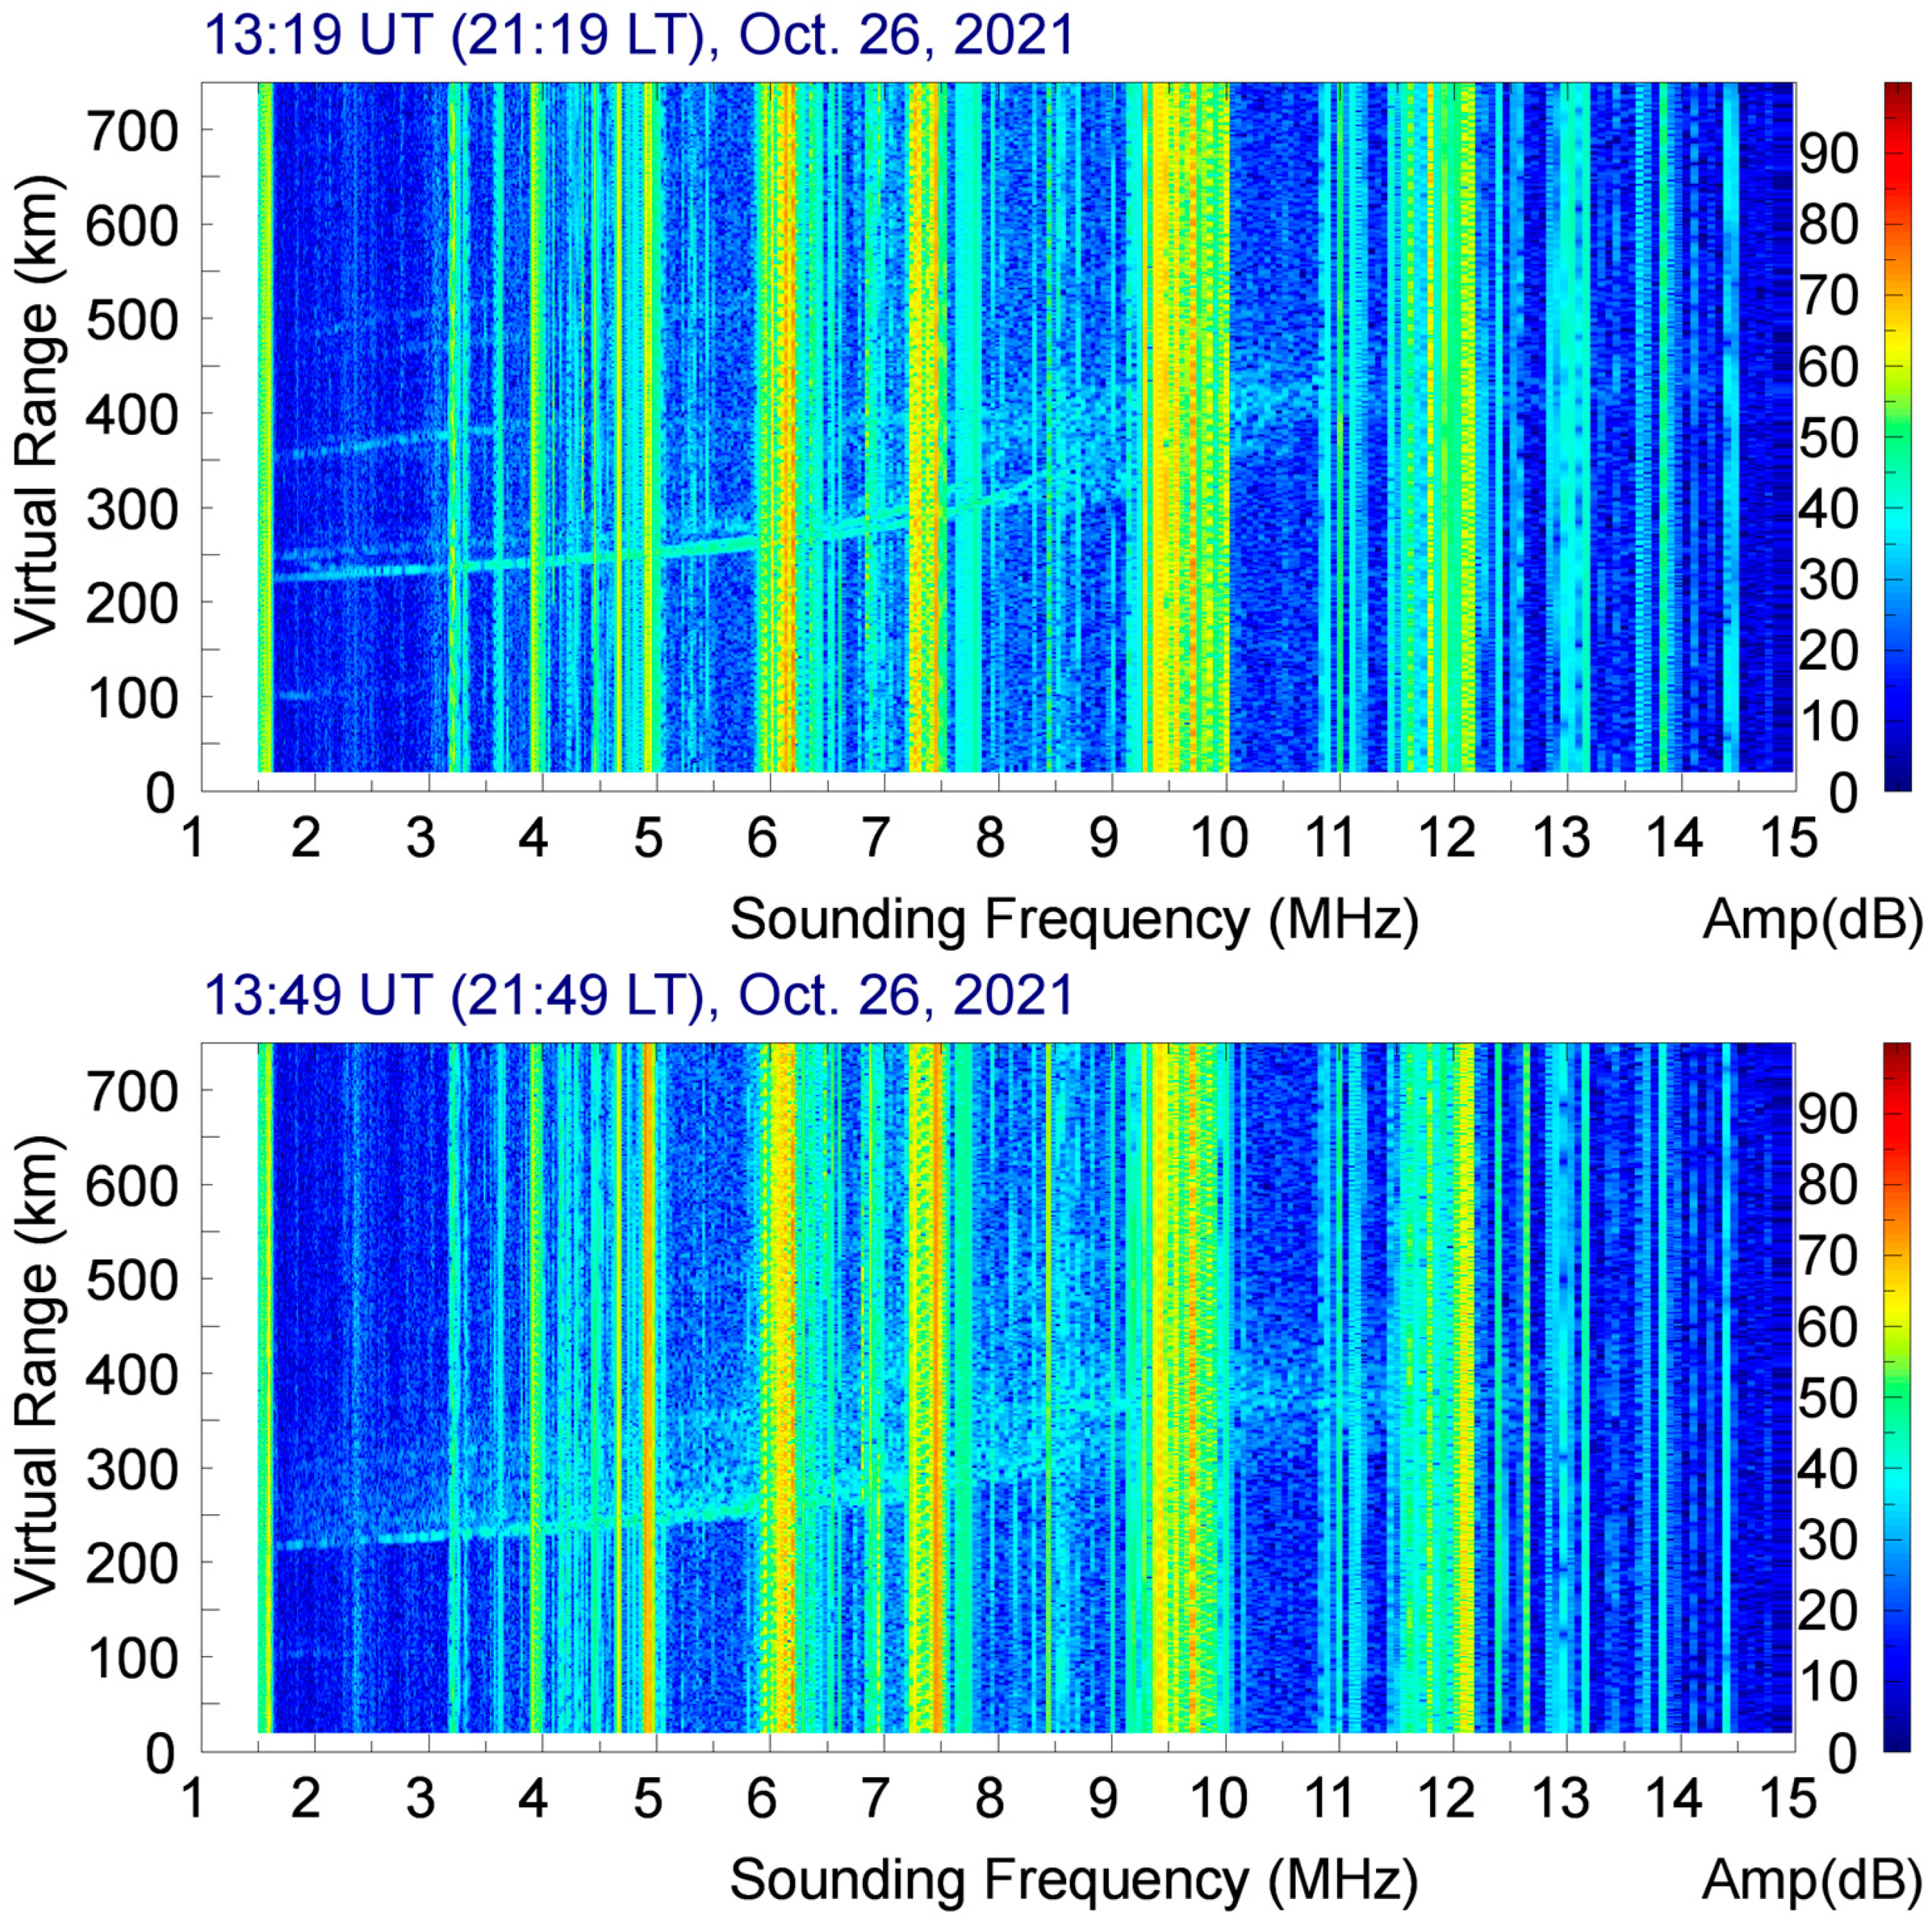
Equatorial spread-F (ESF) features usually accompany equatorial plasma bubbles and have been observed by numerous authors using ionosonde. In this study, we operated the Hualien VIPIR, a modern ionosonde, and observed spread-F features from the ionograms recorded between 13:19~15:04 UT, i.e., 21:19~23:04 LT, on 26 October 2021. The observed ESF event lasted for approximately one hour and forty-five minutes. In
Figure 3, the upper ionogram shows two traces of one-hop F-layer echoes, where the upper trace is weaker than the main trace and has higher altitudes with approximately 25 km differences at the start (13:19 UT) of the ESF event. Furthermore, the lower ionogram shows a weak range spread-F, which was recorded during the middle (13:49 UT) of the ESF event. We note that the spread-F frequencies ranged from ~1.7 MHz up to 11.5 MHz, which presents the top frequency of ordinary ionospheric echoes, i.e.,
foI. It is usually difficult to retrieve a critical plasma frequency
foF2 from ionograms with ESF, but not difficult to retrieve
foI. Multi-trace echoes could be interpreted as being due to the large-scale plasma depletion that happened before an ESF event. Meanwhile, the range-type spread-F indicates the existence of small-scale irregularities on the whole bottom side ionosphere.
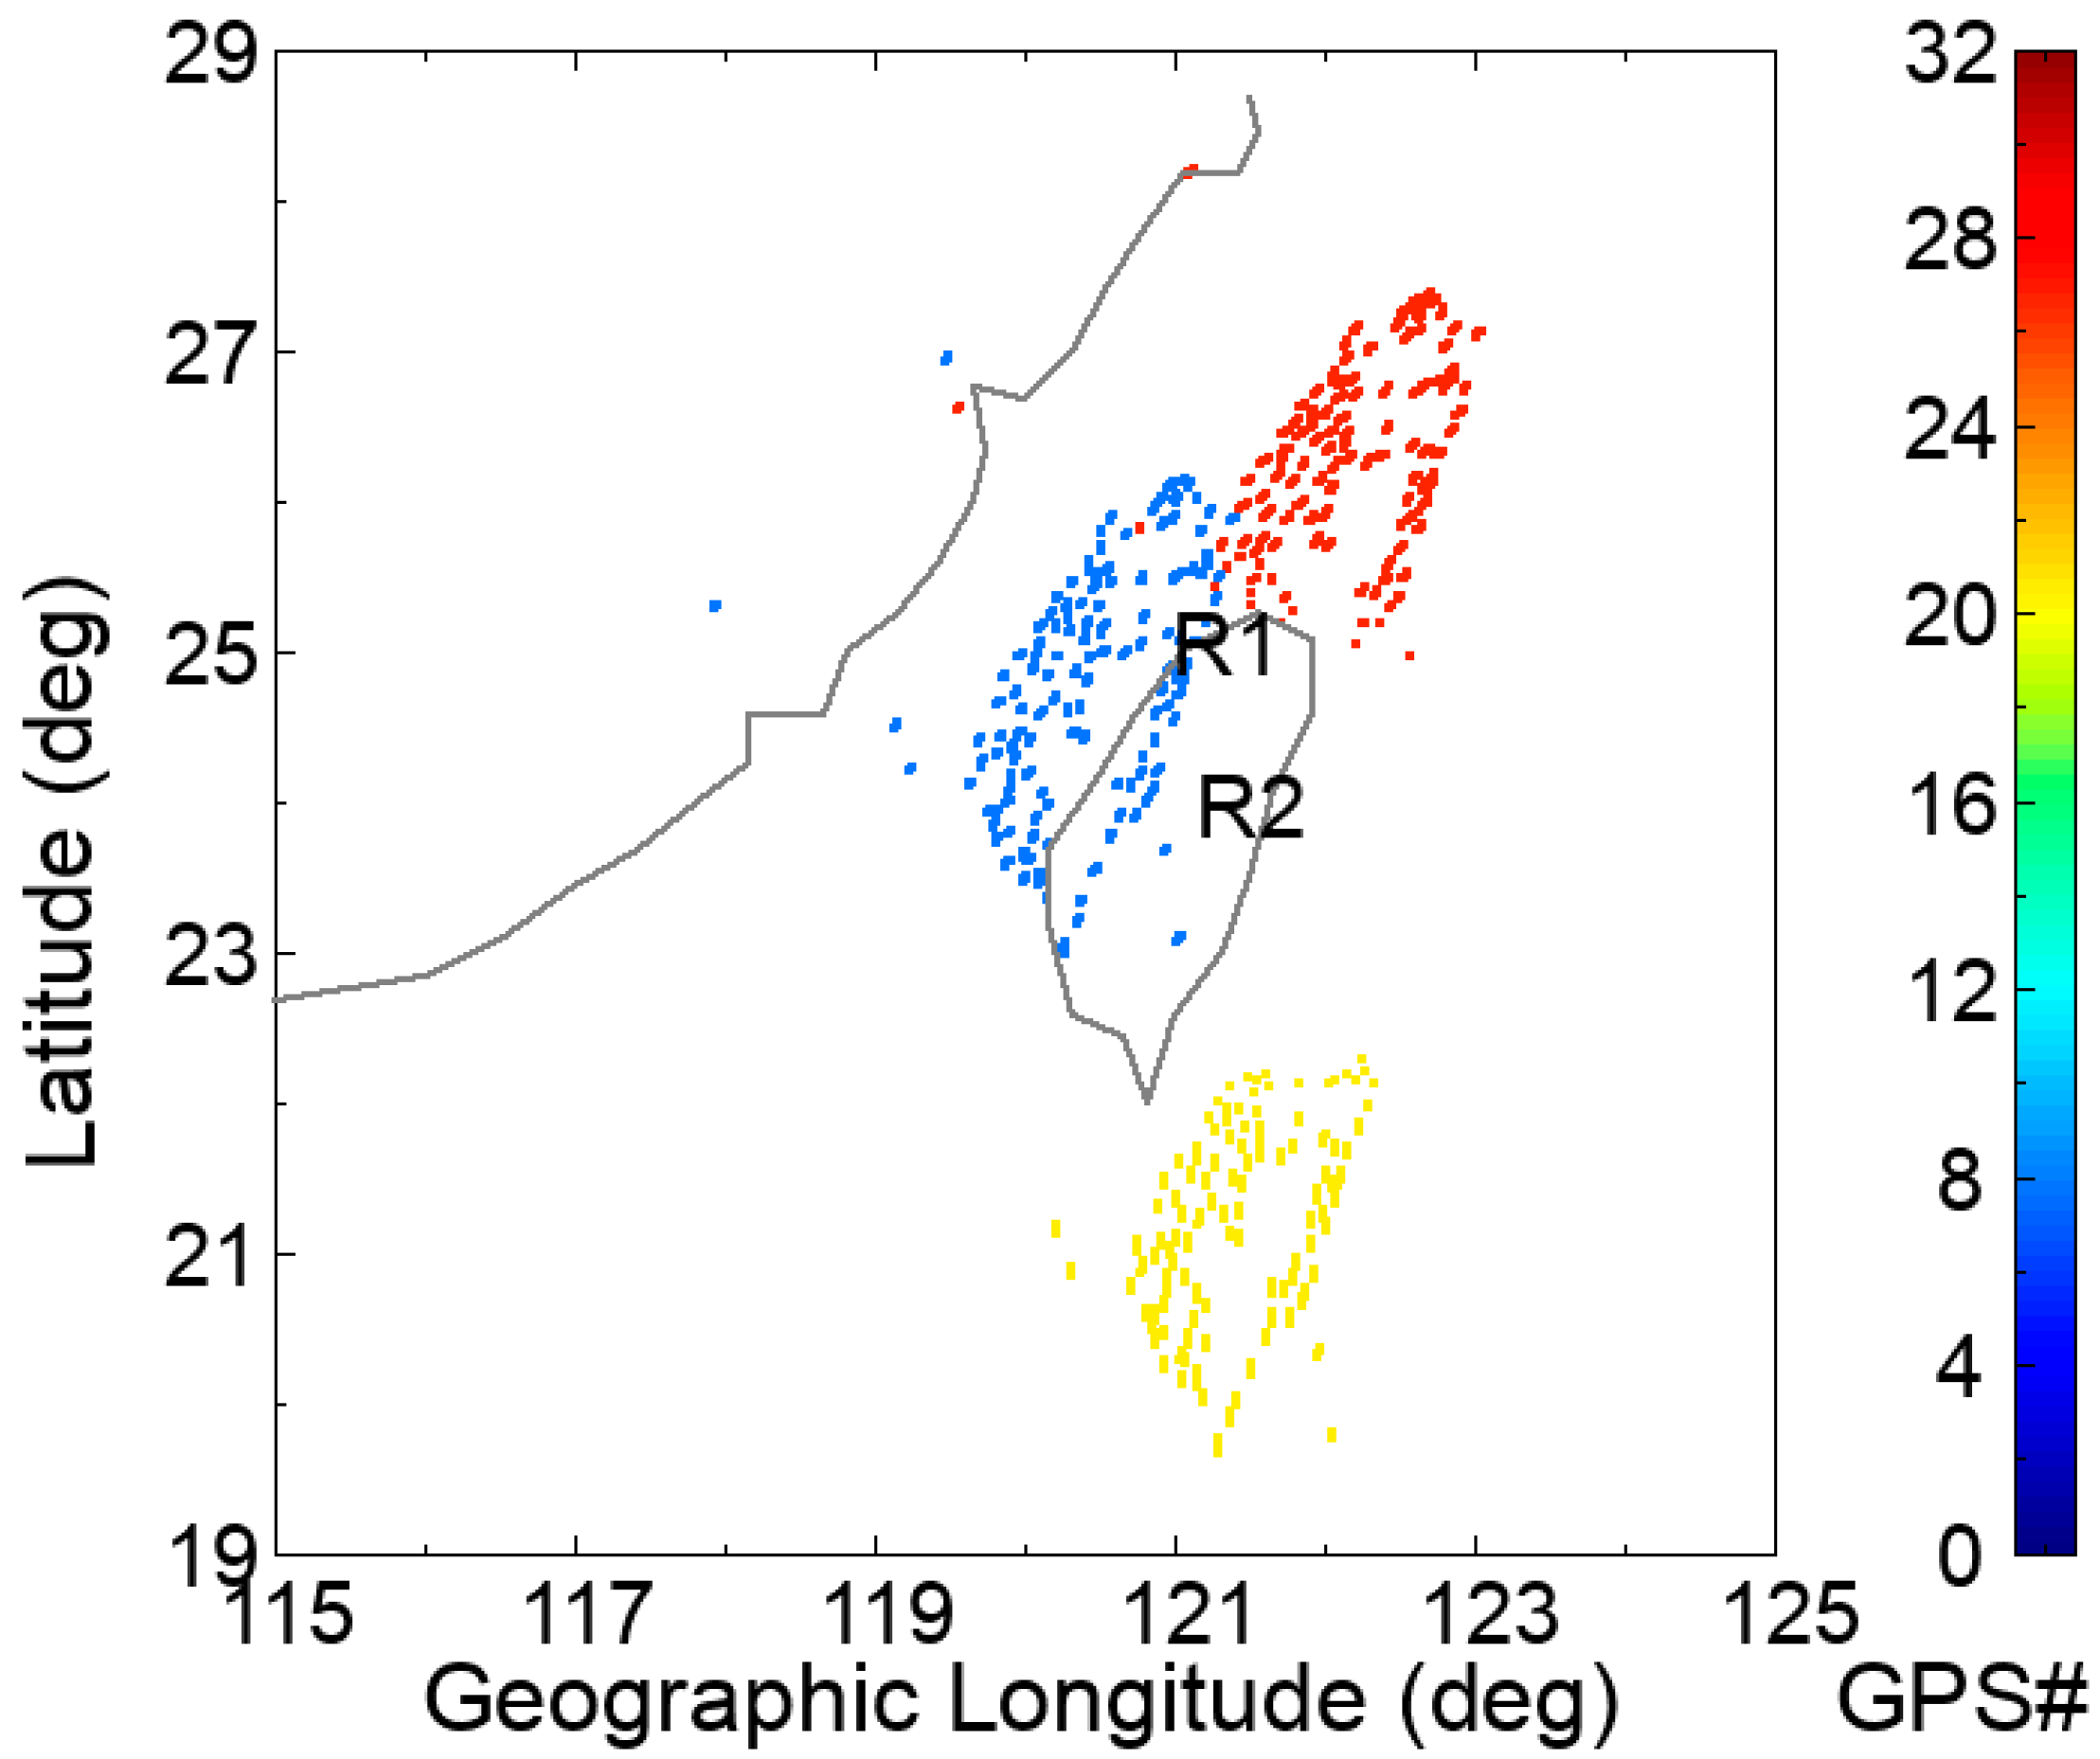
Figure 4 shows the geographical geometry of the ionospheric pierce points (IPP) of the simultaneous GPS signal measurements at 14:42 UT on 26 October 2021, using the CWB GPS receiving network. The IPP altitudes were designed to be 300 km in accordance with the statistical peak scintillation or irregularity altitude retrieved from the FS7/COSMIC2 limb-viewing
S4 and/or
Ne profiles, as shown in
Figure 2. Furthermore, the IPPs were obtained at and limited by a minimum elevation angle of 45° from receivers to avoid multi-path signals. In this study, we define the vertical scintillation index
VS4 as the vertical component of the normalized variance of the signal power intensity
I as follows:
where
θ is the line-of-sight elevation angle from the receiver. We calculate
VS4 values by applying (1) and a 30-s duration window to 1-Hz L1-band signal amplitudes from the CWB GPS data archives. We note that the use of
VS4 to represent a vertical scintillation index is based on an assumption in which irregular
Ne distribution is a function of altitude only along a transionospheric radio path. However, equatorial plasma bubbles are plume-like structures from low altitudes [
4], and the shapes of bubbles are extended vertically upward and also stretched in the north-south direction along the magnetic field lines. Ref. [
20] shows that GPS RO observations with high
S4 values are much more likely to occur when the ray paths are distributed in certain bubbles and more nearly aligned with the magnetic field. The details of two-dimensional and even three-dimensional irregular
Ne structures should be figured out in future studies. Meanwhile, we can assume the observing irregularities located at altitudes around 300 km to be the IPP altitude, and the corresponding FFZ scale sizes (
DF) of L1-band signals are between 239 and 275 m for elevation angles from 90° to 45°. We note that GPS satellites have orbiting velocities of approximately 3.9 km/s, and thus the corresponding IPP velocity is ~60 (80) meter/s at an elevation angle of 90° (45°) from the receiver. If we assume a frozen ionosphere, the resulting Fresnel frequencies
fF are between 0.18 and 0.2 Hz. Ref. [
11] shows that, using extensive incoherent scatter radar observations from Jicamarca, the daytime westward drifts are significantly smaller than the nighttime eastward drifts, and during solar maximum, the maximum nighttime eastward velocity increases up to about 160 m/s. Even if we include a 160 m/s IPP trace component of plasma irregularity drift velocity, the resulting Fresnel frequencies
fF are approximately 0.66 Hz and are also lower than the 1-Hz sampling rate for the CWB GPS receivers. This means that the derived
S4 values from the CWB GPS data are at complete conditions. As a result,
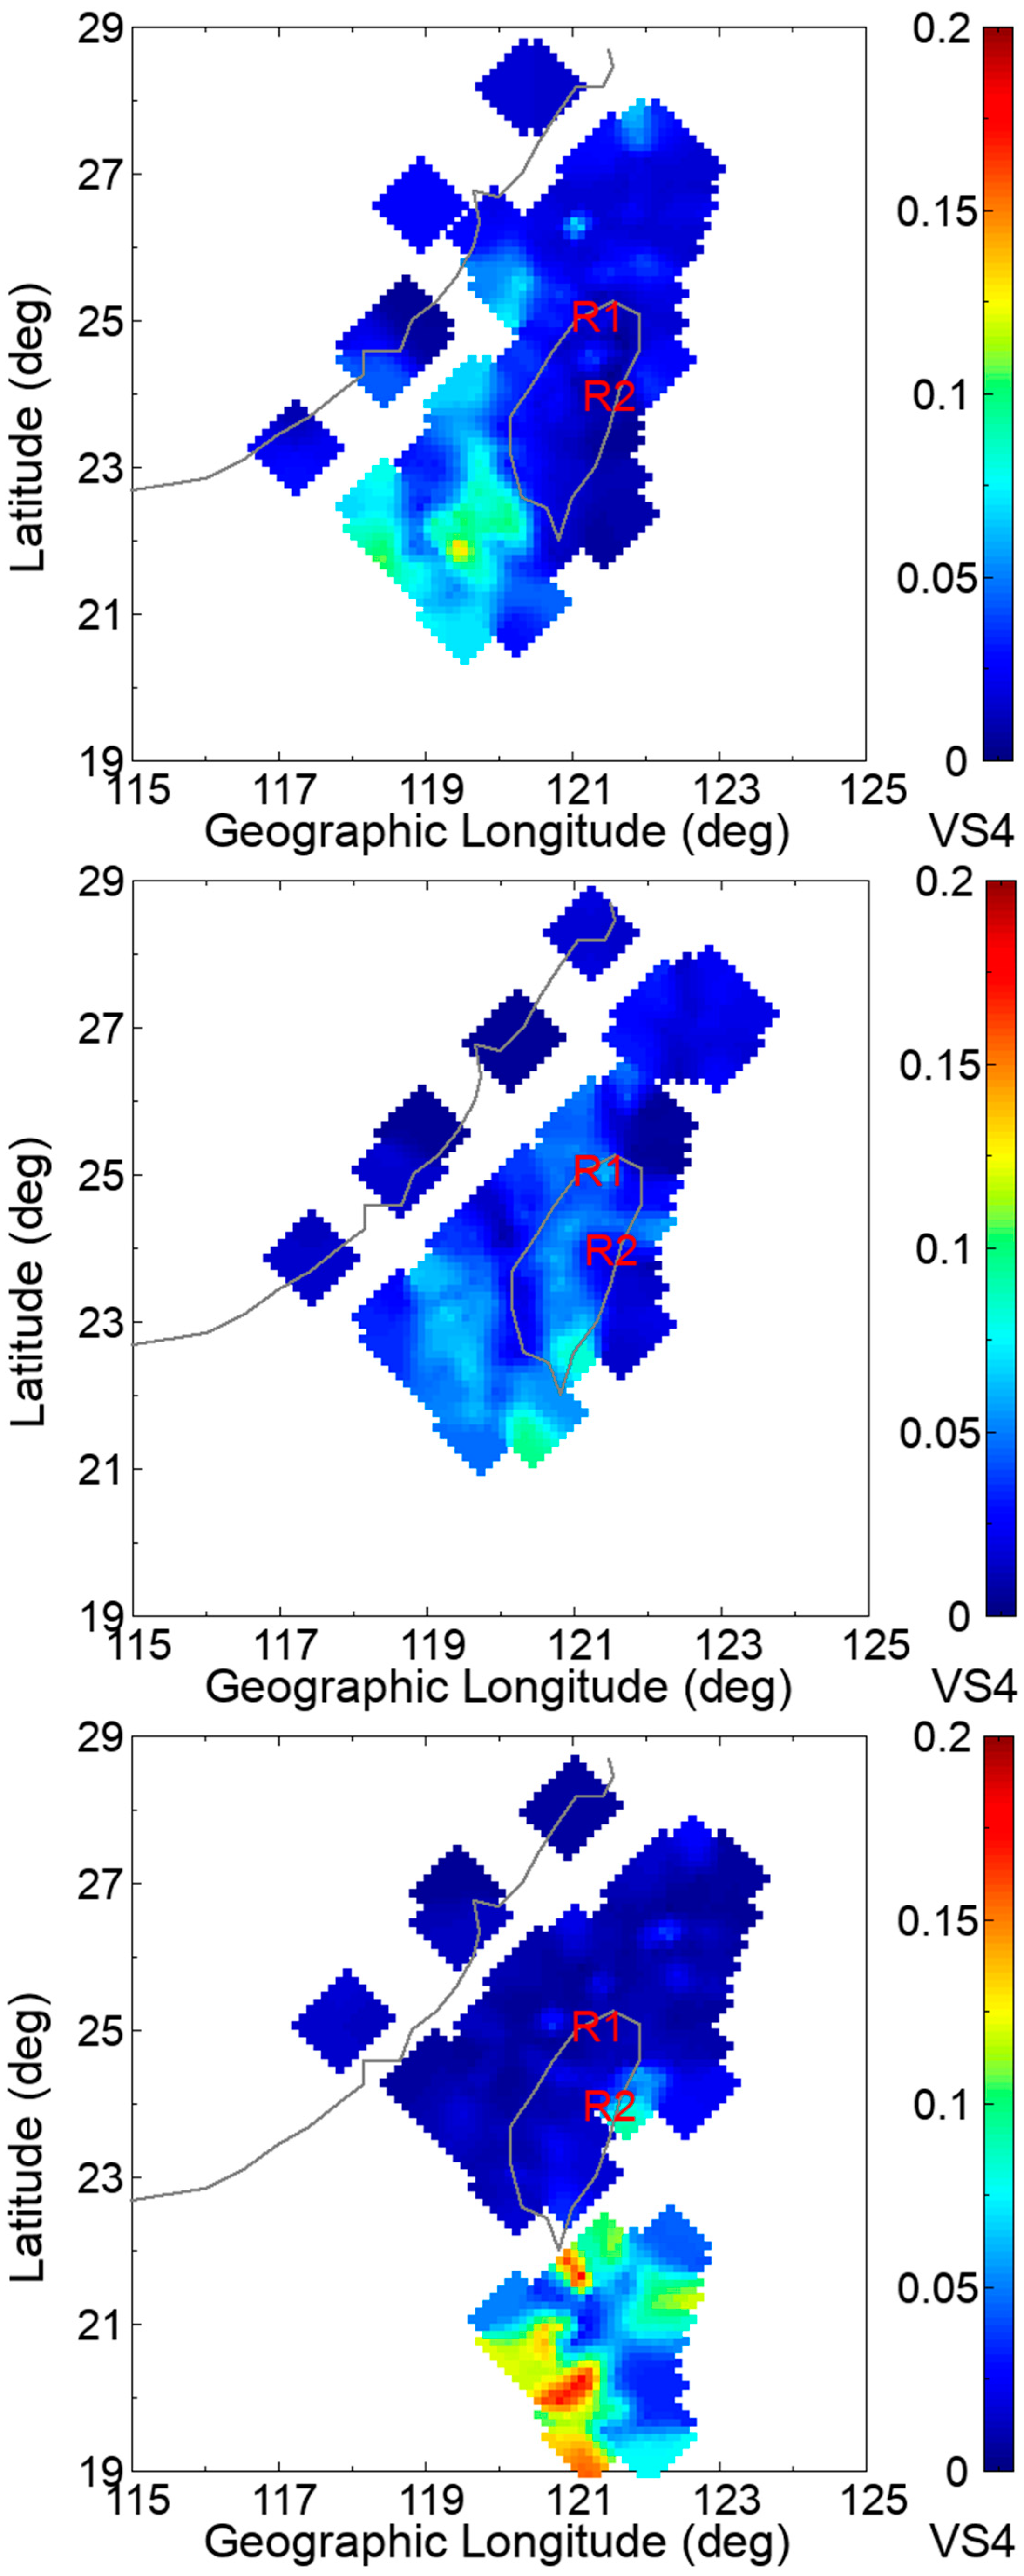
Figure 5 shows three developed structures on a two-dimensional
VS4 map taken at 13:24, 13:49, and 14:42 UT, which are approximately at the start, middle, and end of the scintillation and ESF event. Referring to
Figure 4 and the bottom panel of
Figure 5 based on the same CWB GPS data at 14:42 UT, we derive a two-dimensional extended
VS4 map deduced through relaxation by applying the red-black smoothing technique [
21] on point-distributed
VS4 measurements. We execute one pass through the mesh updating the “red” cells (like the red squares of a checkerboard) and another pass updating the “black” cells (like the black squares) and so forth for two loops. It produces two more cell extents on derived
VS4 maps where the cell (latitudinal or longitudinal) resolution is 0.1°, determined approximately by the medium distance between neighboring GPS stations.
It is now generally accepted that radio scintillation caused by ionospheric plasma irregularities can be characterized by fitting a power-law function with the spectral index
p to the derived signal spectrum [
2,
22,
23,
24]. According to the scintillation theory and power spectra analyses [
2,
25], the intensity spectrum of weak and moderate scintillations and power-law ionospheric irregularities should have more or less a flat portion at low frequencies and start to roll off around the Fresnel frequency in the form
f1−p, where
p is defined as the spectral index and is near 4 in the irregularity power-law relationship. Furthermore, the higher the spectral index, the stronger the scintillation intensity and the smaller the irregularity scale.
As described in the last section, we also operate two high-sampling, software-defined GPS receivers located at Chungli and Hualien, Taiwan separately to simultaneously receive GPS signals. The locations of the Chungli and Hualien software-defined GPS receivers are shown in
Figure 4 and
Figure 5 and labeled by “R1” and “R2”, respectively. In this study, L1-band C/A code signal amplitudes were recorded at a sampling rate of 50 Hz and for a 70-s duration every five minutes. We obtain three L1-band signal scintillation patches recorded by the Chungli software-defined GPS receiver at different data segments, which are from 13:29 to 13:44 UT, 14:29 to 14:49 UT, and 13:44 to 14:19 UT on 26 October 2021, for GPS satellites #8, #21, and #27 signal observations, respectively. The derived
VS4 values are consistent with CWB GPS observation results and are from 0.19 to 0.25, 0.16 to 0.22, and 0.14 to 0.19 for GPS satellites #8, #21, and #27 signal measurements, respectively.
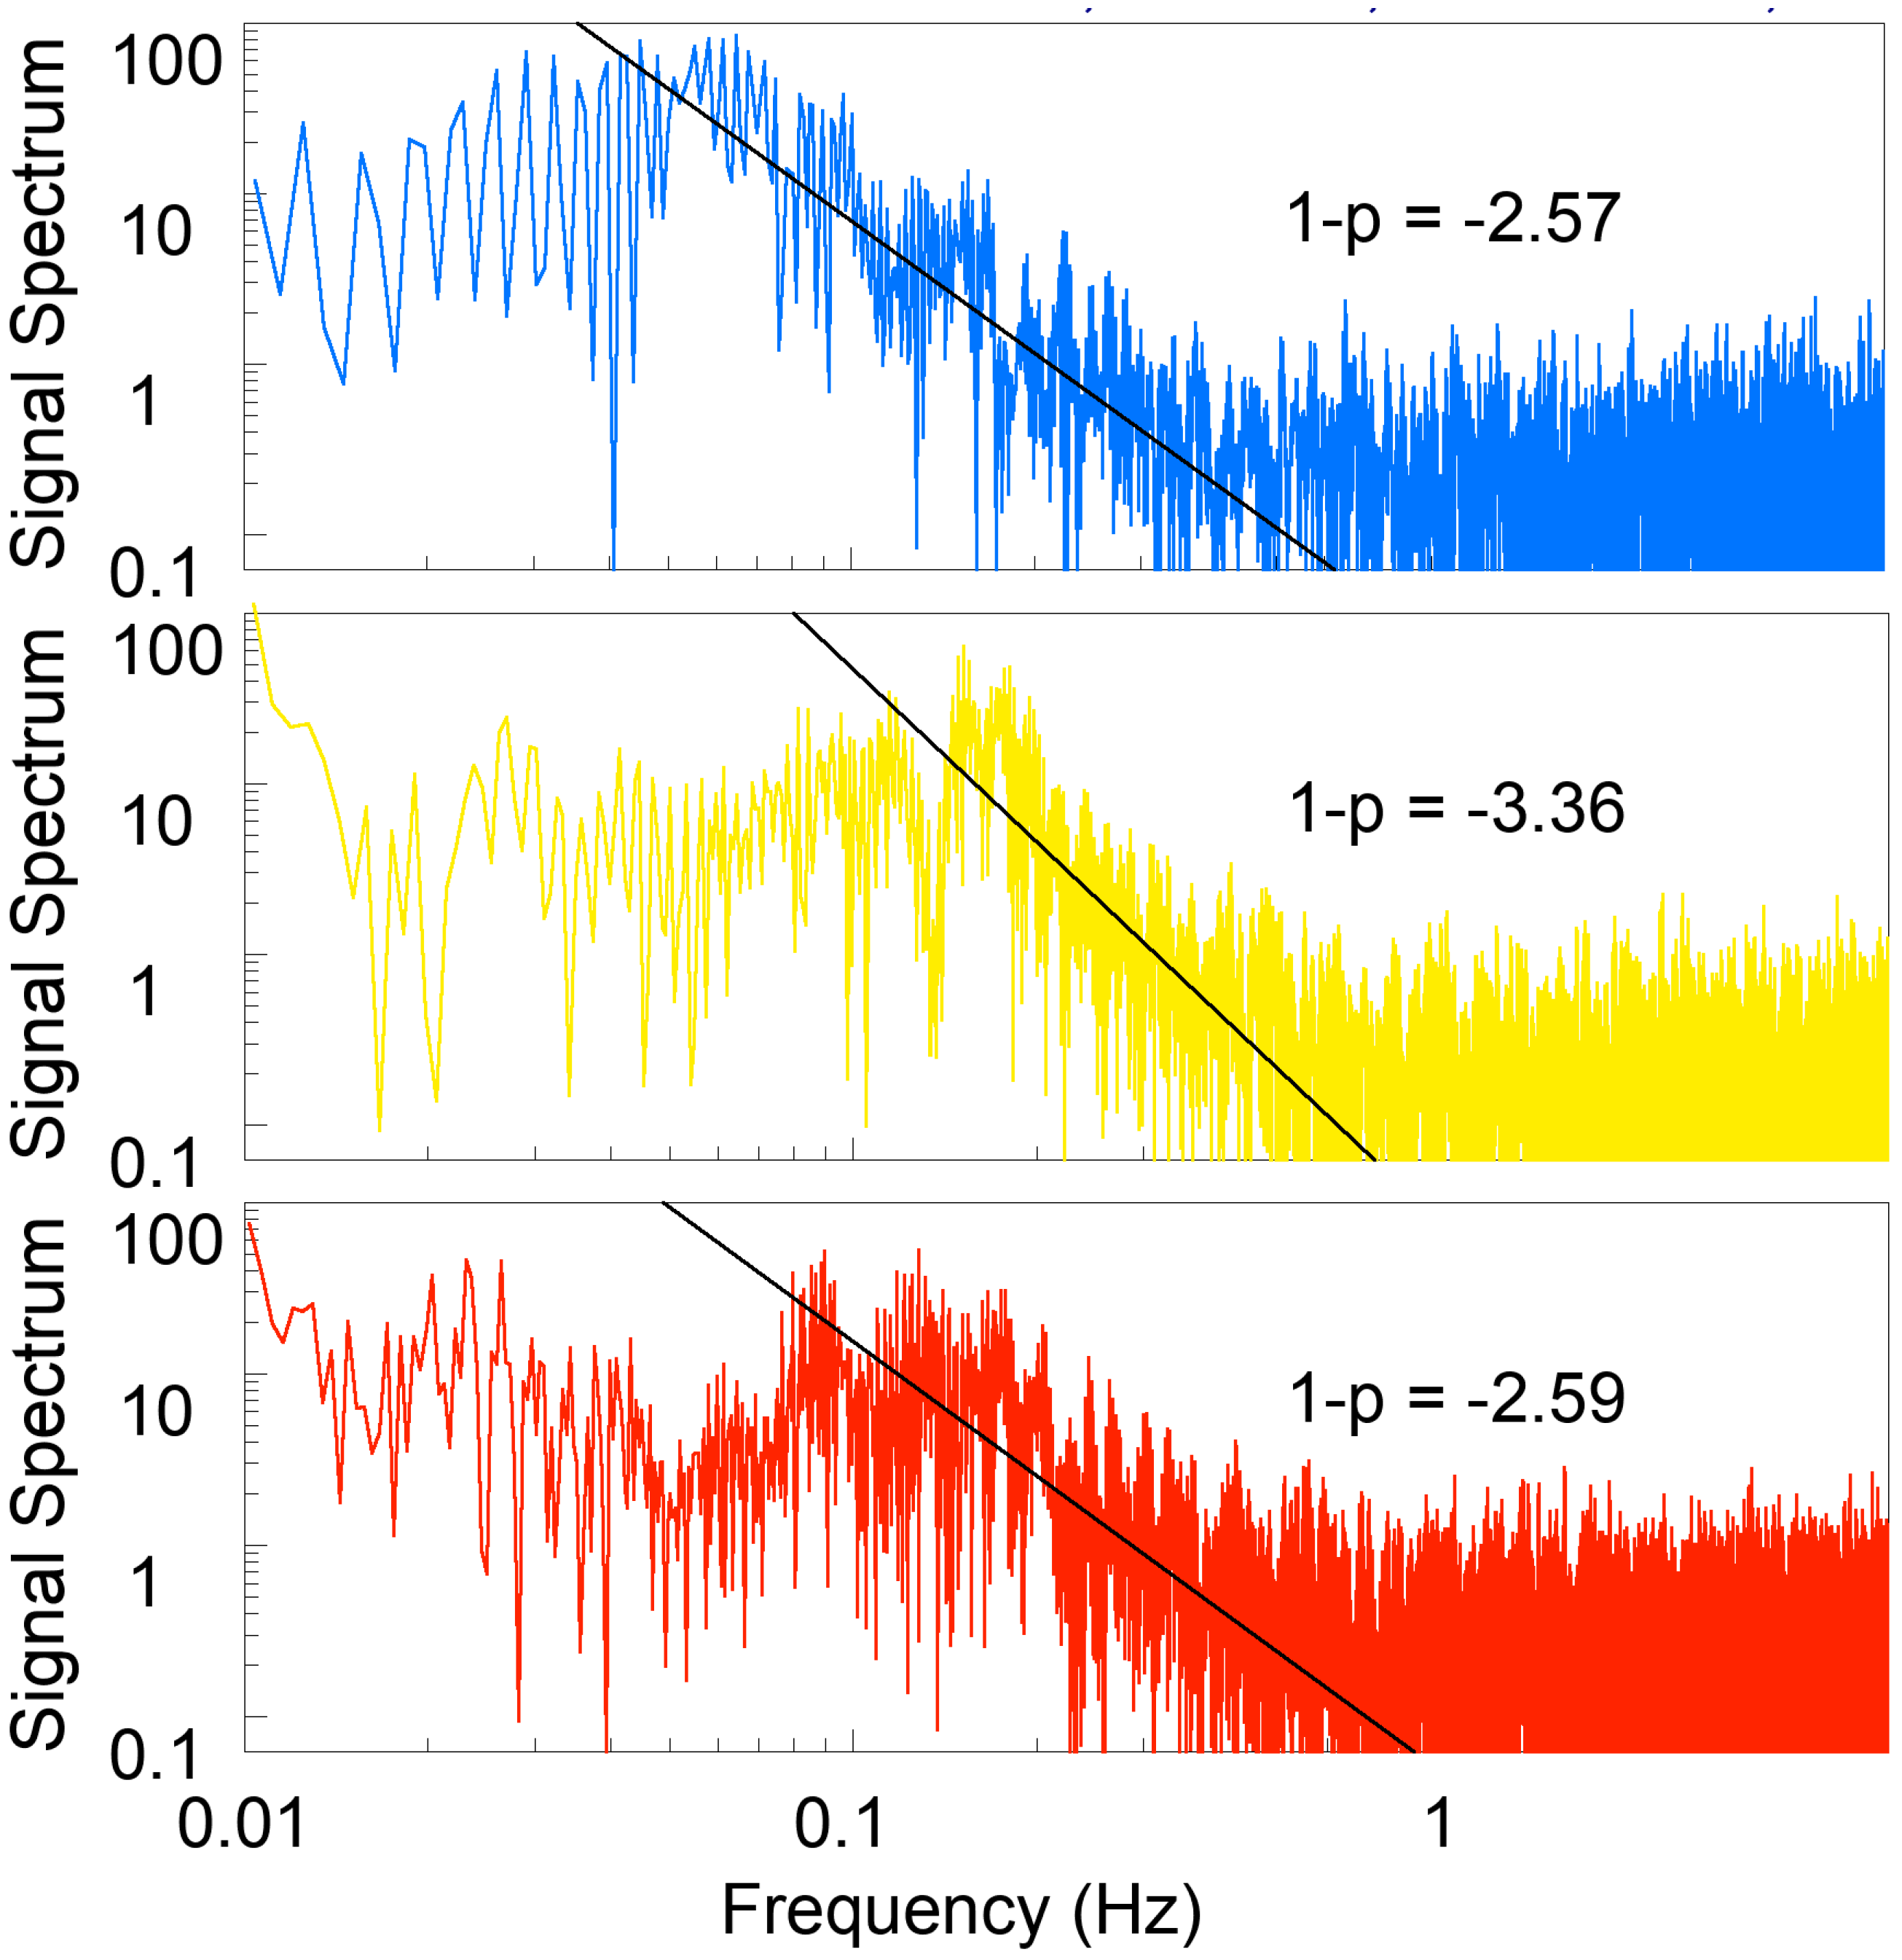
Figure 6 shows the corresponding signal spectrums obtained via a Lomb periodogram algorithm [
21]. We note that above approximately 1 Hz, the power spectral densities (PSD) are near the noise level where the minimum frequency of the noise level is defined as the deviation frequency of the signal intensity spectrum [
26,
27]. The 50-Hz sampling rate is approximately one order higher than the derived deviation frequency. Below 1 Hz, the PSDs are more or less a flat portion at low frequencies and decay from their maxima at a break frequency of
fB toward the noise level in an approximately linear fashion on the log-log scale shown. This indicates and confirms a power-law variation
f1−p of the plasma irregularity PSD with the frequency as discussed. We note that the spectrum break frequencies of
fB can be treated as the experimental Fresnel frequencies and are approximately 0.07, 0.15, and 0.12 Hz, and the derived spectral index
p values are 3.57, 4.36, and 3.59 for the L1-band signal scintillation patches from GPS satellites #8, #21, and #27, respectively. Comparing with the corresponding IPP positions shown in
Figure 4 and the derived
VS4 maps shown in
Figure 5, we note that the area with a higher spectral index
p has a stronger scintillation intensity. The spectrum analysis results of the L1-band signal scintillation patches recorded by the Hualien software-defined GPS receiver are similar to those from the Chungli system and are not shown in this study.
4. Discussion
As mentioned in the Introduction section, at the times near and/or soon after sunset, an enhanced eastward electric field, i.e., PRE, causes the F-layer to move upward and develop plasma depletions, triggering the Rayleigh–Taylor instability. As a result, the plasma bubbles develop from the bottom side, and the instabilities cause ionospheric irregularities and radio signal scintillations and intrude into the higher altitudinal and latitudinal ionosphere.
In this study, a multi-station and multi-instrument system is organized and proposed for ionospheric scintillation and ESF specification in the Taiwan–Philippines sector. The FS7/COSMIC2 program can provide more than 5000 GPS/GLONASS RO observations per day within the region between the geographic latitudes of ±40°, i.e., approximately seven RO observations per hour in the Taiwan–Philippines sector (between 20° ± 15°N and 120° ± 15°E geographic coordinates). From the FS7/COSMIC2 RO measurements on 26 October 2021, the observed or retrieved limb-viewing SNR,
S4, and
Ne profiles have been used to identify an ionospheric irregularity and scintillation event that happened from 13:30 to 15:00 UT, i.e., from 21:30 to 23:00 LT in Taiwan, and at magnetic quiet conditions. The results also show that the
Ne irregularities and limb-viewing radio intensity scintillations are stronger and distributed into higher altitudes at the southernmost part of the Taiwan–Philippines sector, i.e., near the geomagnetic equator, compared to those near the sector center (geomagnetic latitude ~10°N). Furthermore, as shown in the right panel of
Figure 2, the scintillation altitudes of the RO observation #4 and even observations #5 and #6 were distributed at an altitude range of ~100 km only and around the F-layer
Ne peaks. This could indicate that the irregularities at higher latitudes are the latitudinal mapping-out facts from lower latitudes, and that there are stronger irregularities around F-layer peaks because of greater conductivities.
More evidence of the longitudinal extent of plasma irregularities is also shown by the two-dimensional
VS4 maps derived from the CWB GPS data archive. As shown in
Figure 5, the significant scintillation event that happened on 26 October 2021, was also observed by the CWB GPS receiving network. The series of
VS4 maps shows plasma irregularities distributed with a stronger intensity at lower latitudes and when moving eastward. This indicates that the FS7/COSMIC2 could provide ionospheric irregularity and scintillation observations scanning in different limb-viewing, i.e., near-vertical, directions, and more than one hundred and thirty ground-based GPS receivers operated by the CWB could do it in horizontal directions.
We note that the ground-based CWB GPS signal observations have a sampling rate of 1 Hz, which is higher than the possible maximum Fresnel frequencies fF of approximately 0.66 Hz and can thus complete the scintillation index S4 determination. However, the 1-Hz sampling rate is not enough for irregularity spectral index determination, which needs the rate to be approximately one order larger than its Fresnel frequency. In practice, spectrum analyses applied to the high-sampling, software-defined GPS receiver measurements conform to a power-law variation f1−p of plasma irregularity PSD with frequency. Meanwhile, the derived spectrum break frequencies fB are more or less 0.1 Hz, which are all less than the corresponding Fresnel frequencies fF of approximately 0.2 Hz for a frozen ionosphere. This indicates that the targeted plasma irregularities moved northward too and had positive velocity components along the IPP-tracing directions to decrease the relative radio-scanning speed and the experimental Fresnel frequencies obtained by the derived fB values. In sum, integrating the observations from the FS7/COSMIC2, the CWB GPS receiving network, and two software-defined GPS receivers located in Taiwan, the experimental results show that the targeted plasma irregularities moved eastward and northward. Furthermore, the smaller the irregularity scale, the higher the spectral index and the stronger the scintillation intensity at lower latitudes on the aimed irregularity feature.
As described, ESF features usually accompany equatorial plasma bubbles and can also be observed and scaled from ionograms, as shown in
Figure 2.
Figure 7 shows the time variations of the virtual ranges of ionospheric echoes at different sounding frequencies
fs of 1.72, 3.08, 4.72, 5.65, and 7.15 MHz from the Hualien ionograms recorded on 26 October 2021.
Figure 7 also shows the corresponding temporal profile of scaled
foI, which is approximately equal to
foF2 without spread-F and/or sporadic E features but higher than
foF2 with spread-F features. We note that the sunset time of the day was approximately 18:30 LT, i.e., 10:30 UT, at Hualien, Taiwan, and at a 300 km altitude. As shown in
Figure 7, the spread-F features happened and were observed between 13:19~15:04 UT, i.e., 21:19~23:04 LT. Furthermore, after 15:04 UT, i.e., the end of the ESF event, the
foI (
foF2) values decreased, and the virtual heights of the fixed-frequency ionospheric echoes increased as usual facts of nighttime ionograms. Before 13:19 UT, i.e., the start of the ESF event, the
foI (
foF2) values show more or less a flat portion, but the virtual heights of fixed-frequency ionospheric echoes decreased except for those at a sounding frequency of 1.72 MHz, which are actually one-hop and two-hop sporadic E echoes and thus almost invariant in virtual heights. This indicates that after sunset and before the ESF event, the peak ionospheric
Ne values were approximately the same but the ionospheric
Ne values at the bottom side ionosphere were increased. This could be due to a strong PRE, i.e., eastward electric field enhancement that happened near or after sunset on the day and produced an equatorial fountain effect. As a result, the equatorial ionosphere moved upward, developed steep density gradients and large-scale plasma depletions in the bottom side F-region and became unstable, triggering the R–T instability. Meanwhile, ionospheric plasma moved out along the geomagnetic field line and from the magnetic equator to higher latitudes. In this study, such an equatorial fountain effect was not strong enough to increase the peak
Nes and
foF2s but was strong enough to increase the
Nes at the bottom side ionosphere in the low-latitude region, e.g., the Taiwan area. We found that a post-sunset decrement of the virtual heights of fixed-frequency ionospheric echoes could be a good precursor for post-sunset scintillation and ESF events.

