Article

Hospitalization Due to Fire-Induced Pollution in the Brazilian Legal Amazon from 2005 to 2018

by
Wesley Augusto Campanharo
1,*,
Thiago Morello
2,
Maria A. M. Christofoletti
3 and
Liana O. Anderson
4
1
National Institute for Space Research (INPE), Remote Sensing Division, Av. Dos Astronautas 1758, São José dos Campos 12.227-010, SP, Brazil
2
Center for Engineering, Modeling and Applied Social Sciences, Federal University of ABC (UFABC), Alameda da Universidade, Bairro Anchieta, São Bernardo do Campo 09.606-045, SP, Brazil
3
Joint Research Centre (JRC), Via Fermi 2749, 21027 Ispra, VA, Italy
4
National Center for Monitoring and Early Warning of Natural Disasters (Cemaden), Parque Tecnológico, Rua Dr. Altino Bondensan, 500, São José dos Campos 12.247-016, SP, Brazil
*
Author to whom correspondence should be addressed.
Remote Sens. 2022, 14(1), 69; https://doi.org/10.3390/rs14010069
Submission received: 31 October 2021 / Revised: 13 December 2021 / Accepted: 15 December 2021 / Published: 24 December 2021

Abstract

:
Fire is widely used in the Amazon as a ubiquitous driver of land management and land cover change. Regardless of their purpose, fires release a considerable amount of pollutants into the atmosphere, with severe consequences for human health. This paper adds to the extant literature by measuring the causal effect of fires on hospitalizations, using the approach of instrumental variables, whose validity is assessed with multiple statistical tests. A wide range of confounders are added as covariates, seizing on the accuracy enhancement potential of a broad and fine-grained dataset that covers 14 years of the whole Amazon territory at a municipal–monthly level. The results reveal a positive effect of fire on hospitalizations due to respiratory illnesses in general, and particularly in those due to asthma. A 1% increase in pollution concentration would increase hospitalizations by 0.14% at a municipality–monthly level. A total of 5% of respiratory hospitalizations were estimated to be attributable to fire-induced pollution, corresponding to 822 cases per month. The analysis demonstrates that the coupling of econometrics and remote sensing data is a promising avenue towards the assessment of impacts caused by fires, which may be applied to other regions of the world subjected to anthropogenic fires.

1. Introduction

Biomass burning in agriculture is a global source of air pollution and, consequently, of morbimortality. The practice, which is more frequently reported in developing countries—such as China, India, and Brazil [1], but also Indonesia [2]—has been evidenced as a source of respiratory illnesses and related hospitalizations [2,3,4,5,6,7]. In addition to the impairment of health and eventual premature mortality [8], already overloaded national healthcare systems are subjected to higher pressure.
The Amazon biome is the region with the highest frequency of point fire detections in Brazil [9]. Historically, fires have been set as part of the process of deforestation, and also to manage fallow vegetation and pasture, but they may also run out of control and cause forest fires [10]. In addition to the fact that these events in the Amazon are mainly driven by humans, they are also boosted by climate extremes, such as the anomalous temperatures and droughts [11,12] that have become severer and more frequent in recent years (e.g., 1997/98, 2005, 2010, 2015/16).
These fire events release a massive load of pollutants into the atmosphere. However, the smoke is usually composed of primary pollutants—such as particulate matter (PM), carbon monoxide (CO), nitrogen oxides ( NO x ), and non-methane organic compounds (NMOCs)—along with some precursors of secondary pollutants, such ozone (O3) and other secondary organic aerosols (SOAs) [13]. When in contact with the human respiratory system, these components can cause several negative consequences for health. For instance, exposure to CO2 can induce shortness of breath, cough, and fatigue, and can also lead to convulsions, coma, and death depending on its concentration [14].
Since the process that connects pollution and health is a result of spontaneous social and atmospheric forces, and not a consequence of a controlled experiment randomly assigning pollution levels to locations, the available data for analysis are observational. Thus, the observable variations in health levels—for instance, in the form of increased hospitalizations—are not only due to the variation in pollution levels, but both may occur synchronously and at the same place because, for instance, in the dry season, when fires are set, roads become more suitable for travelling and, thus, transporting household members who have become ill due to the lower temperature of the wet season. In this case, the econometric approach of quasi-experimental identification is useful, because under reasonable assumptions and after considering the variation of key variables, it manages to retrieve the random portion of pollution variation. One particularly useful technique is that of instrumental variables (IVs). An instrument variable is a proxy used to substitute the explanatory variable in the main model. Such a variable needs to preserve the cause–effect context and the nature of the relationships between the explanatory and the response variables. In addition, the IV must satisfy two statistical criteria: (1) it must be exogenous—that is, uncorrelated with the error term of the structural equation—and (2) it must be partially correlated with the endogenous explanatory variable [15]; IVs were used elsewhere to identify the effects of pollution on health [7,16,17]. This approach is also applied here for the specific case of the Brazilian Amazon from 2001 to 2020.
It should be highlighted that, in this article, fire is used as an instrumental variable to support the identification of the effect of pollution on hospitalizations, exploring the positive relationship that fire and pollution generally exhibit [7,17,18], and yielding the additional benefit of quantifying fire’s contribution to hospitalizations [17]. The latter was assessed both statistically, with results from the first-stage regression, and numerically, as the fraction of hospitalizations attributable to fires. In addition to fire, and in accordance with the findings of Deryugina et al. [16] and Sheldon and Sankaran [7], wind speed and wind direction were used as additional instrumental variables.
The knowledge available in the extant literature on the health consequences of pollution in general—and especially of fire-induced pollution in the Amazon—is significantly expanded in this paper by addressing two key gaps: The first is the failure to apply an identification strategy, which biases the available estimates of fire-induced pollution on health (this applies, for instance, to the findings of Do Carmo et al. [3], Smith et al. [19], and Machado Silva et al. [20]). Secondly, studies that cover the whole Amazon across long periods are rare, with most evidence circumscribed to particular Amazonian states and even smaller subregions, and generally to particularly fire-critical periods ranging from one to a few years (as in the case of De Mendonça et al. [21], Carmo et al. [22], Jacobson et al. [23], and Machado-Silva et al. [20]).
We used a dataset at a municipal–monthly level from 2005 to 2018, covering 805 Brazilian municipalities and totalizing 118,335 observations. The comprehensive character of our effort is also demonstrated by the 4 combinations among the 3 instrumental variables that were considered, the 4 classes of respiratory illness and 3 age groups examined, and the 12 covariates included. Our estimates suggest a positive effect of fire on hospitalization due to respiratory illnesses in general, and due to asthma in particular. Considering the total range of respiratory illnesses, a 1% increase in the fire count of the average municipality–month would raise the hospitalization count by 0.14%—an effect that could be higher in the fire season (August to October).

2. Materials and Methods

2.1. Study Area

The study area comprises the Brazilian Legal Amazon (BLA), which covers approximately 5 million km2 and includes the states of Acre, Amapá, Amazonas, Mato Grosso, Rondônia, Roraima, Tocantins, Pará, and a subset of Maranhão’s municipalities over the 44th Meridian [24] (Figure 1, red contour). This area represents ~59% of the Brazilian territory [25], totalizing 805 municipalities.

2.2. Data

The variables considered may be classified into three categories: instrumental variables (IVs) and the main explanatory variable (ExpV), dependent variables (DpVs), and control variables (CrVs) (Table 1). Such categories are suggested by the data analysis approach of two-stage least squares regressions, which estimate the effect of the main explanatory variable (pollution; ExpV) on health dependent variables (DpVs). For this, (1) other relevant predictors were added as control variables (CrVs), and (2) instrumental variables (fire and wind; IVs) were explored as a means of effect identification. Therefore, variables’ categories were strictly due to their roles (or positions) in the regression models. Detailing only the less common factors, mortality of infants and mortality due to the four most deadly chronic diseases in Brazil were used to proxy populations’ health levels (in accordance with Aquino et al. [26] and Harris and Kohn [27]). Health professionals, hospital beds, and facilities were sued to proxy the supply of healthcare. Other sources of pollution were proxied by urban zones, road density, and vehicle fleets.

2.2.1. Instrumental Variable Data

It is useful to clarify that an instrumental variable (IV) is understood first of all a strategy of identification—that is, a procedure that enables the estimation of a parameter capturing the specific effect of a particular explanatory variable (ExpV) on the target dependent variable (DpV) [15]. In addition, and relatedly, an IV is needed because, due to the observational nature of data, an ExpV is assigned to locations in a way that is not random, but rather correlated with omitted unobservable predictors; thus, its effect is not identified and, consequently, not measurable as a standard regression coefficient. In short, an IV is any variable correlated with the ExpV and not correlated with the DpV through any other causal path besides the one mediated by the ExpV [15].
We used the MCD64A1-v6 Burned Area data product of the Moderate-Resolution Imaging Spectroradiometer (MODIS) of the Terra and Aqua satellites, collected using the R package “MODIStsp” [28]. The MCD64A1 has a monthly periodicity, spatial resolution of 500 m, and data starting from November 2000. This product uses an association of surface reflectance with active fires, along with an algorithm that checks the temporal changes in the vegetation index [29]. Globally, it presents 99.7% overall accuracy, with 40.2% commission error and 72.6% omission error [30]. In the Amazon region, it shows a great similarity to regional and supervision-based products, underestimating 2.9% of the total burned area, but detecting more fires in the northern and northwestern areas than in the southwest [31].
For thermal anomalies, we used collection 6 of the product MYD14A1 from Aqua MODIS, available on the BDQueimadas website [32]. This product presents active fires with date and quality indices at a global scale, reproducing them at 1 km spatial resolution [33]. This product is considered a “reference satellite” to the Progama Queimadas of the INPE, and it is the basis for comparisons and trend analysis for the whole Brazilian territory.
It is helpful to clarify how the two fire products are used in this paper. Given the influence of cloud cover on the availability of burned area measurements [31,34,35], the robustness of results generated with such data were subjected to an assessment with thermal anomalies, which are cloud-free, in the place of burned area in the econometric analysis (as reported in Section 3.4). Nevertheless, there was no municipal–monthly observation for which missing burned area values at a finer level (for instance, at cell–grid–day) were numerous enough to prevent calculation of burned area at the observational unit level (what was due both to the monthly timescale of the dataset and to Brazilian Amazon municipalities being large, at 6300 km2 on average).
The wind data were obtained using the ERA5 monthly aggregate product, which combines model data with observations across the world, providing a global monthly product with 0.25 degrees of spatial resolution [36]. This product provides the U and V components of the wind, which we converted into wind speed and direction using the “rWind” package [37].

2.2.2. Explanatory Variable

Pollutant information was introduced by the land aerosol optical depth (AOD), gathered by the MCD19A2 version 6 data product, and reported in the blue band (0.47 μm). This product is a daily MODIS Terra and Aqua combined multi-angle implementation of atmospheric correction (MAIAC) at 1 km spatial resolution [38].
The measures of AOD reflect the sum of aerosols from natural and anthropogenic sources, such as emission from industries, vehicles, water vapor, dust, and burned biomass [39]. The product presents a high overall correlation with the ground measurements (≅95%) over South America, and is better over the forest, savannah, grassland, and cropland areas [40]. Moreover, the AOD has been widely used to estimate highly dangerous pollutants for the human respiratory system, such as particulate matter (PM), with considerable accuracy [41,42].
Even with AOD being only one dimension of the atmospheric pollution process engendered by biomass burning, previous studies have demonstrated its correlation with pollutants such as PM2.5 [18], carbon monoxide [43], and sulfur dioxide [44], which also play important roles with regards to impacts on human health. We also clarify that measurements of pollutants’ concentrations were not available at the whole-Amazon level for the period of analysis

2.2.3. Dependent Variables

Hospitalization counts were retrieved from TabNet [45], which is a governmental platform maintained by the informatics department of the Brazilian Health System (“Departamento de Informações do SUS”, DataSUS). We collected three respiratory morbidities (hospitalization code following the International Classification of Disease (ICD) number 10, where diseases of the respiratory system are those between J00 and J99) that are commonly accounted for in the literature as indicators of fire pollution impact: asthma (ICD10: J45–J46), pneumonia (ICD-10: J12–J18), and bronchitis (ICD-10: J20–J21). The total hospitalization due to respiratory illnesses was also considered.
This information was filtered by municipality of residence and month of attendance. Due to the higher vulnerability of children and the elderly to pollution, hospitalizations of such age groups due to any respiratory illnesses were also counted separately, comprising small children (≤ 4 years old), children (between 5 and 14 years old), the elderly (≥ 65 years old), and all ages.

2.2.4. Control Variables

Estimated population data were collected from the DataSUS portal [45], which compiles the yearly estimates produced by IBGE, being compatible with the Brazilian legal provision. These data are available yearly for each Brazilian municipality from 1992 to 2019.
Gross domestic product (GDP) is provided by the IBGE [46], and it is released yearly by municipality, in both current and aggregated prices.
Mortality of infants and mortality due to chronic diseases were collected from the DataSUS portal, filtering by municipality of residence and month of attendance. Infant mortality refers to the death of fetuses and children under one year old. For chronic disease mortality, we considered four groups, in accordance with Malta et al. [47]: cardiovascular diseases (ICD-10: I00 to I99), cancer (ICD-10: C00 to C97), respiratory issues (ICD-10: J30 to J98), and diabetes (ICD-10: E10 to E14).
Data on health professionals, hospital beds, and facilities were also obtained from the DataSUS portal.
Weather information came from two different products: the temperature was acquired from MOD11A2, which provides an 8-day average of land surface temperature with a 1 km spatial resolution [48], while precipitation data came from CHIRPS (the Climate Hazards Group InfraRed Precipitation with Station data), which is a global rainfall dataset with 0.05° spatial resolution [49]. This product has a good performance both globally and locally, and particularly in the BLA, where its values explain 73% of the precipitation, with a root-mean-square error (RMSE) below 15 mm [50].
Regarding the proxies for other sources of pollution, road density was generated by extracting the road component from the total road network provided by OpenStreetMap [51], while the area of the municipalities was provided by the IBGE. The fleet of cars was found on the DENATRAN website [52], which provides the number of registered cars by month and by municipality for the whole of Brazil.
Lastly, urban density (km2/km2) was measured using the MapBiomas product. These land use and land cover data are available annually from 1985 to 2019, with 30 m spatial resolution, based on Landsat images and produced using pixel-based classification and machine learning [53,54].

2.3. Spatial Aggregation

Spatial variables (BA, TA, wind, AOD, temperature, precipitation, roads, and urban zones) were assembled with Google Earth Engine, and were clipped and aggregated at municipal–monthly level. Then, the exported tables were processed in the RStudio environment to merge all variables (spatially and non-spatially explicitly) into a single table compatible with the Stata 14.1 format.
It is worth mentioning that over 20 years of data, the municipalities’ boundaries experienced several legal updates, including the creation of new municipalities. To follow those changes, we used each annual current delimitation provided by the IBGE to perform each clip and aggregation.

2.4. Empirical Analysis

First, we present the main assumption grounding our data analysis, which is suggested by atmospheric science and epidemiological literature [18,22,55]. Once burnings of considerable size and number occur in a location, pollutants are released and transported through the atmosphere, causing considerable appearance or exacerbation of respiratory illnesses. This process is a function of many variables. Fire emissions are primarily affected by fuel type, the temperature of the fire, and climatic conditions [56]. In the atmosphere, fire pollution may be mixed with pollutants of vehicular or industrial sources, and is also affected by weather conditions [57]. Finally, the number of hospitalizations is influenced by the size of population, its health level and income, and the availability of healthcare facilities and staff [6,58].
With that in mind, to evaluate the impact of fire-induced pollution on health, we followed the methodology proposed in [7,16,17,59], which used the instrumental variable (IV) technique with wind as the exogenous source of variation that identifies the effects of endogenous pollution on respiratory morbidity; He et al. [17] and Sheldon and Sankaran [7] also adopted fire as a second instrument. The IV method is based on the two-stage least squares estimator (2SLS) that corresponds to Equations (1) and (2) below, with “i” indexing the spatial unit and “t” the time period:
LogAOD it = α 0 + IV it γ + α 2 CrV it + b i + ε it
LogHosp it = β 0 + β 1 LogAOD it + β 2 CrV it + c i + u it
L o g A O D i t is the logarithm of atmospheric optical depth; IV it is a set of instrumental variables; CrVit is the control variable vector; LogHospit is the logarithm of hospitalization count; Ɛit and uit are time-variant disturbance terms, and bi. and ci. are time-invariant disturbance terms. The Greek letters represent parameters to be estimated.
Regarding the IVit vector, three instrumental variables were employed: burned area (Ba) in logarithmic form (LogBA), wind direction (WDirec), and wind speed (WSpeed). These were combined, either in original form or as interactions (denoted with “*”), into four alternative sets of instrumental variables, all of which included LogBA separately. The first and most comprehensive set included the two interactions of burned area with the two wind measures (i.e., Ba * WSpeed, and Ba * WDirec). The second and third sets included only one of the possible fire–wind interactions (either Ba * WSpeed or Ba * WDirec). The fourth and least comprehensive set did not include any interactions (only LogBA). The last three sets were used as potential alternatives to estimation when the most comprehensive set was rejected in its validity by the overidentification test. In this way, the least comprehensive was the last possible alternative in case the two double-instrument sets were rejected.
Now, regarding the CrVit vector, the control variables captured factors influencing supply and demand for healthcare belonging to the following thematic classes:
  • Health level of the population, represented by infant mortality (Chd_d) [26,60] and chronic disease mortality (Crn_d);
  • Healthcare supply capacity, represented by the number of health professionals (Emp), number of hospital beds (Beds), and number of health facilities (Faci);
  • Sociodemographic factors, such as estimated population (Pop), gross domestic product (GDP), urban zones (Urb), road density (Road), and fleet of cars (Cars);
  • Weather, indicated here by the temperature (Temp) and rainfall (Precp).
These variables are crucial to estimate when they address weather and socioeconomic confounders that could bias the estimation of the causal effect of pollution on hospitalizations. If these variables were not included, they would be left to the disturbance term, thus potentially creating omitted variable bias [15].
The identification strategy was applied both to the whole count of hospitalizations and to counts associated with specific ages and illnesses. Confounders, whose influence is mitigated by the IV approach, may affect illness propensity in the form of viral, bacteriological, and environmental factors varying across illnesses [61,62]. Therefore, since distinct definitions of the dependent variable may be subject to distinct levels of influence from sources of illnesses not related to pollution, the performance of the identification strategy was more broadly assessed.
The estimation was carried out on the Stata program, with a balanced panel structure (at a monthly–municipal level) with fixed effects (state, year, and month) and a heteroscedasticity–autocorrelation “robust” variance–covariance matrix. To check whether the approach used was valid, the following testing sequence was adopted:
  • Generalized Hausman test for the null of consistency of the random-effects estimator (no omitted heterogeneity bias) against the alternative of consistency of the fixed-effects estimator only. Here, the “xtoverid” command developed by Schaffer and Stillman [63] was applied;
  • Pollution exogeneity test for the null that ordinary least squares (OLS) would yield consistent estimates over the IV estimates, i.e., pollution is exogenous. For this, the “dmexogxt” command from Baum and Stillman [64] was applied;
  • Sargan’s overidentification test for instrument validity which assumes validity under the null hypothesis that all instruments are valid, while rejection is interpreted as indicating that at least one of the instruments is not valid [65]. For this, the “xtoverid” command from Schaffer and Stillman [63] was used;
  • Tests for instrument weakness in the first stage, which were based on post-estimation procedures with robust covariance matrix:
    • Joint significance of the instruments (robust F-test), with the test statistic compared to the rule-of-thumb value of 10, as proposed by Staiger and Stock [66] and Shao and Stoecker [67];
    • Stock and Yogo’s IV weakness test, which presumes homoscedastic errors in the instruments, and its null hypothesis is that the instrument is weak. This is rejected whenever the “minimum eigenvalue statistic” [65] exceeds the “critical value” at a 10% level.
When exogeneity was not rejected in step 2, OLS estimation was applied. Conversely, IV estimation was pursued, for which all three instruments were initially used. Then, if such a set of instruments was not accepted in step 3, the list was reduced stepwise until no instrument was deemed invalid or only one instrument remained.

2.5. Simulation: Hospitalizations Attributable to Fires

The count of hospitalizations attributable to fires was estimated as H o s p i t ^ = β 1 ^ . γ 1 ^ . logBa it + β 1 ^ . γ 2 ^ . Ba it * W s p e e d it + β 1 ^ . γ 3 ^ . Ba it * W D i r e c it . The first component is the product of the estimated coefficients measuring the effect of fires on pollution ( α 1 ^ ) , and of pollution on total hospitalizations ( β 1 ^ ) and the observed value of fires. The two remaining components, in line with estimated econometric models, incorporate the effects of interactions between fires and wind speed and direction—the most comprehensive set of instrumental variables was used (due to the linearity of the econometric models, such coefficient products yield the same result as calculating the differences in predicted hospitalizations between the scenarios with observed fire levels and with the counterfactual null fire level. It is in this sense that hospitalizations attributable to fires are estimated). The results obtained at the level of the i-th municipality and t-th month were summed across the whole dataset and then divided by the sum of observed hospitalizations; the latter was also calculated for the whole dataset, which generated the estimate for the share of hospitalizations attributable to fires.

3. Results

3.1. Data Description

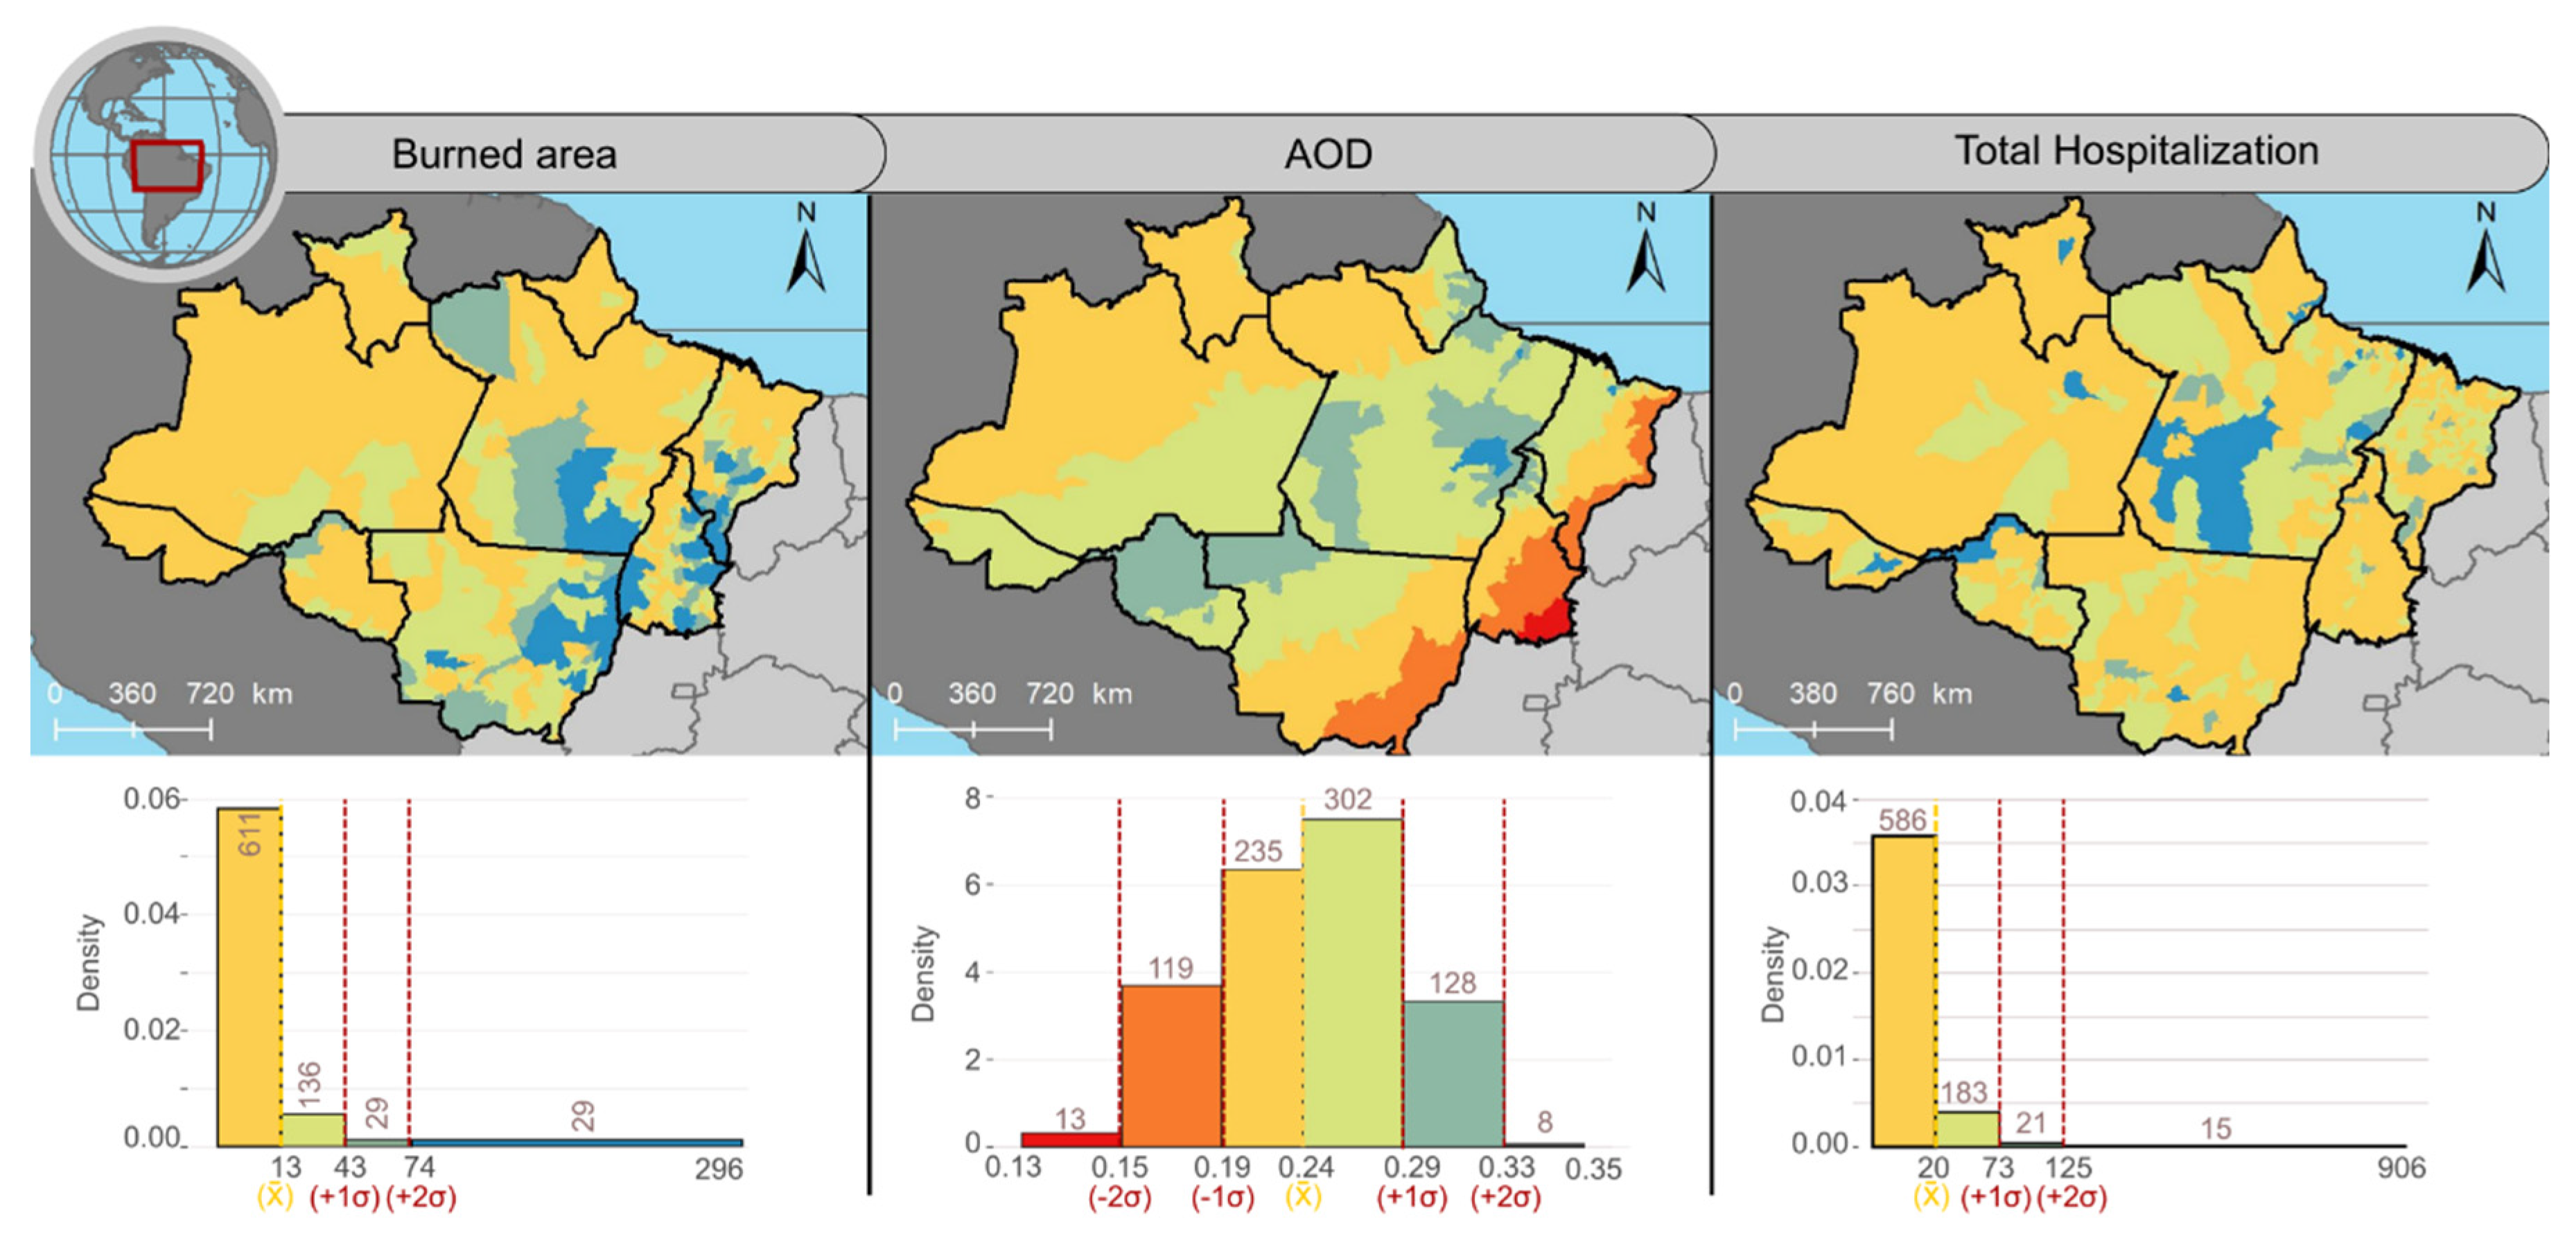
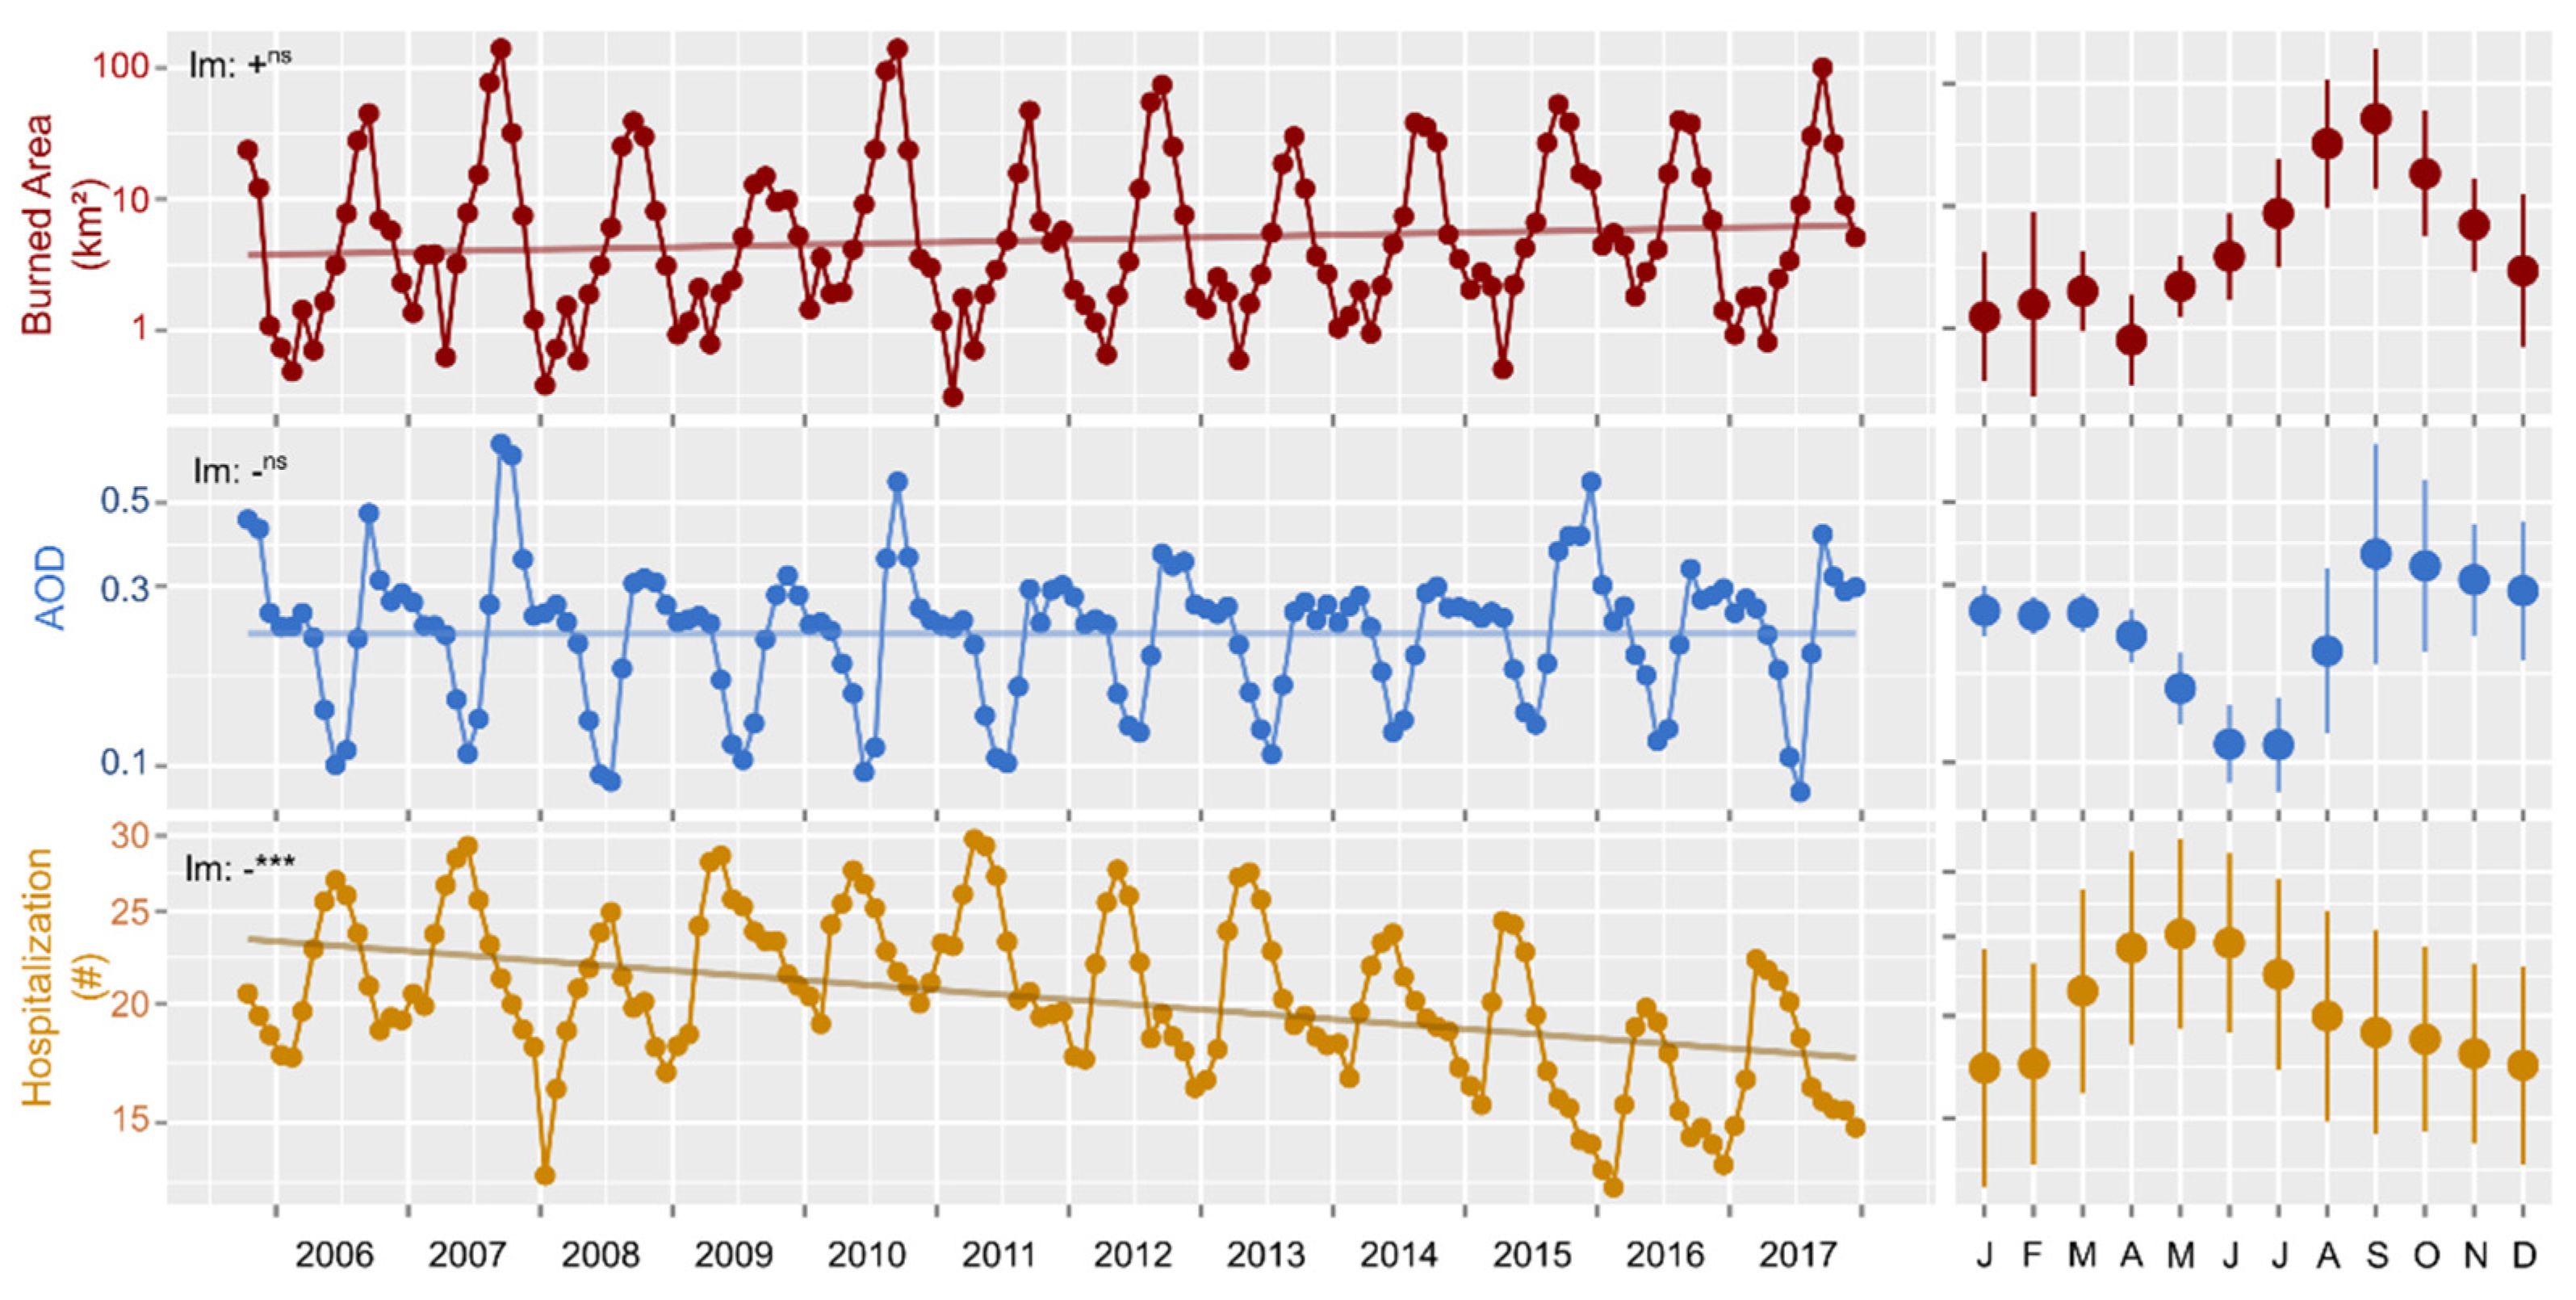
Despite having available data for the last two decades (2001–2020), not all variables were available for this whole period; therefore, the time window of analysis started in August 2005 and ended in December 2018. Descriptive statistics are shown in Table 2. For the main variables (burned area, AOD, and hospitalizations), graphical representations are presented in both the space (Figure 2) and time (Figure 3) dimensions.
The average burned area by municipality is ~13 km2 (±87 km2), and the highest values were found on the triple border of Mato Grosso–Tocantins–Pará and on the border between Tocantins and Maranhão. The empirical distribution is asymmetrical across the Amazon, with more municipalities with values below the time-series average (2005–2018). Among the 805 municipalities in the dataset, approximately 11.20% (90 ± 88) have a monthly burned area above the average, while 88.80% (715 ± 88) of them have values below. Of those municipalities with values below the average, approximately 75% (538 ± 163) have null values for burned area, but this feature varies throughout the year, reaching a maximum of 783 municipalities at the beginning of the year, and a minimum of 203 during the burning season.
On average, hospitalizations due to pneumonia (11.34) are more frequent than those for asthma (3.10) and bronchitis (0.73), with the illnesses’ shares being 55%, 15%, and 4%, respectively. Thus, the three illnesses together represent around 74% of all hospitalizations, while the other 26% are composed of other respiratory diseases such as pharyngitis, laryngitis, and flu. The distribution of hospitalizations for respiratory diseases follows an asymmetric pattern, where the 15 municipalities with the highest values (over two deviations) are mostly in the state of Pará.
From the age group perspective, the average monthly contribution of the small children group represents approximately 39% of the total, while children and the elderly represent 12% and 18%, respectively. Thus, the contribution of small children and the elderly, together, represents more than half of those hospitalized monthly for respiratory diseases, emphasizing once again the vulnerability of these groups.
The AOD values vary between 0.03 and 3.35, with an average of 0.24 for the region; their distribution follows a normal pattern, in which extreme values are found at the border of the BLA (less than two deviations) and in an area that extends from Rondônia to the northern border of Pará with Maranhão (more than two deviations).
The variation of the main variables over time (Figure 3) shows similar seasonal patterns for fire and AOD, but a different pattern for hospitalizations. This discrepancy is clear from the asynchronous peaks, with burned area having two distinct peaks—a smaller one at the beginning of the year (February–March) and another at the end (August–September)—while hospitalizations peak in May.
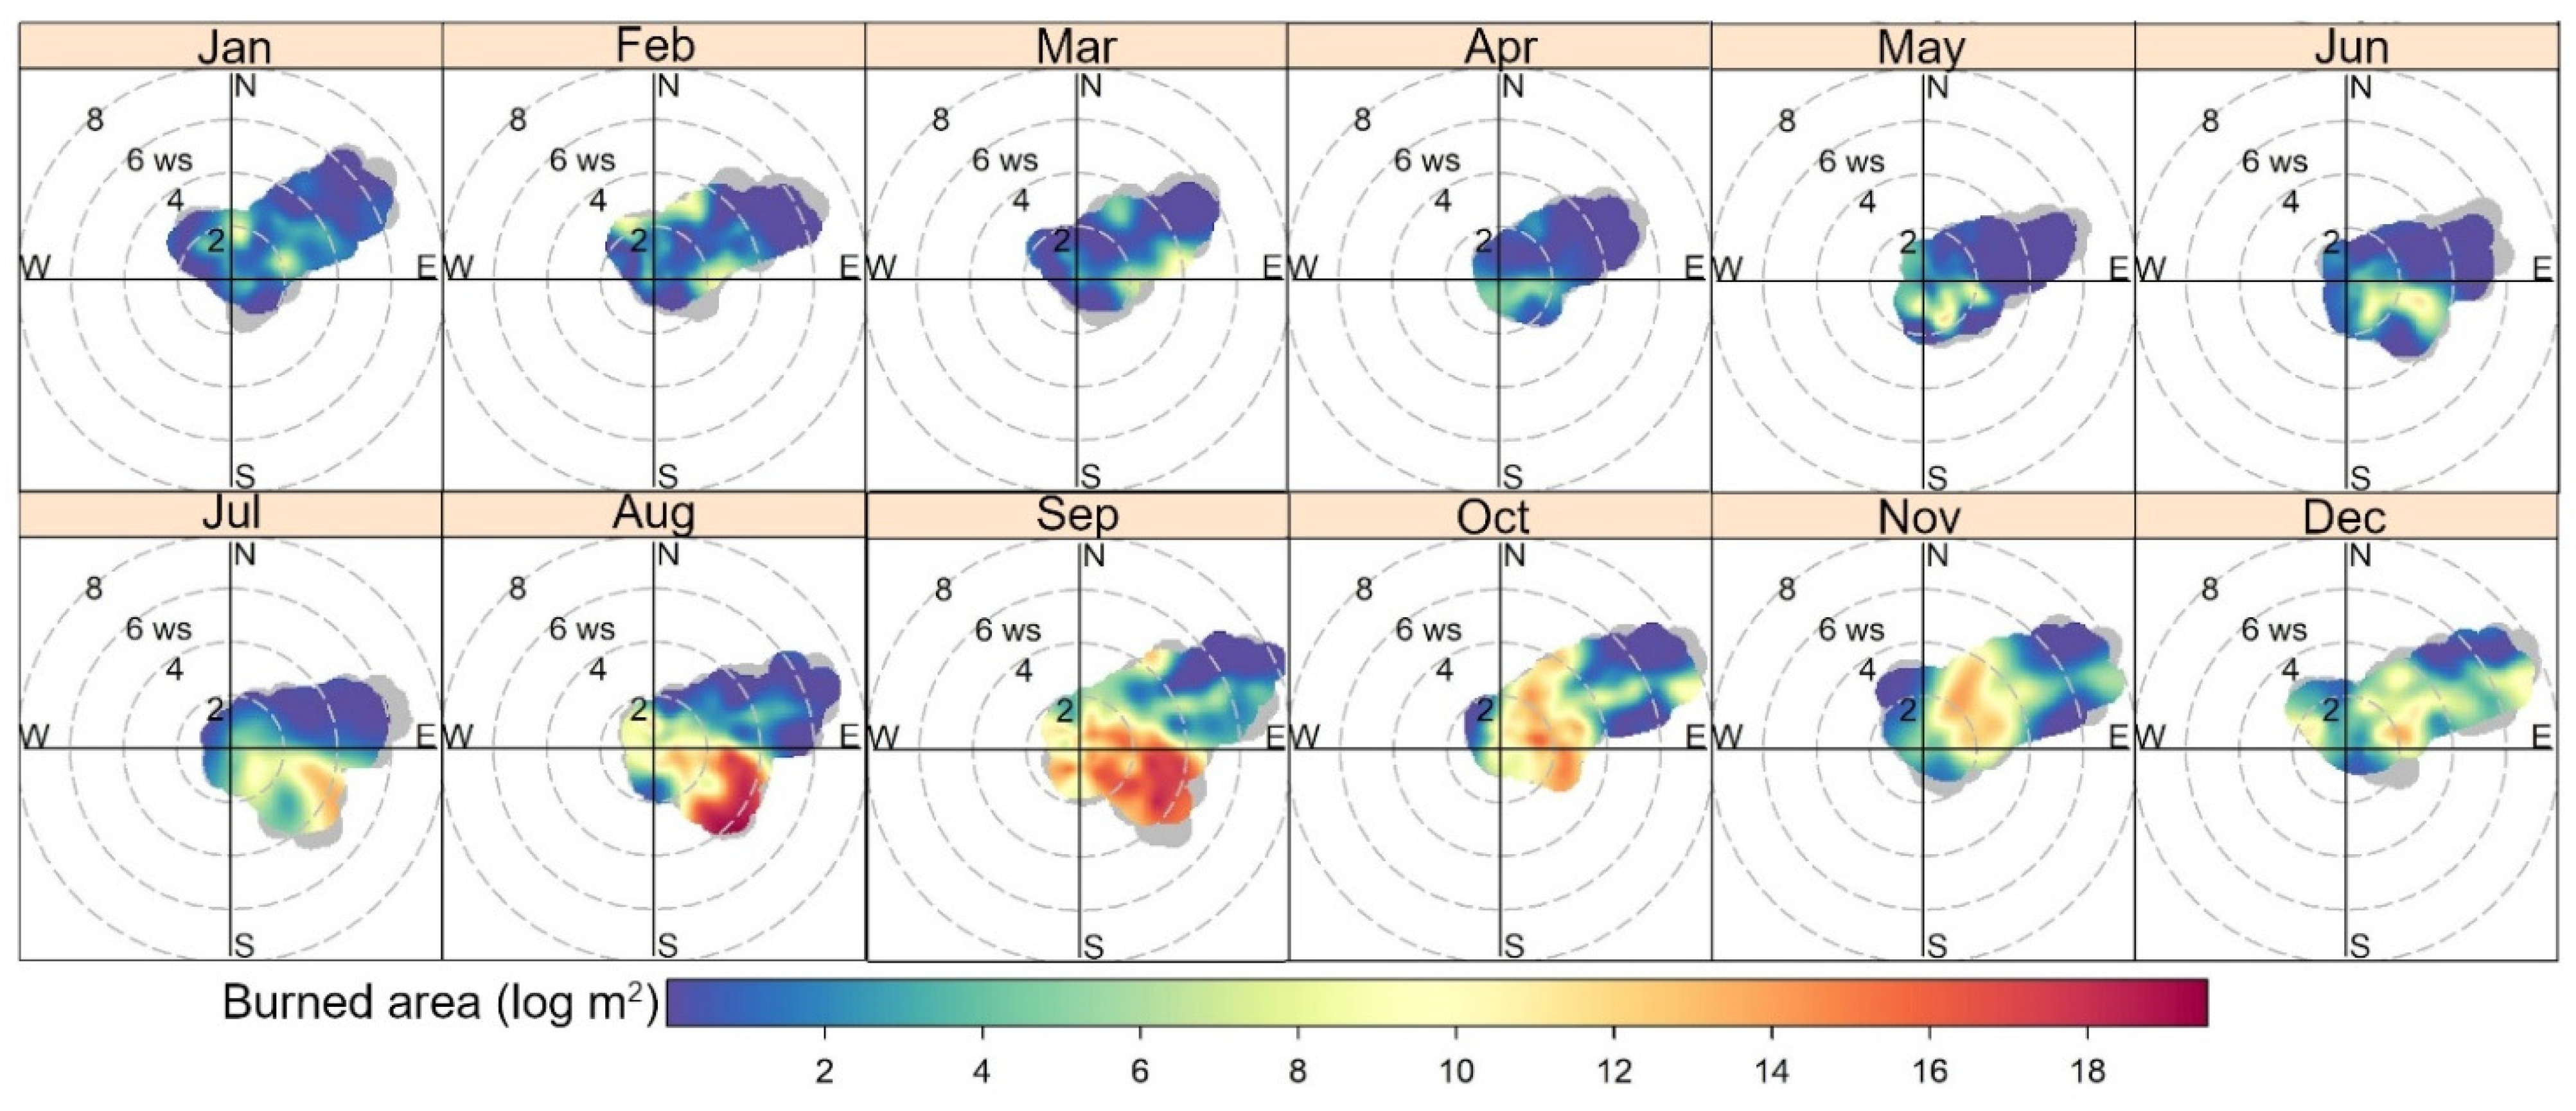
Figure 4 presents the monthly variation of the burned areas considering the wind speed and the prevailing wind direction. Between June and September—the period that covers the burning season in the region—there is the presence of winds coming from the northwest, and the average wind speed increases, reaching a maximum between August and September, at the peak of fires. Subsequently, the wind pattern returns to the southwest direction, with winds that can reach up to 8 m/s.

3.2. Econometrics Estimates

A first and descriptive assessment of a “weak instrument”—that is, of the possibility that the instrument is not significantly related to pollution—is provided by the correlation between the instruments and pollution, as shown in Table 3. Only the logarithm of burned area (LogBA) did not exhibit a significant correlation with pollution, violating the instrument relevance requirement. Nevertheless, this is not conclusive evidence, as it is biased by socioeconomic and weather confounders that are addressed by the multivariate approach presented subsequently (see “weak instrument test” in Table 4), as attested by the positive and significant coefficients estimated in the first-stage regressions for all age groups and illnesses.
Table 4 shows the results obtained with the estimator that was indicated by the four-step test procedure for each dependent variable. Detailed estimation results, also containing control variables and the complete set of instruments (LogBA, BAWSpeed, and BAWDirec) and estimators (OLS, 2SLS, fixed effects, and random effects), are presented in the Supplementary Materials.
It should be noted that for all models tested, the value of the Hausman test indicated a significant difference between the coefficients generated by the fixed- and random-effects estimators, indicating consistency only of the former.
Among the four IV sets, the IVc01 (LogBa + BaWSpeed + BaWDirec) and IVc02 (LogBa + BaWSpeed) were the only sets that met all criteria in the four-step testing for a valid instrument (Section 2.4) for the total (respiratory) hospitalization dependent variable. However, according to the predefined testing order, the larger set (IVc01) was the one that grounded estimation of the effect of pollution from fires on total hospitalizations for respiratory diseases in the BLA. The size of the estimate was such that if AOD increased by 1%, total hospitalizations would increase by 0.1383%, in the average municipality–month. An increase of one standard deviation (0.17) would imply an increase of 2.35% in hospitalizations.
A positive effect was also estimated for asthma, bronchitis, and for the elderly. In the former, the IVc04 instrument set was applied, revealing that hospitalizations would increase by approximately 0.08% for each 1% rise in the AOD level. For bronchitis and the elderly, pollution was exogenous and, thus, OLS estimation was implemented, resulting in 0.002% (p < 0.001) and 0.0103% (p < 0.01) effects on hospitalization, respectively.
Counterintuitively, a negative coefficient was estimated for small children and children. For these two hospitalization counts, the IVc04 set (LogBa) passed the four-step test for a valid instrument, indicating that each increase of 1% in AOD levels decreases the hospitalization of small children by 0.34% (p < 0.001), and of children by 0.18% (p < 0.01). Hospitalization due to pneumonia was not significantly impacted by AOD.

3.3. Hospitalization Attributable to Fires

It was estimated that 5% of respiratory hospitalizations observed in the horizon of analysis were attributable to fires. The monthly trend is shown in Figure 5 and, in absolute terms, ~822 people were estimated to be hospitalized per month due to fire-induced pollution, with a slight increase during the fire season.

3.4. Robustness Check

As an assessment of the robustness of the results obtained, burned area was replaced by point fire detections based on thermal anomalies, which are observed even under weather conditions (e.g., severe cloud coverage) that prevent detection of burned areas. The analysis was re-conducted as shown in Table 5, where all of the new instruments presented positive and significant values.
The variation over the years, and its average by month (Figure 6), show a similar seasonality to that presented by the burned area, wherein the count increases from May onwards, reaching its peak in August–September; however, the low peak of the beginning of the year (February–March)—as observed for the burned area—is not visible.
Table 6 presents the results based on specification selected by the four-stage testing procedure. For each of the seven hospitalization counts, thermal anomaly count was employed as an instrumental variable that interacted with wind direction and wind speed. The use of this product returned negative effects of pollution for all models in which the IV estimator was appropriate (i.e., total, small children, children, the elderly, pneumonia, and bronchitis), whereas in the only model estimated with OLS (asthma), the effect was positive.
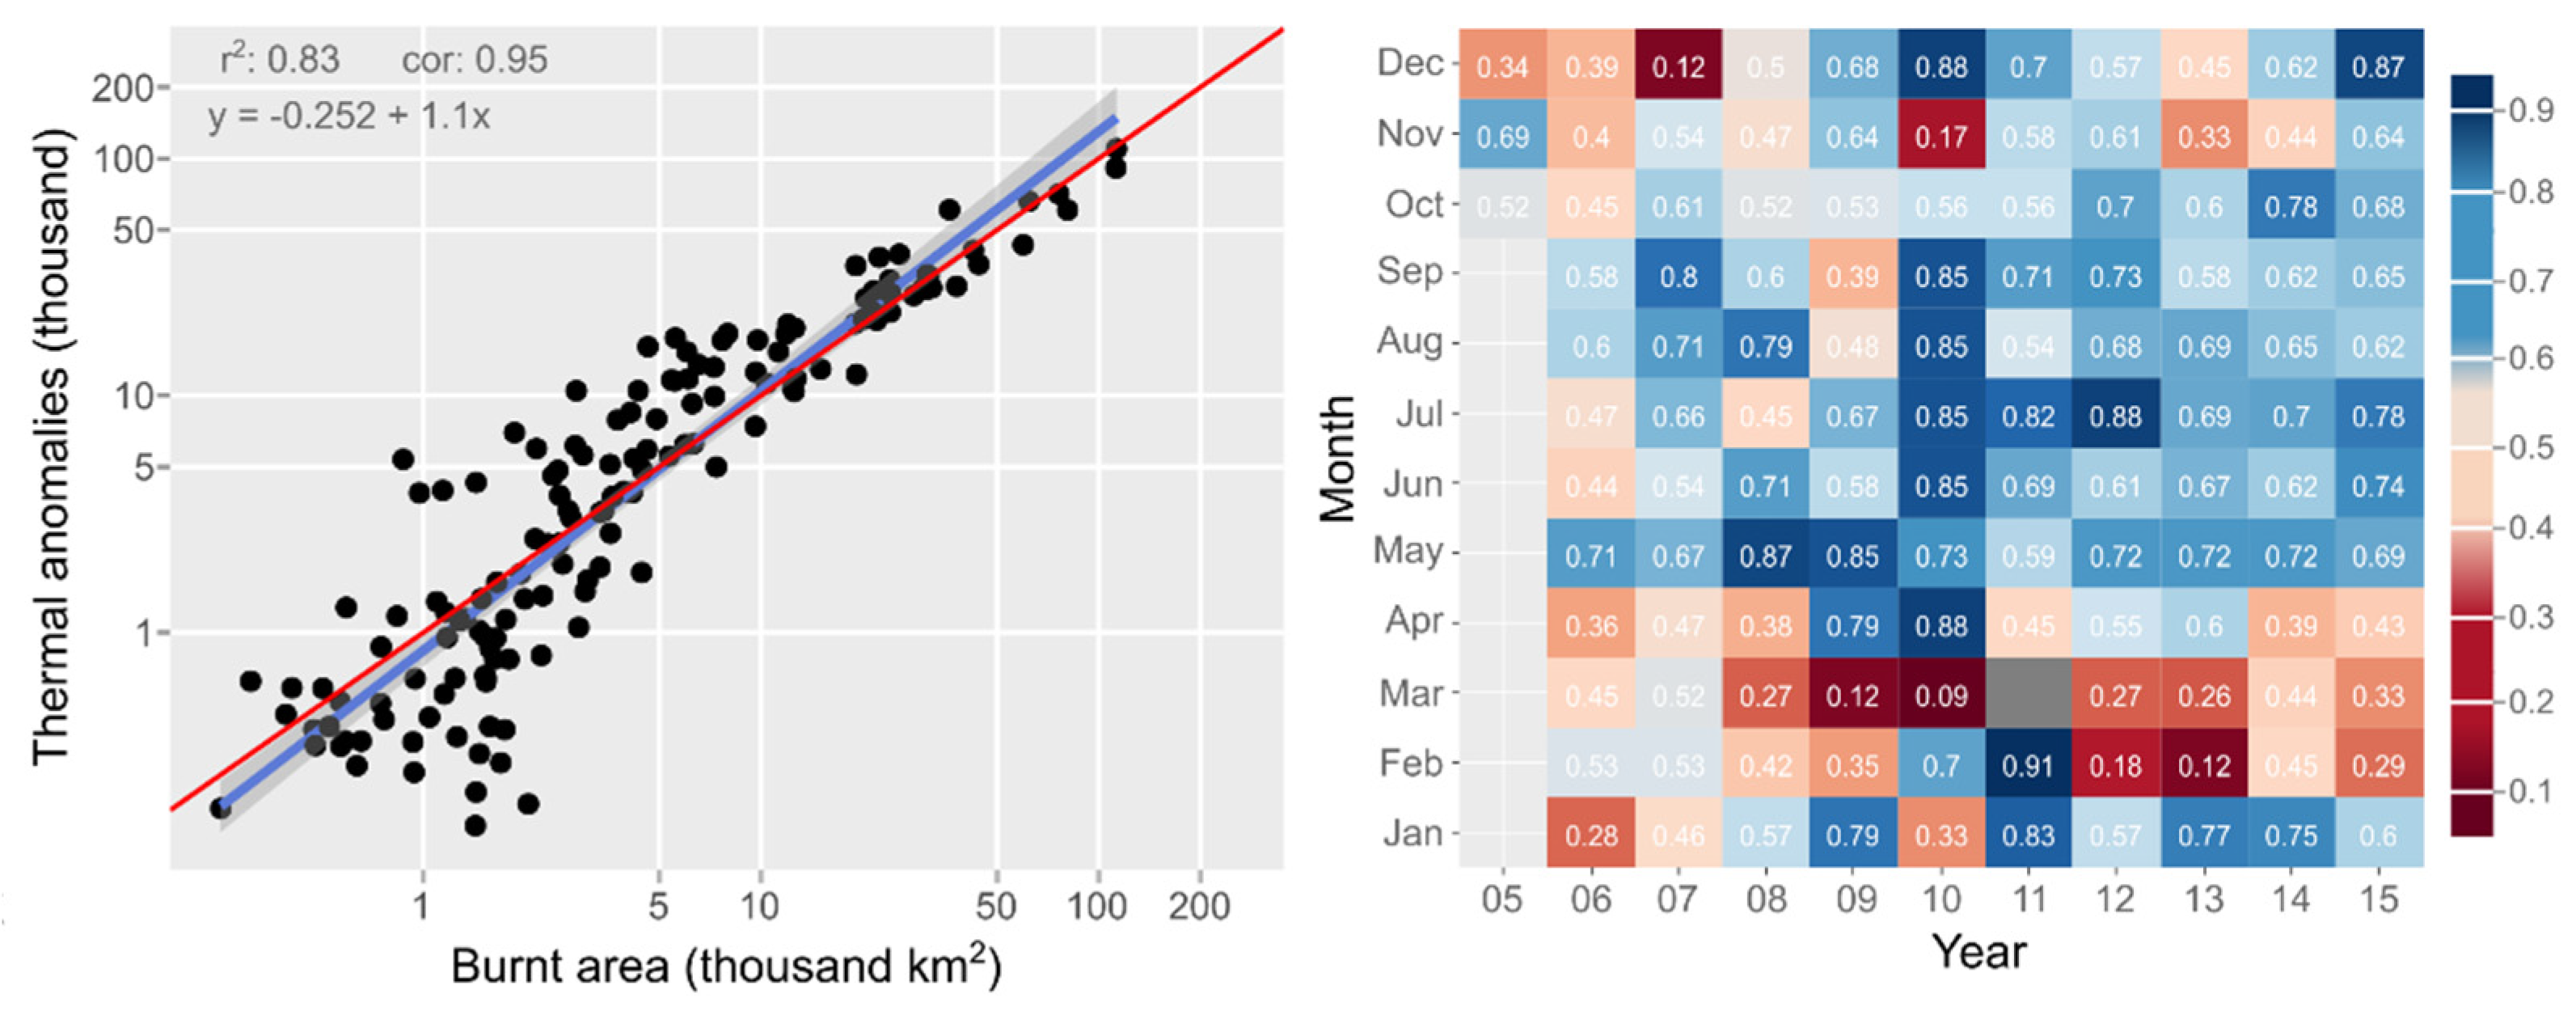
Such results suggest that, aside from the substantial correlation between point and areal fire detections (0.95; Figure 7), their statistical behavior is not similar enough regarding the relationship between pollution and hospitalizations. Even with the higher frequency of point detections by the TA product [68], the correlation with BA at low levels (less than 5000 km2)—especially between February and April (Figure 7)—led to a mismatch in the early peak of burning that occurs when hospitalizations start to increase (Figure 3 and Figure 6). This may have favored the appearance of negative estimates in the robustness check, due to the appearance of a well-defined valley.

4. Discussion

The coefficient (0.1383%) here estimated for total hospitalization is tenfold larger than the one calculated by Rocha and Sant’anna [59] for the BLA in which, using the interaction between the wind direction and pollutants from neighboring municipalities as an instrumental variable, the authors found that an increase of 17.3 µ/m3 (one standard deviation, or a 107% increase compared to the average) in PM2.5 levels causes an average increase of ~1.5% (0.95 hospitalizations per 100,000 inhabitants) in total hospitalizations. It should be emphasized that the authors did not attempt to measure the effects of fire or of fire-induced pollution, but of pollution in general. Nevertheless, larger coefficients were estimated in other papers, such those by Mendonça et al. [21] and Mendonça et al. [69], suggesting that our estimates are not outside the range of the literature.
Additionally, the negative coefficients obtained in this paper for Small Children and Children are paralleled by the estimates by Smith et al. [19] along the eastern and southern edges of the BLA region, using geographically weighted Poisson regression for AOD and respiratory disease in children during the 2005 and 2010 droughts. This relationship opposes results previously found for the BLA by Carmo et al. [22], Jacobson et al. [23], and Rocha and Sant’anna [59]. This may be due to the larger hospitalization peak not occurring in the dry season, when the fire level peaks, but towards the end of the wet season, when humidity is still high and temperature low. This fact was not highlighted by the cited studies, but has been observed by others [19,20,70,71]. Particularly, Silva et al. [70] and Andrade Filho et al. [71] argued that the colder and more humid wet season weather may drive hospitalization of children due to respiratory illnesses, with the former authors having found such correlations in BLA data, and the latter authors arguing that such a factor could exert stronger influence than aerosol pollution.
The wind analysis follows the patterns presented by Gatti et al. [72] and Cassol et al. [73] for the Amazon region, including the dispersion of aerosols, in which there is a change in the predominant wind direction at the beginning of the fire season. This factor can spread smoke plumes to neighboring municipalities, states, and even other Amazonian countries, representing a transboundary issue exemplified by the study of Sheldon and Sankaran 2017 [7].
The main limitations of this study are worth detailing. Related to the statistical approach, the difficulty of establishing the causal effect of fire pollutants on hospitalizations is also revealed in the data description (Section 3.1). At first, when looking strictly at spatial variation, simultaneously high values of the three main variables (burned area, AOD, and hospitalizations for respiratory diseases) were not geographically widespread. This demonstrates the need for going beyond descriptive patterns and bivariate correlation coefficients, and towards an identification strategy that also accounts for a range of potential predictors as covariates. Such an approach to the estimation of pollution’s effect on health proved successful in this paper, leading to results that are consistent with those of previous studies. In particular, Souza et al. [74], analyzing the relationship between deforestation, hot spots, pollutants (PM2.5), and hospitalizations of indigenous people from the BLA, also found a positive relationship.
Finally, the outcome of the robustness test should be interpreted as a lack of robustness of estimates specifically with regard to alternative measures of fire. Nevertheless, with regard to statistical accuracy and precision, the effects estimated were robust with fire measured as burned area.
Hospitalization data are also limited, including only patients who remain at the hospital under supervision for a period equal to or longer than 24 h [75], which excludes inpatients with mild symptoms, as well as outpatients. In other words, the level of pollution exposure required for a person to be hospitalized is above that which triggers mild symptoms and outpatient visits; is the former is less likely and, thus, generally less prominent in the data.
Other dimensions of the fire phenomenon beyond the spatial domain embraced and the count of active events—such as fire radiative power and combustion efficiency—may also influence the amount of pollution released and the consequent health impact [56,76]. These could be considered in future analysis as control variables in order to further isolate the pollution and health effects of the dimensions considered in this text from the influence of other dimensions.
It is helpful for future research on this topic to emphasize the need for careful analysis of the relationship between fires, pollution, and hospitalizations. This paper is proof that in this matter, a descriptive analysis seeking patterns visible to the naked eye may be misleading, as attested by the contrast between Section 3.1, in which such an endeavor was pursued, and Section 3.2, in which a proper statistical analysis was conducted. More precisely, the data description revealed no clear and directly proportional relationship between fires, pollution, and hospitalizations. Nevertheless, such a relationship was indeed present in the data, as unveiled by a more detailed and statistically sound multivariate analysis, which filtered out the influence of other variables that could act as drivers of pollution and hospitalizations. Such filtering thus proved to be critical for observing how the three main variables were actually related in the dataset. In this regard, we advise future researchers both to not take visual patterns for granted—which can serve as refutations or corroborations of hypotheses under test—as well as to guard against spurious correlations by resorting to a multivariate analysis that includes other factors suggested by the available knowledge, beyond the main variables of fires, pollution, and measure of health impact. These recommendations are aligned with the state of the art of the emerging literature on the econometrics of pollution, which also emphasizes the need to resort to causal inference methods for accurately measuring the effect of fire-induced pollution on health (Deryugina et al. [16], Rangel and Volg, [77], and He et al. [17]).

5. Conclusions

In this article, we estimated the hospitalization attributable to fire-induced pollution in the Brazilian Legal Amazon (BLA), using a balanced panel at a monthly–municipal level, with available data from the past 20 years (2005–2018). The impact of fire-induced pollution on age groups and specific illnesses was detailed. For this, we applied the instrumental variable approach by exploring the speed and direction of wind, along with fires, as exogenous sources of variation. Therefore, the evidence on hospitalizations was expanded by embracing the whole BLA with a 20-year time series. As a result, of the seven measures of hospitalization frequency considered, four were significantly increased by fire-induced pollution, indicating a considerable detrimental health impact on regional inhabitants. Methodologically, the potential of econometric analysis of remote sensing and georeferenced data to shed light on the impacts of anthropogenic burnings was demonstrated for the specific case of the Brazilian Amazon.
To overcome the limitations that may prevent the detection of a positive relationship between the key variables—the bias of hospitalization records towards severe symptoms, and lack of robustness to alternative fire measures—alternative analytical strategies could be pursued in future studies. These could include other identification strategies (such as the one proposed by Rangel and Volg [77]), reliance on time-series methods able to better model seasonality, consideration of other pollution measures, and even downscaling the time aggregation to capture intra-monthly peaks.

Supplementary Materials

The detailed estimation for each dependent variable, containing the control variables, the complete set of instruments and the estimators are available online at https://www.mdpi.com/article/10.3390/rs14010069/s1.

Author Contributions

Conceptualization, W.A.C., M.A.M.C. and T.M.; methodology, W.A.C., M.A.M.C., and T.M.; formal analysis, W.A.C., M.A.M.C. and T.M.; writing—original draft preparation, W.A.C., T.M. and L.O.A.; writing—review and editing, W.A.C., T.M., L.O.A. and M.A.M.C.; graphics and illustration, W.A.C.; supervision, T.M. and L.O.A. All authors have read and agreed to the published version of the manuscript.

Funding

This research was funded by the Coordenação de Aperfeiçoamento de Pessoal de Nível Superior—Brasil (CAPES)—Finance Code 001; by the CAPES-PRINT/Satellite Applications for Sustainable Development—grant code 88887.369657/2019-00; by the São Paulo Research Foundation—Brasil (FAPESP), processes 2016/02018-2 and 2019/05440-5; by the Brazilian National Council for Scientific and Technological Development (CNPq) for the scholarship to W.A.C. (process 140261/2018-4), for the productivity fellowship to L.O.A. (314473/2020-3), and for the projects Acre-Queimadas (442650/2018-3) and Sem-Flama (441949/2018-5); and by the Inter-American Institute for Global Change Research (IAI) for the project Map-Fire (IAI-SGP-HW016).

Institutional Review Board Statement

Not applicable.

Informed Consent Statement

Not applicable.

Acknowledgments

This article is part of the doctoral thesis presented to the National Institute for Space Research—INPE in June 2021, and the authors thank all members of the examining commission for their reviews.

Conflicts of Interest

The authors declare no conflict of interest.

References

  1. Cassou, E. Agricultural Pollution: Field Burning; World Bank: Washington, DC, USA, 2018. [Google Scholar]
  2. Watts, J.D.; Tacconi, L.; Hapsari, N.; Irawan, S.; Sloan, S.; Widiastomo, T. Incentivizing compliance: Evaluating the effectiveness of targeted village incentives for reducing burning in Indonesia. For. Policy Econ. 2019, 108, 101956. [Google Scholar] [CrossRef]
  3. Carmo, C.N.D.; Alves, M.B.; Hacon, S.D.S. Impact of biomass burning and weather conditions on children’s health in a city of Western Amazon region. Air Qual. Atmos. Health 2013, 6, 517–525. [Google Scholar] [CrossRef]
  4. Arbex, M.A.; Martins, L.C.; de Oliveira, R.C.; Pereira, L.A.A.; Arbex, F.F.; Cançado, J.E.D.; Saldiva, P.H.N.; Braga, A.L.F. Air pollution from biomass burning and asthma hospital admissions in a sugar cane plantation area in Brazil. J. Epidemiol. Community Health 2007, 61, 395–400. [Google Scholar] [CrossRef] [Green Version]
  5. Kumar, P.; Kumar, S.; Joshi, L. Valuation of the Health Effects. In Perspectives on Social LCA; Springer: Singapore, 2015; pp. 35–67. [Google Scholar]
  6. Chagas, A.L.; Azzoni, C.R.; Almeida, A.N. A spatial difference-in-differences analysis of the impact of sugarcane production on respiratory diseases. Reg. Sci. Urban. Econ. 2016, 59, 24–36. [Google Scholar] [CrossRef]
  7. Sheldon, T.L.; Sankaran, C. The Impact of Indonesian Forest Fires on Singaporean Pollution and Health. Am. Econ. Rev. 2017, 107, 526–529. [Google Scholar] [CrossRef] [PubMed]
  8. Reddington, C.; Butt, E.W.; Ridley, D.A.; Artaxo, P.; Morgan, W.T.; Coe, H.; Spracklen, D.V. Air quality and human health improvements from reductions in deforestation-related fire in Brazil. Nat. Geosci. 2015, 8, 768–771. [Google Scholar] [CrossRef] [Green Version]
  9. INPE Monitoramento Dos Focos Ativos Por Estado/Região/Bioma. Available online: http://www.inpe.br/queimadas/portal/estatistica_estados (accessed on 26 November 2020).
  10. Alencar, A.; Rodrigues, L.; Castro, I. Amazônia em Chamas: O Que Queima e Onde; Instituto de Pesquisa Ambiental da Amazônia: Brasilia, Brazil, 2020. [Google Scholar]
  11. Aragão, L.E.O.C.; Malhi, Y.; Roman-Cuesta, R.M.; Saatchi, S.; Anderson, L.; Shimabukuro, Y.E. Spatial patterns and fire response of recent Amazonian droughts. Geophys. Res. Lett. 2007, 34, 07701. [Google Scholar] [CrossRef] [Green Version]
  12. Aragão, L.E.O.C.; Anderson, L.O.; Fonseca, M.G.; Rosan, T.M.; Vedovato, L.B.; Wagner, F.H.; Silva, C.V.J.; Junior, C.H.L.S.; Arai, E.; Aguiar, A.P.; et al. 21st Century drought-related fires counteract the decline of Amazon deforestation carbon emissions. Nat. Commun. 2018, 9, 536. [Google Scholar] [CrossRef]
  13. Reisen, F.; Duran, S.M.; Flannigan, M.; Elliott, C.; Rideout, K. Wildfire smoke and public health risk. Int. J. Wildland Fire 2015, 24, 1029. [Google Scholar] [CrossRef]
  14. Permentier, K.; Vercammen, S.; Soetaert, S.; Schellemans, C. Carbon dioxide poisoning: A literature review of an often forgotten cause of intoxication in the emergency department. Int. J. Emerg. Med. 2017, 10, 14. [Google Scholar] [CrossRef]
  15. Wooldridge, J.M. Introductory Econometrics: A Modern Approach, 7th ed.; Cengage Learning South-Western: Cincinnati, OH, USA, 2020; ISBN 9781337558860. [Google Scholar]
  16. Deryugina, T.; Heutel, G.; Miller, N.H.; Molitor, D.; Reif, J. The Mortality and Medical Costs of Air Pollution: Evidence from Changes in Wind Direction. Am. Econ. Rev. 2019, 109, 4178–4219. [Google Scholar] [CrossRef]
  17. He, G.; Liu, T.; Zhou, M. Straw burning, PM2.5, and death: Evidence from China. J. Dev. Econ. 2020, 145, 102468. [Google Scholar] [CrossRef] [Green Version]
  18. Gonçalves, K.D.S.; Winkler, M.S.; Benchimol-Barbosa, P.R.; de Hoogh, K.; Artaxo, P.E.; Hacon, S.D.S.; Schindler, C.; Künzli, N. Development of non-linear models predicting daily fine particle concentrations using aerosol optical depth retrievals and ground-based measurements at a municipality in the Brazilian Amazon region. Atmos. Environ. 2018, 184, 156–165. [Google Scholar] [CrossRef]
  19. Smith, L.; Aragão, L.E.O.C.; Sabel, C.; Nakaya, T. Drought impacts on children’s respiratory health in the Brazilian Amazon. Sci. Rep. 2015, 4, 3726. [Google Scholar] [CrossRef] [PubMed] [Green Version]
  20. Machado-Silva, F.; Libonati, R.; de Lima, T.F.M.; Peixoto, R.; França, J.R.D.A.; Magalhães, M.D.A.F.M.; Santos, F.L.M.; Rodrigues, J.A.; DaCamara, C.C. Drought and fires influence the respiratory diseases hospitalizations in the Amazon. Ecol. Indic. 2020, 109, 105817. [Google Scholar] [CrossRef]
  21. de Mendonça, M.J.C.; Diaz, M.D.C.V.; Nepstad, D.; da Motta, R.S.; Alencar, A.; Gomes, J.C.; Ortiz, R.A. The economic cost of the use of fire in the Amazon. Ecol. Econ. 2004, 49, 89–105. [Google Scholar] [CrossRef]
  22. Do Carmo, C.N.; Hacon, S.; Longo, K.M.; Freitas, S.; Ignotti, E.; de Leon, A.P.; Artaxo, P. Associação Entre Material Particulado de Queimadas e Doenças Respiratórias Na Região Sul Da Amazônia Brasileira. Rev. Panam. De Salud Publica 2010, 27, 10–16. [Google Scholar] [CrossRef] [Green Version]
  23. Jacobson, L.D.S.V.; Hacon, S.D.S.; De Castro, H.A.; Ignotti, E.; Artaxo, P.; Saldiva, P.H.N.; De Leon, A.C.M.P. Acute Effects of Particulate Matter and Black Carbon from Seasonal Fires on Peak Expiratory Flow of Schoolchildren in the Brazilian Amazon. PLoS ONE 2014, 9, e104177. [Google Scholar] [CrossRef] [PubMed]
  24. BRASIL. Institui, Na Forma Do Art. 43 Da Constituição Federal, a Superintendência Do Desenvolvimento Da Amazônia–SUDAM.; Estabelece Sua Composição, Natureza Jurídica, Objetivos, Área de Competência e Instrumentos de Ação; Dispõe Sobre o Fundo de Desenvolvimento Da Amazônia–FDA.; Altera a Medida Provisória No 2.157-5, de 24 de Agosto de 2001; Revoga a Lei Complementar No 67, de 13 de Junho de 1991; e Dá Outras Providências; Diário Oficial da União: Brasília, Brasil, 2007. [Google Scholar]
  25. IBGE. Amazônia Legal; IBGE-Instituto Brazileito de Geografia e Estatistica: Rio de Janeiro, RJ, Brazil, 2020. [Google Scholar]
  26. Aquino, R.; De Oliveira, N.F.; Barreto, M.L. Impact of the Family Health Program on Infant Mortality in Brazilian Municipalities. Am. J. Public Health 2009, 99, 87–93. [Google Scholar] [CrossRef]
  27. Harris, M.C.; Kohn, J.L. Reference Health and the Demand for Medical Care. Econ. J. 2018, 128, 2812–2842. [Google Scholar] [CrossRef]
  28. Busetto, L.; Ranghetti, L. MODIStsp: An R package for automatic preprocessing of MODIS Land Products time series. Comput. Geosci. 2016, 97, 40–48. [Google Scholar] [CrossRef] [Green Version]
  29. Giglio, L.; Justice, C.; Boschetti, L.; Roy, D. MCD64A1 MODIS/Terra+Aqua Burned Area Monthly L3 Global 500m SIN Grid V006 2015. Available online: https://lpdaac.usgs.gov/products/mcd64a1v006/ (accessed on 29 December 2020).
  30. Boschetti, L.; Roy, D.P.; Giglio, L.; Huang, H.; Zubkova, M.; Humber, M.L. Global validation of the collection 6 MODIS burned area product. Remote. Sens. Environ. 2019, 235, 111490. [Google Scholar] [CrossRef]
  31. Pessôa, A.; Anderson, L.; Carvalho, N.; Campanharo, W.; Junior, C.; Rosan, T.; Reis, J.; Pereira, F.; Assis, M.; Jacon, A.; et al. Intercomparison of Burned Area Products and Its Implication for Carbon Emission Estimations in the Amazon. Remote. Sens. 2020, 12, 3864. [Google Scholar] [CrossRef]
  32. INPE Banco de Dados de Queimadas. Available online: https://queimadas.dgi.inpe.br/queimadas/bdqueimadas (accessed on 10 May 2021).
  33. Giglio, L.; Justice, C. MYD14A1 MODIS/Aqua Thermal Anomalies/Fire Daily L3 Global 1km SIN Grid V006 2015. Available online: https://lpdaac.usgs.gov/products/myd14a1v006/ (accessed on 29 December 2020).
  34. Alonso-Canas, I.; Chuvieco, E. Global burned area mapping from ENVISAT-MERIS and MODIS active fire data. Remote. Sens. Environ. 2015, 163, 140–152. [Google Scholar] [CrossRef]
  35. Libonati, R.; da Camara, C.C.; Setzer, A.W.; Morelli, F.; de Jesus, S.C.; Candido, P.A.; Melchiori, A.E. Validation of the Burned Area “(V,W)” Modis Algorithm in Brazil. In Advances in Forest Fire Research; Imprensa da Universidade de Coimbra: Coimbra, Portugal, 2014; pp. 1774–1785. ISBN 978-989-26-0884-6. [Google Scholar]
  36. Copernicus Climate Change Service. ERA5 Monthly Averaged Data on Single Levels from 1979 to Present 2019. Available online: https://cds.climate.copernicus.eu/cdsapp#!/dataset/reanalysis-era5-single-levels-monthly-means?tab=overview (accessed on 29 December 2020).
  37. Fernández-López, J.; Schliep, K. rWind: Download, edit and include wind data in ecological and evolutionary analysis. Ecography 2019, 42, 804–810. [Google Scholar] [CrossRef] [Green Version]
  38. Lyapustin, A.; Wang, Y. MCD19A2 MODIS/Terra+Aqua Land Aerosol Optical Depth Daily L2G Global 1km SIN Grid V006 2018. Available online: https://lpdaac.usgs.gov/products/mcd19a2v006/ (accessed on 29 December 2020).
  39. Kumar, N. What Can Affect AOD–PM 2.5 Association? Environ. Health Perspect. 2010, 118, A109–A110. [Google Scholar] [CrossRef] [Green Version]
  40. Martins, V.S.; Lyapustin, A.; Carvalho, L.A.S.; Barbosa, C.C.F.; Novo, E.M.L.M. Validation of high-resolution MAIAC aerosol product over South America. J. Geophys. Res. Atmos. 2017, 122, 7537–7559. [Google Scholar] [CrossRef]
  41. Guo, J.; Xia, F.; Zhang, Y.; Liu, H.; Li, J.; Lou, M.; He, J.; Yan, Y.; Wang, F.; Min, M.; et al. Impact of diurnal variability and meteorological factors on the PM2.5-AOD relationship: Implications for PM2.5 remote sensing. Environ. Pollut. 2017, 221, 94–104. [Google Scholar] [CrossRef] [PubMed] [Green Version]
  42. Chudnovsky, A.; Tang, C.; Lyapustin, A.; Wang, Y.; Schwartz, J.; Koutrakis, P. A critical assessment of high-resolution aerosol optical depth retrievals for fine particulate matter predictions. Atmos. Chem. Phys. Discuss. 2013, 13, 10907–10917. [Google Scholar] [CrossRef] [Green Version]
  43. Alvim, D.; Chiquetto, J.; D’Amelio, M.; Khalid, B.; Herdies, D.; Pendharkar, J.; Corrêa, S.; Figueroa, S.; Frassoni, A.; Capistrano, V.; et al. Evaluating Carbon Monoxide and Aerosol Optical Depth Simulations from CAM-Chem Using Satellite Observations. Remote. Sens. 2021, 13, 2231. [Google Scholar] [CrossRef]
  44. Li, R.; Mei, X.; Chen, L.; Wang, L.; Wang, Z.; Jing, Y. Long-Term (2005–2017) View of Atmospheric Pollutants in Central China Using Multiple Satellite Observations. Remote. Sens. 2020, 12, 1041. [Google Scholar] [CrossRef] [Green Version]
  45. DataSUS Informações de Saúde (TABNET). Available online: http://www2.datasus.gov.br/DATASUS/index.php?area=02 (accessed on 28 December 2020).
  46. IBGE Produto Interno Bruto dos Municípios. Available online: https://www.ibge.gov.br/estatisticas/economicas/contas-nacionais/9088-produto-interno-bruto-dos-municipios.html (accessed on 23 March 2021).
  47. Malta, D.C.; De Moura, L.; Prado, R.R.D.; Escalante, J.C.; Schmidt, M.I.; Duncan, B.B. Mortalidade por doenças crônicas não transmissíveis no Brasil e suas regiões, 2000 a 2011. Epidemiol. E Serv. De Saude Rev. Do Sist. Unico De Saude Do Bras. 2014, 23, 599–608. [Google Scholar] [CrossRef] [Green Version]
  48. Wan, Z.; Hook, S.; Hulley, G. MOD11A2 MODIS/Terra Land Surface Temperature/Emissivity 8-Day L3 Global 1km SIN Grid V006 2015. Available online: https://lpdaac.usgs.gov/products/mcd19a2v006/ (accessed on 29 December 2020).
  49. Funk, C.; Peterson, P.; Landsfeld, M.; Pedreros, D.; Verdin, J.; Shukla, S.; Husak, G.; Rowland, J.; Harrison, L.; Hoell, A.; et al. The climate hazards infrared precipitation with stations—A new environmental record for monitoring extremes. Sci. Data 2015, 2, 150066. [Google Scholar] [CrossRef] [Green Version]
  50. Anderson, L.O.; Neto, G.R.; Cunha, A.P.; Fonseca, M.G.; De Moura, Y.M.; Dalagnol, R.; Wagner, F.H.; de Aragão, L.E. Vulnerability of Amazonian forests to repeated droughts. Philos. Trans. R. Soc. B Biol. Sci. 2018, 373, 20170411. [Google Scholar] [CrossRef]
  51. OSM Download OpenStreetMap Data for This Region: Brazil. Available online: https://download.geofabrik.de/south-america/brazil.html (accessed on 28 December 2020).
  52. MINFRA Estatísticas-Frota de Veículos–DENATRAN. Available online: https://www.gov.br/infraestrutura/pt-br/assuntos/transito/conteudo-denatran/estatisticas-frota-de-veiculos-denatran (accessed on 28 December 2020).
  53. Biomas Project—Collection 4.1. Annual Brazilian Land Use and Land Cover Maps. 2020. Available online: https://mapbiomas.org/ (accessed on 11 May 2020).
  54. Souza, C.M.; Shimbo, J.Z.; Rosa, M.R.; Parente, L.L.; Alencar, A.; Rudorff, B.F.; Hasenack, H.; Matsumoto, M.; Ferreira, L.G.; E Souza-Filho, P.W.; et al. Reconstructing Three Decades of Land Use and Land Cover Changes in Brazilian Biomes with Landsat Archive and Earth Engine. Remote Sens. 2020, 12, 2735. [Google Scholar] [CrossRef]
  55. Ignotti, E.; Valente, J.G.; Longo, K.M.; Freitas, S.R.; Hacon, S.D.S.; Netto, P.A. Impact on human health of particulate matter emitted from burnings in the Brazilian Amazon region. Rev. De Saúde Pública 2010, 44, 121–130. [Google Scholar] [CrossRef] [PubMed] [Green Version]
  56. Urbanski, S.P.; Hao, W.M.; Baker, S. Chapter 4 Chemical Composition of Wildland Fire Emissions. In Developments in Environmental Science; Elsevier: Amsterdam, The Netherlands, 2008; Volume 8, pp. 79–107. [Google Scholar]
  57. Bernard, S.M.; Samet, J.M.; Grambsch, A.; Ebi, K.L.; Romieu, I. The potential impacts of climate variability and change on air pollution-related health effects in the United States. Environ. Health Perspect. 2001, 109, 199–209. [Google Scholar] [CrossRef] [Green Version]
  58. Liu, Y.; Ao, C. Effect of air pollution on health care expenditure: Evidence from respiratory diseases. Health Econ. 2021, 30, 858–875. [Google Scholar] [CrossRef]
  59. Rocha, R.; Sant’Anna, A. Winds of Fire and Smoke: Air Pollution and Health in the Brazilian Amazon; IEPS, Instituto de Estudos para Políticas de Saúde: São Paulo, SP, Brazil, 2020. [Google Scholar]
  60. Barufi, A.M.; Haddad, E.A.; Paez, A. Infant mortality in Brazil, 1980-2000: A spatial panel data analysis. BMC Public Health 2012, 12, 181. [Google Scholar] [CrossRef] [PubMed]
  61. Pope, C.A. Epidemiology of fine particulate air pollution and human health: Biologic mechanisms and who’s at risk? Environ. Heal Perspect. 2000, 108, 713–723. [Google Scholar] [CrossRef]
  62. Nunes, K.V.R.; Ignotti, E.; Hacon, S.D.S. Circulatory disease mortality rates in the elderly and exposure to PM2.5 generated by biomass burning in the Brazilian Amazon in 2005. Cad. De Saúde Pública 2013, 29, 589–598. [Google Scholar] [CrossRef] [PubMed] [Green Version]
  63. Schaffer, M.E.; Stillman, S. XTOVERID: Stata Module to Calculate Tests of Overidentifying Restrictions after Xtreg, Xtivreg, Xtivreg2, Xthtaylor 2006. Available online: https://sociorepec.org/publication.xml?h=repec:boc:bocode:s456779&l=en (accessed on 26 October 2020).
  64. Baum, C.F.; Stillman, S. DMEXOGXT: Stata Module to Test Consistency of OLS vs XT-IV Estimate 1999. Available online: https://bia.unibz.it/esploro/outputs/code/DMEXOGXT-Stata-module-to-test-consistency/991005772344201241 (accessed on 26 October 2020).
  65. Cameron, A.C.; Trivedi, P.K. Microeconometrics Using STATA; STATA Press: College Station, TX, USA, 2009; ISBN 978-1-59718-048-1. [Google Scholar]
  66. Staiger, D.; Stock, J.H. Instrumental Variables Regression with Weak Instruments. Econometrica 1997, 65, 557. [Google Scholar] [CrossRef]
  67. Shao, H.; Stoecker, C.; Yang, S.; Shi, L. The pitfall of instrumental variables in big data: What the rule of thumb can’t give you. Commun. Stat.-Simul. Comput. 2019, 48, 2118–2124. [Google Scholar] [CrossRef]
  68. Giglio, L.; Schroeder, W.; Hall, J.V.; Justice, C.O. MODIS Collection 6 Active Fire Product User’s Guide (Revision c); University of Maryland: College Park, MD, USA, 2020. [Google Scholar]
  69. de Mendonça, M.J.C.; Sachsida, A.; Loureiro, P.R.A. Estimation of damage to human health due to forest burning in the Amazon. J. Popul. Econ. 2006, 19, 593–610. [Google Scholar] [CrossRef]
  70. Silva, P.R.S.; Rosa, A.M.; Hacon, S.S.; Ignotti, E. Hospitalization of children for asthma in the Brazilian Amazon: Trend and spatial distribution. J. De Pediatr. 2009, 85, 541–546. [Google Scholar] [CrossRef] [Green Version]
  71. Filho, V.S.D.A.; Artaxo, P.; Hacon, S.; Carmo, C.N.D.; Cirino, G. Aerossois de queimadas e doencas respiratorias em criancas, Manaus, Brasil. Rev. De Saúde Pública 2013, 47, 239–247. [Google Scholar] [CrossRef] [Green Version]
  72. Gatti, L.V.; Gloor, M.; Miller, J.B.; Doughty, C.E.; Malhi, Y.; Domingues, L.G.; Basso, L.S.; Martinewski, A.; Correia, C.S.C.; Borges, V.F.; et al. Drought sensitivity of Amazonian carbon balance revealed by atmospheric measurements. Nat. Cell Biol. 2014, 506, 76–80. [Google Scholar] [CrossRef]
  73. Cassol, H.; Domingues, L.; Sanchez, A.; Basso, L.; Marani, L.; Tejada, G.; Arai, E.; Correia, C.; Alden, C.; Miller, J.; et al. Determination of Region of Influence Obtained by Aircraft Vertical Profiles Using the Density of Trajectories from the HYSPLIT Model. Atmosphere 2020, 11, 1073. [Google Scholar] [CrossRef]
  74. De Souza, A.A.; Oviedo, A.; dos Santos, T.M. Impactos na Qualidade do ar e Saúde Humana Relacionados ao Desmatamento e Queimadas na Amazônia Legal Brasileira; Instituto Socioambiental: São Paulo, SP, Brazil, 2020; p. 21. [Google Scholar]
  75. BRASIL. Padronização da Nomenclatura do Censo Hospitalar, 2nd ed.; Série A. Normas e Manuais Técnicos; Ministério da Saude: Brasilia, DF, Brazil, 2002. [Google Scholar]
  76. Van der Werf, G.R.; Randerson, J.T.; Giglio, L.; van Leeuwen, T.T.; Chen, Y.; Rogers, B.M.; Mu, M.; van Marle, M.J.E.; Morton, D.C.; Collatz, G.J.; et al. Global Fire Emissions Estimates during 1997–2016. Earth Syst. Sci. Data 2017, 9, 697–720. [Google Scholar] [CrossRef] [Green Version]
  77. Rangel, M.A.; Vogl, T.S. Agricultural Fires and Health at Birth. Rev. Econ. Stat. 2019, 101, 616–630. [Google Scholar] [CrossRef]
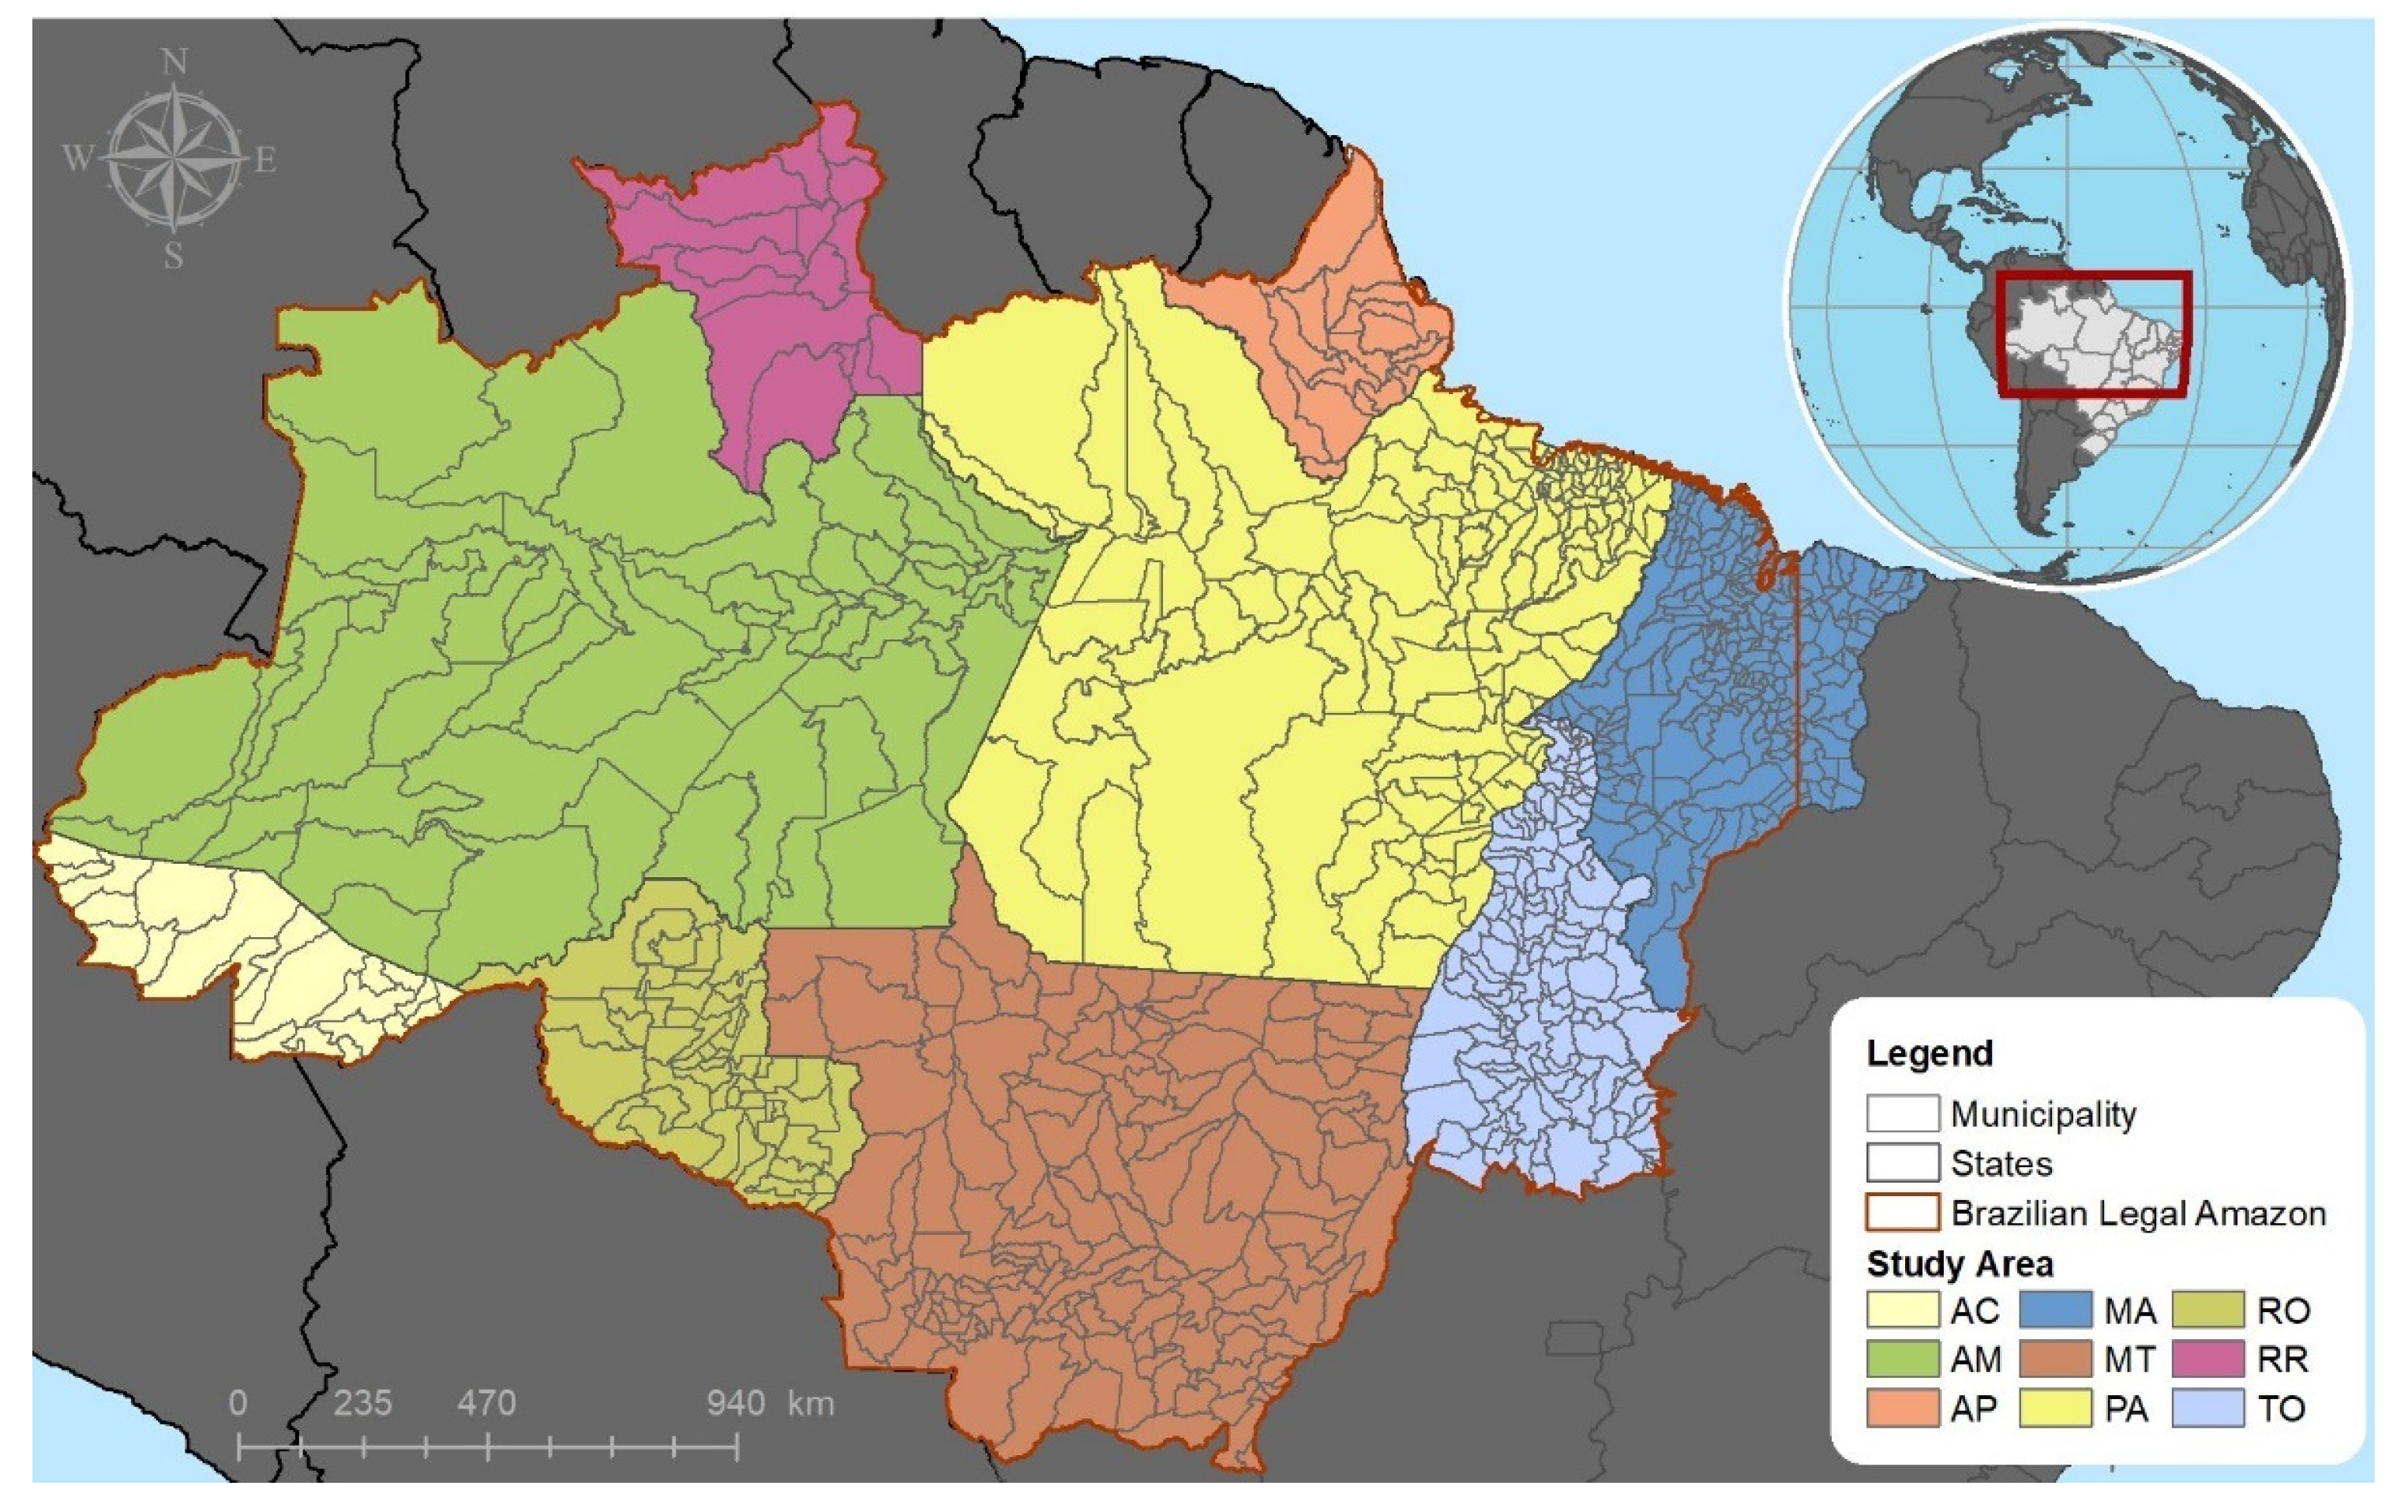
Figure 1. Municipalities within the nine states of the BLA used in this study.
Remotesensing 14 00069 g001
Figure 2. Spatialization of the time-series average for burned area, AOD, and total hospitalizations, aggregated by municipalities The bar plot represents the histogram of the spatialized variable, the bar shows the number of municipalities in each class, and the vertical lines exhibit the mean (yellow) and the first and second deviations (red).
Remotesensing 14 00069 g002
Figure 3. Temporal variation in monthly average values for burned area, AOD, and total hospitalizations. The indicative of the linear trend (lm) is indicated in the up-left corner for each plot, where ns is not significant and *** is for p < 0.001.
Remotesensing 14 00069 g003
Figure 4. Monthly variation in mean values of burned area (log) considering the predominant wind speed (ws) and meteorological direction for the BLA region.
Remotesensing 14 00069 g004
Figure 5. Monthly estimates of total hospitalizations due to fires in terms of percentage and in total number of inpatients.
Remotesensing 14 00069 g005
Figure 6. Temporal variation in average monthly values of thermal anomalies for the region.
Remotesensing 14 00069 g006
Figure 7. Correlation of monthly values of thermal anomalies and burned area, for all time series and months.
Remotesensing 14 00069 g007
Table 1. Variables’ description and summary.
VariableTimeSpatialSource
Tp.Abr.DescriptionAgg.PeriodRes.AggRes.Agg.
IVBABurned areaSum2000–2020mm500 mmcMCD64A1
TAThermal anomalies *Sum2003–2020mm1 kmmcMYD14A1
WDirecWind direction (degree)Mean2001–2020mm0.25°mcERA5
WSpeedWind speed (m/s)
ExpVAODLand aerosol optical depth (AOD)Mean2001–2020mm1 kmmcMCD19A2
DpVHosp.Hospitalization due to respiratory illnesses (ICD 10, Chapter X), by municipality of residence and ageSum2001–2020mm-mcDataSUS
AsthmaHospitalization due to asthmaSum2001–2020mm-mcDataSUS
PneumoniaHospitalization due to pneumonia
BronchitisHospitalization due to bronchitis
CrVPopEstimated populationSum1992–2019yy-ufDataSUS
GDPGross domestic product in thousands of Brazilian Reais (BRL)Sum2002–2017yy-mcIBGE
Chd_dInfant mortalitySum01/2001–12/2018mm-mcDataSUS
Crn_dChronic disease mortality (i.e., the total mortality due to respiratory, cardiovascular, diabetes, and neoplasm diseases)Sum01/2001–12/2018
EmployeNumber of health professionalsSum08/2005–12/2019
BedsNumber of hospital bedsSum10/2005–05/2020
Faci.Number of health facilitiesSum08/2005–05/2020
TempMean, minimum, and maximum temperature (Kelvin)Min2001–2020mm1 kmmcMOD11A2
Mean
Max
PrecpRainfallMean2001–2020mm0.05°mcChirps
RoadRoad density (m/m2) 2019-m-mcOSM
UrbUrban density (km2/km2)Sum2001–2019yy30 mmcMapBiomas
CarsVehicle fleetSum2005–2019mm-mcDenatran
Variable Tp.—Variable type data: IV (instrumental variable data); ExpV (explanatory variable); DpV (dependent variable data), and CrV (control variable data); Variable Abr.—abbreviation; Variable Agg.—aggregation method; Time Res.—the time resolution of the data, as: d (daily); m (monthly), and; y (yearly). Time Agg.—the time aggregation method used; Spatial Res.—the spatial resolution of the source; Spatial Agg.—the spatial aggregation used, by municipality (mc) or states (uf). * Thermal anomalies were used as instrumental variables only in the robustness procedures.
Table 2. Descriptive statistics, subdivided by variable type and calculated at a municipal–monthly level.
TypeVariableUnitMeanStd. Devia.MinMax
IVBAkm213.18705010
TA#14.2573.0606814
WDirecdegree1.391.020.0027.72
WSpeedm/s235.6842.480.03359.95
ExpVAOD-0.240.170.033.35
DpVHosp.#20.6256.3101676
Small Children#7.9831.3101215
Children#2.547.600232
Elders#3.618.460210
Asthma#3.1010.420424
Pneumonia#11.3433.3901092
Bronchitis#0.735.420264
CrVPop#32,295100,8559312,130,264
GDPmil R$463,9972,493,686560673,200,000
Chd_d#0.832.69071
Crn_d#0.532.34072
Employe#2881159028,166
Beds#6526705099
Faci.#249101999
Temp_maxK309.74.7299.0353.9
Temp_medK303.63.3290.6320.0
Temp_minK297.36.0247.7314.8
Precpmm5.244.460.0029.05
Roadm/m24.6514.410.01242.00
Urb%0.331.730.0030.29
Cars#6780.0729,523.871.00689,937
Type of data: IV (instrumental variable); ExpV (explanatory variable); DpV (dependent variable) and CrV (control variable). Unit: # (number of).
Table 3. Correlation between the instrumental variables and the explanatory variable.
LogBABaWSpeedBaWDirec
AOD0.0023 ns−0.0672 ***−0.0644 ***
Significance levels: *** p < 0.001, ns not significant.
Table 4. Summary of estimates from the econometric specifications selected by the four-stage testing for each definition of the dependent variable.
DiseaseRespiratory SystemAsthmaPneumoniaBronchitis
AgeAllSmall ChildrenChildrenElderlyAllAllAll
EstimatorIVIVIVOLSIVIVOLS
IV setIVc01IVc04IVC04-IVc01IVc04-
Pollution coefficient0.1383 ***−0.3381 ***−0.1815 *0.00215 ***0.0792 ***−0.1790 ns0.0103 **
IV exogeneity and validity tests
Exog13.82 ***20.9530 ***7.6436 **-6.63 **7.6513 **-
Overid1.20 ns---3.56 ns--
Weak instrument tests
Joint1103.36252.589252.589-1103.36252.589-
Yogo: stat1445.95282.652282.652-1445.95282.652-
Yogo: crit22.316.3816.38-22.316.38-
Fixed effectsYYYYYYY
ControlsYYYYYYY
Obs.118,335118,335118,335118,335118,335118,335118,335
Notes: Estimator is the possible estimator method: IV for instrumental variable two-stage least squares method, and OLS for ordinary least squares estimator. IV Set is the possible instrumental combination: IVc01 is the Log_Ba plus the BaWSpeed and the BaWDirec; IVc02 is the Log_Ba plus the BaWSpeed; IVc03 is the Log_Ba plus the BaWDirec; and IVc04 is Log_Ba alone. Exog. computes a test of exogeneity for pollution based on a fixed-effects regression estimated via instrumental variables; Overid is the Sargan–Hansen statistic for the instrument overidentification test. Joint is the joint significance test of the instruments in the first-stage regression; Yogo: stat is the value of the Stock–Yogo test for instrument weakness. Yogo: crit is the table value for the Stock–Yogo test. Significance levels: *** p < 0.001, ** p < 0.01, * p < 0.05, ns not significant.
Table 5. Correlation among the instrumental variables and AOD.
Log_TATaWSpeedTaWDirecLog_BA
AOD0.1672 ***0.0323 ***0.1002 ***0.6892 ***
Significance levels: *** p < 0.001.
Table 6. Mean effect of the variation in aerosol optical depth (AOD) on hospitalization due to thermal anomalies, presented by age and respiratory illness type.
DiseaseRespiratory SystemAsthmaPneumoniaBronchitis
AgeAllSmall
Children
ChildrenEldersAllAllAll
OLS
AOD0.0443***0.0177**−0.0061ns0.0215***0.0265***0.059401***0.0103**
(0.0072) (0.0067) (0.0051) (0.0051) (0.0060) (0.0069) (0.0032)
OLS sig.2925.84***2114.69***1139.8***1460.89***1040.86***2391.69***677.16***
2SLS
AOD−0.0799*−0.2493***−0.1250***−0.0405*0.0483**−0.1237***−0.0488**
(0.0333) (0.0349) (0.0190) (0.0176) (0.0351) (0.0155)
1S sig.*********************
2S sig.*********************
Set of Instr.4442144
Exogeneity and IV validity tests:
Exog.20.71***128.64***38.12***14.79***3.06.49.23***22.67***
Overid.- - -0.4ns8.25*- -
Weak Instrument tests:
Joint2876.23***2876.23***2876.23***2177.03***2482.61***2876.23***2876.23***
Yogo: stat4782.32 4782.32 4782.32 3915.95 4311.03 4782.32 4782.32
Yogo: crit16.38 16.38 16.38 19.93 22.30 16.38 16.38
Notes: OLS sig. is the global significance calculated by the Wald test; 1S sig. stands for the global significance of the F-test for the first stage; 2S sig. is the global significance of the Wald test for the second stage; Set of Instr. is the order of the instrument set, where: 1 is LogTA + TaWSpeed + TaWDirec; 2 is LogTA + TaWDirec; 3 is LogTA + TaWSpeed; and 4 is LogTA. Exog. computes a test of exogeneity for a fixed-effects regression estimated via instrumental variables; Overid is the Sargan–Hansen statistic for the instrument overidentification test; Joint is the joint significance test of the instruments in the first-stage regression; Yogo: stat is the value of the Stock–Yogo test for instrument weakness; Yogo: crit is the table value for the Stock–Yogo test. Significance levels: *** p < 0.001, ** p < 0.01, * p < 0.05, ns not significant.
Publisher’s Note: MDPI stays neutral with regard to jurisdictional claims in published maps and institutional affiliations.