Article

Changes in the Distribution Pattern of PM2.5 Pollution over Central China

1
Key Laboratory for Aerosol-Cloud-Precipitation of the China Meteorological Administration, Nanjing University of Information Science & Technology, Nanjing 210044, China
2
Institute of Heavy Rain, China Meteorological Administration, Wuhan 430205, China
3
Department of Atmospheric Sciences, School of Environmental Studies, China University of Geosciences, Wuhan 430074, China
*
Author to whom correspondence should be addressed.
Remote Sens. 2021, 13(23), 4855; https://doi.org/10.3390/rs13234855
Submission received: 21 October 2021 / Revised: 21 November 2021 / Accepted: 27 November 2021 / Published: 30 November 2021

Abstract

:
The extent of PM2.5 pollution has reduced in traditional polluted regions such as the North China Plain (NCP), Yangtze River Delta (YRD), Sichuan Basin (SB), and Pearl River Delta (PRD) over China in recent years. Despite this, the Twain-Hu Basin (THB), which covers the lower flatlands in Hubei and Hunan provinces in central China, was found to be a high PM2.5 pollution region, with annual mean PM2.5 concentrations of 41–63 μg·m−3, which is larger than the values in YRD, SB, and PRD during 2014–2019, and high aerosol optical depth values (>0.8) averaged over 2000–2019 from the MODIS products. Heavy pollution events (HPEs) are frequently observed in the THB, with HPE-averaged concentrations of PM2.5 reaching up to 183–191 μg·m−3, which exceeds their counterparts in YRD, SB, and PRD for 2014–2019, highlighting the THB as a center of heavy PM2.5 pollution in central China. During 2014–2019, approximately 65.2% of the total regional HPEs over the THB were triggered by the regional transport of PM2.5 over Central and Eastern China (CEC). This occurred in view of the co-existing HPEs in the NCP and the THB, with a lag of almost two days in the THB-PM2.5 peak, which is governed by the strong northerlies of the East Asian monsoon (EAM) over CEC. Such PM2.5 transport from upstream source regions in CEC contributes 60.3% of the surface PM2.5 pollution over the THB receptor region. Hence, a key PM2.5 receptor of the THB in regional pollutant transport alters the distribution patterns of PM2.5 pollution over China, which is attributable to the climate change of EAMs. This study indicates a complex relationship between sources and receptors of atmospheric aerosols for air quality applications.

1. Introduction

Haze pollution, which is characterized by high concentrations of aerosol (especially particulate matter with diameters equal to or smaller than 2.5 µm (PM2.5)) in the ambient atmosphere [1,2], has become a significant environmental phenomenon in recent years [3,4,5,6,7,8,9,10]. Significant attention has been paid to the causative reasons of PM2.5 pollution, which is ascribed to air pollutant emissions, meteorological conditions including atmospheric boundary layer, synoptic process, and climate changes, especially the regional transport of source–receptor air pollutants [11,12,13,14,15]. Driven by atmospheric circulation, the regional transport of air pollutants with a source–receptor relationship needs to be understood for atmospheric environmental changes under the background of climate change.
Generally, PM2.5 pollution events are centered in four source regions over Central and Eastern China (CEC), namely the North China Plain (NCP), Yangtze River Delta (YRD), Pearl River Delta (PRD), and Sichuan Basin (SB) [16,17,18,19,20]. The Chinese government launched the Air Pollution Prevention and Control Action Plan, or ‘Clean Air Action’, to improve air quality since 2013 (www.gov.cn/zwgk/2013-09/12/content_2486773.htm, accessed on 21 November 2021). This has seen PM2.5 concentrations decrease drastically across China over the 2013–2018 period [21]. The regional PM2.5 concentration decreased to an annual mean of 34 μg·m−3 over the PRD in 2015, according to the 2015 China Environmental Status Bulletin, which has met the annual standard Grade II National Ambient Air Quality Standard (NAAQS) for PM2.5. However, PM2.5 pollution has increased recently over the Yangtze River middle basin (YRMB) in Central China [22,23,24,25,26], which may turn the YRMB area into a new polluted region over China. Consequently, the distribution pattern of air pollution over China has been altered. As such, the characteristics in PM2.5 pollution over the YRMB require urgent investigation to increase understanding of the environmental changes in China [27,28,29].
Given the particular drivers of atmospheric circulation over China, the regional transport of air pollutants discharged from source regions may cause a deterioration in air quality in receptor regions, resulting in regional haze events over a wide range of CEC during East Asian monsoons (EAMs) [14,30,31,32,33,34]. Haze episodes in the NCP are generally ascribed to the accumulation of air pollutants under stagnant meteorological conditions [35,36,37]. However, cold frontal passages usually favor the quick elimination of ambient pollutants in the NCP, as motivated by the strong northerlies in the East Asian winter monsoon (EAWM) season [37,38], which can facilitate the long-range transport of air pollutants from upwind to downwind areas over China [39,40]. Thus, we need to clearly understand the importance of the downwind receptor area built by regional pollutant transport in the atmospheric environment and the meteorological mechanisms under the background of climate change.
The Twain-Hu Basin (THB), which is a sub-basin covering the lower plain in Hubei and Hunan provinces in the YRMB, is surrounded by the four traditional PM2.5 pollution regions, as shown in Figure 1. Thus, the THB is the transport pivot point for the regional PM2.5 pollution in China driven by the EAM. However, regional air pollution over the THB and its relationship to the heavy pollution events (HPEs) over CEC have rarely been comprehensively and systematically investigated using long-term observations and model simulations. Herein, we first characterize the spatiotemporal distributions of PM2.5 concentrations and the frequency of HPEs for the five target regions of the THB, NCP, YRD, SB, and PRD during 2014–2019, and find the THB to be a center of heavy PM2.5 pollution in central China. Furthermore, the causes of HPEs over the THB are explored and found to be mostly associated with the regional transport of source–receptor air pollutants over CEC, according to the anomalies of HPEs relative to the long-term atmospheric circulation structures. Finally, the relative importance of source regions is assessed using the FLEXPART-WRF model simulation. Our study illuminates a key PM2.5 receptor of the THB in regional pollutant transport, which alters the distribution patterns of PM2.5 pollution over China, which can improve our understanding of the regional transport of air pollutants in atmospheric environmental changes.

2. Materials and Methods

2.1. Data Source

PM2.5 datasets were obtained from the Ministry of Ecology and Environment of China (http://106.37.208.233:20035/, accessed on 21 November 2021) with a temporal resolution of 1 h, which were sourced from over 1600 air quality monitoring stations in China. The regional mean concentrations of PM2.5 for the HPE analysis were calculated from the observation sites in major cities of the NCP, YRD, SB, PRD, and THB, respectively. The locations of observation sites are shown in Figure 2a. Table 1 lists the mentioned region names and their acronyms to avoid confusion.
The MODIS is a sensor aboard the TERRA satellite of NASA with 36 bands from 0.4 to 14.4 mm, a relatively fine spatial resolution between 250 and 1000 m, and a wide range of ~2330 km. MODIS (Terra) Collection 6.1 L2 aerosol products (MOD04_L2) from 2000–2019 with 10 km × 10 km spatial resolution, derived from NASA Level 1 and the Atmosphere Archive and Distribution System (https://ladsweb.nascom.nasa.gov/data/search.html, accessed on 21 November 2021), are used in this study. The Dark-Target (DT) algorithm products for aerosol optical depth (AOD) at 550 nm were chosen for this study, as DT works best over dense and dark vegetated targets. To better analyze the distributions of climatic changes, the 10 km retrievals were aggregated to the dataset with a horizontal resolution of 0.1° × 0.1° using the Cressman interpolation method. Valid data were selected to calculate the annual average. Due to the long-term period (2000–2019), MODIS data was employed to evaluate the spatiotemporal distribution of the aerosols over CEC. This greatly reduced the retrieval uncertainties.
ERA5 reanalysis meteorology data for 2015–2019 with a spatial resolution of 0.25° × 0.25°, and the time resolution of 6 hour, from the European Centre for Medium-Range Weather Forecasts (https://cds.climate.copernicus.eu/cdsapp#!/dataset/reanalysis-era5-land?tab=form, accessed on 21 November 2021), were used to analyze the wind fields and synoptic conditions during HPEs over CEC.

2.2. FLEXPART-WRF Model

We used the FLEXPART-WRF version 3.1 [41,42,43] model to simulate the sources and transport routes of tracer particles before reaching the receptor site, in consideration of the processes of tracer transport, turbulent diffusion, wet and dry depositions, decay, and linear chemistry in the atmosphere [41]. The model simulates the transport and dispersion of tracers by calculating the backward trajectories of multitudinous particles, which reflect the distribution of potential source regions that may have an impact on a target point or receptor region [44,45,46]. Meteorological data with a resolution of 10 km were output from the WRF model, which was described in Yu et al. [14]. This model has been largely applied to study the source–receptor relationships of environmental pollutants [43,47,48,49].
Here, the FLEXPART-WRF simulation was conducted for a 48-hour backward trajectory of the release of 50,000 air particles from Xiangyang (32.04°N, 112.14°E) for HPEs during 2015–2019 and Wuhan (30.61°N, 114.42°E) during the winters of 2008–2017, both of which are in the THB region. Subsequently, the residence time (not the lifetime) of all tracer particles, normalized by the total number of released particles, is determined on a uniform grid and considered as the “footprint” (in units of s). The output with the residence time of tracer particles is simulated using a horizontal resolution of 0.1° × 0.1°. The source contributions of emission sectors and spatial distribution are then evaluated by incorporating the gridded footprint into the primary PM2.5 emission inventories, which are derived from the Multi-resolution Emission Inventory for China (MEIC, http://www.meicmodel.org/, accessed on 21 November 2021), detailed descriptions can be found elsewhere [14,49].

2.3. Figure Illustration

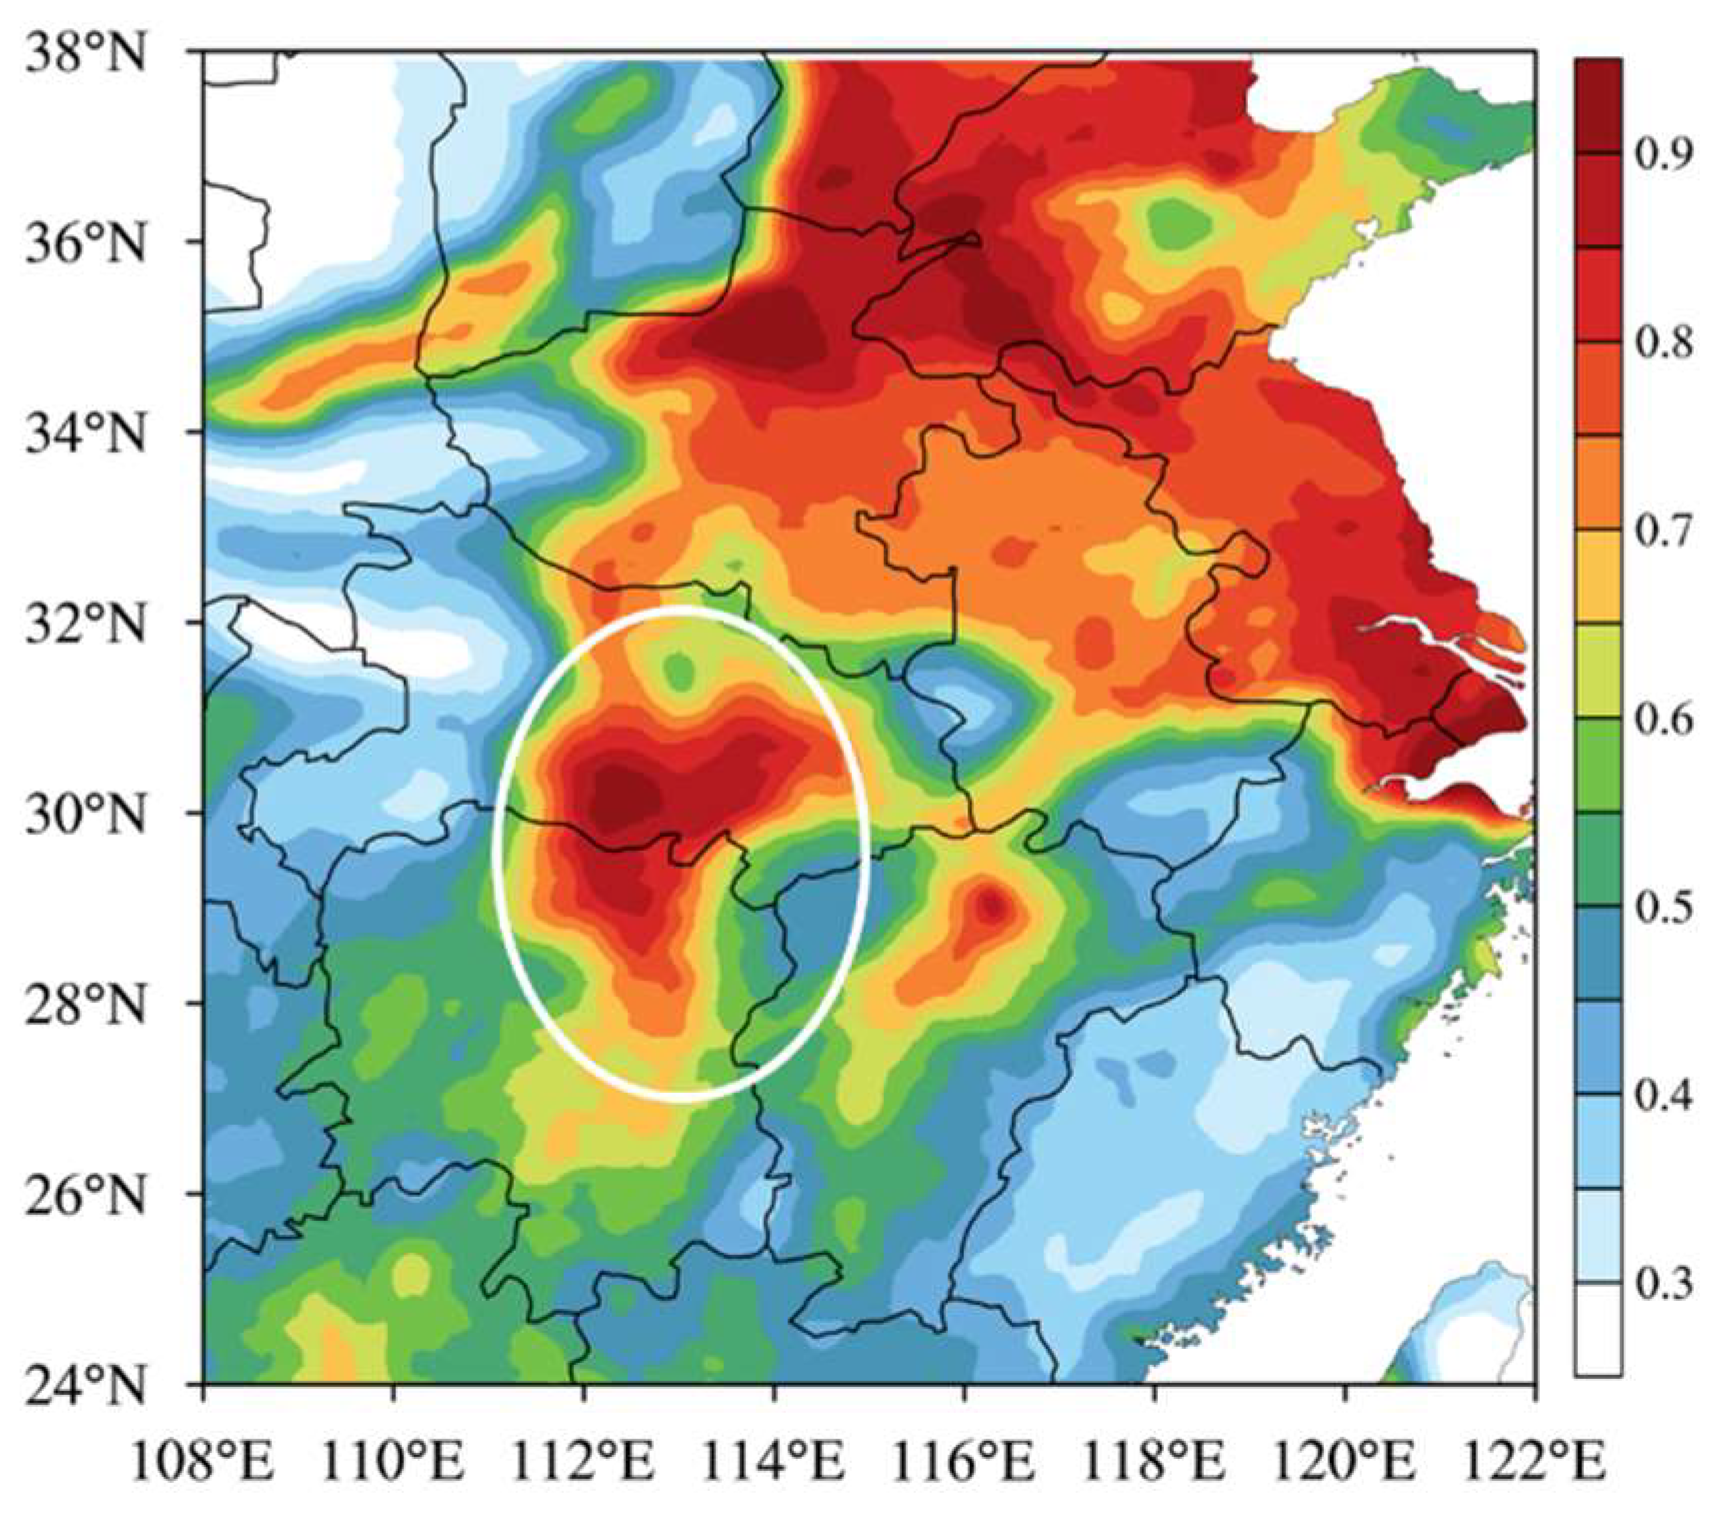
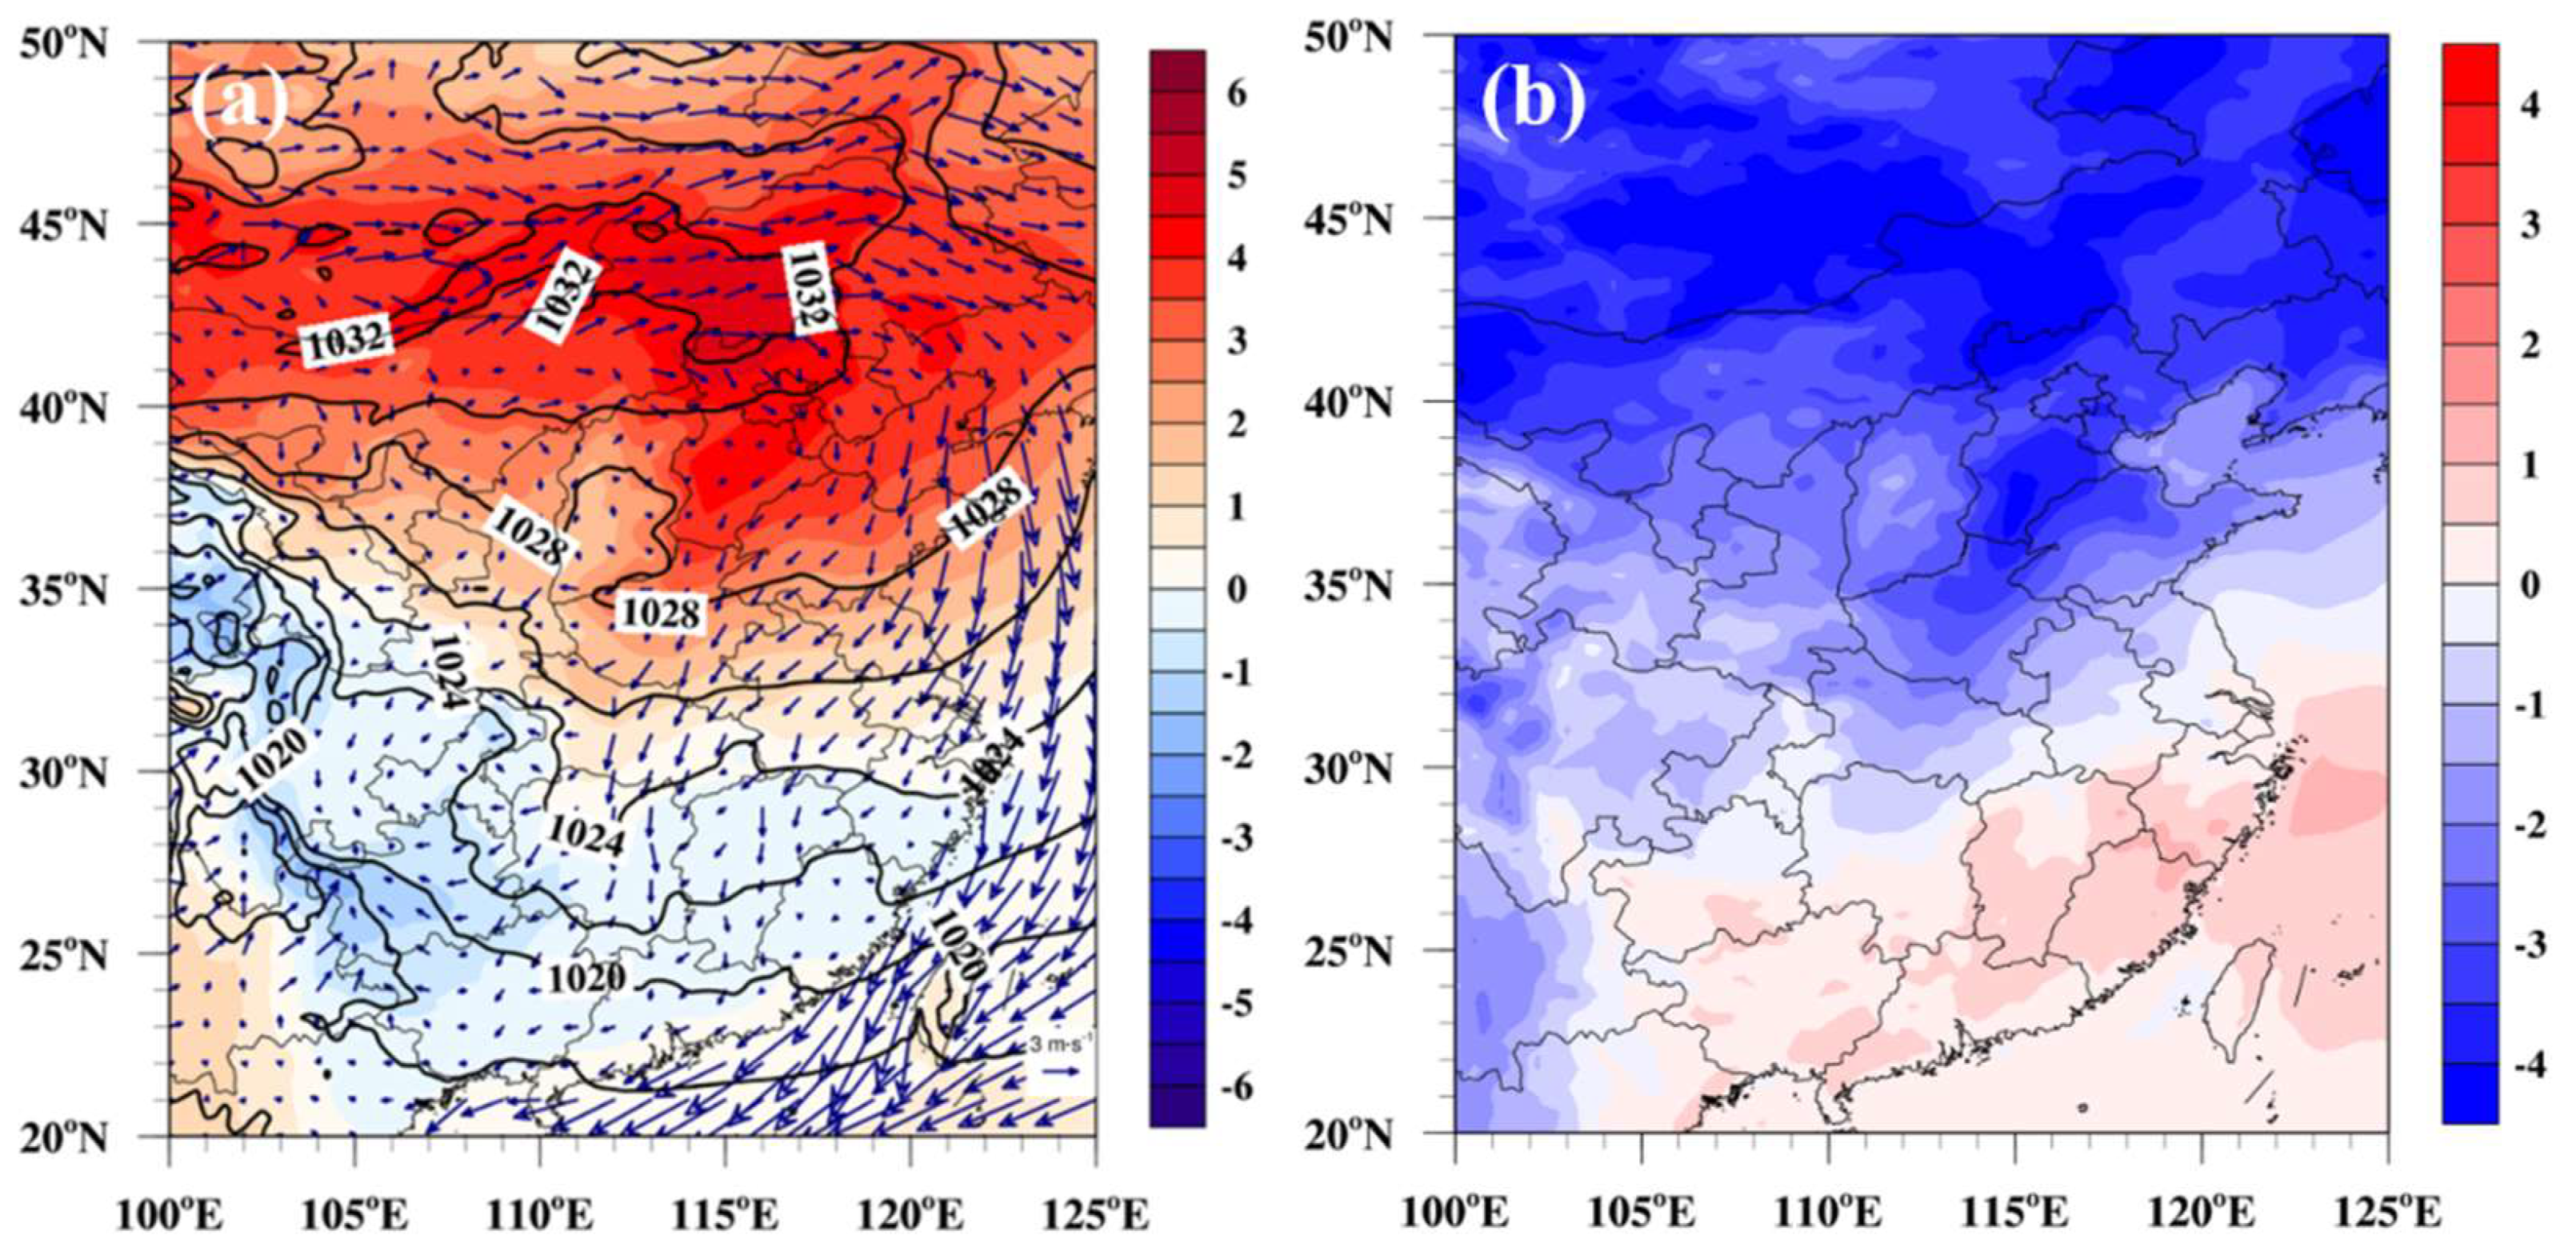
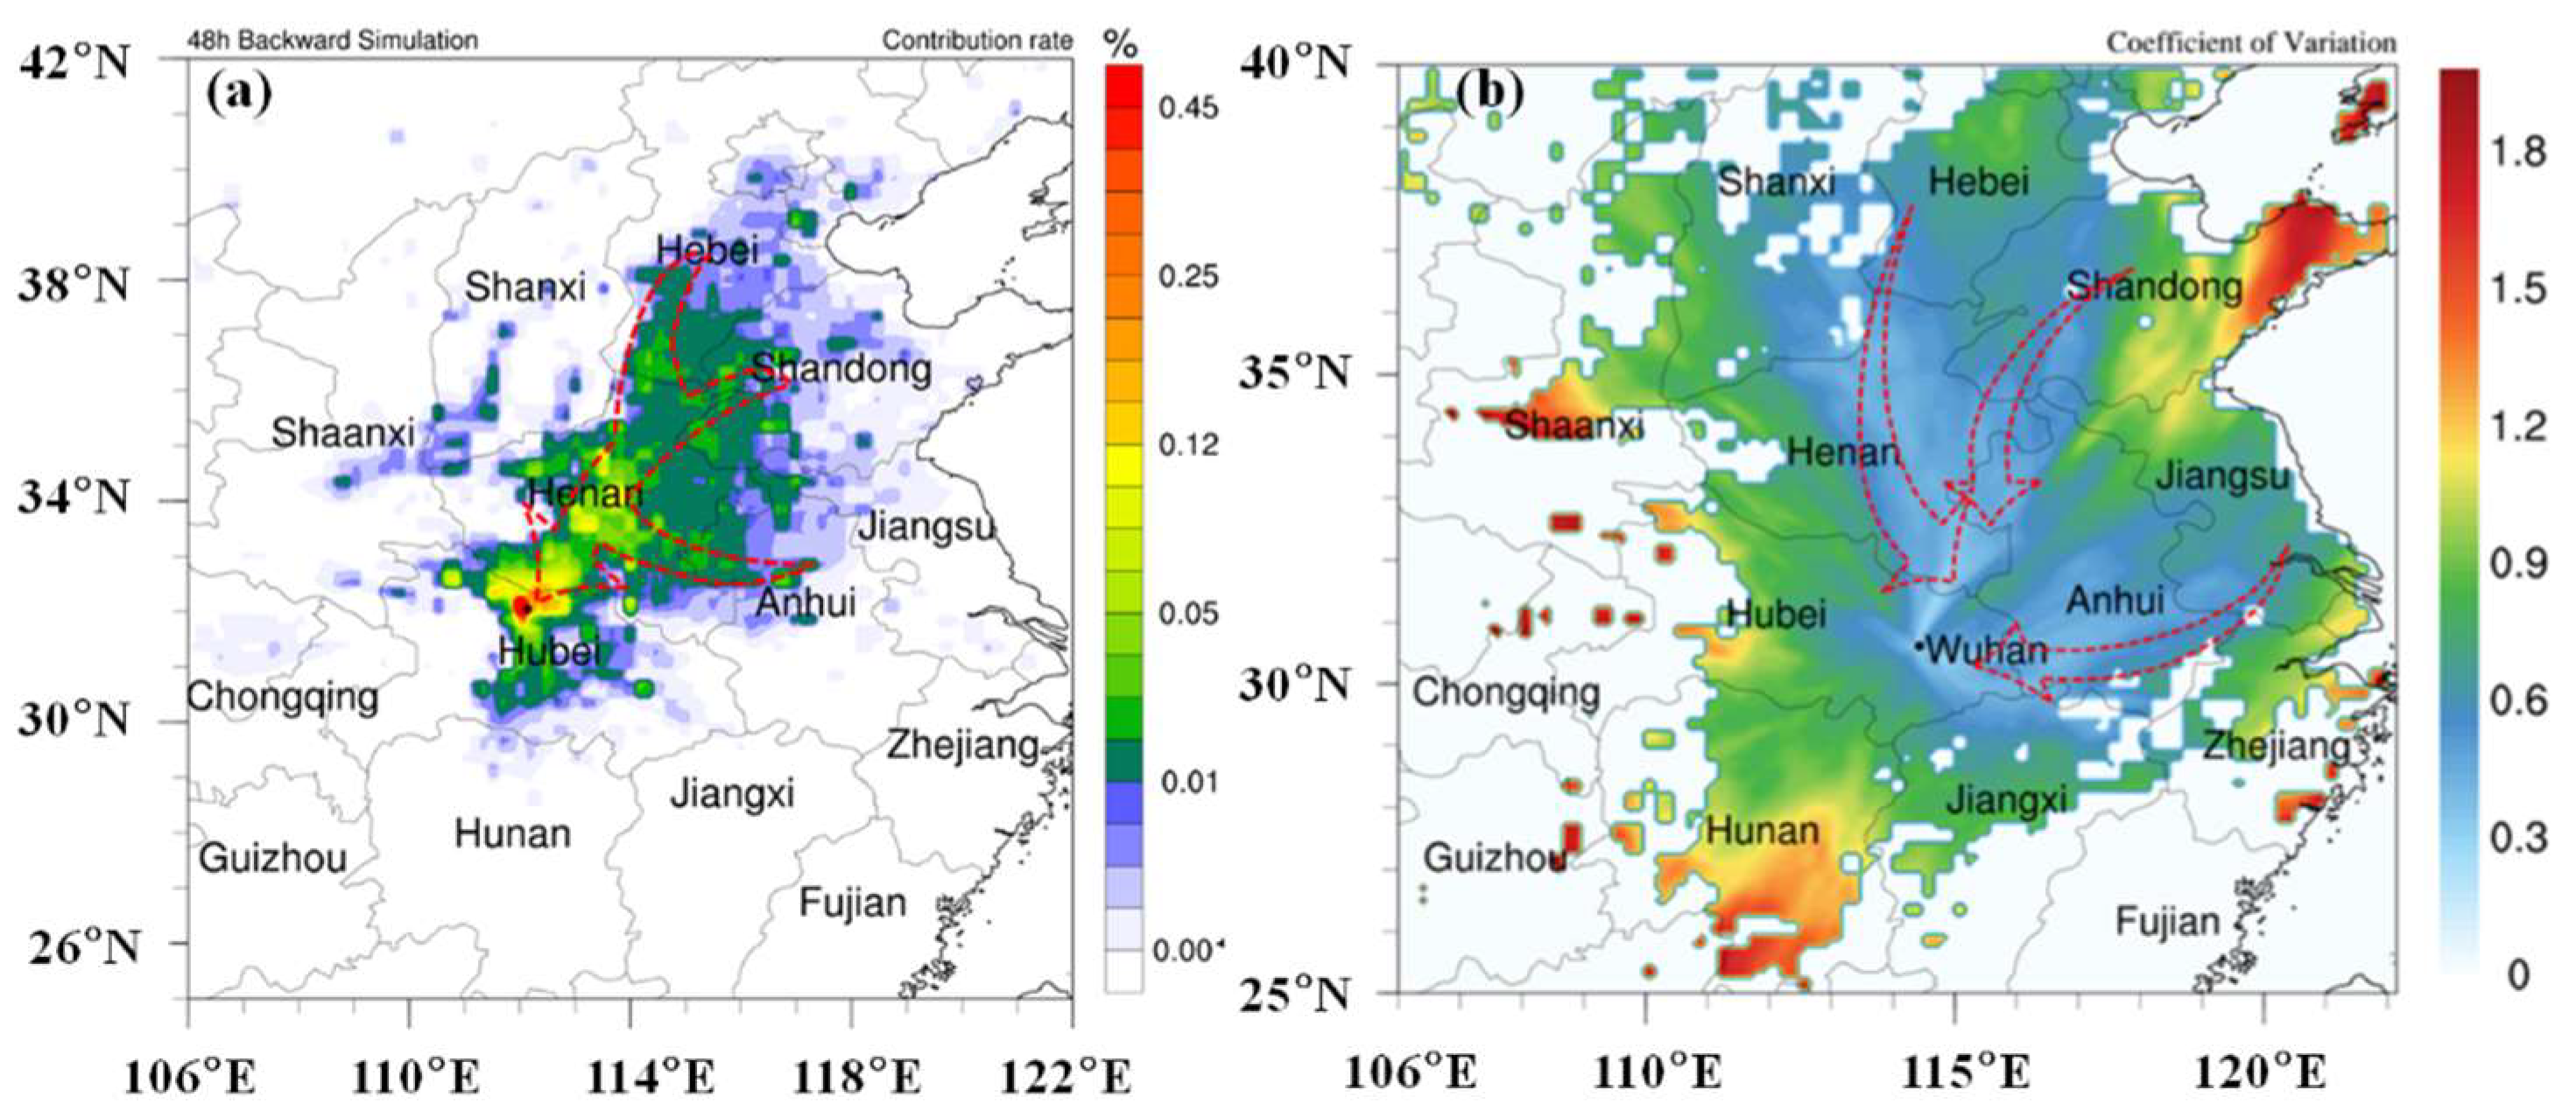
In this study, figures are used to illustrate corresponding contents for different purposes. Figure 1 generally shows the locations of five target regions over CEC and the corresponding topography. Figure 2a shows the spatial distributions of PM2.5 over China, which further reveals the five major pollution regions centered over CEC. Figure 3 is derived from long-term MODIS data, which principally indicate the THB being an aerosol pollution area and confirm the THB as a pollution region from the aerosol remote sensing data in addition to the surface observations discussed above; therefore, the spatial area is smaller than the other figures to minimize the calculation resources for the long-term MODIS products. Figure 4 illustrates the synoptic weather conditions for the 30 HPEs over the THB, so the spatial area represented is larger to comprehensively and accurately discuss the atmospheric circulation structures over CEC. Figures 5 and 6 exhibit the spatial evolution of PM2.5 pollution and the transport routes occurring over CEC from the observation and model simulation.

3. Results

3.1. Severe PM2.5 Pollution over the Twain-Hu Basin

Figure 2a shows the spatial distributions of surface PM2.5 concentrations in China from 2014 to 2019. Five polluted regions covering the NCP, YRD, SB, PRD, and THB are found with 6-year mean PM2.5 concentrations mostly exceeding 35 μg·m−3. Zhang et al. [20] also pointed out severe haze events over Central China based on long-term surface visibility datasets. In 2014, the annual PM2.5 concentrations over the five aforementioned regions well exceed the NAAQS (annual average of 35 µg·m−3). The NCP had the highest annual PM2.5 concentration of 81 μg·m−3, followed by the THB (63 μg·m−3), the YRD (56 μg·m−3), the SB (50 μg·m−3), and the PRD, with the lowest annual mean of 36 μg·m−3 (Figure 2b). The PM2.5 concentrations drop largely from 2014 to 2019 at rates of −6.8, −4.5, −3.4, −3.3, and −1.6 μg·m−3·y−1 in the NCP, THB, YRD, SB, and PRD (Figure 2b), respectively, which has been ascribed to the Clean Air Action implemented by the Chinese Government to aggressively control anthropogenic emissions [21]. The mean concentrations of PM2.5 in 2019 are in the order of NCP (48 μg·m−3) > THB (41 μg·m−3) > YRD (39 μg·m−3) > SB (33 μg·m−3) > PRD (26 μg·m−3). Thus, the NCP acts as the region with the highest annual PM2.5 concentration despite it having the fastest decreasing rate, whereas the THB is the region with the second highest amount of PM2.5 pollution, even though its reduction extent is greater than those in the YRD, SB, and PRD. Such severe PM2.5 pollution over the THB is also detected from the aerosol remote sensing data. Figure 3 shows that AOD values were high (>0.8) over the sub-basin in the central China during 2000–2019, as shown in Figure 1, thereby indicating an aerosol pollution area over the THB. On the other hand, the MODIS–AOD trend in the THB has shown a decreasing trend since 2013 [24]. The contrary trends of AOD and PM2.5 are related to the different physical properties in the two variables. The physical relationship between AOD and PM2.5 is complicated by aerosol size distributions, boundary layer depths, relative humidity, particle types, and diurnal variations in PM2.5 [50], which could be material for a further study on air pollution change through examining fine data of aerosols and meteorology.

3.2. Center of Heavy PM2.5 Pollution Events over the Twain-Hu Basin

In this study, one HPE is considered to occur when the daily PM2.5 concentration is above 150 μg·m−3, according to the China Environmental Protection Standard HJ 633-2012 (http://www.cnemc.cn/jcgf/dqhj/201706/P020181010540071146103.pdf, accessed on 21 November 2021). The occurrence frequencies of HPEs averaged for the major cities in the five regions is calculated during 2014–2019 via dividing the total HPE days by the overall days in one year. The mean concentrations of PM2.5 during these HPEs are listed in Table 2. Generally, the PRD has the lowest HPE frequency (<0.4%), which resulted in rare HPEs happening during 2014–2019. Although the HPE frequency has decreased significantly in the NCP since 2014, the PM2.5 concentrations averaged over the NCP-HPEs are higher than those in the other regions and varied slightly over the period of 2014–2019, which indicates that the concentrations of heavy PM2.5 pollution have not changed significantly in the NCP during recent years, despite the remarkable decreasing trends (Figure 2b). Zhang et al. [51] found that the frequency of heavy haze episodes decreased, but haze severity only reduced slightly, and that moderate haze episodes showed no improvement over the NCP. The pollution frequencies in regions of YRD, SB and THB were lower, with values less than 3.3%, than the NCP during 2014–2019, with overall decreases in occurrence of HPEs in the CEC regions. However, the mean concentrations of PM2.5 during the HPEs reached up to 183–191 μg·m−3 over the THB, which mostly exceeds the counterparts in the YRD and the SB and significantly narrows the difference in PM2.5 pollution levels with the NCP (Table 2). Such comparisons imply that the THB has become a new center of heavy PM2.5 pollution over the YRMB; thus, the environmental problem in this area warrants urgent attention.

3.3. Attribution of Heavy Pollution Events in the Twain-Hu Basin

Given that the THB is a geographical junction linking the four pollution regions of the NCP, YRD, PRD, and SB (Figure 1), the reason for this center of heavy PM2.5 pollution should be explored in detail for further pollution prevention as there are scarce studies available in this area now. Subsequently, a regional HPE is defined as being when the HPE occurs in three or more cities over the THB during 2015–2019. Finally, 46 days of HPEs were detected, mostly during the season of EAWM (January to March, November, and December) over CEC (Table S1). Among them, 30 days, mainly in the wintertime were matched with the regional transport of air pollutants from the upstream source regions in Northern China, driven by the atmospheric circulation of cold air activity over CEC, according to the atmospheric circulation provided by the ERA5 reanalysis data.
Consistent atmospheric circulation structures occur over CEC during the 30 days of HPEs (Figure 4). Compared with the five-year climatological mean from 2015 to 2019, the negative (positive) anomalies of 2 m air temperature over the THB and its northern regions (the south of the THB) are observed during the 30 HPEs (Figure 4b), which is contrary to the sea-level pressure anomalies (Figure 4a). Such synoptic conditions are typical for the southward incursion of cold airflows with a high air pressure system, which can generate large pressure gradients and strong northerly winds [52], especially over the THB and the upstream region, thus driving the regional PM2.5 transport for the THB’s air pollution. Meanwhile, the contrast temperature anomalies over the THB and the decreasing winds in the downwind of THB further reveal that the advections of cold airflows are just reaching the northern THB, which is conducive to the convergence of air pollutants from upstream regions to the THB along with the transport of air masses. Strong winds usually promote the removal of air pollutants in the source regions [53,54]. However, HPEs are mostly triggered by prevailing northerlies over the THB, indicating the attribution of the HPE center in the THB to regional PM2.5 transport from upwind areas over CEC, as regulated by the anomalous northerlies during the EAWM season.
It is evident that the upwind regions of the THB are featured with high levels of PM2.5 (>150 μg·m−3) persisting in Northern China (mostly over the source regions in NCP) 2 days prior to the HPEs in the THB (Figure 5a); these air pollutant parcels flow southward, driven by the northerly winds, and finally reach the THB (Figure 5b), where the PM2.5 concentrations increase noticeably over time to a heavy PM2.5 pollution level. The negative and positive PM2.5 differences in regions of the NCP and THB, as well as the anomalous northerlies over CEC between 2 days prior to and on the day of the HPE in the THB (Figure 5c), confirm the regional transport of PM2.5 from the upstream CEC source regions to the downstream THB receptor region. The occurrence of 30 day HPEs over the THB is generally connected with those over the NCP during the evolution of the air pollution processes. The NCP still has the most severe heavy PM2.5 pollution in spite of the frequency decrease as shown in Table 2, where the meteorological changes determine the HPE frequency (especially the HPEs terminated by strong northerlies of EAWM) [35,36,37,38,39,40]. Meanwhile, 65.2% of the total regional events over the THB are dominated by the regional transport processes over CEC. A relationship between alleviating PM2.5 pollution over the NCP and deteriorating air quality in the downwind region is built into the regional transport of air pollutants from the NCP, which could act as a major source region for the regional change in air pollutants in the downwind THB receptor regions over China. Shen et al. [55,56] also pointed out that air pollutants from the CEC source regions of NCP and YRD contributed greatly to PM2.5 pollution over the THB during strong cold airflows and the COVID-19 period. Yu et al. [14] found unique “non-stagnant” meteorological conditions, including strong northerly winds, no temperature inversion, and additional unstable structures in the atmospheric boundary layer, during the noteworthy cases of heavy PM2.5 pollution in Wuhan of Hubei provinces.
Figure 5d shows further that the hourly PM2.5 concentrations exhibit inverse changes over the THB and the NCP regions during 30 THB–HPEs for the years of 2015–2019, and the PM2.5 peak over the THB is delayed for almost 2 days compared with that of the NCP, which is consistent with the results of Hu et al. [57]. Although the PM2.5 peak concentrations in the THB are slightly smaller than those in the NCP, which are attributable to the dilution effect when being transported, local emission can also be important during these processes, considering the high levels of PM2.5 concentrations in the THB. Overall, the co-existing HPEs in the NCP’s source region and the THB’s receptor area reveal the noticeably regional transport of source–receptor PM2.5 over CEC, as governed by the southward invasion of the EAWM winds, which could give rise to an important receptor center for heavy aerosol pollution in the THB over YRMR. In particular, the HPEs in the THB might have been aggravated by such regional transport, given the significant increase in co-existing HPE days in the NCP and the THB in 2019 (Table S1).

3.4. Assessing the Contribution of Heavy Pollution Events in the Twain-Hu Basin

The upstream sources of PM2.5 emissions for 30 day HPEs over CEC are recognized with the key receptor region in THB based on the FLEXPART-WRF model simulation (Figure 6). The major pathway is centered along the northeasterly route from Hebei, Shandong, Anhui, and Henan provinces, which is comparable to the transport pathway from the observations (Figure 5a,b and Figure 6a). Meanwhile, the principal transport routes for the HPEs during 2015–2019 are generally consistent with those during 2008–2017, considering the three pathways of low-variation coefficients for the contribution rates in Wuhan, Hubei Province (Figure 6b), which comprise the northerly route from the NCP, northeasterly route along the low foothill channel on the west side of the Dabie Mountains, and easterly route along the Yangtze River channel.
A total of 30 HPEs, accounting for 65.2% of the 46 total regional events over the THB, are estimated with the southward transport of pollutants from the source region of NCP to the receptor region, with an almost 2-day delay in the peak PM2.5 concentration over the THB (Figure 5). The relative contributions of regional PM2.5 transport over CEC to the 30 day HPEs in a THB site, namely Xiangyang, Hubei Province, are calculated as ranging from 28.9% to 80.3%, with an average of 60.3% (Table S1). Such variance in regional contribution reveals that the source emissions over CEC have different impact extents on the formation of HPEs over the THB despite generally large contributions of surface PM2.5 from source regions, which should be investigated in detail in future study. In particular, 76.7% of the 30 HPEs have regional contributions greater than 50.0%, thereby revealing a significant role in regional PM2.5 transport from upstream source regions over CEC in formatting the center of HPEs over the THB receptor region. In this study, the potential source contribution is evaluated based on transport alone, ignoring complex deposition and chemical conversion for the formation of secondary particles. The results derived in this study could represent the basic features of contribution and patterns of regional PM2.5 transport over CEC when limited to the primary PM2.5 particles.

4. Discussion

Based on the long-term data of surface PM2.5 and aerosol remote sensing from the MODIS, the THB, which covers the lower plain in Hubei and Hunan provinces of the YRMB, is identified as a high PM2.5 pollution region in China, with an annual mean PM2.5 of 41–63 μg·m−3, which is larger than values recorded in YRD, SB, and PRD during 2014–2019, and high AOD values (>0.8) for 2000–2019. A center of heavy PM2.5 pollution over the THB has the HPE-averaged concentrations reaching up to 183–191 μg·m−3, which exceeds the counterparts in the YRD, SB, and PRD. Such exceptional pollution over the THB changes the distribution pattern of PM2.5 pollution in central China.
During 2015–2019, 30 HPEs, accounting for 65.2% of the 46 total regional events over the THB, were dominated by the regional transport processes over CEC, in view of the co-existing HPEs in the NCP and the THB with a two-day delay in the peak PM2.5 concentration. Such processes are triggered by the strong northerlies in the EAM season over CEC, where the key receptor region of PM2.5 pollution in the THB exists in regional pollutant transport over China. According to the FLEXPART-WRF simulations for HPEs during 2015–2019, the regional transport of PM2.5 from upstream CEC source regions contributes approximately 60.3% to the HPEs over the THB receptor region. Thus, the change in distribution patterns of the atmospheric environment in China is attributed to regional transport of source–receptor air pollutants, as regulated by the anomalous EAM winds.

5. Conclusions

This study systematically characterizes the spatiotemporal distributions of PM2.5 concentrations and the frequency of HPEs for the five target regions of the THB, NCP, YRD, SB, and PRD over China during 2014–2019, using long-term surface observations and satellite remote sensing data. Moreover, a key PM2.5 receptor of the THB, which is associated with the regional pollutant transport over CEC triggered by the climate change of EAMs, is found to alter the distribution patterns of PM2.5 pollution over China.
Air quality change is strongly influenced by pollutant emissions and meteorological drivers. Furthermore, regional transport of air pollutants complicates the relationships between sources and receptors in atmospheric aerosols for air quality applications, which are governed by multi-scale atmospheric circulations, and physical and chemical processes. Therefore, the special variations in PM2.5 over the THB which have unique causative factors can be further investigated, with more comprehensive analyses on changes in air pollutant emissions, atmospheric physical, and chemical processes, as well as the EAM climate.

Supplementary Materials

The following are available online at https://www.mdpi.com/article/10.3390/rs13234855/s1, Table S1: Descriptive statistics of HPEs over THB during 2015–2019.

Author Contributions

L.S. wrote, reviewed, and edited the manuscript; W.H. provided the dataset, reviewed, and edited the manuscript; T.Z. proposed the study and edited the manuscript. Y.B. validated and reviewed. H.W. assisted with the data analysis; S.K. reviewed; Y.Z. provided the dataset. All authors have read and agreed to the published version of the manuscript.

Funding

This research was supported by the National Natural Science Foundation of China (41830965, 42075186 and 91744209) and the National Key R&D Program Pilot Projects of China (2016YFC0203304).

Institutional Review Board Statement

Not applicable.

Informed Consent Statement

Not applicable.

Data Availability Statement

MODIS (Terra) Collection 6.1 L2 aerosol products (MOD04_L2) are available at https://ladsweb.nascom.nasa.gov/data/search.html (accessed on 21 October 2021). ERA5 reanalysis meteorology data were obtained from the European Centre for Medium-Range Weather Forecasts (https://cds.climate.copernicus.eu/cdsapp#!/dataset/reanalysis-era5-land?tab=form, accessed on 21 October 2021). The NCEP reanalysis data are available at https://psl.noaa.gov/data/gridded/reanalysis/ (accessed on 21 October 2021). The PM2.5 datasets and Multi-resolution Emission Inventory for China emission source data are available at http://beijingair.sinaapp.com/ and http://meicmodel.org/?page_id=89 (accessed on 21 October 2021).

Acknowledgments

The authors would like to acknowledge Chao Yu for providing the product shown in Figure 6b. We are grateful for the comments from the reviewers.

Conflicts of Interest

The authors declare no conflict of interest.

References

  1. Zhang, X.; Sun, J.; Wang, Y.; Li, W.; Zhang, Q.; Wang, W.; Quan, J.; Cao, G.; Wang, J.; Yang, Y.; et al. Factors contributing to haze and fog in China. Sci. Bull. 2013, 58, 1178–1187. [Google Scholar]
  2. Li, Z.; Guo, J.; Ding, A.; Liao, H.; Liu, J.; Sun, Y.; Wang, T.; Xue, H.; Zhang, H.; Zhu, B. Aerosol and boundary-layer interactions and impact on air quality. Natl. Sci. Rev. 2017, 4, 810–833. [Google Scholar] [CrossRef]
  3. An, Z.; Huang, R.J.; Zhang, R.; Tie, X.; Li, G.; Cao, J.; Zhou, W.; Shi, Z.; Han, Y.; Gu, Z.; et al. Severe haze in Northern China: A synergy of anthropogenic emissions and atmospheric processes. Proc. Natl. Acad. Sci. USA 2019, 116, 8657–8666. [Google Scholar] [CrossRef] [Green Version]
  4. Chan, C.K.; Yao, X.H. Air pollution in mega cities in China. Atmos. Environ. 2008, 42, 1–42. [Google Scholar] [CrossRef]
  5. Chang, Y.; Huang, R.J.; Ge, X.; Huang, X.; Hu, J.; Duan, Y.; Zou, Z.; Liu, X.; Lehmann, M. Puzzling haze events in China during the coronavirus (COVID-19) shutdown. Geophys. Res. Lett. 2020, 47, e2020GL088533. [Google Scholar] [CrossRef]
  6. Callahan, C.W.; Mankin, J.S. The influence of internal climate variability on projections of synoptically driven Beijing haze. Geophys. Res. Lett. 2020, 47, e2020GL088548. [Google Scholar] [CrossRef]
  7. Du, H.; Li, J.; Wang, Z.; Dao, X.; Guo, S.; Wang, L.; Ma, S.; Wu, J.; Yang, W.; Chen, X.; et al. Effects of regional transport on haze in the North China Plain: Transport of precursors or secondary inorganic aerosols. Geophys. Res. Lett. 2020, 47, e2020GL087461. [Google Scholar] [CrossRef]
  8. Guo, S.; Hu, M.; Zamora, M.L.; Peng, J.; Shang, D.; Zheng, J.; Molina, M.J.; Zhang, R. Elucidating severe urban haze formation in China. Proc. Natl. Acad. Sci. USA 2014, 111, 17373–17378. [Google Scholar] [CrossRef] [Green Version]
  9. Wang, H.; Miao, Q.; Shen, L.; Yang, Q.; Wu, Y.; Wei, H. Air pollutant variations in Suzhou during the 2019 novel coronavirus (COVID-19) lockdown of 2020: High time-resolution measurements of aerosol chemical compositions and source apportionment. Environ. Pollut. 2021, 271, 116298. [Google Scholar] [CrossRef]
  10. Wang, H.; Pei, Y.; Yin, Y.; Shen, L.; Chen, K.; Shi, Z.; Chen, J. Observational Evidence of Lightning-Generated Ultrafine Aerosols. Geophys. Res. Lett. 2021, 48, e2021GL093771. [Google Scholar] [CrossRef]
  11. Rosenfeld, D.; Sherwood, S.; Wood, R.; Donner, L. Climate effects of aerosol-cloud interactions. Science 2014, 343, 379–380. [Google Scholar] [CrossRef]
  12. Tao, M.H.; Chen, L.F.; Su, L.; Tao, J.H. Satellite observation of regional haze pollution over the north China plain. J. Geophys. Res. 2012, 117, D12203. [Google Scholar] [CrossRef]
  13. Wang, N.; Ling, Z.H.; Deng, X.J.; Deng, T.; Lyu, X.P.; Li, T.Y.; Gao, X.R.; Chen, X. Source contributions to PM2.5 under unfavorable weather conditions in Guangzhou City, China. China Adv. Atmos. Sci. 2018, 35, 1145–1159. [Google Scholar] [CrossRef]
  14. Yu, C.; Zhao, T.; Bai, Y.; Zhang, L.; Kong, S.; Yu, X.; He, J.; Cui, C.; Yang, J.; You, Y.; et al. Heavy air pollution with a unique “non-stagnant” atmospheric boundary layer in the Yangtze River middle basin aggravated by regional transport of PM2.5 over China. Atmos. Chem. Phys. 2020, 20, 7217–7230. [Google Scholar] [CrossRef]
  15. Zheng, S.; Pozzer, A.; Cao, C.; Lelieveld, J. Long-term (2001–2012) concentrations of fine particulate matter (PM2.5) and the impact on human health in Beijing, China. Atmos. Chem. Phys. 2015, 15, 5715–5725. [Google Scholar] [CrossRef] [Green Version]
  16. Gui, K.; Che, H.; Wang, Y.; Wang, H.; Zhang, L.; Zhao, H.; Zheng, Y.; Sun, T.; Zhang, X. Satellite-derived PM2.5 concentration trends over Eastern China from 1998 to 2016: Relationships to emissions and meteorological parameters. Environ. Pollut. 2019, 247, 1125–1133. [Google Scholar] [CrossRef] [PubMed]
  17. Han, R.; Wang, S.; Shen, W.; Wang, J.; Wu, K.; Ren, Z.; Feng, M. Spatial and temporal variation of haze in China from 1961 to 2012. J. Environ. Sci. 2016, 46, 134–146. [Google Scholar] [CrossRef]
  18. Shen, L.; Wang, H.; Cheng, M.; Ji, D.; Liu, Z.; Wang, L.; Gao, W.; Yang, Y.; Huang, W.; Zhang, R.; et al. Chemical composition, water content and size distribution of aerosols during different development stages of regional haze episodes over the North China Plain. Atmos. Environ. 2021, 245, 118020. [Google Scholar] [CrossRef]
  19. Xu, X.; Zhao, T.; Liu, F.; Gong, S.L.; Kristovich, D.; Lu, C.; Guo, Y.; Cheng, X.; Wang, Y.; Ding, G. Climate modulation of the Tibetan Plateau on haze in China. Atmos. Chem. Phys. 2016, 16, 1365–1375. [Google Scholar] [CrossRef] [Green Version]
  20. Zhang, X.Y.; Wang, Y.Q.; Niu, T.; Zhang, X.C.; Gong, S.L.; Zhang, Y.M.; Sun, J. Atmospheric aerosol compositions in China: Spatial/temporal variability, chemical signature, regional haze distribution and comparisons with global aerosols. Atmos. Chem. Phys. 2012, 12, 779–799. [Google Scholar] [CrossRef] [Green Version]
  21. Zhai, S.; Jacob, D.J.; Wang, X.; Shen, L.; Li, K.; Zhang, Y.; Gui, K.; Zhao, T.; Liao, H. Fine particulate matter (PM2.5) trends in China, 2013–2018: Separating contributions from anthropogenic emissions and meteorology. Atmos. Chem. Phys. 2019, 19, 11031–11041. [Google Scholar] [CrossRef] [Green Version]
  22. Bai, Y.; Qi, H.; Zhao, T.; Yang, H.; Liu, L.; Cui, C. Analysis of meteorological conditions diurnal variation characteristics of PM2.5 heavy pollution episodes in the winter of 2015 in Hubei province. Acta Meteorol. Sin. 2018, 76, 803–815. [Google Scholar]
  23. Lu, M.; Tang, X.; Wang, Z.; Wu, L.; Chen, X.; Liang, S.; Zhou, H.; Wu, H.; Hu, K.; Shen, L.; et al. Investigating the transport mechanism of PM2.5 pollution during January 2014 in Wuhan, Central China. Adv. Atmos. Sci. 2019, 36, 1217–1234. [Google Scholar] [CrossRef] [Green Version]
  24. Shen, L.; Wang, H.; Zhao, T.; Liu, J.; Bai, Y.; Kong, S.; Shu, Z. Characterizing regional aerosol pollution in central China based on 19 years of MODIS data: Spatiotemporal variation and aerosol type discrimination. Environ. Pollut. 2020, 263, 114556. [Google Scholar] [CrossRef]
  25. Tan, C.; Zhao, T.; Cui, C.; Luo, B.; Zhang, L.; Bai, Y. Characterization of haze pollution over Central China during the past 50 years. China Environ. Sci. 2015, 35, 2272–2280. [Google Scholar]
  26. Ma, D.; Li, L.; Ju, Y. Climate characteristics of haze days and analysis of summer haze weather event in Hubei province. Environ. Sci. Technol. 2015, 38, 148–153. [Google Scholar]
  27. Ding, Y.; Liu, Y. Analysis of long-term variations of fog and haze in China in recent 50 years and their relations with atmospheric humidity. Sci. China Earth Sci. 2014, 57, 36–46. [Google Scholar] [CrossRef]
  28. Li, L.; Wang, Y. What drives the aerosol distribution in Guangdong-the most developed province in Southern China? Sci. Rep. 2014, 4, 5972. [Google Scholar] [CrossRef] [PubMed] [Green Version]
  29. Xu, X.; Wang, Y.; Zhao, T.; Chen, X.; Meng, Y.; Ding, G. “Harbor” effect of large topography on haze distribution in eastern China and its climate modulation on decadal variations in haze China. Sci. Bull. 2015, 60, 1132–1143. [Google Scholar]
  30. Bei, N.; Xiao, B.; Meng, N.; Feng, T. Critical role of meteorological conditions in a persistent haze episode in the Guanzhong basin, China. Sci. Total Environ. 2016, 550, 273–284. [Google Scholar] [CrossRef] [PubMed]
  31. Li, J.; Wang, Z.; Huang, H.; Hu, M.; Meng, F.; Sun, Y.; Wang, X.; Wang, Y.; Wang, Q. Assessing the effects of trans-boundary aerosol transport between various city clusters on regional haze episodes in spring over East China. Tellus B 2013, 65, 20052. [Google Scholar] [CrossRef] [Green Version]
  32. Jiang, C.; Wang, H.; Zhao, T.; Li, T.; Che, H. Modeling study of PM2.5 pollutant transport across cities in China’s Jing-Jin-Ji region during a severe haze episode in December 2013. Atmos. Chem. Phys. 2015, 15, 5803–5814. [Google Scholar] [CrossRef] [Green Version]
  33. Chen, Q.; Sheng, L.; Gao, Y.; Miao, Y.; Hai, S.; Gao, S.; Gao, Y. The effects of the trans-regional transport of PM2.5 on a heavy haze event in the Pearl River Delta in January 2015. Atmosphere 2019, 10, 237. [Google Scholar] [CrossRef] [Green Version]
  34. Wang, H.; Li, J.; Peng, Y.; Zhang, M.; Che, H.; Zhang, X. The impacts of the meteorology features on PM2.5 levels during a severe haze episode in central-east China. Atmos. Environ. 2019, 197, 177–189. [Google Scholar] [CrossRef]
  35. Gao, Y.; Zhang, M.; Liu, Z.; Wang, L.; Wang, P.; Xia, X.; Tao, M.; Zhu, L. Modeling the feedback between aerosol and meteorological variables in the atmospheric boundary layer during a severe fog–haze event over the North China Plain. Atmos. Chem. Phys. 2015, 15, 4279–4295. [Google Scholar] [CrossRef] [Green Version]
  36. Zhang, Y.; Ding, A.; Mao, H.; Nie, W.; Zhou, D.; Liu, L.; Huang, X.; Fu, C. Impact of synoptic weather patterns and inter-decadal climate variability on air quality in the North China Plain during 1980–2013. Atmos. Chem. Phys. 2016, 124, 119–128. [Google Scholar] [CrossRef]
  37. Zhao, X.J.; Zhao, P.S.; Xu, J.; Meng, W.; Pu, W.W.; Dong, F.; He, D.; Shi, Q.F. Analysis of a winter regional haze event and its formation mechanism in the North China Plain. Atmos. Chem. Phys. 2013, 13, 5685–5696. [Google Scholar] [CrossRef] [Green Version]
  38. Gao, M.; Carmichael, G.R.; Wang, Y.; Saide, P.E.; Yu, M.; Xin, J.; Liu, Z.; Wang, Z. Modeling study of the 2010 regional haze event in the North China Plain. Atmos. Chem. Phys. 2016, 16, 1673–1691. [Google Scholar] [CrossRef] [Green Version]
  39. Hsu, S.C.; Liu, S.C.; Tsai, F.; Engling, G.; Lin, I.I.; Chou, C.K.C.; Kao, S.J.; Lung, S.C.C.; Chan, C.Y.; Lin, S.C.; et al. High wintertime particulate matter pollution over an offshore island (Kinmen) off southeastern China: An overview. J. Geophys. Res. 2010, 115, D17. [Google Scholar] [CrossRef] [Green Version]
  40. Kang, H.; Zhu, B.; Gao, J.; He, Y.; Wang, H.; Su, J.; Pan, C.; Zhu, T.; Yu, B. Potential impacts of cold frontal passage on air quality over the Yangtze River Delta, China. Atmos. Chem. Phys. 2019, 19, 3673–3685. [Google Scholar] [CrossRef] [Green Version]
  41. Brioude, J.; Arnold, D.; Stohl, A.; Cassiani, M.; Morton, D.; Seibert, P.; Angevine, W.; Evan, S.; Dingwell, A.; Fast, J.D.; et al. The Lagrangian particle dispersion model FLEXPART-WRF version 3.1. Geosci. Model. Dev. 2013, 6, 1889–1904. [Google Scholar] [CrossRef] [Green Version]
  42. Fast, J.D.; Easter, R.C. A Lagrangian partic le dispersion model compatible with WRF. In Proceedings of the 7th Annual WRF User’s Workshop, Boulder, CO, USA, 19–22 June 2006; pp. 19–22. [Google Scholar]
  43. Stohl, A.; Forster, C.; Frank, A.; Seibert, P.; Wotawa, G. Technical note: The Lagrangian particle dispersion model FLEXPART version 6.2. Atmos. Chem. Phys. 2005, 5, 2461–2474. [Google Scholar] [CrossRef] [Green Version]
  44. Chen, B.; Xu, X.D.; Zhao, T. Quantifying oceanic moisture exports to mainland China in association with summer precipitation. Clim. Dynam. 2017, 51, 4271–4286. [Google Scholar] [CrossRef]
  45. Seibert, P.; Frank, A. Source-receptor matrix calculation with a Lagrangian particle dispersion model in backward mode. Atmos. Chem. Phys. 2004, 4, 51–63. [Google Scholar] [CrossRef] [Green Version]
  46. Zhai, S.; An, X.; Liu, Z.; Sun, Z.; Hou, Q. Model assessment of atmospheric pollution control schemes for critical emission regions. Atmos. Environ. 2016, 124, 367–377. [Google Scholar] [CrossRef]
  47. Sauvage, B.; Fontaine, A.; Eckhardt, S.; Auby, A.; Boulanger, D.; Petetin, H.; Paugam, R.; Athier, G.; Cousin, J.M.; Darras, S.; et al. Source attribution using FLEXPART and carbon monoxide emission inventories: SOFT-IO version 1.0. Atmos. Chem. Phys. 2017, 17, 15271–15292. [Google Scholar] [CrossRef] [Green Version]
  48. Stohl, A.; Forster, C.; Eckhardt, S.; Spichtinger, N.; Huntrieser, H.; Heland, J.; Schlager, H.; Wilhelm, S.; Arnold, F.; Cooper, O. A backward modeling study of intercontinental pollution transport using aircraft measurements. J. Geophys. Res. 2003, 108, 1–8. [Google Scholar] [CrossRef]
  49. Zhu, C.; Kanaya, Y.; Takigawa, M.; Ikeda, K.; Tanimoto, H.; Taketani, F.; Miyakawa, T.; Kobayashi, H.; Pisso, I. FLEXPART v10. 1 simulation of source contributions to Arctic black carbon. Atmos. Chem. Phys. 2020, 20, 1641–1656. [Google Scholar] [CrossRef] [Green Version]
  50. Zhai, S.; Jacob, D.; Brewer, J.; Li, K.; Moch, J.; Kim, J.; Lee, S.; Lim, H.; Lee, H.; Kuk, S.; et al. Relating geostationary satellite measurements of aerosol optical depth (AOD) over East Asia to fine particulate matter (PM2.5): Insights from the KORUS-AQ aircraft campaign and GEOS-Chem model simulations. Atmos. Chem. Phys. 2021, 21, 16775–16791. [Google Scholar] [CrossRef]
  51. Zhang, F.; Wang, Y.; Peng, J.; Chen, L.; Sun, Y.; Duan, L.; Ge, X.; Li, Y.; Zhao, J.; Liu, C.; et al. An unexpected catalyst dominates formation and radiative forcing of regional haze. Proc. Natl. Acad. Sci. USA 2020, 11, 3960–3966. [Google Scholar] [CrossRef] [Green Version]
  52. Holton, J.; Hakim, G. An Introduction to Dynamic Meteorology; Academic Press: New York, NY, USA, 2012. [Google Scholar]
  53. Wei, P.; Ren, Z.H.; Wang, W.J. Analysis of meteorological conditions and formation mechanisms of lasting heavy air pollution in eastern China in October 2014. Res. Environ. Sci. 2015, 28, 676–683. [Google Scholar]
  54. Yang, Y.R.; Liu, X.G.; Qu, Y.; An, J.L.; Jiang, R.; Zhang, Y.H.; Sun, Y.L.; Wu, Z.J.; Zhang, F.; Xu, W.Q.; et al. Characteristics and formation mechanism of continuous hazes in China: A case study during the autumn of 2014 in the North China Plain. Atmos. Chem. Phys. 2015, 15, 10987–11029. [Google Scholar] [CrossRef] [Green Version]
  55. Shen, L.; Zhao, T.; Liu, J.; Wang, H.; Bai, Y.; Kong, S.; Shu, Z. Regional transport patterns for heavy PM2.5 pollution driven by strong cold airflows in Twain-Hu Basin, Central China. Atmos. Environ. 2021, 269, 118847. [Google Scholar] [CrossRef]
  56. Shen, L.; Zhao, T.; Wang, H.; Liu, J.; Bai, Y.; Kong, S.; Zheng, H.; Zhu, Y.; Shu, Z. Importance of meteorology in air pollution events during the city lockdown for COVID-19 in Hubei Province, Central China. Sci. Total Environ. 2021, 754, 142227. [Google Scholar] [CrossRef]
  57. Hu, W.; Zhao, T.; Bai, Y.; Kong, S.; Xiong, J.; Sun, X.; Yang, Q.; Gu, Y.; Lu, H. Importance of regional PM2.5 transport and precipitation washout in heavy air pollution in the Twain-Hu Basin over Central China: Observational analysis and WRF-Chem simulation. Sci. Total Environ. 2021, 758, 143710. [Google Scholar] [CrossRef]
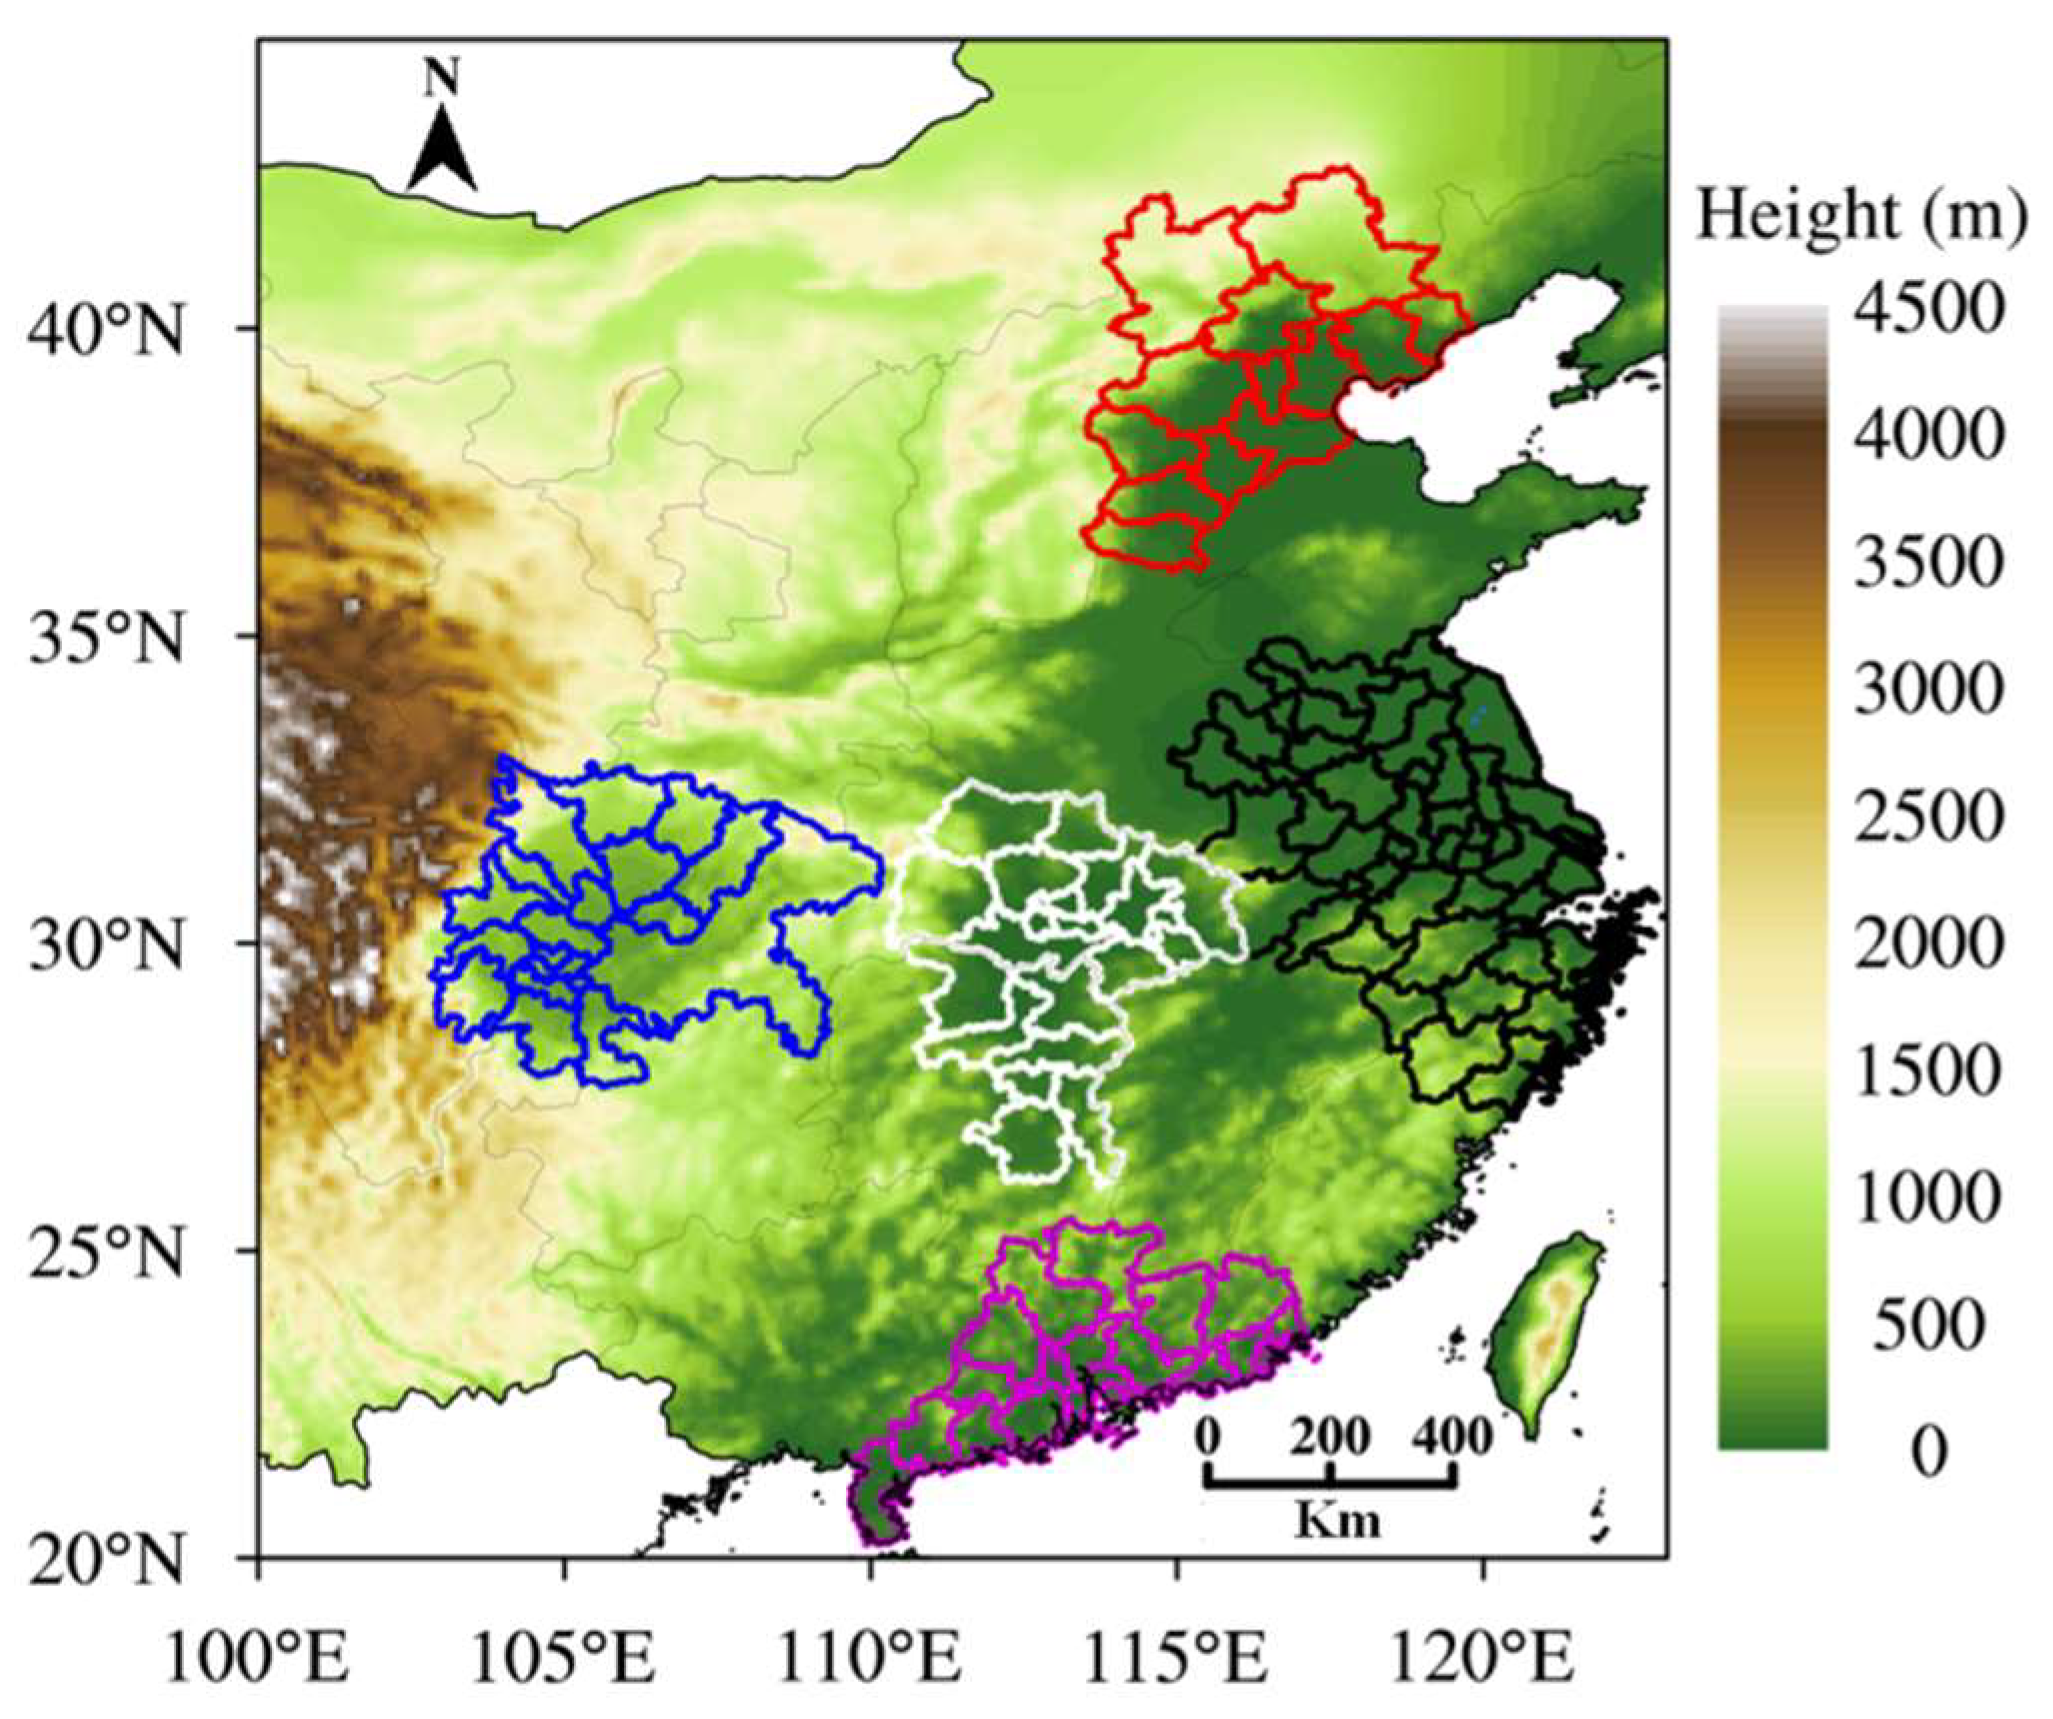
Figure 1. Topographical height (m, in a.s.l) of Central and Eastern China (CEC), with the red, black, white, blue, and purple lines marking the regions of the North China Plain (NCP), Yangtze River Delta (YRD), Twain-Hu Basin (THB), Sichuan Basin (SB), and Pearl River Delta (PRD), respectively, for air pollution change.
Remotesensing 13 04855 g001
Figure 2. (a) Spatial distribution of surface PM2.5 concentrations averaged over 2014–2019, (b) interannual variations (solid lines) in annual PM2.5 concentrations in five regions of China. The dashed lines refer to the slopes of the linear regression.
Remotesensing 13 04855 g002
Figure 3. Distribution in annual mean of MODIS AOD during 2000–2019 over the THB and its surroundings in CEC. The oval indicates the THB region.
Remotesensing 13 04855 g003
Figure 4. (a) Mean sea-level air pressure (hPa, black lines), wind vectors (m·s−1) during 30 HPEs, and anomalies of sea-level air pressure (color shadings), (b) 2 m air temperature (°C) during 30 HPEs in the THB relative to the five-year climatology (2015–2019).
Remotesensing 13 04855 g004
Figure 5. Distributions of PM2.5 concentrations (scatter) and 10 m wind fields (a) 2 d before HPEs, (b) on HPE days over the THB, and (c) their differences, (d) hourly changes in surface PM2.5 around the HPEs over the NCP and the THB, with the error bars representing the standard deviation.
Remotesensing 13 04855 g005
Figure 6. (a) Distribution of average contribution rates (color contours) to PM2.5 concentrations in Xiangyang, THB during 30 HPEs for 2015–2019, with the major routes of regional transport over CEC (dashed line), (b) spatial distribution of variation coefficients for the contribution rates to wintertime PM2.5 concentrations in Wuhan, a capital city in the THB with the larger values of variation coefficients representing the stronger inter-annual variations over recent years.
Remotesensing 13 04855 g006
Table 1. Summaries of the full names and acronyms used in this study.
Full NameAcronym
Central and Eastern ChinaCEC
North China PlainNCP
Yangtze River DeltaYRD
Sichuan BasinSB
Pearl River DeltaPRD
Yangtze River middle basinYRMR
Twain-Hu BasinTHB
Heavy pollution eventHPE
East Asian monsoonEAM
East Asian winter monsoonEAWM
Table 2. Descriptive statistics of heavy pollution events (HPEs) over the NCP, YRD, SB, PRD, and THB during 2014–2019.
YearNCPYRDSBPRDTHB
Frequency
(%)
Concentration
(μg·m−3)
Frequency
(%)
Concentration
(μg·m−3)
Frequency
(%)
Concentration
(μg·m−3)
Frequency
(%)
Concentration
(μg·m−3)
Frequency
(%)
Concentration
(μg·m−3)
201412.8 215 1.6 176 1.4 169 0.0 --2.7 186
201510.3 231 2.1 180 3.2 179 0.3 154 2.9 183
20169.6 221 1.4 175 1.3 178 0.0 --1.4 191
20177.0 212 1.4 189 2.4 180 0.4 185 1.7 186
20184.0 198 1.9 184 0.9 172 0.3 181 1.3 188
20194.4 199 0.8 172 0.5 174 0.0 --1.5 183
Publisher’s Note: MDPI stays neutral with regard to jurisdictional claims in published maps and institutional affiliations.