Abstract
Many analyses of the perturbed ionospheric D-region and its influence on the propagation of ground-based and satellite signals are based on data obtained in ionospheric remote sensing by very low/low frequency (VLF/LF) signals. One of the most significant causes of errors in these analyses is the lack of data related to the analysed area and time period preceding the considered perturbation. In this paper, we examine the influence of the estimation of the quiet ionosphere parameters on the determination of the electron density (Ne) and total electron content in the D-region (TECD) during the influence of a solar X-ray flare. We present a new procedure in which parameters describing the quiet ionosphere are calculated based on observations of the analysed area by a VLF/LF signal at the observed time. The developed procedure is an upgrade of the quiet ionospheric D-region (QIonDR) model that allows for a more precise analysis of the D-region intensively perturbed by a solar X-ray flare. The presented procedure is applied to data obtained in ionospheric remote sensing by the DHO signal emitted in Germany and received in Serbia during 30 solar X-ray flares. We give analytical expressions for the dependencies of the analysed parameters on the X-ray flux maximum at the times of the X-ray flux maximum and the most intense D-region perturbation. The results show that the obtained Ne and TECD are larger than in the cases when the usual constant values of the quiet ionosphere parameters are used.
1. Introduction
In addition to the importance of ionospheric D-region modelling in scientific studies (see, for example, [1,2,3,4,5,6]), knowledge of properties of this atmospheric layer is necessary for the analysis of the electromagnetic signal propagation. Consequently, this modelling can have practical application in technologies based on the propagation of satellite and ground-based signals, such as space geodesy and telecommunications. Namely, during intense perturbations of the D-region, its influence on the satellite signal delay is not negligible [7], which is consequently reflected in the determination of the ionospheric influence in many measurements (see, for example, [8]). Due to lower frequencies of ground based signals, the importance of D-region modelling is more pronounced in the determination of the characteristics of their propagation, which is significant in, for example, telecommunications.
Monitoring of the ionospheric D-region is based on three techniques: rocket measurements, radar sounding, and propagation of very low/low frequency (VLF/LF) signals in the Earth–ionosphere waveguide. The latter technique is most commonly used for the corresponding studies. The two main reasons for this are: (1) the global system for these observations consists of numerous worldwide distributed transmitters and receivers, thus ensuring good coverage of the lower ionosphere, and (2) data are recorded continuously with the possibility of time sampling of only a few milliseconds, which allows the detection of sudden and short-term variations. However, this technique requires a large distance between a transmitter and a receiver that is a minimum of several hundred kilometres. Due to the spatial and time variations of this atmospheric layer caused by both periodic changes and unpredictable sudden effects of numerous terrestrial and extraterrestrial phenomena and processes, it is necessary that observational data relevant to the observed area and time period be included in modelling. Even in studies of perturbations affecting the entire signal propagation path (induced by some phenomena from the outer space such as solar X-ray flares), it is necessary to introduce several approximations. The most significant of them are the horizontal uniformity of the ionosphere (either along the entire signal propagation path or partially along its sections) and the estimation of the quiet ionosphere parameters in the time period preceding the considered perturbation. The first approximation is good for a not too long signal propagation path and for daytime periods of a few hours around midday in absence of intensive local disturbances. Estimations of the quiet ionosphere parameters are given in several studies [9,10,11,12,13]. However, there are no studies on the influence of the choice of the quiet ionosphere parameters on D-region modelling during disturbances. That analysis is in the focus of this study.
In this research, we present a new methodology for calculating the parameters of the perturbed D-region, which refers to the analysed time period and the observed area. We analyse the “sharpness” (), the signal reflection height (), the D-region electron density (), and the total electron content in the D-region (TEC). The first two parameters describe the so-called Wait model of the ionosphere, and their common name is Wait’s parameters. As a source of ionospheric perturbation, we observe solar X-ray flares. They can induce intense D-region perturbations which can last from several tenth of minutes to over one hour. This astrophysical phenomenon can induce an increase in the D-region electron density by more than one order of magnitude (see, for example, [14]). This analysis is a continuation of the research given in [13] in which the quiet ionospheric D-region (QIonDR) model is presented. The motivation to develop the presented procedure was the need for more precise determination of the initial state in both the considered time period and the observed area for modelling of the perturbed D-region. Namely, the QIonDR model provides a procedure for estimating the dependencies of ionospheric parameters on the solar cycle period and season, as well as the equations relevant to a part of Europe. That analysis is relevant for quiet conditions, but the equations obtained by fitting the estimated values in the analysed periods give the values with certain errors which, consequently, affects modelling of ionospheric parameters during perturbations. In the presented study, we give the following three analyses: first, we describe the influence of the choice of Wait’s parameters in the quiet state on the determination of their time evolutions during perturbations; second, we present a procedure for the determination of these parameters before perturbations caused by solar X-ray flares; and, third, we model the considered ionospheric parameters during perturbation using the Long-Wave Propagation Capability (LWPC) numerical model [15] and the initial values of Wait’s parameters estimated by the presented procedure. We apply the developed procedure to (1) the entire time period of a perturbation caused by a single flare and (2) the times of the X-ray flux maxima recorded by the geostationary operational environmental system (GOES) and the times of the D-region perturbation maxima determined by the times of the TEC maxima for 30 events. Here, it is important to emphasise that, although the D-region disturbance is most intense some time after the considered X-ray flux maximum, the previous statistical studies are primarily related to the values of ionospheric parameters at the time of the X-ray flux maximum. In other words, the maximum effects of X-ray flares on both the D-region parameters and the propagation of electromagnetic waves in this area have not been investigated from a statistical point of view.
We observe variations caused by solar X-ray flares that are sources of intense D-region disturbances. The impact of these events on the atmosphere is global and for several hours around noon it causes similar variations at the same altitude along relatively short VLF/LF signal paths that extend in the low and mid latitude areas. For this reason, we are able to apply an approximation of the horizontally uniform ionosphere. The presented analysis is based on the data recorded by the receiver station in Belgrade, Serbia, and refers to the DHO signal emitted in Rhauderfehn, Germany.
The paper is organised as follows. After describing the analyses of observations and events in Section 2, we present our proposed methodology in Section 3. Section 4 shows the results of the presented procedure applied to the considered class-C and -M solar X-ray flares at the times of the X-ray flux and the D-region perturbation maxima. The conclusions of this study are given in Section 5.
2. Observational Setups, Studied Area, and Considered Events
The procedure presented in this study is based on data collected by a VLF/LF receiver while the observed periods are selected based on GOES satellite measurements.
In this study, we use data recorded by the atmospheric weather electromagnetic system for observation modelling and education (AWESOME) receiver [16] located in Belgrade, Serbia, relating to the VLF signal emitted by the DHO transmitter in Germany. This receiver was a part of the Stanford/AWESOME Collaboration for Global VLF Research (http://waldo.world/narrowband-data/, accessed on 5 November 2021). As in many previous studies (see, for example, [7,8,17]), we analyse the DHO signal because of the best quality of the recorded data. Consequently, the analytical expressions obtained in this study refer to the D-region over the part of Europe included within the transmitter (Rhauderfehn, Lower Saxony, Germany) and receiver (Belgrade, Serbia) locations.
The observed time periods are selected based on X-ray flux data recorded by the GOES satellites. Datasets of the X-ray fluxes recorded by the GOES satellites are available on the National Oceanic and Atmospheric Administration’s (NOAA’s) National Centers for Environmental Information website (http://satdat.ngdc.noaa.gov/sem/goes/data, accessed on 7 September 2021). A GOES satellite provides data recorded by two detectors in the energy channels A (0.05 nm–0.4 nm) and B (0.1 nm–0.8 nm), which better describe the influence of an X-ray flare in the bottom and upper D-region, respectively [17]. Bearing in mind that the electron density increases with the D-region altitude, i.e., the upper D-region provides the dominant contribution to TEC, we assume that the flux representing the X-radiation (ϕ) is the flux recorded by the GOES channel B. The data recorded through this channel are also used in many previous studies of the solar X-ray flare perturbed D-region (see, for example, [18,19,20]).
In this study, we consider the time period from 2010 to 2016 that includes both the minimum and maximum of the 24th solar cycle. We analyse 30 flares whose characteristics (dates, start times, and flare classes) are shown in Table 1. The last two columns list the daily smoothed sunspot number () and season parameter ( = DOY/365, where DOY is the day of year). These two parameters show that the obtained numbers of sunspots are in a wide range and that the events took place throughout the year. This allows us to analyse the impact of variations during the solar cycle and seasonal changes on the observed parameters.

Table 1.
Dates, times, and classes of the considered X-ray flares, the daily smoothed sunspot number (), and season parameter ( = DOY/365, where DOY is the day of year).
These flares are selected based on the following criteria:
- The DHO signal amplitude and phase are recorded by the AWESOME receiver in Belgrade during the period when the D-region is perturbed by a solar X-ray flare. Significant changes in amplitude and phase resulting from the influence of other phenomena or technical problems in signal emission/reception are not recorded during the period significant for the presented analysis;
- The impact of an X-ray flare is in the midday period. This condition makes it possible to avoid the effects of diurnal changes which are more pronounced during the morning and afternoon when an approximation of the horizontally uniform ionosphere cannot be taken during the whole period of perturbation;
- The X-ray flare class is from C1 to M5. The lower limit is set because weaker flares do not cause clear changes in the signal characteristics, while the upper limit is introduced because modelling of the electron density by the procedure given in [21] is more appropriate for not too intensive flares.
To show the influence of the choice of Wait’s parameters in the quiet state ( and ) on modelling of the considered parameters during the entire period of perturbation, we analyse the D-region perturbed by an X-ray flare that occurred on 18 January 2014. The time evolution of the solar X-ray flux ϕ recorded by the GOES satellite is shown in Figure 1 (upper panel), while the time evolutions of the signal amplitude and phase changes with respect to their value in quiet conditions are presented in the bottom panel.
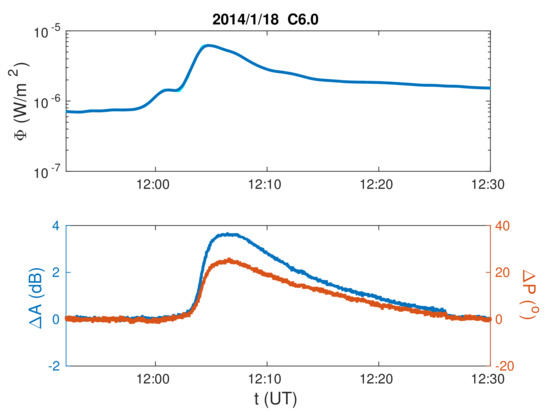
Figure 1.
Time evolutions of the energy X-ray flux (ϕ) (upper panel), and the recorded amplitude () and phase () changes with respect to quiet conditions (bottom panel) during a solar X-ray flare that occurred on 18 January 2014.
3. Methodology
In this section, we present a methodology for modelling , , , and TEC during the influence of a solar X-ray flare. It takes into account the different states of the quiet ionosphere before the observed perturbations and provides a new procedure for the determination of Wait’s parameters and .
3.1. Determination of Wait’s Parameters
In this section, we (1) describe the procedure for the determination of the time evolutions of and , (2) describe how the choice of and affects the determination of Wait’s parameters during a disturbance caused by a solar X-ray flare, and (3) give criteria for the estimation of and before a particular X-ray flare event.
- Determination of the time evolutions of Wait’s parameters.Modelling of these dependencies is based on observational data and the LWPC numerical model [15]. For the considered VLF/LF signal and receiver location, the input parameters in this numerical program are Wait’s parameters, and its outputs are the modelled amplitude () and phase (). The presented procedure for the determination of and at time t is based on the comparison of the observed changes in the recorded signal amplitude () and phase () with respect to quiet conditions with the corresponding modelled changes:andIn these expressions, and are considered known, while and are determined based on the best agreement of the left and right sides of Equations (1) and (2) at time t. This procedure is well known and used in many papers [19,22], but it differs according to the mentioned criteria and the taken values and . In some studies, these criteria are not clearly defined, while and are usually taken as constants. The consequence of the last approximation is the neglect of daily and seasonal variations, variations during a solar cycle, as well as variations due to various sudden influences.In this paper, the criterion for the best agreement of the recorded and modelled changes in the signal characteristics (for pre-estimated values and ) is the minimum value of the sum of the corresponding differences normalised to the corresponding maximum recorded values.whereHere, and are all possible values of Wait’s parameters.In this paper, special attention is paid to the choice of parameters and . We propose a new methodology for their determination that represents an upgrade of the QIonDR model. An explanation of the significance of this analysis and a description of the proposed methodology are given in the following text.
- Description of the influence of Wait’s parameters describing quiet ionosphere before the considered solar X-ray flare on modelling of their values under the disturbed conditions.As it can be seen from Equation (4), the pair () affects the value of G and, consequently, the value of the pair () obtained by applying the criterion given by Equation (3). To better explain this impact, we analyse the results of modelling by the LWPC numerical program for two pairs () and for the given registered amplitude and phase changes of 3 dB and 30°, respectively. The surfaces presented in Figure 2 show and (left and right panel, respectively) corresponding to all combinations of the considered values of Wait’s parameters. The isolated points (blue and red diamonds) correspond to the two combinations of and : (0.4 km, 72 km) and (0.3 km, 74 km), respectively. The points that form the blue and red “lines” indicate the pairs of Wait’s parameters for which the modelled amplitude (left panel) and phase (right panel) are approximative 3 dB and 30° larger than the corresponding values obtained for the two considered initial states, respectively.
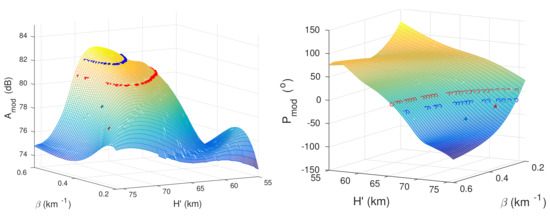 Figure 2. Surface plots of the modelled amplitude () (left panel) and phase () (right panel) on the Wait’s parameters “sharpness” () and signal reflection height (). The isolated points (blue and red diamonds) correspond to the two combinations of and : (0.4 km, 72 km) and (0.3 km, 74 km), respectively. Blue and red circles indicate the pairs of Wait’s parameters for which the modelled amplitude (left panel) and phase right panel) are approximative 3 dB and 30° larger than the corresponding values obtained for the two considered initial states, respectively.Although there are a number of pairs () for which one of the modelled changes is approximately equal to the corresponding given change, there are only a few combinations of Wait’s parameters (for one observed initial state) that give approximate agreement of both signal characteristics changes. It can be seen in Figure 3, where the obtained modelled pairs are presented in the 2D Wait’s parameter space. The estimated intersection points on the left and right panels ((0.48 km, 68.2 km) and (0.38 km, 68.4 km), respectively) represent Wait’s parameters obtained for their initial combinations (0.4 km, 72 km) and (0.3 km, 74 km), respectively. Based on the estimated pairs of Wait’s parameters, the electron density values at 65 km, 75 km, and 85 km are m, m, and m, in the first case, and m, m, and m, in the second case, while the corresponding values of TEC are 0.2 TECU and 0.03 TECU, respectively (the procedures for modelling these parameters are given in Section 3.2 and Section 3.3). A comparison of these values indicates a significant influence of the choice of and on modelling of the perturbed D-region. In order to better understand its significance, it is necessary to emphasise that the given changes in the signal characteristics are not too large and that the selected pairs of initial Wait’s parameters represent their real values that are not quiet close to the corresponding intervals limits. In other words, the obtained differences may be more pronounced in some other, also realistic, conditions.
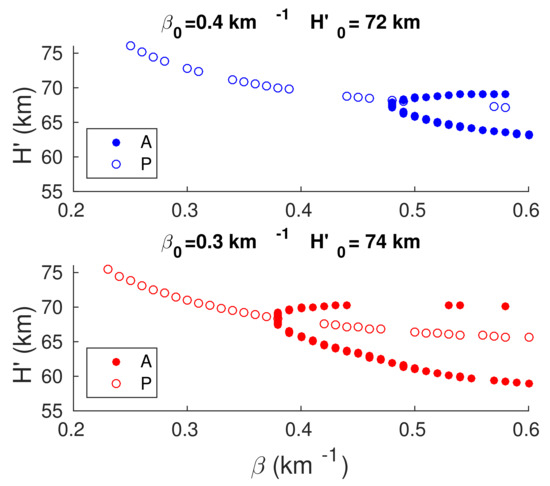 Figure 3. Pairs of the Wait’s parameters, “sharpness” () and signal reflection height (), for which the modelled amplitude (left panel) and phase (right panel) are approximative 3 dB and 30° larger than the corresponding values obtained for the two initial combinations of Wait’s parameters (0.4 km, 72 km) (upper panel) and (0.3 km, 74 km) (bottom panel). The filled and open circles relate to the modelled amplitude and phase, respectively. These scatters correspond to those shown in Figure 2.
 - Criteria for estimation of Wait’s parameters in the quiet state before the considered solar X-ray flare.Intensification of a D-region disturbance causes an increase/decrease in and , respectively, while the tendencies of these time evolutions are opposite during the return to the steady state of the ionosphere [2,13,17]. However, the choice of and significantly influences the shapes of their time evolutions, which allows us to introduce criteria for choosing the combination that gives the best dependences and . To better explain the differences in the time evolutions of Wait’s parameters, we present four different shapes for an X-ray flare that occurred on 18 January 2014 (see Figure 4). In the presented graphs, the points represent the corresponding values obtained at time t using the criterion given by Equation (3), while the lines show their smoothed values.
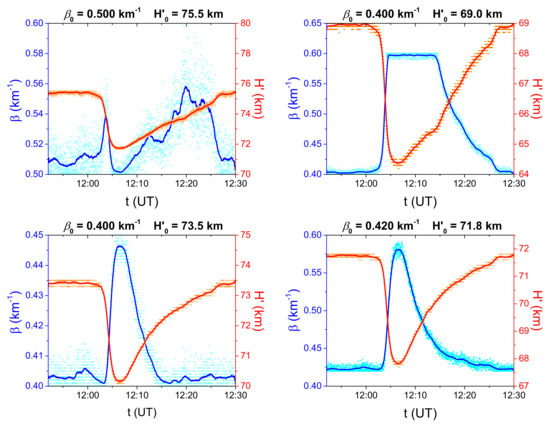 Figure 4. Examples of the four different shapes of the time evolutions of Wait’s parameters for an X-ray flare that occurred on 18 January 2014.As it can be seen in the upper panels, there are values of pairs () for which the time evolutions of decrease (upper left panel) or reach the maximum possible value in a longer time period (right panel) which is not in accordance with the expected form. These discrepancies allow us to exclude all combinations () for which the corresponding forms are similar to those shown on these two panels. In addition, many combinations () give dependences that fall very quickly to the initial values with respect to the time evolutions of , A, and P, which also excludes the corresponding pairs (). One such example is given in the bottom left panel. An example of the shape of function that can describe the time evolution of this Wait’s parameter is given in the bottom right panel.To estimate the initial conditions and model the time evolutions of Wait’s parameters we use the following criteria:
- 1.
- The obtained values of cannot be greater than 0.6 km. We take this value based on the studies presented in [10,11,12,13,21,23].
- 2.
- The shape of the smoothed time evolution of is characterised by an increase to the maximum value (occurs after the maximum X-ray flux in the period, when reaches minimum value) followed by a decrease. Deviations from this shape are possible if the corresponding characteristics are observed in the signal amplitude/phase but, in that case, we consider only events in which these variations do not affect the analysis, i.e., when these variations occur after extreme values of Wait’s parameters.
- 3.
- The relaxation of to its value in the quiet state after the considered disturbance should be as similar as possible to the signal amplitude relaxation. For this reason, we introduce the condition that the time when reaches values corresponding to quiet conditions should be after the time when falls to some given value. This value is not unique due to differences in the characteristics of various impacts on the observed area during the analysed time period. Based on the presented analysis, the estimated value of this parameter is between 0.5 dB and 1 dB.
- 4.
- Generally, there are several combinations of and that meet criteria 1 and 2 and have a similar time when reaches values corresponding to quiet conditions. Therefore, we introduce an additional criterion that allows us to determine the combination (,) that deviates the least from Wait’s parameters, and , predicted by the QIonDR model. This deviation () is calculated by the following expression:where dependencies of midday Wait’s parameters on the daily smoothed sunspot number () and the seasonal parameter () estimated by the QIonDR model are given by following equations [13]:andHere, km and km are the estimated maximal absolute deviations of and from and , respectively. These values are estimated based on the maximum absolute deviations of Wait’s parameters from their fitted values for data shown in [10] (0.03 km and 1.5663 km), [19] (0.07 km and 1.8 km), and [13] (0.08 km and 3.6 km). We note that the fitted functions for the first two sets of data are given in [24].Here, it is important to emphasise that the values of and are estimated and that they can influence the choice of pairs () if the analysed deviations are similar for multiple combinations of initial Wait’s parameters. In this case, it is necessary to check which values of Wait’s parameters at the time of the X-ray flux maximum fit best with those obtained in other cases. In our study, this correction procedure is applied in only three cases (10% of the total number of the analysed cases). The correction for these class-C4.1, -C6.1, and -C8.0 solar X-ray flares is made due to the excessive value of (0.59 km , 0.55 km , and 0.57 km , respectively) at the X-ray flux maximum obtained before correction.
3.2. Determination of the Electron Density
As in many previous papers (see, for example, [25,26,27]), we calculate the time evolution of the D-region electron density at the altitude h using Equation [21]:
where , , and and h are given in m, km, and km, respectively.
3.3. Determination of the D-Region Total Electron Content
The determination of TEC in the entire ionosphere has both practical and scientific significance. The contribution of the D-region to TEC is very often neglected in these calculations or the presence of its perturbations is not taken into account [28,29,30,31,32]. However, a recent study, presented in [7], shows that neglecting the impact of this ionospheric layer on satellite signals due to its low electron density is justified in quiet conditions, but it can result in significant errors in space geodesy during intensive ionospheric perturbations. For this reason, we further analyse TEC using the expression [24]:
where = 60 km and = 90 km are the bottom and upper D-region boundary, respectively. The factor 1000 is introduced because and TEC are given in km and m, respectively.
4. Results and Discussions
The presented methodology for the estimation of , , , and TEC is applied to 30 flares of classes C and M. We present two analyses relating to: (1) the time evolutions of the considered ionospheric parameters during a solar X-ray flare which occurred on 18 January 2014 and (2) the statistical analysis of their dependencies on the maximum X-ray flux in the times of the radiation maximum and the most intense D-region disturbance. To show the importance of the choice of initial conditions, we compare the obtained dependences with those obtained for the initial values of Wait’s parameters which were commonly used in previous studies. In the second analysis, the comparisons with results presented in previous studies are also given.
4.1. Time Evolutions of the Considered Ionospheric Parameters during a Single Flare
In this section, we present the application of the procedure described in Section 3 to an individual event. We analyse the considered parameters during the perturbation induced by an X-ray flare that occurred on 18 January 2014. The time evolutions of the X-ray flux, and the DHO signal amplitude and phase registered by the AWESOME receiver in Serbia during this period are shown in Figure 1.
The first step in this analysis is to determine and , using the following procedure:
- The time dependences and are determined for all combinations of Wait’s parameters in quiet conditions in the ranges 0.2 km to 0.55 km with a step of 0.01 km for and 65 km to 76 km with a step of 0.1 km for .
- Wait’s parameters and are determined by applying criteria 1–4 given in Section 3 to the obtained dependences and .
To obtain the time evolutions and , we include the obtained pair of initial values of Wait’s parameters (0.43 km, 71.8 km) in the LWPC numerical model and apply the criterion given by Equation (3) to the analysed datasets related to the changes in the registered signal amplitude and phase. These time evolutions are shown in Figure 5.
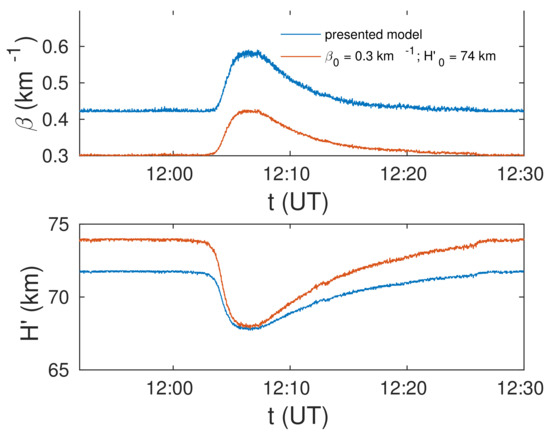
Figure 5.
Time evolutions of the “sharpness” () (upper panel) and the signal reflection height () (bottom panel) obtained for the initial values of Wait’s parameters determined by the procedure developed in this study (blue lines) and for commonly used = 0.3 km and = 74 km.
In order to compare the obtained time evolutions of Wait’s parameters (represented by blue lines in Figure 5) with those obtained for commonly used = 0.3 km and = 74 km, we show the corresponding dependencies in the second case by red lines. In the top panel, it can be seen that is higher for the initial parameters estimated in the procedure presented in this study and that the difference between the corresponding two presented time evolutions is very similar for the entire considered time period. In other words, this difference does not significantly vary during the perturbation with respect to the pre-disturbance value. On the other hand, is smaller in the first case during the entire time period. This difference decreases significantly with increasing perturbation intensity. After the minimum of , the difference increases again and reaches the initial value at the end of the considered perturbation. These conclusions are in line with the results obtained in the statistical analysis presented below (see Section 4.2).
The electron density time variations, obtained from Equation (8), and the calculated time evolutions of Wait’s parameters for both considered pairs of and are shown in Figure 6. In these two cases, the altitude-time dependencies look similar, but the obtained values are different. The values obtained in the procedure presented in this paper (upper left panel) are higher than those obtained for = 0.3 km and = 74 km (upper right panel) in the middle and upper part of the D-region, while this relationship is opposite in the bottom part of this ionospheric layer. Going to the lower boundary of the D-region, the considered difference decreases and, from some height, the values in the second case become larger than in the first case. The absolute values of this difference are shown in the bottom left panel where it can be seen that they increase with the perturbation intensity and with h above around 70 km. The obtained differences in the D-region bottom part are significantly smaller than at its highest altitudes, which is in line with the increase in with h.
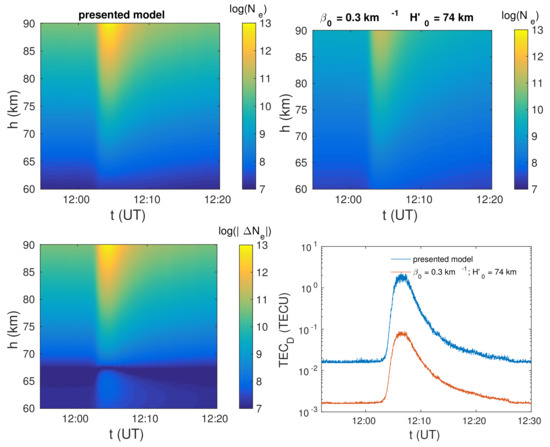
Figure 6.
Surface plots of the logarithm of the electron density values given in m obtained for the initial Wait’s parameters determined by the procedure developed in this study (upper left panel) and for commonly used = 0.3 km and = 74 km (upper right panel). The absolute values of the corresponding differences are shown in the bottom left panel. The time evolutions of the total electron content in the D-region, TEC, obtained for the analysed initial Wait’s parameters are shown in the bottom right panel.
The time evolutions of TEC for both cases are obtained from Equation (9). As can be seen in the bottom right panel, the values of TEC obtained by the procedure developed in this study are significantly higher (one order of magnitude) than the corresponding values obtained in the second case. Although the difference is similar throughout the observed time period, its increase with the perturbation intensity is noticeable.
4.2. Statistical Analysis
In this section, we study the influence of the X-ray flare class represented by the X-ray flux maximum in the wavelength domain 0.1 nm–0.8 nm, , on , , , and TEC. We study the 30 X-ray flares listed in Table 1, applying the procedure shown in Section 4.1 to each individual event, and analyse , , and all observed parameters at the times of the X-ray flux maximum () and the TEC maximum ().
The influence of the solar cycle period and season on the observed dependences is included via and . Namely, these parameters are determined in a procedure based on the QIonDR model (see details in Section 3) which gives the dependences of Wait’s parameters in the midday period on the day of year and sunspot number. To analyse the effects of these periodic changes in the times and , different seasons are represented with blue squares (winter), green triangles (spring), red circles (summer), and yellow diamonds (autumn), while the increase in their size corresponds to the increase in parameter .
Wait’s Parameters
The obtained values of and , and their comparisons with the corresponding values modelled by the QIonR and International Reference Ionosphere (IRI)—2016 [9] (for the observed times and geographical coordinates of the DHO signal mid-path) models, are shown in Figure 7. In the latter case, we model Wait’s parameters from electron density altitude distributions determined from both the IRI-95 [33] and Faraday-International Reference Ionosphere (FIRI) [34] D-region models, which are included in the IRI-2016 ionosphere model ( https://ccmc.gsfc.nasa.gov/modelweb/models/iri2016_vitmo.php, accessed on 11 December 2021) and which are based on rocket data. As it can be seen in the upper panel, agrees well with the values obtained by the QIonDR model and the IRI-2016 model when the D-region electron density is calculated by the FIRI model. The values of that are obtained by the IRI-2016 model using the IRI-95 model of the D-region are approximatively constant which differs from the other three cases. The agreement of obtained by the presented procedure with the values obtained using the other three considered models is good. The results obtained for both parameters are within the ranges expected from the results shown in [18,23,35].
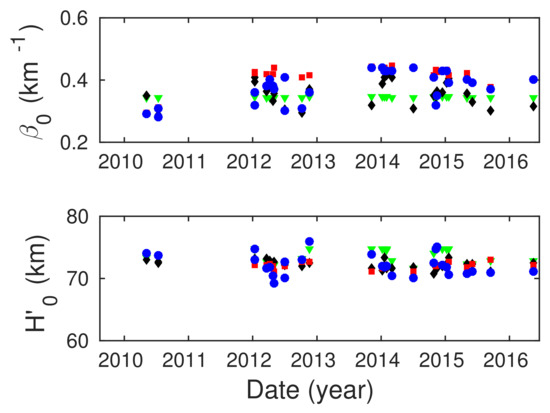
Figure 7.
The “sharpness” (; upper panel) and the signal reflection height (; bottom panel) describing the quiet ionosphere before the considered solar X-ray flares. The results obtained by the presented procedure, and the QIonDR and IRI-2016 (which includes modelling of the D-region by the IRI95 and FIRI models) models are represented by blue circles, red squares, green triangles, and black diamonds, respectively.
A detailed analysis of the differences in the results obtained by the procedure presented in this study and the QIonDR model is given in Supplementary Materials.
The dependences of Wait’s parameters on at the time ( and ) and at the time ( and ) are shown in Figure 8 and Figure 9 (left panels). The values of are given in W/m.
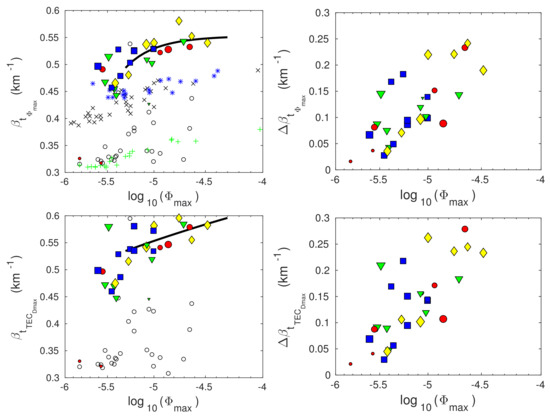
Figure 8.
Dependencies of the “sharpness” () (left panels) and its changes with respect to the initial value () (right panels) on the logarithm of the X-ray flux maximum given in W/m (log) at the times of the X-ray flux maxima () (upper panels) and the D-region perturbation maxima () (bottom panels). The values obtained in this study are presented by blue squares (X-ray flares occurred in winter), green triangles (X-ray flares occurred in spring), red circles (X-ray flares occurred in summer), and yellow diamonds (X-ray flares occurred in autumn). The results presented in [18,23,35] are represented by “x”, “+”, and “*”, respectively. The black lines show fitting of the obtained values for the X-ray flares whose flux maxima are greater than Wm and which occurred on days for which the daily smoothed sunspot number is greater than 50.
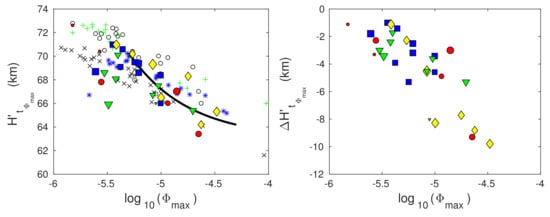
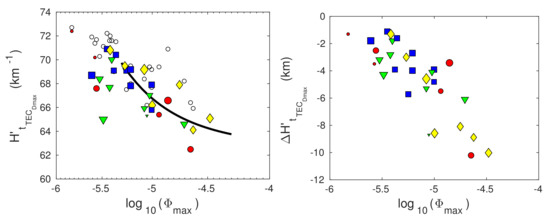
Figure 9.
Dependencies of the signal reflection height () (left panels) and its changes with respect to the initial value () (right panels) on the logarithm of the X-ray flux maximum given in W/m, (log) at the times of the X-ray flux maxima () (upper panels) and the D-region perturbation maxima () (bottom panels). The values obtained in this study are presented by blue squares (X-ray flares occurred in winter), green triangles (X-ray flares occurred in spring), red circles (X-ray flares occurred in summer), and yellow diamonds (X-ray flares occurred in autumn). The results presented in [18,23,35] are represented by “x”, “+”, and “*”, respectively. The black lines represent fitting of the obtained values for the X-ray flares whose flux maxima are greater than Wm and which occurred on days for which the daily smoothed sunspot number is greater than 50.
Based on the presented data, we can conclude the following:
- The dispersion of points on the graph is greater at the time , which can be explained by the additional influence of differences in the radiation characteristics after the maximum of its flux. This difference is not significant for .
- The dispersion of the obtained values decreases with , which indicates a decrease in the influence of the initial state of the ionosphere on the considered parameters during disturbance with the flare class. This can be explained by the fact that the solar X-radiation dominates the solar hydrogen Ly and cosmic radiation (these two radiations are the most important sources of ionisation in the unperturbed D-region) in electron gain processes at the time of the X-ray flux maximum [36]. This dominance increases with and, consequently, the considered differences in Wait’s parameters decrease with .
- The effect of variations in the radiation intensity during a solar cycle on at times and is significant in the period around the solar cycle minimum. In the cases of the two X-ray flares of classes C1.4 and C2.6, which occurred in this period, has significantly less values than those estimated for the other analysed flares of the similar classes. This difference is reduced for the stronger flare of class-C8.8. The values of for all three events which occurred during this period are similar to the corresponding values for the other analysed events.
- The influence of seasonal changes on the observed parameters is not visible for less intense flares. In the case of more intense flares (starting with class-C5), there is indication that and are slightly higher during the winter (blue squares) and autumn (yellow diamonds) periods than during the second part of year (green triangles and red circles). However, these differences are not significant which is why we analyse all these flares together (see the next item).
- The dispersion of the obtained values is significant for the considered weak X-ray flares of low intensity. Therefore, and due to the mentioned differences in and for events which occurred in the period around the solar cycle minimum, we fit the obtained values for the X-ray flares whose maximum flux is greater than Wm and which occurred on days for which 50. The fitted functions have the form:where f is the considered parameter. The corresponding values of a, b, and c are given in Supplementary Materials (Table S2).
To see the significance of the choice of parameters and , we show the values of the corresponding parameters obtained for the commonly used values km and = 74 km [17,18,19,22] and applying the selection criteria given by Equation (3) (open circle in Figure 8 and Figure 9). Comparing the results of these two analyses, it can be concluded that the differences are more pronounced for , and at time . The values obtained in this study are larger for and smaller for at both times. The differences are more noticeable for the first parameter. Contrary to the results of the presented model, the dispersion of the values of Wait’s parameters for km and = 74 km are more pronounced for flares of higher intensities.
Bearing in mind that previous statistical studies primarily refer to the dependences of Wait’s parameters on at the time of the X-ray flux maximum, we present comparisons of the values obtained in this study for the time with those given in previous studies [23,35] (also used in [10,18]). As in the previous comparison, the differences are more noticeable for . They are similar in the entire observed X-ray flux domain in contrast to the differences in the dependences which decrease with log.
The choice of the initial values of Wait’s parameters at the time has a dominant influence on the differences in the obtained values. This can be seen from the comparison of the results related to the same year and the same D-region area, as well as from the comparison of the results of studies based on data recorded in different periods of a solar cycle and in observations of different areas.
- In the first case, we compare studies presented in [18,35] that analyse solar X-ray flares that occurred in 2011 (medium solar cycle conditions) and the D-region area monitored by the NWC signal emitted in Australia and recorded in India. The pairs of Wait’s parameters () used in [18,35] are (0.43 km, 71 km) and (0.3 km, 74 km), respectively. A comparison of these values (presented in the upper left panels in Figure 8 and Figure 9) shows that is higher and is less in the first case.
- In the second case, we compare Wait’s parameters in the time obtained in [23] with those shown in [18,35]. The study presented in [23] analyses perturbations caused by X-ray flares which occurred during the solar cycle minimum and medium (1994–1998). It is based on data related to the NPM and NLK signals from USA recorded in New Zealand. The values shown in [23] are between the values given in [18,35]. They are very similar to those given in [35] which corresponds to similar values of (this value is 0.39 km) and the same value of .Finally, the agreement of the results obtained in this study with those given in the previous three can be explained in the same way as in the previous analysis: agreement is best with the results of analyses in which the pair () has similar values to those estimated for a single observed event analysed in this research. The values of shown in [35] are greater than the corresponding values shown in [18,23]. Consequently, they are in the best agreement with the results obtained in this study for events that occurred since 2012, i.e., for events for which the values of are higher and the values of are less than the corresponding values during the minimum of the solar cycle. The agreement of the results of this study is better with those given in [18] in the cases of weak flares that occurred in 2010, i.e., in the period around the solar cycle minimum. In these cases, the initial values of Wait’s parameters are similar in both studies.
In all three analyses in which the pair () is the same for all cases, the dependences of Wait’s parameters on log are linear in the observed domain of X-ray flux. In this analysis, it is shown that the variations of this pair induce the deviations of the considered dependences from the corresponding linear functions. Moreover, the influence of the pair () on Wait’s parameters at the time is so pronounced in cases of weak flares that fitting is not relevant for the analysis of the dependences of Wait’s parameters on the X-ray flux maximum. Fitting of the obtained values that describe the considered flares for which Wm and 50 indicates a decrease in changes of Wait’s parameters with log. The tendency towards saturation is more pronounced for in the observed X-ray flux domain.
4.3. Determination of the Electron Density
Knowledge of Wait’s parameters allows us to calculate the D-region electron density at the times and using Equation (8). The corresponding values at 65 km, 75 km, and 85 km are shown in Figure 10, where the left and right panels refer to the times and , respectively.
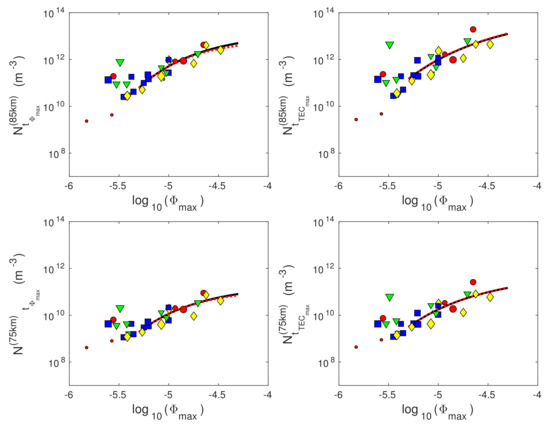
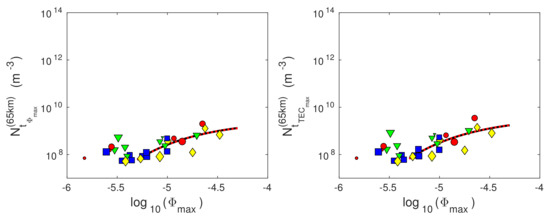
Figure 10.
Dependencies of the electron density () at 85 km (upper panels), 75 km (middle panels), and 65 km (bottom panels) on the logarithm of the X-ray flux given in W/m (log) at the times of the X-ray flux maxima () (left panels) and the D-region perturbation maxima () (right panels). The values obtained in this study are presented by blue squares (X-ray flares occurred in winter), green triangles (X-ray flares occurred in spring), red circles (X-ray flares occurred in summer), and yellow diamonds (X-ray flares occurred in autumn). The black lines represent fitting of the obtained values for the X-ray flares whose flux maxima are greater than Wm and which occurred on days for which the daily smoothed sunspot number is greater than 50. The red lines indicate the corresponding values obtained by applying Equation (8) to the fitted Wait’s parameters.
The obtained graphs show the following:
- As in the case of Wait’s parameter , the dispersion of the obtained values of is greater at the time .
- The influence of the ionospheric initial state is more manifested in the cases of weak flares, which is reflected in more pronounced dispersion of the obtained values at all heights for the corresponding part of the observed flux domain.
- Deviations of points representing weak flares that occurred during periods near the solar cycle minimum are visible at 85 km for both the considered times.
- Fitting of the modelled values refers to the considered flares for which Wm and 50. The obtained fitted functions, shown by black lines in Figure 10, have the form given by Equation (10), where the corresponding parameters a, b, and c are given in Supplementary Materials (Table S2).
- The changes in within the considered flux domain are greater at the time . This is expected because the perturbation intensity is the most pronounced at that time.
Knowledge of the time evolutions and allows us to calculate the D-region electron density time–altitude distribution using Equation (8). In some analyses, the electron density time evolution needs to be fitted. If this fitting is required for many values of h, it is easier to apply Equation (8) to the fitted functions and than to perform a fitting of the electron density time evolution for each of the considered heights. Since the agreement of the corresponding time evolutions obtained by these two ways cannot be confirmed a priori, it is necessary to examine whether it is possible to use the first, easier, method with acceptable accuracy. In Figure 10, we show the time evolutions calculated from the fitted values of Wait’s parameters by red dashed lines. A comparison of these lines with the black ones representing the results of the second fitting method shows that they practically coincide at the bottom D-region heights. By increasing the height, the values obtained in the first way are less than those obtained by fitting of the originally calculated values . However, these deviations are small. This can be shown by the ratio of the values obtained by the first and second method () given in Figure 11. Although the form of the dependence changes with height, it can be seen that the deviations are most significant in the upper D-region part for the largest observed X-ray fluxes. However, these deviations do not exceed 27%, which is not significant considering that the plasma parameters in this atmospheric region are estimated in procedures based on numerous approximations. For this reason, we can conclude that electron density calculation based on fitted values of Wait’s parameters can be used in analyses.
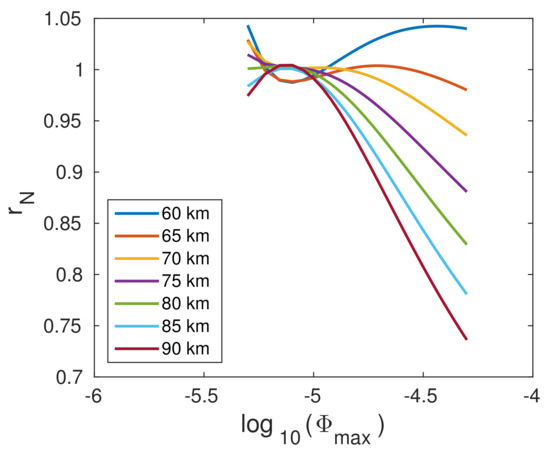
Figure 11.
Dependencies of the coefficient on the logarithm of the X-ray flux given in W/m, log, at the times of the X-ray flux maxima ().
4.4. Determination of the Total Electron Content in the D-Region
The obtained dependencies TEC at times and are shown in Figure 12 (left and right panels, respectively). The obtained graphs show the following:
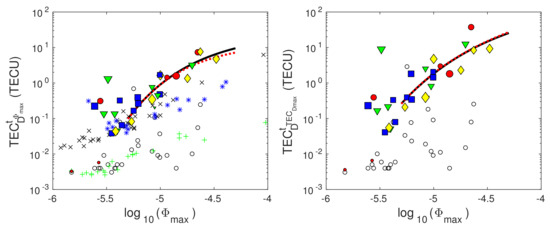
Figure 12.
Dependencies of the total electron content in the D-region (TEC) on the logarithm of the X-ray flux given in W/m (log) at the times of the X-ray flux maxima () (left panel) and at the times of the D-region perturbation maxima () (right panel). The values obtained in this study are presented by blue squares (X-ray flares occurred in winter), green triangles (X-ray flares occurred in spring), red circles (X-ray flares occurred in summer), and yellow diamonds (X-ray flares occurred in autumn). The results obtained from Wait’s parameters presented in [18,23,35] are represented by “x”, “+”, and “*”, respectively. The black lines show fitting of the obtained values for the X-ray flares whose flux maxima are greater than Wm and which occurred on days for which the daily smoothed sunspot number is greater than 50.
- The values of TEC are higher at the time . This is consistent with the change in the intensity of the D-region perturbation which is the largest at this time.
- Due to the additional influence of the differences in the X-ray flux time evolutions after the analysed flare intensity maxima, the dispersion of the shown points is more pronounced at the time .
- The influence of seasonal variations is not pronounced.
- The effect of the X-ray flux variation during a solar cycle is visible only for the considered weak flares that occurred in the period around the solar cycle minimum.
- The dispersion of points representing weak flares is expressed at both times due to the significant influence of the initial conditions on the characteristics of the corresponding perturbations.
- The influence of initial conditions on a perturbation decreases with the X-ray flux. This reduces the dispersion of the obtained points and, consequently, allows the fitting of points that represent flares for which Wm and 50 (black lines on the chart). In both cases, the fitted function has the form given by Equation (10), where the corresponding parameters a, b, and c are given in Supplementary Materials (Table S2).
- As in the case of the parameter , the values of TEC obtained by the presented procedure are greater than those obtained for the initial values of Wait’s parameters 0.3 km and 74 km in both observed times (except in one case). The tendency of the dependence TEC is more pronounced in the first than in the second case.
- Compared to the studies presented in [18,23,35], the values obtained in this paper are in good agreement with:
- -
- The values obtained from Wait’s parameters presented in [23,35] for X-ray flares of mid-intensity class-C;
- -
- The values obtained from Wait’s parameters presented in [18] for two weak X-ray flares that occurred in the period around the solar cycle minimum (2010).
The values obtained in this study are greater in the cases of the other considered weak X-ray flares and in the cases of more intense ones. - Unlike the shown dependences obtained on the basis of the data presented in [18,23,35], the dependences obtained in this paper are not linear, and the given fittings are not relevant for weak flares due to the significant dispersion of the obtained values.
As in the case of the electron density at higher D-region altitudes, the values obtained by fitting the points determined for the individual considered cases (black lines in Figure 12) are in very good agreement with those calculated on the basis of fitted dependences of Wait’s parameters (red lines in Figure 12), except for the most intense flares at time where a small deviation is visible. The ratio of the obtained values in the second and first case () at the time is shown in Figure 13 where one can see that it does not exceed 25%. This deviation is not great considering the necessity of using numerous approximations in ionospheric models. Therefore, we can conclude that the fitted functions of Wait’s parameters can be used to determine the dependence TEC.
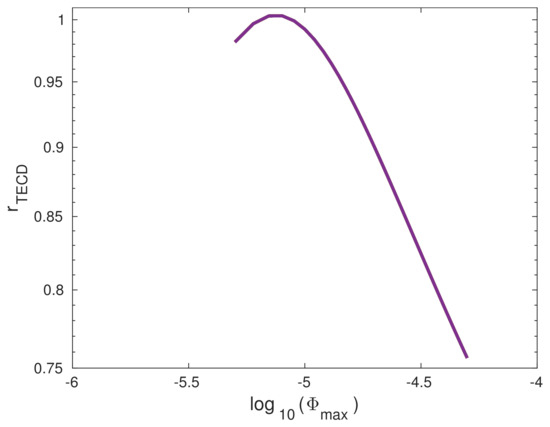
Figure 13.
Dependencies of the coefficient on the logarithm of the X-ray flux given in W/m (log) at the times of the X-ray flux maxima ()
5. Conclusions
This study presents an upgrade of the quiet ionospheric D-region model. The presented procedure, based on the data obtained by remote sensing of the analysed area during the considered time period, allows for a more precise modelling of the D-region intensively perturbed by a solar X-ray flare. Its most significant contribution refers to a method for the determination of the quiet ionosphere parameters describing the observed area in the period preceding the analysed perturbation. In addition, the developed procedure allows us to reduce the required number of very low/low frequency signals (i.e., transmitters that emit them) to monitor the ionosphere from two (as required in the quiet ionospheric D-region model) to just one. In this way, the observation area is more localised and, consequently, the obtained values of the considered quiet ionosphere parameters are more precise which is, as shown in this study, significant for modelling of the perturbed ionosphere.
In this study, we analyse the “sharpness”, the signal reflection height, the D-region electron density, and the total electron content in the D-region. The obtained results show the following:
- The choice of Wait’s parameters describing the quiet ionosphere affect the time evolutions of the considered parameters during the entire period of a perturbation induced by an X-ray flare.
- The influence of the quiet ionosphere state in the period preceding perturbation on the electron density and total electron content in the perturbed D-region is significant for weak X-ray flares.
- The influence of the initial conditions on the considered ionospheric parameters at the times of the radiation maximum and the most intense D-region perturbation decreases with the X-ray flux.
- Significant differences caused by the variations in the radiation intensity during the 24th solar cycle are obtained for:
- -
- The “sharpness”—the obtained values are significantly lower for events that occurred in the period around the solar cycle minimum;
- -
- The electron density in the D-region upper part—the obtained values are significantly lower for weak solar X-ray flares that occurred in the period around the solar cycle minimum;
- -
- The total electron content in the D-region—the obtained values are significantly lower for weak solar X-ray flares that occurred in the period around the solar cycle minimum.
The stated differences are obtained at the times of the X-ray flux maximum and the most intense D-region disturbance. The variations in the radiation intensity during the 24th solar cycle do not affect the signal reflection height. - The influence of the seasonal variations on the analysed parameters is not significant at the times of the X-ray flux maximum and the most intense D-region disturbance.
- Due to the pronounced influence of the quiet ionosphere state before perturbation on the analysed parameters in the cases of weak flares, the dispersions of the points describing these events on the corresponding graphs are large. For this reason, we fit only the obtained values describing the X-ray flares of class-C5 or stronger. Due to the differences induced by the variations in the radiation intensity during a solar cycle, the presented fits are relevant for the events which occurred during the days when the smoothed daily sunspot number is greater than 50.
- The obtained results indicate the need to correct the linear dependences of the observed parameters on the logarithm of the X-ray flux maximum obtained in the cases when the initial conditions are considered the same for all analysed cases. The dependences obtained by the method presented in this study indicate a tendency towards saturation of the observed values with the logarithm of the X-ray flux maximum.
- The dispersion of points representing the dependences of the observed parameters on the logarithm of the X-ray flux is higher at the time of maximum D-region perturbation than at the time of maximum X-ray flux. This can be explained by the additional influence of the difference in the time evolutions of the X-ray flux after its maximum on the ionosphere.
- The fitted functions of Wait’s parameters can be used to determine the fitted dependences of the electron density and total electron content in the D-region.
To conclude, the obtained results show that taking into account the specificity of the initial conditions in an individual case gives more intense perturbations of the solar X-ray flare perturbed D-region than in the case when the initial conditions are considered the same in different time periods. Consequently, this result indicates more significant influence of the perturbed D-region on electromagnetic signals. This study confirms the need to include observations of the intensely perturbed D-region in the modelling of satellite signal propagation indicated in recent studies. This is important for the accuracy of satellite data used in many modern technologies and indicates the possibility of practical applications of space weather research.
Supplementary Materials
The following are available at https://www.mdpi.com/article/10.3390/rs14010054/s1, Table S1: Wait’s parameters obtained by the Quiet ionospheric D-region model ( and ) and by the procedure presented in this study ( and ) for the considered X-ray flares, Table S2: Parameters a, b and c required for the calculations of the “sharpness” (), the signal reflection height (), the electron density () at 60 km, 65 km, 70 km, 75 km, 80 km, 85 km, and 90 km, and the total electron content in the D-region (TEC) by Equation (10).
Funding
The author acknowledge funding provided by the Institute of Physics Belgrade through the grant by the Ministry of Education, Science, and Technological Development of the Republic of Serbia.
Institutional Review Board Statement
Not applicable.
Informed Consent Statement
Not applicable.
Data Availability Statement
The VLF data used for analysis is available from the corresponding author. Simulation results by IRI-16 model have been provided by the Community Coordinated Modeling Center at Goddard Space Flight Center through their public Runs on Request system (http://ccmc.gsfc.nasa.gov, accessed on 11 December 2021). The IRI Model was developed by Dieter Bilitza at the National Aeronautics and Space Administration/Goddard Space Flight Center (NASA/GSFC). Publicly available datasets were analysed in this study. This data can be found here: https://hesperia.gsfc.nasa.gov/goes/goes_event_listings/, accessed on 24 March 2020; https://satdat.ngdc.noaa.gov/sem/goes/data/full/, accessed on 7 September 2021; https://wwwbis.sidc.be/silso/datafiles, accessed on 3 August 2020; https://ccmc.gsfc.nasa.gov/modelweb/models/iri2016_vitmo.php, accessed on 11 December 2021.
Acknowledgments
The author thank Vladimir Čadež and Tamal Basak for very useful suggestions and comments.
Conflicts of Interest
The author declare no conflict of interest.
References
- Raulin, J.P.; Trottet, G.; Kretzschmar, M.; Macotela, E.L.; Pacini, A.; Bertoni, F.C.P.; Dammasch, I.E. Response of the low ionosphere to X-ray and Lyman-α solar flare emissions. J. Geophys. Res. Space Phys. 2013, 118, 570–575. [Google Scholar] [CrossRef] [Green Version]
- Schmitter, E.D. Modeling solar flare induced lower ionosphere changes using VLF/LF transmitter amplitude and phase observations at a midlatitude site. Ann. Geophys. 2013, 31, 765–773. [Google Scholar] [CrossRef] [Green Version]
- Ammar, A.; Ghalila, H. Ranking of Sudden Ionospheric Disturbances by Means of the Duration of Vlf Perturbed Signal in Agreement with Satellite X-ray Flux Classification. Acta Geophys. 2016, 64, 2794–2809. [Google Scholar] [CrossRef]
- Kumar, S.; Kumar, A.; Menk, F.; Maurya, A.K.; Singh, R.; Veenadhari, B. Response of the low-latitude D region ionosphere to extreme space weather event of 14–16 December 2006. J. Geophys. Res. Space Phys. 2015, 120, 788–799. [Google Scholar] [CrossRef] [Green Version]
- Kumar, S.; NaitAmor, S.; Chanrion, O.; Neubert, T. Perturbations to the lower ionosphere by tropical cyclone Evan in the South Pacific Region. J. Geophys. Res. Space Phys. 2017, 122, 8720–8732. [Google Scholar] [CrossRef]
- Zhao, S.; Shen, X.; Liao, L.; Zhima, Z.; Zhou, C.; Wang, Z.; Cui, J.; Lu, H. Investigation of Precursors in VLF Subionospheric Signals Related to Strong Earthquakes (M > 7) in Western China and Possible Explanations. Remote Sens. 2020, 12, 3563. [Google Scholar] [CrossRef]
- Nina, A.; Nico, G.; Odalović, O.; Čadež, V.; Todorović Drakul, M.; Radovanović, M.; Popović, L.Č. GNSS and SAR Signal Delay in Perturbed Ionospheric D-Region During Solar X-ray Flares. IEEE Geosci. Remote Sens. Lett. 2020, 17, 1198–1202. [Google Scholar] [CrossRef]
- Nina, A.; Radović, J.; Nico, G.; Popović, L.Č.; Radovanović, M.; Biagi, P.F.; Vinković, D. The Influence of Solar X-ray Flares on SAR Meteorology: The Determination of the Wet Component of the Tropospheric Phase Delay and Precipitable Water Vapor. Remote Sens. 2021, 13, 2609. [Google Scholar] [CrossRef]
- Bilitza, D. IRI the International Standard for the Ionosphere. Adv. Radio Sci. 2018, 16, 1–11. [Google Scholar] [CrossRef] [Green Version]
- Thomson, N.R.; Rodger, C.J.; Clilverd, M.A. Large solar flares and their ionospheric D region enhancements. J. Geophys. Res. Space Phys. 2005, 110, A06306. [Google Scholar] [CrossRef] [Green Version]
- Han, F.; Cummer, S.A.; Li, J.; Lu, G. Daytime ionospheric D region sharpness derived from VLF radio atmospherics. J. Geophys. Res. Space Phys. 2011, 116, 5314. [Google Scholar] [CrossRef] [Green Version]
- McRae, W.M.; Thomson, N.R. VLF phase and amplitude: Daytime ionospheric parameters. J. Atmos. Sol.-Terr. Phys. 2000, 62, 609–618. [Google Scholar] [CrossRef]
- Nina, A.; Nico, G.; Mitrović, S.T.; Čadež, V.M.; Milošević, I.R.; Radovanović, M.; Popović, L.Č. Quiet Ionospheric D-Region (QIonDR) Model Based on VLF/LF Observations. Remote Sens. 2021, 13, 483. [Google Scholar] [CrossRef]
- Singh, A.K.; Singh, A.; Singh, R.; Singh, R. Solar flare induced D-region ionospheric perturbations evaluated from VLF measurements. Astrophys. Space Sci. 2014, 350, 1–9. [Google Scholar] [CrossRef]
- Ferguson, J.A. Computer Programs for Assessment of Long-Wavelength Radio Communications, Version 2.0; Space and Naval Warfare Systems Center: San Diego, CA, USA, 1998. [Google Scholar]
- Cohen, M.B.; Inan, U.S.; Paschal, E.W. Sensitive Broadband ELF/VLF Radio Reception with the AWESOME Instrument. IEEE Trans. Geosci. Remote Sens. 2010, 48, 3–17. [Google Scholar] [CrossRef]
- Nina, A.; Čadež, V.M.; Bajčetić, J.; Mitrović, S.T.; Popović, L.Č. Analysis of the Relationship Between the Solar X-ray Radiation Intensity and the D-Region Electron Density Using Satellite and Ground-Based Radio Data. Sol. Phys. 2018, 293, 64. [Google Scholar] [CrossRef]
- Basak, T.; Chakrabarti, S.K. Effective recombination coefficient and solar zenith angle effects on low-latitude D-region ionosphere evaluated from VLF signal amplitude and its time delay during X-ray solar flares. Astrophys. Space Sci. 2013, 348, 315–326. [Google Scholar] [CrossRef] [Green Version]
- Grubor, D.P.; Šulić, D.M.; Žigman, V. Classification of X-ray solar flares regarding their effects on the lower ionosphere electron density profile. Ann. Geophys. 2008, 26, 1731–1740. [Google Scholar] [CrossRef] [Green Version]
- Chakraborty, S.; Basak, T. Numerical analysis of electron density and response time delay during solar flares in mid-latitudinal lower ionosphere. Astrophys. Space Sci. 2020, 365, 1–9. [Google Scholar] [CrossRef]
- Thomson, N.R. Experimental daytime VLF ionospheric parameters. J. Atmos. Terr. Phys. 1993, 55, 173–184. [Google Scholar] [CrossRef]
- Žigman, V.; Grubor, D.; Šulić, D. D-region electron density evaluated from VLF amplitude time delay during X-ray solar flares. J. Atmos. Sol.-Terr. Phys. 2007, 69, 775–792. [Google Scholar] [CrossRef]
- McRae, W.M.; Thomson, N.R. Solar flare induced ionospheric D-region enhancements from VLF phase and amplitude observations. J. Atmos. Sol.-Terr. Phys. 2004, 66, 77–87. [Google Scholar] [CrossRef]
- Todorović Drakul, M.; Čadež, V.M.; Bajčetić, J.; Popović, L.Č.; Blagojević, D.; Nina, A. Behaviour of electron content in the ionospheric D-region during solar X-ray flares. Serb. Astron. J. 2016, 193, 11–18. [Google Scholar] [CrossRef]
- Hayes, L.A.; Gallagher, P.T.; McCauley, J.; Dennis, B.R.; Ireland, J.; Inglis, A. Pulsations in the Earth’s Lower Ionosphere Synchronized With Solar Flare Emission. J. Geophys. Res. Space Phys. 2017, 122, 9841–9847. [Google Scholar] [CrossRef] [Green Version]
- Nina, A.; Čadež, V. Electron production by solar Ly-α line radiation in the ionospheric D-region. Adv. Space Res. 2014, 54, 1276–1284. [Google Scholar] [CrossRef] [Green Version]
- Kumar, A.; Kumar, S. Solar flare effects on D-region ionosphere using VLF measurements during low- and high-solar activity phases of solar cycle 24. Earth Planets Space 2018, 70, 29. [Google Scholar] [CrossRef]
- Klobuchar, J.A. Design and characteristics of the GPS ionospheric time delay algorithm for single frequency users. In PLANS ’86—Position Location and Navigation Symposium; Institute of Electrical and Electronics Engineers: New York, NY, USA, 1986. [Google Scholar]
- Zhao, J.; Zhou, C. On the optimal height of ionospheric shell for single-site TEC estimation. GPS Solut. 2018, 22, 48. [Google Scholar] [CrossRef]
- Daniell, R.J.; Brown, L. PRISM: A Parameterized Real-Time Ionospheric Specification Model, Version 1.5; Computational Physics Inc: Newton, MA, USA, 1995. [Google Scholar]
- Nava, B.; Coïsson, P.; Radicella, S. A new version of the NeQuick ionosphere electron density model. J. Atmos. Sol.-Terr. Phys. 2008, 70, 1856–1862. [Google Scholar] [CrossRef]
- Scherliess, L.; Schunk, R.W.; Sojka, J.J.; Thompson, D.C.; Zhu, L. Utah State University Global Assimilation of Ionospheric Measurements Gauss-Markov Kalman filter model of the ionosphere: Model description and validation. J. Geophys. Res. Space Phys. 2006, 111, A11315. [Google Scholar] [CrossRef] [Green Version]
- Mechtly, E.; Bilitza, D. Models of D-Region Electron Concentration, Report IPW-WB1; Institut fur Physik Weltraumforsch: Freiburg, Germany, 1974. [Google Scholar]
- Friedrich, M.; Torkar, K.M. FIRI: A semiempirical model of the lower ionosphere. J. Geophys. Res. 2001, 106, 21409–21418. [Google Scholar] [CrossRef]
- Pandey, U.; Singh, B.; Singh, O.; Saraswat, V. Solar flare induced ionospheric D-region perturbation as observed at a low latitude station Agra, India. Astrophys. Space. Sci. 2015, 357, 35. [Google Scholar] [CrossRef]
- Nina, A.; Čadež, V.; Bajčetić, J. Contribution of Solar Hydrogen Lyα Line Emission in Total Ionization Rate in Ionospheric D-region During the Maximum of Solar X-flare. Serb. Astron. J. 2015, 191, 51–57. [Google Scholar] [CrossRef]
Publisher’s Note: MDPI stays neutral with regard to jurisdictional claims in published maps and institutional affiliations. |
© 2021 by the author. Licensee MDPI, Basel, Switzerland. This article is an open access article distributed under the terms and conditions of the Creative Commons Attribution (CC BY) license (https://creativecommons.org/licenses/by/4.0/).