Article

Automatic, Multiview, Coplanar Extraction for CityGML Building Model Texture Mapping

1
School of Geomatics, East China University of Technology, Nanchang 330013, China
2
Key Laboratory of Mine Environmental Monitoring and Improving around Poyang Lake, Ministry of Natural Resources, Nanchang 330013, China
3
Jiangxi Academy of Water Science and Engineering, Nanchang 330029, China
*
Author to whom correspondence should be addressed.
Remote Sens. 2022, 14(1), 50; https://doi.org/10.3390/rs14010050
Submission received: 14 November 2021 / Revised: 19 December 2021 / Accepted: 21 December 2021 / Published: 23 December 2021
(This article belongs to the Special Issue Techniques and Applications of UAV-Based Photogrammetric 3D Mapping)

Abstract

:
Most 3D CityGML building models in street-view maps (e.g., Google, Baidu) lack texture information, which is generally used to reconstruct real-scene 3D models by photogrammetric techniques, such as unmanned aerial vehicle (UAV) mapping. However, due to its simplified building model and inaccurate location information, the commonly used photogrammetric method using a single data source cannot satisfy the requirement of texture mapping for the CityGML building model. Furthermore, a single data source usually suffers from several problems, such as object occlusion. We proposed a novel approach to achieve CityGML building model texture mapping by multiview coplanar extraction from UAV remotely sensed or terrestrial images to alleviate these problems. We utilized a deep convolutional neural network to filter out object occlusion (e.g., pedestrians, vehicles, and trees) and obtain building-texture distribution. Point-line-based features are extracted to characterize multiview coplanar textures in 2D space under the constraint of a homography matrix, and geometric topology is subsequently conducted to optimize the boundary of textures by using a strategy combining Hough-transform and iterative least-squares methods. Experimental results show that the proposed approach enables texture mapping for building façades to use 2D terrestrial images without the requirement of exterior orientation information; that is, different from the photogrammetric method, a collinear equation is not an essential part to capture texture information. In addition, the proposed approach can significantly eliminate blurred and distorted textures of building models, so it is suitable for automatic and rapid texture updates.

Graphical Abstract

1. Introduction

1.1. Background

The development of smart city highly depends on the quality of geospatial data infrastructure, and 3D visualization is a core technology of a digital city [1]. A representative city geography markup language (CityGML) is developed by Open Geospatial Consortium for defining and describing 3D building attributes, such as geometric, topological, semantic, and appearance characteristics, which are very valuable for many applications, such as simulation modeling, urban planning, and map navigation [2]. Texture mapping of building models has always been a hot and significant research topic in the fields of computer vision, photogrammetry, and remote sensing. Nevertheless, due to problems such as ground-object occlusion, texture mapping of CityGML building models is still challenging.
Generally, CityGML can be divided into five levels of detail (LOD), including LOD0 (e.g., regional, landscape), LOD1 (e.g., city, region), LOD2 (e.g., city neighborhoods, projects), LOD3 (e.g., architectural models (exterior), landmarks), and LOD4 (e.g., architectural models (interior)) [3,4,5,6]. However, popular map providers, such as Google and Baidu, are currently limited to LOD0-2 as a result of extremely large and complex data processing, as well as high costs and time consumption of data acquisition. In addition, researchers are attempting to build 3D city models using multisource geospatial data (e.g., airborne LiDAR point cloud and photogrammetric mapping) to generate LOD2- and LOD3-level city models [7]. Although these techniques can obtain desirable 3D building models, they still require high potential costs for frequent updates of the texture of building models. However, a single data source usually suffers from several problems, such as object occlusion.

1.2. Related Work

In the previous decades, building large-scale urban models has been broadly studied, including manual, automatic, and human–computer-interaction methods. Evidently, the manual method is not desirable, given its long production cycle and high cost. From the perspective of data sources used for building-texture mapping, many studies mainly focus on photogrammetric data, LiDAR point cloud data, and crowd-sourced data.

1.2.1. Texture Mapping Based on Photogrammetric Data and LiDAR Point Cloud Data

In recent years, the popularization of unmanned aerial vehicles (UAV), oblique cameras, and LiDAR, coupled with the increasing maturity of high-resolution stereo imaging, not only realizes rapid production of large-scale urban models but also gradually shortens the modeling cycle and continuously reduces the cost. Consequently, photogrammetric data and LiDAR point cloud data are also widely used in 3D modeling and texture mapping. Li et al. [8] proposed an optimized combination of graph-based 3D visualization and image-based 3D visualization to realize geographic information system (GIS) 3D visualization. Yalcin et al. [9] suggested creating a 3D city model from aerial images based on oblique photogrammetry. Abayowa et al. [10] presented 3D city modeling based on the fusion of LiDAR data and aerial image data. Through the efforts of the researchers, these data sources can provide users with a multidimensional, multiperspective, and omnidirectional environment to browse, measure, and analyze ground objects, which are suitable for spatial decision-making applications. However, these methods have many problems, such as the large amount of data acquisition, complex processing algorithms, fuzzy texture information, high production cost, and long update cycle. Strong theoretical and technical support is also provided for urban modeling and its application due to the vigorous development of remote sensing, photogrammetry, computer graphics, stereo vision, and machine learning, while research on the continuous expansion of the breadth and depth of the urban model is promoted. Among them, Heo et al. [11] proposed a semi-automatic method for high-complexity 3D city modeling using point clouds collected by ground LiDAR. Wang et al. [12] suggested a method for urban modeling based on oblique photogrammetry and 3DMax plug-in development technology. These methods aim to combine the advantages of multisource data to provide practical, efficient, and semi-automatic urban modeling methods. Zhang et al. [13] presented a rapid-reconstruction method of 3D city model texture based on the principle of oblique photogrammetry, which can automatically extract the texture and uniform color of building façades and perform texture mapping, considering multiple building occlusions. These methods have achieved certain results in response to these problems. However, other problems, such as object occlusion and incomplete texture, are still challenging for fine texture mapping of building models.

1.2.2. Texture Mapping Based on Crowd-Sourced Data

In recent years, crowd-sourced data (such as public images) have been broadly used as alternative or supplementary data sources for many GIS modeling applications. These public images can provide structured map description by tags and attributes, and existing 2D images can be converted into 3D models in batches in terms of related attributes. Therefore, this type of crowd-sourced data has also become an important data source for 3D city refined texture mapping. Many 3D city modeling methods based on crowd-sourced data have also been proposed. For example, Lari et al. [14] introduced a new method for 3D reconstruction of flat surfaces; it aims to improve the interpretability of planes extracted from laser-scanning data by using the spectral information of the overlapping images collected by low-cost aerial surveying and mapping systems. Khairnar et al. [15] used the structural and geographic information retrieved from OpenStreetMap (OSM) to reconstruct the shape of the building. They also used the images obtained from the street view of Google Maps to extract information about the appearance of the building to map textures to building boundaries. Girindran et al. [16] proposed a method to generate low-cost 3D city models from public 2D building data by combining satellite-elevation datasets, confirming a potential solution for the lack of free, high-resolution 3D city models. In addition, the use of other data, combined with public images, has made great breakthroughs in texture mapping. Gong et al. [17] used vehicle-mounted mobile measurement data to supplement and refine building façades by using an enhanced method. Li et al. [18] proposed a seamless reconstruction method for texture optimization based on low-altitude, multi-lens, oblique photography in the production of 3D urban models. Hensel et al. [7] improved the quality of textures on the façades of LOD2 CityGML building models based on deep learning and mixed-integer linear programming. Although these studies have achieved good performance in texture optimization, update cycle, modeling cost, quality and scalability of building models decline in the process of urban modeling because the textures of building models are still not updated promptly.
Generally, most traditional 3D models have been built in the form of pure graphics or geometry, ignoring the semantic and topological relationship between graphics and geometry. These models are limited to 3D visualization and cannot satisfy the requirement of in-depth applications, such as thematic query, spatial analysis, and spatial data mining. CityGML defines the classification of most geographic objects in the city and the relationship between them. It fully considers the geometry, topology, semantics, appearance, and other attributes of the regional model, thereby making up for the traditional 3D models in terms of data sharing and interoperability. In addition, the city’s 3D model has become reusable, greatly reducing the cost of the city’s 3D modeling [2]. Many studies have been conducted using CityGML building modeling. Deng et al. [19] proposed a relatively complete and high-precision mapping framework between IFC and CityGML in different LOD CityGML models, including the transformation of geometric shapes, coordinate systems, and semantic frameworks. Fan et al. [20] introduced a method to derive LOD2 buildings from the LOD3 model, which separated the different semantic components of the building, with the goal of preserving the features of the floor plan, roof, and wall structure as much as possible. Hensel et al. [7] described the workflow of generating an LOD3 CityGML model (i.e., a semantic building model with a structured appearance) by adding window and door objects to texture LOD2 CityGML building models. Kang et al. [21] developed an automatic multiprocessing LOD geometric mapping method based on screen-buffer scanning, including semantic mapping rules, to improve the efficiency of the mapping task. However, these studies using the CityGML model rarely involved improvement of visualization and interpretability through texture mapping. In addition, most existing texture-mapping methods for remotely sensed imagery and terrestrial images heavily depend on exterior orientation information and normally require a collinear equation to associate the 3D models and image texture. Nevertheless, due to the simplification of the building model and the inaccurate location information of LOD CityGML building models, the commonly used photogrammetric methods cannot satisfy the requirement of texture mapping for the CityGML building model. In addition, textured buildings derived from aerial photogrammetry are often occluded by ground objects, e.g., pedestrians, vehicles, and trees, as shown in Figure 1, resulting in object occlusion and texture distortion.

1.3. Research Objectives

The above-introduced photogrammetric methods seek to perform texture mapping from UAV, LiDAR, and crowd-sourced data through rigorous geometric transformation (e.g., aerial triangulation), which is not suitable for texture mapping of simplified CityGML building models. Additionally, a single data source usually suffers from several problems, such as object occlusion. In this study, we propose a novel approach of texture mapping for 3D building models from multisource data, such UAV remotely sensed imagery and terrestrial images, to alleviate these problems of texture mapping for CityGML building models. This approach does not perform aerial triangulation; instead, only multiview coplanar extraction was explored for texture mapping, without the requirement of exterior orientation information. Inspired by the superiority of deep learning, an object-occlusion detection method combining deep convolutional neural networks and vegetation removal is exploited to filter out pedestrians, vehicles, and trees under complex image background, such as uneven illumination and geometric deformation. Point-feature-based matching under the constraint of building boundaries is conducted to compute the homography matrix of the overlapped image, in which multiview 2D planes are extracted as the candidate textures. Then, geometric topology is derived to accurately delineate the façade boundaries of building models using Hough-transform and iterative least-squares methods. Subsequently, based on the registration of the map and the street view, the untextured or textured building models of CityGML can be mapped or updated using texture information of terrestrial images. Therefore, texture mapping of CityGML building models can be achieved by air-ground integrated data acquisition (e.g., aerial oblique images, ground street-scene images) and processing technologies. Furthermore, the texture of CityGML building models can be automatically and rapidly updated to significantly eliminate blurred and distorted textures caused by object occlusion in aerial photogrammetry.
The main contribution of this work is to propose an approach for texture mapping that is suitable for CityGML building models using 2D remotely sensed and terrestrial images. In this study, deep convolutional neural networks enable high-quality texture to be extracted from complex image backgrounds. Multiview coplanar extraction is defined to extract building façades by perspective transformation without the requirement of exterior orientation information. In addition, geometric topology is used to optimize the façade boundaries of building models for denoising.
The remainder of the paper is organized as follows. Section 2 describes the details of the proposed approach for building façade texture mapping. Section 3 and Section 4 present the comparative experimental results in combination with a detailed analysis and discussion. Section 5 concludes this paper and discusses possible future work.

2. Methods

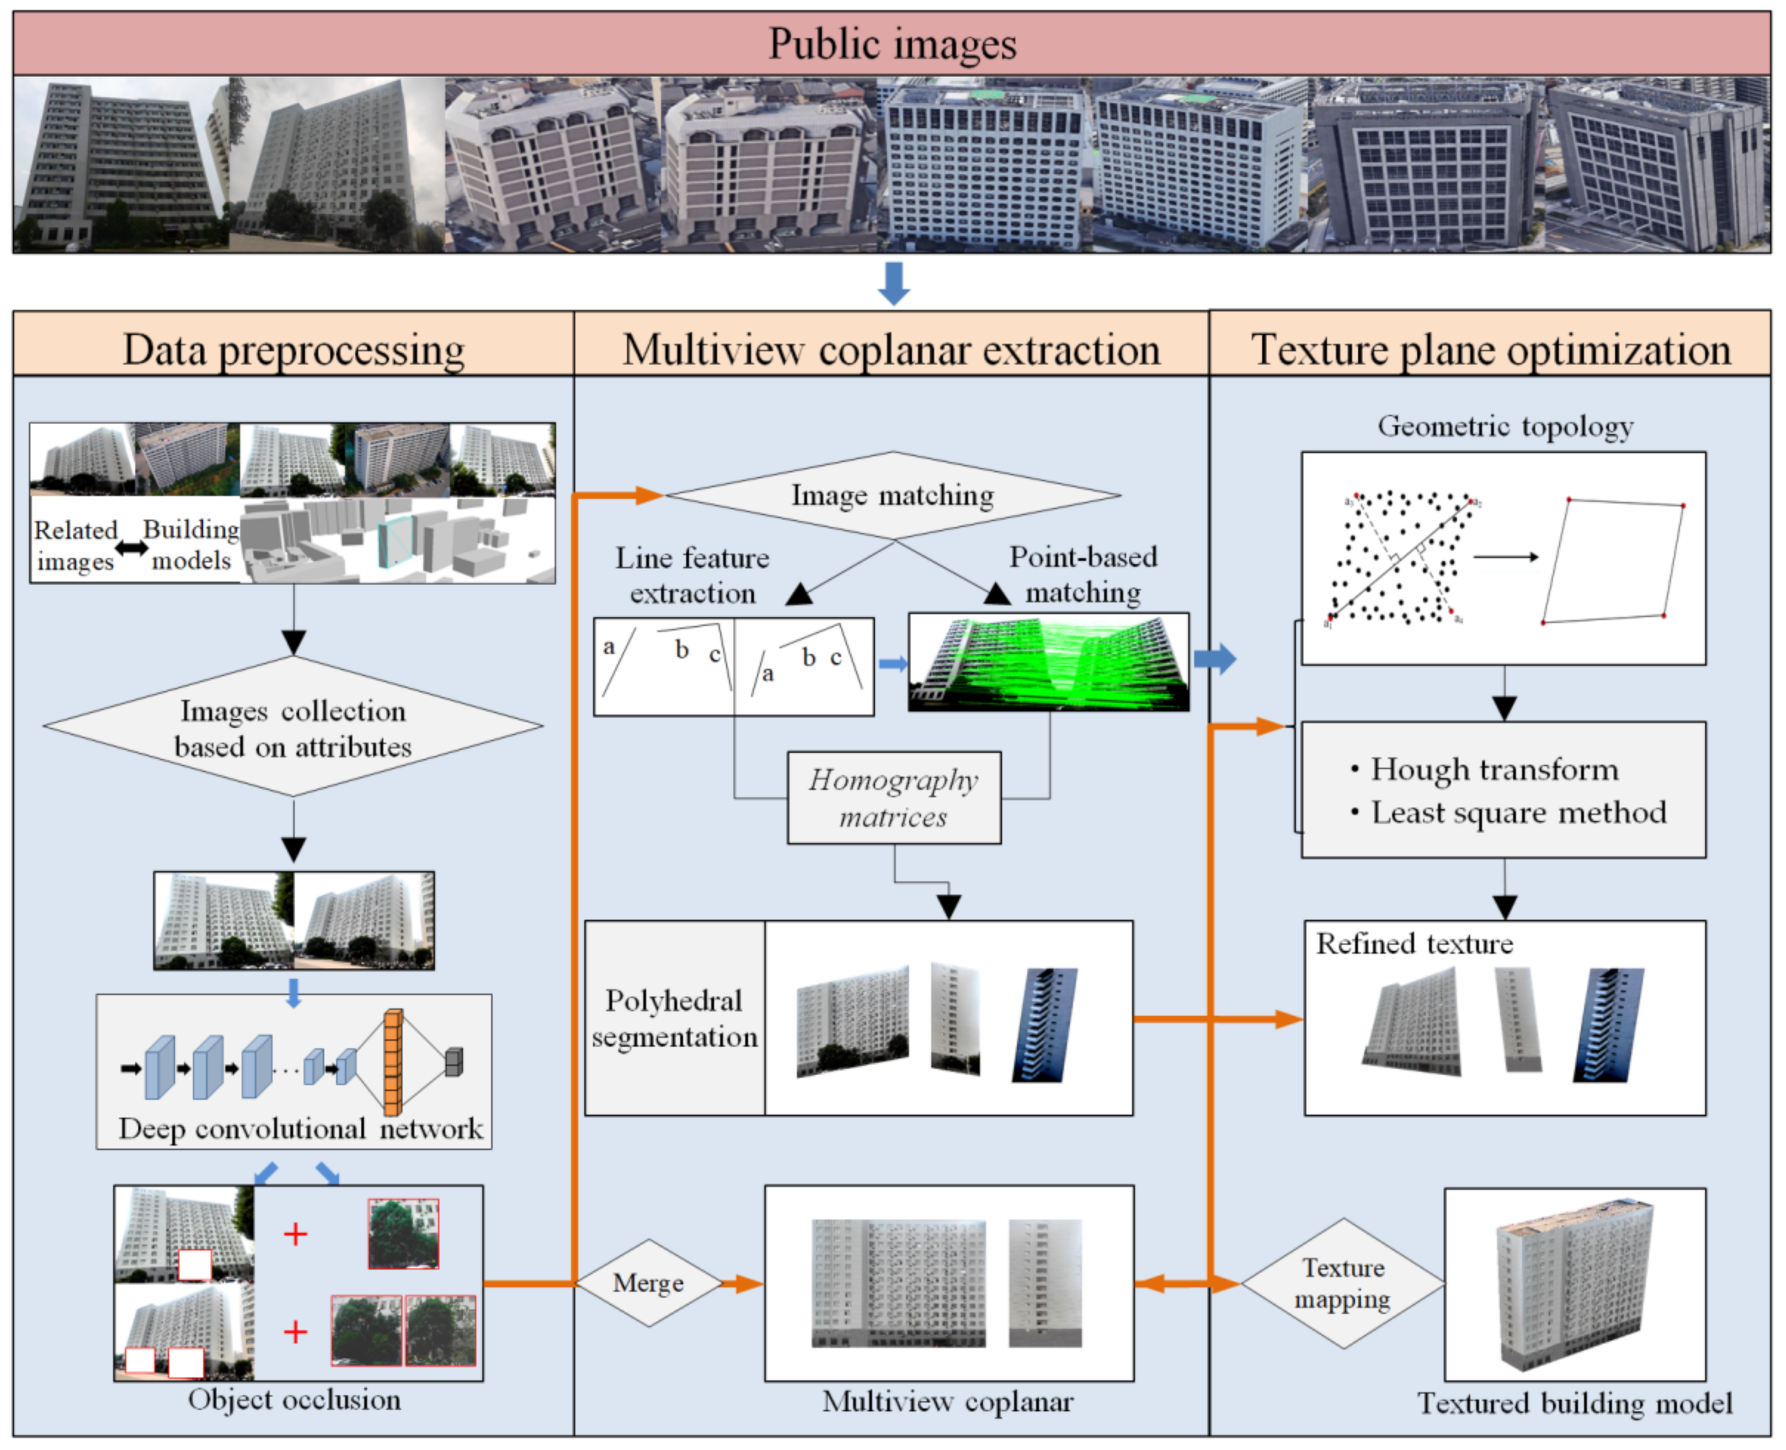
2.1. Overview of the Proposed Approach

Generally, texture mapping on top of the building model using UAV remote imagery is simpler than that on the building façade with terrestrial images because no object occlusion exists. The workflow of the proposed approach focuses on the façade of the building for texture mapping by terrestrial images, as shown in Figure 2; it consists of three stages. In the preprocessing stage, the relevant terrestrial images of the building are gathered from public images through some basic attributes, e.g., GPS position and annotation, and the texture is preferred by excluding object occlusion, e.g., pedestrians, vehicles, and trees, using deep convolutional networks (e.g., NanoDet [22]). In the multiview planar extraction stage, point-based image matching is utilized to compute the homography matrix, which is used to extract texture information in 2D multiview planes under the constraint of building boundaries. In the texture-plane optimization stage, the quadrilateral shape of building façades is defined based on the geometric topology of point and line features and optimized using Hough-transform and iterative least-squares methods. Finally, in the texture-mapping operation, the building façade is mapped from the extracted texture by perspective transformation, including projection, mapping, and resampling.

2.2. Relevant Terrestrial Image Collection Based on Attributes

Although a large number of public images offer an opportunity for texture mapping of building façades easily with low cost, determining which images correspond to which buildings is difficult and time-consuming. Fortunately, many public images are captured by mobile phones with some attributes, e.g., global navigation satellite system (GNSS) position and image annotation, which can be used to filter images that are unrelated to a building. In particular, the image annotation is usually provided with a building name, which can correspond to the building through the online map, and the orientation of an image to the center of the building can be derived in combination with the GPS position. Therefore, we developed an approach of relevant terrestrial image collection based on attributes.
As shown in Figure 3, the related regions, R and R’, of Buildings 1 and 2 are defined by a given radius, r. Then, the subregions, Region1-4 and Region1′-4′, corresponding to each façade of Buildings 1 and 2, respectively, are split by the lines (l1,l2) and (l1′,l2′), which are defined based on the diagonal of the buildings. Evidently, the candidate terrestrial images corresponding to a building can be obtained on the basis of GPS position and annotation. However, a terrestrial image is usually annotated by only one place name, which may be related to multiple buildings, i.e., the public image P may be related to Buildings 1 and 2. Then, we explore the dot-product [23] operation of two vectors, P C 1 and P C 2 , to determine whether a public image can provide the potential texture for multiple buildings. In addition, two vectors, P C 1 and P C 2 , can be defined based on the GPS position of the public image, P, and the centers, C1 and C2, of Buildings 1 and 2. The dot-product of P C 1 and P C 2 is computed as follows:
v a l P C 1 , P C 2   = P C 1 · P C 2 =   P C 1 P C 2 c o s θ ,
where θ is the angle between two vectors, P C 1 and P C 2 . Through many experiments and statistical analysis, we conclude that when θ > 90 degrees, a satisfactory texture is difficult to capture due to severe deformation. Hence, when v a l P C 1 , P C 2 < 0 , if either building is not annotated, then the public image, P, cannot be considered a candidate texture for the annotated building.

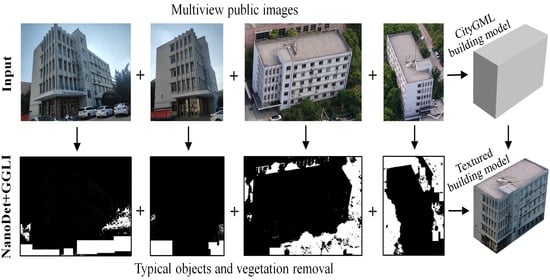
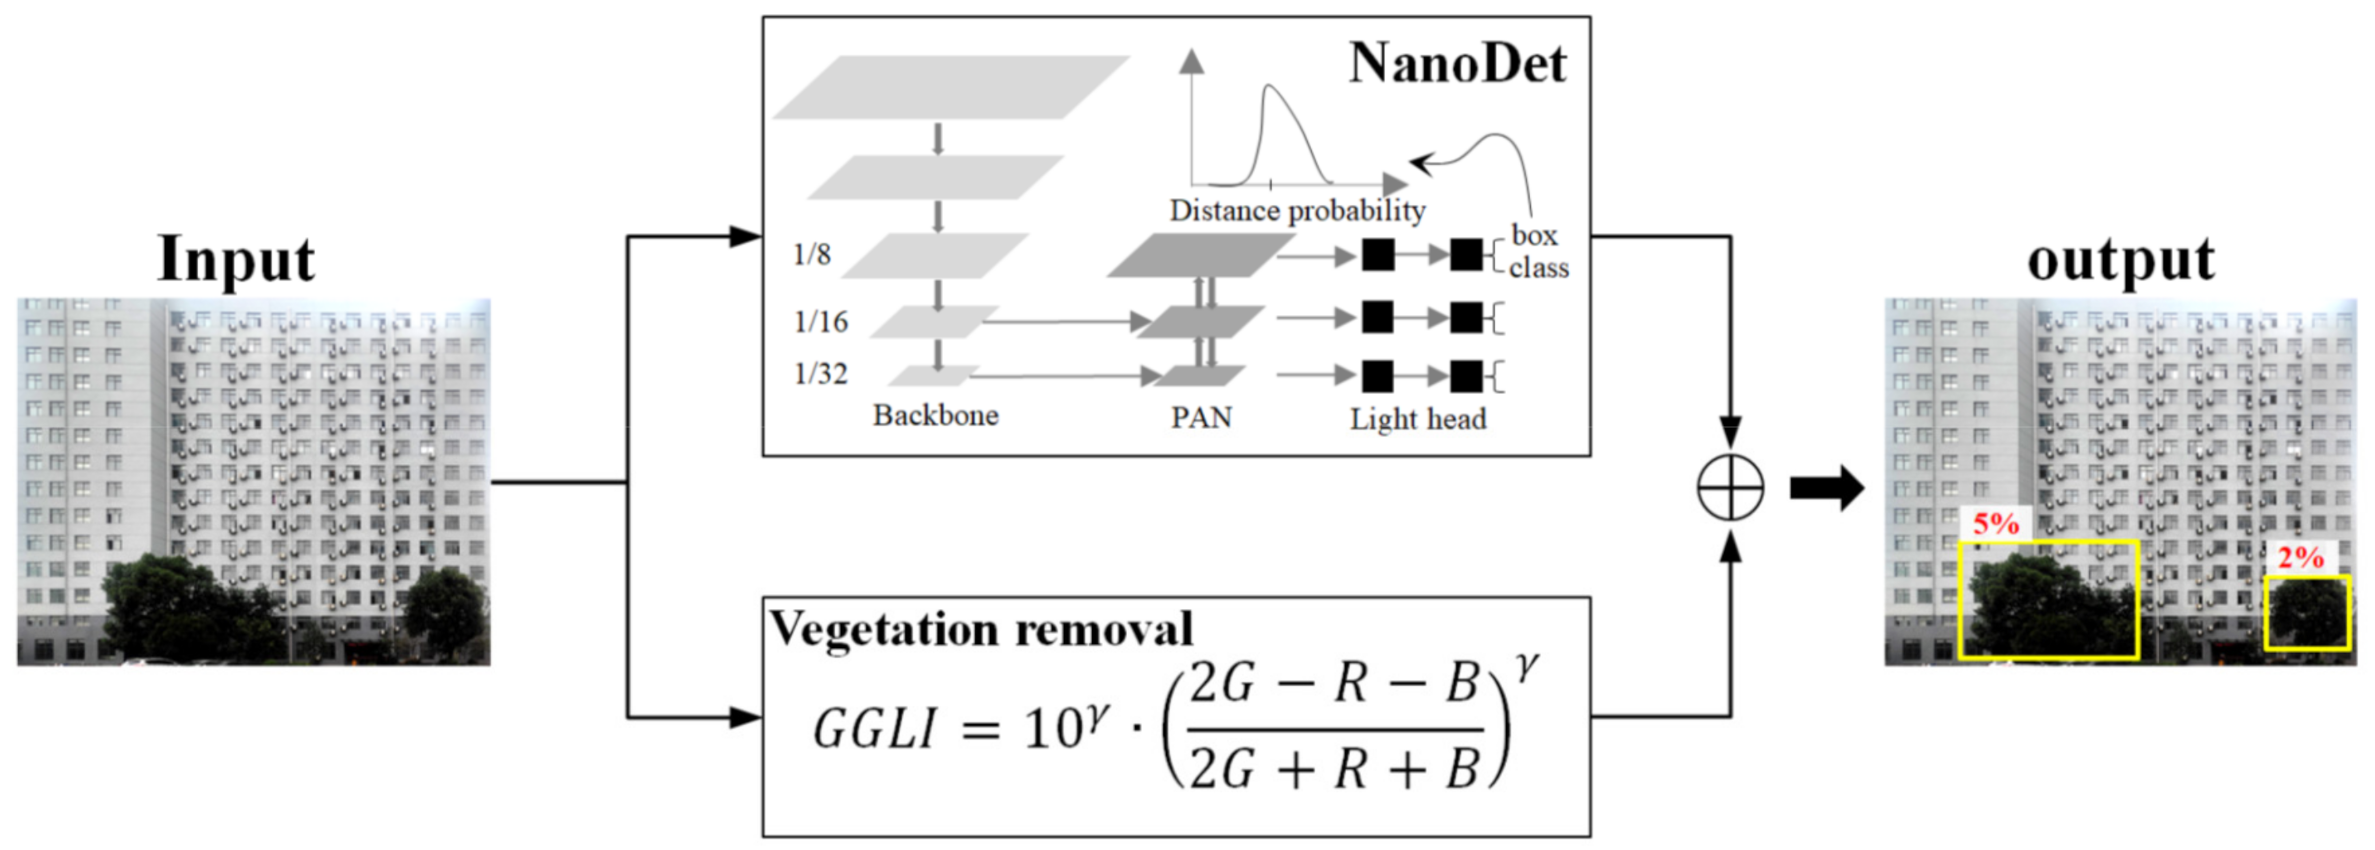
2.3. Object-Occlusion Detection Based on Deep Learning

Although a large number of public images enables the CityGML building model to perform texture mapping from terrestrial images without extra data acquisition, some problems cannot be ignored, such as texture redundancy and object occlusion. Unfortunately, because public images are acquired from different viewpoints, times, conditions, and cameras, complex nonlinear transformation, such as uneven illumination, deformation, and object mixture often exist. Then, automatically detecting object occlusion and selecting high-quality texture using the conventional feature-based methods is difficult [24,25,26].
Compared with these methods based on manually-designed features, deep learning can perform better in image classification, pattern recognition, image processing, and other fields [27,28,29]. Inspired by the progresses and outstanding nonlinear feature extraction achieved in deep learning in recent years, convolutional neural networks can not only extract multiscale and nonlinear features from images but are also insensitive to image translation, scale, viewpoint, and deformation [30,31]. Therefore, we utilized a deep convolutional neural network to detect object occlusion and gather high-quality terrestrial images for texture mapping.
In recent years, many convolutional neural networks, e.g., VGG [32] and GoogleNet [33], have been proposed and perform well for some applications, such as object recognition and classification [34,35]. However, these networks are very deep and large-scale, with tens of millions of parameters. Thus, deep neural networks, such as VGG and GoogleNet, cannot satisfy the requirement of fast object recognition involved in CityGML building-texture mapping. Recently, a project named NanoDet [22] appeared on GitHub; it is an open-sourced and real-time anchor-free detection model, which can provide good performance—as much as that of the YOLO network [36,37,38]; it is also easy for training and porting. NanoDet is a detection model considering accuracy, efficiency, and model scale; it is achieved by combining some tricks that refer to deep learning literature to obtain a detection model considering accuracy, efficiency, and model scale. Generalized focal loss and box regression are used in NanoDet to reduce a large number of convolutional operations and significantly improve efficiency. Although NanoDet is a lightweight model, its performance is similar to that of the state-of-the-art networks [22]. Therefore, to avoid complex training from scratch, we explore a transfer-learning strategy based on NanoDet to evaluate object occlusion and determine high-quality public images for texture mapping, considering the performance and efficiency of the deep neural network. In addition, typical objects, such as pedestrians and vehicles, can be easily detected. Other types of object occlusion (e.g., trees) are not easily inferred by most convolutional neural networks, such as DanoDet, because of uncertainty and irregular distribution. Furthermore, as illustrated in Figure 4, we introduce a gamma-transform green leaf index, named GGLI [39], to detect tree occlusion. Then, an approach combining DanoDet and GGLI is proposed to evaluate object occlusion, and the area of object occlusion can be calculated. Subsequently, low-quality public images with high occlusion ratios can be excluded without being performed for texture mapping.

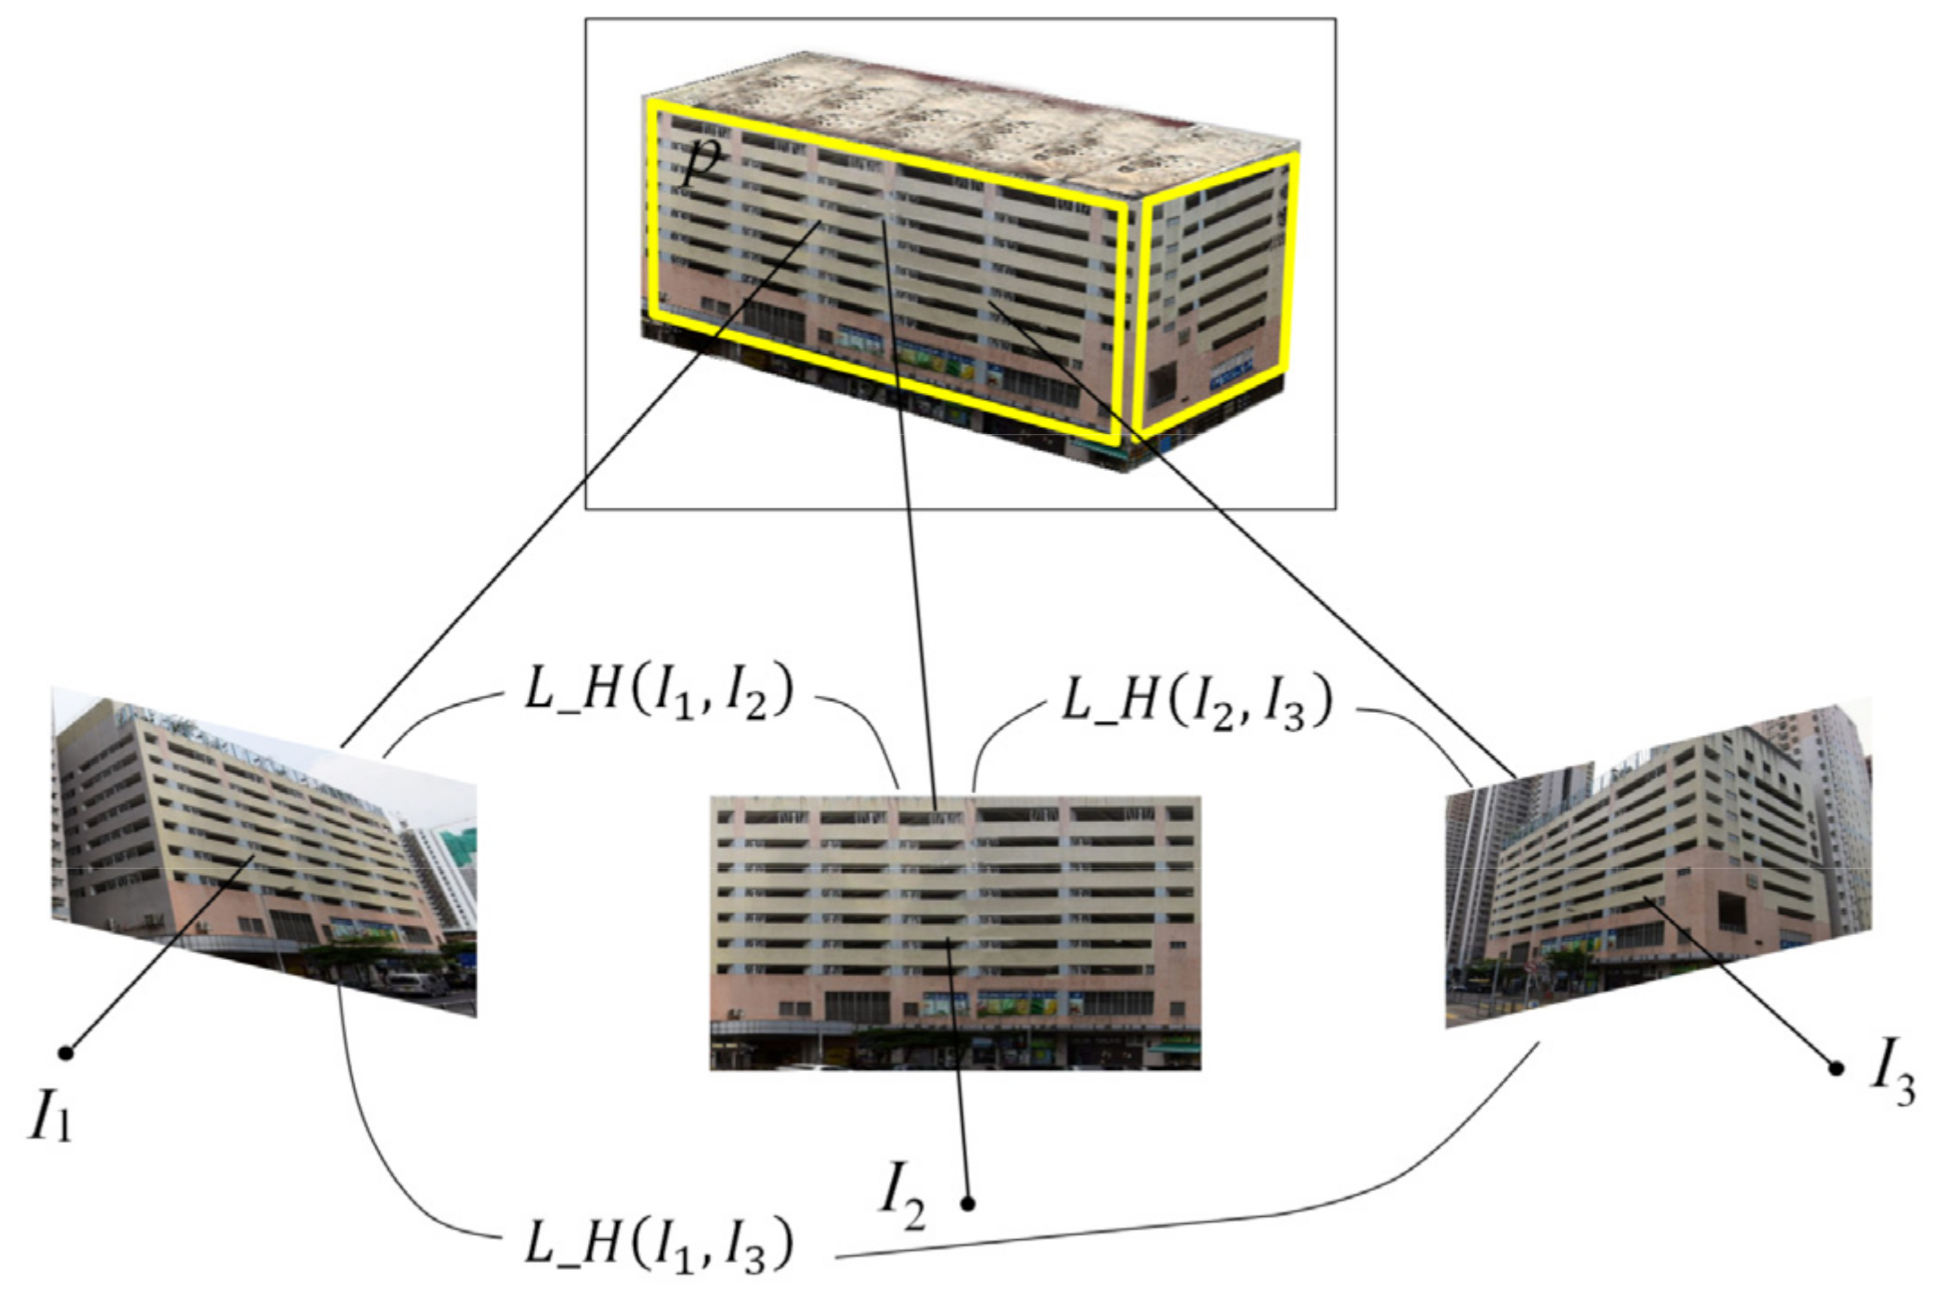
2.4. Multiview Coplanar Extraction

The actual textured 3D building model derived from photogrammetric technologies (including oblique photogrammetry and laser scanning) can finely characterize the geometric building structure. However, limited by the error of building-model reconstruction, especially for simplified CityGML building models, such as the LOD2 CityGML models, it cannot perform automatic texture mapping using photogrammetric technologies from the terrestrial images without the support of exterior orientation information. Unfortunately, in most cases, the camera parameters and pose of public images are unknown; thus, texture mapping from public images becomes more difficult. In general, the façades of most buildings are composed of several approximate planes. In particular, homography transformation is usually used to describe the relationship between two images of some points on the common plane and broadly used for photogrammetry and computer vision, such as image correction, image mosaic, camera-pose estimation, and visual simultaneous localization and mapping (SLAM) [40,41]. Therefore, based on these characteristics of CityGML building façades and homography transformation, we developed a multiview coplanar extraction approach from the candidate terrestrial images by homography matrix.
As opposed to the commonly used photogrammetric methods, some parameters, such as interior parameters and exterior orientation elements, are not the prerequisites for deriving spatial correspondence between public images and the CityGML building model in this study; that is, the collinear equation is not an essential condition for texture mapping. In other words, compared with the commonly used photogrammetric methods, the proposed multiview coplanar extraction based on homography matrix is more available and is an alternative method for texture mapping of CityGML building models. A single homography matrix, i.e., global homography matrix, cannot be simply applied to define the transformation of two views for extraction of textures of multiple building façades because a public image may cover multiple planes of a building. Therefore, we exploit multiple local homography matrices, named L_H, to model the multiple façades of a building, as shown in Figure 5. The mathematical formula can be expressed as follows:
L _ H I 1 , I 2 , , I n   =   H p | p I 1 , I 2 , , I n ,
H p = h 00 h 01 h 02 h 10 h 11 h 12 h 20 h 21 1 ,
where I 1 , I 2 , , I n are the candidate public images, 1 ~ n , for texture mapping; H p denotes a homography matrix of a local plane in I 1 , I 2 , , I n ; and h 00 ~ h 21 are the matrix elements of H p . Therefore, L _ H may involve more than one homography matrix.
Generally, the homography matrix of two views can be obtained by image matching. Based on previous studies [42], feature extraction and matching are performed using a sub-Harris operator coupled with the scale-invariant feature-transform algorithm, which can find evenly distributed corresponding points to compute the homography matrix. In homogeneous coordinates, the homography transformation between a point, X x i , y i , 1 , of a public image, I , and the corresponding point, X x i , y i , 1 , of the matched image, I , can be described by a mathematical formula, X = H p X , which is also the perspective transformation. The homography matrix, H p , has 8 degrees of freedom; thus, at least four matching pairs are required to solve this matrix. Then, the homography transformation, in terms of matches, can be expressed as follows:
x i y i 1 L _ H p I , I x i y i 1 , x i , y i   F I , x i , y i   F I ,
where F I   and   F I denote the set of features in images I and I , respectively.
For the case of n matches in a plane, p , of images I and I , using the least-squares method, Equation (4) can be expressed using an alternative formula, A f = 0 . Then, the coefficients, h 00 h 21 , are calculated by a nonlinear optimization of min | | A f | | 2 . Here, A and f are expressed as follows:
A = x 1 , y 1 , 1 , 0 , 0 , 0 , x 1 x 1 , y 1 x 1 , x 1 0 , 0 , 0 , x 1 , y 1 , 1 , x 1 y 1 , y 1 y 1 , y 1 x n , y n , 1 , 0 , 0 , 0 , x n x n , y n x n , x n 0 , 0 , 0 , x n , y n , 1 , x n y n , y n y n , y n ,
f = h 00 , h 01 , h 02 , h 10 , h 11 , h 12 , h 20 , h 21 , 1 T .
Note that only one global homography matrix can be obtained based on the previous studies; therefore, we propose a strategy to define multiple planes that may exist in two paired views by extracting coplanar features. Although the mathematical transformation of each plane in a terrestrial image can be derived by L_H, the sub-Harris corners are insufficient to form the geometric shape of the façades of a building. Extracting the textures on each plane is still a problem because so far, no accurate boundary of the polygon on building façades is delineated. Generally, a large number of line features is distributed on the building façades. In addition, due to the advantages of easy extraction and strong anti-noise ability, line features are extracted to obtain abundant geometric description of the façades, and the corresponding points on the lines between two paired views are determined by the calculated L_H. To further determine the coplanar features on the same building, based on the similarity of geometry and texture on the same façade, we use the feature descriptors, namely RGB-SIFT descriptors [43], to exclude features not on the same façade or outliers by clustering.

2.5. Texture-Plane Quadrilateral Definition Based on Geometric Topology

The geometric boundary of a façade is assumed to be consistent with the quadrilateral, which is warped due to perspective transformation. On the basis of the spatial distribution of the coplanar features, we subsequently perform texture-plane extraction based on geometric topology. Specifically, as shown in Figure 6, the two farthest points, X a , X b , are initially determined as the two initial diagonal corners of the quadrilateral façade from the coplanar point set S X . Then, the line equation, l ab , between points X a and X b can be expressed as follows:
α x + β y + δ = 0 ,
where the coefficients, α , β , δ , can be calculated by the coordinates of points X a , X b ; x , y is the coordinate of a coplanar point. The two other corners, X c , X d , of the façade can be defined based on the condition, i.e., Equation (8), that the farthest vertical distance from the point set, S X , on both sides of line l ab .
d X c l ab = max d | x , y S X     α x + β y + δ > 0 d X d l ab = max d | x , y S X     α x + β y + δ < 0 ,
where d is the distance between a coplanar point x , y and line l ab , and the calculation formula is as follows.
d = α x + β y + δ / α 2 + β 2 .
Although the initial boundary of a façade can be defined based on the four anchor points, i.e., X a , X b , X c , X d , a clear error is found on the boundary because the contribution of coplanar points on the edge of the façade is not considered. Then, we use Hough-transform and iterative least-squares methods together to optimize the initial boundary obtained by the four anchor points. This optimization consists of the following steps:
(1)
Along the straight lines, l ab ,   l ad ,   l bc , and l bd , point sets S l ab X ,   S l ad X ,   S l bc X , and   S l bd X with the closest vertical distance to the corresponding straight lines are found.
(2)
Hough-transform algorithm is conducted to derive the mathematical formulas (i.e., y = k x + ϵ , where k , ϵ denote slope and intercept of lines l ab ,   l ad ,   l bc , and   l bd from S l ab X ,   S l ad X ,   S l bc X , and   S l bd X , respectively.
(3)
Iterative weighted least-squares method [44] is explored to optimize each mathematical formula of lines l ab ,   l ad ,   l bc , and   l bd , and the error correction, x ^ , is expressed as follows:
x ^ = A T P A 1 A T P L ,
P = d i a g P 1 , P 2 , , P n ,
where x ^ = δ k δ ϵ ; A = x 1 1 x n 1 ;   B = y 1 y n ; n is the number of points in S l ab X ,   S l ad X ,   S l bc X , and   S l bd X ; P is the diagonal weight matrix; and P i 1 / d , which is updated after each line-formula optimization.

2.6. Sub-Image Mosaic for Object-Occlusion Filling

This study aims at texture mapping for low-quality textured and untextured CityGML building models and attempts to solve the problem of texture occlusion through multiview images. Although the multiview texture of a façade can be captured based on this method, object occlusion caused by pedestrians, trees, and vehicles may lead to missing partial texture in a single image. Fortunately, multiview public images obtained from different perspectives may capture textures at different angles. Thus, the missing local texture of a façade may be filled by the unobstructed area; that is, the unobstructed sub-images obtained from multiview textures can be mosaicked to solve missing texture in the masked area introduced in Section 2.3.
The details of the Algorithm 1 for texture extraction are shown in the following section.
Algorithm 1: Texture extraction based on sub-image mosaic
Input: S I is the set of candidate terrestrial images for one façade, n u m is the size of S I , x , y is the coplanar point, and S T is the texture set.
Parameters: Gamma-transform green leaf index, G G L I , multiple local homography matrices, L _ H . k , ϵ are the coefficients of a line.
Output: Texture, T , of the façade
1: for  i = 1 to n u m  do
2:      Perform object detection using NanoDet
3:      Compute G G L I
4:      Remove area R o i of object occlusion
5: end for
6: for  i = 1 to n u m 1  do
7:      for  j = i + 1 to n u m  do
8:         Perform feature extraction and matching based on sub-Harris operator
9:         Compute L _ H
10:        Define initial quadrilateral q     X a , X b , X c , X d
11:        Compute k , ϵ based on Hough transform
12:        Compute x ^ δ k δ ϵ based on least square method
13:        Update k , ϵ     x ^
14:        Refine l ab , l ad , l bc , l bd and q
15:        Repeat steps from 12 to 14 until error convergence or the maximum iteration number is reached
16:        Add q into S T
17:     end for
18: end for
19: Merge S T into T

3. Experiment Results and Analysis

A set of CityGML building models is used to perform the experiments. The datasets mainly include two categories, as follows: (1) the untextured building models downloaded from the commercial map providers, such as Baidu, and (2) the textured building models derived from the photogrammetric method. Initially, three building models are selected to evaluate the method quantitatively and qualitatively. To further evaluate the performance of texture update, five textured building models are selected to evaluate the proposed approach by replacing low-quality texture. In addition, the public images are collected to capture texture from street-view images managed by the commercial map providers. Only relatively regular and simplified building models, such as LOD2 CityGML building models, are selected to evaluate the proposed approach because this study mainly focuses on the texture mapping of nondetailed building models.

3.1. Data Description

To validate the effect of the proposed texture-mapping method, the three typical untextured building models and the corresponding multiview texture images, including UAV remotely sensed and terrestrial images, as shown in the subfigures of the first and second columns in Figure 7, are selected. These building models are characterized by simplified geometric structure, different styles, different heights, and different façades. The candidate texture images with multiple perspectives include object occlusion, such as pedestrians, trees, vehicles, and other nonbuilding objects.
In addition, the three textured building models derived by photogrammetric mapping and the corresponding multiview texture images, as shown in the subfigures of the first and second columns in Figure 8, are selected. Different from the untextured building models in Figure 7, the textured building models are characterized by detailed geometric structure. In the experiments, texture mapping of these textured building models has low-quality, which is probably caused by photogrammetric error, noneliminated object occlusion, or imaging quality. These models are specially selected to validate the performance of the proposed approach for improving texture quality.

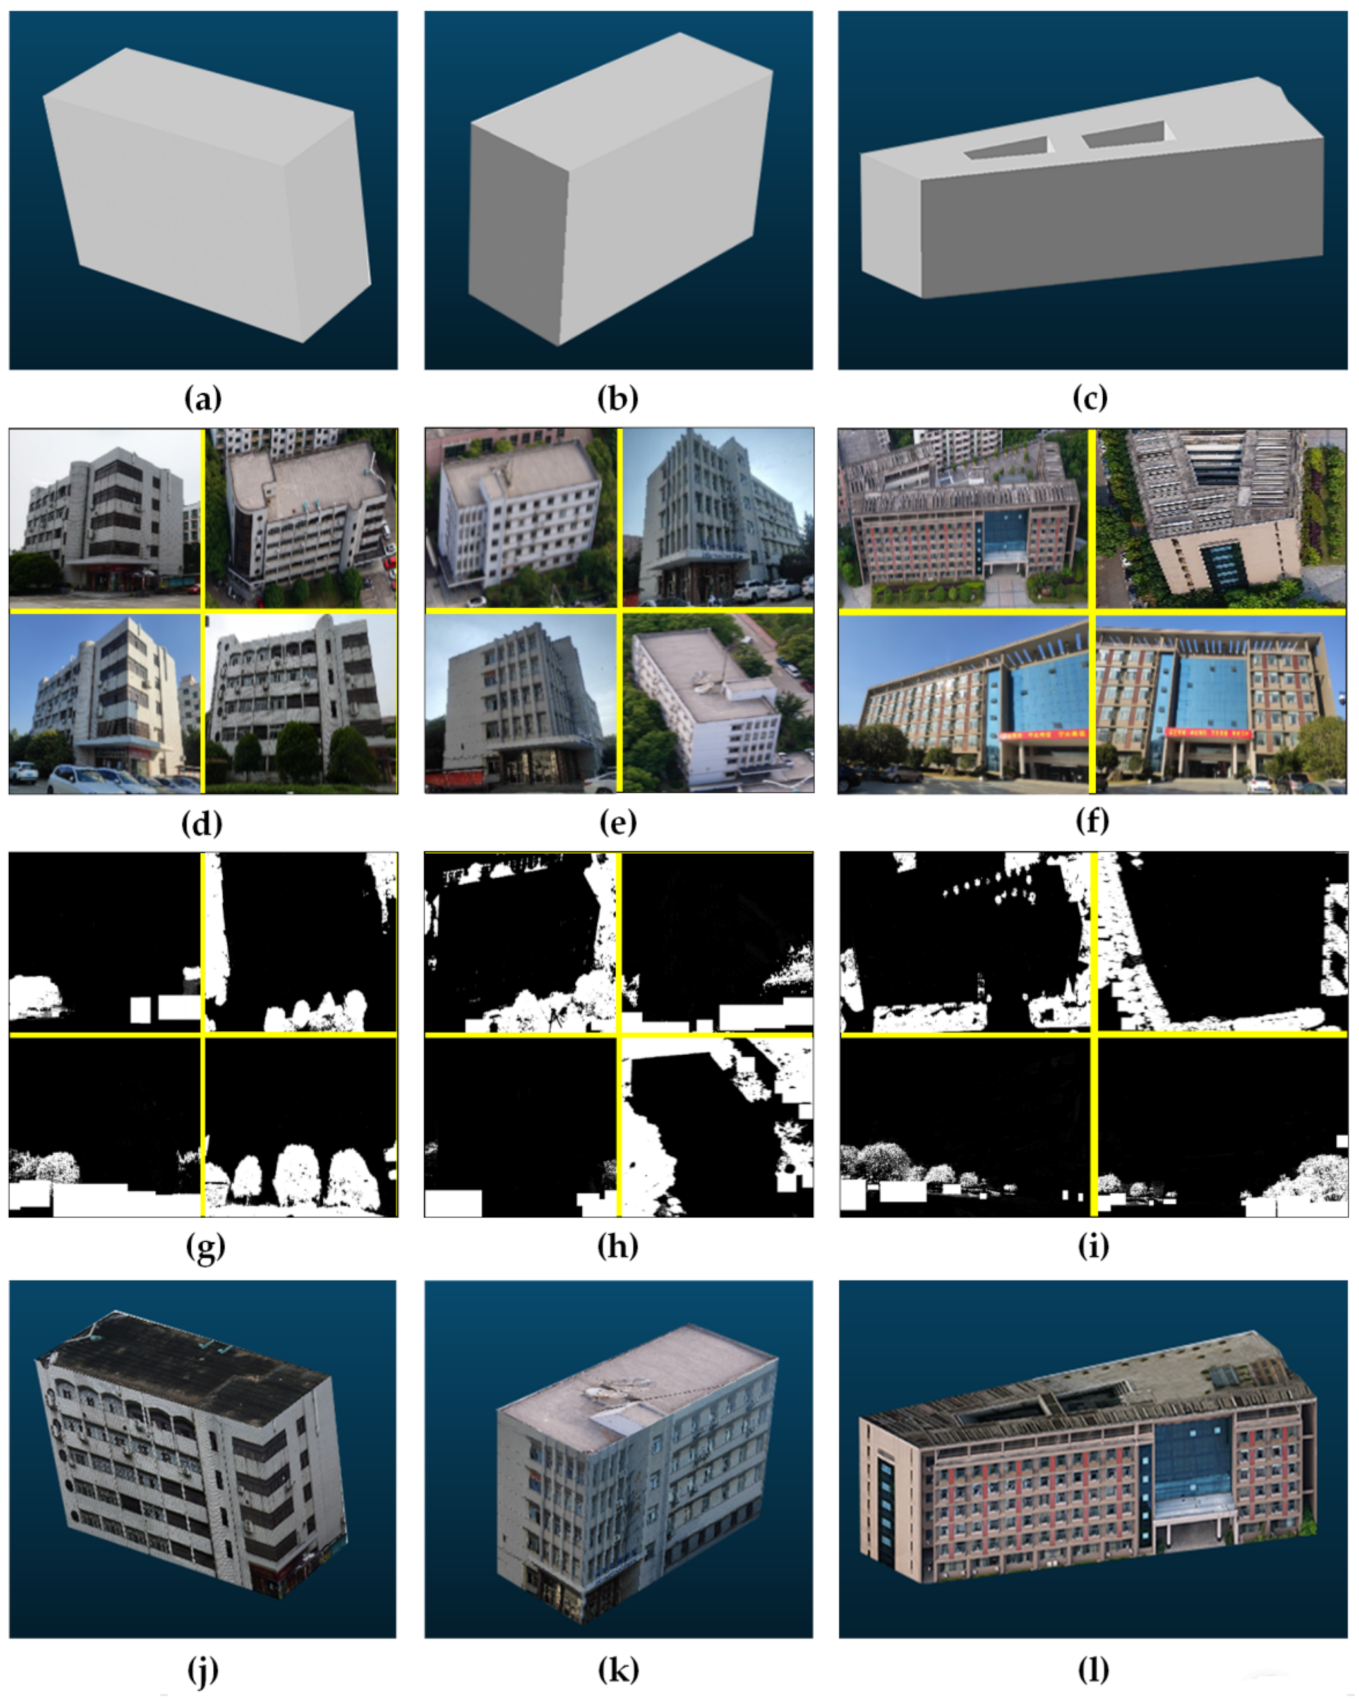
3.2. Qualitative Performance Evaluation

In the experiments, as shown in Figure 7 and Figure 8, object occlusions, such as pedestrians, vehicles, trees, and other objects, can be effectively removed by jointly using NanoDet and GGLI. The façades of the simplified building models, such as LOD CityGML building models, e.g., Figure 7a–c, can be textured by the multiview coplanar extraction from multiple public images (e.g., Figure 7d,e,f) obtained from different viewpoints. The texture on the top façade is captured from UAV orthophoto based on the previous studies [39]. The façades surrounding these buildings can be textured from public images in which the texture hidden by object occlusion (e.g., Figure 7g–i) can be uncovered, given that the textures may appear in multiview images because of the different depths of objects and buildings. Therefore, object occlusion can be effectively removed by merging multiple texture planes, which are then defined based on quadrilateral geometric topology to delineate the boundary of textures for mapping, as illustrated in Figure 7j–l.
Although actual textured 3D building models are derived by UAV mapping, such as oblique photogrammetry in some places, as shown in Figure 8a–e, low-quality textures characterized by low-resolution and warped surfaces are inevitably mapped to the building façades because of object occlusion, low precise building geometric models, and missing texture information. Generally, low-quality building models should be improved and updated by manual processing and mapping operations, which is a tedious and time-consuming task. Fortunately, the LOD CityGML building models corresponding to these actual textured 3D building models are provided by the commercial map providers, such as Baidu. Then, a simplified LOD CityGML building model can be considered an alternative for the low-quality textured 3D building, as shown in Figure 8f–g. Similar to Figure 7, object-occlusion removal shown in Figure 8p–t and multiview coplanar extraction from public images (e.g., Figure 8k–o) are conducted for texture mapping. On the contrary, although the alternative building models, such as the simplified LOD CityGML building models, cannot provide the detailed geometric structure of buildings, they significantly improve the geometric shape and texture-mapping quality of building façades. For examples, in Figure 8a,c, the warped façades are replaced by regular planes, and the texture quality of the building is also optimized by terrestrial images with higher resolution and more abundant detail.
Compared with the visualization of the textured building models, the proposed approach is suitable for performing texture mapping on regular building models, such as LOD CityGML building models. In addition, in some cases, the low-quality geometric structure of building façades can be optimized by regular planes. Not all façades of building models perform texture mapping when relevant terrestrial images, such as B3–B6, are limited.

3.3. Performance Evaluation of Object-Occlusion Detection

One advantage of the proposed approach is that it has outstanding performance in object-occlusion detection. To evaluate the performance of combining NanoDet and GGLI to detect object occlusion, state-of-the-art deep neural networks, including R-CNN [45], Faster-R-CNN [46], YOLO [37], and NanoDet [35], are selected for comparison and analysis. A metric, namely overall accuracy ( O A ), is used to quantitatively assess performance, and O A is computed as follows:
O A = T P + T N / T P + F N + T N + F P ,
where T P , F N , T N , and F P are defined as accurately detected object-occluded regions, inaccurately detected non-object-occluded regions, accurately detected non-object-occluded regions, and inaccurately detected object-occluded regions, respectively. The texture images, namely Datasets 1–8, corresponding to the building models in Figure 7 and Figure 8 are collected to compare the performance of object occlusion with the state-of-the-art networks. Table 1 presents the comparative results of O A values using R-CNN, Faster-R-CNN, YOLO, NanoDet, and our method (i.e., the combination of NanoDet and GGLI). The combination of NanoDet and GGLI achieves a better performance than the five other deep learning networks in terms of O A values. Compared with the four other methods, our method significantly improves the accuracy of object-occlusion detection by vegetation removal based on previous studies, such as GGLI. However, the other deep learning networks do not have the ability to detect vegetation, such as trees. As shown in Figure 8k,o corresponding to Datasets 4 and 8, the tree occlusion is less than in other datasets. Thus, the accuracy of object-occlusion detection, represented by O A values, is close to our proposed method.

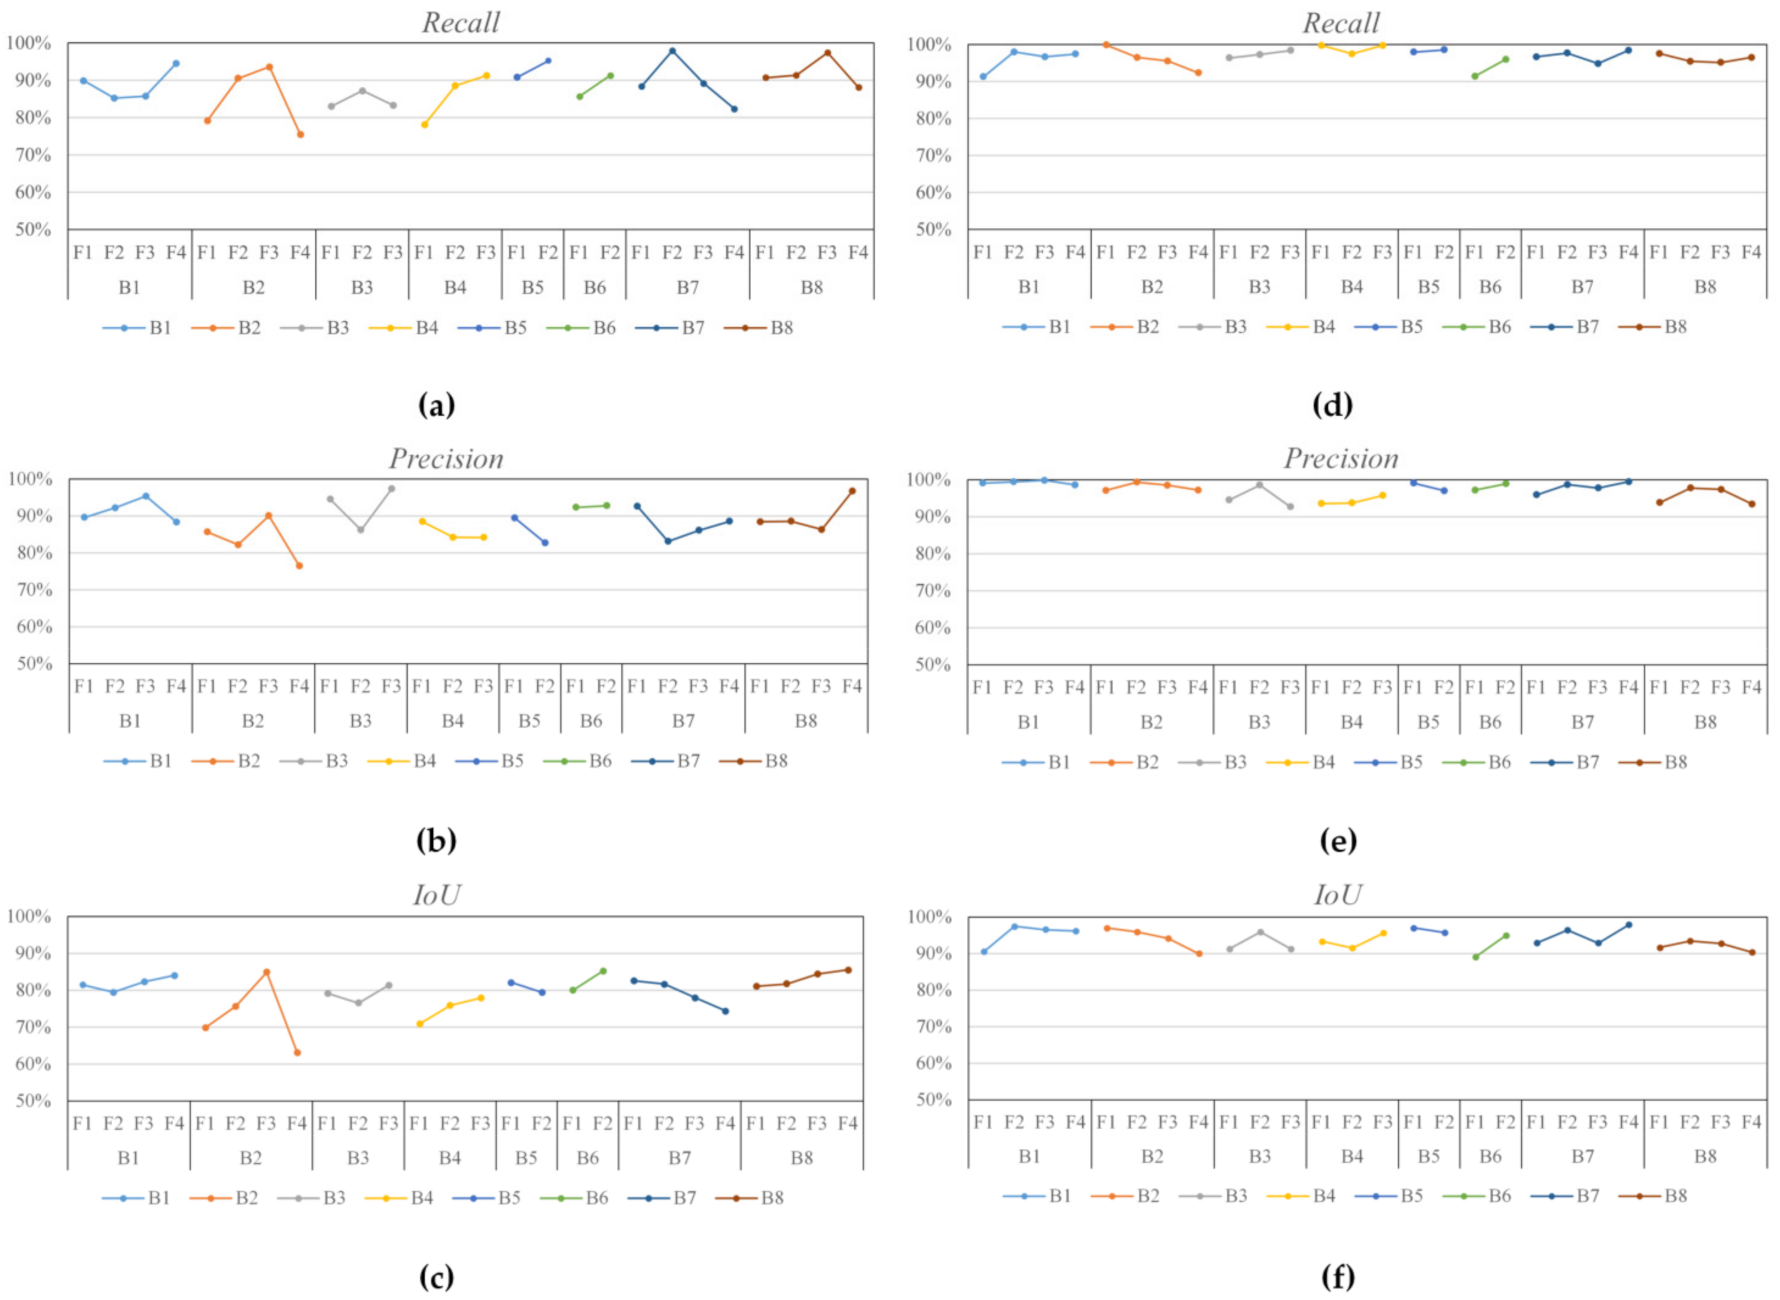
3.4. Performance Evaluation of Multiview Coplanar Extraction

The results of multiview coplanar extraction using the proposed approach are evaluated by the quantitative metrics, i.e., recall, precision, and intersection over union (IoU), which can be computed as [47]
Recall =   G T q / G T ,
Precision =   G T q / q ,
IoU   = G T q / G T q ,
where G T and q are the ground truth delineated by manual operation and the quadrilateral region extracted by multiview coplanar extraction, respectively.
Point-feature-based matching is a popular method used to compute the geometric transformation between images. However, building facades often have weak textures. Thus, point features may be insufficient to reconstruct the boundary of the texture quadrilateral region. Line features are extracted to obtain coplanar features to evaluate the performance of combining point and line features to detect the boundary of the texture quadrilateral region. We compare the results obtained by point-based and point-line-based methods. Figure 9 depicts the comparative results of Recall , Precision , and IoU values calculated from the public images, corresponding to the eight building models, including three untextured and five textured models. The point-line-based method for quadrilateral-region detection achieves a better performance than the point-based method in terms of the Recall , Precision , and IoU values; that is, the texture boundaries obtained from the point-line-based method are closer to the ground-truth texture regions. The point-line-based method is suitable for achieving this goal due to the following reason: linear objects, such as building edges and window edges, are abundant and easy to extract from building façades and can be used to support boundary detection.

3.5. Quality Evaluation of Updated Texture

Visual comparison of Figure 8a–e,u–y shows that some geometric details and textures on the façades of building models are seriously blurred and distorted in Figure 8a–e. They are optimized and substituted using patches obtained from the high-resolution terrestrial images by the proposed approach in Figure 8u–y. In addition, to further evaluate the superiority of the proposed approach, a metric, namely a Tenengrad function based on gradient without reference image [48], is used to quantitatively compare the texture quality before and after optimization. The Tenengrad value, T e n , of an image, I , is computed as follows:
T e n = y x G x , y G x , y   > T ,
G x , y   = G x 2 x , y   +   G y 2 x , y ,
in which G x , y is the gradient of a pixel I x , y , and G x x , y and G y x , y are gradients in the horizontal and vertical directions, respectively. T is a given threshold. The comparative results of five building models in Figure 8a–e are shown in Figure 10, which indicates that the texture after optimization has higher quality and clearer details than that prior to optimization in terms of T e n values, and it can also significantly eliminate blurred and distorted textures.

4. Discussion

On the basis of experimental results of texture mapping, the proposed approach can be considered an alternative for performing texture mapping for regular building models, such as simplified LOD CityGML building models. In particular, as opposed to the commonly used photogrammetric method for texture mapping, reconstructing high-quality textures for the façades of building models using exterior orientation information is not imperative. The effectiveness of the proposed texture-mapping approach can be explained by a number of reasons. First, high-resolution terrestrial images gathered based on spatial relevancy derived from spatial location and attributes, such as GPS position and image annotation, can provide multidata for texture mapping. As shown in Figure 7d–f and Figure 8k–o, the higher-resolution terrestrial images compared with aerial photography can be used to reconstruct the textures for the façades of building models. Second, as illustrated in Figure 7g–i and Figure 8k–t, the abundant terrestrial images offer the opportunity to collect higher-quality textures by effectively filtering out object occlusions, such as pedestrians, vehicles, and trees by deep learning and vegetation removal. Third, multiview coplanar extraction based on multiple local homography matrices enables texture mapping for simplified or regular building models, such as LOD CityGML building models, in multiple 2D spaces without the support of interior parameters and exterior orientation elements. It even allows nonprofessional practitioners to perform texture mapping with high-resolution terrestrial images. Finally, the point-line-based method for quadrilateral-region detection is available to capture the optimal building façade boundaries of patches for texture mapping.
The essence of texture mapping is the two-dimensional parameterization of 3D building models; that is, a one-to-one correspondence between 2D texture space and 3D building façades should be established. In this study, multiview coplanar extraction is definitely proposed to establish this correspondence. However, this study concentrates on texture mapping for simplified or regular building models, such as LOD2 CityGML building models, which are popular in street view maps (e.g., Google, Baidu). Therefore, it may not be suitable to perform texture mapping for some complex buildings with abundant building details or complex geometric structure.

5. Conclusions

We present a framework to effectively perform texture mapping for LOD CityGML building models by extracting high-quality textures from terrestrial images. First, terrestrial images corresponding to the target building are collected from public images based on spatial relevancy. Second, integration of deep learning and GGLI is used to filter out object occlusions (e.g., pedestrians, vehicles, and trees) and obtain non-occluded building candidate texture distributions. Third, point-line-based coplanar features are extracted to characterize multiple planes in 2D space under the constraint of multiple local homography matrices, and the initial boundaries of the building models are obtained from four anchor points. Fourth, geometric topology is conducted to optimize the initial boundaries of texture patches based on a strategy combining Hough-transform and iterative least-squares methods. Finally, abundant candidate texture patches are mosaicked to obtain high-quality object-occlusion filling. The statistical and visualization results indicate that the proposed methods can effectively perform texture mapping of CityGML building models. The framework also shows higher-quality textures for all experimental building models, including untextured and textured models, according to quantitative and qualitative comparisons and analyses. The results prove the high capability of the proposed approach in texture mapping for CityGML building models from 2D terrestrial images.
The proposed texture-mapping approach relies greatly on the regular geometric shape of building models, in which the façades are composed of multiple rectangles. At present, the proposed approach focuses on texture mapping of simplified or regular building models, such as LOD2 CityGML building models. It does not optimize the geometric structure of the façades of building models. However, it cannot satisfy the requirement of texture mapping for some building models with high levels of detail, such as LOD3 CityGML building models.
In future studies, we will attempt to improve the proposed approach by optimizing the geometric structure on the façades of building models using multiscale and multiview coplanar extraction and improve the performance of texture mapping for complex building models, such as LOD3 CityGML building models.

Author Contributions

Conceptualization, H.H. and J.Y.; methodology, H.H. and P.C.; software, Y.W. and Y.Z.; validation, J.Y., T.L. and G.D.; formal analysis, P.C.; investigation, H.H. and Y.Z.; resources, Y.W.; data curation, T.L. and G.D.; writing—original draft preparation, H.H.; writing—review and editing, J.Y.; visualization, H.H.; supervision, P.C.; project administration, Y.W.; funding acquisition, H.H. All authors have read and agreed to the published version of the manuscript.

Funding

This research was funded by the “National Natural Science Foundation of China, grant number 41861062 and 41401526”, “Fuzhou Youth Science and Technology Leading Talent Program, grant number 2020ED65”, “Jiangxi University Teaching Reform Research Project, grant number JXJG-18-6-11”, “Science and Technology Project of Jiangxi Provincial Department of Water Resources, grant number 202123TGKT12”, and “Jiangxi 03 Special Project and 5G Project, grant number 20204ABC03A04”.

Data Availability Statement

Data available on request.

Acknowledgments

The authors thank Mengyun Ling for providing datasets.

Conflicts of Interest

The authors declare no conflict of interest.

References

  1. Shan, J.; Li, Z.X.; Zhang, W.Y. Recent progress in large-scale 3D city modeling. Acta Geod. Cartogr. Sin. 2019, 48, 1523–1541. [Google Scholar]
  2. Gröger, G.; Kolbe, T.H.; Nagel, C.; Häfele, K.H. OGC City Geography Markup Language (CityGML) Encoding Standard; Open Geospatial Consortium: Rockville, MD, USA, 2012. [Google Scholar]
  3. Kolbe, T.H. Representing and Exchanging 3D City Models with CityGML. In 3D Geo-Information Sciences; Springer: New York, NY, USA, 2009. [Google Scholar]
  4. Kutzner, T.; Chaturvedi, K.; Kolbe, T.H. CityGML 3.0: New Functions Open Up New Applications. PFG—J. Photogramm. Remote Sens. Geoinf. Sci. 2020, 88, 43–61. [Google Scholar] [CrossRef] [Green Version]
  5. Eriksson, H.; Harrie, L. Versioning of 3D City Models for Municipality Applications: Needs, Obstacles and Recommendations. ISPRS Int. J. Geo-Inf. 2021, 10, 55. [Google Scholar] [CrossRef]
  6. Pepe, M.; Costantino, D.; Alfio, V.S.; Vozza, G.; Cartellino, E. A Novel Method Based on Deep Learning, GIS and Geomatics Software for Building a 3D City Model from VHR Satellite Stereo Imagery. ISPRS Int. J. Geo-Inf. 2021, 10, 697. [Google Scholar] [CrossRef]
  7. Hensel, S.; Goebbels, S.; Kada, M. Facade reconstruction for textured Lod2 Citygml models based on deep learning and mixed integer linear programming. ISPRS Ann. Photogramm. Remote Sens. Spat. Inf. Sci. 2019, IV-2/W5, 37–44. [Google Scholar] [CrossRef] [Green Version]
  8. Li, D. 3D visualization of geospatial information: Graphics based or imagery based. Acta Geod. Cartogr. Sin. 2010, 39, 111–114. [Google Scholar]
  9. Yalcin, G.; Selcuk, O. 3D City Modelling with Oblique Photogrammetry Method. Procedia Technol. 2015, 19, 424–431. [Google Scholar] [CrossRef] [Green Version]
  10. Abayowa, B.O.; Yilmaz, A.; Hardie, R.C. Automatic registration of optical aerial imagery to a LiDAR point cloud for generation of city models. SPRS J. Photogramm. Remote Sens. 2015, 106, 68–81. [Google Scholar] [CrossRef]
  11. Heo, J.; Jeong, S.; Park, H.K.; Jung, J.; Han, S.; Hong, S.; Sohn, H.-G. Productive high-complexity 3D city modeling with point clouds collected from terrestrial LiDAR. Comput. Environ. Urban. Syst. 2013, 41, 26–38. [Google Scholar] [CrossRef]
  12. Wang, Q.D.; Ai, H.B.; Zhang, L. Rapid city modeling based on oblique photography and 3ds Max technique. Sci. Surv. Mapp. 2014, 39, 74–78. [Google Scholar] [CrossRef]
  13. Zhang, C.S.; Zhang, W.L.; Guo, B.X.; Liu, J.C.; Li, M. Rapidly 3D Texture Reconstruction Based on Oblique Photography. Acta Geod. Cartogr. Sin. 2015, 44, 782–790. [Google Scholar]
  14. Lari, Z.; El-Sheimy, N.; Habib, A. A new approach for realistic 3D reconstruction of planar surfaces from laser scanning data and imagery collected onboard modern low-cost aerial mapping systems. Remote Sens. 2017, 9, 212. [Google Scholar] [CrossRef] [Green Version]
  15. Khairnar, S. An Approach of Automatic Reconstruction of Building Models for Virtual Cities from Open Resources. Master’s Thesis, University of Windsor, Windsor, ON, Canada, 2019. [Google Scholar]
  16. Girindran, R.; Boyd, D.S.; Rosser, J.; Vijayan, D.; Long, G.; Robinson, D. On the Reliable Generation of 3D City Models from Open Data. Urban Sci. 2020, 4, 47. [Google Scholar] [CrossRef]
  17. Gong, J.Y.; Cui, T.T.; Shan, J.; Ji, S.P.; Huang, Y.C. A Survey on Façade Modeling Using LiDAR Point Clouds and Image Sequences Collected by Mobile Mapping Systems. Geomat. Inf. Sci. Wuhan Univ. 2015, 40, 1137–1143. [Google Scholar]
  18. Li, M.; Zhang, W.L.; Fan, D.Y. Automatic Texture Optimization for 3D Urban Reconstruction. Acta Geod. Cartogr. Sin. 2017, 46, 338–345. [Google Scholar]
  19. Deng, Y.; Cheng, J.C.; Anumba, C. Mapping between BIM and 3D GIS in different levels of detail using schema mediation and instance comparison. Autom. Constr. 2016, 67, 1–21. [Google Scholar] [CrossRef]
  20. Fan, H.; Meng, L. A three-step approach of simplifying 3D buildings modeled by CityGML. Int. J. Geogr. Inf. Sci. 2012, 26, 1091–1107. [Google Scholar] [CrossRef]
  21. Kang, T.W.; Hong, C.H. IFC-CityGML LOD mapping automation using multiprocessing-based screen-buffer scanning including mapping rule. KSCE J. Civ. Eng. 2017, 22, 373–383. [Google Scholar] [CrossRef]
  22. NanoDet. Super Fast and Light Weight Anchor-Free Object Detection Model: Real-Time on Mobile Devices. Available online: https://github.com/RangiLyu/nanodet (accessed on 14 November 2021).
  23. Bazi, Y.; Bashmal, L.; Al Rahhal, M.M.; Al Dayil, R.; Al Ajlan, N. Vision Transformers for Remote Sensing Image Classification. Remote Sens. 2021, 13, 516. [Google Scholar] [CrossRef]
  24. Wu, B.; Nevatia, R. Simultaneous Object Detection and Segmentation by Boosting Local shape Feature Based classifier. In Proceedings of the 2007 IEEE Conference on Computer Vision and Pattern Recognition—CVPR’07, Minneapolis, MN, USA, 17–22 June 2007; pp. 1–8. [Google Scholar]
  25. Wu, B.; Nevatia, R. Detection and Segmentation of Multiple, Partially Occluded Objects by Grouping, Merging, Assigning Part Detection Responses. Int. J. Comput. Vis. 2008, 82, 185–204. [Google Scholar] [CrossRef] [Green Version]
  26. Pena, M.G. A Comparative Study of Three Image Matching Algorithms: SIFT, SURF, and FAST. Master’s Thesis, Utah State University, Logan, UT, USA, 2011. [Google Scholar]
  27. Druzhkov, P.N.; Kustikova, V.D. A survey of deep learning methods and software tools for image classification and object detection. Pattern Recognit. Image Anal. 2016, 26, 9–15. [Google Scholar] [CrossRef]
  28. Pritt, M.; Chern, G. Satellite Image Classification with Deep Learning. In Proceedings of the 2017 IEEE Applied Imagery Pattern Recognition Workshop (AIPR), Washington, DC, USA, 10–12 October 2017; pp. 1–7. [Google Scholar]
  29. Wang, P.; Fan, E.; Wang, P. Comparative analysis of image classification algorithms based on traditional machine learning and deep learning. Pattern Recognit. Lett. 2021, 141, 61–67. [Google Scholar] [CrossRef]
  30. Kauderer-Abrams, E. Quantifying translation-invariance in convolutional neural networks. arXiv 2017, arXiv:1801.01450. Available online: https://arxiv.fenshishang.com/pdf/1801.01450.pdf (accessed on 14 November 2021).
  31. Rodríguez, M.; Facciolo, G.; Von Gioi, R.G.; Musé, P.; Morel, J.-M.; Delon, J. Sift-Aid: Boosting Sift with an Affine Invariant Descriptor Based on Convolutional Neural Networks. In Proceedings of the 2019 IEEE International Conference on Image Processing (ICIP), Taipei, Taiwan, 22–25 September 2019; pp. 4225–4229. [Google Scholar]
  32. Simonyan, K.; Zisserman, A. Very deep convolutional networks for large-scale image recognition. arXiv 2014, arXiv:1409.1556. Available online: https://arxiv.fenshishang.com/pdf/1409.1556.pdf(2014.pdf (accessed on 14 November 2021).
  33. Szegedy, C.; Liu, W.; Jia, Y.; Sermanet, P.; Reed, S.; Anguelov, D.; Erhan, D.; Vanhoucke, V.; Rabinovich, A. Going Deeper with Convolutions. In Proceedings of the IEEE Conference on Computer Vision and Pattern Recognition, Boston, MA, USA, 7–12 June 2015; pp. 1–9. [Google Scholar]
  34. Geirhos, R.; Janssen, D.H.J.; Schütt, H.H.; Rauber, J.; Bethge, M.; Wichmann, F.A. Comparing deep neural networks against humans: Object recognition when the signal gets weaker. arXiv 2017, arXiv:1706.06969. Available online: https://arxiv.fenshishang.com/pdf/1706.06969.pdf (accessed on 14 November 2021).
  35. Afzal, M.Z.; Kölsch, A.; Ahmed, S.; Liwicki, M. Cutting the Error by Half: Investigation of Very Deep Cnn and Advanced Training Strategies for Document Image Classification. In Proceedings of the 2017 14th IAPR International Conference on Document Analysis and Recognition (ICDAR), Kyoto, Japan, 9–15 November 2017; pp. 883–888. [Google Scholar]
  36. Redmon, J.; Farhadi, A. Yolov3: An incremental improvement. arXiv 2018, arXiv:1804.02767. Available online: https://arxiv.fenshishang.com/pdf/1804.02767.pdf (accessed on 14 November 2021).
  37. Bochkovskiy, A.; Wang, C.Y.; Liao, H.Y.M. Yolov4: Optimal speed and accuracy of object detection. arXiv 2020, arXiv:2004.10934. Available online: https://arxiv.fenshishang.com/pdf/2004.10934.pdf (accessed on 14 November 2021).
  38. Wang, C.Y.; Bochkovskiy, A.; Liao, H.Y.M. Scaled-yolov4: Scaling Cross Stage Partial Network. In Proceedings of the IEEE/CVF Conference on Computer Vision and Pattern Recognition, Nashville, TN, USA, 19–25 June 2021; pp. 13029–13038. [Google Scholar]
  39. He, H.; Zhou, J.; Chen, M.; Chen, T.; Li, D.; Cheng, P. Building Extraction from UAV Images Jointly Using 6D-SLIC and Multiscale Siamese Convolutional Networks. Remote Sens. 2019, 11, 1040. [Google Scholar] [CrossRef] [Green Version]
  40. Sun, Y.; Zhao, L.; Huang, S.; Yan, L.; Dissanayake, G. Line matching based on planar homography for stereo aerial images. ISPRS J. Photogramm. Remote Sens. 2015, 104, 1–17. [Google Scholar] [CrossRef] [Green Version]
  41. Kim, J.-I.; Kim, T. Comparison of Computer Vision and Photogrammetric Approaches for Epipolar Resampling of Image Sequence. Sensors 2016, 16, 412. [Google Scholar] [CrossRef] [Green Version]
  42. Vincent, E.; Laganiére, R. Detecting Planar Homographies in an Image Pair. In Proceedings of the 2nd International Symposium on Image and Signal Processing and Analysis (ISPA 2001) in Conjunction with 23rd International Conference on Information Technology Interfaces, Pula, Croatia, 19–21 June 2001; pp. 182–187. [Google Scholar]
  43. Ai, D.-N.; Han, X.-H.; Ruan, X.; Chen, Y.-W. Color Independent Components Based SIFT Descriptors for Object/Scene Classification. IEICE Trans. Inf. Syst. 2010, E93-D, 2577–2586. [Google Scholar] [CrossRef] [Green Version]
  44. Zhang, L.; Yang, L.; Lin, H.; Liao, M. Automatic relative radiometric normalization using iteratively weighted least square regression. Int. J. Remote Sens. 2008, 29, 459–470. [Google Scholar] [CrossRef]
  45. Girshick, R.; Donahue, J.; Darrell, T.; Malik, J. Rich Feature Hierarchies for Accurate Object Detection and Semantic Segmentation. In Proceedings of the IEEE Conference on Computer Vision and Pattern Recognition, Columbus, OH, USA, 23–28 June 2014; pp. 580–587. [Google Scholar]
  46. Ren, S.; He, K.; Girshick, R.; Sun, J. Faster r-Cnn: Towards real-time object detection with region proposal networks. In Advances in Neural Information Processing Systems; MIT Press: Cambridge, MA, USA, 2015; pp. 91–99. [Google Scholar]
  47. Bah, M.D.; Hafiane, A.; Canals, R. CRowNet: Deep network for crop row detection in UAV images. IEEE Access 2019, 8, 5189–5200. [Google Scholar] [CrossRef]
  48. Hu, S.; Li, Z.; Wang, S.; Ai, M.; Hu, Q.A. A Texture Selection Approach for Cultural Artifact 3D Reconstruction Considering Both Geometry and Radiation Quality. Remote Sens. 2020, 12, 2521. [Google Scholar] [CrossRef]
Figure 1. Objection occlusion and texture distortion in building models. (a) Example of CityGML building models; (b) building models of a local area; (c) object occlusion, e.g., tree, pedestrian, and vehicle. Yellow boxes with solid line indicate texture distortion of local areas caused by object occlusion in aerial photogrammetry. Yellow boxes with dotted line indicate object occlusion, e.g., tree, pedestrian, and vehicle.
Remotesensing 14 00050 g001
Figure 2. Workflow of the proposed approach.
Remotesensing 14 00050 g002
Figure 3. Relevant public-image collection. C1 and C2 are the centers of Buildings 1 and 2, respectively. R and R’ are the regions corresponding to Buildings 1 and 2, respectively. (l1,l2) and (l1′,l2′) are the splitting lines of R and R’, respectively. Region1-4 and Region1′-4′ are the subregions split by (l1,l2) and (l1′,l2′), respectively. Green and blue dots denote the terrestrial images that may be related to Buildings 1 and 2 within the radius, r, respectively. Red dots denote the public images that may be related to buildings (i.e., Building 1 and 2), and gray dots denote the terrestrial images that are unrelated to either Building 1 or 2. θ is the angle between two vectors, P C 1 and P C 2 .
Remotesensing 14 00050 g003
Figure 4. Object-occlusion detection combined with NanoDet and vegetation removal. γ denotes a gamma value, and R, G, and B are the three components of RGB color.
Remotesensing 14 00050 g004
Figure 5. Multiview local homography transformation. I 1 , I 2 , I 3 denote three multiview candidate public images corresponding to the same building; p is a building façade. L _ H I 1 , I 2 ,   L _ H I 2 , I 3 , and   L _ H I 1 , I 3 are the multiple local homography matrices of image pairs I 1 , I 2 ,   I 2 , I 3 , and I 1 , I 3 , respectively.
Remotesensing 14 00050 g005
Figure 6. Initial quadrilateral definition of a plane. The red and green dots denote the corresponding points obtained from point features and line features, respectively. Blue lines represent the ground truth of the boundary of a façade, and the black line is the initial quadrilateral boundary.
Remotesensing 14 00050 g006
Figure 7. Typical untextured building models and the multiview texture images. (ac) are three untextured building models; (df) are examples of texture images with different viewpoints corresponding to (ac), respectively. (gi) are the object occlusions, marked by white regions, detected by combining NanoDet and GGLI corresponding to (ac), respectively. (jl) are three textured building models by texture mapping using the proposed approach corresponding to (ac), respectively.
Remotesensing 14 00050 g007
Figure 8. Typical textured building models and multiview texture images. (ae) are five textured building models, and (fo) are examples of texture images with different viewpoints and LOD CityGML building models corresponding to (ae). (pt) are object occlusions, marked by white regions, detected by combining NanoDet and GGLI corresponding to (ae). (uy) are five textured building models by texture mapping using the proposed approach corresponding to (ae).
Remotesensing 14 00050 g008
Figure 9. Comparisons of Recall , Precision , and IoU values calculated from the public images corresponding to the three untextured and five textured models shown in Figure 7 and Figure 8. (ac) are the Recall , Precision , and IoU values obtained by point-based quadrilateral-region detection. (df) are the Recall , Precision , and IoU values obtained by point-line-based quadrilateral-region detection. B1–B8 indicate the number of building models, and F1–F4 indicate the façades of building models.
Remotesensing 14 00050 g009
Figure 10. Comparisons of T e n values calculated from the textures on the façades of five building models in Figure 8a–e. Dark blue and orange columns denote the textures before and after optimization, respectively. B4–B8 indicate the number of building models, and F1–F4 indicate the façades of building models.
Remotesensing 14 00050 g010
Table 1. Comparisons of O A values using Faster-R-CNN, YOLO, NanoDet, and our method.
DatasetR-CNNFaster-R-CNNYOLONanoDetNanoDet + GGLI
Dataset166.066.971.671.292.9
Dataset253.356.970.467.288.3
Dataset361.668.374.164.785.9
Dataset486.195.996.098.999.6
Dataset550.457.968.459.687.6
Dataset657.759.163.674.992.6
Dataset743.348.950.178.787.8
Dataset873.781.183.287.992.8
Publisher’s Note: MDPI stays neutral with regard to jurisdictional claims in published maps and institutional affiliations.

