Article

Satellite-Based Monitoring of Primary Production in a Mediterranean Islet Post Black Rat Eradication

by
Miguel Ibañez-Álvarez
1,*,
Pol Farràs Santasusana
2,
Juan Antonio Calleja
3,4,
Carlos Rouco
5,
Matthew Brolly
6,
Niall G. Burnside
6,
Elena Baraza
7,
Jordi Bartolomé
1 and
Emmanuel Serrano
2
1
Grup de Recerca en Remugants, Departament de Ciéncia Animal i dels Aliments, Universitat Autònoma de Barcelona (UAB), 08193 Bellaterra, Spain
2
Wildlife Ecology & Health Group (WE&H), Servei d’Ecopatologia de Fauna Salvatge (SEFaS), Departament de Medicina i Cirurgia Animals, Universitat Autònoma de Barcelona (UAB), 08193 Bellaterra, Spain
3
Centro de Investigación en Biodiversidad y Cambio Global, Universidad Autónoma de Madrid, 28049 Madrid, Spain
4
Center for Ecological Research and Forestry Applications, 08193 Cerdanyola del Valles, Spain
5
Departamento de Botánica, Ecología y Fisiología Vegetal, Universidad de Córdoba, 14071 Cordoba, Spain
6
Centre for Earth Observation Sciences, School of Applied Sciences, University of Brighton, Lewes Road, Brighton BN2 4JG, UK
7
Department of Biology-INAGEA, University of the Balearic Islands, 07122 Palma de Mallorca, Spain
*
Author to whom correspondence should be addressed.
Remote Sens. 2022, 14(1), 101; https://doi.org/10.3390/rs14010101
Submission received: 8 November 2021 / Revised: 17 December 2021 / Accepted: 21 December 2021 / Published: 26 December 2021
(This article belongs to the Special Issue Remote Sensing of Islands)

Abstract

:
Invasive rodents have a detrimental impact on terrestrial ecosystem functioning, this is often exacerbated on small islands. Rat eradication campaigns are often used to deal with this environmental perturbation given their classification as invasive species. Studies assessing the effects of rodent control at ecosystem scale are scarce and thus little is known about the subsequent functional response of vegetation subsequent to rat control. In this work, we use remote sensing to assess the effects of black rat (Rattus rattus) eradication on Mediterranean vegetation productivity in the Sa Dragonera Islet, Mallorca (Spain). Rats feed on seeds, sprouts, and leaves of woody vegetation and hence we expect primary production to increase nine years after the rodenticide campaign. The Break Detection approach for additive season and trend (BFAST method) was adopted to examine changes in vegetation density before and after the eradication campaign in Sa Dragonera Islet (Balearic Islands), using a temporal series of monthly NDVI data extracted from Landsat imagery. The same temporal trends were examined for a control zone where no rat eradication took place, in order to control for weather-driven changes. The results of this study revealed changes across the 21-year monthly NDVI time series. However, the dates, magnitude, and trend of these changes could not be explicitly attributed to the action of rats, when compared to the historical changes on the islet and the changes found to co-occur within the control zone. These finding could, perhaps, be explained by the high resilience of Mediterranean shrubs to browsing including that of rat invasion. However, the results from the study appear to show that rat damage on specific plant species, with little contribution to global NDVI values, would be overshadowed by the effects of broader environmental factors in this remote sensing approach. The results suggest that the current passive restoration scheme imposed following eradication is not sufficient for effective ecosystem restoration.

Graphical Abstract

1. Introduction

Invasive alien species (IAS) are those that have reached new geographic areas by way of human introduction, and are populations which can survive, reproduce and spread over the natural environment leading to major impacts on the environment or society [1]. IAS can cause serious disturbance to other indigenous species and the ecosystems they invade, often altering ecosystem structure and function, trophic relationships (e.g., plant-animal interactions), and reducing the biodiversity of the invaded ecosystems [2,3,4,5].
Island communities which have evolved in isolation are typically the most vulnerable to IAS [6]. One of the most harmful invasive species are rodents belonging to the genus Rattus, in particular, the black rat (Rattus rattus), brown rat (R. norvegicus) and Pacific rat (R. exulans) [7,8,9]. The impact of rats is often density-dependent [10,11,12] and regulated by primary production [13,14,15], thus, in many biomes rat populations fluctuate seasonally [16]. Records of black rat density are highly variable ranging from 36.4 rats ha−1 in New Zealand islands [15], to 50 rats ha1 in some Mediterranean islands [17]. In the Mediterranean basin the black rat is the most invasive species due to its broad tolerance to dry climates [18,19]. These species have already invaded 80% of the world’s islands [12,20,21,22] and they cause a cascade of damage to ecosystems, resulting in the decline and extinction of native birds, mammals, reptiles, invertebrates and plants of many archipelago ecosystems [7,8,18]. The black rat tends to consume more plants than animals [23], showing a preference for seeds, sprouts, and leaves of adult plants [24,25], and thus directly affecting photosynthetic and reproductive parts. As a result, black rats affect the composition and structure of plant communities, plant recruitment, and the viability of the plant population on the islets and islands they infest. This has been recorded in some islands of New Zealand [26,27], and in islands and small islets of Spanish archipelagos (Canarias and Balearic Islands) where the presence of black rat has altered the structure of the vegetation; depressing or limiting some plant species and favoring others [19].
In islands where rats are removed at an early stage of their invasion, vegetation recovers quickly [28,29]. However, in places with prolonged history of rat colonization, recovery is much slower due to critical changes in vegetation structure [30,31]. Rodent eradication is a common measure [8] for recovering invaded areas [32] with accompanying environmental monitoring necessary to evaluate the effectiveness of rat eradication campaigns in terms of ecosystem restoration [33]. However, ecosystem recovery is often affected by other confounding factors (e.g., climatic events) [34,35], or is limited to specific plant or animal species [36,37]. Conversely, the lack of environmental information prior to rat invasion [38] can hamper the evaluation of ecosystem restoration programs [39]. In fact, ecosystem monitoring post rodent eradication is uncommon [13,40]. Remote sensing therefore has a clear role to play in assessing ecosystem restoration post rodent eradication [41] given its spatial and temporal extents.
Satellite sensors are capable of providing land cover information at different spatial, spectral, and temporal resolutions, allowing the monitoring of vegetation extent and health, and through this indicate areas of recovery post natural or human-induced disturbance [42,43]. A range of spectral vegetation indices, such as the Normalized Difference Vegetation Index (NDVI), can be used for these purposes [44]. NDVI is a proxy for photosynthetic activity [45], vegetation productivity, aboveground biomass [46], and vegetation dynamics [47,48], and has been shown to reliably capture ecological response to environmental change including human and animal-driven land degradation [44]. In most terrestrial biomes, long-term NDVI time series follow a non-linear pattern that comprises alternating cycles of greening (increasing NDVI) or browning (decreasing NDVI). The dating and quantification of frequency and magnitude of these NDVI cycles is generally used as a proxy for ecosystem dynamics [44,48,49]. NDVI time series are particularly useful in periods longer than 10 years [50], as this makes it feasible to analyze the seasonal and trend components over time. The nature of the change in NDVI time series can be interpreted according to the affected component. For example, modifications of the seasonal oscillation could indicate phenological changes, while changes in the trend, including the magnitude, may point to a disturbance event [43], precipitation variability [51,52,53] or drought event [53,54].
In this work, we evaluate the impact of a rodent eradication campaign in a Mediterranean scrubland located in the Baleares Archipelago (western Mediterranean basin, Spain) using twenty-one years of monthly NDVI data for the Sa Dragonera and for a nearby control zone on the island of Mallorca. Changes in vegetation productivity, before and after the eradication campaign, across the two zones was examined using the breaks for additive seasonal and trend analysis (BFAST, [43,55]). BFAST is especially useful here to address the lack of information regarding the magnitude of change on primary production after deratization management, because unlike other methods, BFAST does not restrict the data to a specific season since it considers a seasonal fit over the entire time series. Additionally, its change detection approach based on signal-to-noise ratio does not require setting a change threshold. BFAST has the sensitivity to differentiate the normal phenological cycle from abnormal changes and has been used to monitor the recovery of vegetation [56,57] after a broad range of environmental catastrophes including wildfires, insect outbreaks [58] and floods [59]. Due to the devastating effect that black rat infestations can have on small islet ecosystems reported worldwide [19] and the ability of BFAST to detect changes at the local scale [55,60,61], we hypothesized that primary productivity on Sa Dragonera Islet would differ before and after the rodenticide campaign; due to vegetation regeneration following black rat eradication. In particular, we expect to detect an increase (abrupt and/or gradual) in the greenness of the main vegetation due to the natural vegetation recovery following rodent eradication after controlling for climatic conditions.

2. Materials and Methods
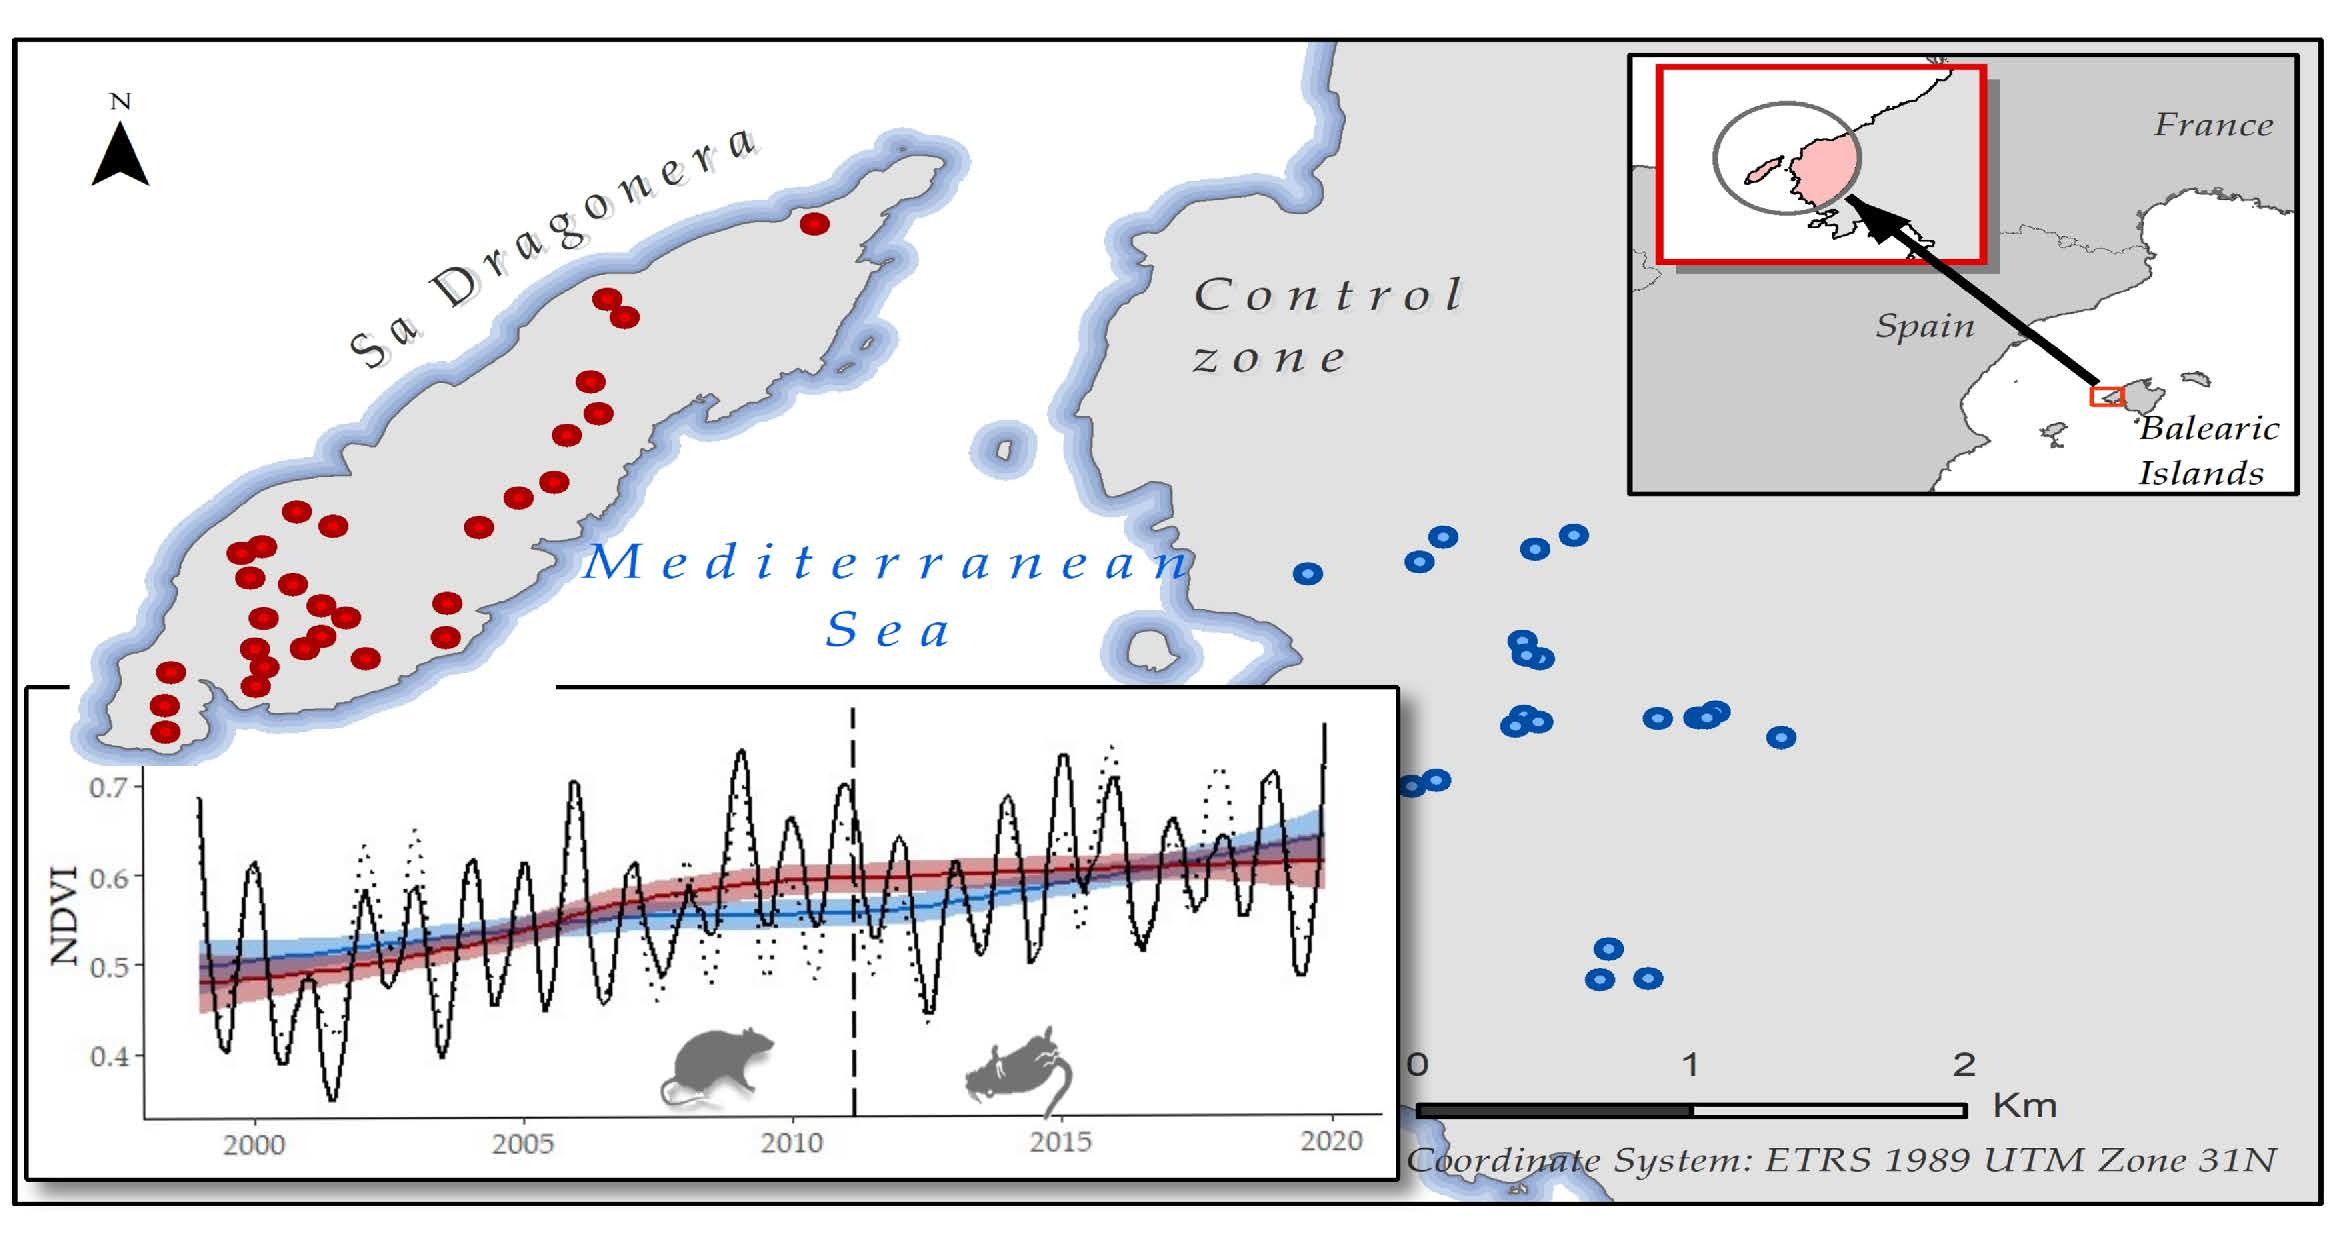
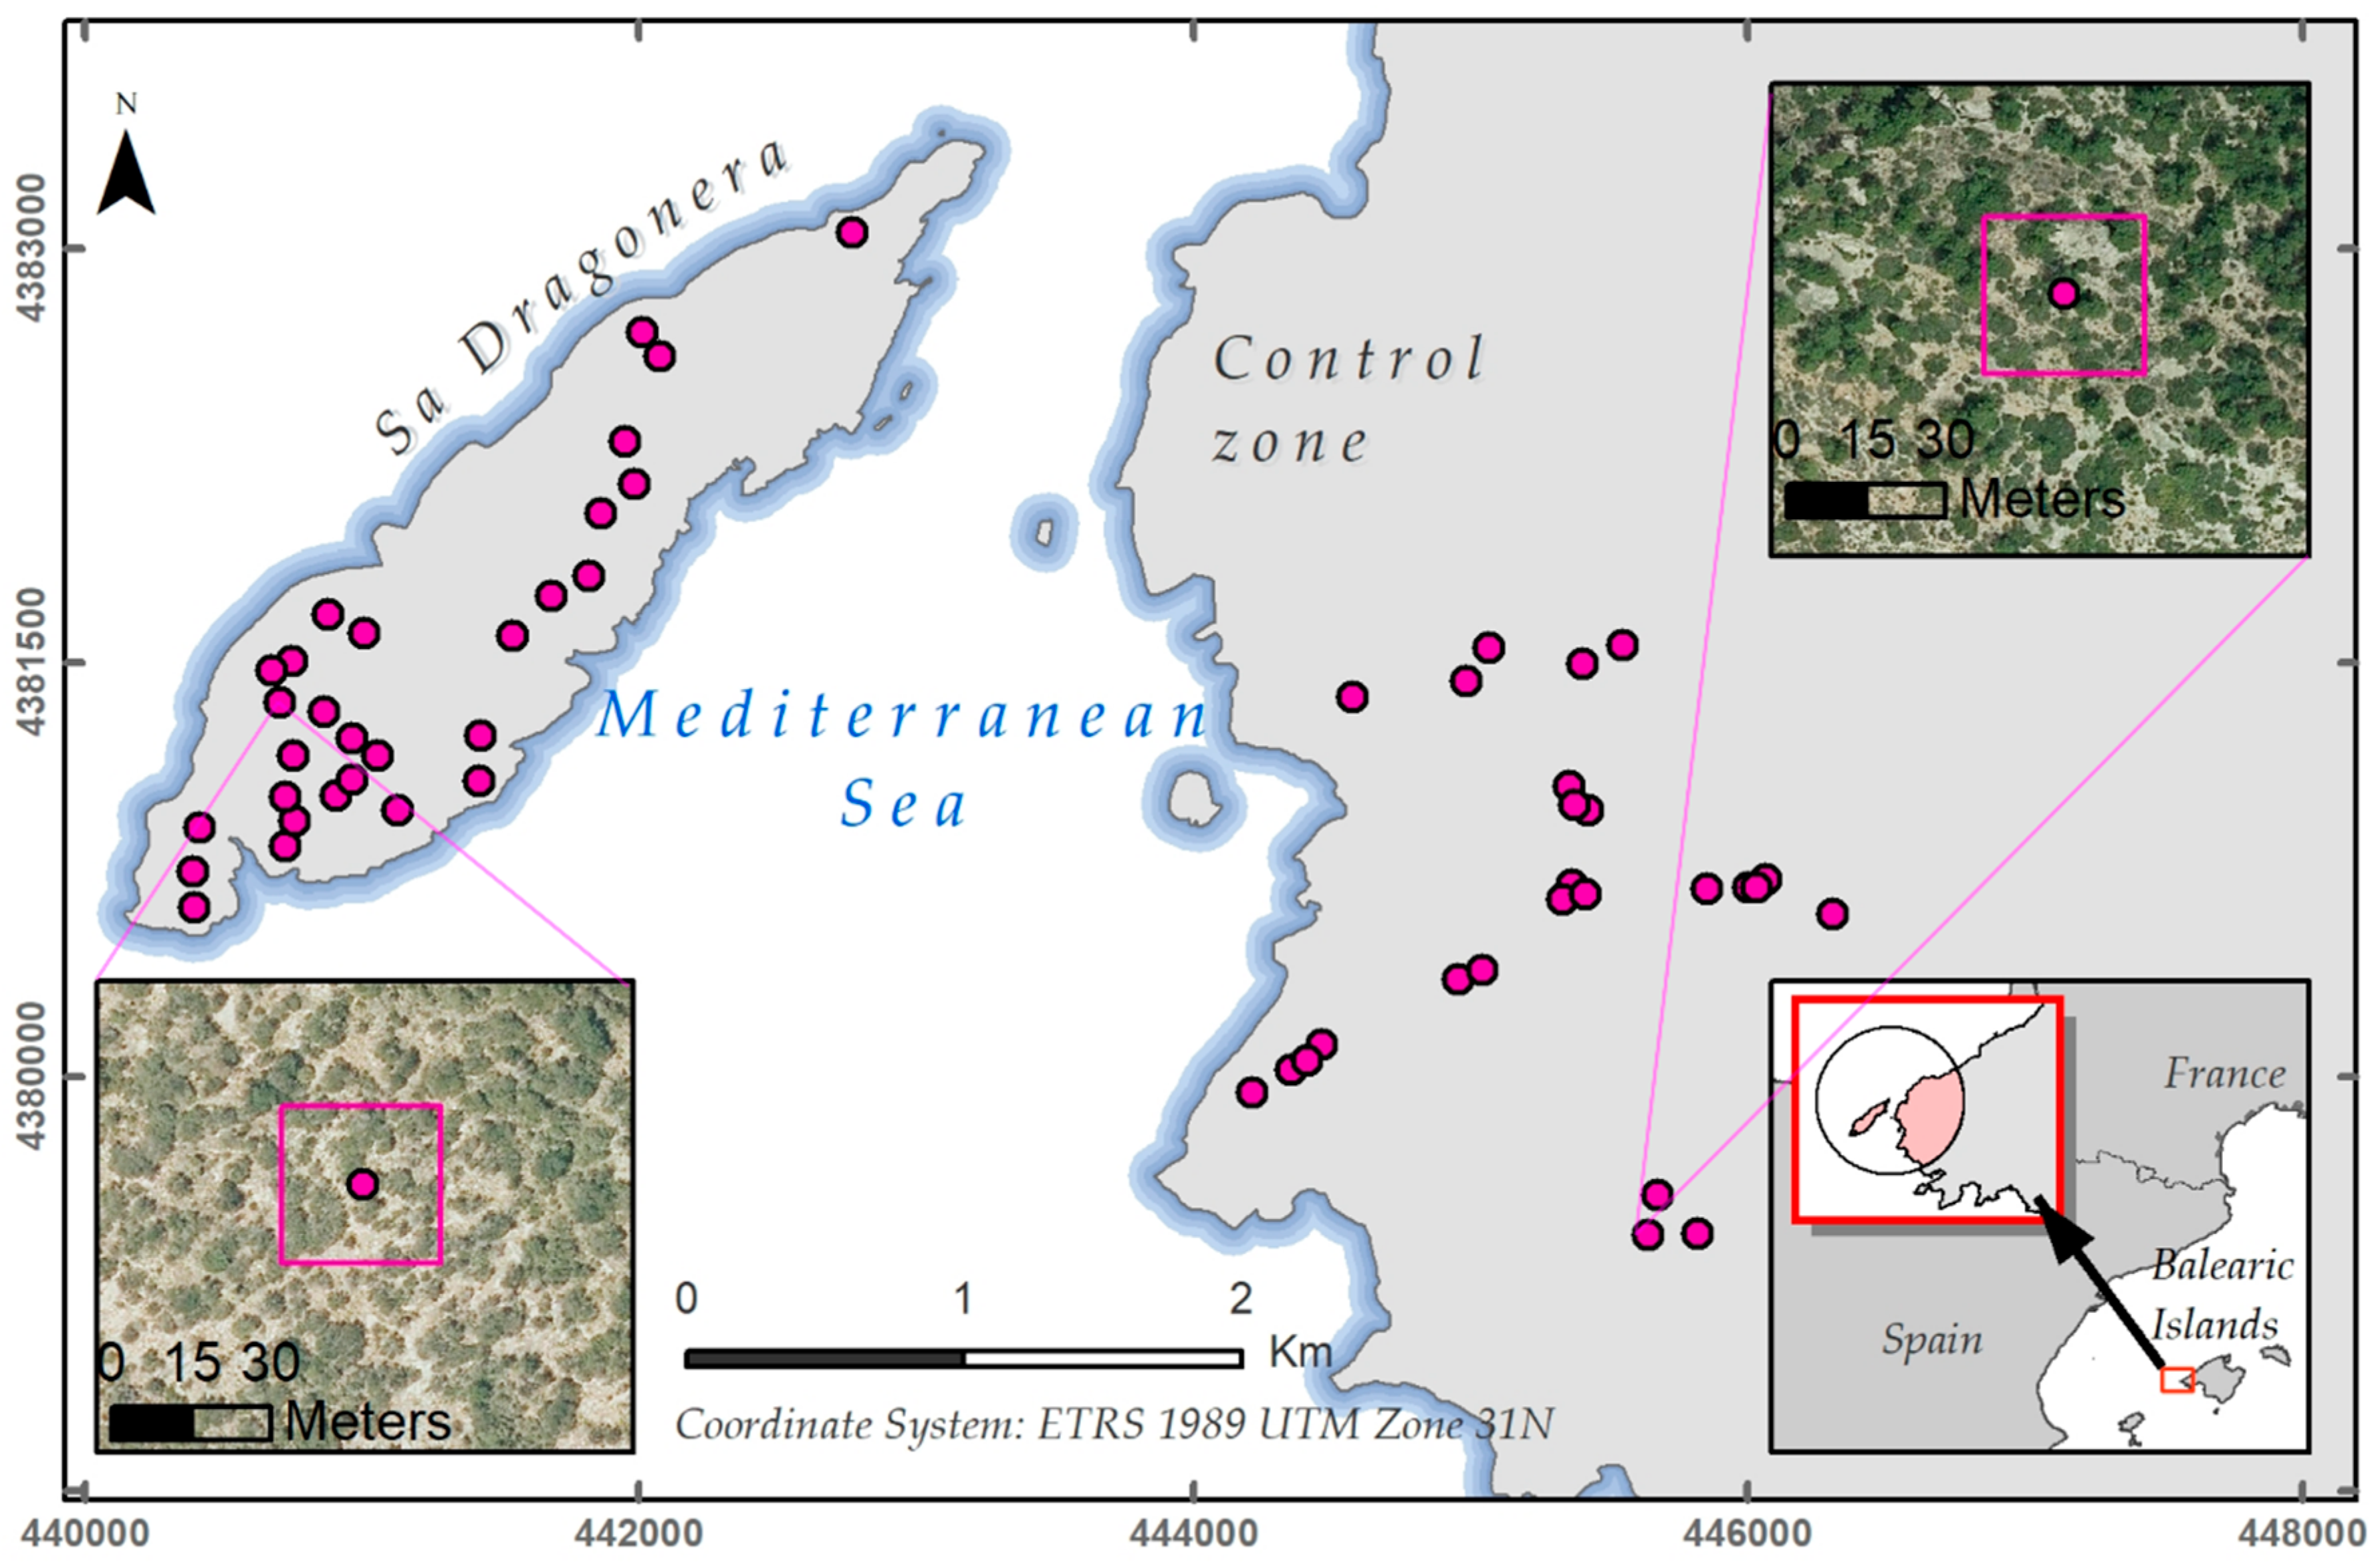
2.1. Study Area

The focal geographic area of the study is in the Baleares Archipelago (western Mediterranean basin, Spain). It comprises Sa Dragonera Islet, referred to hereafter as treatment zone. In addition, a control zone was included, some 800m away on Mallorca Island, due to its similarity in orography, lithology and vegetation type. Importantly, both zones are an extension of the UNESCO designated World Heritage Site of the Serra de Tramuntana Mountain Range. The treatment zone is a 276 ha islet extending 350 m above sea level, with the north-west exposure terminating in a cliff face.
The climate at both sites is Mediterranean, with annual average temperatures above 16 degrees and little annual rainfall (<400 mm); but with high inter-annual variability. According to the Spanish Meteorological Agency (AEMET) [62], drought periods typically last 5 months; yet these events are partially mitigated by maritime influence. Limestone is the predominant bedrock and overlying soils are poorly developed or skeletal. The main vegetation consists of a mosaic of scrub communities. There are tree patches, and the herbaceous taxa are scarce (other than non-palatable plants such as Urginea maritima and Crithmum maritimum) due to the poor climatic and edaphic conditions. Sclerophyllous woody species of Mediterranean optimum predominate, such as Pinus halepensis, Pistacia lentiscus, Olea europaea, Anthyllis cytisoides, Chamaerops humilis, Cistus monspeliensis, Cneorum tricoccon, Ephedra fragilis, Euphorbia dendroides, Phillyrea angustifolia [63,64]. Most of these species can resprout following disturbance, exhibiting some resilience to fires or/and browsing, which are typical characteristics of sclerophyllous flora of the Mediterranean basin [65,66,67].
The islet is currently uninhabited; however, human activity has shaped its landscape as well as that of Mallorca Island over the last five millennia, fostering deforestation and soil erosion processes [63,68]. Natural resources, such as woodcutting, crop growing, and domestic animal breeding, were common until the 1975 [69,70]. Feral goats (Capra hircus) were eradicated in the 1980s, European wild rabbits (Oryctolagus cuniculus), and house mouse (Mus musculus) were also present in the treatment zone, yet black rats have been by far the most common invasive mammal in the islet reaching up to 50 individuals ha−1 [71]. This density of rats equals the maximum reported in Mediterranean islands [17,72] and is higher than that historically recorded in the islands of New Zealand (36.4 rats ha−1) [15].
Sa Dragonera is the main islet of an archipelago which was awarded the status of Natural Park in 1995 and forms part of the Natura 2000 Special Protection Area and Site of Community Importance (SPA and SCI, EU Birds and Habitats Directive) [73]. The majority of the islet is considered a reserve area devoted to the conservation of natural values in the absence of active management measures [74]. Field observations revealed severe damage by rodents on vegetation cover, for example, in 2010 partial or total damage on branches of juvenile individuals of Ficus carica, Ceratonia siliqua and Olea europaea var. sylvestris were reported (Figure 1). Likewise, the endangered populations of Balearic shearwater (Puffinus mauretanicus) were impacted by rat predation [71]. Hence, conservationists have performed several ground-based rodent eradication attempts between 2001 and 2008 using rodenticide baits in the most accessible areas, but with little long-term success as rat populations have recovered to high densities. In February 2011 the local government organized an eradication campaign using Brodifacoum rodenticide. Brodifacoum baits were aerially distributed twice over the entire islet at rates of 14 kg ha−1 [71]. Since this eradication effort, the treatment zone has been rodent free [75,76], despite the high risk of reinvasion due to the proximity of the coast of Mallorca [77]. Four years after Brodifacoum baiting, unsystematic and occasional field observations have reported the increase of vegetation cover [78], however evidence of this recovery remains lacking.
The Sierra Tramuntana in Mallorca is also a landscape shaped by human activity, which suddenly ceased from the 1960s in the rural mountain areas, becoming focused on rapid development of the tourism sector in the urbanized areas. The abandonment of the rural sector led to the cessation of domestic animal grazing but also to the proliferation of the feral goat which continues today [79,80].

2.2. NDVI Time Series Construction

To identify whether the rodenticide eradication campaign affected primary production in the treatment zone, we compare its NDVI time series with that in the control zone. NDVI time series are here based on Landsat surface reflectance (SR) data for a period ranging from 1999 to 2020. February 2011 was set as the base date for detecting changes due to rat eradication. Therefore, the study period was divided into: (i) a historical period of 12 years where vegetation was impacted by rats (1999–2010) and (ii) a recovery period of 9 years post rat eradication (2012–2020).

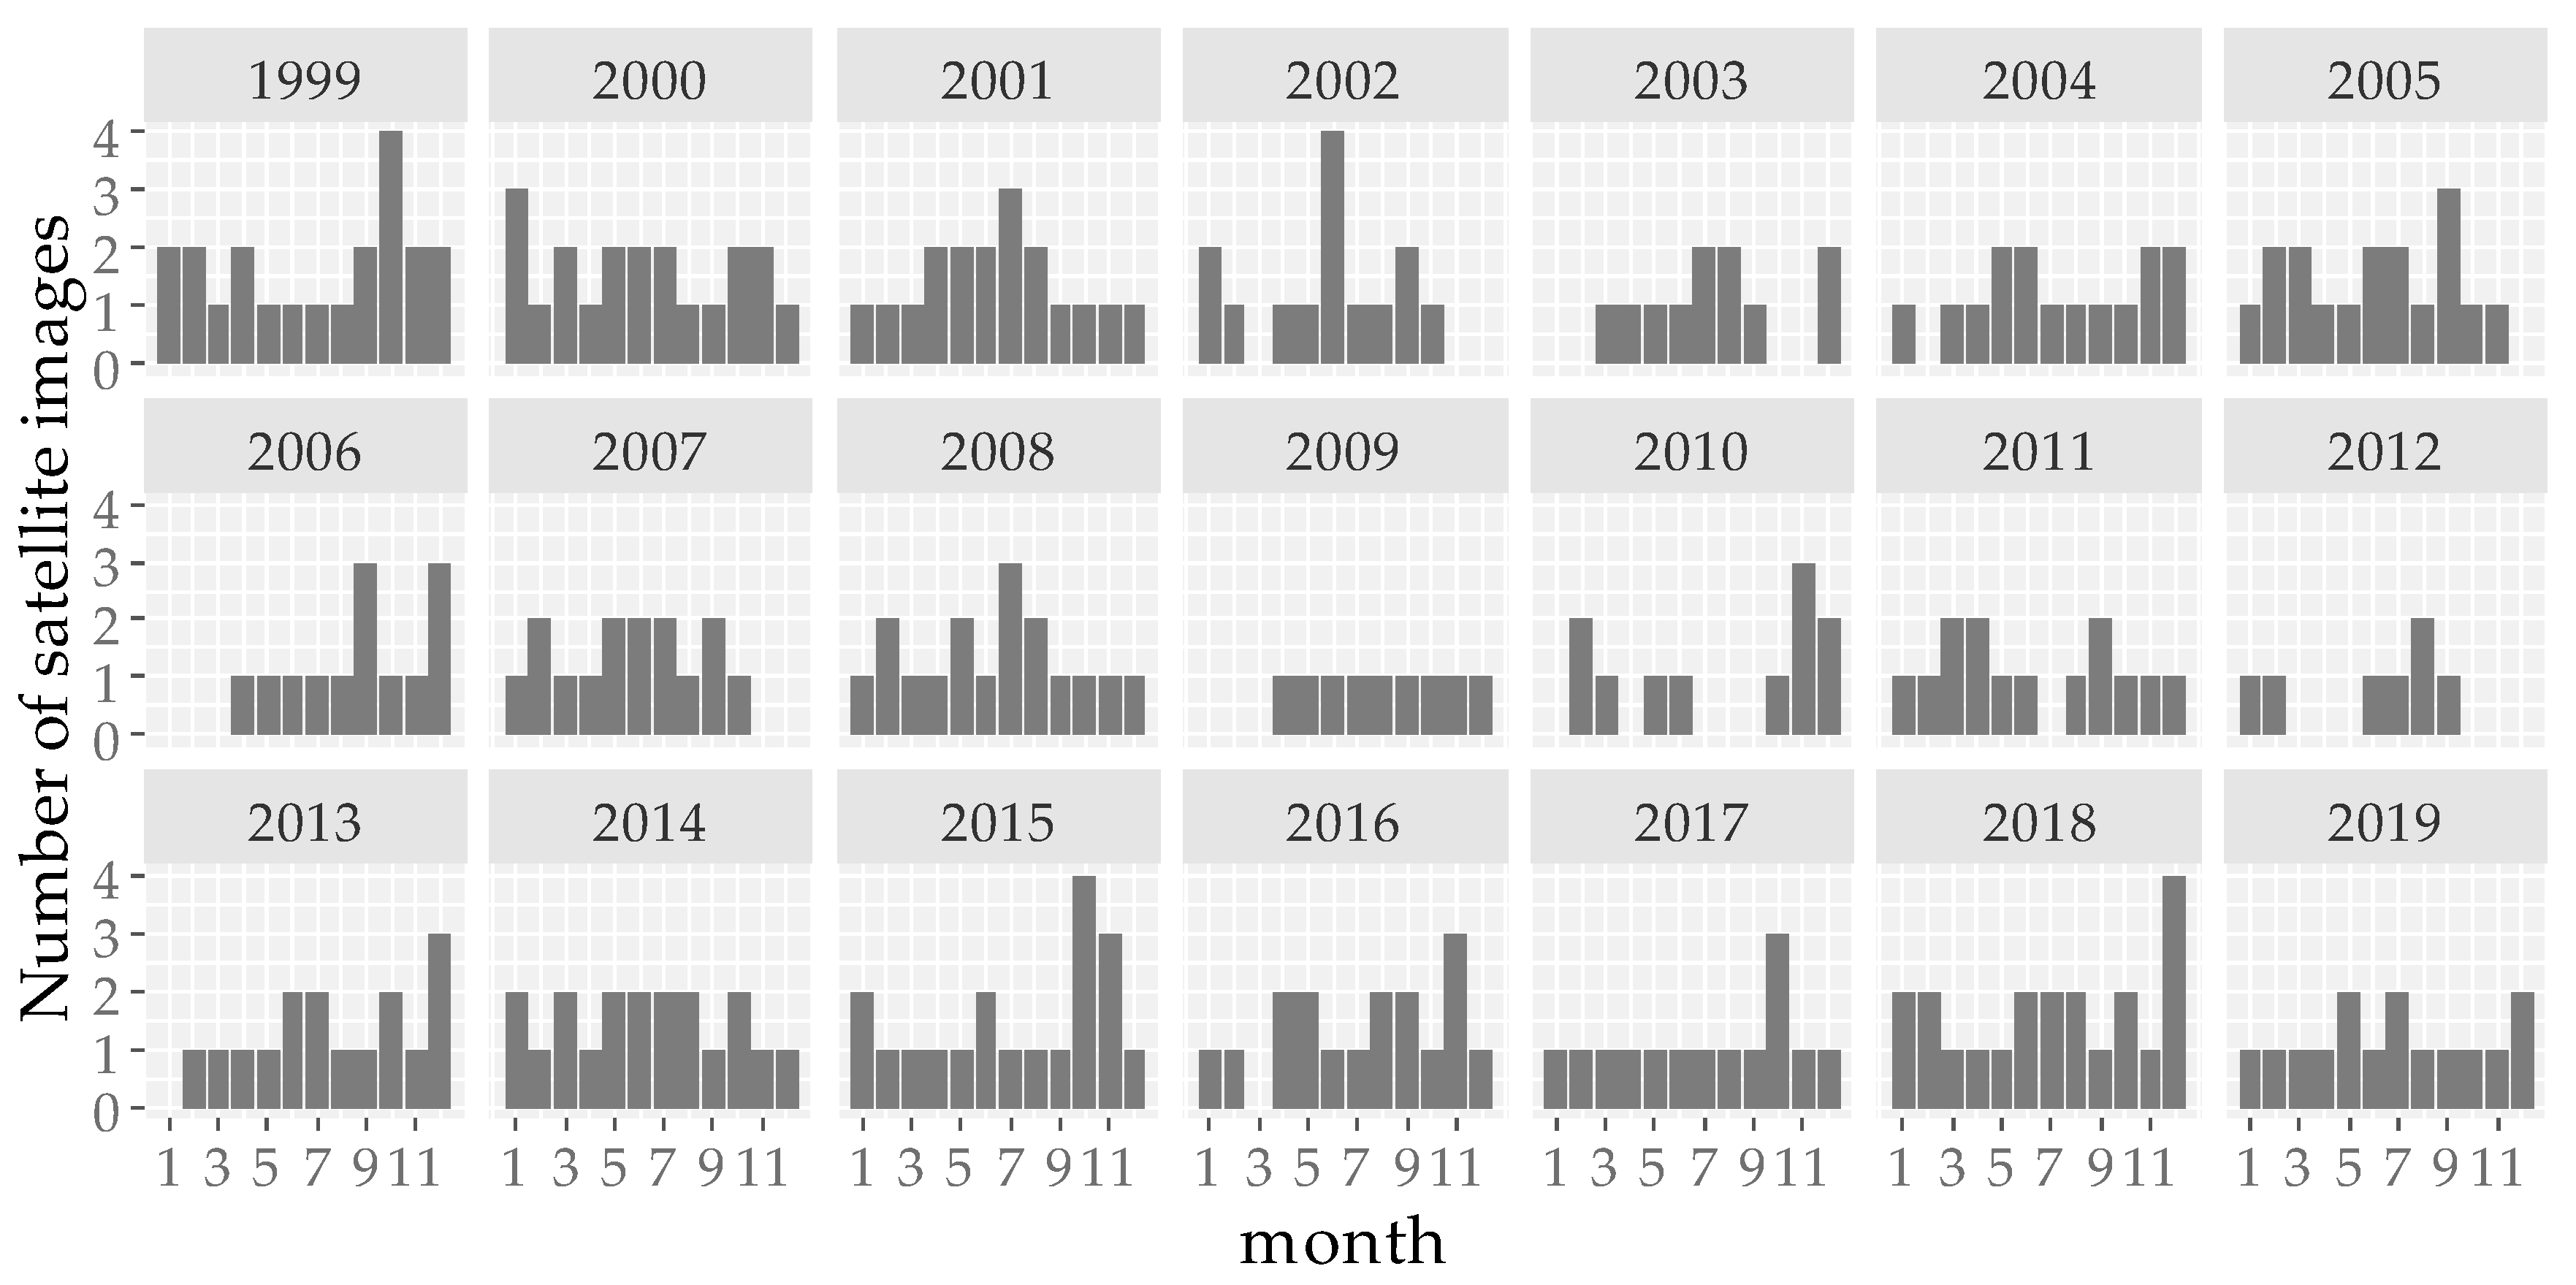
2.2.1. Satellite Images

This study used the Landsat satellite archive due to the temporal continuity across the analysis time period. Landsat imagery Collection 1 provided by USGS (United States Geological Survey) was accessed via the web site https://earthexplorer.usgs.gov/ on 14 November 2020. Landsat Collection 1 images are calibrated and aligned across all Landsat satellites. 333 Landsat SR images were obtained for the period January 1999 to December 2019 from Landsat 5 TM, Landsat 7 ETM+ and Landsat 8 OLI sensors. SR images are a Landsat level-2 product that provide the bottom of atmosphere surface spectral reflectance as it would be measured at ground level (i.e., with atmospheric correction applied). The availability of a high number of images favors the temporal consistency of the radiometric data across time series, since gaps produced due to the presence of clouds or due to SLC off-Data error, inherent to Landsat 7 [81] acquisitions post May 2003, can be replaced with optimal values recorded by another sensor at a close date (Figure 2).
Once Landsat SR images were downloaded, R script was coded to search for the red and NIR spectral bands of each satellite observation, combining them according to the NDVI formula [82] using the “Raster” package [83] in the R statistical software [84]. Thus, NDVI layers were produced for all observations. All layers were stacked creating a multi-variable raster dataset called RasterStack object.

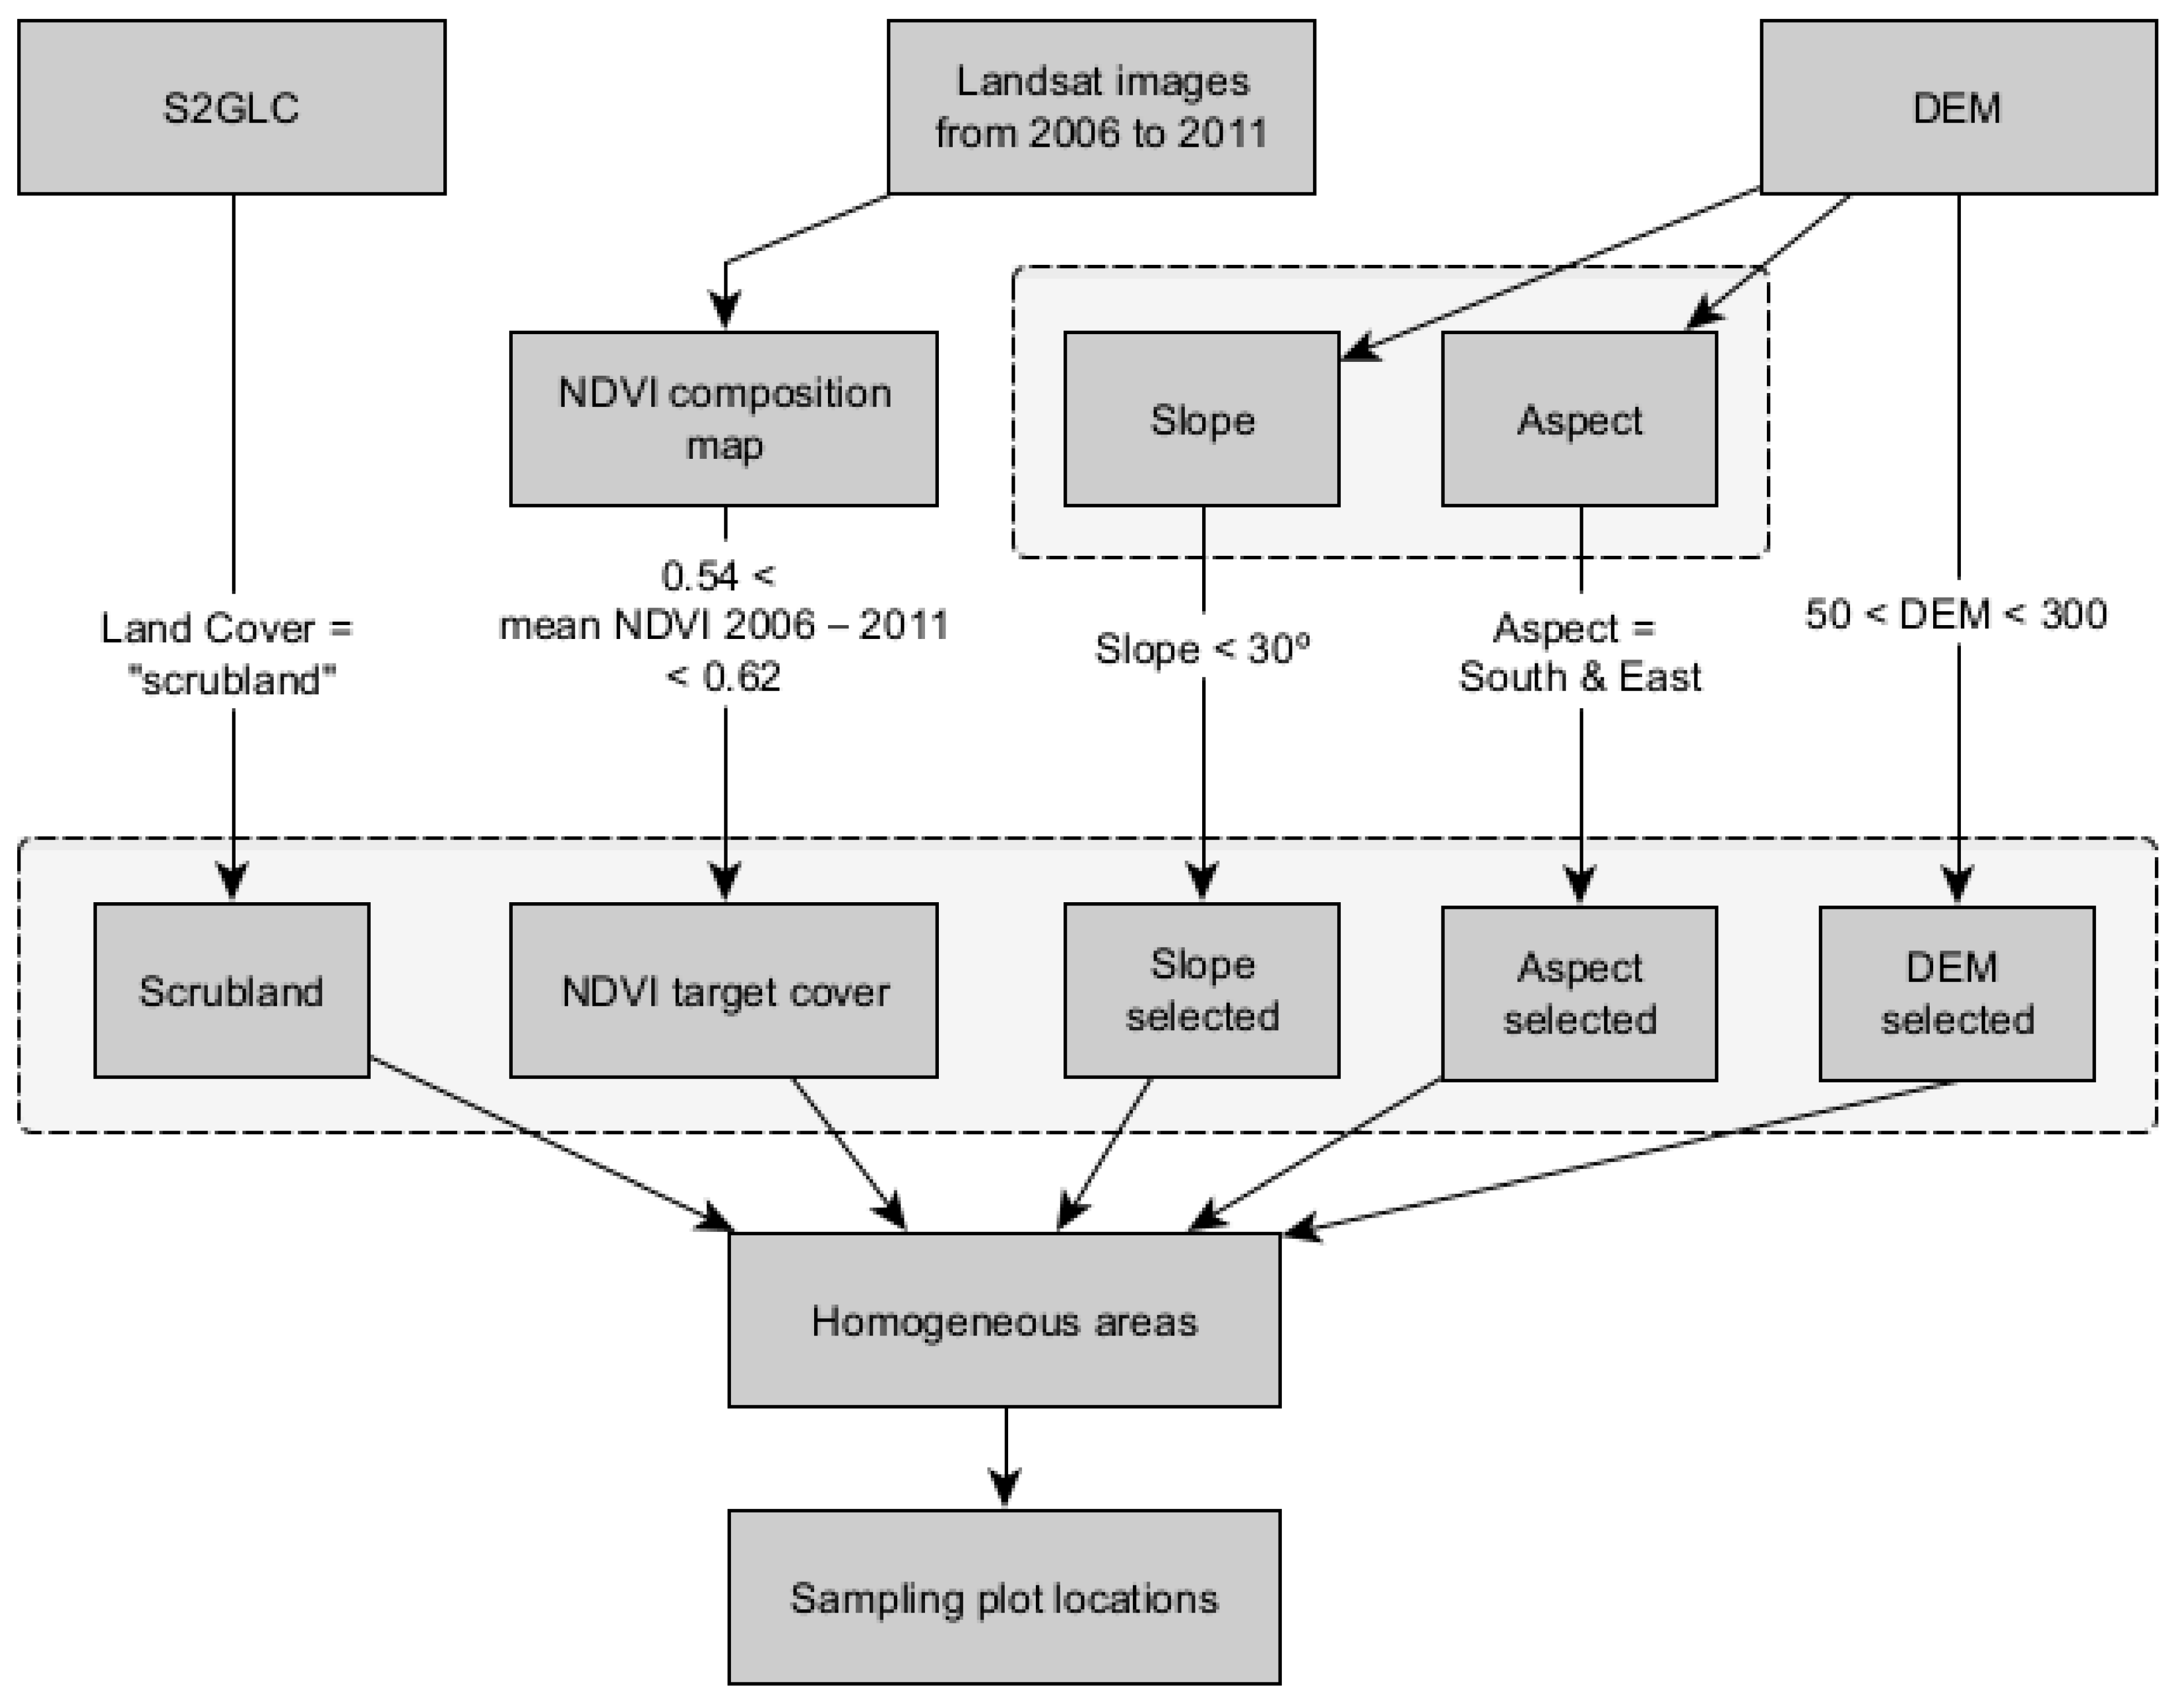
2.2.2. Plot Selection Procedure

Time series are created by averaging NDVI values from selected sampling plots. The plots were located using a pair of UTM coordinates indicating the center and extended to the spatial resolution of a Landsat image (i.e., 900 m2). To select sampling plots where vegetation shows similar temporal dynamics of NDVI, a sampling procedure was used to choose plots meeting the following features: (I) same vegetation cover, (scrubland, because it is the principal vegetation cover of the islet), based on Sentinel-2 Global Land Cover (S2GLC, [85]); (II) similar NDVI values avoiding scattered scrub areas and cliffs. For this purpose, a NDVI composition map was created where each pixel represented the 5-year average NDVI prior to the rodenticide event (i.e., from 2006 to 2011). This map was classified into the major categories (i.e., coniferous forest, scrubland, scattered thicket and bare soil) using the Jenks natural breaks classification method to maximise the variation between classes and to best group similar values [86]. With the help of a high resolution orthophoto (15 cm spatial resolution aerial orthophotography from the PNOA (National Plan for Aerial Orthophotography) available in http://www.scne.es/#ORTOPNOA) on 17 October 2020, we photo-interpreted and established that the values of the target vegetation cover in the NDVI composition map ranges from 0.45 to 0.62. To address NDVI differences due to slope, altitude and orientation issues [87], sampling plots were selected if they were between 50 to 300 m asl, had a slope less than 30 degrees, and had an east or south facing-orientation. This selection was carried out using a 5 × 5 m2 resolution Digital Elevation Model (DEM) raster layer in ArcGIS 10.7. A workflow of the sampling procedure is shown in Figure 3. A total of fifty-four sampling plots, 29 in the treatment zone and 25 in the control zone, met these criteria (Figure 4).

2.2.3. Monthly Landsat NDVI Time Series Construction

For each sampling plot, NDVI values were extracted from a multilayer raster object (Section 2.2.1) using the “raster” 3.4–10 package [83] in the R statistical software [84]. The cleaning, gap-filling and smoothing procedure summarized below was followed:
(a) NDVI values outside the range of the target vegetation index range, below 0.2 or over 1, were removed. The NDVI values were then selected according to maximum-value composite (MVC) criterion.
(b) a gap-filling with linear interpolation between neighboring values [88] was performed, to fill NDVI gaps (31 observations in the treatment zone and 32 in Mallorca Island, the control zone).
(c) the Savitzky–Golay [89] smoothing algorithm was applied to smooth out the noise in both time series. It is appropriate to apply it on seasonal data [90] since it follows within-season variations and therefore captures subtle dynamics during seasons [91].
By applying the steps described here, clean and consistent time series were constructed for each treatment to feed the BFAST algorithms (Figure 5), since a temporal consistency of observations is critical for understanding ecosystems dynamics [92].

2.3. Historical Time Series Analysis

To detect and characterize changes in the ecosystem dynamics, the BFAST protocol described in [43] was applied to the monthly NDVI time series. BFAST interactively decomposes time series into trend, seasonal, and remainder components [43,55]. The iteration begins using a Seasonal-Trend decomposition (STL) method. STL first detrends the time series by subtracting the trend from the observed values resulting in a new time series that exposes seasonality. The detrended time series is then used to compute the average seasonality. The amount of NDVI beyond the combination of the seasonal and trend components is considered random noise or the remainder component (Figure 6). Subsequently, BFAST function detects breakpoints by applying ordinary least squares residuals-based moving sum (OLS-MOSUM). This tests the null hypothesis that the linear trend of the NDVI values remain constant over the observations against the alternative of significant changes (p < 0.05). The optimal number of breakpoints is determined by minimizing the Bayesian Information Criterion (BIC) and the position of the breakpoints (dates and its confidence intervals) are chosen by globally minimizing the residual sum of squares. BFAST iterates along these steps until the number and position of the breakpoints remains constant. The basis and the process carried out by BFAST is described in detail in [43] and is available in the BFAST package for R (https://cran.r-project.org/web/packages/bfast/index.html) on 9 September 2021. All BFAST analyses were performed using R statistical software [84].
BFAST transforms the NDVI time series into a piecewise model, whose maximum number of linear regressions depends on the parameter h. The h parameter sets the minimal segment size between potentially detected breaks in the trend model given as a fraction relative to the sample size. The sample size of each of our time series consists of 252 observations (i.e., 21 years at a monthly frequency). We established the value of h = 1/7 in order to set significant trend periods following the recommendations of [59]. For our dataset, this implies that a maximum of seven linear regressions with 252/7 = 36 minimum observations each (i.e., a minimum of three years). The difference between the NDVI value at the end of a preceding linear model and the intercept of the following linear model defines the magnitude of the abrupt change and the slope of each linear model defines the gradual change between breakpoints.
For better understanding of the vegetation dynamics and to avoid misinterpretation of the effect of rat removal, we compared the BFAST outcomes between zones and with historical environmental records. Because changes in hydrological regimes are considered the main drivers of vegetation dynamic changes [52,54], and closely related to shifts in NDVI time series in water limited ecosystems [93,94], we compared the BFAST results with the hydrological drought index (HDI). This is reported by the General Directorate of Water Resources (DGRH) of the government of the Balearic Islands [95] in the Hydrological Demand Unit (HDU) of Sierra Tramuntana Sur. This corresponds to our study area. In the report they categorize HDI in 4 groups which describe the state of water resources. These categories, from highest to lowest hydric abundance are: normality, pre-alert, alert and emergency. The years 1999, 2001, 2004, 2007 and 2011 are key dates to consider due to the area entering alert or emergency states. Similar to the majority of zones in Mallorca, as a result of the high rainfall in 2009 and 2010, our study area was at optimal HDI levels, although from 2015 onwards a rapid decline was observed, leading to the alert situation in late 2015.
The BFAST outputs are compared between zones. This, on the one hand, gives us an idea of whether the process of selection of plots was efficient at the time of selecting areas whose vegetation follows the same dynamics. On the other hand, the comparison of the dates when the breaking points occur tries to find the singularity of the effect of the eradication campaign. In addition, the magnitude of the breakpoints is used as a proxy for the vegetation resistance facing a disturbance event; and the slope of the linear regressions as a proxy of the recovery rate (greening when positive rate or browning when negative rate) [96].

3. Results

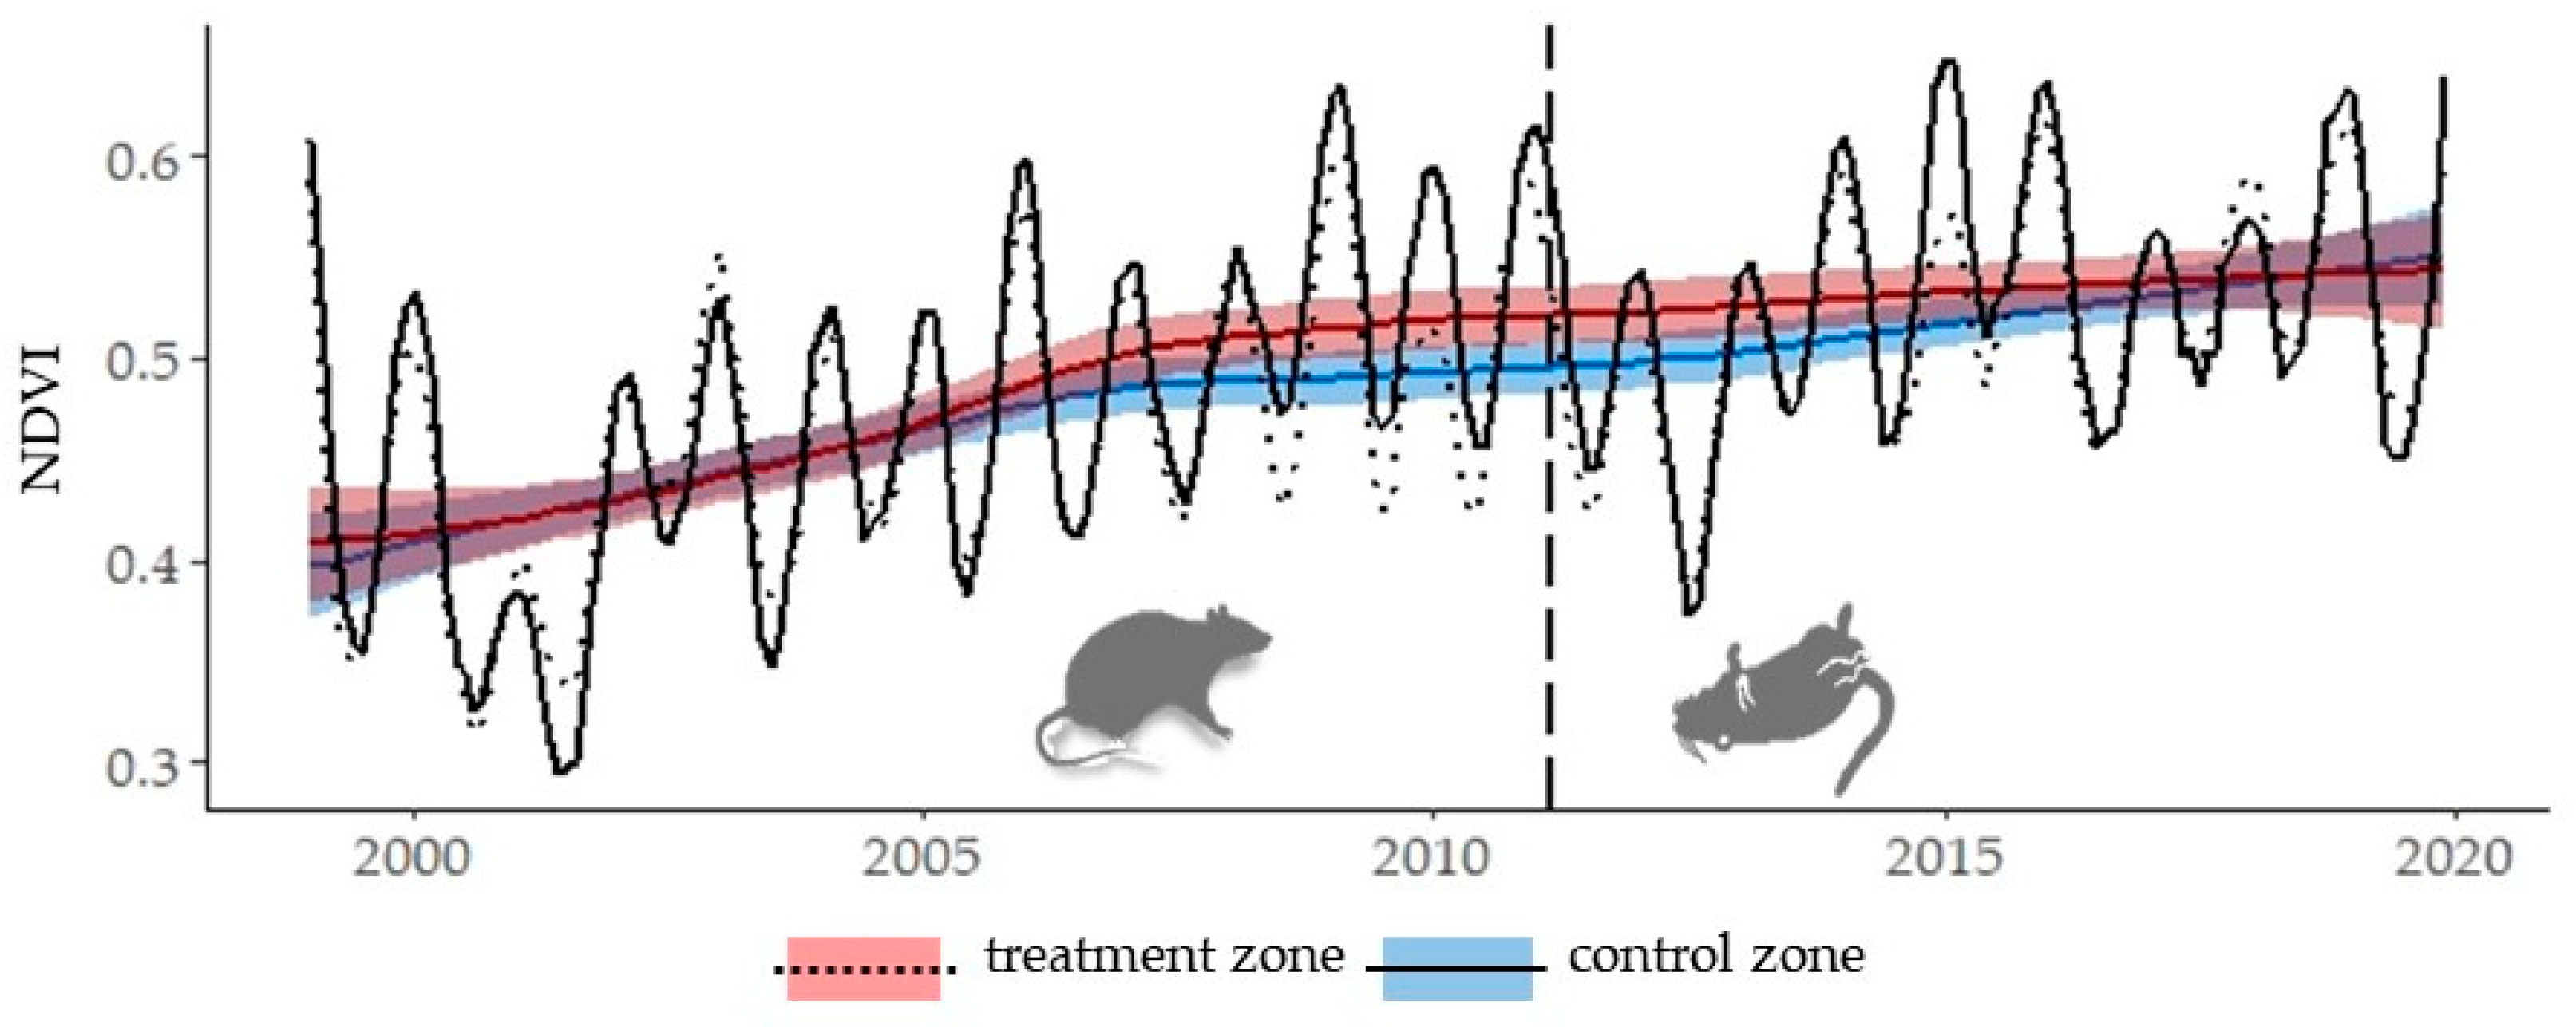
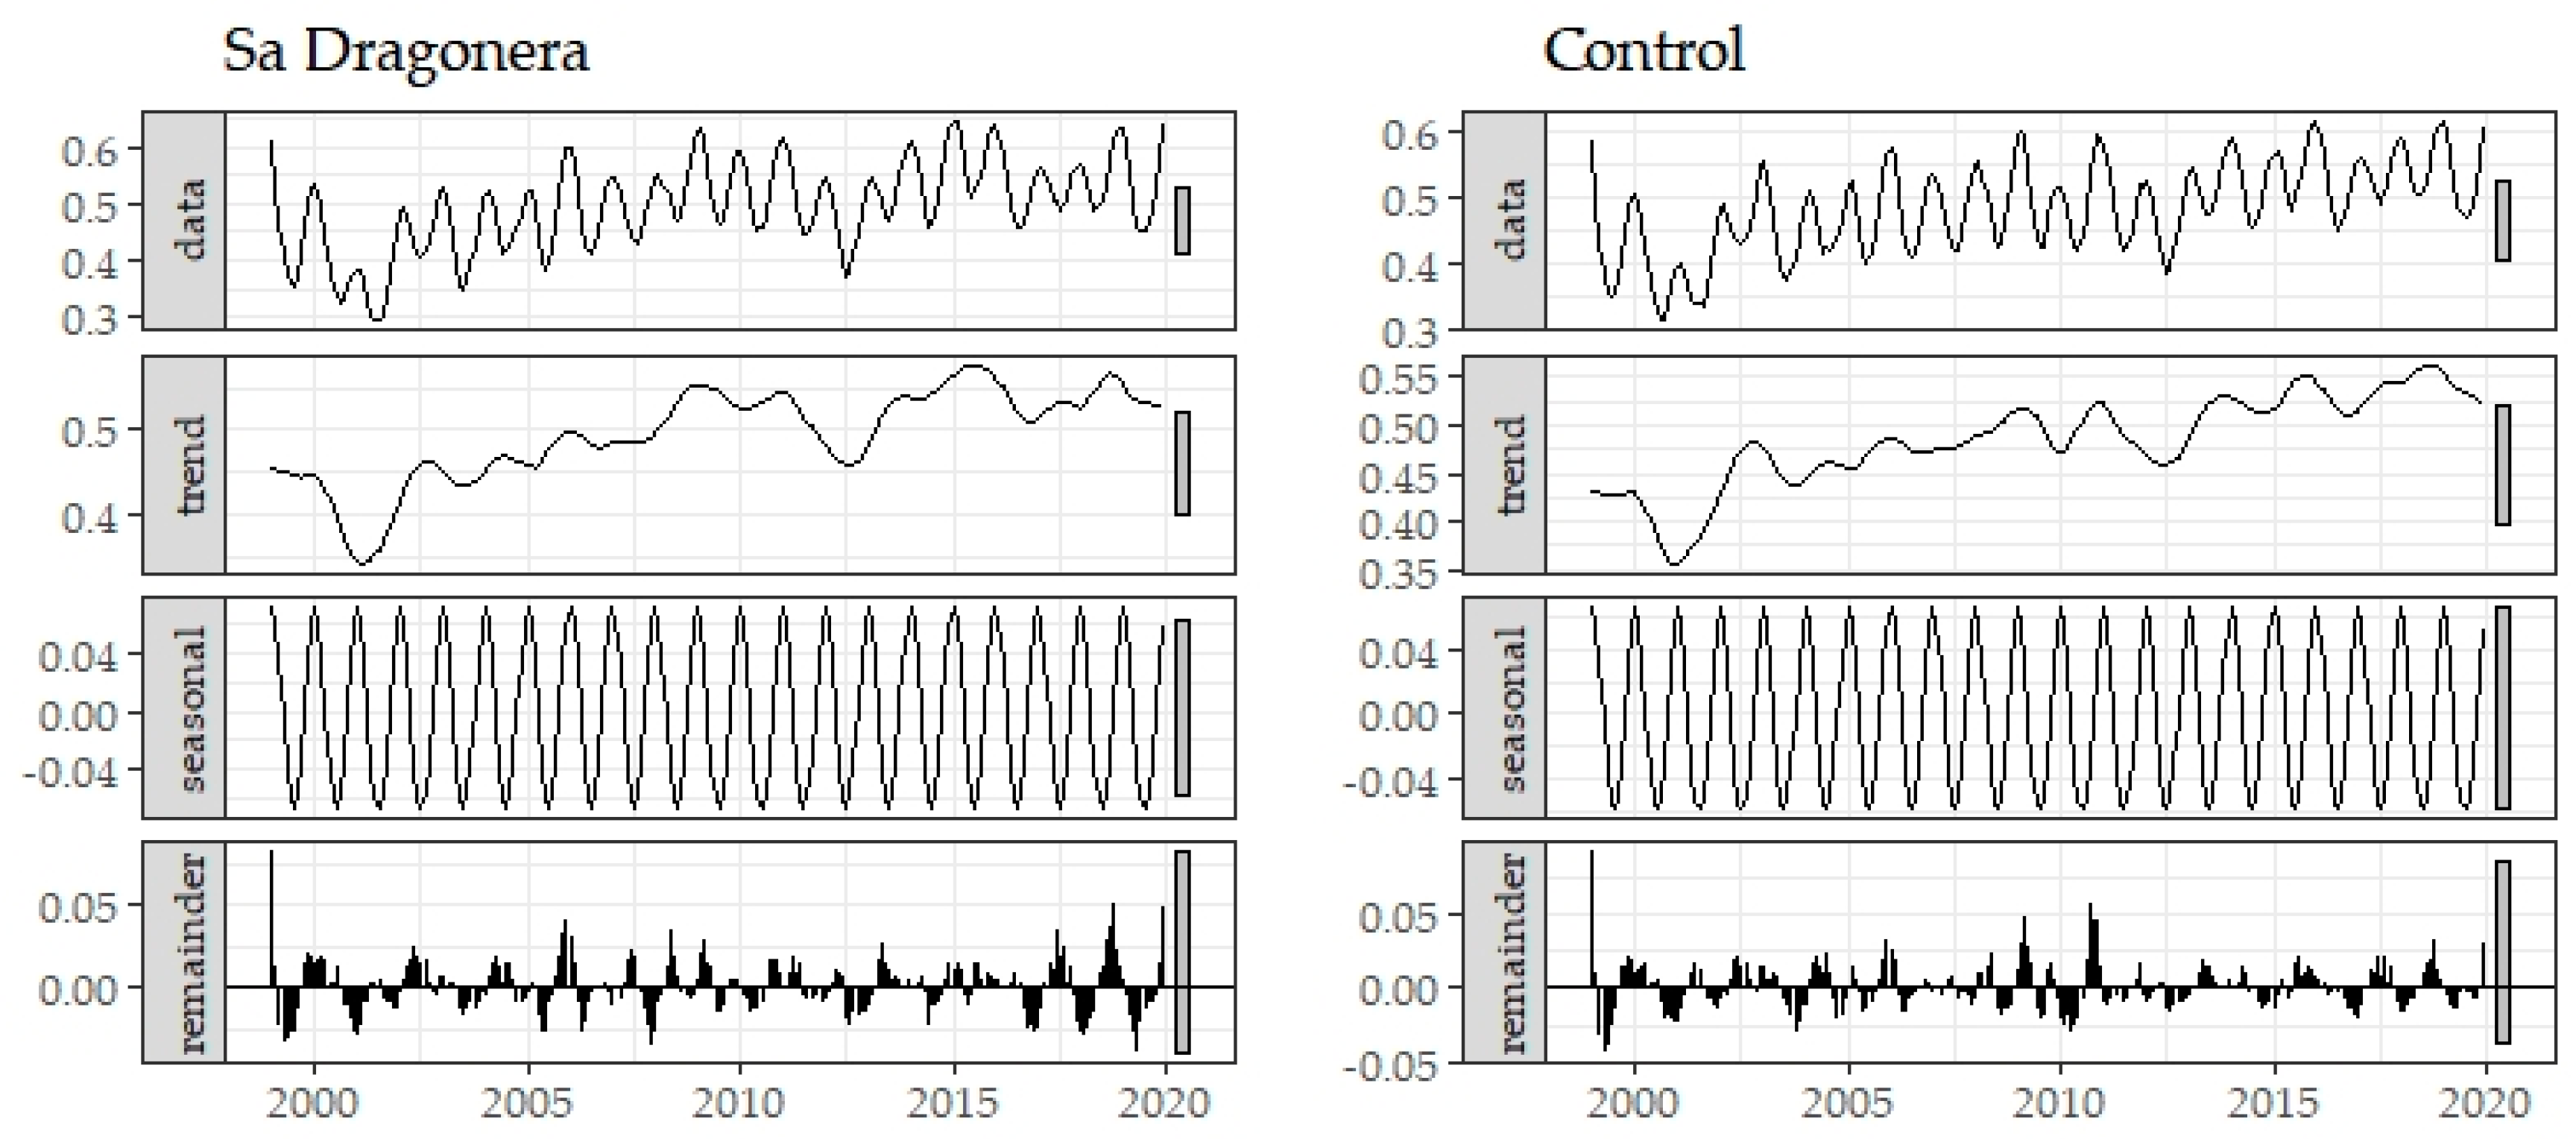
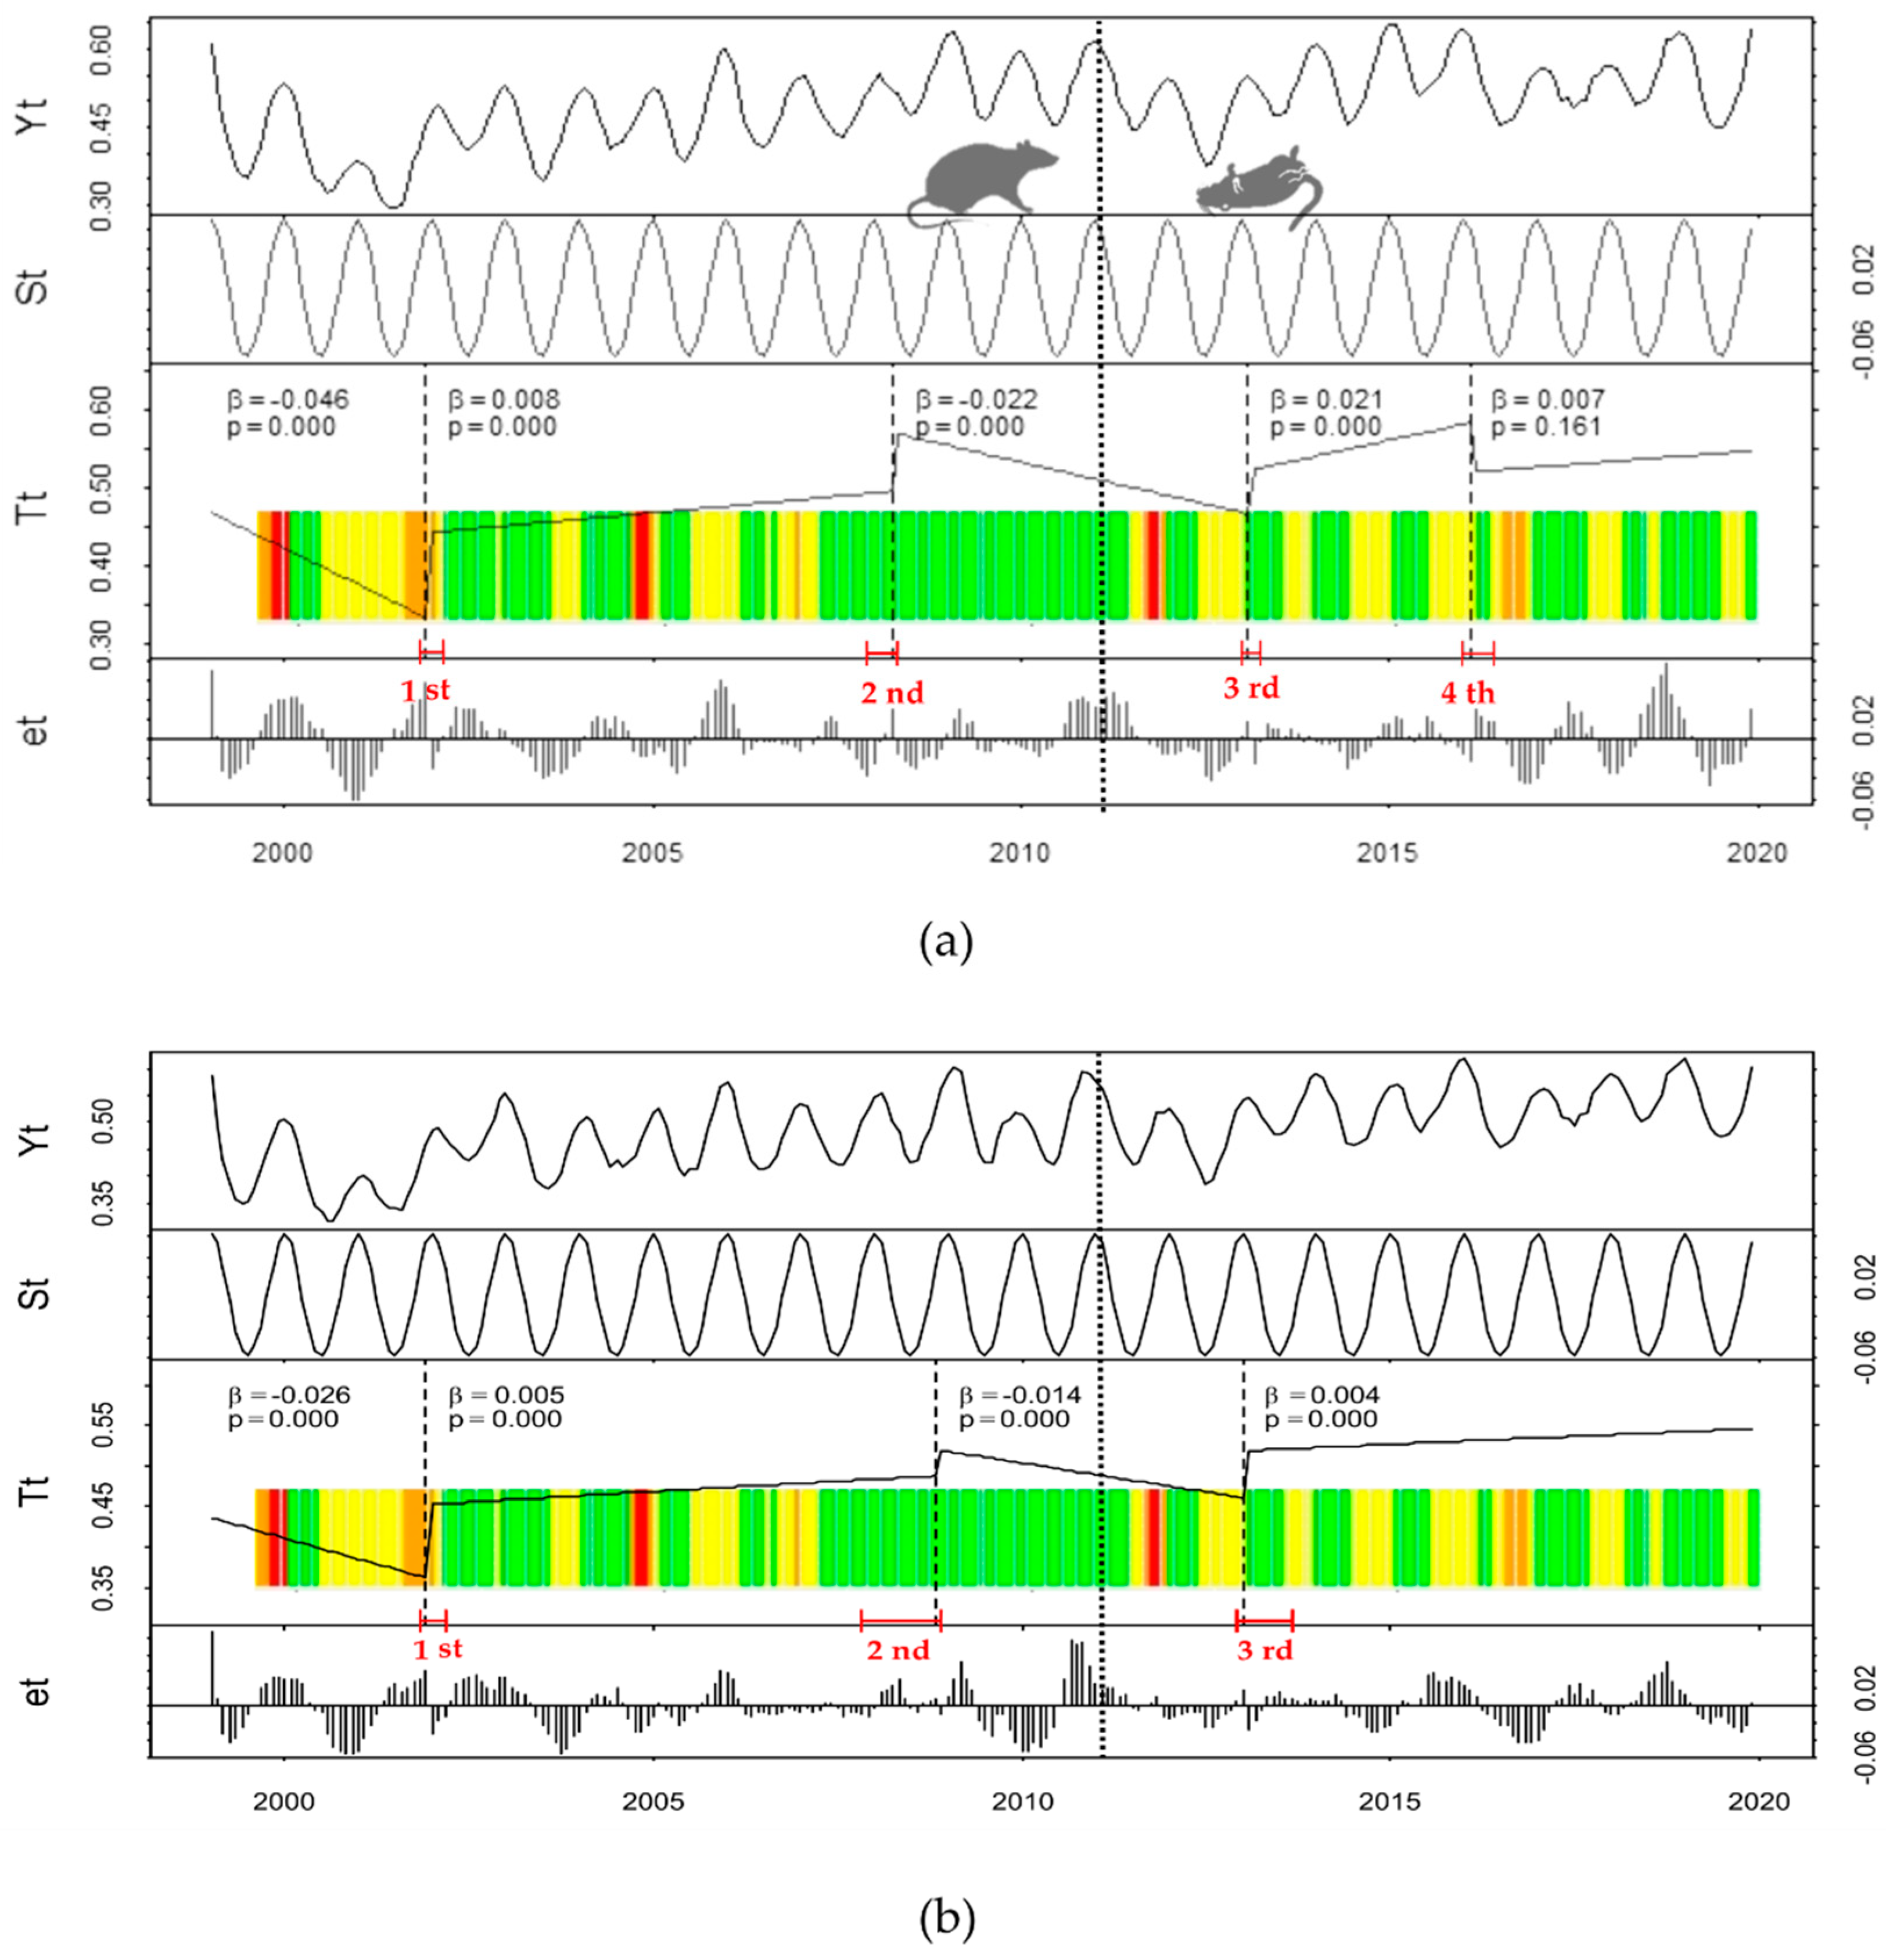
Historical Time Series Results

BFAST decomposed the original NDVI data (Yt) into seasonal (St), trend (Tt) and remainder (et) components (Figure 7). The algorithm identified four breakpoints at both the treatment and control zones in the NDVI trend component (Figure 7a,b, respectively), two of them following the eradication campaign. The seasonal component showed no abrupt changes, and the seasonal amplitude was approximately 0.05 NDVI.
Table 1 summarizes the date of abrupt changes, their magnitude and direction, and the regression parameters of the piecewise model, which provides information about the NDVI on the break date (intercept) and on the recovery rate (slope). The timing of occurrence and the direction of all four abrupt changes were similar for both treatment and control zones, since their breakpoint dates (95% CI) overlapped. All identified breakpoints occurred immediately after environmental disturbances (i.e., anomalies in water resources in this study). In the first and second abrupt changes an increase in NDVI was observed associated with normal hydric states (HDI) arising after recurrent states of alert or emergency. Conversely, the third and fourth abrupt change occurred along with an emergency or alert state just after the observed NDVI values moved between normality and pre-alert states of water resources. The magnitudes observed at the four breakpoints were always higher for treatment zone than for the control zone (Table 1).
Likewise, the recovery rates (Slope in Table 1) were of a similar level in all four modeled linear regressions, highlighting that these rates are not higher in the modeled segments of the treatment zone after the rat eradication campaign date.
Together, the BFAST approaches consistently describe the dynamics of the vegetation and show similar shift dates of NDVI between zones, as well as the direction of the changes, and trends of the piecewise models. These results indicate that the variability of rainfall and water reserves were the main factors controlling the vegetation dynamics following the rat eradication campaign as observed in its previous data and in the control zone data. Furthermore, in terms of the magnitude of the changes and the recovery rates observed, there was no relationship between the elimination of rats and the processes of resistance or recovery of the studied vegetation of the islet.

4. Discussion

The presented results indicate that the 2011 rodent eradication campaign in Sa Dragonera Islet (treatment zone) had a negligible effect on the primary production dynamics detected at the Landsat resolution scale. The observed changes in NDVI before and after the eradication campaign appear to be driven by water-related environmental events, which could be deemed characteristic of a Mediterranean system [43,53,55,97]. Positive changes detected are followed by segments with a negative or almost zero recovery rate. These patterns coincide with the transition of HDI from alert or pre-alert prolonged states to states of normality. These vegetation dynamics arise in regions with prolonged periods of water limitation interrupted by wet episodes [54] that may trigger a fast germination of short-lived plants and subsequent increase in NDVI followed by a gradual decrease [50]. Other papers such as [59] have used the visual comparison of the rain patterns with dates of abrupt changes of NDVI to evaluate the BFAST algorithm facing known flood events. In this study, we do not validate the dates of the abrupt changes observed due to hydrological factors, since we do not have enough temporal precision in the dates that categorize the HDI. However, the abrupt and gradual change patterns in the NDVI time series of both treatments is used to reject the hypothesis that deratization drove changes in NDVI.
The comparison between the timing of eradication campaign with the timing of the first break following, indicated that BFAST was unable to detect abrupt changes in vegetation response caused by rat elimination. The gradual NDVI increase shown in the fourth segment in the treatment time series (Figure 7a) could reflect the recovery of the ecosystem. However, the BFAST algorithm indicated a non-significant linear relationship, which may have been a relic of noise rather than the signal [59], resulting in the detection of this abrupt change. It is not believed that this represents the response of the vegetation to the demise of rats. The choice of h parameter influences the decomposition of the time series, affecting the change detection process, which is based on signal-to-noise ratio. It is possible that the low h parameters caused the linear models to fit the noise rather than the signal, resulting in the detection of this abrupt change but being non-significant verifies our interpretation. We considered the optimal value of h = 1/7 following the recommendations of [59]. Values of h lower than 1/8 generated additional changes with non-significant linear fits (for example, it identified negative abrupt breaks in 2011), and values greater than 1/6 generated longer segments, which limited the level of detection detail (here it removed changes detected at the end of 2001). No seasonal changes were detected, however Seasonal-Trend decomposition (STL) showed that a seasonal component was present in the time series, therefore it was convenient to remove seasonal effects before analyzing the long-term trends.
The BFAST method dates and quantifies the changes in vegetation from global to local scale, which can be geolocated pixel by pixel at the satellite spatial resolution [43,55]. Often studies using BFAST validate results by prior knowledge of the study area or by subsequent field visits. Our study, however, has been carried out in an entirely remote manner where the NDVI refer to averaged pixels from the sample plots selected under strict spatial criteria, rather than to geolocated pixels. Thus, changes detected characterize the dynamics on the targeted area over time. Averaged pixels allow comparison of the time series of the study area with that of a control zone, where sampling plots that follow similar dynamics could be selected. By doing this the study overcomes the lack of information available about the previous state of the rodenticide campaign.
The presented results do, however, demonstrate that using BFAST is a suitable approach to detect abrupt and gradual changes in NDVI, for example due to the effects of rodenticide campaigns which are known to lead to recovery of vegetation productivity. Within the treatment zone the BFAST model dates and quantifies the NDVI abnormal behavior, considering seasonal variations In this study, we cannot conclusively attribute NDVI recovery, detectable on a 30m spatial scale across the treatment zone, to the eradication campaign, particularly as meteorological drivers in such settings are evident as the dominant influence.
The recovery of an island ecosystem invaded by rats must necessarily begin with their eradication. However, the time and rate of recovery depends on multiple factors such as the frequency, severity and duration of the impacts. There are some studies that have reported the recovery of the vegetation cover in deratized islands through field work, but in an extension and magnitude appreciable by the Landsat sensors. For example, eight years after the deratization of a small island in the Indian Ocean, they reported, through field work, an increase in vegetation cover (from 30% to 70%) validated through aerial images. However, it was due only to the regeneration of the herbaceous stratus [29]. In a study to assess rodent eradication in the Montebello archipelago, Western Australia, vegetation density was monitored for 26 years with Landsat images [34], and the authors reported a trend of vegetation recovery on the islands just two years after rat eradication. Interestingly, and converse to the findings of our study, they observed that the positive relationship typically exhibited between precipitation and vegetation cover was nullified in the rat-infested islands [34].
That said, in the case of Sa Dragonera Islet, some signs of recovery have been described such as the presence of new plant species, the greater presence of other plants that were previously rare, or the greater abundance of arthropods [78].
The original hypothesis suggests the greening of vegetation, especially considering that plants can keep sprouts (and hence NDVI increment) after rat browsing demise. However, our results reflect the lack of change to primary production.
It appears likely that the lack of rat herbivory pressure that could lead to higher plant recruitment and increase in existing plant biomass, did not translate into an abrupt change in the NDVI time series; and that the NDVI values recorded in the Mediterranean ecosystem, before and after the eradication campaign, are principally driven by water-related environmental events. The remote sensing record would therefore offer no signs of long-term recovery.
The vegetation of Sa Dragonera Islet and Mallorca Island exhibit a long history of permanent pressures by natural and domestic animals plus recurrent natural and human-induced fires [79,80]. The herbivorous mammals such as Myotragus balearicus lived in Baleares archipelago till its extinction shortly before the introduction of goats 4000 years ago [98]. Feral goats are currently common in Mallorca Island and they were also in Sa Dragonera Islet until its eradication in 1975 [69,70]. Thus, it could be suggested that the prolonged coexistence of the dominant plant taxa with herbivores in Baleares archipelago, might explain the resistance of vegetation dynamics to herbivory by rats in Dragonera Islet.
Ecosystem recovery is complex and involves cascading processes, and, when it has been severely impacted, recovery could take thousands of years [99,100]. Thus, the absence of remotely detectable NDVI recovery in the treatment zone may be due to the action of disturbance within an environment with inherently stressful conditions (e.g., xeric environment). The presence of black rats could go back several centuries [17] and contribute to disturbance through extremely high population densities. That, combined with historical anthropogenic activity make the islet ecosystem particularly susceptible to land degradation [101]. Therefore, due to an intense and prolonged disturbance the ecosystem compositions could have drastically changed, resulting in a limited recovery following removal of an early driver of degradation in the location [17,30,102,103].
Alternatively, the null response of the vegetation could be due to the fact that the pressure exerted by rats on the plants is not sufficiently high to impact the primary productivity of the island and therefore the recorded NDVI. It could be argued that the ecosystem tolerates the rat herbivore in an already naturally stressed environment [67,104], with most of the dominant plants in the landscape also being sprouting species adapted to browsing and associated disturbance [65,66,67,104]. To assume or discard this option, it would be necessary to have more detailed information on the situation prior to the arrival of the rats on the islet. Likewise, more detailed data on the influence of rats on the richness of plant species, growth rates and periods, seed production, and the consequent population recruitment on the islet would prove vital to deeper functional understanding.
Although records of the ecological past of the islet are sparsely available and limited, the evolution of the ecosystem following elimination of the rats can be monitored in this manner to determine long term trends. The effects of rats on the structure of vegetation are sufficiently reported in the literature, however monitoring eradication outcomes is sporadic and limited [32,35,40], and pre-management data is usually lacking [38]. Hence, this satellite-driven approach represents a consistent methodology that is critical to understanding the ongoing and evolving dynamics of island ecosystems following rat eradication.

5. Conclusions

This study is the first of its kind to examine the effectiveness of remote sensing and BFAST timeseries analysis in island ecosystems post black rat eradication. Given the general lack of reports assessing the effect of rat eradication on island ecosystems, a satellite approach to assess changes in vegetation productivity over time is proposed. Addressing this generalized information gap, the BFAST model is found to be an appropriate tool to monitor NDVI time series due to its sensitivity to reflect the long-term and short-term changes in vegetation growth at local scales accurately. To interpret the changes found, a 21-year time series of NDVI data extracted from satellite images was analyzed and compared with hydrological data, which was found to be the likely driver of NDVI changes in water limited environments as is the case for our study area. These climatological influences are deemed to mask the detectable effects of rat eradication in remotely sensed NDVI data.
The BFAST results reveal that the primary production in the treatment area is sensitive to water cycles but not immediately to cessation of rat activity. In the short term there was no abrupt increase in vegetation primary productivity as a response to the cessation of rat browsing with this significant ecological event being overshadowed by the state of water emergency that occurred close to the time of the eradication campaign. Nor were changes observed in the long term, since facing the aforementioned environmental stress events, the recovery rates in the treatment zone did not overcome those found in the control zone, rather, they continued to show similar trends. Changes may have only occurred at a small spatial scale, as evidenced by the reported field observations of the anecdotal studies in the area. Thus, given the spatial resolution of the core satellite data these changes had little impact on the averaged NDVI produced over the islet. Unlike other studies, changes were not widespread over the island’s surface, so it is not possible to detect them at the scale at which Landsat sensors record. We suggest that the non-response of NDVI to rat eradication on Dragonera Islet is due to a high resistance of vegetation to rat predation achieved during a long period of colonization in an already naturally stressed environment.

Author Contributions

Conceptualization: M.I.-Á., E.B., J.A.C., C.R., J.B., and E.S.; formal analysis: M.I.-Á., P.F.S., and E.S.; funding acquisition: E.S.; methodology: M.I.-Á., J.A.C., M.B., N.G.B. and E.S.; writing—original draft: M.I.-Á., P.F.S., J.A.C., E.B. and E.S.; writing—review and editing: M.I.-Á., P.F.S., J.A.C., C.R., M.B., N.G.B., E.B., J.B. and E.S.; All authors have read and agreed to the published version of the manuscript.

Funding

This article has been supported by the Spanish Ministry of Science through the INCREMENTO coordinated project (RTI2018-094202-BC21 and RTI2018-094202-A-C22), ES was funded by the Spanish Ministerio de Economia y Competitividad (MINECO) through a Ramon y Cajal agreement (RYC-2016-21120). Author M.I.-Á. was supported by PhD fellowships CGL2015-70449-R/BES-2016 from Ministerio de Economía y Competitividad (MINECO, Spain).

Institutional Review Board Statement

Not applicable.

Informed Consent Statement

Not applicable.

Data Availability Statement

The data presented in this study are available on request from the corresponding author. The data are not publicly available due to the data size.

Conflicts of Interest

The authors declare no conflict of interest.

References

  1. Richardson, D.M.; Pyšek, P.; Carlton, J.T. A Compendium of Essential Concepts and Terminology in Invasion Ecology. In Fifty Years Invasion Ecology: The Legacy of Charles Elton; WILEY: Hoboken, NJ, USA, 2011; pp. 409–420. [Google Scholar]
  2. Dukes, J.S.; Mooney, H.A. Does global change increase the success of biological invaders? Trends Ecol. Evol. 1999, 14, 135–139. [Google Scholar] [CrossRef]
  3. Berger, J.J. Ecological Restoration and Nonindigenous Plant Species: A Review. Restor. Ecol. 1993, 1, 74–82. [Google Scholar] [CrossRef]
  4. Tsutsumida, N.; Saizen, I.; Matsuoka, M.; Ishii, R. Land cover change detection in Ulaanbaatar using the breaks for additive seasonal and trend method. Land 2013, 2, 534–549. [Google Scholar] [CrossRef]
  5. Vilà, M. Efectos de la introducción de especies vegetales en el funcionamiento de los ecosistemas terrestres. Montes 1999, 55, 26–30. [Google Scholar]
  6. Tershy, B.R.; Shen, K.W.; Newton, K.M.; Holmes, N.D.; Croll, D.A. The importance of islands for the protection of biological and linguistic diversity. Bioscience 2015, 65, 592–597. [Google Scholar] [CrossRef] [Green Version]
  7. Towns, D.R.; Atkinson, I.A.E.; Daugherty, C.H. Have the harmful effects of introduced rats on islands been exaggerated? Biol. Invasions 2006, 8, 863–891. [Google Scholar] [CrossRef]
  8. Howald, G.; Donlan, C.J.; Galván, J.P.; Russell, J.C.; Parkes, J.; Samaniego, A.; Wang, Y.; Veitch, D.; Genovesi, P.; Pascal, M.; et al. Invasive rodent eradication on islands. Conserv. Biol. 2007, 21, 1258–1268. [Google Scholar] [CrossRef] [PubMed]
  9. Capizzi, D.; Bertolino, S.; Mortelliti, A. Rating the rat: Global patterns and research priorities in impacts and management of rodent pests. Mamm. Rev. 2014, 44, 148–162. [Google Scholar] [CrossRef]
  10. Cheylan, G. Prédation du rat noir Rattus rattus sur les oiseaux de mer qui nichent dans les îles méditerranéennes. Ann. Crop 1985, 2, 27–29. [Google Scholar]
  11. Igual, J.M.; Forero, M.G.; Gomez, T.; Orueta, J.F.; Oro, D. Rat control and breeding performance in Cory’s shearwater (Calonectris diomedea): Effects of poisoning effort and habitat features. Anim. Conserv. 2006, 9, 59–65. [Google Scholar] [CrossRef]
  12. Atkinson, I.A. The spread of commensal species of Rattus to oceanic islands and their effects on island avifaunas. ICPB Tech Publ. 1985, 3, 35–81. [Google Scholar]
  13. Russell, J.C.; Holmes, N.D. Tropical Island conservation: Rat eradication for species recovery. Biol. Conserv. 2015, 185, 1–7. [Google Scholar] [CrossRef]
  14. Ruffino, L.; Russell, J.; Vidal, E. Anthropogenic subsidies mitigate environmental variability for insular rodents. Oecologia 2013, 172, 737–749. [Google Scholar] [CrossRef] [PubMed]
  15. Harper, G.; Rutherford, M. Home range and population density of black rats (Rattus rattus) on a seabird island: A case for a marine subsidised effect? N. Z. J. Ecol. 2016, 40, 219–228. [Google Scholar] [CrossRef] [Green Version]
  16. Oppel, S.; McClelland, G.T.W.; Lavers, J.L.; Churchyard, T.; Donaldson, A.; Duffield, N.; Havery, S.; Kelly, J.; Proud, T.; Russell, J.C.; et al. Seasonal variation in movements and survival of invasive Pacific rats on sub-tropical Henderson Island: Implications for eradication. In Proceedings of the 21st International Conference on Aquatic Invasive Species, Montreal, QC, Canada, 27–31 October 2019; pp. 200–208. [Google Scholar]
  17. Ruffino, L.; Bourgeois, K.; Vidal, E.; Duhem, C.; Paracuellos, M.; Escribano, F.; Sposimo, P.; Baccetti, N.; Pascal, M.; Oro, D. Invasive rats and seabirds after 2000 years of an unwanted coexistence on Mediterranean islands. Biol. Invasions 2009, 11, 1631–1651. [Google Scholar] [CrossRef] [Green Version]
  18. Martin, J.L.; Thibault, J.C.; Bretagnolle, V. Black rats, island characteristics, and colonial nesting birds in the Mediterranean: Consequences of an ancient introduction. Conserv. Biol. 2000, 14, 1452–1466. [Google Scholar] [CrossRef]
  19. Traveset, A.; Nogales, M.; Alcover, J.A.; Delgado, J.D.; López-Darias, M.; Godoy, D.; Igual, J.M.; Bover, P. A review on the effects of alien rodents in the Balearic (western Mediterranean sea) and Canary islands (eastern Atlantic ocean). Biol. Invasions 2009, 11, 1653–1670. [Google Scholar] [CrossRef]
  20. Russell, J.C.; Jones, H.P.; Armstrong, D.P.; Courchamp, F.; Kappes, P.J.; Seddon, P.J.; Oppel, S.; Rauzon, M.J.; Cowan, P.E.; Rocamora, G.; et al. Importance of lethal control of invasive predators for island conservation. Conserv. Biol. 2016, 30, 670–672. [Google Scholar] [CrossRef] [PubMed]
  21. Campbell, D.J.; Atkinson, I.A.E. Effects of kiore (Rattus exulans Peale) on recruitment of indigenous coastal trees on northern offshore islands of New Zealand. J. R. Soc. N. Z. 1999, 29, 290. [Google Scholar] [CrossRef] [Green Version]
  22. Borchert, M.I.; Jain, S.K. The effect of rodent seed predation on four species of California annual grasses. Oecologia 1978, 33, 101–113. [Google Scholar] [CrossRef]
  23. Shiels, A.B. Ecology and Impacts of Introduced Rodents (Rattus spp. and Mus Musculus) in the Hawaiian Islands. Ph.D. Thesis, University of Hawaii at Manoa, Honolulu, HI, USA, 2010. [Google Scholar]
  24. Grant-Hoffman, M.N.; Barboza, P.S. Herbivory in invasive rats: Criteria for food selection. Biol. Invasions 2010, 12, 805–825. [Google Scholar] [CrossRef]
  25. Auld, T.D.; Hutton, I.; Ooi, M.K.J.; Denham, A.J. Disruption of recruitment in two endemic palms on Lord Howe Island by invasive rats. Biol. Invasions 2010, 12, 3351–3361. [Google Scholar] [CrossRef] [Green Version]
  26. Campbell, D.J.; Atkinson, I.A.E. Depression of tree recruitment by the Pacific rat (Rattus exulans Peale) on New Zealand’s northern offshore islands. Biol. Conserv. 2002, 107, 19–35. [Google Scholar] [CrossRef]
  27. Grant-Hoffman, M.N.; Mulder, C.P.; Bellingham, P.J. Effects of invasive rats and burrowing seabirds on seeds and seedlings on New Zealand islands. Oecologia 2010, 162, 1005–1016. [Google Scholar] [CrossRef] [PubMed]
  28. Hunt, T. Rethinking the fall of Easter Island. New evidence points to and alternative explanation for a civilization’s collapse. Am. Sci. 2006, 94, 412–419. [Google Scholar] [CrossRef]
  29. Le Corre, M.; Danckwerts, D.K.; Ringler, D.; Bastien, M.; Orlowski, S.; Morey Rubio, C.; Pinaud, D.; Micol, T. Seabird recovery and vegetation dynamics after Norway rat eradication at Tromelin Island, western Indian Ocean. Biol. Conserv. 2015, 185, 85–94. [Google Scholar] [CrossRef]
  30. Weber, C. Ecological Impacts of Invasive Rat Removal on Mediterranean Sea Islands. Ph.D. Thesis, University of Michigan, Ann Arbor, MI, USA, 2014. [Google Scholar]
  31. Blackburn, T.M.; Cassey, P.; Duncan, R.P.; Evans, K.L.; Gaston, K.J. Avian extinction and mammalian introductions on oceanic islands. Science 2004, 305, 1955–1958. [Google Scholar] [CrossRef] [Green Version]
  32. Jones, H.P. Prognosis for ecosystem recovery following rodent eradication and seabird restoration in an island archipelago. Ecol. Appl. 2010, 20, 1204–1216. [Google Scholar] [CrossRef]
  33. Block, W.M.; Franklin, A.B.; Ward, J.P.; Ganey, J.L.; White, G.C. Design and implementation of monitoring studies to evaluate the success of ecological restoration on wildlife. Restor. Ecol. 2001, 9, 293–303. [Google Scholar] [CrossRef]
  34. Lohr, C.; Van Dongen, R.; Huntley, B.; Gibson, L.; Morris, K. Remotely monitoring change in vegetation cover on the Montebello Islands, Western Australia, in response to introduced rodent eradication. PLoS ONE 2014, 9, e114095. [Google Scholar] [CrossRef] [PubMed] [Green Version]
  35. Bastille-Rousseau, G.; Gibbs, J.P.; Campbell, K.; Yackulic, C.B.; Blake, S. Ecosystem implications of conserving endemic versus eradicating introduced large herbivores in the Galapagos Archipelago. Biol. Conserv. 2017, 209, 1–10. [Google Scholar] [CrossRef] [Green Version]
  36. Graham, M.F.; Veitch, C.R. Changes in Bird Numbers on Tiritiri Matangi Island, New Zealand, Over the Period of Rat Eradication. In Turning the Tide, The Eradication of Invasive Species; IUCN Species Survival. Commission: Gland, Switzerland, 2002; pp. 120–123. [Google Scholar]
  37. McClelland, P.J. Eradication of Pacific rats (Rattus exulans) from Whenua Hou Nature Reserve (Codfish Island), Putauhinu and Rarotoka Islands, New Zealand. Turning the Tide, The Eradication of Invasive Species; IUCN Species Survival. Commission: Gland, Switzerland, 2002; pp. 173–181. [Google Scholar]
  38. Towns, D.R.; Atkinson, I.A.E.; Daugherty, C.H. Reconstructing the Ambiguous: Can Island Ecosystems be Restored. In Ecological Restoration of New Zealand Islands; Department of Conservation: Wellington, New Zealand, 1990. [Google Scholar]
  39. Schweizer, D.; Jones, H.P.; Holmes, N.D. Literature Review and Meta-Analysis of Vegetation Responses to Goat and European Rabbit Eradications on Islands. Pac. Sci. 2016, 70, 55–71. [Google Scholar] [CrossRef]
  40. Jones, H.P.; Holmes, N.D.; Butchart, S.H.M.; Tershy, B.R.; Kappes, P.J.; Corkery, I.; Aguirre-Muñoz, A.; Armstrong, D.P.; Bonnaud, E.; Burbidge, A.A.; et al. Invasive mammal eradication on islands results in substantial conservation gains. Proc. Natl. Acad. Sci. USA 2016, 113, 4033–4038. [Google Scholar] [CrossRef] [PubMed] [Green Version]
  41. Pettorelli, N.; Safi, K.; Turner, W. Satellite remote sensing, biodiversity research and conservation of the future. Philos. Trans. R. Soc. B Biol. Sci. 2014, 369. [Google Scholar] [CrossRef]
  42. Sader, S.A.; Jin, S. MODIS time-series imagery for forest disturbance detection and quantification of patch size effects Article in Remote Sensing of Environment December 2005 SEE PROFILE MODIS time-series imagery for forest disturbance detection and quantification of patch size effects. Remote Sens. Environ. 2005, 99, 462–470. [Google Scholar] [CrossRef]
  43. Verbesselt, J.; Hyndman, R.; Newnham, G.; Culvenor, D. Detecting trend and seasonal changes in satellite image time series. Remote Sens. Environ. 2010, 114, 106–115. [Google Scholar] [CrossRef]
  44. Pettorelli, N.; Vik, J.O.; Mysterud, A.; Gaillard, J.M.; Tucker, C.J.; Stenseth, N.C. Using the satellite-derived NDVI to assess ecological responses to environmental change. Trends Ecol. Evol. 2005, 20, 503–510. [Google Scholar] [CrossRef]
  45. Sellers, P.J. Canopy reflectance, photosynthesis and transpiration. Int. J. Remote Sens. 1985, 6, 1335–1372. [Google Scholar] [CrossRef]
  46. Reed, B.C.; Brown, J.F.; VanderZee, D.; Loveland, T.R.; Merchant, J.W.; Ohlen, D.O. Measuring phenological variability from satellite imagery. J. Veg. Sci. 1994, 5, 703–714. [Google Scholar] [CrossRef]
  47. Running, S.W. Estimating Terrestrial Primary Productivity by Combining Remote Sensing and Ecosystem Simulation. In Remote Sensing of Biosphere Functioning; Springer: New York, NY, USA, 1990; pp. 65–86. [Google Scholar]
  48. Myneni, R.B.; Hall, F.G.; Sellers, P.J.; Marshak, A.L. The interpretation of spectral vegetation indexes. IEEE Trans. Geosci. Remote Sens. 2019, 33, 481–486. [Google Scholar] [CrossRef]
  49. Potter, C.; Tan, P.N.; Steinbach, M.; Klooster, S.; Kumar, V.; Myneni, R.; Genovese, V. Major disturbance events in terrestrial ecosystems detected using global satellite data sets. Glob. Chang. Biol. 2003, 9, 1005–1021. [Google Scholar] [CrossRef] [Green Version]
  50. De Jong, R.; Verbesselt, J.; Zeileis, A.; Schaepman, M.E. Shifts in global vegetation activity trends. Remote Sens. 2013, 5, 1117–1133. [Google Scholar] [CrossRef] [Green Version]
  51. Gaitán, J.J.; Bran, D.; Oliva, G.; Ciari, G.; Nakamatsu, V.; Salomone, J.; Ferrante, D.; Buono, G.; Massara, V.; Humano, G.; et al. Evaluating the performance of multiple remote sensing indices to predict the spatial variability of ecosystem structure and functioning in Patagonian steppes. Ecol. Indic. 2013, 34, 181–191. [Google Scholar] [CrossRef]
  52. Helman, D.; Mussery, A.; Lensky, I.M.; Leu, S. Detecting changes in biomass productivity in a different land management regimes in drylands using satellite-derived vegetation index. Soil Use Manag. 2014, 30, 32–39. [Google Scholar] [CrossRef]
  53. Alcaraz-Segura, D.; Cabello, J.; Paruelo, J. Baseline characterization of major Iberian vegetation types based on the NDVI dynamics. Plant Ecol. 2008, 202, 13–29. [Google Scholar] [CrossRef]
  54. Vicente-Serrano, S.M.; Gouveia, C.; Camarero, J.J.; Beguería, S.; Trigo, R.; López-Moreno, J.I.; Azorín-Molina, C.; Pasho, E.; Lorenzo-Lacruz, J.; Revuelto, J.; et al. Response of vegetation to drought time-scales across global land biomes. Proc. Natl. Acad. Sci. USA 2013, 110, 52–57. [Google Scholar] [CrossRef] [Green Version]
  55. Verbesselt, J.; Zeileis, A.; Herold, M. Near real-time disturbance detection using satellite image time series. Remote Sens. Environ. 2012, 123, 98–108. [Google Scholar] [CrossRef]
  56. Geng, L.; Che, T.; Wang, X.; Wang, H. Detecting spatiotemporal changes in vegetation with the BFAST model in the Qilian Mountain region during 2000–2017. Remote Sens. 2019, 11, 103. [Google Scholar] [CrossRef] [Green Version]
  57. Gillespie, T.W.; Ostermann-Kelm, S.; Dong, C.; Willis, K.S.; Okin, G.S.; MacDonald, G.M. Monitoring changes of NDVI in protected areas of southern California. Ecol. Indic. 2018, 88, 485–494. [Google Scholar] [CrossRef]
  58. Fang, X.; Zhu, Q.; Ren, L.; Chen, H.; Wang, K.; Peng, C. Large-scale detection of vegetation dynamics and their potential drivers using MODIS images and BFAST: A case study in Quebec, Canada. Remote Sens. Environ. 2018, 206, 391–402. [Google Scholar] [CrossRef]
  59. Watts, L.M.; Laffan, S.W. Effectiveness of the BFAST algorithm for detecting vegetation response patterns in a semi-arid region. Remote Sens. Environ. 2014, 154, 234–245. [Google Scholar] [CrossRef]
  60. Bernardino, P.N.; De Keersmaecker, W.; Fensholt, R.; Verbesselt, J.; Somers, B.; Horion, S. Global-scale characterization of turning points in arid and semi-arid ecosystem functioning. Glob. Ecol. Biogeogr. 2020, 29, 1230–1245. [Google Scholar] [CrossRef] [Green Version]
  61. Chen, L.; Michishita, R.; Xu, B. Abrupt spatiotemporal land and water changes and their potential drivers in Poyang Lake, 2000-2012. ISPRS J. Photogramm. Remote Sens. 2014, 98, 85–93. [Google Scholar] [CrossRef]
  62. Spanish Meteorology Agency—AEMET Government of Spain. 2021. Available online: http://www.aemet.es/ (accessed on 25 February 2021).
  63. Ginés, Á.; Ginés, J.; Gómez-Pujol, L.; Onac, B.; Fornós, J. Mallorca: A Mediterranean Benchmark for Quaternary Studies; Societat d’Història Natural de les Balears: Palma, Spain, 2012. [Google Scholar]
  64. Vogiatzakis, I.N.; Pungetti, G.; Mannion, A.M. Mediterranean Island Landscapes: Natural and Cultural Approaches; Springer Science & Business Media: Berlin/Heidelberg, Germany, 2008; Volume 9. [Google Scholar]
  65. Focardi, S.; Tinelli, A. Herbivory in a Mediterranean forest: Browsing impact and plant compensation. Acta Oecologica 2005, 28, 239–247. [Google Scholar] [CrossRef]
  66. Bashan, D.; Bar-Massada, A. Regeneration dynamics of woody vegetation in a Mediterranean landscape under different disturbance-based management treatments. Appl. Veg. Sci. 2017, 20, 106–114. [Google Scholar] [CrossRef]
  67. Dell, B.; Hopkins, A.J.; Lamont, B.B. Resilience at the Level of the Plant Community. In Resilience in Mediterranean-Type Ecosystems; Springer Netherlands: Dordrecht, The Netherlands, 1986; Volume 16. [Google Scholar]
  68. Morey, M.; Ruiz-Pérez, M. The Balearic Islands. In Mediterranean Island Landscapes; Springer: Dordrecht, The Netherlands, 2008; pp. 271–296. [Google Scholar]
  69. Campbell, K.; Donlan, C.J. Feral Goat Eradications on Islands. Conserv. Biol. 2005, 19, 1362–1374. [Google Scholar] [CrossRef]
  70. Genovesi, P. Eradications of invasive alien species in Europe: A review. Biol. Invasions 2005, 7, 127–133. [Google Scholar] [CrossRef] [Green Version]
  71. Mayol, J.; Mayol, M.; Domenech, O.; Oliver, J.; McMinn, M.; Rodríguez, A. Aerial broadcast of rodenticide on the island of Sa Dragonera (Balearic Islands, Spain). A promising rodent eradication expe-rience on a Mediterranean island. Aliens Invasive Species Bull. 2012, 32, 29–32. [Google Scholar]
  72. Granjon, L.; Cheylan, G.; Duryadi, D.; Piraud, N.; Ganem, G. Premières données sur l’écologie et l’évolution des populations de rats noirs (Rattus rattus L. 1758) des îles Cerbicale (Corse du Sud). Trav. Sci. Parc Nat. Régional Réserves Nat. Corse 1992, 39, 97–111. [Google Scholar]
  73. NATURA 2000 Standard Data Form. Available online: https://natura2000.eea.europa.eu/natura2000/SDF.aspx?site=ES0000221 (accessed on 24 February 2021).
  74. Ministry of the Environment and Territory—Baleares Islands Government. Plan Rector de Uso y Gestión (PRUG). Plan for Use and Management of the Natural Park of sa Dragonera. Order of the Minister of the Environment of June 8, 2001, Approving the Master. (BOIB No. 73 of June 19, 2001). Available online: https://www.caib.es/sites/espaisnaturalsprotegits/ca/parc_natural_de_sa_dragonera-21716/ (accessed on 24 February 2021).
  75. Mcminn, M.; Sevilla, G.; Rodríguez, A.; Pons, G.X. Verificación de la presencia de roedores en el Parque Natural de sa Dragonera. Bolletí Soc. D’història Nat. Balear. 2017, 60, 171–192. [Google Scholar]
  76. Grivé, M.M. Acciones con Aves Marinas 2010 Phalacrocorax Aristotelis Cormorán Moñudo Acciones Aves Marinas 2009 Phalacrocorax Aristotelis Cormorán Moñudo; Skua Gabinet d’estudis ambientals S.L.P: Palma de Mallorca, Spain, 2010; pp. 1–13. [Google Scholar]
  77. Russell, J.C.; Beaven, B.M.; Mackay, J.W.B.; Towns, D.R.; Clout, M.N. Testing island biosecurity systems for invasive rats. Wildl. Res. 2008. [Google Scholar] [CrossRef]
  78. Aomar, G.; Mayol, M.; González, J.M. Notes naturalístiques del parc natural de sa Dragonera (2011-2014). Monogr. Soc. d’Historia Nat. Balear. 2015, 2015, 355–358. [Google Scholar]
  79. Alcover, J.A.; Alcover, J.A. The First Mallorcans: Prehistoric Colonization in the Western Mediterranean. J. World Prehistory 2008, 21, 19–84. [Google Scholar] [CrossRef] [Green Version]
  80. Seguí, B.; Payeras, L.; Ramis, D.; Martínez, A.; Delgado, J.V.; Quiroz, J. La cabra salvaje mallorquina: Origen, genética, morgología, notas ecológicas e implicaciones taxonómicas. Bolleti Soc. d’Historia Nat. Balear. 2005, 48, 121–151. [Google Scholar]
  81. USGS. Landsat 7 Science Data Users Handbook; USGS: Reston, VA, USA, 1998.
  82. Gutman, G.G. Vegetation indices from AVHRR: An update and future prospects. Remote Sens. Environ. 1991, 35, 121–136. [Google Scholar] [CrossRef]
  83. Hijmans, R.J. Raster: Geographic Data Analysis and Modeling. Cran. 2021. R Package Version 3.5-9. Available online: https://CRAN.R-project.org/package=raster (accessed on 24 February 2021).
  84. R Core Team. R: A Language and Environment for Statistical Computing; R Foundation for Statistical Computing: Vienna, Austria, 2021. [Google Scholar]
  85. Gromny, E.; Lewiński, S.; Rybicki, M.; Malinowski, R.; Krupiński, M.; Nowakowsk, A.; Jenerowicz, M. Creation of training dataset for Sentinel-2 land cover classification. In Proceedings of the Photonics Applications in Astronomy, Communications, Industry, and High-Energy Physics Experiments, Wilga, Poland, 26 May–2 June 2019; p. 106. [Google Scholar]
  86. North, M.A. A method for implementing a statistically significant number of data classes in the Jenks algorithm. In Proceedings of the 6th International Conference on Fuzzy Systems and Knowledge Discovery, Tianjin, China, 14–16 August 2009; pp. 35–38. [Google Scholar]
  87. Thomas, W. A three-dimensional model for calculating reflection functions of inhomogeneous and orographically structured natural landscapes. Remote Sens. Environ. 1997, 59, 44–63. [Google Scholar] [CrossRef]
  88. Verbesselt, J.; Jönsson, P.; Lhermitte, S.; Van Aardt, J.; Coppin, P. Evaluating satellite and climate data-derived indices as fire risk indicators in savanna ecosystems. IEEE Trans. Geosci. Remote Sens. 2006, 44, 1622–1632. [Google Scholar] [CrossRef]
  89. Chen, J.; Jönsson, P.; Tamura, M.; Gu, Z.; Matsushita, B.; Eklundh, L. A simple method for reconstructing a high-quality NDVI time-series data set based on the Savitzky-Golay filter. Remote Sens. Environ. 2004, 91, 332–344. [Google Scholar] [CrossRef]
  90. Zeng, L.; Wardlow, B.D.; Xiang, D.; Hu, S.; Li, D. A review of vegetation phenological metrics extraction using time-series, multispectral satellite data. Remote Sens. Environ. 2020, 237. [Google Scholar] [CrossRef]
  91. Stanimirova, R.; Cai, Z.; Melaas, E.K.; Gray, J.M.; Eklundh, L.; Jönsson, P.; Friedl, M.A. An empirical assessment of the MODIS land cover dynamics and TIMESAT land surface phenology algorithms. Remote Sens. 2019, 11, 2201. [Google Scholar] [CrossRef] [Green Version]
  92. Kennedy, R.E.; Andréfouët, S.; Cohen, W.B.; Gómez, C.; Griffiths, P.; Hais, M.; Healey, S.P.; Helmer, E.H.; Hostert, P.; Lyons, M.B.; et al. Bringing an ecological view of change to Landsat-based remote sensing. Front. Ecol. Environ. 2014, 12, 339–346. [Google Scholar] [CrossRef]
  93. Funk, C.; Budde, M.E. Phenologically-tuned MODIS NDVI-based production anomaly estimates for Zimbabwe. Remote Sens. Environ. 2009, 113, 115–125. [Google Scholar] [CrossRef]
  94. Vrieling, A.; de Beurs, K.M.; Brown, M.E. Variability of African farming systems from phenological analysis of NDVI time series. Clim. Chang. 2011, 109, 455–477. [Google Scholar] [CrossRef] [Green Version]
  95. Conselleria medi ambient i pesca, Direcció General Recurs Hídrics. Plan Especial de Actuación en Situaciones de Alerta y Eventual Sequía; Direcció General Recurs Hídrics: Palma de Malloca, Spain, 2017. [Google Scholar]
  96. von Keyserlingk, J.; de Hoop, M.; Mayor, A.G.; Dekker, S.C.; Rietkerk, M.; Foerster, S. Resilience of vegetation to drought: Studying the effect of grazing in a Mediterranean rangeland using satellite time series. Remote Sens. Environ. 2021, 255, 112270. [Google Scholar] [CrossRef]
  97. Verbesselt, J.; Hyndman, R.; Zeileis, A.; Culvenor, D. Phenological change detection while accounting for abrupt and gradual trends in satellite image time series. Remote Sens. Environ. 2010, 114, 2970–2980. [Google Scholar] [CrossRef] [Green Version]
  98. Alcover, J.A.; Perez-Obiol, R.; Yll, E.-I.; Bover, P. The diet of Myotragus balearicus Bate 1909 (Artiodactyla: Caprinae), an extinct bovid from the Balearic Islands: Evidence from coprolites. Biol. J. Linn. Soc. 1999, 66, 57–74. [Google Scholar] [CrossRef] [Green Version]
  99. Dobson, A.P.; Bradshaw, A.D.; Baker, A.J.M. Hopes for the future: Restoration ecology and conservation biology. Science 1997, 277, 515–522. [Google Scholar] [CrossRef]
  100. Foley, J.A.; DeFries, R.; Asner, G.P.; Barford, C.; Bonan, G.; Carpenter, S.R.; Chapin, F.S.; Coe, M.T.; Daily, G.C.; Gibbs, H.K.; et al. Global consequences of land use. Science 2005, 309, 570–574. [Google Scholar] [CrossRef] [PubMed] [Green Version]
  101. Ginés, À.; Ginés, J. La Cova de sa Font (o Cova des Moro) i l’origen del topònim de s’ illa de sa Dragonera: Una hipòtesi espeleològica. Endins: Publicació D’espeleologia 2010, 34, 9–18. [Google Scholar]
  102. Zavaleta, E.S.; Hobbs, R.J.; Mooney, H.A. Viewing invasive species removal in a whole-ecosystem context. Trends Ecol. Evol. 2001, 16, 454–459. [Google Scholar] [CrossRef]
  103. Strayer, D.L.; Eviner, V.T.; Jeschke, J.M.; Pace, M.L. Understanding the long-term effects of species invasions. Trends Ecol. Evol. 2006, 21, 645–651. [Google Scholar] [CrossRef] [PubMed]
  104. Blondel, J.; Aronson, J.; Bodiou, J.; Boeuf, G. The Mediterranean Region: Biological Diversity in Space and Time; Oxford University Press: Oxford, UK, 2010. [Google Scholar]
Figure 1. Damage caused by the black rat (Rattus rattus) in 2010 in Sa Dragonera Islet. (Top left) Wild olive tree (Olea europaea var. sylvestris) with damaged bark. (Top right) Damage in a perennial herb (Urginea maritima). (Bottom right) Damage in a pinecone (Pinus halepensis). Author of the photos: Martí Mayol (Director of the Sa Dragonera Natural Park at the time of the deratization campaign).
Remotesensing 14 00101 g001
Figure 2. Temporal distribution of Landsat Collection 1 Surface Reflectance (SR) imagery. More images were used (when available) where clouds obstructed data collection or where SLC off-data error in Landsat 7 was detected over study zones.
Remotesensing 14 00101 g002
Figure 3. Workflow of spatial criteria to select fifty-four 30 × 30 m2 plots (29 in treatment zone and 25 in the control zone represented by pink dots in Figure 4) to compare NDVI time series.
Remotesensing 14 00101 g003
Figure 4. Map showing locations of selected sampling plots (pink dots) to create the NDVI time series for both treatments. On the left the sampling plots of Dragonera Islet (the treatment zone), on the right those of Mallorca Island (the control zone). High resolution aerial orthophotos (15 × 15 cm2) show two examples of the 30 × 30 m2 sampling plots of both treatments. Spatial reference map in the bottom right corner.
Remotesensing 14 00101 g004
Figure 5. Monthly NDVI time series showing the average NDVI of the sampling plots for each zone. The colored lines (Red = Sa Dragonera; Blue = Mallorca Island, i.e., control zone) represent the trend throughout the study period, with a LOESS smoothing and standard deviation shown with the corresponding colors. The black lines represent the real data for each treatment (Solid = Sa Dragonera; Dotted= control zone), in which the seasonal variation can be observed. The dashed vertical line dates the rodent eradication campaign (February 2011).
Remotesensing 14 00101 g005
Figure 6. The STL decomposition of the monthly NDVI time series of Sa Dragonera and control zone (Mallorca Island) into seasonal, trend, and remainder components. In each plot NDVI units are plotted against time. The seasonal component is estimated by taking the mean of all seasonal sub-series (e.g., for a monthly time series the first sub-series contains the January values). The sum of the seasonal, trend, and remainder components equals the data series. The solid bars on the right-hand side of the plots act as reference to show the same data range and aid comparison.
Remotesensing 14 00101 g006
Figure 7. Decomposed NDVI data (Yt) into seasonal (St), trend (Tt) and remainder (et) components for NDVI timeseries between 1999 and 2020 for both treatment zone (a), and control zone (b), using the breaks for additive seasonal and trend (BFAST) method. The dotted vertical line shows when the rodent eradication campaign took place (February 2011). The dashed lines in Tt represent the timing of each significant NDVI change (p < 0.05) in the trend component, together with its 95% confidence intervals (horizontal red bars). Ordinal numbers are used to name the breakpoints. Vertical axis units are absolute NDVI values. The slope coefficient ( β ) and p-value is shown for each fitted trend segment. Colored slots represent Hydrological Drought Index (HDI) between March 1999 and December 2019 [95] which describe the water resources state from more to less abundant for: normality (green), pre-alert (yellow), alert (orange), and emergency (red).
Remotesensing 14 00101 g007
Table 1. Timing and NDVI magnitudes of breaks in the trend component of Sa Dragonera (treatment zone) and Mallorca (control zone) time series. The left and right limits of the breakpoint dates indicate a 95% confidence interval of date estimation. 1 = Timing indicated by year and month. Data format: Year (Month). 2: Difference between the NDVI value at the end of a linear model and the intercept of the next one. 3: Linear regression parameters of segments after the breakpoints date, where the intercept represents the starting NDVI, and the slope represents the greening (+) or browning (-) ratio of the vegetation. The parameters of the starting segment are omitted in this table.
ZoneBreakpointBreakpoints DatesChange Magnitude
(Absolute NDVI Units)
Linear Regression Parameters of Trend Component
2.5% CI LimitBreakpoint Timing97.5% CI Limit InterceptsSlopes
Treatment1st2001(11)2001(12)2002(03)0.1090.4420.008
2nd2007(12)2008(04)2008(05)0.0740.569−0.022
3rd2013(01)2013(02)2013(04)0.0570.5230.021
4th2016(01)2016(02)2016(06)−0.0630.5210.007
Control1st2001(11)2001(12)2002(03)0.0910.4530.005
2nd2007(11)2008(11)2008(120.0310.519−0.014
3rd2012(12)2013(01)2013(09)0.0590.5190.004
Publisher’s Note: MDPI stays neutral with regard to jurisdictional claims in published maps and institutional affiliations.

