Article

A Semi-Automatic Method for Extracting Small Ground Fissures from Loess Areas Using Unmanned Aerial Vehicle Images

1
Faculty of Geosciences and Environmental Engineering, Southwest Jiaotong University, Chengdu 611756, China
2
Guangxi Natural Resources Survey and Monitoring Institute, Nanning 530022, China
3
School of Civil Engineering and Geomatics, Southwest Petroleum University, Chengdu 610500, China
*
Author to whom correspondence should be addressed.
Remote Sens. 2021, 13(9), 1784; https://doi.org/10.3390/rs13091784
Submission received: 30 March 2021 / Revised: 25 April 2021 / Accepted: 27 April 2021 / Published: 3 May 2021
(This article belongs to the Special Issue Geodetic Monitoring for Land Deformation)

Abstract

:
Remote sensing-based ground fissure extraction techniques (e.g., image classification, image segmentation, feature extraction) are widely used to monitor geological hazards and large-scale artificial engineering projects such as bridges, dams, highways, and tunnels. However, conventional technologies cannot be applied in loess areas due to their complex terrain, diverse textural information, and diffuse ground target boundaries, leading to the extraction of many false ground fissure targets. To rapidly and accurately acquire ground fissures in the loess areas, this study proposes a data processing scheme to detect loess ground fissure spatial distributions using unmanned aerial vehicle (UAV) images. Firstly, the matched filter (MF) algorithm and the first-order derivative of the Gaussian (FDOG) algorithm were used for image convolution. A new method was then developed to generate the response matrices of the convolution with normalization, instead of the sensitivity correction parameter, which can effectively extract initial ground fissure candidates. Directions, the number of MF/FDOG templates, and the efficiency of the algorithm are comprehensively considerate to conclude the suitable scheme of parameters. The random forest (RF) algorithm was employed for the step of the image classification to create mask files for removing non-ground-fissure features. In the next step, the hit-or-miss transform algorithm and filtering algorithm in mathematical morphology is used to connect discontinuous ground fissures and remove pixel sets with areas much smaller than those of the ground fissures, resulting in a final binary ground fissure image. The experimental results demonstrate that the proposed scheme can adequately address the inability of conventional methods to accurately extract ground fissures due to plentiful edge information and diverse textures, thereby obtaining precise results of small ground fissures from high-resolution images of loess areas.

1. Introduction

Loess is a yellow silt quaternary deposit transported by the wind; the most typical loess area in the world is the Loess Plateau in China. Loess is well developed in the He’nan, Shanxi, and Gansu provinces near the middle basin of the Yellow River, which has been gradually transformed into representative loess landform areas by the power of water, gravity, and the wind [1]. Loess landforms are typically divided into gully, erosion, and valley landscapes, the latter of which are prone to major geohazards such as floods, collapses, and landslides, which threaten human life [1,2]. Ground fissures are the most typical representative of the instability of loess sediments. It may be caused by natural or human-made factors, which will cause damage to buildings and other structures on the ground and endanger people’s lives [3]. In addition, it also seriously threatens the safe operation of high-speed railways, highways and other transportation networks [4,5]. Therefore, it is necessary to monitor these geological dynamics effectively. As mentioned in previous studies [6], a useful way to monitor such geohazards is to extract ground fissure information from loess areas using unmanned aerial vehicle (UAV) images.
Ground fissures, which exhibit dark and linear characteristics in aerial images, are a typical feature of loess areas. Many computer vision methods are used to extract linear targets, such as pixel-oriented edge extraction [7,8], object-oriented feature extraction [9], and LiDAR [10]. Edge extraction operators based on computer vision are particularly popular. Methods based on edge extraction operators are typically divided into two categories: first-order derivative methods and second-order derivative methods [11]. The edge in the images is the pixel sets covering sharp grayscale changes, whose trend can be represented by the first-order derivative function. The greater the value of the first-order derivative function, the more likely the pixel is to be marked as an edge indicator. Frequently used first-order derivative functions include the Roberts operator [12], Sobel operator [13], Prewitt operator [14], and Canny operator [11]. With all these operators, an appropriate threshold is selected after the convolution to the segment the image and extract the edge information; however, the arbitrary threshold used in image segmentation has a substantial impact on the final results of fissure extraction.
Therefore, second-order derivative methods were proposed to address this problem. The essence of second-order derivative methods is to find the maximum position of local gradient values calculated by the first-order derivative function (i.e., the local peak position of the first-order derivative function); the value of this position in the second-order derivative function is zero. This position is therefore considered the ground fissure location of interest. The Laplacian operator and LOG operator [15] are two typical second-order derivative strategies. Recently, the aforementioned edge detection operators, as well as other improved operators [16,17], have been widely studied and applied to highway extraction, bridge recognition, and tunnel and pipeline fissure detection [18,19,20,21].
Although edge extraction operators based on pixel grayscale change detection can extract ground fissures from high-resolution UAV images, one primary limitation is their applicability to different types of ground fissure. Firstly, these operators only detect the outer edges of the ground fissure and not the fissure itself when the fissure is treated as a planar target. Secondly, they are not sensitive to pixels with a small grayscale gradient. Moreover, broken soil, pits, withered grass, snow, and ice (in winter) are often widely distributed in loess areas [22], whose edges are commonly recognized as ground fissures by the above methods because of their rich textural information.
In the medical field, blood vessels in retina images scanned by computed tomography (CT) present a similar shape and hue to ground fissures. Using the spatial attributes of blood vessels in CT images, Chaudhuri et al. [23] successfully recognized blood vessels with the matched filter (MF) algorithm. When the vertical profile of a blood vessel is drawn as a graph, its distribution curve is similar to that of an inverted Gaussian distribution. Therefore, the use of a convolution operation with the available inverted Gaussian template can enhance the contrast between the blood vessels and the background, enabling the CT image to be segmented by setting an appropriate grayscale threshold. However, the MF algorithm cannot accurately distinguish blood vessel targets and blood vessel edges. After matched filtering, the response signals of blood vessels and their edges showed similar patterns but different strengths. To address this issue, Zhang et al. [24] proposed the combined matched filter and first-order derivative of the Gaussian (MF-FDOG) algorithm to improve the accuracy of blood vessel extraction. In 2013, Stumpf et al. [25] successfully applied the MF-FDOG algorithm to investigate ground fissures before landslides due to the similarity of their vertical profile compared to blood vessels. By analyzing the results of ground fissure extracted for different periods, they were able to predict the orientation and extent of the landslide.
Nevertheless, the scheme proposed by Stumpf et al. [25] has some limitations regarding its practical application. In loess areas, vegetation often appears as linear targets in images; i.e., its spectral curve does not always satisfy the normal spectral curve pattern of green vegetation. As a result, traditional vegetation index methods are not capable of removing vegetation that is incorrectly detected as ground fissures. Moreover, the sensitivity correction parameter in the MF-FDOG algorithm is indeterminate and not in the range from 3 to 4 for different UAV images. In addition, the optimal direction number of the convolution template is not considered and it can reduce the accuracy and efficiency of the algorithm. Therefore, to overcome these shortcomings of the MF-FDOG algorithm, we propose an advanced processing scheme for ground fissure extraction using different UAV images.

2. Methodology of Ground Fissure Extraction

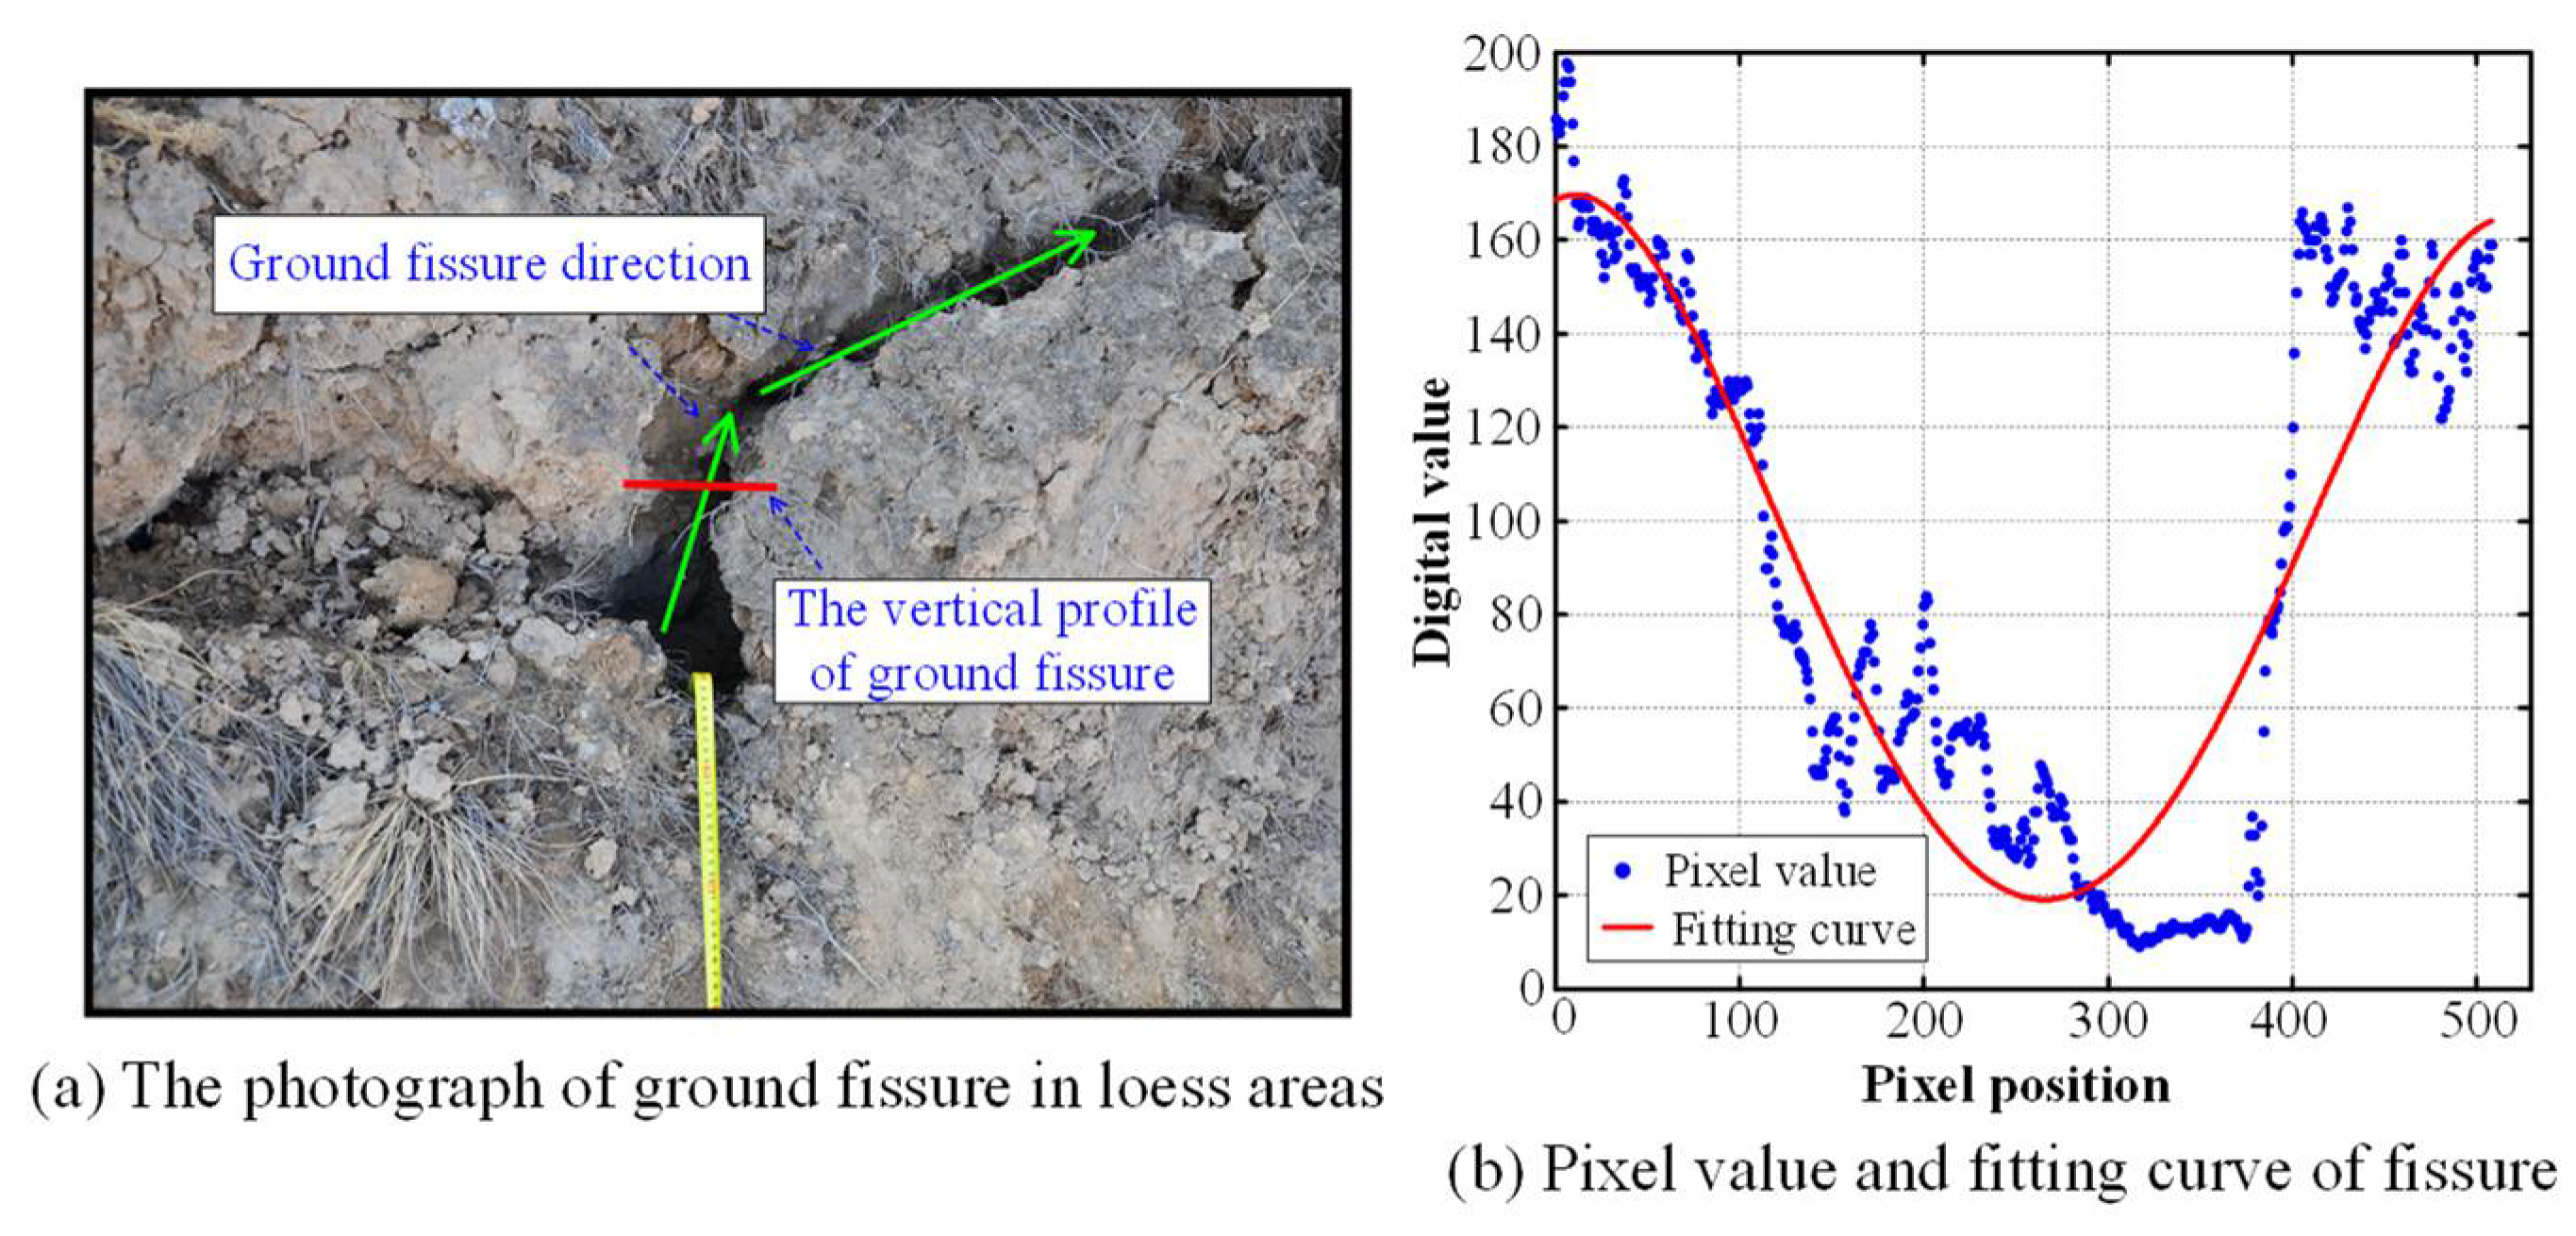
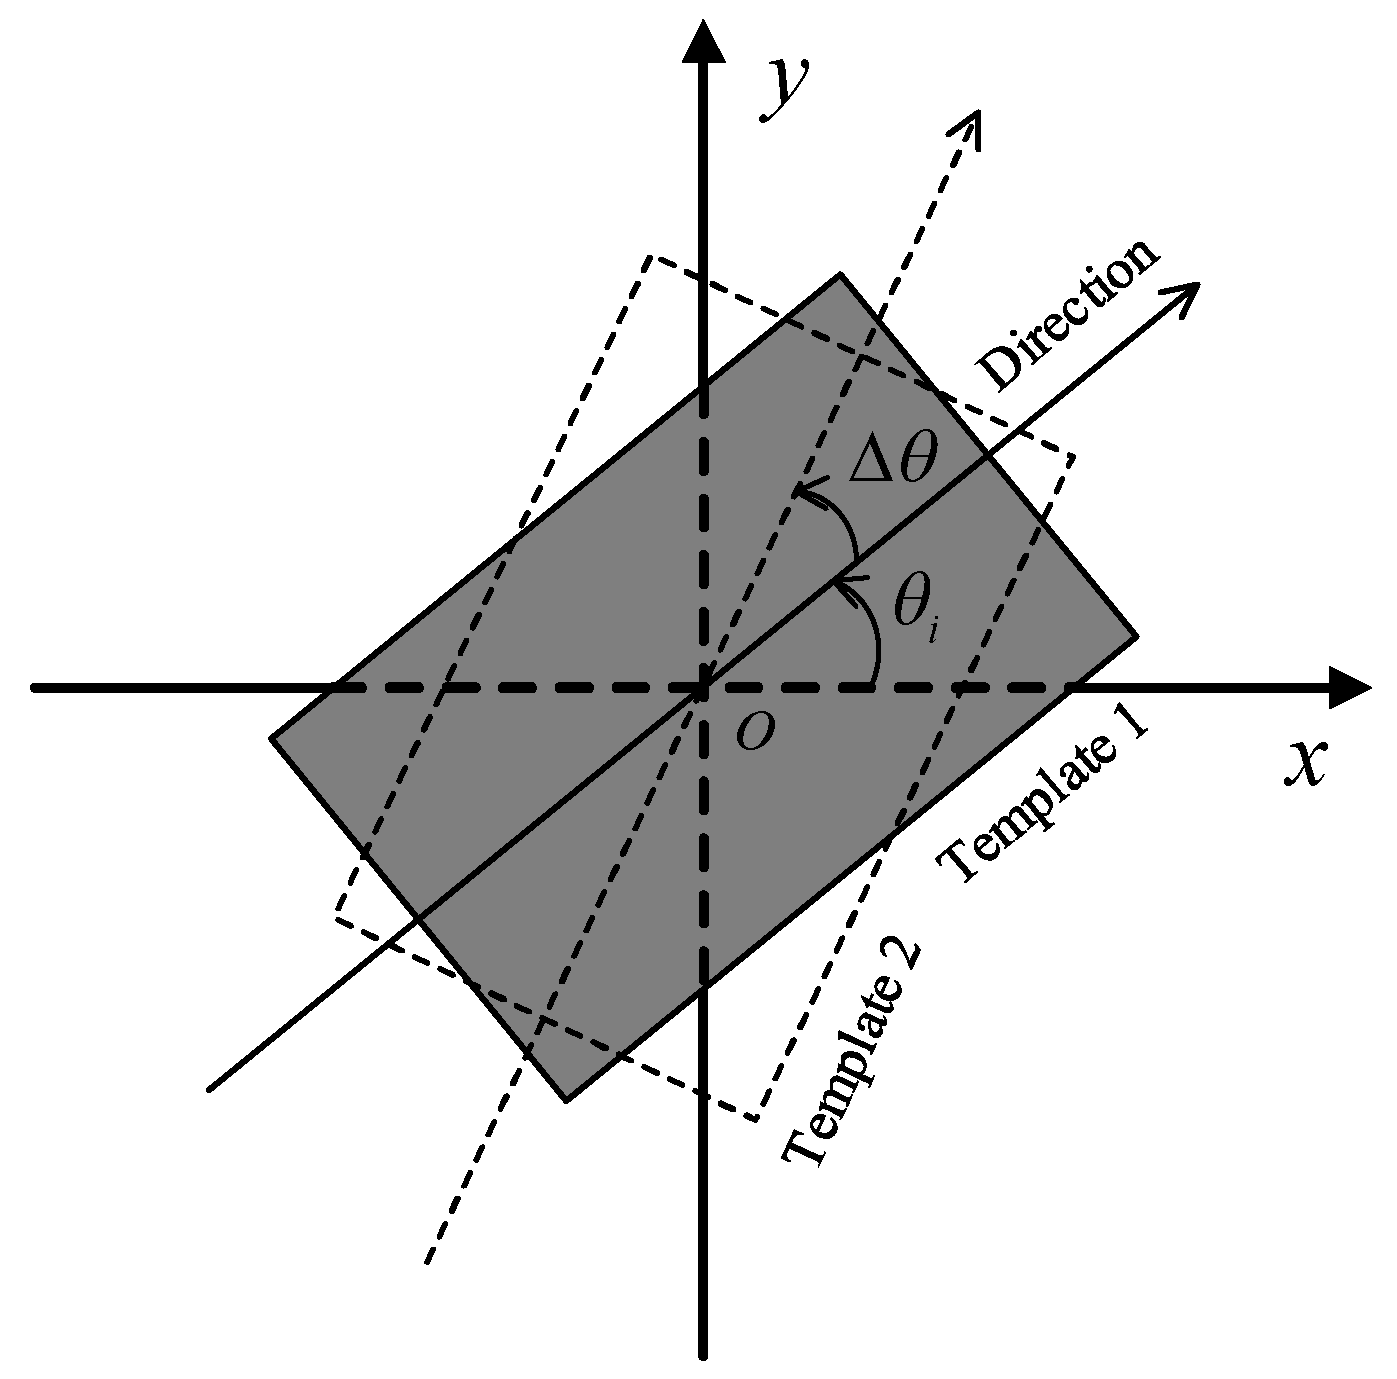
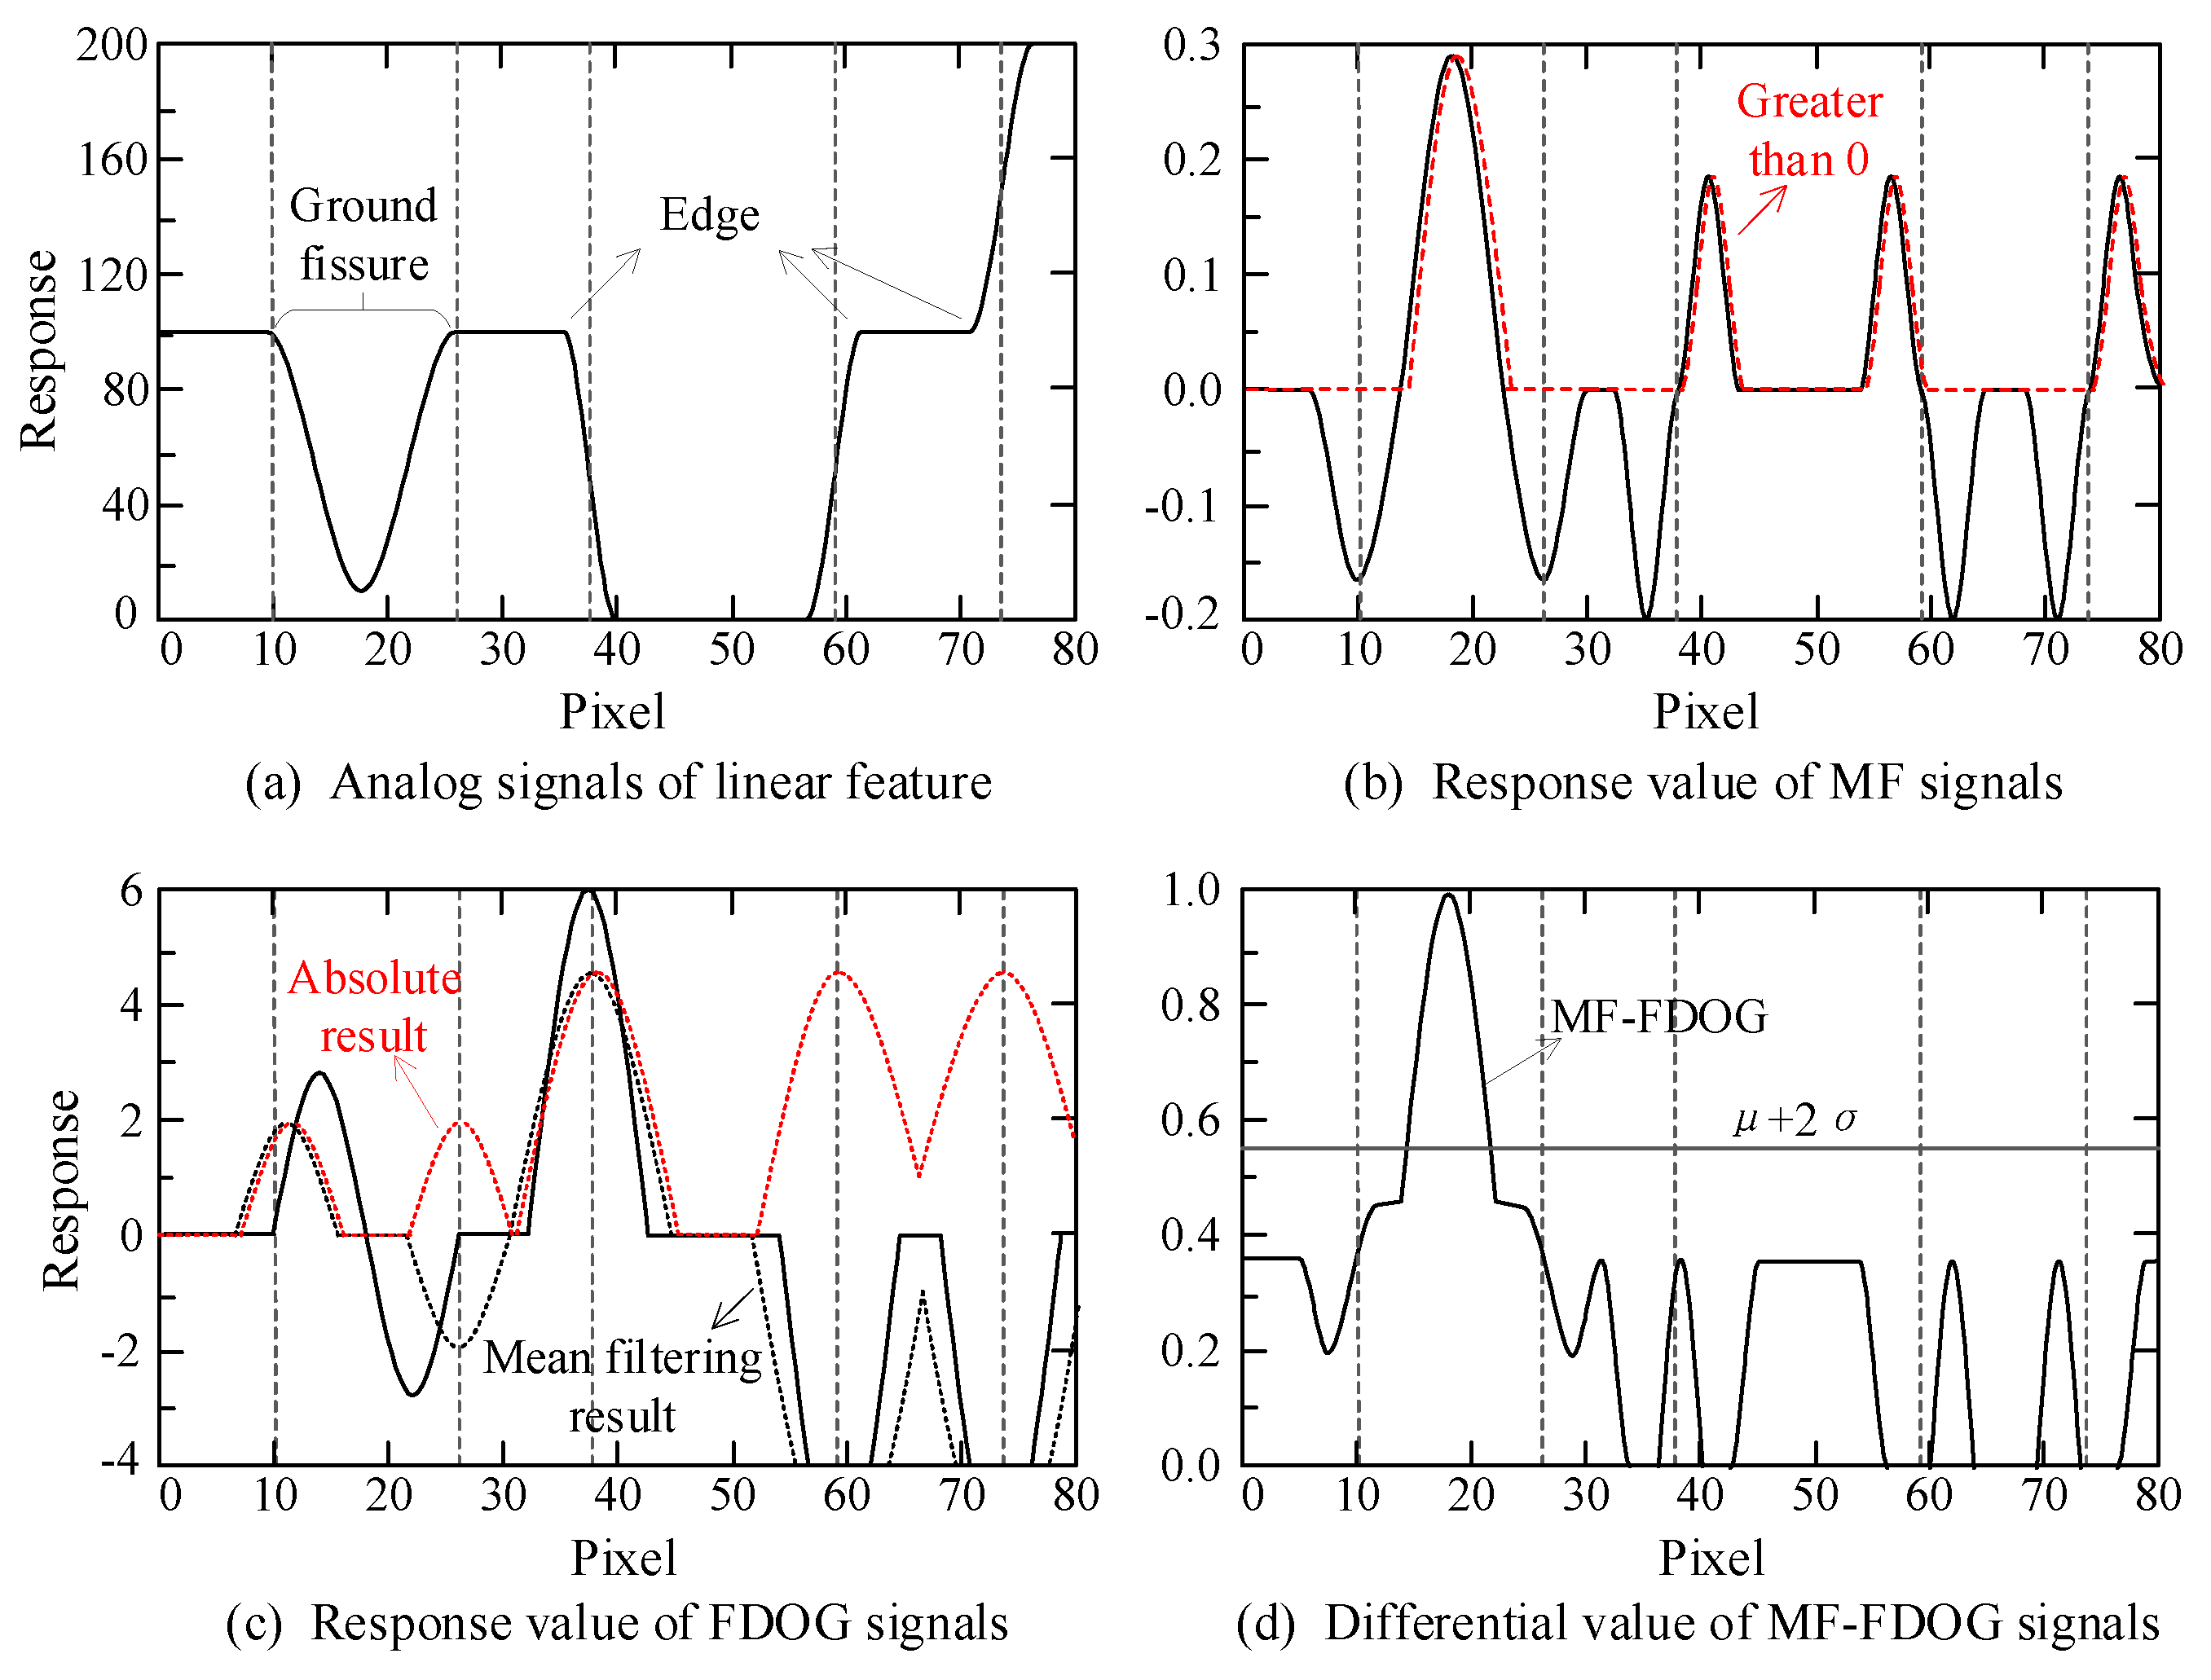
2.1. Modified MF-FDOG Algorithm for Ground Fissure Extraction

The MF-FDOG algorithm comprises the MF algorithm and the FDOG algorithm. The MF [26] algorithm was initially applied in the digital signal processing field to detect whether a complex signal contains a simple known signal [27,28]. As a digital image is one type of digital signal; thus, methods used in the digital signal field can be used for digital image processing.
In terms of the structure (e.g., width, length, shape) of ground fissures in different images, we can expand a one-dimensional template to two-dimensional space. Then, using the two-dimensional template. The function of the template is as follows:
MF = g ( x , y ; σ ) = { y 1 = 1 2 π σ exp ( | x | 2 2 σ 2 ) m , y n = 1 2 π σ exp ( | x | 2 2 σ 2 ) m ; | x | 3 σ , | y | L / 2
where x and y denote variables along the horizontal and vertical directions of the two-dimensional template, respectively; and σ denotes the standard deviation of the inverted Gaussian distribution. In a Gaussian distribution, the probability that variable x lies in the range of [ 3 σ , 3 σ ] is up to 99.7%, and the vertical profile of ground fissures is similar to an inverted Gaussian distribution (Figure 1). Therefore, it is reasonable to select this interval as the range of variable x. In other words, the width of the ground fissure is 6 σ . Moreover, L denotes the minimum length of the ground fissure and m denotes the mean template. In computer memory, continuous digital image signals have a regular digital matrix format. Therefore, m is represented by
m = i N K i ( x , y ) / N ,
where K i represents the response after MF processing at position ( x , y ) and N represents the size of the two-dimensional template.
FDOG [24] refers to the first-order derivative function of the Gaussian function, then expands it to a two-dimensional filter template. The template is established in the same way as that of the MF template. The FDOG function is represented by
FDOG = g ( x , y ; σ ) = { y 1 = x 2 π σ 3 exp ( | x | 2 2 σ 2 ) , y n = x 2 π σ 3 exp ( | x | 2 2 σ 2 ) ; | x | 3 σ , | y | L / 2 ,
where all parameters are the same as those in Equation (1). Figure 2a,b show examples of the three-dimensional diagram about the MF template and FDOG template, respectively. The parameters of both templates are set to σ = 1.5, L = 9.0, and θ = 90° (i.e., the template is along the vertical direction).
The orientation and distribution of ground fissures are arbitrary. Thus, we must process images with the optimal direction number of templates to ensure that all ground fissures are detected. In experiments, the template direction number will have a strong effect on the sensitivity and accuracy of the modified MF-FDOG algorithm; however, ground fissures are a linear target, which means that they can be regarded as a straight line with an anti-parallel characteristic in a local area [29]. Therefore, we only need to create a template with directions of 0°–180° in two-dimensional space. To create these templates with different directions, the central pixel of the templates is set as the origin (0, 0) of the coordinate system. We must decide how many directions, N, we want in the 180° space. Then, the angular interval of direction θ int is calculated using Equation (4). The rotation angle, θ i , between the direction of the template and the x axis (see Figure 3) and the rotation matrix r i are represented by Equations (5) and (6), respectively:
θ int = 180 ° ÷ N ,
θ i = n × θ int ,
r i = [ cos θ i sin θ i sin θ i cos θ i ] ,
Through rotation, we can obtain a group of MF and FDOG templates. The template direction corresponding to the maximum response is taken as the direction of ground fissures in the processed images. The derived maximum response represents the result of the MF operation at the current pixel location. The angle corresponding to this response represents the orientation angle of the ground fissures. The function for selecting the template angle is defined as
θ max ( x , y ) = argmax ( I ( x , y ) MF θ i ) ,   0 < θ i π
where θ m a x ( x , y ) denotes the angle corresponding to the maximum response obtained by convolving an image with n MF templates processing different directions; I ( x , y ) represents the UAV image; M F θ i denotes the template with the rotation angle θ i ; and denotes convolution operation.
For ground fissure extraction, the difference between the MF response matrix and the FDOG response matrix must be calculated. Before this step, to reduce the probability of false ground fissure extraction, [25] suggested implementing some special procedures: (1) after convolution by the MF template, all negative responses should be set to zero; (2) for the FDOG response matrix, a mean filter should be performed before calculating the absolute value for all responses. The two steps are represented by
R ( x , y ) = ( I ( x , y ) MF θ max ( x , y ) ) > 0
D ( x , y ) = | I ( x , y ) FDOG θ max ( x , y ) M |
where R ( x , y ) and D ( x , y ) denote the response matrices obtained by convolution of the MF and FDOG templates, respectively; M F θ m a x ( x , y ) and F D O G θ m a x ( x , y ) denote the template corresponding to the maximum response of the convolution operation in n different directions, and M denotes the template of the mean filter, whose value is set to 6 σ [24]. Additionally, the mean filter not only reduces noise and smooths the image, but also expands the width of D ( x , y ) . To do this, the differential signals are enhanced.
The results indicate that it is difficult to directly differentiate between R ( x , y ) and D ( x , y ) matrices because their ranges are substantially different. Therefore, a sensitivity correction parameter should be used to correct their ranges. In [25], the empirical ranges of the parameter are between 3 and 4. However, the ranges of R ( x , y ) and D ( x , y ) , do not satisfy the linear relationship shown by ground fissure extraction experiments using different images. Therefore, there is a limitation of using the sensitivity correction parameter to correct their ranges. In this study, we propose a solution to normalize the range of R ( x , y ) and D ( x , y ) by a linear stretching method. Their difference is then calculated as
R ( x , y ) ¯ = R ( x , y ) D ( x , y )
where R ( x , y ) and D ( x , y ) indicate the response matrices of R ( x , y ) and D ( x , y ) stretched into [0,1], respectively.
Figure 4 is the frequency histogram of the R ( x , y ) ¯ matrix, which exhibits a Gaussian distribution. Generally, ground fissures are small targets in UAV images, whose area is far less than that of the loess, vegetation, and other ground targets. Ground fissure signals show a strong response after the modified MF-FDOG convolution operation. It is reasonable to choose a threshold T, according to the mean and standard deviation of R ( x , y ) ¯ to segment the image using (11) and (12). Then, pixels with values greater than T can be considered ground fissure locations. Finally, ground fissure candidates can be extracted from the images; i.e., locations with F m a p = 1 :
T = μ R ¯ + 2 σ R ¯
{ R ( x , y ) ¯ T ,   F map = 1 R ( x , y ) ¯ < T ,   F map = 0  
In Equations (11) and (12), μ R ¯ denotes the mean of R ( x , y ) ¯ ; σ R ¯ denotes the standard deviation of R ( x , y ) ¯ ; T denotes the threshold selected for image segmentation; and F m a p denotes the final result the ground fissure extraction.
For a better description of the modified MF-FDOG algorithm, we present a simulation experiment. The simulated signals of the ground fissure and edges, as well as the results of the modified MF-FDOG algorithm, are shown in Figure 5. Both the ground fissure and edge signals are dramatically enhanced by the MF convolution operation. However, the ground fissure information obtained by FDOG convolution shows the exact opposite response from that of MF convolution. As the response signals of edges are stronger than those of ground fissures, these two targets can be clearly distinguished by mean filter processing.
High-resolution UAV images contain copious features, representing complex and diverse textures; this increases the difficulty of ground fissure identification, as these textures can be mistaken for ground fissures. Therefore, it is inevitable that multiple false ground fissure results will result from modified MF-FDOG processing. These false results must be removed. In this study, a “non-ground fissure removal” method based on random forest (RF) classification was introduced to improve the ground fissure results obtained using the modified MF-FDOG algorithm.

2.2. RF Classification in Loess Landform Areas

In this study, the RF algorithm was utilized to identify different ground targets (e.g., withered vegetation, snow, and bare soil). Vegetation indexes are common methods for extracting green vegetation from true color images [30,31]; however, they cannot extract withered vegetation [32]. Feng et al. [33] proved that the RF algorithm using both gray and texture information is better than other classification methods such as vegetation indexes, the nearest distance method, and the object-oriented method in urban vegetation cartography using true color images. In our experiment, the RF algorithm was used to remove “non-ground fissure” targets, such as snow and vegetation.

3. Post-Processing of Ground Fissure Extraction

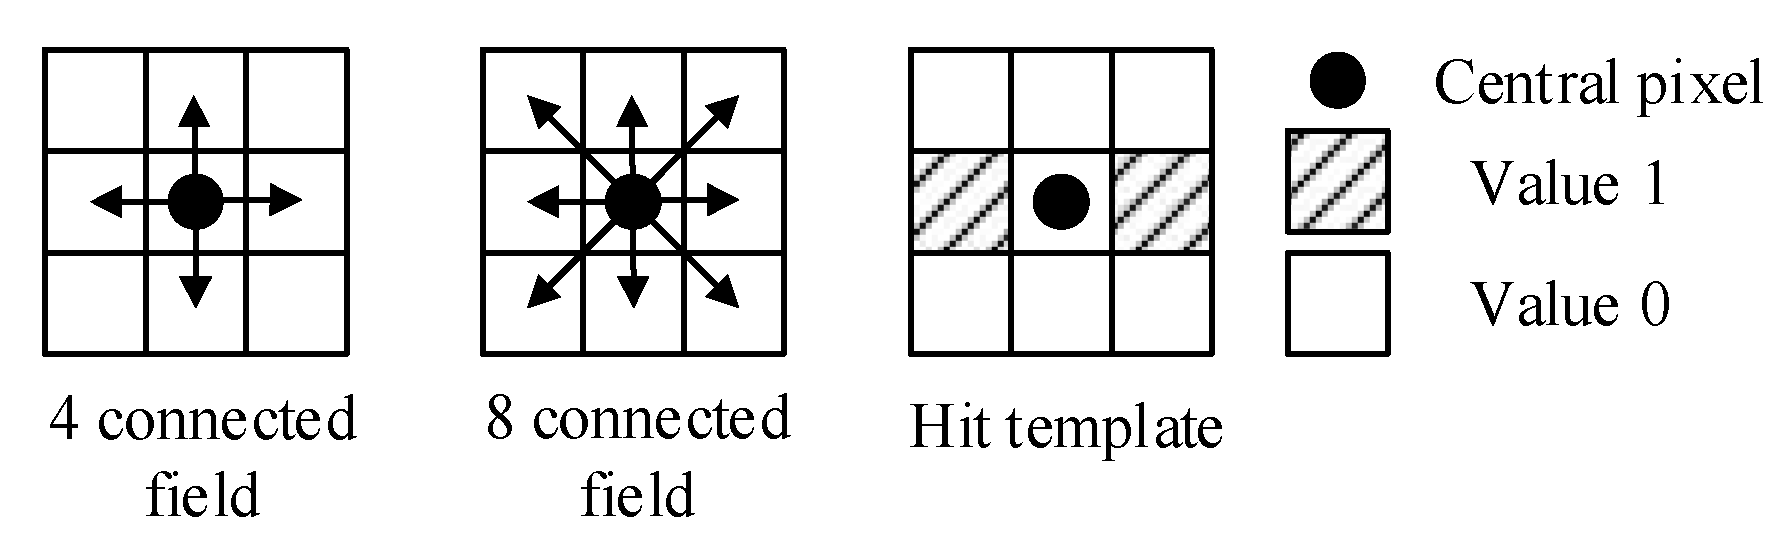
3.1. Ground Fissure Connection

The modified MF-FDOG algorithm and the RF algorithm are operations based on pixels instead of objects. The grayscale values of ground fissures in the image often change unevenly at different positions. Linear targets (e.g., ground fissures) will inevitably become discontinuous after template convolution, resulting in small gaps along the linear targets. To eliminate small gaps distributed along the ground fissure candidates, the hit-or-miss transform [34] was adopted in our experiment. This method can connect broken targets within a small gap distance according to complementary templates M1 M1and M2, which are termed the “hit template” and “miss template,”, respectively. The central pixel of a patch that satisfies the conditions of both the “hit template” and “miss template” is used for further processing.
For the UAV images used in our study, we propose that gaps of no more than one-pixel length in a four-connected field (first sub-figure in Figure 6) should be connected. Therefore, the 3 × 3 template is built in the hit-or-miss transform. The pixel value for the foreground is set to 1, whereas the pixel value for the background is set to 0 (third sub-figure in Figure 7). Figure 7a (1)–(12) show cases with a pixel gap and (13)–(16) show cases that only satisfy the diagonal condition in an eight-connected field (second sub-figure in Figure 6). All “miss templates” are shown in Figure 7b. It should be noted that all “hit templates” and “miss templates” follow a corresponding one-to-one relationship.
In the process of gap elimination, the “hit template” is used to match the images pixel by pixel. A case is determined as a “hit” if the distribution of pixels within the coverage of the “hit template” is the same as the “hit template” itself in the binary image. Similarly, a case is termed a “miss” when the distribution of pixels within the coverage of the “miss template” is the same as the “miss template.” “Hit” and “miss,” which detect the position of the pixels of interest, are the key points of this method. To improve the efficiency of the calculation, the procedures of hit-or-miss transform are changed according to the mathematical morphology. The original binary image, I1, is eroded by the “hit” template. Meanwhile, the complementary binary image I2 caused by I1 is eroded by the “miss template.” The pixel intersection of I2 and I1 is the final result. The flow chart is shown in Figure 8. The results from the hit-or-miss transform are shown in Figure 9a,b.
It is noted that the length of the used template is typically odd; thus, the central pixel can be chosen as the target pixel. However, a non-central pixel can also be chosen as the target pixel. In some special cases, the length of the template can be set as even. Moreover, it is unnecessary that the “hit” template and “miss” template are completely complementary for each pixel when they are built (see Figure 7a,b), provided that the pixels set to one do not overlap each other.

3.2. Fragment Removal from the Ground Fissure Candidates

Among the ground fissure candidate sets, there are some discrete pixels (or small sets of pixels), whose area is far less than the area of the ground fissure. To improve the results, these small patches must be removed. After connecting the disconnected ground fissure sections, these patches should be deleted if they contain three or fewer pixels that satisfy the relationship of the eight-connected field in the range of 3 × 3 (Figure 9c,d).

4. Application of the Ground Fissure Extraction Scheme to the Study Area

4.1. Introduction of the Ground Fissure Extraction Scheme

In this study, we propose an advanced scheme of ground fissure extraction based on UAV images according to typical feature information in loess areas, which involves image acquisition, image preprocessing, ground fissure candidate extraction, removing “non-ground fissures” and accuracy assessment of linear targets. The principle procedures are summarized in the following steps:
Step 1:
Image acquisition. According to the survey results, the appropriate UAV is selected to obtain the images of the study area. Before flight, the terrain, wind direction and other factors should be considered, and the appropriate flight parameter and the position of the control points should be set. After flight, RTK equipment is used to obtain the coordinates of control points. If image quality is low in some areas, much flight time is added in order to improve the image quality.
Step 2:
Image pre-processing. Firstly, the lens parameters will be imported into PixelGrid software to correct the distortion of the original image, in order to reduce the systematic error caused by the lens. After importing the control point data, the geometric correction of images will be processed by PixelGrid software, and the resampling method of three convolutions is selected to ensure the image accuracy. Then, the accuracy evaluation method of PixelGrid will be automatically carried out. Finally, the appropriate filtering and histogram matching method is used to enhance images for conveniently extracting ground fissure.
Step 3:
Extraction of ground fissure candidates with the modified MF-FDOG algorithm. According to information obtained from surveying and image analysis, the program is run with suitable parameter settings (i.e., the optimal σ , L , and θ values) to obtain ground fissure candidates.
Step 4:
“Non-ground fissure” target removal. Banded vegetation, edges of remaining snow and shadows from micro-topography will result in several “non-ground fissure” targets in the candidates extracted by step 2. Additionally, UAV images only include red, green, and blue bands. It is difficult to completely remove vegetation targets with such limited spectral information from the candidates. However, the inherent textural features of vegetation are valuable for vegetation information extraction, which is used to eliminate vegetation-induced false ground fissures. Therefore, the RF algorithm is used to classify the images based on both textural and spectral information. Then, the different categories, such as vegetation, are used to create mask files. Applying the mask files to the ground fissure candidate image can exclude non-ground fissure targets and improve the accuracy of ground fissure extraction. Finally, a binary image of the ground fissure is derived.
Step 5:
Post-processing. The modified MF-FDOG algorithm is an image processing method based on single pixels. Therefore, the obtained binary image of ground fissures inevitably contains many small gaps and pixel sets whose areas are far less than that of the corresponding true ground fissures. To achieve more accurate results, mathematical morphology was employed to connect broken ground fissures and remove these scattered pixels.
Step 6:
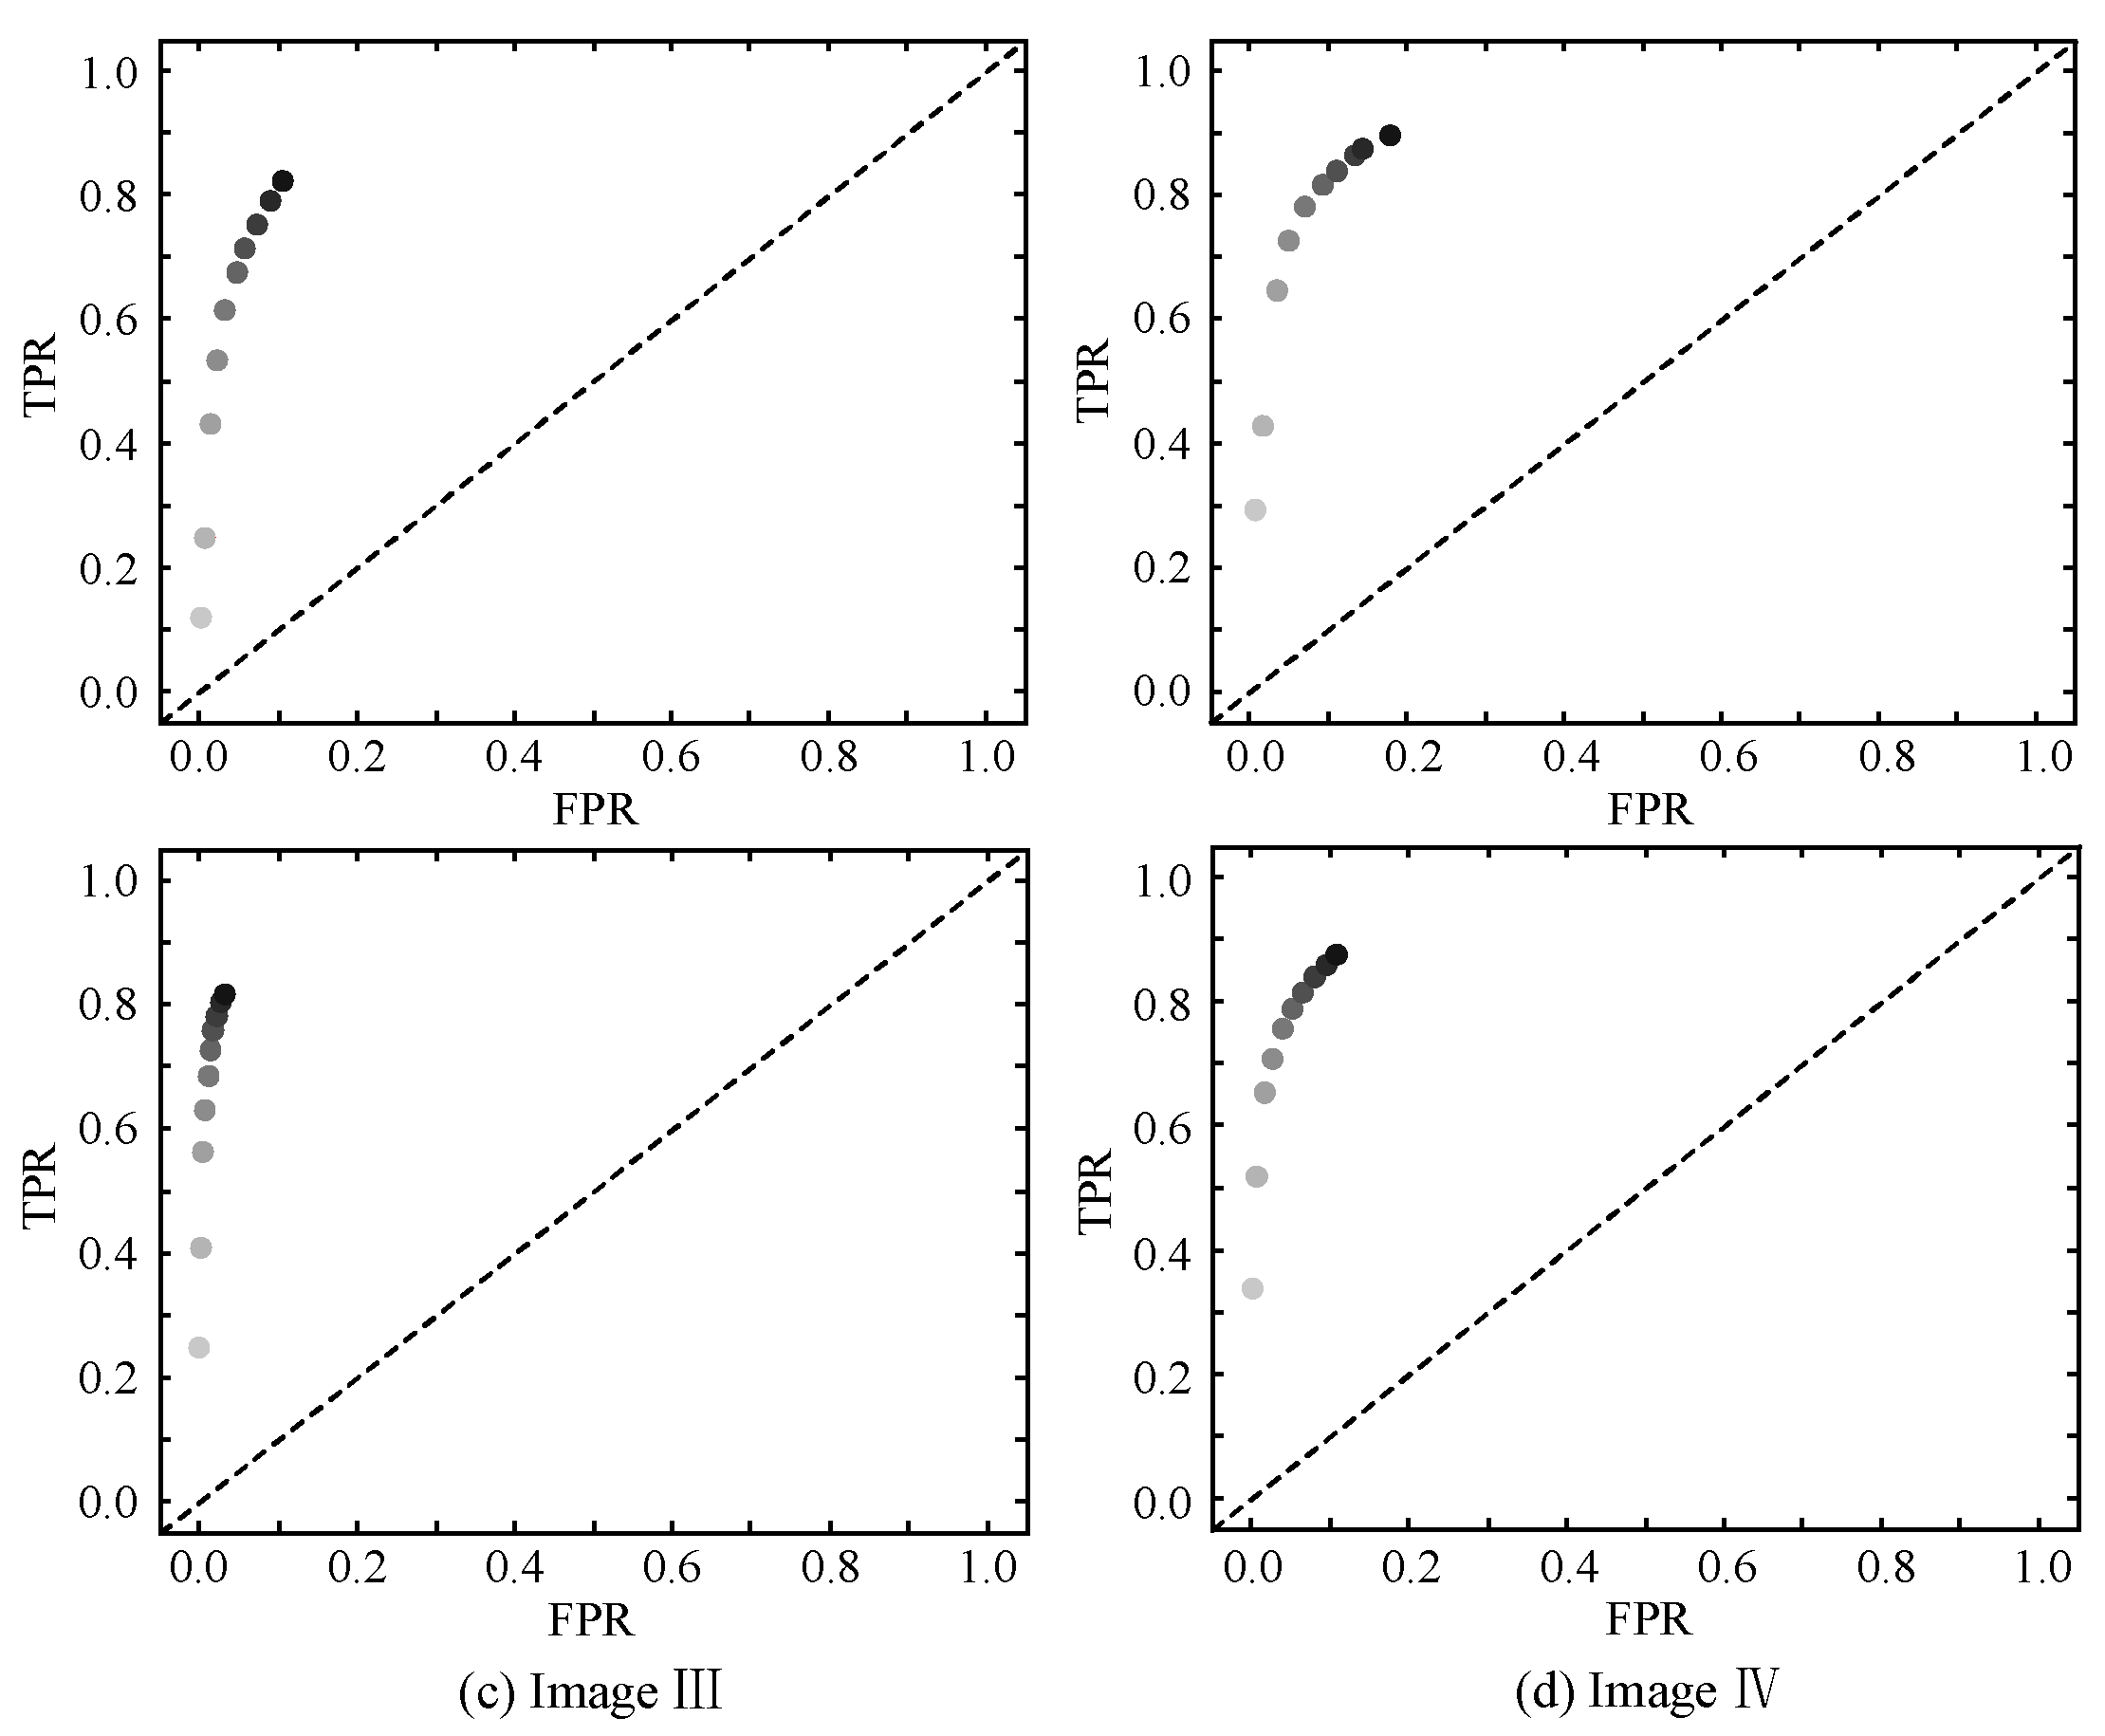
Accuracy assessment. In our study, an image classification method was used to identify non-ground fissure targets. The accuracy of image classification significantly affects the final results; thus, the Kappa coefficient and confusion matrix were used to evaluate RF classification accuracy in this study. In addition, the receiver operating characteristic curve (ROC) was used to evaluate the results of ground fissure extraction [35].

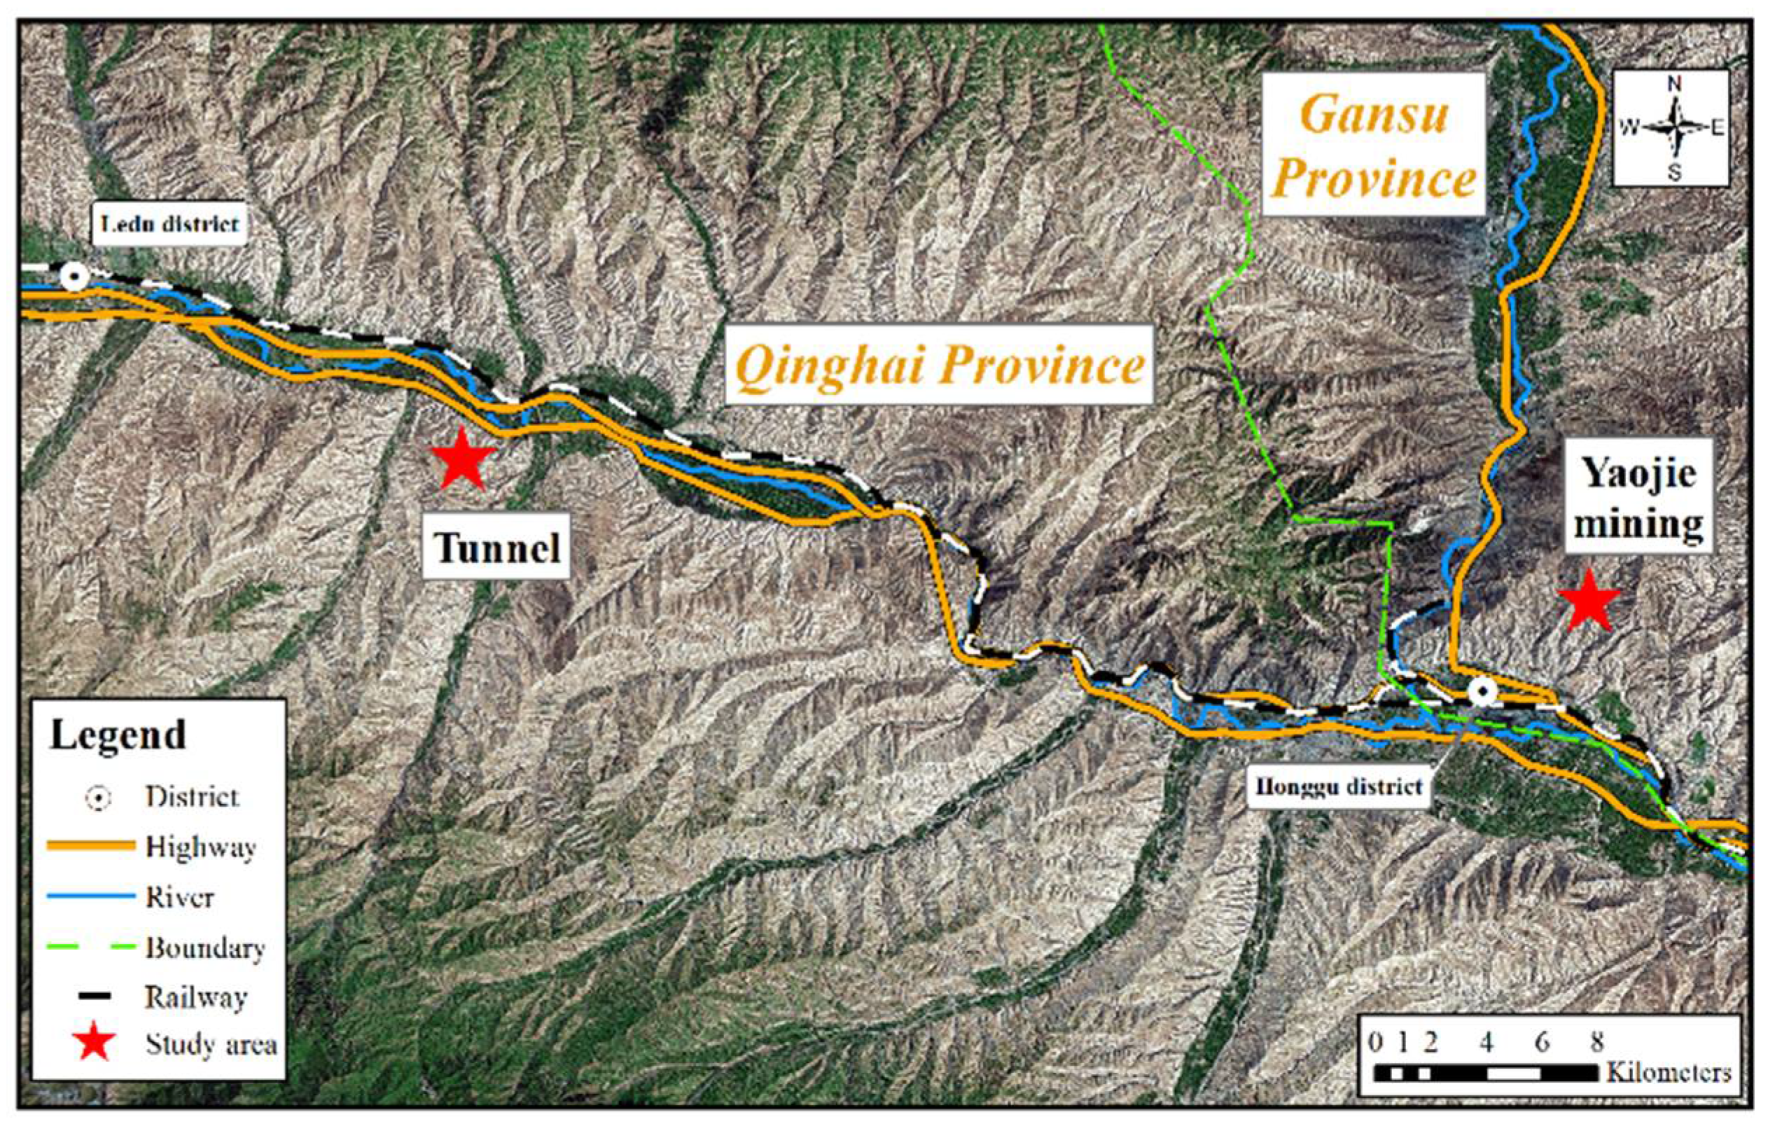
4.2. Study Area and Data Source

A mountain over a tunnel in Qinghai province and a mining area in Gansu province were selected as the study areas to represent typical developing loess landforms (red five-pointed stars in Figure 10). Due to the instability of loess units, as well as other natural and anthropogenic factors, ground fissures are a very common geological phenomenon. These two areas predominantly comprise very complex mountainous terrain. The exposed loess surface is unstable because of its typical semi-arid climate and small forest coverage. To prevent soil erosion, the local inhabitants have planted banded vegetation and trees on the mountain.
True color images of the tunnel area and mining area were obtained at approximately 13:00 on 25 March 2015, and 09:00 on 18 November 2016, respectively. The former was acquired by a small fixed-wing UAV oblique photography platform (Figure 11a, come from Third Aerial Survey and Remote Sensing Institute of the Ministry of Natural Resources, Chengdu, China) and covers a larger area around the tunnel. The latter was acquired by a small four-rotor UAV platform (Figure 11b) and covers a small area around the mining area. The detailed attributes of the two platforms are listed in Table 1.
In our experiment, the computer with a CPU model Intel (R) Core (TM) i5-2450M was used for data processing. The frequency of the CPU is 2.5 GHz, and the memory of the computer is 4 GB. The modified MF-FDOG algorithm was developed by C/C++ programming language based on Visual Studio 2013. PixelGrid software was used to preprocess the raw images. For the RF algorithm, the EnMAP-Box2.1.1 software (Earth Observation Center of DLR. German: EnMap Box) was used.
For the tunnel area (Figure 12), the coverage of the image was 5 km × 2 km, with an elevation of 1930–2500 m. According to the field investigation, there are a large number of ground fissures, loess craters, remaining snow, and withered grasses in the mountain areas. The maximum width of ground fissures is no more than 30 cm: however, the depth is up to 120 cm. Some ground fissures are covered by broken soil after a period of weathering and snow melting. The coverage of the mining area (Figure 13), which is less than that of the tunnel area, is predominantly composed of bare soil, withered grass, ground fissures, and artificial structures. As shown in Table 1, the flight altitude of PHANTOM4 is approximately 150 m. Therefore, we can obtain high-resolution images in which the ground fissures can be clearly recognized.
To improve the efficiency of the data processing, we selected and cropped small sub-sections from the complete images (I,II,III, and IV in Figure 12 and Figure 13). All previously described typical objects were found in these patches; thus, they were deemed highly representative for testing the proposed ground fissure extraction scheme.

5. Ground Fissure Extraction Results and Analysis in a Loess Area

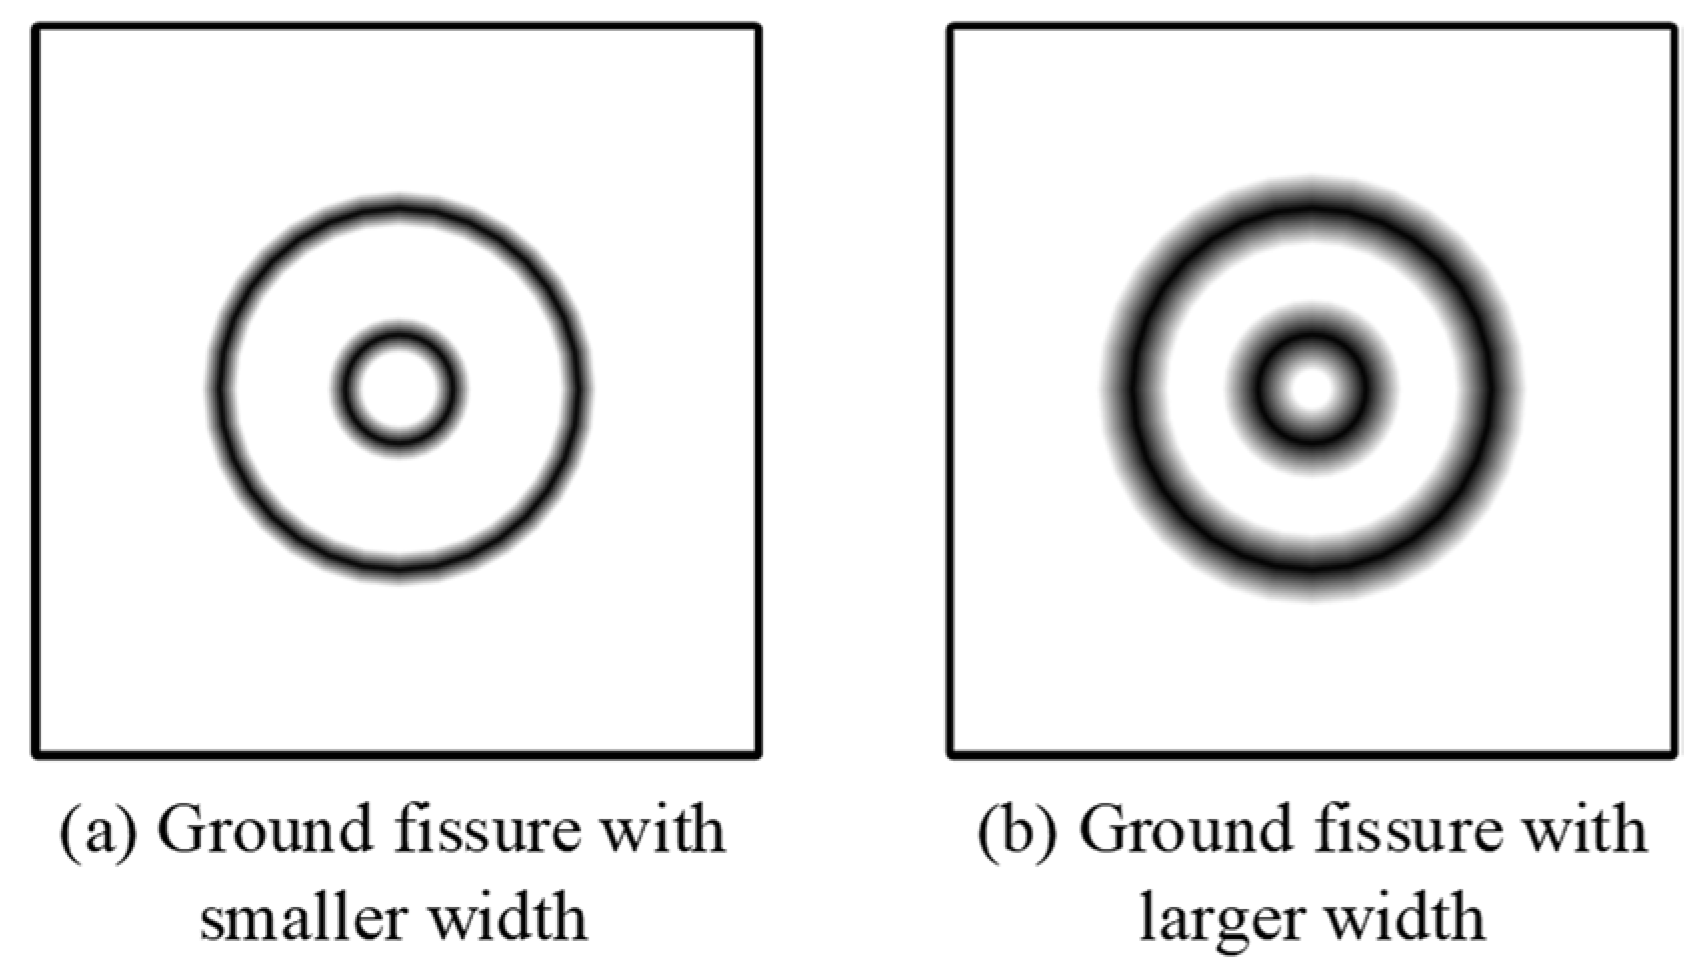
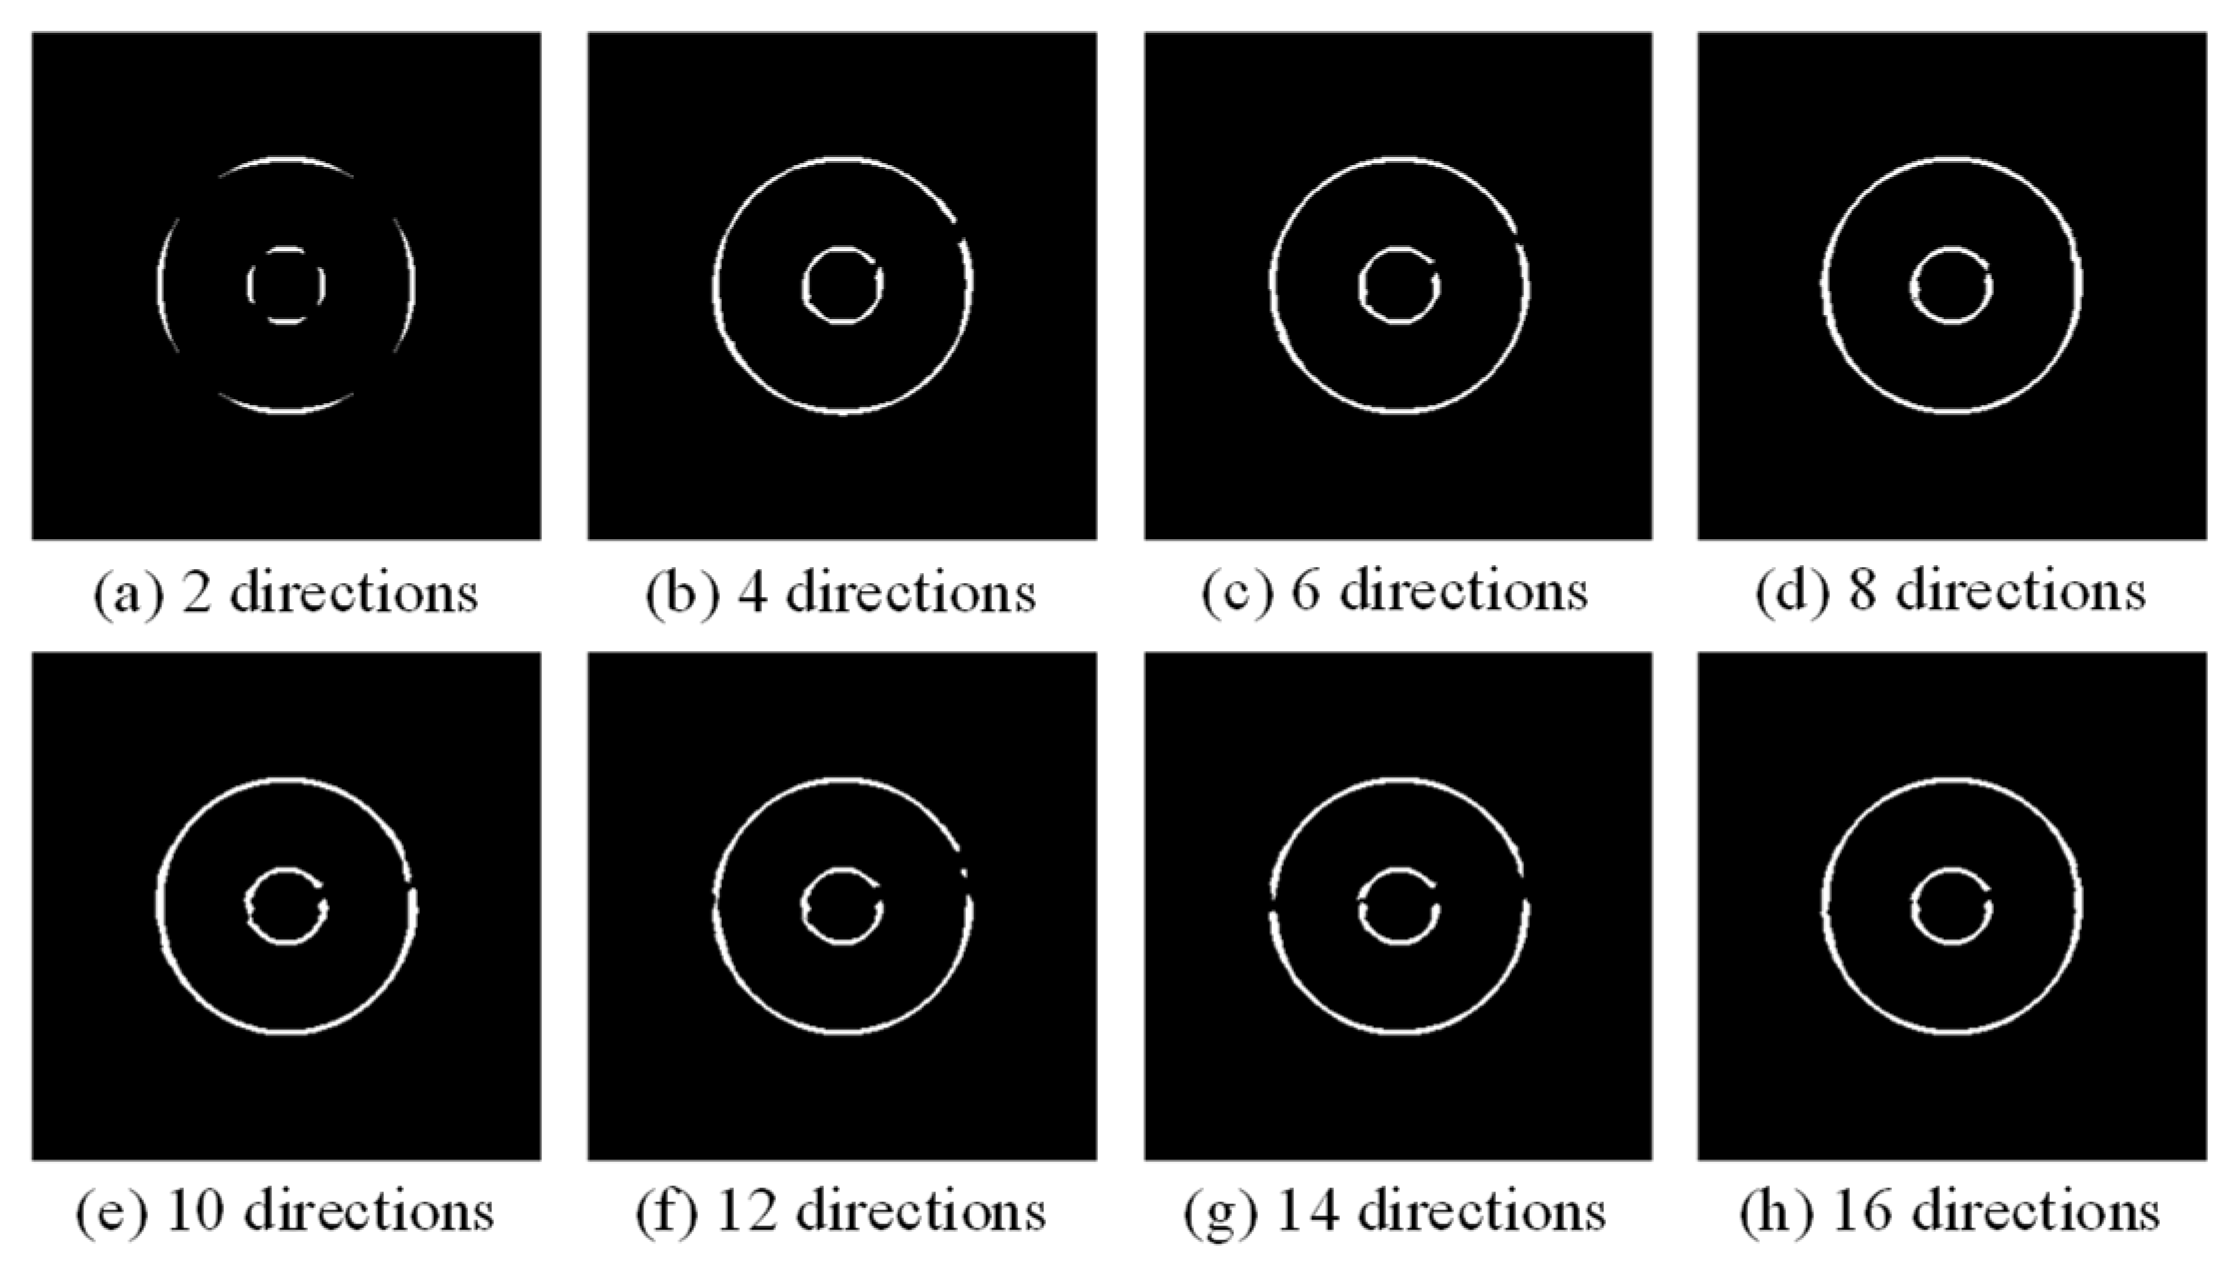
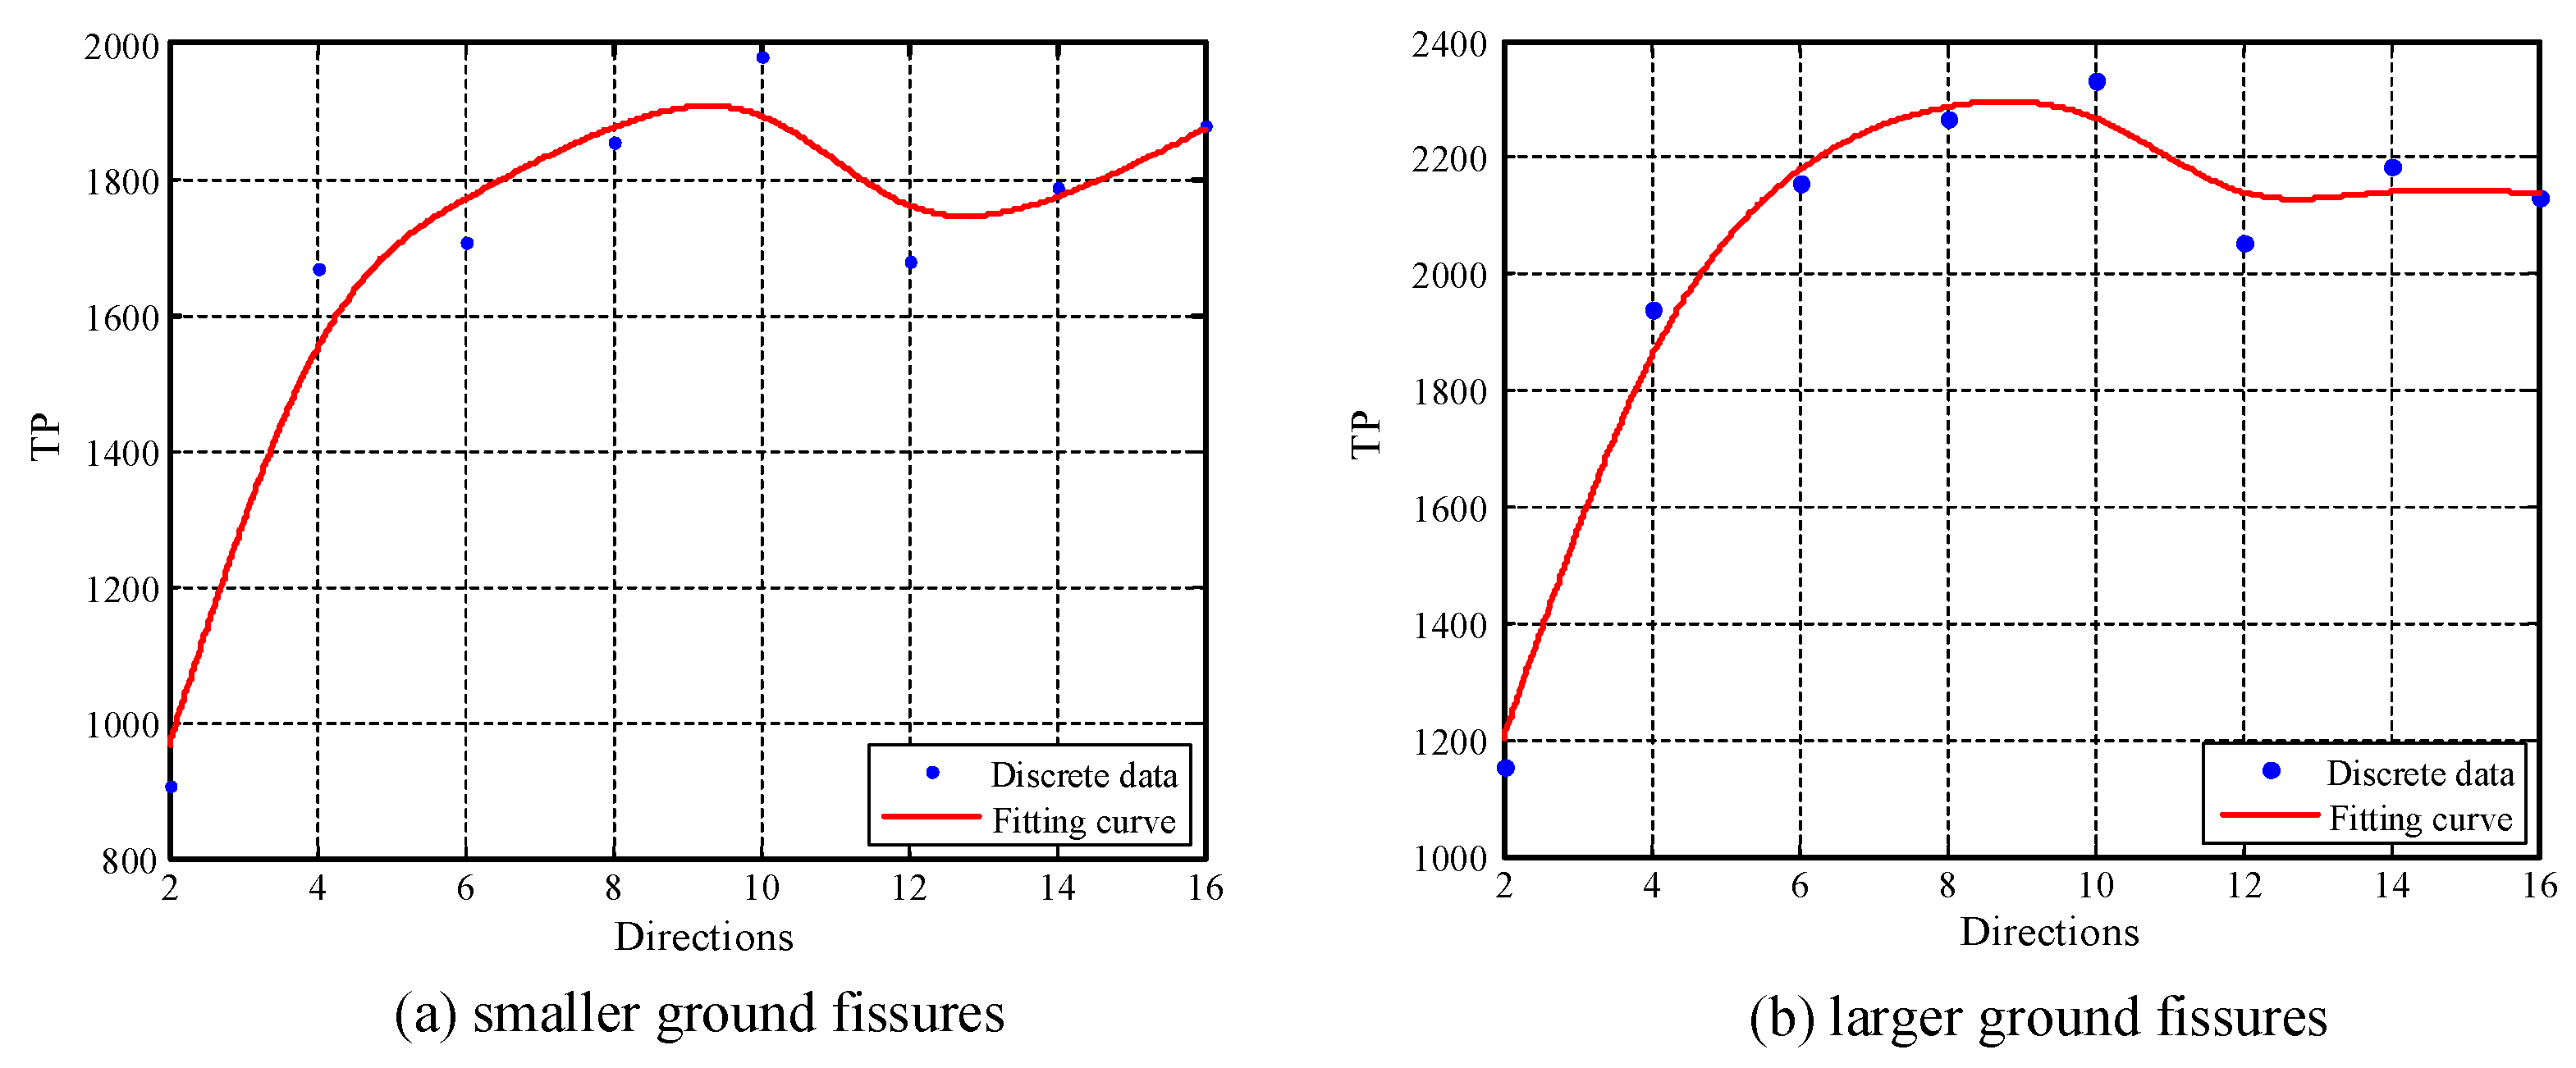
5.1. Selection of Parameter σ and Direction Number in the Template

As described in Section 2.1, the key aspect of the modified MF-FDOG algorithm is the convolution operation using specific templates that are similar to the vertical profile of ground fissures. After convolution, the contrast between ground fissures and other targets will be enhanced. Thus, it is crucial to select an appropriate parameter, σ , for fitting the vertical profile of ground fissures. A previous study [25] noted that: (1) the parameter σ should increase as the image resolution is enhanced; (2) for a ground fissure in a single image, the value of the detectable width will be larger as σ increases. Additionally, σ maintains good sensitivity to five times the optimal width of a ground fissure. Therefore, parameter σ can be improved using the image resolution and the width of ground fissures in the real scene, which is selected according to Table 2.
Additionally, the template of the convolution operation is related to parameter σ and the minimum length of the ground fissure, L. The two parameters define the width and length of the template, respectively. An appropriate template can achieve a better effect when the minimum length of the ground fissure is greater than or equal to L. Therefore, it is necessary to select an optimal value of L according to the actual minimum length of the ground fissure and effectively reduce the possibility of “non-ground fissure” targets in the ground fissure extraction results.
Another important parameter of the modified MF-FDOG algorithm is the template direction number. The direction of the ground fissure is arbitrary; thus, it is necessary to process the entire image using a group of templates with different directions for detecting ground fissures with unknown positions and directions. Multiple template directions can be obtained by setting different angular intervals. For example, if six is selected as the template direction number in the algorithm, the angular interval will be computed by Equation (4). Generally, the larger the template direction number, the more accurate the results.
The template direction number, N, is a crucial parameter that affects the performance of the modified MF-FDOG algorithm in ground fissure extraction from two major aspects: (1) the template direction number, which is related to the sensitivity of direction detection, and the accuracy of ground fissure extraction. A larger direction number not only does fail to improve the accuracy of ground fissure extraction, but also increases the redundancy. Increasing N can even reduce the accuracy of ground fissure extraction. (2) Time consumed in the modified MF-FDOG algorithm has a positive correlation with an increase of N. If we reduce the template direction number, the efficiency of the algorithm will increase linearly. However, the performance of sensitivity in the direction detection will decrease. Therefore, to maintain high accuracy in ground fissure extraction, the template direction number should be reduced as much as possible to improve the efficiency of the modified MF-FDOG algorithm.
To determine the relationship between the accuracy of the modified MF-FDOG algorithm and the direction number of the template, we designed a specific experiment, which can provide important insights into selecting the template direction number. Firstly, only one group of templates is used to extract ground fissures with different widths from the UAV image. To determine whether the template has the same directionality characteristics as the ground fissures of different width, it is necessary to simulate two ground fissures with different widths covering the full direction of 360° (Figure 14). The length and width of the simulated images are 295 pixels. Secondly, we created eight groups of templates with different direction numbers, which have the same values of parameters σ and L. Finally, the modified MF-FDOG convolution operation results are shown in Figure 15 and Figure 16.
To evaluate the accuracy of the results of the modified MF-FDOG algorithm, the results of the visual interpretation were considered as accurate results of the ground fissures (i.e., expert maps). Following a comparison of the results of ground fissure extraction and the expert maps, the number of ground fissure pixels that were correctly extracted is shown in Table 3, where TP indicates true pixels, i.e., correctly extracted pixels. The statistical results indicate that TP reaches a maximum when the direction number is 10. Furthermore, data fitting was conducted using the two result sets in Table 3 to demonstrate the relationship between the accuracy of ground fissure extraction and the direction number of the template (Figure 17a,b). The two fitted curves exhibit the same trend and achieve a peak value around the position associated with direction number 10. It can be inferred that ground fissures with different widths have no effect on the selection of template direction numbers. In addition, the templates with 10 directions can achieve optimal results. It should be noted that the direction in the modified MF-FDOG algorithm only uses even numbers; therefore, 10 is selected to be the optimal direction number in our study. The relevant angular interval is 18°.

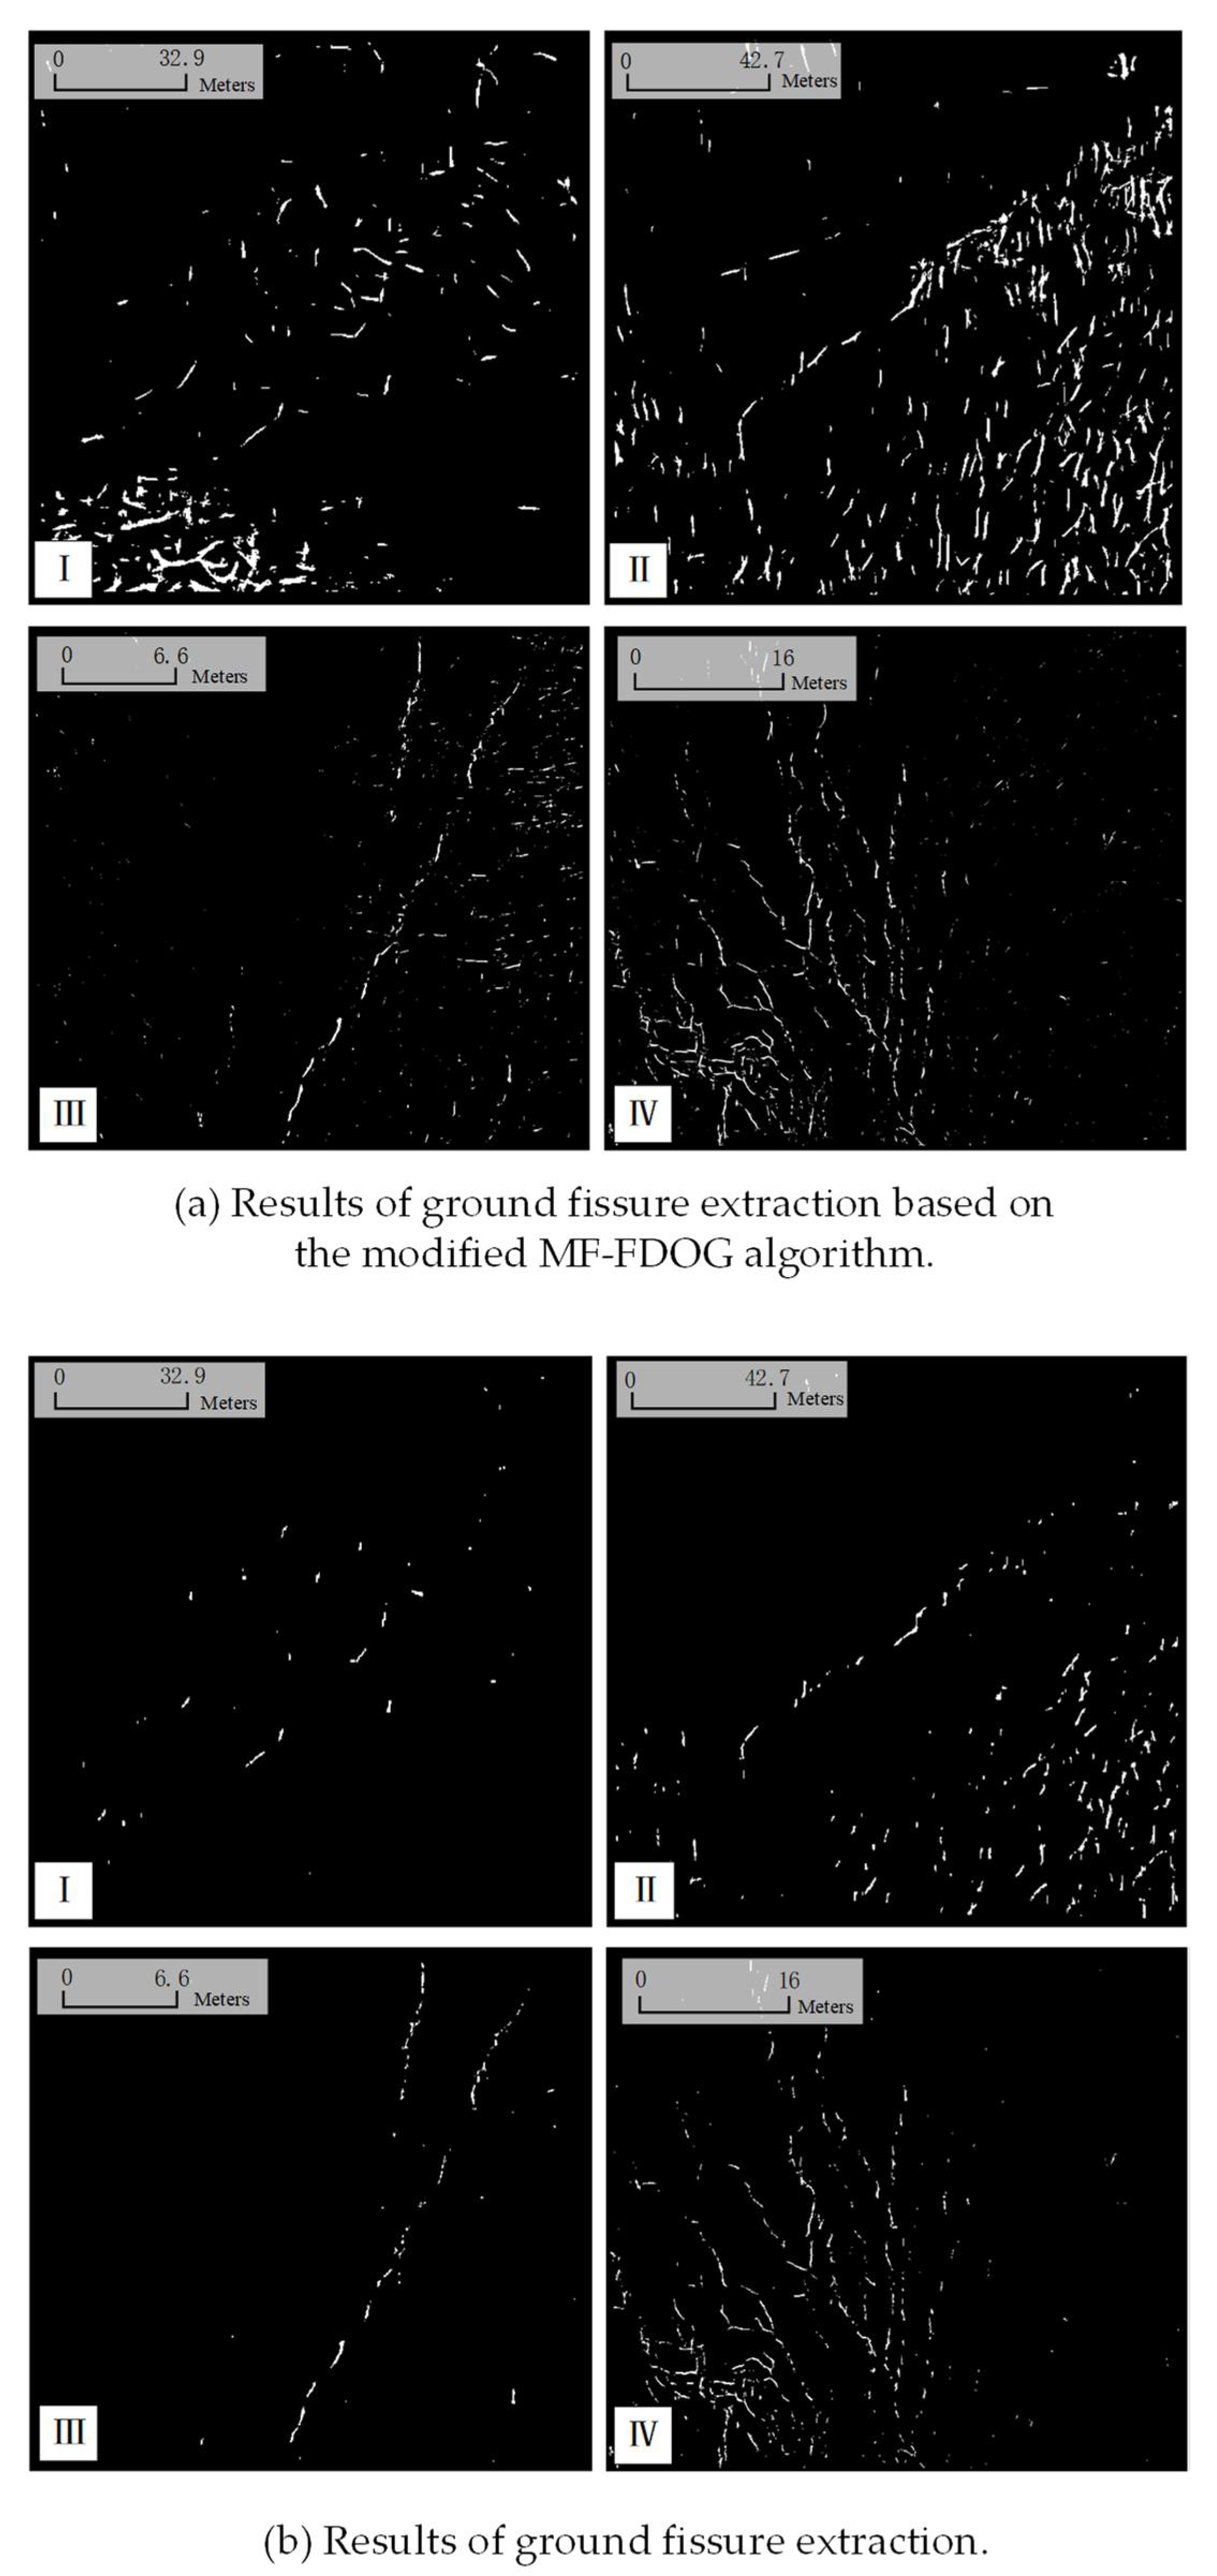
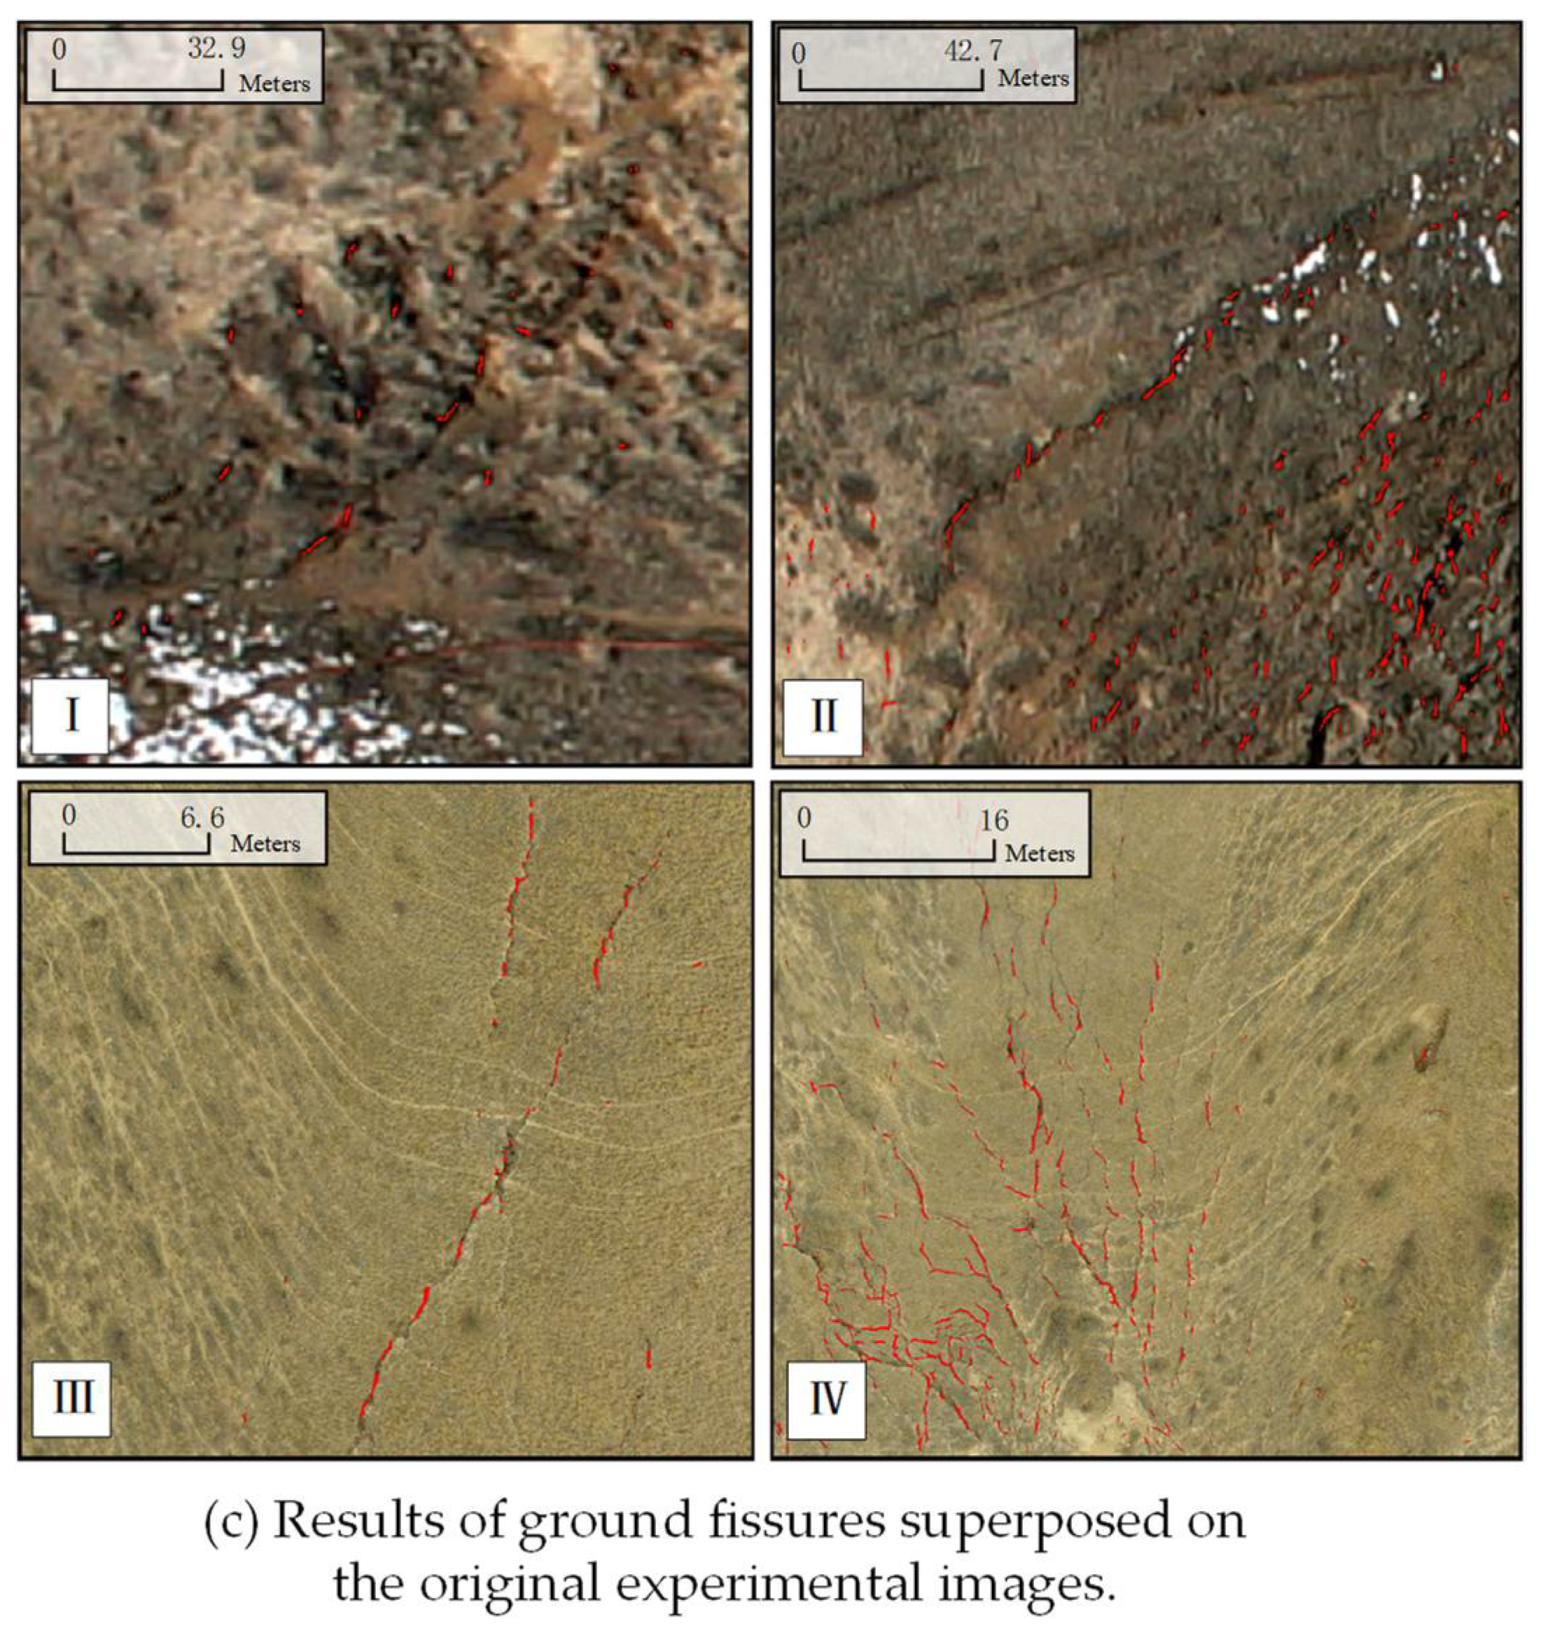
5.2. Results of Ground Fissure Extraction Based on Modified MF-FDOG Algorithm

Figure 12 (I and II) and Figure 13 (III and IV) show the original experimental images of this study. After processing using the modified MF-FDOG algorithm, the results from each step are shown in Figure 18a–c. The ground fissure candidates are presented as bright white against a black background (Figure 18a). The candidate sets include “non-ground fissure” targets, e.g., the edges of snow cover and withered grass.
The RF algorithm was used to identify these targets. The spectral information of snow is most obvious due to its bright white spectral signature. However, it is difficult for the RF algorithm to distinguish ground fissures and the boundaries between snow and loess because they have similar vertical profiles. The use of a dilation operation in the mathematical morphology for the boundaries can eliminate the effect of this phenomenon. Specifically, we combined six types of textural information (mean, variance, homogeneity, entropy, and second moment), which were created by a 7 × 7 co-occurrence matrix, as well as the spectral information, to calculate the required parameters of the RF algorithm by sample training. The samples should be a small polygon shape [36]. The results of extracted vegetation and snow by the RF algorithm are shown in Figure 19 I–IV. Then, the vegetation and snow-induced “false ground fissures” were excluded by mask files. The RF algorithm was integrated into the EnMAP-Box software.
For the RF classification results, overall accuracy [37] and Kappa coefficient [38] are typically employed for the accuracy assessment. The assessment results for image patches I, II, III, and IV are listed in Table 4. According to the accuracy indices, all four groups of RF classification results exhibit good precision. Moreover, the Kappa coefficients for image patches II and III are higher than 90%, which further demonstrates the accuracy and reliability of the RF algorithm. The accuracy of image patch I is lower because of the more complex spectral and textural information in this area.
Finally, the post-processing procedure introduced in Section 3 was conducted, and the final results of ground fissure extraction were derived (Figure 18c I–IV). According to the original image, the ground fissures in Figure 18a I do not satisfy the characteristics of a linear distribution due to their complex and broken shape. Therefore, only a small fraction of ground fissures with a discrete distribution were extracted. After applying the RF algorithm, many error targets caused by shadows remain in the lower right corner of Figure 18b II, along with correct ground fissures. In comparison, Figure 18b III,IV clearly shows the distribution and shape of ground fissures. In order to better demonstrate the effect of the modified MF-FDOG algorithm, the results of ground fissure extraction are superposed on the original experimental image in Figure 18c.

5.3. Accuracy Analysis of the Modified MF-FDOG Algorithm

To evaluate the effectiveness and accuracy of the modified MF-FDOG algorithm used in ground fissure extraction based on UAV images in a loess area, expert images (Figure 20) of ground fissures were obtained by visual interpretation according to surveys and previous experience. These expert images have sufficient precision for use as reference images. Furthermore, three other traditional algorithms (e.g., Canny operator, image segmentation, and SVM (support vector machine) algorithm) were used to extract ground fissures. The results of these algorithms are shown in Figure 21, Figure 22, Figure 23 and Figure 24, in which (a), (b), (c) and (d) represent the results of the Canny operator, image segmentation, and the SVM algorithm, respectively. The accuracy of the shapes marked A–H was analyzed in this study.
The Canny operator, which is only sensitive to edge information in the image, can extract many edge targets. However, it also contains many “non-ground fissures” (e.g., the snow marked by shape B in Figure 21a and the shadow marked by shape D in Figure 22a. In addition, the Canny operator cannot efficiently extract ground fissures with blurred edges (e.g., the ground fissures marked by shapes A in Figure 21a and C in Figure 22a). A key characteristic of the Canny operator for ground fissure extraction is that the majority of ground fissure edges are not completely closed; therefore, it is difficult to extract complete ground fissures.
A crucial aspect of the image segmentation method is dividing the image grayscale into many levels, which can be set to the same range or not. To do this, some objects in the same grayscale level, such as shadows, are considered as ground fissures (as shown by the area marked by shape B in Figure 21b and shape D in Figure 22b). Moreover, the ground fissure results do not retain their clear linear features (see Figure 24b).
Grayscale information and textural information are the main classification bases of the SVM algorithm, which exhibits a good ground fissure extraction result (as shown by the area marked by shapes A–H in Figure 21c to Figure 24c). However, withered grass (see shape B in Figure 21c), shadows caused by micro topography (see shape D in Figure 22c), loess pits (see shape H in Figure 24c), and even loess close to ground fissures (see shape A in Figure 21c) are wrongly extracted by the SVM algorithm without considering the geometric information of ground fissures. For ground fissures with large variations in width, the SVM algorithm exhibits good adaptability during extraction (as shown by the areas marked by shape E in Figure 23c and shape G in Figure 24c).
In contrast to the above algorithms, the modified MF-FDOG algorithm is sensitive to ground fissures with small and narrow features. The extraction results retain good ground fissure geometry (as shown by shape A in Figure 21d, shape C in Figure 22d, and shape G in Figure 24d). However, the modified MF-FDOG algorithm does not obtain a good result if the ground fissures do not exhibit a linear distribution in the local area (see shape E in Figure 23d).

5.4. Accuracy Assessment of the Different Ground Fissure Extraction Algorithms

5.4.1. Self-Assessment of the Modified MF-FDOG Algorithm

To evaluate the results of ground fissure extraction, the ROC was used for the accuracy assessment. The ROC was initially applied in the medical field to evaluate the performance of feature extraction methods. The first application of the ROC in machine learning was in 1889 [35]. For the accuracy assessment of linear targets extractions, Tveite et al. [39] suggested that the buffer zone of the result of the modified MF-FDOG algorithm should be increased step by step and overlaid on an expert map. Accordingly, we selected the horizontal distance between the central point of two adjacent pixels as the single unit of the buffer zone. and then increased the buffer zone from one to ten units. Subsequently, the different buffer zones of each ground fissure were used for the overlay analysis.
By searching each ground fissure pixel after buffer processing, ground fissure pixels were deemed to be correctly extracted if the pixels of the expert map in the same position are also ground fissure pixels. On the contrary, pixels are incorrectly extracted if the pixels of the expert map in the same position are not ground fissure pixels. If the pixels in the raw image corresponding to ground fissure pixels in the expert map are not recognized by the algorithm, the ground fissure pixels are missed. We count the number of instances of the above three cases and calculate the TPR (true positive rate) and FPR (false positive rate) according to Equations (13) and (14), which express the ratio of correct and incorrect extraction, respectively. The results are shown in Table 5:
TPR = TN M total
FPR = FN N total M total
Here, TN and FN denote the correctly extracted pixel number and incorrectly extracted pixel number, respectively; N total represents the total pixel number of an image; and M total represents the pixel number of the expert maps derived by visual interpretation. The range of TPR and FPR is [0, 1].
The ROCs were drawn using Table 5 and are shown in Figure 25. The vertical axis represents the TPR, and the horizontal axis represents the FPR. As the FPRs for part I, II, and IV are close to 10%, their TPRs all exceed 80%. The FPR for patch III is only 2.6% when the TPR exceeds 80%, demonstrating that the ground fissure extraction accuracy for patch III is the highest among all four image patches.

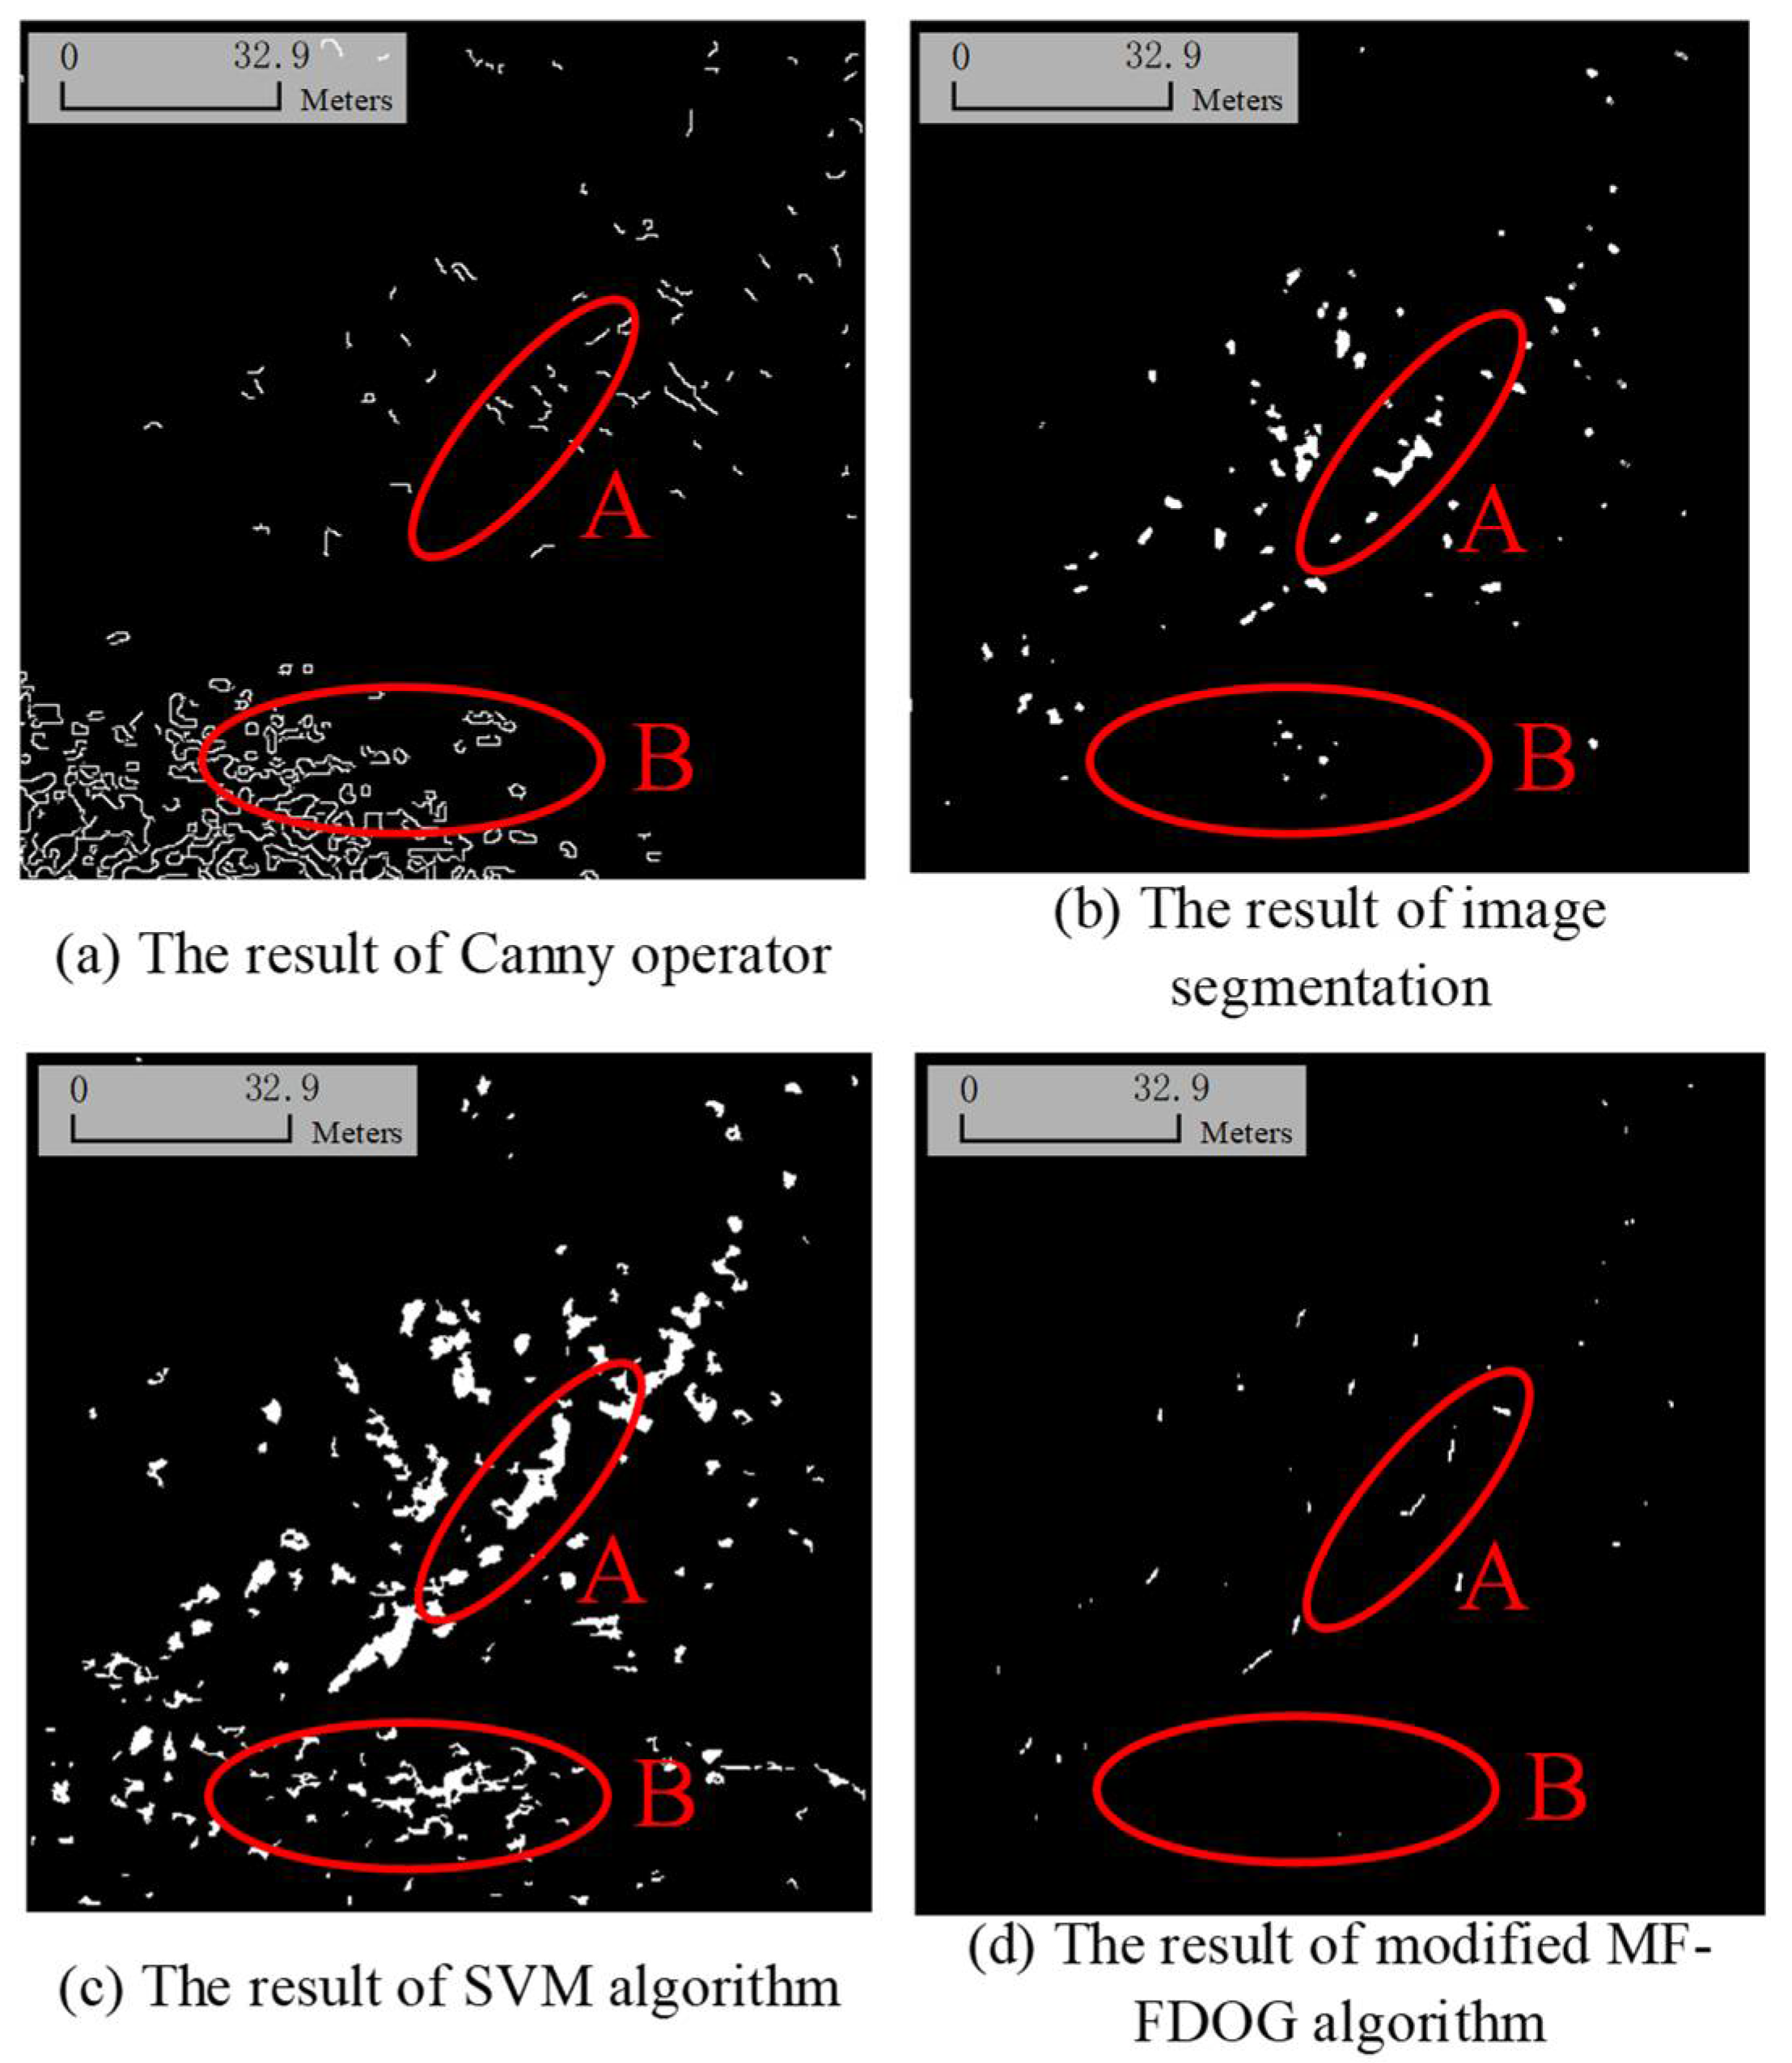
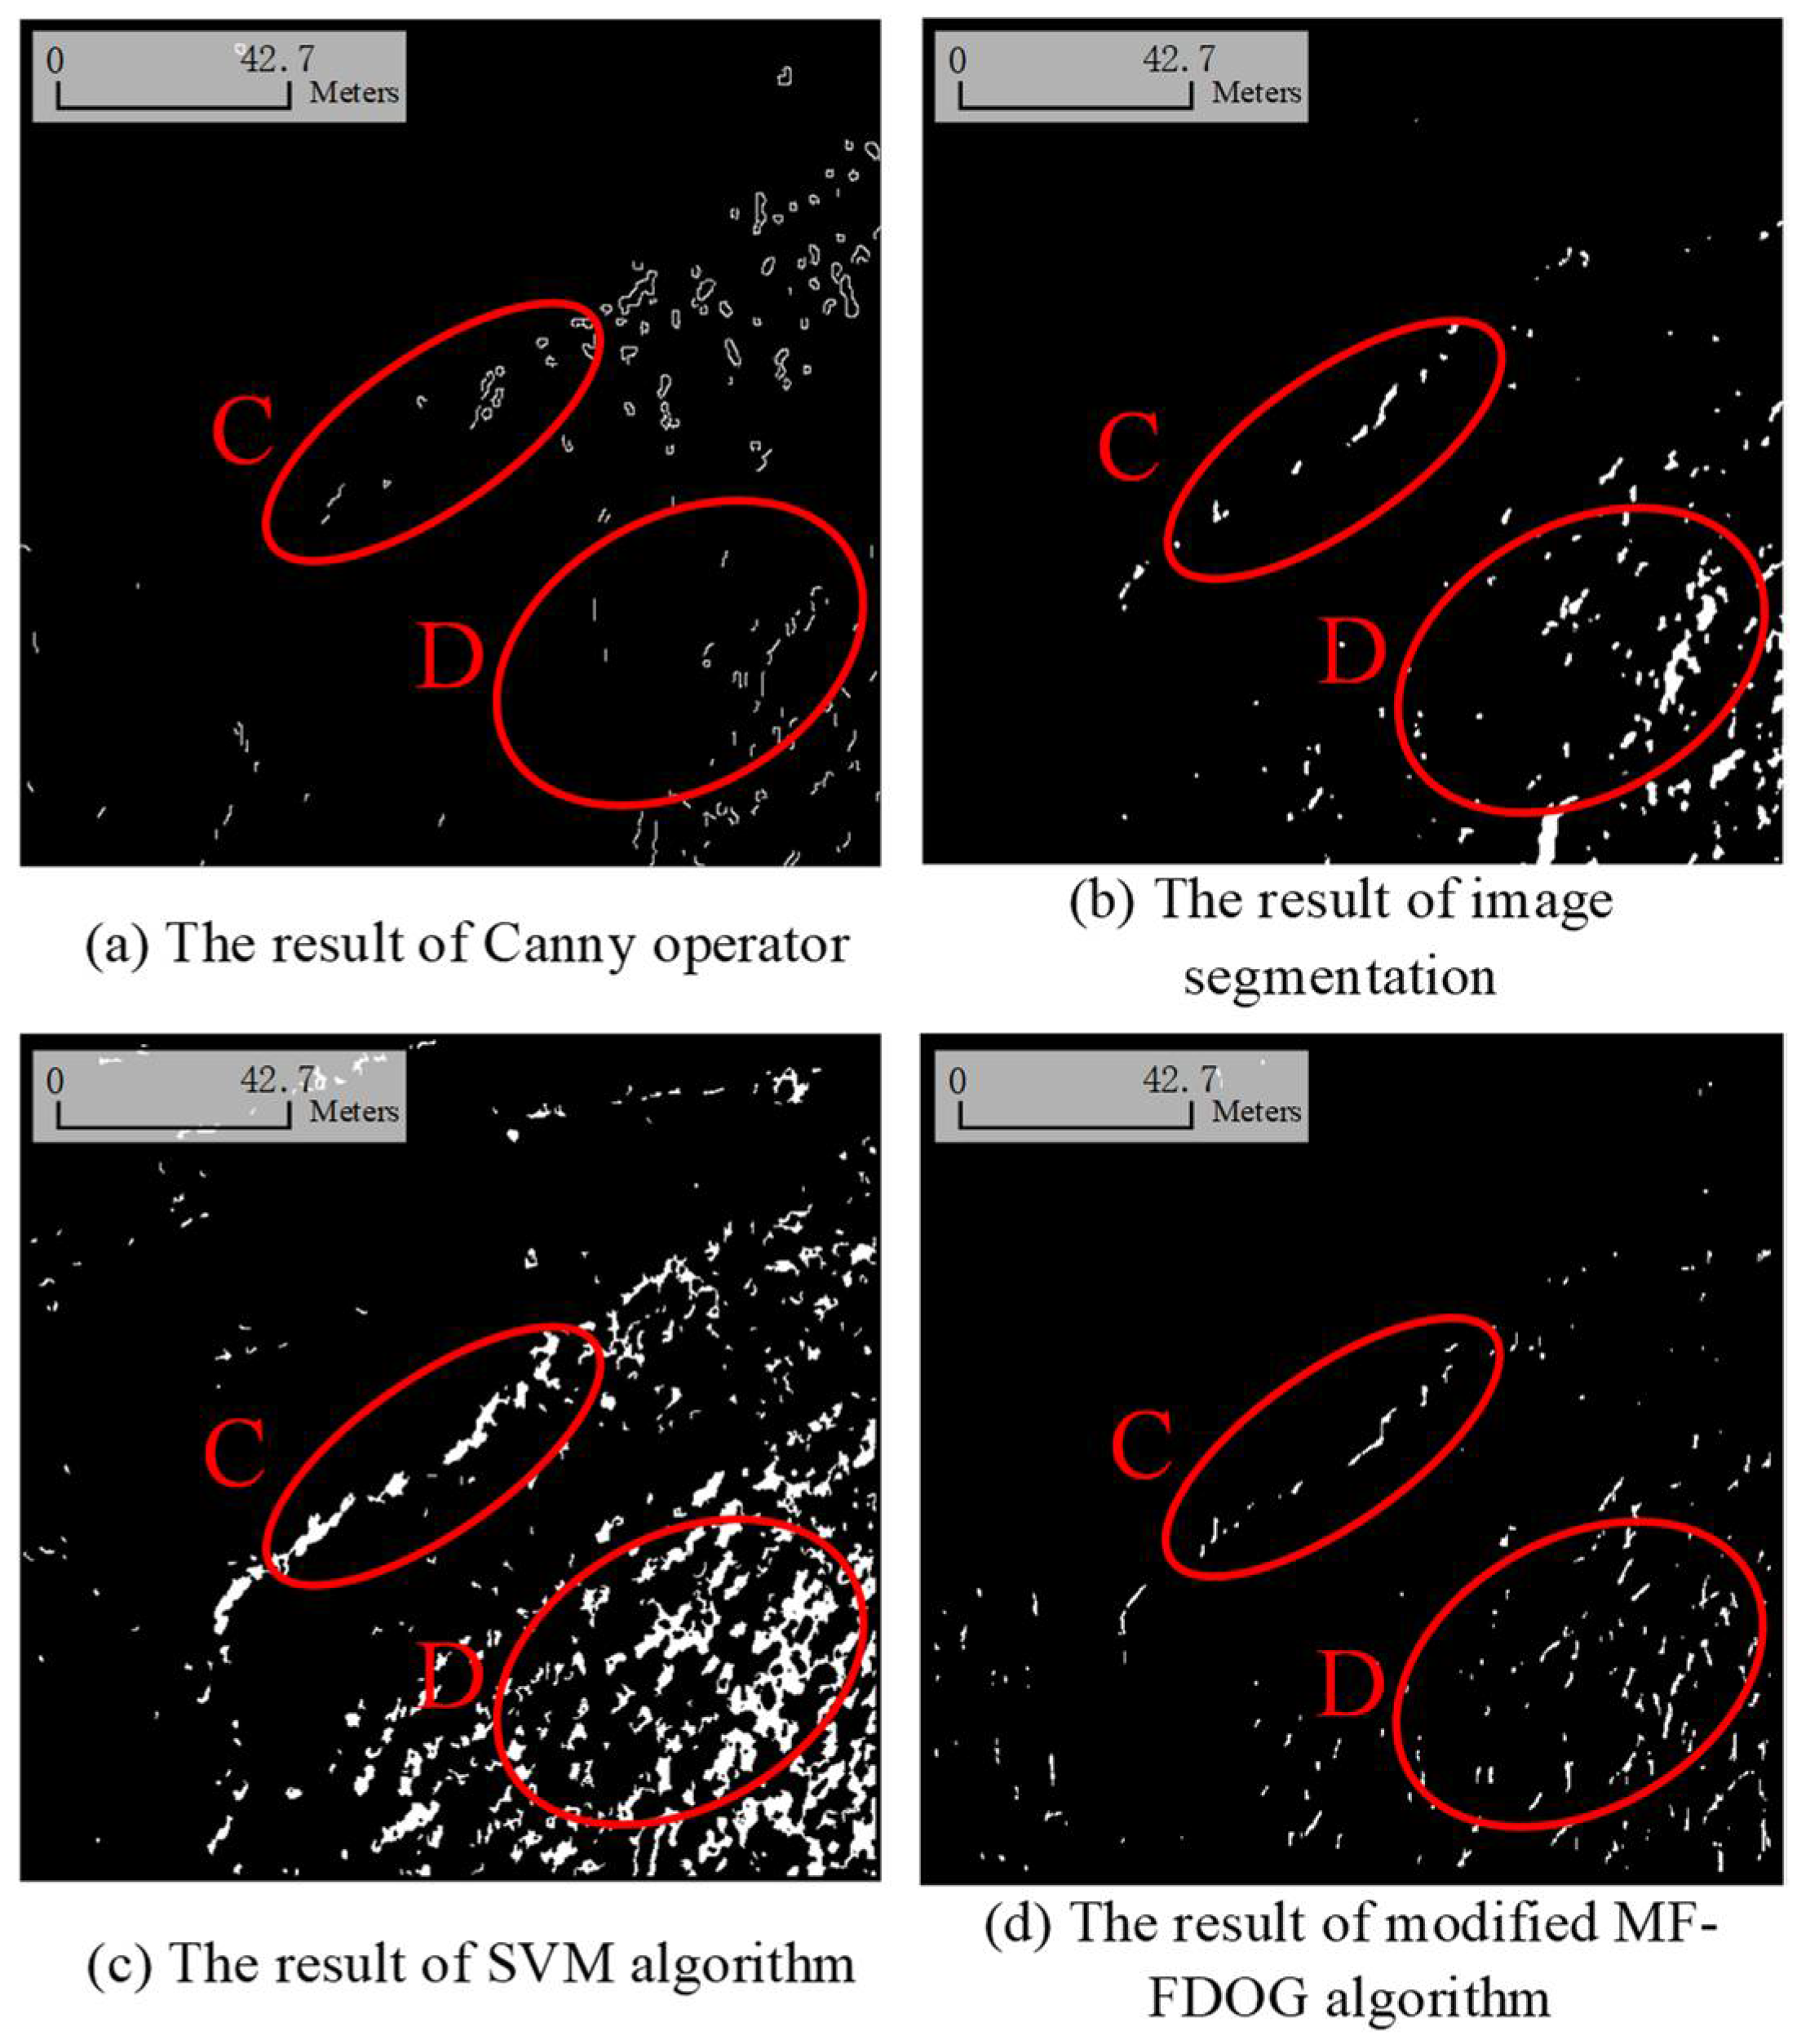
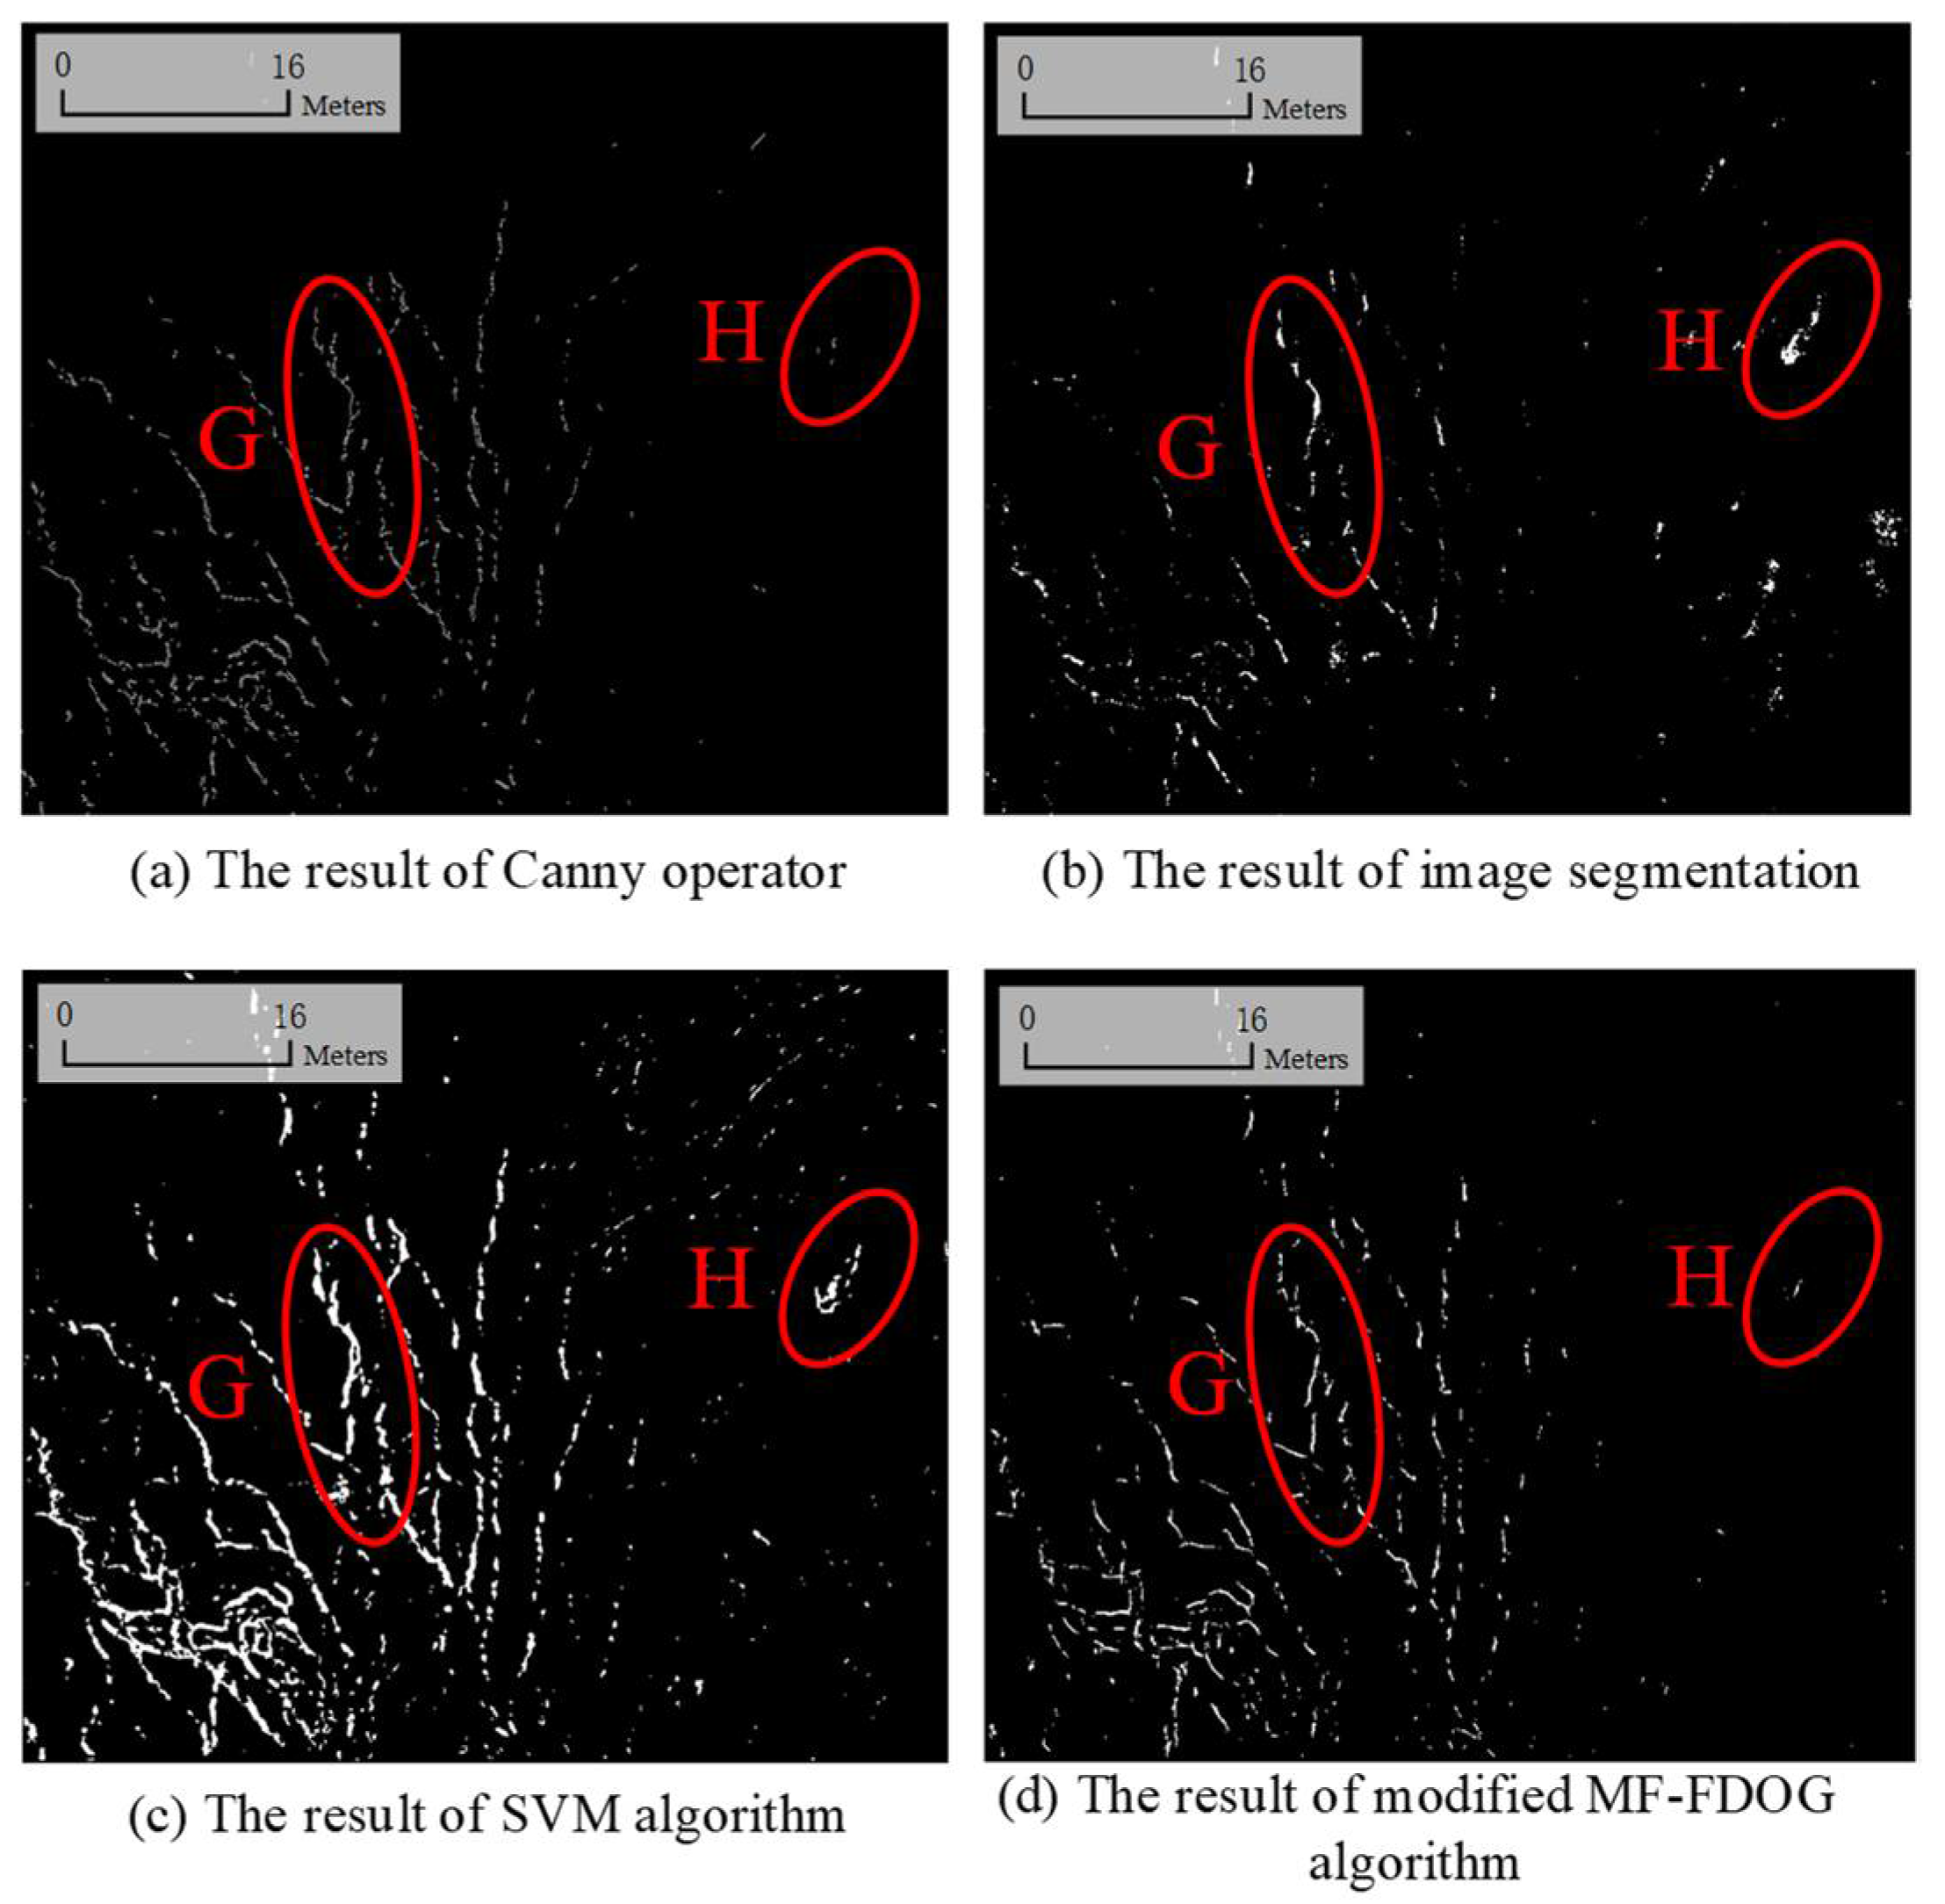
5.4.2. Accuracy Comparison of the Different Ground Fissure Extractions Algorithms

Ground fissures can be extracted by the Canny algorithm in the form of edges, which cannot be compared with the SVM algorithm, grayscale threshold algorithm, or modified MF-FDOG algorithm. Therefore, we compared and analyzed the latter three algorithms. The overall accuracy [37] is calculated using Equation (15), and results are shown in Table 6:
ε = TN + TN ¯ N sum
where ε denotes the overall accuracy and T N ¯ denotes the number of correctly extracted background pixels. As shown by the results (Table 6 and Figure 26), the modified MF-FDOG algorithm is better than both the SVM algorithm and the grayscale threshold segmentation algorithm.

6. Conclusions and Future Works

The image of the loess region contains rich texture information, which makes it difficult for traditional edge extraction operators to accurately distinguish ground cracks and other linear objects, resulting in limited extraction accuracy. In order to improve the accuracy of ground fissure extraction, this study proposes an improved MF-FDOG algorithm. Experimental results show that this method has high accuracy and robustness.
In this study, the normalization was used to generate the response matrices of the convolution, which solves the instability of the sensitivity correction parameter and effectively extract initial ground fissure candidates. At the same time, the automatic evaluation of optimal directions and the number of the MF/FDOG template can effectively improve the efficiency of the algorithm. In addition, using the sum of the mean value and two times the mean square error in the Gaussian curve as the threshold instead of an arbitrary threshold can achieve an adaptive threshold parameter, which effectively avoids the influence of uncertainty in image segmentation.
In future work, our research will focus on the improvement of the efficiency of data processing and the accuracy of ground fissure extraction. Firstly, the parallel processing technology based on graphics processing unit (GPU) [40] calculations and the development of multiple programming languages (such as CUDA and OpenCL [41]) can greatly improve the efficiency of data processing; secondly, although the vertical photography image has the advantage that the image data can be processed quickly, for areas with large slope fluctuations, the ground crack target will be deformed. Therefore, the images of different spatial resolutions or different types of images can be combined to improve the accuracy of fracture extraction, thereby further ensuring the robustness of the proposed method.

Author Contributions

Conceptualization, G.L. and H.J.; methodology, B.W.; validation, R.Z.; formal analysis, B.Y.; investigation, S.W.; data curation, R.Z.; writing—original draft preparation, B.W.; writing—review and editing, H.J. and G.L.; supervision, G.L.; project administration, G.L. All authors have read and agreed to the published version of the manuscript.

Funding

This research was funded by the National Key R&D Program of China under Grant 2017YFB0502700, the National Natural Science Foundation of China under Grant 41701535 and Grant 41771402 and the Sichuan Science and Technology Program under Grant 2019YJ0224.

Institutional Review Board Statement

Not applicable.

Informed Consent Statement

Not applicable.

Data Availability Statement

Data are available on request.

Acknowledgments

The authors would like to thank the Third Aerial Survey and Remote Sensing Institute of the Ministry of Natural Resources for providing the UAV images.

Conflicts of Interest

The authors declare no conflict of interest.

References

  1. Wang, S.; Dong, Y.G.L. Geology and Geomorphology; China Agricultural University Press: Beijin, China, 2013; pp. 257–267. [Google Scholar]
  2. Chai, H.X.; Cheng, W.M.; Qiao, Y.L. Classification system of 1:1000,000 digital loess geomorphology in China Geo-information. Science 2006, 8, 6–13. [Google Scholar]
  3. Wang, X.Y.; Mao, S.H.; Zhang, Y.J. Differential Settlement due to Ground Fissures in Xi’an. Adv. Mater. Res. 2015, 1065–1069, 410–413. [Google Scholar] [CrossRef]
  4. Li, Q.C.; Ye, P.; Shao, G.Z.; Luo, W.B. Integrated Geophysical Detection on Ground Fissure in Shanxi Jingyang Seismostation of National Highway 211. Chin. J. Eng. Geophys. 2014, 11, 106–111. [Google Scholar]
  5. Wang, Z.F.; Shen, S.L.; Cheng, W.C.; Xu, Y.S. Ground fissures in Xi’an and measures to prevent damage to the Metro tunnel system due to geohazards. Environ. Earth Sci. 2016, 75, 511. [Google Scholar] [CrossRef]
  6. Stumpf, A.; Niethhammer, U.; Rothmund, S.; Mathieu, A.; Malet, J.P.; Kerle, N.; Joswing, M. Advanced image analysis for automated mapping of landslide surface fissures. Landslide Sci. Pract. 2013, 2, 357–363. [Google Scholar]
  7. Giuseppe, P.; Nicolai, P. Edge and line oriented contour detection: State of the art. Image Vis. Comput. 2011, 29, 79–103. [Google Scholar]
  8. Quackenbush, L.J. A review of techniques for extracting linear features from imagery. Photogramm. Eng. Remote Sens. 2004, 70, 1383–1392. [Google Scholar] [CrossRef] [Green Version]
  9. Shruthi, B.V.; Kerle, N.; Jetten, V.G. Object-based gully feature extraction using high spatial resolution imagery. Geomorphology 2011, 134, 260–268. [Google Scholar] [CrossRef]
  10. Baruch, A.; Filin, S. Detection of gullies in roughly textured terrain using airborne laser scanning data. J. Photogramm. Remote Sens. 2011, 66, 564–578. [Google Scholar] [CrossRef]
  11. Jain, R.; Kasturi, R.; Schunck, B.G. Machine Vision; McGraw-Hill: New York, NY, USA, 1995. [Google Scholar]
  12. Lawrence, G.R. Machine Perception of Three-Dimensional Solids; Institute of Technology: Boston, MA, USA, 1963. [Google Scholar]
  13. Sobel, I. Camera Models and Machine Perception; California Department of Computer Science, Stanford University: Stanford, CA, USA, 1970. [Google Scholar]
  14. Prewitt, J.M.S. Object Enhancement and Extraction. Picture Processing and Psychopictorics; Academic Press: Cambridge, MA, USA, 1970. [Google Scholar]
  15. Koenderink, J.J. Theory of “Edge-Detection”. Anal. Sci. Eng. Beyond 2012, 6, 35–49. [Google Scholar]
  16. Gonzalez, C.I.; Melin, P.; Castro, J.R.; Mendoza, O.; Castillo, O. An improved sobel edge detection method based on generalized type-2 fuzzy logic. Soft Computing—A Fusion of Foundations. Methodol. Appl. 2016, 20, 773–784. [Google Scholar]
  17. Manasa, N.; Mounica, G. Brain tumor detection based on canny edge detection algorithm and its area calculation. Int. Comput. Math. Sci. 2016, 5, 10–13. [Google Scholar]
  18. Hu, X. Research on Subway Tunnel Crack Detection Technology Based on Image Processing; Beijing Jiaotong University: Beijing, China, 2014. [Google Scholar]
  19. Alam, M.A.; Ali, M.M.N.; Syed, M.A.A.; Sorif, N.; Rahaman, M.A. An algorithm to detect and identify defects of industrial pipes using image processing. In Proceedings of the 8th International Conference on Software, Knowledge, Information Management and Applications (SKIMA), Dhaka, Bangladesh, 18–20 December 2014; pp. 1–6. [Google Scholar]
  20. Khalifa, I.; Aboutabl, A.E.; Barakat, G.S.A. A New Image-Based Model for Predicting Cracks in Sewer Pipes. Int. J. Adv. Comput. Sci. Appl. 2013, 4, 65–71. [Google Scholar] [CrossRef] [Green Version]
  21. Kirstein, S.; Muller, K.; Walecki, M.N.; Desemo, T.M. Robust adaptive flow line detection in sewer pipes. Autom. Constr. 2012, 21, 24–31. [Google Scholar] [CrossRef]
  22. Li, Z.; Liu, X.L. Geomorphic regionalization and agricultural evaluation of geomorphic featuresin Gansu. J. Gansu Agric. Univ. 1994, 30, 444–449. [Google Scholar]
  23. Chaudhuri, S.; Chatterjee, S.; Katz, N.; Nelson, M.; Goldbaum, M. Detection of blood vessels in retinal images using two-dimensional matched filters. IEEE Trans. Med Imaging 1989, 8, 263–269. [Google Scholar]
  24. Zhang, B.; Zhang, L.; Zhang, L.; Karray, F. Retinal vessel extraction by matched filter with first-order derivative Gaussian. Comput. Biol. Med. 2010, 40, 438–445. [Google Scholar] [CrossRef] [PubMed] [Green Version]
  25. Stumpf, A.; Malet, J.P.; Kerle, N.; Niethammer, U.; Rothmund, S. Image-based mapping of surface fissures for the investigation of landslide dynamics. Geomorphology 2013, 186, 12–27. [Google Scholar] [CrossRef] [Green Version]
  26. Breimal, L. Random Forests. Machine Learning; Springer: Berlin/Heidelberg, Germany, 2001; Volume 45, pp. 5–32. [Google Scholar]
  27. Turin, G. An introduction to matched filters. IRE Trans. Inf. Theory 1960, 6, 311–329. [Google Scholar] [CrossRef] [Green Version]
  28. Woodward, P.M. Probability and Information Theory with Applications to Radar; Pergamon Press Ltd.: New York, NY, USA, 1953; Volume 41, pp. 59–68. [Google Scholar]
  29. Nevatla, R.; Babu, K.R. Linear feature extraction and description. Comput. Graph. Image Process. 1980, 13, 257–269. [Google Scholar] [CrossRef]
  30. Torres, S.J.; Peńa, J.M.; Castro, A.I.D.; López, G.F. Multi-temporal mapping of the vegetation fraction in early-season wheat fields using images from UAV. Comput. Electron. Agric. 2014, 103, 104–113. [Google Scholar] [CrossRef]
  31. Rasmussen, J.; Ntakos, G.; Nielsen, J.; Svensgaard, J.; Poulsen, R.N.; Christensen, S. Are vegetation indices derived from consumer-grade cameras mounted on UAVs sufficiently reliable for assessing experimental plots. Eur. J. Agron. 2016, 74, 75–92. [Google Scholar] [CrossRef]
  32. Hung, C.; Xu, Z.; Sukkarieh, S. Feature learning based approach for weed classification using high resolution aerial images from a digital camera mounted on a UAV. Remote Sens. 2014, 6, 12037–12054. [Google Scholar] [CrossRef] [Green Version]
  33. Feng, Q.; Liu, J.; Gong, J. UAV remote sensing for urban vegetation mapping using random forest and texture analysis. Remote Sens. 2015, 7, 1074–1094. [Google Scholar] [CrossRef] [Green Version]
  34. Serra, J. Image Analysis and Mathematical Morphology. Orlando; Academic Press: Cambridge, MA, USA, 1982. [Google Scholar]
  35. Fawcett, T. An introduction to ROC analysis. Pattern Recognit. Lett. 2006, 27, 861–874. [Google Scholar] [CrossRef]
  36. Chen, D.M.; Stow, D. The effect of training strategies on supervised classification at different spatial resolutions. Photogramm. Eng. Remote Sens. 2002, 68, 1155–1161. [Google Scholar]
  37. Emami, H.; Mojaradi, B. A New Method for Accuracy Assessment of Sub-Pixel Classification Results. Am. J Eng. Appl. Sci. 2009, 2, 456–465. [Google Scholar] [CrossRef] [Green Version]
  38. Janssen, L.L.F.; Vanderwel, F.J.W. Accuracy assessment of satellite-derived land-cover data: A review. Photogramm. Eng. Remote Sens. 1994, 60, 419–426. [Google Scholar]
  39. Tveite, H.; Langaas, S. An accuracy assessment method for geographical line data sets based on buffering. Int. J. Geogr. Inf. 1999, 13, 27–47. [Google Scholar] [CrossRef]
  40. Owens, J.D.; Houston, M.; Luebke, D.; Green, S.; Stone, J.E.; Phillips, J.C. GPU Computing. IEEE 2008, 96, 879–899. [Google Scholar] [CrossRef]
  41. Wei, B.W.; Li, T.; Li, G.Y.; Wang, Z.H.; He, M.; Shi, Y.L.; Liu, L.Y.; Zhang, R. Applied analysis of image accelerating distortion correction of OpenCL technology on heterogeneous platform. Comput. Sci. 2016, 43, 167–169. [Google Scholar]
Figure 1. (a) Photograph and (b) pixel value distribution (red line shows the fitting curve) of ground fissures in loess areas.
Remotesensing 13 01784 g001
Figure 2. (a,b) are templates of MF and FODG filters, respectively (parameters: σ   = 1.5, L   = 9.0,   θ   = 90°).
Remotesensing 13 01784 g002
Figure 3. Illustration of the template direction.
Remotesensing 13 01784 g003
Figure 4. Frequency histogram of R ( x , y ) ¯ .
Remotesensing 13 01784 g004
Figure 5. Analog signals of ground fissures and edges (modified from Stumpf et al. 2013): (a) analog signals of linear features; (b) response value of MF signals; (c) response value of FDOG signals; and (d) differential value of MF-FDOG signals.
Remotesensing 13 01784 g005
Figure 6. Illustration of connected fields and hit templates.
Remotesensing 13 01784 g006
Figure 7. Hit templates and miss templates((a) and (b) represent all cases of hit template and miss template respectively).
Remotesensing 13 01784 g007
Figure 8. Flow chart of hit-or-miss transform.
Remotesensing 13 01784 g008
Figure 9. Results of hit-or-miss transform and fragment removal.
Remotesensing 13 01784 g009
Figure 10. Image of the locations of the two study areas, accessed on 7 May 2018 (http://www.91weitu.com/).
Remotesensing 13 01784 g010
Figure 11. Equipment used for image acquisition ((a) is a homemade UAV that comes from the Third Aerial Survey and Remote Sensing Institute of the Ministry of Natural Resources; (b) is Phantom 4 Pro comes from SZ DJI Technology Co., Ltd.).
Remotesensing 13 01784 g011
Figure 12. Experimental images of mountains covering the tunnel (the two local areas marked by the rectangles I–II were selected for ground fissure extraction).
Remotesensing 13 01784 g012
Figure 13. Experimental images of the mining area (the two local areas marked by the rectangles III–IV were selected for ground fissure extraction).
Remotesensing 13 01784 g013
Figure 14. Illustration of analog images: (a) small-width ground fissure; and (b) large-width ground fissure.
Remotesensing 13 01784 g014
Figure 15. Modified MF-FDOG convolution results for the small-width ground fissure.
Remotesensing 13 01784 g015
Figure 16. Modified MF-FDOG convolution results for the large-width ground fissure.
Remotesensing 13 01784 g016
Figure 17. Fitted curve representing the relationship between template direction numbers and true ground fissure pixel numbers obtained for smaller ground fissures (Figure 14a) and larger ground fissures (Figure 14b).
Remotesensing 13 01784 g017
Figure 18. Results of experimental images of ground fissure extraction.
Remotesensing 13 01784 g018aRemotesensing 13 01784 g018b
Figure 19. Results of the RF algorithm: (ad) are the classification results of RF for patch I–IV, respectively.
Remotesensing 13 01784 g019
Figure 20. Results of visual interpretation.
Remotesensing 13 01784 g020
Figure 21. Comparison of ground fissure extraction in image patch I.
Remotesensing 13 01784 g021
Figure 22. Comparison of ground fissure extraction in image patch II.
Remotesensing 13 01784 g022
Figure 23. Comparison of ground fissure extraction in image patch III.
Remotesensing 13 01784 g023
Figure 24. Comparison of ground fissure extraction in image patch IV.
Remotesensing 13 01784 g024
Figure 25. ROCs of the ground fissure extraction results.
Remotesensing 13 01784 g025
Figure 26. Overall accuracy of the ground fissure extraction results.
Remotesensing 13 01784 g026
Table 1. Parameters of the UAV equipment.
Tunnel AreaMining Area
Properties of sensorModelSONY DSC-RX1PHANTOM4
Resolution (dpi)6000 × 40004000 × 2250
Effective focal length (mm)3520
Photoreceptor size (mm)35.8 × 23.925.4 × 25.4
UAV platformFlight height (m)3000150
Flight speed (km/h)90–12072
Payload (kg)3–5
Table 2. Relationship between the image resolution and parameter σ .
Resolution (m)0.10.080.5
σ (px)0.670.751.34
Table 3. Statistics of true pixels for analog images.
Direction
TP246810121416
Small9081667170818541979167917881880
Large11541938215522672331205421862132
Table 4. User accuracy and producer accuracy.
IIIIIIIV
Overall accuracy/%79.8193.1094.9897.22
Kappa accuracy/%73.5590.8989.5796.01
Table 5. Buffer analysis of the tunnel area and mining area.
-Tunnel AreaMining Area
Subset ISubset IISubset IIISubset IV
TPRFPRTPRFPRTPRFPRTPRFPR
Buffer 10.11950.00220.29380.00800.24900.00050.33870.0027
Buffer 20.24890.00580.42760.01770.40810.00170.51650.0075
Buffer 30.43230.01440.64720.03570.56380.00460.65370.0184
Buffer 40.53380.02230.72530.05130.63120.00740.70900.0282
Buffer 50.61500.03310.78210.07100.68530.01080.75470.0405
Buffer 60.67670.04680.81810.09360.72700.01440.78720.0526
Buffer 70.71350.05740.83990.11040.75790.01820.81410.0652
Buffer 80.75340.07250.86350.13300.78230.02230.83840.0795
Buffer 90.78950.08950.87440.14440.80380.02700.85810.0947
Buffer 100.82180.10630.89570.18030.81800.03150.87500.1087
Table 6. Comparison of the overall accuracy of three ground fissure extraction algorithms.
SubsetSVM AlgorithmGrayscale Threshold AlgorithmThe Modified MF-FDOG Algorithm
I0.94620.97820.9836
II0.92170.97580.9806
III0.98260.98690.9871
IV0.95870.97540.9749
Publisher’s Note: MDPI stays neutral with regard to jurisdictional claims in published maps and institutional affiliations.

