Abstract
Wastewater treatment plants (WWTPs) are sources of greenhouse gases, hazardous air pollutants and offensive odors. These emissions can have negative repercussions in and around the plant, degrading the quality of life of surrounding neighborhoods, damaging the environment, and reducing employee’s overall job satisfaction. Current monitoring methodologies based on fixed gas detectors and sporadic olfactometric measurements (human panels) do not allow for an accurate spatial representation of such emissions. In this paper we use a small drone equipped with an array of electrochemical and metal oxide (MOX) sensors for mapping odorous gases in a mid-sized WWTP. An innovative sampling system based on two (10 m long) flexible tubes hanging from the drone allowed near-source sampling from a safe distance with negligible influence from the downwash of the drone’s propellers. The proposed platform is very convenient for monitoring hard-to-reach emission sources, such as the plant’s deodorization chimney, which turned out to be responsible for the strongest odor emissions. The geo-localized measurements visualized in the form of a two-dimensional (2D) gas concentration map revealed the main emission hotspots where abatement solutions were needed. A principal component analysis (PCA) of the multivariate sensor signals suggests that the proposed system can also be used to trace which emission source is responsible for a certain measurement.
Keywords:
drone; UAV; gas sensors; odour; air pollution; industrial emissions; mapping; environmental monitoring 1. Introduction
The monitoring of emissions to air is a key element in preventing and reducing pollution from industrial installations, in ensuring a high level of protection of the environment, and in minimizing odor impact to the surrounding population. Industrial activities such as production of energy, intensive rearing of poultry and pigs or waste management are sources of greenhouse gases (GHGs), hazardous air pollutants (HAPs) and offensive odors. In 2017, emissions from waste management sites made up 3% of total GHG emissions and 5% of particulate matter (PM) emissions in Spain [1]. These facilities are also responsible for many citizen complaints to the local authorities regarding odor annoyance episodes [2]. The objectives of monitoring are many and diverse. For example, monitoring can be applied to assess compliance with environmental permit requirements; check the performance of odor abatement systems; determine the relative contribution of different sources to the overall emissions; report emissions for national and international inventories, e.g., the Pollutant Release and Transfer Registers (PRTRs); and many others [3].
In Europe, industrial air emissions are regulated by the Industrial Emissions Directive 2010/75/EU (IED) [4]. The IED and national regulations impose requirements on the monitoring approach to be used for a particular installation, for example the requirement for continuous monitoring of certain pollutants with specific instruments. The accepted monitoring methodologies and reference instruments for each type of gas are described in the Best Available Technique (BAT) document [5]. The quantification of the total emissions of an installation often requires the assessment of channeled (point-like) emissions and diffuse emissions including fugitive emissions. Channeled emissions are relatively easy to monitor with automated measuring systems (AMS) permanently installed on-site. However, the quantification of diffuse emissions might not be easy with AMS and is, in general, labor- and cost-intensive due to the number of potential sources.
To simplify the measurement of diffuse emissions, the European IED specifies that “measurements techniques based on the use of a transportable measurement platform, despite being less accurate than reference methods, may be used to supplement the information supplied by fixed measurements for the determination of the spatial concentration distribution or for the assessment of diffusive gas emissions”. The advantage of a portable instrument over a set of fixed analyzers installed on different locations of the plant is the lower investment and operational costs, as well as higher spatial resolution of the measurements. However, manually scanning an entire plant with a portable instrument is a tedious and risky task. The use of terrestrial robots may seem the most obvious solution to this problem, however their limited maneuverability hinders their practical application in realistic scenarios which often include obstacles (e.g., buildings, stairs, trees, etc.) and elevated emission sources (e.g., chimneys, flares).
Aerial surveys with small drones (<10 kg) equipped with gas detectors are a promising cost-effective and safe alternative for emission monitoring in industrial plants [6]. Both fixed- and rotary-wing drones can be used, however rotorcrafts are preferred for this application due to key practical advantages such as vertical take-off and landing (VTOL), autonomous hovering, high maneuverability, and low cruise speed. Drones equipped with laser-based methane detectors have been demonstrated with great success in the oil and gas (O&G) industry, e.g., for quantifying whole-site methane emissions [7] and detecting fugitive methane leaks [8,9,10]. The main O&G companies are already testing this technology in their plants [11,12,13]. Similar platforms have been recently used in solid waste landfills (SWLs) for identifying surface methane hotspots [14].
Wastewater treatment plants (WWTPs) are another scenario where small drones could improve the monitoring of plant emissions/odors. To the best of our knowledge, there are no reports of drones being used for emission monitoring or odor sensing of WWTPs. In this case, the major emission problem is not methane, but odorous compounds produced during wastewater treatment, such as hydrogen sulfide (H2S), ammonia (NH3), mercaptans, or volatile organic compounds (VOCs) which can produce odor impact in workers and communities living nearby these facilities, even at low concentration levels [3]. Current odor assessment methodologies in WWTPs are mostly based on walkover surveys with portable H2S detectors or via olfactometric measurements involving expensive human panels, which leads to odor measurements with poor temporal and spatial resolution. The idea of using drones to monitor odorous emissions in WWTPs is very interesting because they can measure the concentration of key odorous compounds in different locations of the plant including hard-to-reach locations, and with higher spatial resolution, less risk, and lower cost than existing methods. This information can then be used by plant operators for (i) feedback into the industrial processes, (ii) as input for atmospheric dispersion models to estimate the odor emission rate and then to predict odor impact in the plant vicinity, and (iii) to identify fugitive emissions.
The two main challenges associated with the application of drones for monitoring emissions in WWTPs are (i) the lack of reliable and lightweight sensors to detect the relevant compounds and (ii) the plume distortion produced by the downwash of the rotating propellers. While methane can be selectively detected with laser-based spectrometers amenable for drone integration, detection of H2S, NH3 or VOCs at the required concentration levels is yet not feasible with lightweight optical analyzers. In this case, the most straightforward approach is to use low-cost chemical sensors, such as electrochemical cells (EC) or metal oxide (MOX or MOS) sensors, which inherently have limited performance [15]. Electrochemical sensors offer decent selectivity (though not comparable to optical analysers) for compounds such as CO, SO2, NH3 or NO/NO2 (among many others) and are often the technology of choice when any of these compounds is targeted [16]. MOX sensors operating in the (default) isothermal mode are not selective but are more sensitive, faster, and cheaper than electrochemical cells [17]. These features make them very popular in robotic studies addressing gas source localization and mapping tasks [18,19,20] where selectivity is not critical because artificial gas sources releasing a single compound (typically ethanol) are normally used.
Up to now, the use of drones fitted with low-cost chemical sensors has been mostly explored in relatively simple scenarios, such as indoor areas [19] or outdoor environments [21,22], using artificial gas sources. A few exceptions exist at the industrial and academic level. For example, Aeromon (Helsinki, Finland) has been regularly using their BH-12 multi-sensor system (based on electrochemical cells) for monitoring the emission performance of vessels and checking compliance with the new emission regulations regarding fuel sulfur content (FSC). The DR1000 “Flying Lab” from Scentroid (Whitchurch-Stouffville, ON, Canada), which uses EC and MOX sensors, has been used for monitoring the quality of fuel used for domestic heating in Poland. The recently announced Muve C360 from FLIR Systems (Wilsonville, OR, USA) is a multi-gas detector completely integrated in a DJI M210 drone for emergency responders, industrial safety, and environmental monitoring. At the research level, drones equipped with electrochemical sensors have been used for atmospheric research studies, e.g. analysing the composition of volcanic plumes [23], among other applications [6].
Despite the many advantages offered by rotorcrafts, the intense downwash generated by the propellers is a main problem for chemical sensing applications in which the drone has to fly close to point or surface emitters. In these cases, the downwash strongly distorts the gas distribution, leading to gross errors in the sensor readings. This is a well-known problem that has received lots of attention from the research community. The downwash has been simulated by numerical methods (e.g., computer fluid dynamics, CFD) and empirically characterized using smoke tracers, anemometers, and particle tracking velocimetry (PTV) [6]. These studies show that the downwash is particularly strong in the vertical axis underneath the drone where its influence can extend up to several meters (depending on the drone´s take-off weight).
The downwash is the main factor to be considered in the design of gas sampling systems for drones, or for optimizing sensor placement, especially for point-like sensors or closed-path optical analysers. Although the sensing elements can be directly exposed to the air sample, it is more convenient to place them in a sensor chamber with an aspiration system. This provides more flexibility regarding the sampling point and more control in the sample delivery. The few existing commercial systems using low-cost sensors (e.g., Aeromon BH-12, Scentroid DR1000 and FLIR Muve C360) implement a rigid horizontal sampling tube (1–2 m length) to aspirate the gas sample from outside the rotors’ influence zone [23,24]. This type of boom is very convenient for monitoring elevated and channeled sources, such as chimneys or flares, but has practical inconveniences for diffusive area sources such as those encountered in WWTPs. In this case, the problem is that a drone implementing a rigid horizontal probe would have to fly very close to the ground or nearby obstacles to sample the space directly above the source, which is risky and leads to a strong mixing (dilution) of the emissions because of the downwash.
The goal of our current research is to develop a drone to monitor and map odorous emissions in WWTPs. For that, we use a commercial drone (DJI Matrice 600) fitted with a custom payload based on an array of low-cost gas sensors (electrochemical and MOX sensors) and an innovative sampling system consisting of an aspiration pump connected to a 10-m sampling tube suspended from the drone. This system allows the drone to sample the emission sources with negligible effect from the downwash and, at the same time, fly at sufficient height above the obstacles to minimize the operational risks. This paper presents the first preliminary set of experiments carried out in a real WWTP in Murcia (Spain). The objectives of these initial measurements are to (i) check if the signals recorded by the drone are consistent with the expected concentrations based on previous measurements with hand-held detectors; (ii) build rough concentration maps of the most relevant compounds to understand their spatial distribution and identify the emission hotspots; and (iii) assess if the different emission sources can be identified based on the multivariate patterns produced by the sensor array. We will discuss some of the challenges encountered during these tests, and how future developments could overcome them.
2. Materials and Methods
2.1. Test Site
Field measurements were carried out in the WWTP of Molina del Segura (Murcia, Spain), which is operated by Depuración de Aguas del Mediterráneo (DAM). The plant (Figure 1) has an extension of 35,000 m2 and serves a population of 290,000 inhabitants. Five emission sources (settler stage A, bioreactor stage A, sludge hoppers, sludge thickener, and deodorization chimney) were suggested by the plant manager as elements with the highest emissions based on previous measurement campaigns using hand-held detectors and olfactometric campaigns (human panels). Therefore, the aerial mapping was focused on a region of ~4500 m2 centered around these sources. An ultrasonic anemometer (Model: WindSonic, Gill Instruments, Lymington, UK) placed at 10 m a.g.l. in a clear area without nearby obstacles continuously measured wind speed and direction.
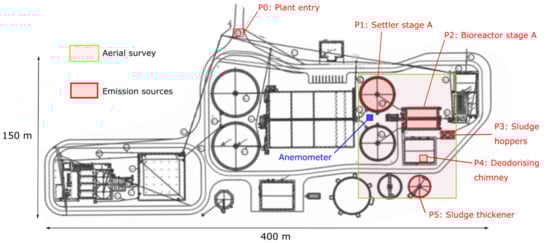
Figure 1.
Map of the WWTP of Molina del Segura with the five main emission sources highlighted in red. The aerial mapping was focused on a 4500 m2 squared region centered around these sources.
2.2. Drone and Payload
A rotary-wing drone was selected for this application due to its ability to hover, slow flight speed and vertical takeoff and landing (VTOL). These characteristics are essential for close-up monitoring of emission sources, safe navigation around the plant infrastructure, and high-resolution mapping. The selected drone was the Matrice 600 Pro (DJI International, Nanshan, Shenzhen, China) which has a high payload capacity (6 kg) and allows for a flight time between 15 min (fully loaded) and 30 min (unloaded). The drone was equipped with a custom gas sensing payload (Figure 2) composed of a custom-made electronic nose (e-nose) and a commercial multi-gas analyzer Dräger X-am 8000 (Drägerwerk AG, Lübeck, Germany).
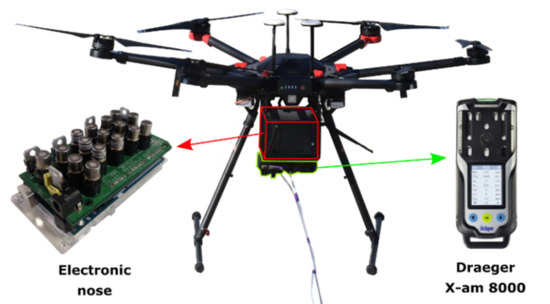
Figure 2.
DJI Matrice 600 Pro drone equipped with a custom e-nose and a Dräger X-am 8000 analyzer. The inlets of both systems are connected to 10-m PTFE tubing.
Both sensor systems were attached underneath the drone using a custom mounting plate, and their inlets were connected to 10-m PTFE tubing (hanging vertically from the drone) to sample the region below the drone where the downwash has disappeared or it is greatly reduced. The required length of the tubing was determined by measuring the downwash influence with a hand-held anemometer placed below the loaded drone while it was hovering at multiple altitudes. We prefer this sampling approach over the horizontal tube because it allows the drone to fly over obstacles without risk. However, using a long sampling tube also has practical problems: (i) a delay in the measurements due to the sample transport, (ii) memory effects if some gases stick to the tubing walls, and (iii) tilt of the tube due to wind or drone motion. The delay in the measurements and the tilt of the tube lead to inaccuracies in the GPS marking of the sensor signals. To solve these issues we attached a weight of 150 g to the end of the tube as a plumb bob (to keep the tube as straight as possible during flight) and compensated the delay via software.
Regarding the e-nose architecture (Figure 3), it contains an array of 16 MOX sensors (several TGS models, Figaro Engineering Inc., Osaka, Japan) operated at various temperatures, a combo sensor for temperature, humidity and pressure, a flow sensor, GPS receiver, and long-range ZigBee 868 MHz radio communication. The specifications of the e-nose sensors are summarized in Table 1. A microcontroller reads the sensor signals and the GPS position, and sends them to the base station through the radio link at a sampling frequency of 0.2 Hz. A miniature pump delivers the gas flow to the sensing chamber at a flow rate of 1.8 L/min. Power is provided by a 7.4 V lithium polymer (LiPo) battery with 2200 mAh of capacity, allowing continuous operation for approximately 2 h. The weight of the e-nose including the battery is ~1200 g.
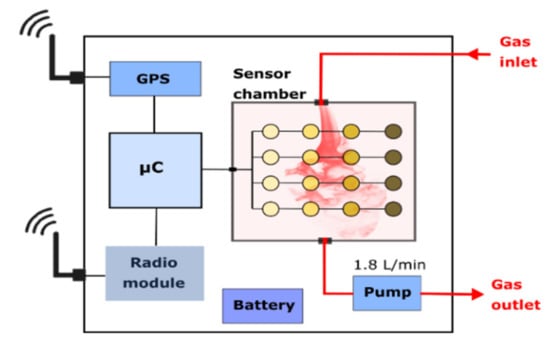
Figure 3.
Internal architecture of the electronic nose.

Table 1.
Sensors included in the electronic nose.
The Dräger X-am 8000 is equipped with four electrochemical sensors (for H2S, NH3, mercaptans and amines), a photo-ionization detector (PID) for quantifying total VOCs, an internal pump, an integrated battery, and weighs 550 g (Table 2). The sensor data are logged every second in an internal memory which can store up to 210 h of measurements.
Table 2.
Sensors included in the Dräger X-am 8000 analyzer.
2.3. Experimental Protocol
All measurements were carried out in a single day. The e-nose sensors were preheated for 24 h before the start of the measurements to stabilize the sensors’ baseline. At the beginning of the experiment the drone was positioned near the entry of the plant (P0 in Figure 1), where no odor was perceivable, and measurements were taken for 7 min to determine the sensors’ baseline. The drone took off from there and scanned the target area slowly at a height of approximately 12 m, keeping the inlet of the sampling tube as close as possible to the emission sources. The drone hovered for 5–7 min at each of the five emission sources (highlighted in Figure 1) to capture the variability of the gas concentration over time. The whole experiment took slightly less than 2 h to complete, which required multiple sets of drone batteries.
2.4. Data Processing and Visualization
A laptop computer with a ZigBee 868 MHz radio antenna and a custom software application developed in MATLAB R2019B (The MathWorks, Natick, MA, USA) was used as base station to receive and log in real-time the data from the e-nose (timestamp, sensor signals and GPS position). The measurement data stored in the internal memory of the Dräger X-am 8000 (timestamp and sensor signals) was downloaded into the base station at the end of the flight (no radio link available for this device). Data from both instruments were merged into a single file, using linear interpolation (MATLAB interp1) to synchronize the data to a common timestamp. Each entry of the log file is a tuple where is the timestamp, the spatial coordinates, the concentration (ppmv, parts-per-million in volume) of the five gases measured by the Dräger X-am 8000, and the MOX sensor resistances (Ω).
For data visualization, we used MATLAB and the Google Maps Javascript API to produce a heatmap visualization of the geolocalized raw sensor data. In addition, a principal component analysis (PCA) was used to visually determine if the different emission sources could be clustered based on the sensor responses. For that, a PCA model with three principal components was applied to the e-nose signals after logarithmic transformation (to reduce the dynamic range and improve normality) and mean-centering. The PCA modelling was done also in MATLAB.
3. Results and Discussion
3.1. Weather Conditions
The weather conditions during the field measurements were favorable, with clear sky, temperature between 18 and 20 °C, and 50% relative humidity. The wind direction was predominantly north-west, with average wind speed of 10–15 km/h, and gusts of up to 50 km/h (Figure 4). The effect of wind on the sampling tube can be observed in Figure 5, which shows pictures of the drone hovering above the five emission sources. For example, while measuring at the settlers (P1) and the deodorization chimney (P4) the drone had to be positioned slightly upwind to compensate the tilt of the sampling tube. The GPS signal reception was good throughout the experiment, with more than 12 satellites in line-of-sight (LOS) with the drone.
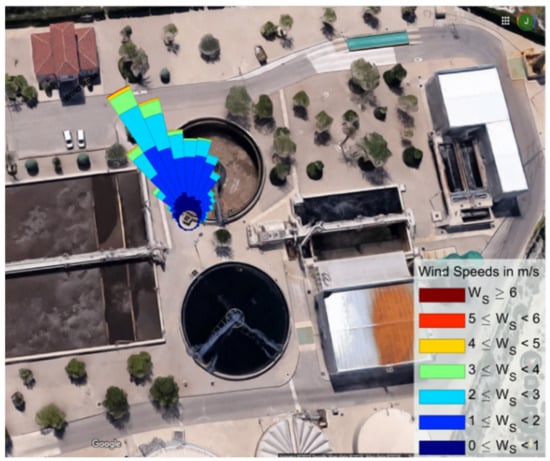
Figure 4.
Wind speed and direction during the field measurements.
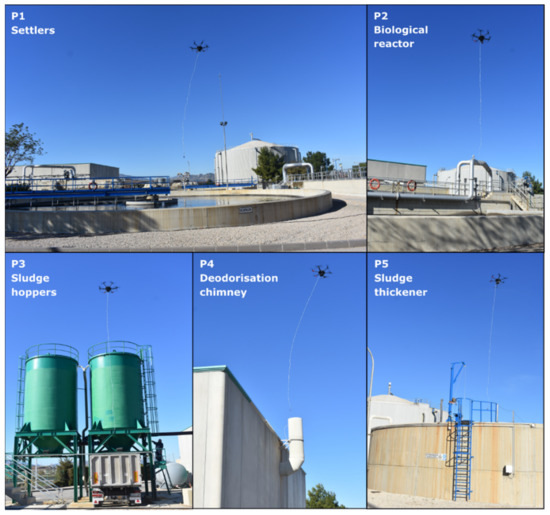
Figure 5.
Drone hovering over the selected emission sources (P1–P5).
3.2. Gas Concentration Measurements
The raw sensor signals throughout the experiment are shown in Figure 6. The highest gas concentrations were recorded near the bioreactor stage A (P2) and the deodorization chimney (P4). The high variability of the sensor signals at the chimney is a consequence of the oscillations of the sampling tube around the chimney outlet due to the wind. The oscillations of the sampling tube were less problematic in the area sources because, since the concentration is more homogeneous, the exact location of the sampling point is not as critical as in ducted (point-like) sources. Very low concentration of all gases was measured near the settlers (P1) despite a strong malodor could be appreciated near this site. Only the response of the MOX sensors was distinguishable from the blank measurements, which may indicate that odor from this source was produced mostly by VOCs rather than by H2S or NH3. A peak of 100 ppm of CO2 above the background level was measured near the sludge hoppers (P3) during sludge discharge into a truck. Finally, low concentrations were measured at the sludge thickener (P5) probably because it was covered.
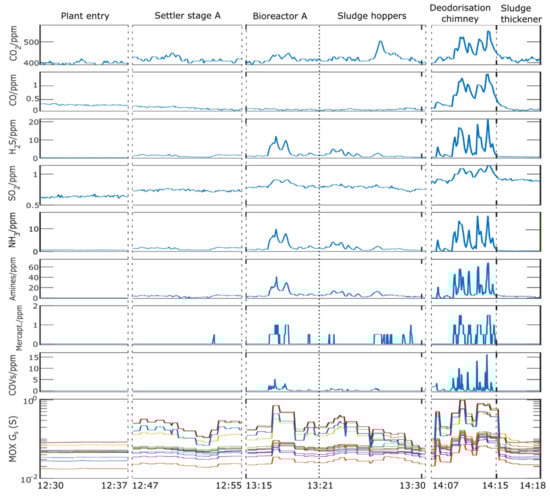
Figure 6.
Raw sensor signals during the field measurements.
The measured concentrations were in line with the expected values based on previous measurement campaigns carried out at the same emission sources with a hand-held X-am 8000 detector (Table 3). It is not surprising that the measured values during a single day in very specific conditions (e.g., drone flight) differ from values obtained in other measurement campaigns carried out at a different date. This is because the pattern of emissions in a WWTP is not stationary and there is a large variability in the emissions depending on process factors (e.g., quality of influent water and flow rate) but also on environmental conditions (wind, temperature, humidity, precipitation, etc.). There are also seasonal trends. Thus, the recorded signals only represent the emissions during the time of sampling. A comprehensive characterization of the emissions, which would require a much more elaborated measurement campaign spanning several months, was out of the scope of this preliminary measurements. Similarly, a precise characterization of the uncertainty associated with the drone measurements is also subject of future experiments. The goals of this preliminary work were less ambitious, e.g., showing that drone-based measurements using the proposed sampling approach provide sensible signals.
Table 3.
Comparison between drone-based measurements and those performed with a hand-held X-am 8000 detector near the same emission sources.
It should be noted that while the recorded signals give a clear indication of the characteristics of emissions in the different sources, their exact values are subject to various sources of uncertainty. While low-cost sensors can provide relatively good results in the laboratory, their application in field conditions remains challenging. First of all, because the sensors react not only to the target gas but also to interfering compounds. For example, the response of an H2S electrochemical sensor is affected by the presence of SO2 or NH3 because of matrix effects. Uncontrolled or unknown variations in temperature, humidity, and pressure can also affect the sensor signals, as can overheating due to direct sunlight exposure. Strong winds also affect the measurements due to the oscillations of the sampling line.
3.3. Gas Concentration Mapping
The sensor data was used to produce heatmaps indicative of the concentration of each gas. An example of an H2S map is shown in Figure 7. As it was expected from the analysis of the raw sensor signals, the H2S concentration hotspots are located near the bioreactor stage A (P2) and the deodorization chimney (P4). These hotspots are shifted a few meters with respect to the location of the emission sources due to the inaccuracy of the GPS position (±3 m), the effect of wind on the gas dispersion, and the tilt of the sampling tube with respect to the vertical axis of the drone where the GPS receiver is located. This latter effect can be clearly seen in Figure 5 when the drone is sampling the chimney. In order to keep the inlet of the sampling tube centered above the chimney, the drone must be positioned a few meters upwind to compensate for the effect of wind on the tubing. Because the GPS receiver is placed on the drone and not at the inlet of the tube, the recorded position indicates the location of the drone and not the location where the gas is being sampled. This could be solved in the future by either placing the GPS receiver at the inlet of the tubing or using an on-board camera to track the position of the sampling inlet and compensate the offset via software.
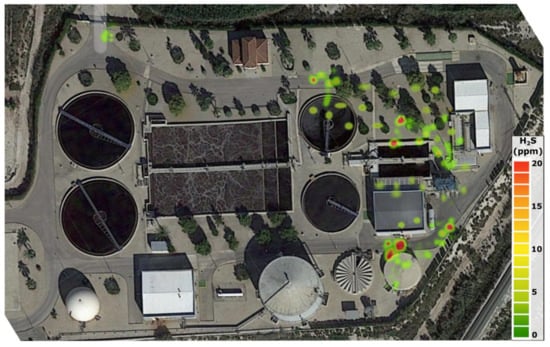
Figure 7.
Map of H2S concentration obtained from drone measurements.
3.4. Gas Source Identification
One research question of this work is whether the different emission sources could be distinguished based on the e-nose signals. A PCA score plot of the signals recorded while the drone was hovering over the sources revealed that this is indeed the case, and the different emission sources are clustered in different regions of the PCA space (Figure 8). This suggests that each source has a different gas composition, so the e-nose could be potentially used to identify which source is responsible for a certain measurement. Even the settler (P1) and sludge thickener (P5) could be differentiated from the blank measurements (P0) despite the gas concentrations measured at these sources were very close to the baseline level. This result, which may be a consequence of the low limit of detection (LOD) of MOX sensors, should be confirmed with more measurement campaigns and using external validation (blind) samples.
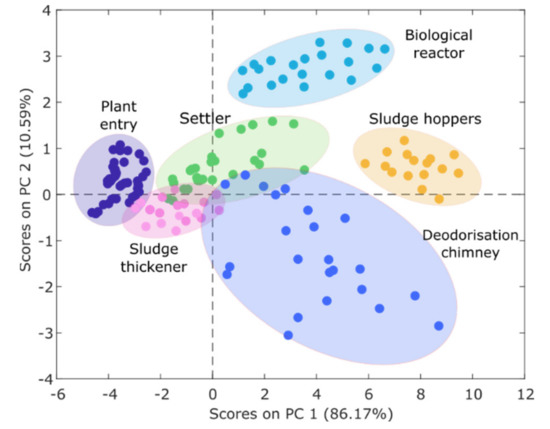
Figure 8.
Principal component analysis (PCA) score plot of the e-nose signals.
4. Conclusions
This study has explored the possibility of using a small drone equipped with an array of low-cost gas sensors for real-time monitoring of odorous emissions in a WWTP. The drone was equipped with an innovative sampling system that allowed the drone to fly at a safe distance from obstacles and minimize the impact of downwash into the sensor signals. The proposed system was useful to measure gas concentrations near previously inaccessible emission sources, such as the deodorization chimney, which turned out to be the main odor source in this plant. The geolocalized sensor signals were used to build H2S concentration maps that highlighted the location of the main emission hotspots.
During these field measurements we faced several challenges that affect the operation of the drone and the quality of the acquired data. The main challenge was the presence of strong winds which affected the drone stability, made the sampling tube oscillate considerably, and induced a high variability in the spatial distribution of the released gases. Adding a weight at the end of the sampling line improved the stability of the measurements. Flying above the obstacles was key to minimize the operational risks considering the strong and unpredictable wind gusts present in our flights. Real-time visual feedback from the sensor signals was very helpful for fine-tuning the position of the sampling inlet close to the different emission sources (especially channeled sources). Nonetheless, the geolocalization of the sensor measurements was inaccurate under strong winds because the GPS receiver and the inlet of the sampling line were not necessarily in the same vertical axis. Two possible solutions to improve this in future experiments are (i) to place the GPS receiver at the inlet of the tubing or (ii) using an on-board camera to track the position of the sampling inlet and compensate the GPS offset via software.
Another problem that we want to address in future works is the quantification of odor concentration (e.g., in standardized units such as ou/m3 [24]) from drone-based measurements. This is much more challenging than quantification of individual gas concentrations, as the relationship between the components of a gas mixture and the perceived odour concentration is non-linear and subject to synergic and masking effects [25]. We also plan to combine the drone measurements with atmospheric dispersion models, such as CALPUFF [26], to predict the impact outside of the plant. The proposed platform could be applied in the future to other industrial sectors, such as solid waste landfills, composting plants, and animal farms.
Author Contributions
Conceptualization, J.B., M.D.E., S.D. and S.M.; Data curation, J.B.; Formal analysis, J.B.; Funding acquisition, L.P. and S.M.; Investigation, J.B., M.D.E. and S.D.; Methodology, J.B., M.D.E. and S.M.; Project administration, L.P. and S.M.; Resources, M.D.E. and S.D.; Software, J.B.; Supervision, S.M.; Validation, J.B.; Visualization, J.B.; Writing—original draft, J.B.; Writing—review & editing, J.B., M.D.E., S.D., L.P. and S.M. All authors have read and agreed to the published version of the manuscript.
Funding
This research has received funding as third party from the ATTRACT project funded by the EC under Grant Agreement 777222.
Institutional Review Board Statement
Not applicable.
Informed Consent Statement
Not applicable.
Data Availability Statement
Restrictions apply to the availability of the data presented in this study. These data can be available on private request from the corresponding author.
Acknowledgments
CERCA Programme/Generalitat de Catalunya. The Signal and Information Processing for Sensor Systems group is a consolidated Grup de Recerca de la Generalitat de Catalunya and has support from the Departament d’Universitats, Recerca i Societat de la Informació de la Generalitat de Catalunya (expedient 2017 SGR 1721). We would also like to acknowledge Luis Fernández Romero, Maria José Ibáñez, Lidia Saúco, Ana Maciá and Pilar Pradas for their support during the field campaigns. Authors of this report gratefully acknowledge the cooperation of ESAMUR (Entidad Regional de Saneamiento y Depuración de Murcia).
Conflicts of Interest
The authors declare no conflict of interest. The funders had no role in the design of the study; in the collection, analyses, or interpretation of data; in the writing of the manuscript, or in the decision to publish the results.
References
- Agency, E.E. Spain—Industrial Pollution Profile. 2019. Available online: https://www.eea.europa.eu/themes/industry/industrial-pollution/industrial-pollution-country-profiles-2019/spain (accessed on 24 April 2020).
- Dincer, F.; Muezzinoglu, A. Odor-causing volatile organic compounds in wastewater treatment plant units and sludge man-agement areas. J. Environ. Sci. Health Part A 2008, 43, 1569–1574. [Google Scholar] [CrossRef] [PubMed]
- Brinkmann, T.; Both, R.; Scalet, B.M.; Roudier, S.; Sancho, L.D. JRC Reference Report on Monitoring of Emissions to Air and Water from IED Installations. Ind. Emiss. Dir. 2018. [Google Scholar] [CrossRef]
- Directive, C. Directive 2010/75/EU of the European Parliament and of the Council. Off. J. Eur. Union L 2010, 334, 17–119. [Google Scholar]
- Brinkmann, T.; Santonja, G.G.; Yükseler, H.; Roudier, S.; Sancho, L.D. Best Available Techniques (BAT) Reference Document for Common Waste Water and Waste Gas Treatment/Management Systems in the Chemical Sector; Publications Office of the European Union: Luxembourg, 2016. [Google Scholar]
- Burgués, J.; Marco, S. Environmental chemical sensing using small drones: A review. Sci. Total Environ. 2020, 748, 141172. [Google Scholar] [CrossRef]
- Nathan, B.J.; Golston, L.M.; O’Brien, A.S.; Ross, K.; Harrison, W.A.; Tao, L.; Lary, D.J.; Johnson, D.R.; Covington, A.N.; Clark, N.N. Near-field characterization of methane emission variability from a compressor station using a model air-craft. Environ. Sci. Technol. 2015, 49, 7896–7903. [Google Scholar] [CrossRef]
- Ravikumar, A.P.; Sreedhara, S.; Wang, J.; Englander, J.; Roda-Stuart, D.; Bell, C.; Zimmerle, D.; Lyon, D.; Mogstad, I.; Ratner, B. Single-blind inter-comparison of methane detection technologies--results from the Stanford/EDF Mobile Monitoring Challenge. Elem. Sci. Anth. 2019, 7, 37. [Google Scholar] [CrossRef]
- Golston, L.M.; Aubut, N.F.; Frish, M.B.; Yang, S.; Talbot, R.W.; Gretencord, C.; McSpiritt, J.; Zondlo, M.A. Natural Gas Fugitive Leak Detection Using an Unmanned Aerial Vehicle: Localization and Quantification of Emission Rate. Atmosphere 2018, 9, 333. [Google Scholar] [CrossRef]
- Yang, S.; Talbot, R.; Frish, M.; Golston, L.; Aubut, N.; Zondlo, M.; Gretencord, C.; McSpiritt, J. Natural gas fugitive leak detec-tion using an unmanned aerial vehicle: Measurement system description and mass balance approach. Atmosphere 2018, 9, 383. [Google Scholar] [CrossRef]
- ConocoPhillips Testing Drone Technology to Detect and Quantify Emissions. Available online: http://www.conocophillips.com/sustainability/sustainability-news/story/testing-drone-technology-to-detect-and-quantify-emissions/ (accessed on 31 March 2020).
- BP p.l.c. BP North Sea Deploys Mars Technology in World-First Methane Monitoring Project. Available online: https://www.bp.com/en/global/corporate/news-and-insights/press-releases/bp-north-sea-deploys-mars-technology-in-world-first-methane-monitoring-project.html (accessed on 31 March 2020).
- TOTAL Group Integrating Climate into Our Strategy. Available online: https://www.total.com/sites/default/files/atoms/files/total_rapport_climat_2019_en.pdf#page=30 (accessed on 29 March 2020).
- Emran, B.J.; Tannant, D.D.; Najjaran, H. Low-Altitude Aerial Methane Concentration Mapping. Remote Sens. 2017, 9, 823. [Google Scholar] [CrossRef]
- Burgués, J.; Jiménez-Soto, J.M.; Marco, S. Estimation of the limit of detection in semiconductor gas sensors through linearized calibration models. Anal. Chim. Acta 2018, 1013, 13–25. [Google Scholar] [CrossRef]
- Mead, M.; Popoola, O.; Stewart, G.; Landshoff, P.; Calleja, M.; Hayes, M.; Baldovi, J.; McLeod, M.; Hodgson, T.; Dicks, J.; et al. The use of electrochemical sensors for monitoring urban air quality in low-cost, high-density networks. Atmos. Environ. 2013, 70, 186–203. [Google Scholar] [CrossRef]
- Martinez, D.; Burgués, J.; Marco, S. Fast Measurements with MOX Sensors: A Least-Squares Approach to Blind Deconvolution. Sensors 2019, 19, 4029. [Google Scholar] [CrossRef]
- Lilienthal, A.J.; Loutfi, A.; Duckett, T. Airborne Chemical Sensing with Mobile Robots. Sensors 2006, 6, 1616–1678. [Google Scholar] [CrossRef]
- Burgués, J.; Hernández, V.; Lilienthal, A.J.; Marco, S. Smelling Nano Aerial Vehicle for Gas Source Localization and Map-ping. Sensors 2019, 19, 478. [Google Scholar] [CrossRef]
- Burgués, J.; Hernández, V.; Lilienthal, A.J.; Marco, S. Gas distribution mapping and source localization using a 3D grid of metal oxide semiconductor sensors. Sens. Actuators B Chem. 2020, 304, 127309. [Google Scholar] [CrossRef]
- Neumann, P.P.; Asadi, S.; Lilienthal, A.J.; Bartholmai, M.; Schiller, J.H. Autonomous gas-sensitive microdrone: Wind vector estima-tion and gas distribution mapping. IEEE Robot. Autom. Mag. 2012, 19, 50–61. [Google Scholar] [CrossRef]
- He, X.; Bourne, J.R.; Steiner, J.A.; Mortensen, C.; Hoffman, K.C.; Dudley, C.J.; Rogers, B.; Cropek, D.M.; Leang, K.K. Autonomous chemical-sensing aerial robot for urban/suburban environmental monitoring. IEEE Syst. J. 2019, 13, 3524–3535. [Google Scholar] [CrossRef]
- Schellenberg, B.; Richardson, T.; Watson, M.; Greatwood, C.; Clarke, R.; Thomas, R.; Wood, K.; Freer, J.; Thomas, H.; Liu, E.; et al. Remote sensing and identification of volcanic plumes using fixed-wing UAVs over Volcán de Fuego, Guatemala. J. Field Robot. 2019, 36, 1192–1211. [Google Scholar] [CrossRef]
- Bax, C.; Sironi, S.; Capelli, L. How Can Odors Be Measured? An Overview of Methods and Their Applications. Atmosphere 2020, 11, 92. [Google Scholar] [CrossRef]
- Capelli, L.; Sironi, S.; Del Rosso, R.; Céntola, P.; Grande, M.I. A comparative and critical evaluation of odour assessment methods on a landfill site. Atmos. Environ. 2008, 42, 7050–7058. [Google Scholar] [CrossRef]
- Levy, J.; Spengler, J.D.; Hlinka, D.; Sullivan, D.; Moon, D. Using CALPUFF to evaluate the impacts of power plant emissions in Illinois: Model sensitivity and implications. Atmos. Environ. 2002, 36, 1063–1075. [Google Scholar] [CrossRef]
Publisher’s Note: MDPI stays neutral with regard to jurisdictional claims in published maps and institutional affiliations. |
© 2021 by the authors. Licensee MDPI, Basel, Switzerland. This article is an open access article distributed under the terms and conditions of the Creative Commons Attribution (CC BY) license (https://creativecommons.org/licenses/by/4.0/).