Article

Remote Sensing-Based Analysis of Spatial and Temporal Water Colour Variations in Baiyangdian Lake after the Establishment of the Xiong’an New Area

1
School of Geomatics, Liaoning Technical University, Fuxin 123000, China
2
Key Laboratory of Digital Earth Science, Aerospace Information Research Institute, Chinese Academy of Sciences, Beijing 100049, China
3
Key Laboratory of Earth Observation Hainan Province, Hainan 572029, China
4
School of Electronic, Electrical and Communication Engineering, University of Chinese Academy of Sciences, Beijing 100049, China
*
Author to whom correspondence should be addressed.
Remote Sens. 2021, 13(9), 1729; https://doi.org/10.3390/rs13091729
Submission received: 10 March 2021 / Revised: 10 April 2021 / Accepted: 23 April 2021 / Published: 29 April 2021

Abstract

:
The Forel-Ule Index (FUI) is an important parameter that can be calculated from optical remote sensing data to assess water quality based on water colour. Using Sentinel-2 images from April to November within the 2016–2020 period coupled with the Google Earth Engine Platform, we calculated FUI to analyse the spatial distribution, seasonal variations, and inter-annual variations of water colour in Baiyangdian Lake in the Xiong’an New Area established on 1 April 2017. The lake was divided into seven sub-regions, A–G; subsequently, high and low FUI values were observed in the south and north, respectively. Additionally, the mean FUI values of G and F zones in the south were 11.9 and 12.7, respectively, whereas those for the A, B, C, D, and E zones in the north were 10.5, 9.8, 10.4, 11.1, 11.2, respectively. The seasonal variations in the Baiyangdian Lake and seven sub-regions were consistent, with turbid water in spring and autumn, and clear water in summer. Inter-annual variations analyses for 2016–2020 indicated that the zone of A became progressively turbid, whereas the B, C, D, E, F, and G zones exhibited slow and gradually decreasing trends. Our findings suggest that the overall water quality of Baiyangdian Lake may be better, which may be related to the governance policies of the region.

1. Introduction

Baiyangdian Lake is the largest freshwater lake in the urban agglomerations of Beijing, Tianjin, and Hebei Province. Baiyangdian Lake and their surrounding waterbodies play an important role in maintaining the normal functioning of local ecosystems. It is located in Anxin County, Xiong’an New Area, Hebei Province (115°53′8.25″–116°6′9.64″ E, 38°47′1.69″–38°59′22.78″ N). The established of the Xiong’an New Area was followed by a rapid industrial development in the upper reaches of the Baiyangdian Lake, resulting in severe water pollution. These problems include decreased water inflow, insufficient water storage, low water retention capacity, and poor water self-purification capacity. Currently, in order to improve the water quality of Baiyangdian Lake, the local government has formulated relevant regulatory measures and governance polices [1,2,3,4,5].
Traditional water quality monitoring comprises manual sampling at limited sampling points, followed by water quality analysis in the laboratory. However, this monitoring method is not comprehensive enough to monitor the overall water quality of a waterbody, nor can it accurately reflect the water quality at each location of the lake. In contrast, remote sensing technology is time-saving, enables a wide monitoring range and fast data acquisition, and renders data that can be intuitively interpreted. Therefore, this technology not only enables the characterisation of spatial information changes in water dynamically and in real-time, but also provides access to previous water information through historical remote sensing images.
In order to improve the accuracy of water quality parameter inversion models, studies have recently improved the applicability of different remote sensing data and optimised the water quality parameter inversion methods. For example, an empirical algorithm was developed to estimate suspended solid concentrations [6]. Additionally, the estimations of chlorophyll-a have been made by implementing a three-band method [7,8]. Moreover, a neural networks method has been implemented to estimate chorophyll-a [9]. Machine learning has been implemented to estimate chorophyll-a and suspended solids [10].
Several studies have been conducted on Baiyangdian Lake in recent years, including analyses to explain the water shortage in Baiyangdian Lake in different periods and surface water changes in Baiyangdian Lake in the previous 30 years based on Landsat series data [11,12,13,14,15,16]. Based on different data sources, statistics, and analysis methods, several characteristics of Baiyangdian Lake have been studied, including its regional divisions, pollution sources, landscape pattern changes, and eutrophication changes [11,12,17,18,19,20,21,22,23,24,25,26,27]. Based on Budyko hypothesis, Wang et al. analysed the sensitivity and causes of streamflow change in Baiyangdian Lake [28]. Meanwhile, Zhu et al. evaluated the plant community structure and water quality in Baiyangdian ecological restoration area [29]. Additionally, Zhao et al. analysed the hydrochemistry and water quality of surface water and groundwater in Baiyangdian Lake [30]. Moreover, Yan et al. conducted a study on drought recovery in Baiyangdian Lake [31]. However, when the Xiong’an New Area was established, relatively little research was conducted on the spatial and temporal changes in the water colour of Baiyangdian Lake.
Different components in the water affect the colour of the water. Therefore, several parameters, such as the clarity and turbidity of the water, can be analysed based on the colour of the water at a regional or global scale. Research on the evaluation of water quality via colour analyses began approximately a hundred years ago. The Forel-Ule scale is used to divide the colour of natural waterbody into 21 levels-from dark blue to reddish-brown, which can be used to characterise oceans and inland waterbody. Wang et al. used the Forel–Ule index (FUI) to establish different models to evaluate the water clarity and the trophic state of inland water [32,33,34]. To monitor water quality using remote sensing technology, water colour technology can be applied to remote sensing images, and the water colour Forel–Ule scale is based on the reflectance of water in the remote sensing images, referred to as FUI [34,35,36]. Native and international researchers have both conducted related studies to evaluate the water quality using the colour of water. The X, Y, and Z tristimulus values of the CIE (Commission internationale de l’éclairage) standard colorimetric system are calculated based on the red, green, and blue bands, respectively, in remote sensing images to establish the image colour coordinates and water quality parameters for the evaluation of water quality [36,37,38,39]. Therefore, the FUI can be used to classify and evaluate the water quality and screen water with abnormal water colour [34,40,41,42,43,44]. Petus et al. combined satellite water colour data with field water quality and ecosystem monitoring data to divide MODIS pixels into six different types of water during the rainy season in Australia’s Great Barrier Reef region [45]. Sidik et al. applied the traditional Forel-Ule Scale to MODIS data to analyse the colour change law of marine water [46]. Nie et al. used the in situ results of FUI to evaluate its calculation based on the satellite sensor and systematically evaluated the large-scale marine environment for the first time based on FUI [47]. Pitarch used monthly ESA-OC-CCI data to realise global results to FUI, hue angle α , and Secchi disk depth from 1997 to 2018 [48]. However, there are few studies on the application of FUI in Sentinel-2 [44]. FUI can enable the widespread analysis of spatial and temporal changes of water quality.
Analysing the spatial and temporal changes in water quality over a wide range is a complex and challenging task. Given that screening image data is very time-consuming, it is necessary to establish an efficient cloud data processing platform and develop good water quality inversion methods on this platform. The Google Earth Engine Platform (GEE) is a cloud platform that can perform data analyses and data visualization on Peta-byte-level geospatial data. The GEE integrates remote sensing data, such as Sentinel-1, Sentinel-2, and Sentinel-3. All of the historical data on the GEE are available for free, and Google’s high-performance cluster server can be used to analyse, process, and download remote sensing data. Therefore, many studies have been conducted using these resources [49,50,51,52,53].
Although some studies have been conducted on Baiyangdian Lake, no previous work has implemented the FUI to characterise the Baiyangdian Lake. Therefore, our study produced the FUI of the Baiyangdian Lake from April to November in 2016–2020 based on Sentinel-2 images and the GEE, and then analysed the spatial distribution and seasonal and inter-annual FUI variations of Baiyangdian Lake, along with other related factors.

2. Materials and Methods

2.1. Study Area

Baiyangdian Lake is the largest freshwater lake in the urban agglomerations of Beijing, Tianjin, and Hebei Province [18]. It is located in Anxin County, Hebei Province (115°53′8.25″–116°6′9.64″ E, 38°47′1.69″–38°59′22.78″ N) and it covers a water area of 366 km². Seven rivers flow into Baiyangdian Lake, including the Baigouyinhe (longest; 275 km), Zhulong, Tanghe, Caohe, Xiaoyi, Puhe, and Fuhe rivers (shortest; 62 km), all of which originate in the Taihang Mountain. Baiyangdian Lake is known as the ‘Pearl of North China’ and the ‘Kidney of North China’ [54,55]. Lake wetlands and their surrounding water play an important role in several processes that maintain the normal functioning of the local ecosystems, including mobilising the water supply, supplying water for reed growth, increasing groundwater supply, improving the local climate system, protecting biodiversity, etc. Because of the complexity of Baiyangdian Lake (Figure 1), it is divided into seven sub-regions according to functional region, which are named A, B, C, D, E, F, and G [27].

2.2. Study Data

2.2.1. Sentinel-2 Image Data

Sentinel-2 is a high-resolution satellite equipped with the MultiSpectral Instrument (MSI) orbiting at a mean altitude of 786 km, with a swath width of 290 km, and 13 spectral bands; the spatial resolution of R(Band1), R(Band9), and R(Band10) is 60 m; the spatial resolution of R(Band5), R(Band6), R(Band7), R(Band8A), R(Band11), and R(Band12) is 20 m; and, the spatial resolution of R(Band2), R(Band3), R(Band4), and R(Band8) is 10 m. The Sentinel-2A and Sentinel-2B satellites were launched in June 2015 and March 2017, respectively. The revisit period of each satellite is 10 days. However, the two satellites complement each other, thereby shortening the revisit period to five days. Sentinel-2 images have significant potential applications in hydrology to water quality monitoring [10,56,57,58,59,60,61].
In this study, non-frozen Sentinel-2A/B satellite data corresponding to April–November within the 2016–2020 period were used. The data were processed locally (within the 2016–2018 period) and on GEE (within the 2019–2020 period). Although GEE has Sentinel-2 Level 2A surface reflectance products from 2017, it does not provide global coverage. The Sentinel-2 Level 2A surface reflectance products in this study were functional from 2019. Therefore, from 2016–2018, we downloaded the Level 1C top atmosphere reflectance products (L1C TOA) from ESA (European Space Agency). Additionally, the Sen2Cor and SNAP software that were developed by ESA were used to process L1C TOA reflectance products to generate surface reflectance and resample the spatial resolution of each image band to 10 m. Based on the processed surface reflectance data, the FUI from 2016 to 2018 were produced locally. In 2019–2020, Level 2A surface reflectance products with a 10 m spatial resolution can be obtained directly on the GEE that can be used to calculate FUI.

2.2.2. In Situ Remote Sensing Reflectance Data

On 21 and 22 May 2019, a satellite-to-ground quasi-synchronization experiment was conducted in four zones of the Baiyangdian Lake (C, D, E, and F), with differences of 1 and 2 d from the satellite transit time, respectively. The transit time of the satellite was 23 May, 2019. In this study, we collected in situ data of 29 points from four zones (C, D, E, and F). The surface spectrum of water was measured onsite, and the waterbody onsite photos of each experimental point were obtained. Later, the field conditions of the water were recorded at each experimental point, as illustrated in Figure 1. For each experimental point, an ASD Field-SpecR3 portable spectroradiometer (USA) was used to acquire the water surface spectrum and the spectrum measurement implemented the NASA Ocean Optics Specification and the water spectrum measurement method that was proposed by Tang Junwu [62,63,64]. The observation azimuth was set to 135° to avoid the influence of sunglint. Moreover, the observation zenith angle was set to 40° in order to avoid the shadow of the hull [60]. To avoid the influence of water surface waves and sunglint, when collecting spectral data, each spectral result should be obtained, and the mean value should be calculated after removing the abnormal value in processing the spectrum. The spectrum acquisition at each sample point was conducted in the following order: (1) reference plate, (2) waterbody, (3) skylight, and (4) reference plate. The remote sensing reflectivity was then calculated, as follows [62]:
R rs ( λ ) = L t λ · r × L s k y λ L p λ / ρ p × π ,
where L t λ   is the upward radiance of the waterbody and r is the skylight reflectivity. The calculations were determined according to the position of the sun, observed geometry, wind speed, wind direction, etc. According to the Fresnel formula (r = 0.0245), when the observation zenith angle is 40°, L s k y is the downward radiance of the sky light, L p λ is the radiance of the reference plate, and ρ p is the reflectance of the standard reference plate that is calibrated in the laboratory. Figure 2 shows the in situ remote-sensing reflectance Rrs) and the image of equivalent spectral reflectance. Affected by the absorption of phytoplankton pigments, reflection peaks near 570 nm, 580 nm, 650 nm, and 700 nm, and characteristic valleys near 675 nm were observed. In addition, although there was a notable error in the equivalent spectrum of Sentinel-2 image at 945 nm, the band was not included in the FUI calculation and, therefore, did not affect the calculation results. The shapes of the equivalent spectrum of Sentinel-2 were similar to the measured spectrum, while being slightly higher; however, the FUI was calculated as a ratio, which offset the influence of the numerical deviation.

2.3. Accuracy Evaluation of Indices

Generally, the mean relative error (MRE) and root mean square error (RMSE), as defined below, were adopted during the evaluation of the accuracy of waterbody extraction and FUI:
M R E = 1 n 1 n A A A
R M S E = 1 n A A 2 n
where A represents the result of the FUI calculated by the in situ remote-sensing reflectance Rrs(λ), A represents the result of the FUI that was calculated by the remote-sensing reflectance Rrs(λ) of the Sentinel-2 image, and n denotes the number of waterbody sample points.

2.4. Waterbody Extraction

The water area of Baiyangdian Lake is small and broken; additionally, multiple narrow roadways exist, and the water–land boundary is not easily distinguishable. Therefore, the water results in the 10 m resolution global surface coverage map released by Gong Peng in 2019 were used as the reference range for water extraction to accurately obtain the water area of Baiyangdian Lake [65]. As the range of the water area was constantly changing due to external factors, the 20 m expansion of Gongpeng’s result was taken as the reference range for water extraction. The multi-spectral water index (MUWI), automated water extraction index (AWEI), normalized difference water index (NDWI), and modified normalized difference water index (MNDWI) are commonly used to extract water [66,67,68].
However, the effect of the above several water indexes on restraining interference factors, such as houses, vegetation, and shadows, are not ideal. Therefore, the multi-Band Water Index (MBWI) that was proposed by Wang was selected [69]. The MBWI is calculated, as follows:
MBWI = 2Green-Red-NIR-SWIR1-SWIR2
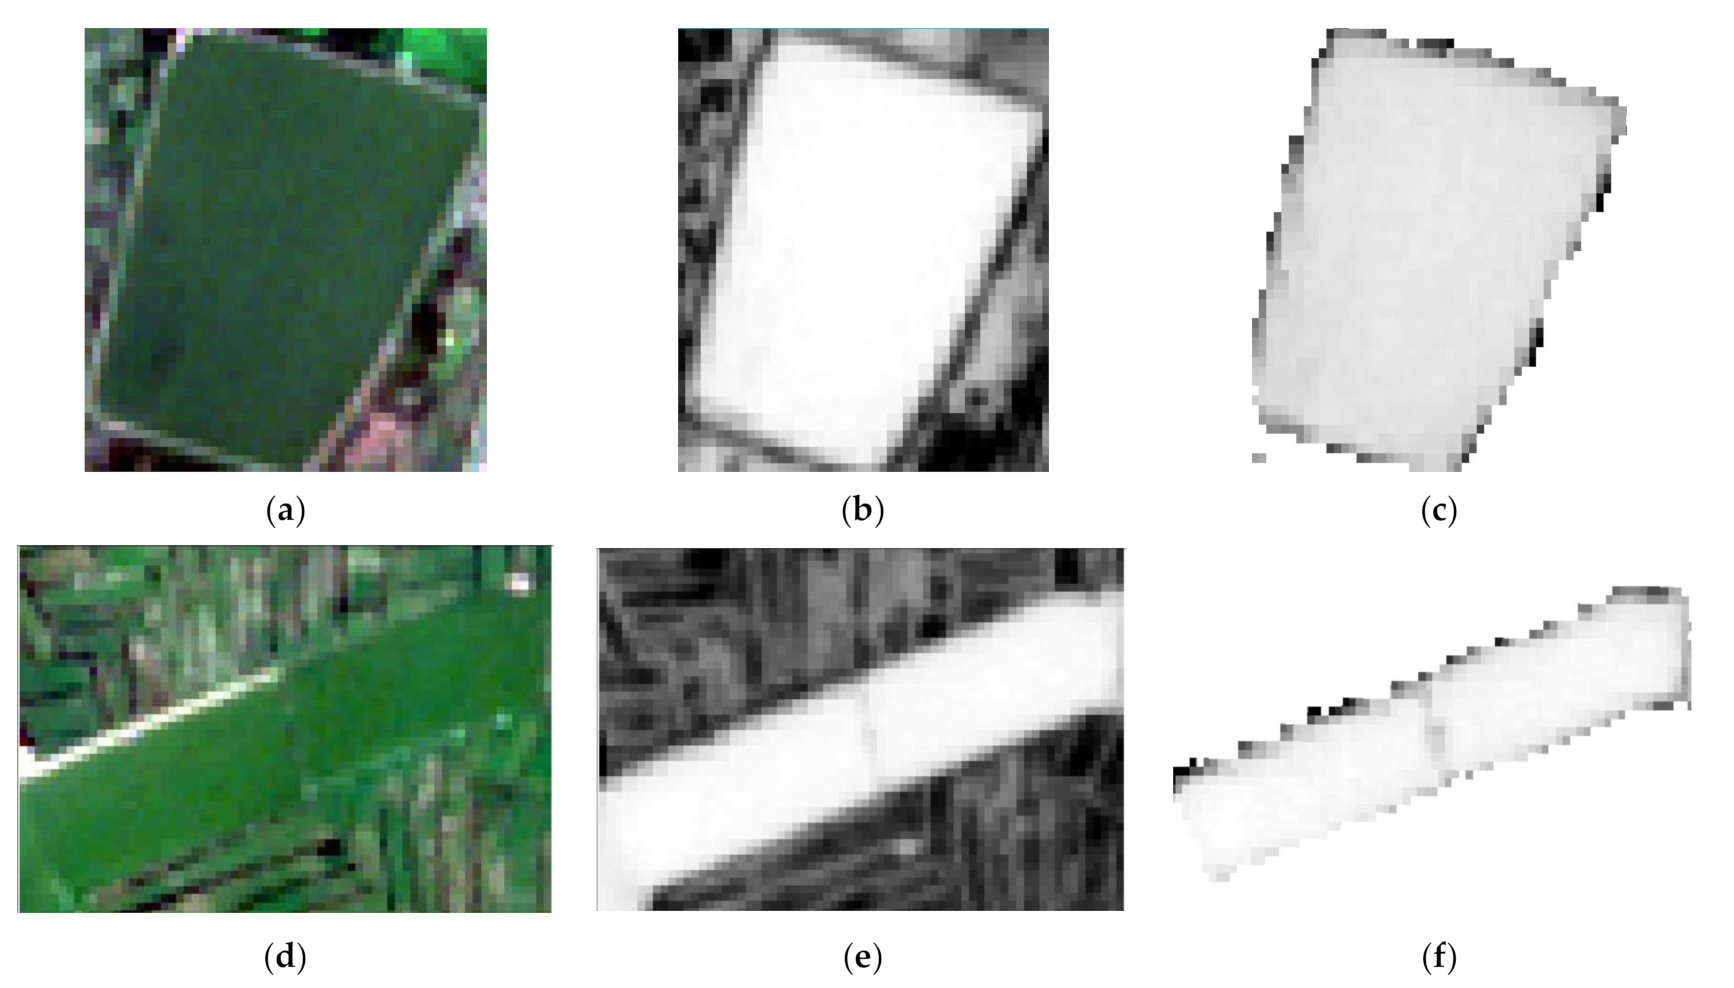
This water index effectively eliminated the interference from houses, vegetation, shadows, and other factors. It is based on the optimal threshold to extract water, which is calculated via independent iteration or statistical methods. This calculation process is rather complex; each scene image must match an optimal threshold and, therefore, obtaining the optimal threshold is a labour-intensive process. Therefore, the MBWI grey image was taken as input data, and K-means clustering analysis was used to discriminate water from non-water components, in order to facilitate the calculation of these optimal thresholds and to distinguish water and non-water components in the image more efficiently and automatically. In addition, to reduce calculation loads, this procedure also reduces the error that is caused by the artificial selection of empirical values [70]. The purpose of the K-means cluster is to distribute the mean value of the initial class evenly in the data space and allocate the pixels into the nearest one through the iterative calculation using the minimum distance method [70,71]. Figure 3 presents the waterbody extraction results.

2.5. FUI Calculations

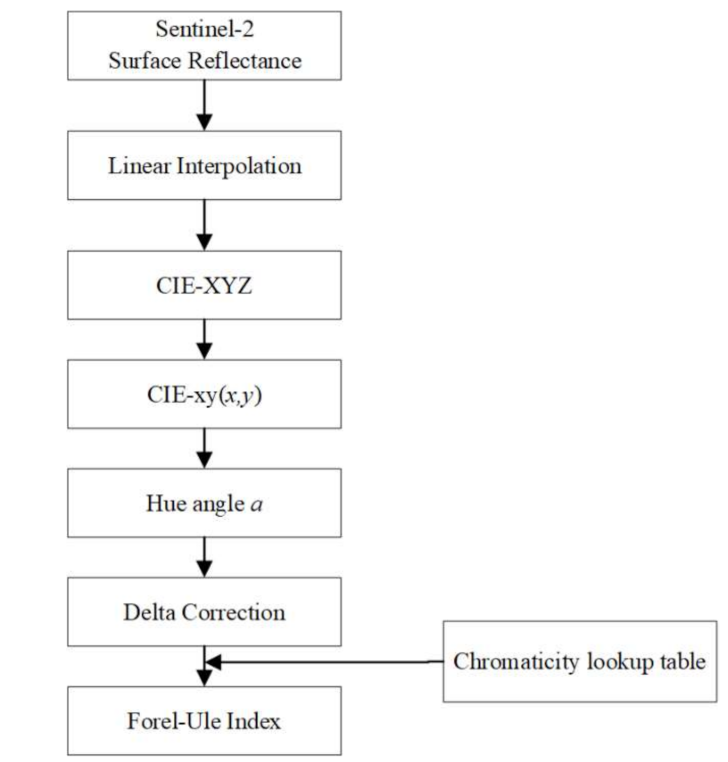
Commission Internationale de L’Eclairage (CIE) is a standard chromaticity coordinate system [72]. Moreover, the hue angle   α is a parameter to describe colour in the CIE colour space. Figure 4 presents the flow char of Forel–Ule Index.
According to colour matching functions (CMFs), the weighted functions of the X, Y, and Z tristimulus values were determined, as follows [73]:
X = 11.756R(443) + 6.423R(490) + 53.696R(560) + 32.028R(665) + 0.529R(705)
Y = 1.744R(443) + 22.289R(490) + 65.702R(560) + 16.808R(665) + 0.192R(705)
Z = 62.696R(443) + 31.101R(490) + 1.778R(560) + 0.015R(665) + 0.000R(705)
Notably, the spatial resolution of R(443) was 60 m, and that of R(490), R(560), and R(665) was 10 m, while that of R(705) was 20 m. Therefore, before calculating the hue angle   α , the band used for the local sentinel-2 data was processed to a spatial resolution of 10 m. The spatial resolution of the surface reflectance products of GEE was also 10 m. Imaging sensors with instruments have broad spectral bands with a radiation detection efficiency that is not uniform within each band. This detection efficiency is described by the spectral response function (SRF) [73]. The CMF values are near to zero outside this visual interval [73]. R(443), R(490), R(560), R(665), and R(705) in equation 5 corresponds to R(443.9), R(496.6), R(560.0), R(664.5), and R(703.9) of Sentinel-2, respectively.
The chromaticity coordinates in CIE were calculated using X, Y, and Z tristimulus values, and the calculated chromaticity coordinates were normalized to 0–1. Therefore, a new coordinate system was obtained based on the chromaticity coordinates.
x = X / ( X + Y + Z ) y = Y / ( X + Y + Z )
The hue angle α can be expressed as [35,73]:
α = arctan y y w x x w × 180 π
The coordinates of the yw and xw are (1/3, 1/3).
The optimal linear relationship between the hue angle   α calculated based on hyperspectral data and that calculated by the satellite sensor was obtained via the fine correction of each hue angle   α . The hue angle   α correction (△) process compensates for the linear interpolation between the natural water spectrum and detector band [72]. The affirmative correction of different sensors was conducted based on the interpretations of Hendrik Jan van der Woerd and Marcel Robert Wernand [73]. Sensors with limited bands produced a large offset; however, the offset was not completely random. The hue angle   α correction formula of the Sentinel-2 satellite is expressed, as follows [73]:
Δ = 65.74 a 5 + 477.16 a 4 1279.99 a 3 + 1524.96 a 2 751.59 a + 116.56
where a is the calculated hue angle   α that is divided by 100. A hue angle α closer to the waterbody can be obtained by correcting the hue angle   α , as indicated in the above formula. Figure 4 shows a flow chart about FUI calculation.

2.6. Temporal and Spatial Aggregation

To analyse the changes in the trend of the FUI for Baiyangdian Lake, the FUI model was applied to Sentinel-2 images to calculate the FUI for Baiyangdian Lake for the 2016–2020 period. The calculation of the monthly and annual FUI for Baiyangdian Lake required the acquisition of images during the non-icing period of the water and in the absence of a large proportion of cloud cover. The non-icing period of Baiyangdian Lake is usually from April to November. Table 1 shows the statistical results of valid images that were obtained in each month from 2016 to 2020. In this study, the FUI was not obtained from a single-scene image. Instead, the FUI results of all available images in each month were calculated, respectively, and the mean value of these results was obtained to derive the monthly FUI. Thereafter, the monthly FUI in each year was calculated to finally obtain the annual FUI.
The spatial distribution of FUI was determined to obtain the overall annual FUI for the 2016 to 2020 period. The mean FUI value corresponding to the overlapping areas was determined to obtain the final spatial distribution results. Additionally, the minimum and maximum values for each region were calculated.

3. Results and Discussion

3.1. Accuracy of Evaluation of FUI

In order to prove the stability of FUI, FUI was calculated using the quasi-synchronous Sentinel-2 image of Baiyangdian Lake on 23 May 2019, and it was compared with the FUI calculated through in situ remote sensing reflectance Rrs(λ) on 21 and 22 May 2019. First, the FUI was extracted using the remote-sensing reflectance of the Sentinel-2 image. Thereafter, the FUI was extracted using in situ remote-sensing reflectance Rrs(λ). Figure 5 shows the scatterplot of the accuracy evaluation of the FUI, with RMSE = 0.57 and MRE = 3.54%.
The larger the FUI is, the more turbid the water is. The smaller the FUI, the clearer the water. Therefore, the FUI results should be negatively correlated with the water clarity results. In this study, we analysed the water clarity results and the FUI results, and then observed that the negative correlation coefficient between them was −0.78, which further proved the stability and reliability of the FUI.

3.2. Spatial Distribution

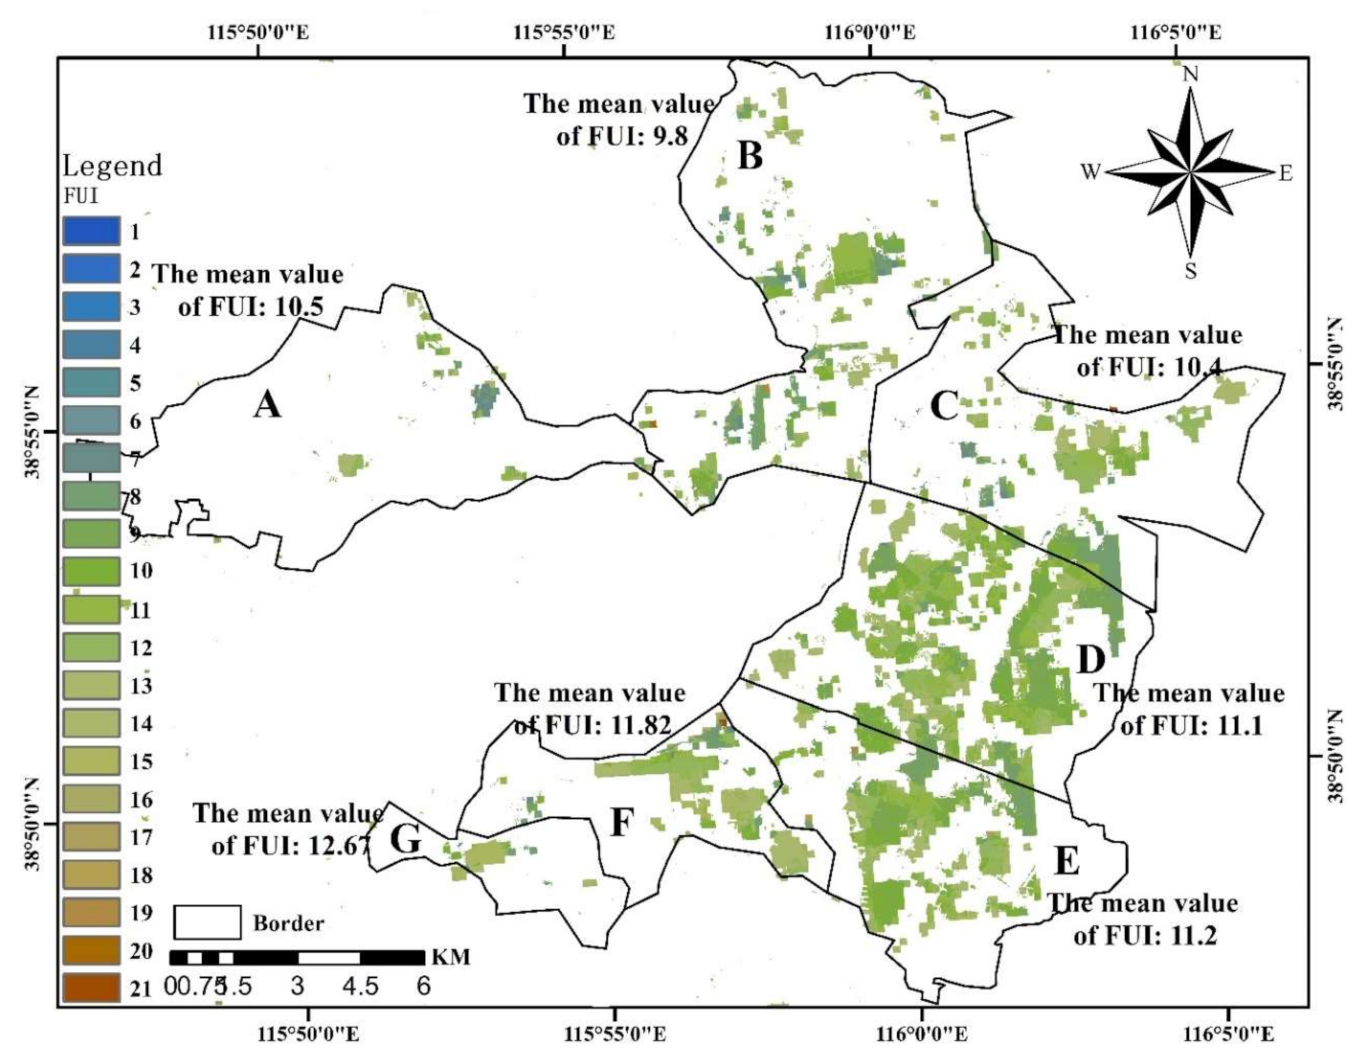
Figure 6 illustrates the mean FUI value of the results from April to November in 2016–2020.The results showed that the spatial distribution of Baiyangdian Lake was high in the south and low in the north, with the highest FUI values of 11.82 and 12.67 in F and G zones, respectively, in the south, and the lowest FUI value (9.8) in zone of B in the north, as indicated in Figure 6. The FUI values of A, C, D, and E zones in the other four zones were 10.5, 10.4, 11.1, and 11.2, respectively. The higher value of FUI in the G and F water zones may be due to the following two reasons: (1) the Zhulong River, Tang River, and Xiaoyi River merge into the G zone and carry large quantities of silt, which leads to substantial sediment accumulation in the G zone of Baiyangdian Lake, causing turbidity [12]; (2) fish farming in the F zone is relatively developed and it primarily includes cage fish farming, fence fish farming, and trench stocking [27]. The Baiyangdian lake is polluted by the manure that is produced by the fish, and cage fish culture discharges large amounts of bait into the water, both of which accelerate lake eutrophication [26].

3.3. Seasonal Variations

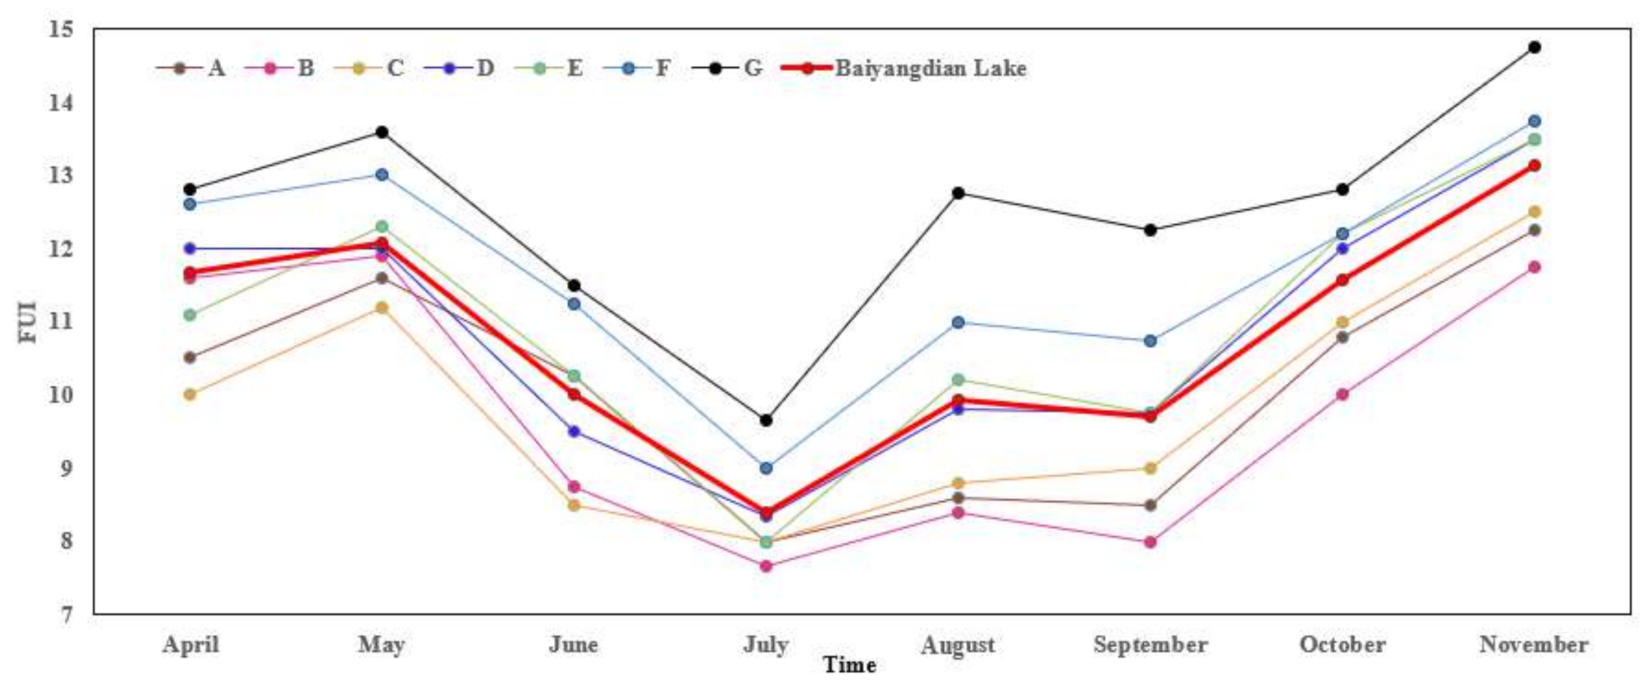
Figure 7 illustrates the mean monthly FUI value of Baiyangdian Lake and the seven sub-regions from April to November in 2016–2020. The April–May period represents spring, June–August represents summer, and September–November represents autumn. According to the mean monthly FUI value of Baiyangdian Lake from April to November in 2016–2020, the seasonal variations within the lake and its seven sub-regions were highly consistent. The monthly mean FUI value was higher in both spring and autumn, indicating that the water was relatively turbid, whereas the summer FUI was lower, indicating that the waterbody was clear. Additionally, local climatic conditions were probably the main factors affecting the seasonal variations in the FUI in the study area. The Baiyangdian Lake Basin is in a temperate continental monsoon climate zone with four distinct seasons. The spring is dry and rainless; the summer is hot and rainy; the autumn is sunny; and, the winter is cold and snowy, with temperatures below 0 °C, thus, freezing water. Therefore, winter was excluded from this study. Precipitation increases surface runoff and it deposits a large amount of sediment into Baiyangdian Lake due to the influence of upstream water and sediment, resulting in the turbidity of the waterbody and an increase in the FUI value. In the spring, with the increase of precipitation, the amount of water in Baiyangdian Lake increases, and it is affected by the upstream water and sediment, resulting in an increase in the FUI; Baiyangdian Lake experiences rain in the summer, and the water level rises, which results in a decrease in the FUI; from summer to autumn, the precipitation is less variable and the water level gradually decreases, and a large amount of sediment accumulates in the lake, resulting in an increase in the FUI. Because of the increase in precipitation in Baiyangdian Lake in summer, the concentration of suspended solids in the water is diluted, and the FUI is lower. Additionally, industrial wastewater and agricultural irrigation withdrawals are gradually increasing due to the development of economy. To meet the water demand of the industry and agriculture located in the upstream areas, few large and medium-sized reservoirs were built in the upper reaches of Baiyangdian Lake to intercept water, reducing the water inflows and increasing the sediment content in the lake.

3.4. Inter-Annual Variations

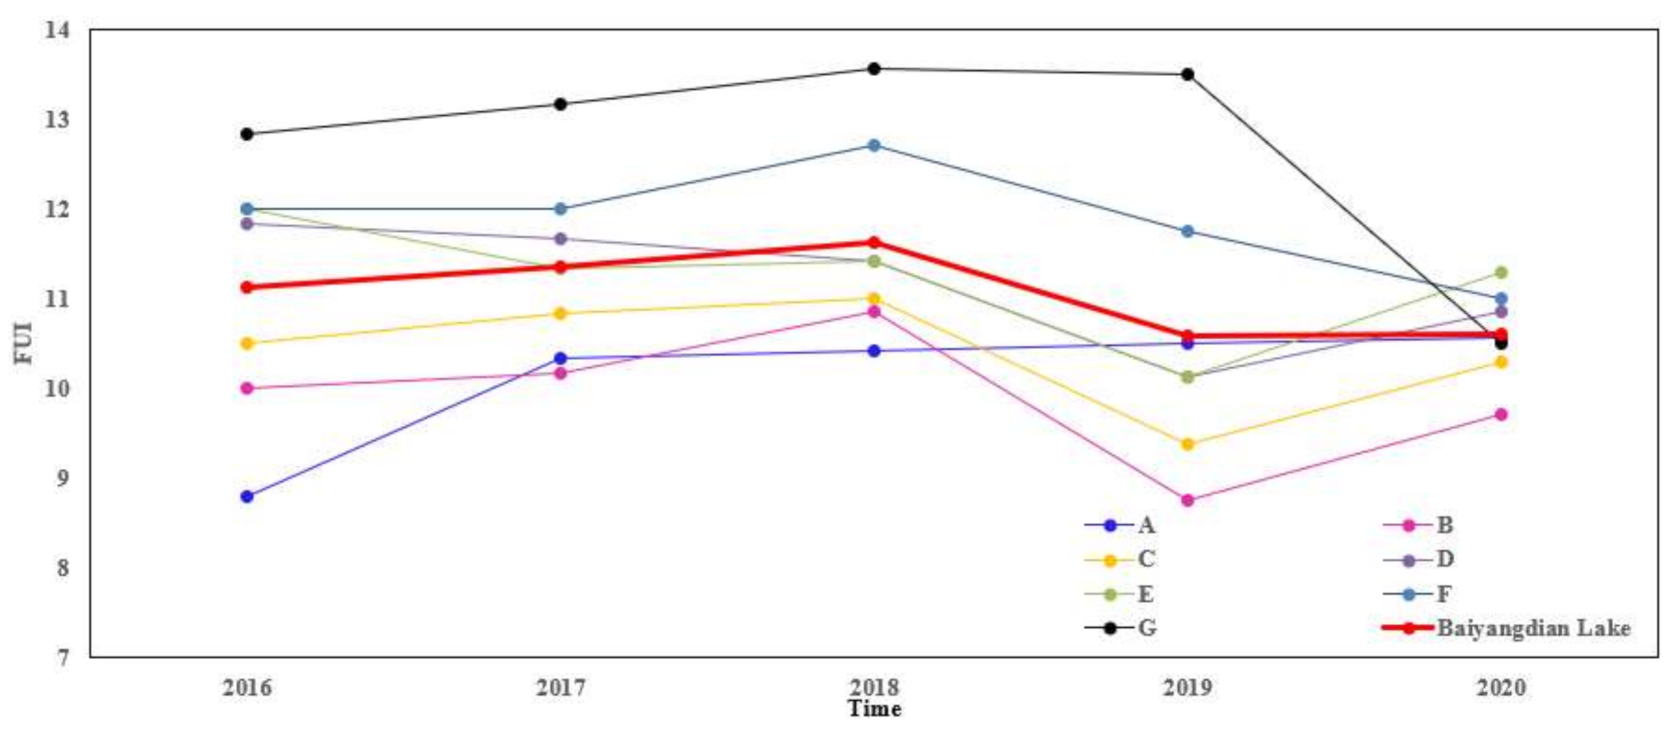
Figure 8 illustrates the statistical results of the mean annual FUI value for the Baiyangdian Lake and its seven sub-regions (A–G) from 2016 to 2020. Table 2 shows the mean annual FUI value in the Baiyangdian Lake and its seven sub-regions from 2016 to 2020. The mean annual FUI value in zone A increased significantly in 2017 as compared with 2016, and it showed a weak upward trend from 2017 to 2020. This may be due to the establishment of the Xiong’an New Area in 2017, the robust development of industries in upstream cities, continuous increase of domestic sewage and industrial wastewater, and a large quantity of pollutants being discharged into the lake through the river during the wet season. From 2016 to 2020, the mean annual value of FUI in B, C, D, E, F, and G zones and the overall Baiyangdian Lake shows a weak downward trend, indicating that the water quality had slightly improved. Among these changes, the change trend in the mean annual FUI value in B and C zones was consistent; both had a weak upward trend in 2017 and 2018 as compared with 2016, and the mean annual FUI value in 2019 was significantly lower than in 2018 and 2020. The trend of the mean annual FUI value in D and E zones was also consistent: in 2016–2019, these values decreased every year, showing a slight increase in 2020. The trend in the mean annual FUI value in zones of F and G, and the overall Baiyangdian Lake showed a slight increase from 2016 to 2018, and a gradual decrease from 2018 to 2020, among which the mean annual FUI value in zone of G decreased significantly in 2020. Various local water environment management strategies were formulated in 2018 and 2019 to strengthen the internal pollution management and external pollution prevention and control in Baiyangdian Lake. In consequence, the water quality of Baiyangdian Lake did not further deteriorate, indicating that the management policies may have achieved certain results [3,4,5]. The present results are generally consistent with the results obtained by Wang et al. [74]. The slight increase in FUI in the B, C, D, and E zones in 2020 may be due to the influence of precipitation and streamflow [24,75]. Additionally, the Nanjumahe River in the north of B and C zones, and the Zhaowangxinhe River in east of D and E zones, may have deposited large amounts of sediments into the lake, leading to the slight increase in the FUI value [12,28,76,77,78]. Table 2 shows the statistical mean of the annual FUI values of the Baiyangdian Lake and seven sub-regions.

3.5. Deficiencies

In this study, the temporal analysis of Baiyangdian Lake is relatively short. The study mainly focused on the analysis of the water quality variations of Baiyangdian Lake after the establishment of Xiong’an New Area on 1 April 2017. Because the area under water in Baiyangdian Lake is relatively small and broken, remote sensing images with high spatial resolution were required; therefore, Sentinel-2 images were selected. As the temporal resolution of Landsat data is relatively low and the revisit period is 15 days, less data would be available per month, thus increasing the uncertainties in the analysis of the seasonal and inter-annual variations of water quality in Baiyangdian Lake. In the future, we will combine multi-source remote sensing data (such as GF-1, GF-2, JL-1, etc.) with local precipitation data, water level data, runoff data, etc. to analyse the variation across longer periods. Furthermore, we will simultaneously interpret the deviation between different sensors.

4. Conclusions

The optical properties of inland water are complex, and conventional water quality parameter inversion models have limitations. FUI is an optical parameter, which is the result of the interaction between solar light and substances in water. It is affected by the absorption and scattering of different components in water, and it has a significant relationship with the cleanliness of water. Thus, it can be used to characterise water quality in different regions and seasons. Therefore, based on Sentinel-2 images and GEE, our study calculated FUI for the Baiyangdian Lake area from April to November in 2016–2020 and analysed the spatial distribution and seasonal and inter-annual variations in Baiyangdian Lake. The following are our main conclusions:
(1) Spatial distribution: high FUI value was observed in the south and lower north. The water in F and G zones was the most turbid, with mean FUI values of 11.9 and 12.7, respectively. The A, B, C, D, and E zones were relatively clear with mean FUI values of 10.5, 9.8, 10.4, 11.1, and 11.2, respectively.
(2) Seasonal variations: the seasonal variations in Baiyangdian Lake and seven sub-regions were consistent; the lake was relatively turbid in spring and autumn and it became relatively clear in summer, which may be due to increased precipitation that increases surface runoff and sediment content, resulting in water turbidity.
(3) Inter-annual variations: the zone of A showed an upward trend that indicated decreases in water quality. From 2016 to 2020, the FUI values of D and E zones showed a gradual decreasing trend, while those of B, C, F, and G zones showed a weak increasing trend from 2016 to 2018, but a gradual decreasing trend from 2018 to 2020. Overall, Baiyangdian Lake showed similar tends as the B, C, D, F, and G zones, indicating that the overall water quality of Baiyangdian Lake most likely improved, which may be related to local governance polices.

Author Contributions

Conceptualization, Q.S. and Y.Z.; methodology, Y.Z. and S.W.; Software, Y.Z.; validation, Q.S., F.Z. and S.W.; Formal Analysis, Y.Z.; investigation, Y.Z.; resources, J.L.; data curation, F.Y.; writing—original draft preparation, Y.Z.; writing—review and editing, J.L., Q.S., S.W. and F.Z.; visualization, F.Z.; supervision, Q.S.; project administration, F.Z.; funding acquisition, F.Z. All authors have read and agreed to the published version of the manuscript.

Funding

This work was supported by the Hainan Provincial Department of Science and Technology (ZDKJ2019006), the Science and Technology Service Network Initiative, Chinese Academy of Sciences (KFJ-STS-ZDTP-077), Open Research Fund of National Earth Observation Data Center (No.NODAOP2020017), the National Natural Science Foundation of China (419713184), and Dragon 5 Cooperation (No. 59193).

Data Availability Statement

In this section, please provide details regarding where data supporting reported results can be found, including links to publicly archived datasets analyzed or generated during the study. Please refer to suggested Data Availability Statements in section “MDPI Research Data Policies” at https://www.mdpi.com/ethics, accessed on 23 April 2021. You might choose to exclude this statement if the study did not report any data.

Acknowledgments

The authors would like to thank ESA and GEE for providing the Sentinel-2 data. We would like to thank Editage (8 April 2021) for English language editing.

Conflicts of Interest

The authors declare no conflict of interest.

References

  1. China to create Xiong’an New Area in Hebei. Available online: http://www.gov.cn/xinwen/2017–04/01/content_5182891.htm#1 (accessed on 1 April 2017).
  2. Xiong’an New Area Focuses on Comprehensive Improvement of Water Environment in Baiyangdian Basin. Available online: https://baijiahao.baidu.com/s?id=1597093148398412407&wfr=spider&for=pc. (accessed on 7 April 2018).
  3. Three Projects Were Formulated and 51 Projects Were Implemented. Xiong’an New Area Took Many Measures to Control and Repair the Ecological Environment of Baiyangdian Lake. Available online: https://kuaibao.qq.com/s/20191205A0SLWQ00?refer=spider (accessed on 5 December 2019).
  4. Pearl of North China Reappears Vitality. Available online: http://news.hexun.com/2020–04–14/201012586.html (accessed on 14 April 2020).
  5. Xiong’an New Area, Hebei Province: Exploring a New Way to Control Endogenous Pollution. Available online: https://baijiahao.baidu.com/s?id=1677195894437407993&wfr=spider&for=pc (accessed on 8 September 2019).
  6. Fragam, R.S.; Guedes, H.A.S.; Martins, V.S.; Caballero, C.B.; Mendes, K.G.P.; Monks, J.L.F.; Fassoni-Andrade, A.C. Empirical modelling of suspended solids in a subtropical lagoon (Brazil) using linear spectral mixing algorithm. Remote Sens. Appl. Soc. Environ. 2020, 20, 100380. [Google Scholar]
  7. Wang, Q.; Yang, Y.; Wu, C.Q. Study of retrieving models for Chlorophyll-A concentration based on HJ-1A HIS images. Spacecr. Eng. 2009, 16, 133–137. [Google Scholar]
  8. Zhou, L.; Xu, B.; Ma, W.; Zhao, B.; Li, L.; Huai, H. Evaluation of Hyperspectral Multi-Band Indices to Estimate Chlorophyll-A Concentration Using Field Spectral Measurements and Satellite Data in Dianshan Lake. Water 2013, 5, 525–539. [Google Scholar] [CrossRef]
  9. Zhu, Y.F.; Zhu, L.; Li, J.G.; Chen, Y.J.; Zhang, Y.H.; Hou, H.Q.; Jiu, X.; Zhang, Y.Z. The study of inversion of chlorophyll a in Taihu based on GF-1 WFV image and BP neural network. Acta Sci. Circumstantiae. 2017, 1, 130–137. [Google Scholar]
  10. Saberioon, M.; Brom, J.; Nedbal, V.; Soucek, P.; Cisar, P. Chlorophyll-a and total suspended solids retrieval and mapping using Sentinel-2A and machine learning for inland waters. Ecol. Indic. 2020, 113, 106236. [Google Scholar] [CrossRef]
  11. Gao, Y.C.; Wang, H.; Long, D. Changes in hydrological conditions and the eco-environment problems in Baiyangdian Watershed. Resour. Sci. 2009, 31, 1506–1513. [Google Scholar]
  12. Li, Y.H.; Cui, B.S.; Yang, Z.F. Influence of hydrological characteristic change of Baiyangdian on the ecological environment in Wetland. J. Nat. Resour. 2004, 19, 62–68. [Google Scholar]
  13. Liu, K.; Zhang, L.; Zhang, G.; Liu, J.; Yan, M. The impact of human activities on runoff in Baiyangdian Basin in North China. J. China Hydrol. 2007, 27, 6–10. [Google Scholar]
  14. Gong, R. Water Change in Baiyangdian Lake and affecting factors. Geogr. Territ. Res. 1993, 9, 36–40. [Google Scholar]
  15. Wang, X.Y.; Wang, W.J.; Jiang, W.G.; Jia, K.; Rao, P.Z.; Lv, J.X. Analysis of the dynamic changes of the Baiyangdian Lake surface based on a complex water extraction method. Water 2018, 10, 1616. [Google Scholar] [CrossRef] [Green Version]
  16. Song, C.Q.; Ke, L.H.; Pan, H.; Zhan, S.G.; Liu, K.; Ma, R.H. Long-term surface water changes and driving cause in Xiong’an, China: From dense Landsat time series images and synthetic analysis. Sci. Bull. 2018, 11, 708–716. [Google Scholar] [CrossRef] [Green Version]
  17. Li, C.H.; Zheng, X.K.; Zhao, F.; Wang, X.; Cai, Y.P.; Zhang, N. Effects of urban non-point source pollution from Baoding City on Baiyangdian Lake, China. Water 2017, 9, 249. [Google Scholar]
  18. Liu, C.L.; Xie, G.D.; Huang, H.Q. Shrinking and drying up of Baiyangdian Lake wetland: A natural or human cause? Chin. Geogr. Sci. 2006, 16, 314–319. [Google Scholar] [CrossRef]
  19. Zhao, Y.; Xia, X.H.; Yang, Z.F.; Wang, F. Assessment of water quality in Baiyangdian Lake using multivariate statistical techniques. Procedia Environ. Sci. 2012, 13, 1213–1226. [Google Scholar] [CrossRef] [Green Version]
  20. Su, L.Y.; Liu, J.L.; Christensen, P. Spatial distribution and ecological risk assessment of metals in sediments of Baiyangdian wetland ecosystem. Ecotoxicology 2011, 20, 1107–1116. [Google Scholar] [CrossRef]
  21. Zhang, M.; Gong, Z.N.; Zhao, W.J.; Duo, A. Landscape pattern change and the driving in Baiyangdian wetland from 1984–2014. Acta Ecol. Sin. 2016, 36, 4780–4791. [Google Scholar]
  22. Wang, T.T.; Cui, B.S.; Liu, P.P.; Lan, Y.; Han, Z.; Zhang, Y.T. Effect of floating plants on distributions of emergent and submerged plants in Baiyangdian Lake. Wetl Sci. 2013, 11, 266–270. [Google Scholar]
  23. Wang, X.D.; Liu, S.L.; Zhang, S.S.; Chen, J.W. Improvement of WASP Eutrophication Model in Baiyangdian Water Area. Environ. Sci. Technol. 2009, 10, 19–24. [Google Scholar]
  24. Yuan, Y.; Yan, D.H.; Wang, H.; Wang, Q. Attributive analysis on evolution of inflow to Baiyangdian wetland. J. Water Resour. Plan. Manag. 2013, 12, 1–4. [Google Scholar]
  25. Hu, S.S.; Zheng, H.X.; Liu, C.M.; Yu, J.J.; Wang, Z.G. Assessing the impacts of climate variability and human activities on streamflow in the water source area of Baiyangdian Lake. J. Geogr. Sci. 2012, 22, 895–905. [Google Scholar] [CrossRef]
  26. Liu, F.; Liu, J.J.; Zhang, T.; Chen, Q.Y. Land use change and its effects on water quality in Baiyangdian Lake of north China during last 20 Years. J. Agro-Environ. Sci. 2010, 29, 1868–1875. [Google Scholar]
  27. Zhao, Y.K.; Zhang, X.Q.; Ma, D.M. Baiyangdian functional area division principle. Environ. Sci. 1995, S1, 40–41. [Google Scholar]
  28. Wang, H.N.; Lv, X.Z.; Zhang, M.Y. Sensitivity and attribution analysis based on the Budyko hypothesis for streamflow change in the Baiyangdian catchment, China. Eco. Ind. 2021, 121, 107221. [Google Scholar]
  29. Zhu, H.; Liu, X.G.; Cheng, S.P. Phytoplankton community structure and water quality assessment in an ecological restoration area of Baiyangdian Lake, China. Int. J. Environ. Sci. Technol. 2020, 1735, 1–8. [Google Scholar] [CrossRef]
  30. Zhao, Y.; Han, J.Y.; Zhang, B.; Gong, J.G. Impact of transferred water on the hydrochemistry and water quality of surface water and groundwater in Baiyangdian Lake, North China. Geosci. Front. 2020, 12, 101086. [Google Scholar] [CrossRef]
  31. Yan, S.; Yin, J.; Yuan, Z.; Yan, D.H.; Yuan, Y. Research on Drought Retrieve in Baiyangdian Basin, China. Earth Environ. Sci. 2020, 525, 012004. [Google Scholar] [CrossRef]
  32. Wang, S.; Li, J.; Zhang, B.; Spyrakos, E.; Tyler, A.N.; Shen, Q.; Zhang, F.; Kuster, T.; Lehmann, M.K.; Wu, Y.; et al. Trophic state assessment of global inland waters using a MODIS-derived Forel-Ule index. Remote Sens. Environ. 2018, 217, 444–460. [Google Scholar] [CrossRef] [Green Version]
  33. Wang, S.; Li, J.; Zhang, B.; Lee, Z.; Spyrakos, E.; Feng, L.; Liu, C.; Zhao, H.; Wu, Y.; Zhu, L.; et al. Changes of water clarity in large lakes and reservoirs across China observed from long-term MODIS. Remote Sens. Environ. 2020, 247, 111949. [Google Scholar] [CrossRef]
  34. Wang, S.L.; Li, J.S.; Shen, Q.; Zhang, B.; Zhang, F.; Lu, Z.Y. MODIS-based radiometric colour extraction and classification of inland water with the Forel-Ule scale: A case study of Lake Taihu. IEEE J. Sel. Top. Appl. Earth Obs. Remote Sens. 2015, 8, 907–918. [Google Scholar] [CrossRef]
  35. Van der Woerd, H.J.; Wernad, M.R. True colour classification of natural waters with medium-spectral resolution satellites: SeaWiFs, MODIS, MERIS and OLCI. Sensors 2015, 15, 25663–25680. [Google Scholar] [CrossRef] [Green Version]
  36. Alfoldi, T.; Munday, J. Water quality analysis by digital chromaticity mapping of Landsat data. Can. J. Remote Sens. 1978, 4, 108–126. [Google Scholar] [CrossRef]
  37. Jaquet, J.; Zand, B. Colour analysis of inland waters using Landsat TM data. ESA SP 1989, 1102, 57–67. [Google Scholar]
  38. Bukata, R.P.; Bruton, J.E.; Jerome, J.H. Use of chromaticity in remote measurements of water quality. Remote Sens. Environ. 1983, 13, 161–177. [Google Scholar] [CrossRef]
  39. Bukata, R.P.; Jerome, J.H.; Kondratyev, K.Y.; Pozdnyakov, D.V.; Kotykhov, A.A. Modeling the radiometric colour of inland waters: Implications to a) remote sensing and b) limnological colour scales. J. Great Lakes Res. 1997, 23, 254–269. [Google Scholar] [CrossRef]
  40. Li, J.S.; Wang, S.L.; Wu, Y.H.; Zhang, B.; Chen, X.L.; Zhang, F.F.; Shen, Q.; Peng, D.L.; Tian, L.Q. MODIS observations of the water colour of the largest 10 lakes in China between 2000 and 2012. Int. Digit. Earth 2016, 9, 788–805. [Google Scholar] [CrossRef]
  41. Shen, Q.; Yao, Y.; Li, J.S.; Zhang, F.F.; Wang, S.L.; Wu, Y.H.; Ye, H.P.; Zhang, B. A CIE colour purity algorithm to detect black and odorous water in urban rivers using high-resolution multispectral remote sensing images. IEEE Trans. Geosci. Remote Sens. 2019, 57, 6577–6590. [Google Scholar] [CrossRef]
  42. Wang, S.L.; Lee, Z.P.; Shang, S.L.; Li, J.S.; Lin, G. Deriving inherent optical properties from classical water colour measurements: Forel-Ule Index and Secchi disk depth. Opt. Express 2019, 27, 7642–7655. [Google Scholar] [CrossRef]
  43. Garaba, S.P.; Friedrichs, A.; Vofs, D.; Zielinski, O. Classifying natural waters with the Forel-Ule colour system: Results, applications, corrdations and crowdsourcing. Int. J. Environ. Res. Public Health 2015, 12, 16096–16109. [Google Scholar] [CrossRef] [Green Version]
  44. Zhao, Y.L.; Qian, S.; Wang, Q.; Yang, F.; Wang, S.L.; Li, J.S.; Zhang, F.F.; Yao, Y. Recognition of water colour anomalies by using hue angle and Sentinel-2 images. Remote Sens. 2020, 12, 716–736. [Google Scholar] [CrossRef] [Green Version]
  45. Petus, C.; Waterhous, J.; Lewis, S.; Vacher, M.; Tracey, D.; Devlin, M. A flood of information: Using Sentinel-3 water colour products to assure continuity in the monitoring of water quality trends in the Great Barrier Reef (Australia). J. Environ. Manag. 2019, 248, 109255. [Google Scholar] [CrossRef]
  46. Sidik, M.J.; Bower, D.G.; Griffiths, J.W. Remote sensing observations of ocean colour using the traditional Forel-Ule Scale. Estuar. Coast. Shelf Sci. 2018, 215, 52–58. [Google Scholar] [CrossRef]
  47. Nie, Y.F.; Guo, J.T.; Sun, B.N.; Lv, X.Q. An evaluation of apparent colour of seawater and on the in-situ and satellite-derived Forel-Ule colour scale. Estuar. Coast. Shelf Sci. 2020, 246, 107032. [Google Scholar] [CrossRef]
  48. Pitarch, J.; Bellacicco, M.; Marullo, S.; Van der Woerd, H. Global maps of Forel-Ule Index, hue angle and Secchi disk depth derived from twenty-one years of monthly ESA-OC-CCI data. Earth Syst. Sci. Data 2020, 316. [Google Scholar]
  49. Patel, N.N.; Angiuli, E.; Gamba, P.; Gaughan, A.; Lisini, G.; Stevens, F.R.; Tatem, A.J.; Trianni, G. Multitemporal settlement and population mapping from Landsat using Google Earth Engine. Int. J. Appl. Earth Obs. Geoinf. 2015, 35, 199–208. [Google Scholar] [CrossRef] [Green Version]
  50. Liu, X.P.; Hu, G.H.; Chen, Y.M.; Li, X.; Pei, F.S. High-resolution multi-temporal mapping of global urban land using Landsat images based on the Google Earth Engine platform. Remote Sens. Environ. 2018, 209, 227–239. [Google Scholar] [CrossRef]
  51. Sidhu, N.; Pebesma, E.; Camara, G. Using Google Earth Engine to detect land cover change: Singapore as a use case. Eur. J. Remote Sens. 2018, 51, 486–500. [Google Scholar] [CrossRef]
  52. Dong, J.W.; Xiao, X.M.; Menarguez, M.A.; Zhang, G.L.; Qin, Y.W.; Thau, D.; Biradar, C.; Moore, B. Mapping paddy rice planting area in northeastern Asia with Landsat 8 images, phenology-based algorithm, and Google Earth Engine. Remote Sens. Environ. 2016, 185, 142–154. [Google Scholar] [CrossRef] [Green Version]
  53. Gorelick, N.; Harcher, M.; Dixon, M.; Ilyushchenkob, S.; Thau, D.; Moore, R. Google Earth Engine planetary-scale geospatial analysis for everyone. Remote Sens. Environ. 2017, 202, 18–27. [Google Scholar] [CrossRef]
  54. Gui, B.S.; Li, X.; Zhang, K.J. Classification of hydrological conditions to assess water allocation schemes for Lake Baiyangdian in North China. J. Hydrol. 2010, 385, 247–256. [Google Scholar]
  55. Yang, Z.F.; Mao, X.F. Wetland system network analysis for environmental flow allocations in the Baiyangdian basin, China. Ecol. Model. 2011, 222, 3785–3794. [Google Scholar] [CrossRef]
  56. Chen, J.; Zhu, W.N.; Tian, Y.Q.; Yu, Q.; Zheng, Y.H.; Huang, L.T. Remote estimation of colored dissolved organic matter and chlorophyll-a in Lake Huron using Sentinel-2 measurements. J. Appl. Remote Sens. 2017, 11, 036007. [Google Scholar] [CrossRef]
  57. Guo, H.W.; Huang, J.J.; Chen, B.; Guo, X.L.; Singh, V.P. A machine learning-based strategy for estimating non-optically active water quality parameters using Sentinel-2 imagery. Int. J. Remote Sens. 2020, 42, 1841–1866. [Google Scholar] [CrossRef]
  58. Wang, J.; Ding, J.; Yu, D.; Ma, X.; Zhang, Z.; Ge, X.; Teng, D.; Li, X.; Liang, J.; Lizaga, I.; et al. Capability of Sentinel-2 MSI data for monitoring and mapping of soil salinity in dry and wet seasons in the Ebinur Lake region, Xinjiang, China. Geoderma 2019, 353, 172–187. [Google Scholar] [CrossRef]
  59. Caballero, I.; Fernandez, R.; Escalante, O.M.; Maman, L.; Navarro, G. New capabilities of Sentinel-2A/2B satellites combined with in situ data for monitoring small harmful algal blooms in complex coastal waters. Sci. Rep. 2020, 10, 8743. [Google Scholar] [CrossRef]
  60. Toming, K.; Kutser, T.; Laas, A.; Sepp, M.; Paavel, B.; Noges, T. First Experiences in Mapping Lake Water Quality Parameters with Sentinel-2 MSI Imagery. Remote Sens. 2016, 8, 640–653. [Google Scholar] [CrossRef] [Green Version]
  61. Chen, J.; Zhu, W.N.; Tian, Y.Q.; Yu, Q. Monitoring dissolved organic carbon by combining Landsat-8 and Sentinel-2 satellites: Case study in Saginaw River estuary, Lake Huron. Sci. Total Environ. 2020, 718, 137374. [Google Scholar] [CrossRef]
  62. Tang, J.W.; Tian, G.L.; Wang, X.Y.; Wang, X.M.; Song, Q.J. The methods of water spectral measurement and analysis I: Above water method. J. Remote Sens. 2004, 8, 37–44. [Google Scholar]
  63. Ocean Optics Book. Available online: www.oceanopticbooks.info/view/overview-of-optical-oceannography/refelectance (accessed on 29 July 2017).
  64. Muller, J.L.; Fargion, G.S.; Mcclain, C.R. Ocean Optics Protocols for Satellite Ocean Colour Sensor Validation, Revision 4, Volume Ⅲ: Radiometric Measurements and Data Analysis Protocols; NASA/TM-2003–21621/Rev-VolⅢ; National Aeronautical and Space Administration: Washington, DC, USA, 2003.
  65. Gong, P.; Liu, H.; Zhang, M.; Li, C.; Wang, J.; Huang, H.; Clinton, N.; Ji, L.; Li, W.; Bai, Y.; et al. Stable classification with limited sample: Transferring a 30 m resolution sample set collected in 2015 to mapping 10 m resolution global land cover in 2017. Sci. Bull. 2019, 64, 370–373. [Google Scholar] [CrossRef] [Green Version]
  66. Feyisa, G.L.; Meilby, J.; Fensholt, R.; Proud, S.R. Automated water extraction index: A new technique for surface water mapping using Landsat imagery. Remote Sens. Environ. 2014, 140, 23–35. [Google Scholar] [CrossRef]
  67. McFeeters, S.K. The use of the normalised difference water index (NDWI) in the delineation of open water features. Int. J. Remote Sens. 1996, 17, 1425–1432. [Google Scholar] [CrossRef]
  68. Xu, H.Q. Modification of normalised difference water index (NDWI) to enhance open water features in remotely sensed imagery. Int. J. Remote Sens. 2006, 27, 3025–3033. [Google Scholar] [CrossRef]
  69. Wang, X.B.; Xie, S.P.; Zhang, X.L.; Chen, C.; Guo, H.; Du, J.K.; Duan, Z. A robust multi-band water index (MBWI) for automated extraction of surface water from Landsat 8 OLI imagery. Int. J. Appl. Earth Obs. Geoinf. 2018, 68, 73–91. [Google Scholar] [CrossRef]
  70. Capoa, M.; Pereza, A.; Lozanoa, J.A. An efficient approximation to the K-Means clustering for massive data. Knowl. Based Syst. 2017, 117, 56–59. [Google Scholar] [CrossRef] [Green Version]
  71. Exelis, 2010. Exelis Visual Information Solutions. Available online: http://www.exelisvis.com (accessed on 6 June 2014).
  72. CIE. Commission International de l’Eclairage Proceedings 1931; Cambridge University Press: Cambridge, UK, 1931; pp. 19–29. [Google Scholar]
  73. Van der Woerd, H.J.; Wernand, M.R. Hue-angle product for low to medium spatial resolution optical satellite sensors. Remote Sens. 2018, 10, 180. [Google Scholar] [CrossRef] [Green Version]
  74. Wang, M.X.; Yao, Y.; Shen, Q.; Gao, H.J.; Li, J.S.; Zhang, F.F.; Wu, Q.S. Time-Series Analysis of Surface-Water Quality in Xiong’an New Area, 2016–2019. J. Indian Soc. Remote Sens. 2021, 49, 857–872. [Google Scholar] [CrossRef]
  75. Liu, C.L.; Xie, G.D.; Xiao, Y. Impact of climatic change on Baiyangdian wetland. Res. Environ. Yangtze Basin 2007, 16, 245–250. [Google Scholar]
  76. Gao, Y.C.; Wang, J.F.; Feng, Z.M. Variation trend and response relationship of temperature, precipitation and runoff in Baiyangdian lake basin. Chin. J. Eco Agric. 2017, 25, 467–477. [Google Scholar]
  77. Liu, M.F.; Gao, Y.C.; Gan, G.J. Long-term trends in annual runoff and the impact of meteorological factors in the Baiyangdian watershed. Res. Sci. 2011, 33, 1438–1445. [Google Scholar]
  78. Yang, C.X. Analysis on the deposited quantity variation and its influenced factors in Baiyangdian. Ground Water 2010, 32, 110–112. [Google Scholar]
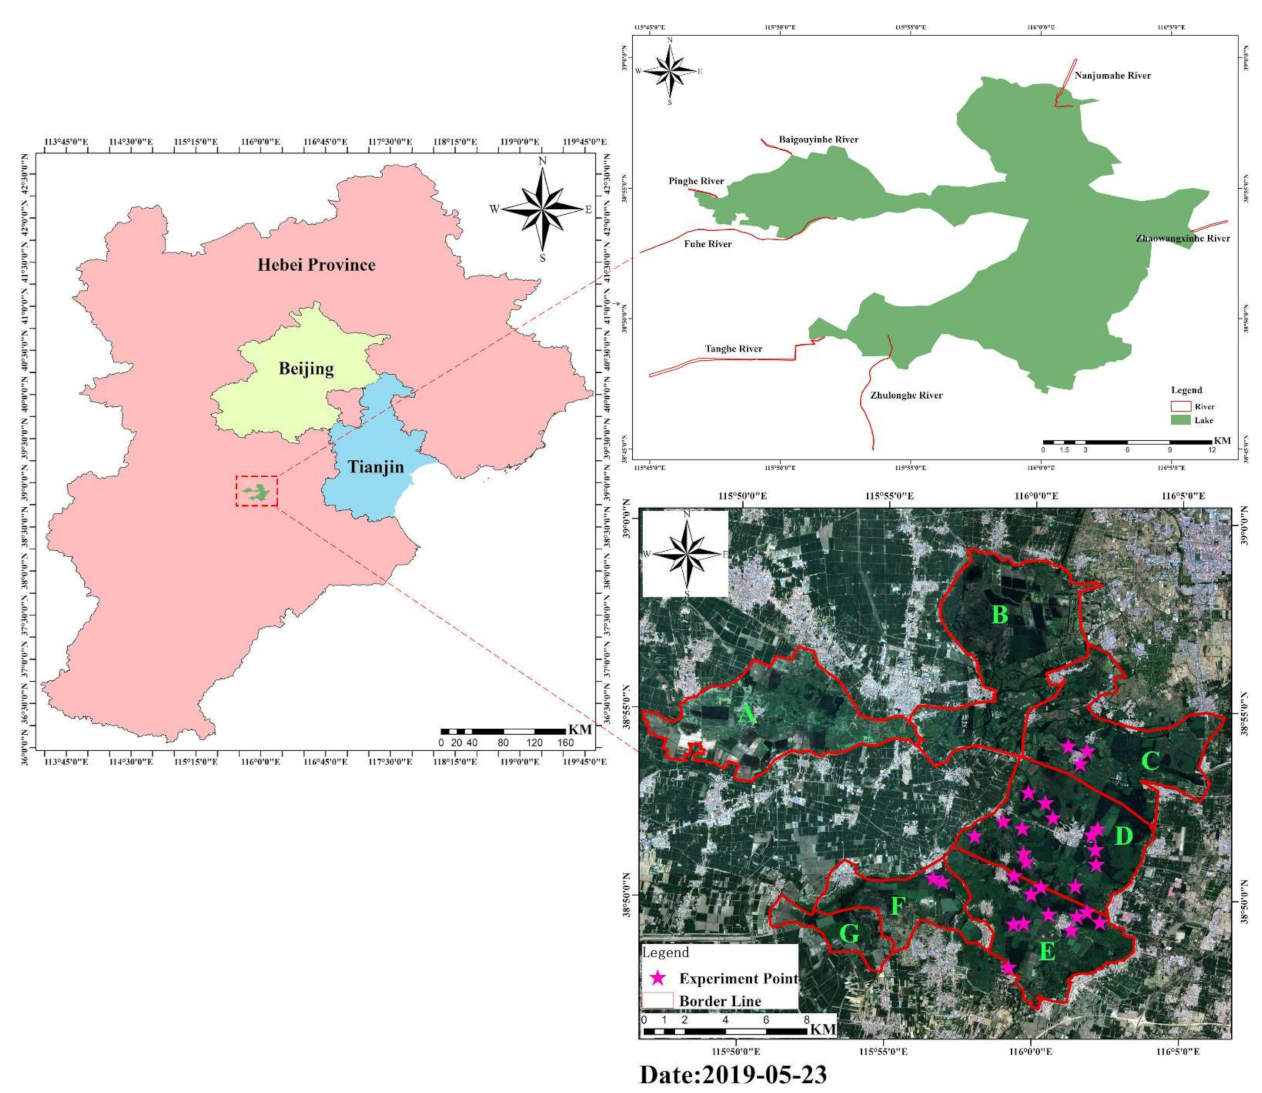
Figure 1. Study area at (a) Beijing-Tianjin-Hebei Province, (b) Baiyangdian Lake and surrounding rivers, and (c) seven sub-regions of and study sites at Baiyangdian Lake.
Remotesensing 13 01729 g001
Figure 2. (a) In situ remote-sensing reflectance Rrs(λ) on 21 and 22 May 2019 and (b) the equivalent spectral reflectance of Sentinel-2 on 23 May 2019.
Remotesensing 13 01729 g002
Figure 3. Water extraction results: (a) Sentinel-2 RGB image; (b) MBWI grey image; (c) the water extraction; (d) Sentinel-2 RGB image; (e) MBWI grey image; and, (f) the result of water extraction.
Remotesensing 13 01729 g003
Figure 4. Flow chart of Forel-Ule Index [Adapted with permission from ref. [33]. Copyright 2020 Shenglei Wang 33].
Remotesensing 13 01729 g004
Figure 5. Scatterplots showing the derivation accuracies of FUI from the remote-sensing reflectance of the Sentinel-2 image compared with the in situ remote-sensing reflectance; the number represents the number of points.
Remotesensing 13 01729 g005
Figure 6. Spatial distribution of FUI in 2016–2020.
Remotesensing 13 01729 g006
Figure 7. Mean monthly FUI value derived from Sentinel-2 data for the Baiyangdian Lake and its seven sub-regions.
Remotesensing 13 01729 g007
Figure 8. Mean annual FUI values of Baiyangdian Lake and its seven sub-regions in 2016–2020.
Remotesensing 13 01729 g008
Table 1. Image-selection schedule.
20162017201820192020
April649514
May6109912
June86756
July-9245
August682115
September69399
October3881012
November-1512919
Total3569526282
Table 2. The statistical results of mean annual FUI values of the Baiyangdian Lake and seven sub-regions.
BaiyangdianABCDEFG
201611.148.81010.511.83121212.83
201711.3610.3310.1710.8311.6711.331213.17
201811.6310.4310.861111.4311.4312.7113.57
201910.5910.58.759.3710.1310.1311.7513.5
202010.610.579.7110.2910.8611.291110.5
Publisher’s Note: MDPI stays neutral with regard to jurisdictional claims in published maps and institutional affiliations.