Article

Assessment of Normalized Water-Leaving Radiance Derived from GOCI Using AERONET-OC Data

1
Ocean College, Zhejiang University, Zhoushan 316021, China
2
State Key Laboratory of Satellite Ocean Environment Dynamics, Second Institute of Oceanography, Ministry of Natural Resources, Hangzhou 310012, China
3
Hainan Institute of Zhejiang University, Sanya 572025, China
4
Division of Marine Science, School of Ocean Science and Engineering, The University of Southern Mississippi, Stennis Space Center, MS 39529, USA
5
Observation and Research Station of Yangtze River Delta Marine Ecosystems, Ministry of Natural Resources, Zhoushan 316022, China
*
Author to whom correspondence should be addressed.
Remote Sens. 2021, 13(9), 1640; https://doi.org/10.3390/rs13091640
Submission received: 2 April 2021 / Revised: 18 April 2021 / Accepted: 19 April 2021 / Published: 22 April 2021
(This article belongs to the Special Issue Remote Sensing Applications in Ocean Observation)

Abstract

:
The geostationary ocean color imager (GOCI), as the world’s first operational geostationary ocean color sensor, is aiming at monitoring short-term and small-scale changes of waters over the northwestern Pacific Ocean. Before assessing its capability of detecting subdiurnal changes of seawater properties, a fundamental understanding of the uncertainties of normalized water-leaving radiance (nLw) products introduced by atmospheric correction algorithms is necessarily required. This paper presents the uncertainties by accessing GOCI-derived nLw products generated by two commonly used operational atmospheric algorithms, the Korea Ocean Satellite Center (KOSC) standard atmospheric algorithm adopted in GOCI Data Processing System (GDPS) and the NASA standard atmospheric algorithm implemented in Sea-Viewing Wide Field-of-View Sensor Data Analysis System (SeaDAS/l2gen package), with Aerosol Robotic Network Ocean Color (AERONET-OC) provided nLw data. The nLw data acquired from the GOCI sensor based on two algorithms and four AERONET-OC sites of Ariake, Ieodo, Socheongcho, and Gageocho from October 2011 to March 2019 were obtained, matched, and analyzed. The GDPS-generated nLw data are slightly better than that with SeaDAS at visible bands; however, the mean percentage relative errors for both algorithms at blue bands are over 30%. The nLw data derived by GDPS is of better quality both in clear and turbid water, although underestimation is observed at near-infrared (NIR) band (865 nm) in turbid water. The nLw data derived by SeaDAS are underestimated in both clear and turbid water, and the underestimation worsens toward short visible bands. Moreover, both algorithms perform better at noon (02 and 03 Universal Time Coordinated (UTC)), and worse in the early morning and late afternoon. It is speculated that the uncertainties in nLw measurements arose from aerosol models, NIR water-leaving radiance correction method, and bidirectional reflectance distribution function (BRDF) correction method in corresponding atmospheric correction procedure.

Graphical Abstract

1. Introduction

Remote sensing of ocean color has proven to be an efficient and irreplaceable technique in monitoring the ocean environment in the last two decades, contributing to biogeochemistry, physical oceanography, ocean-system modeling, fisheries, and coastal management [1]. Although polar-orbiting ocean color sensors (e.g., MODIS, SeaWiFS, MERIS) are well suited for observing seasonal or annual variations of ocean phenomena on a global scale, their once-per-day-time coverage cannot resolve diel variability. With greater temporal resolution than traditional polar-orbiting ocean color sensors, geostationary ocean color sensors may provide an alternative when observing the ocean environments that vary on short temporal scales [2,3,4]. Geostationary ocean color imager (GOCI), the first geostationary ocean color mission, was designed to focus on an area of 2500 × 2500 km2 centered around the Korean Peninsula. It acquires multispectral images with a 500 m ground resolution eight times per day [4,5,6]. The GOCI data have been successfully used in monitoring and characterizing short-term and small-scale ocean phenomena, such as red tides, green algae, particulate organic carbon flux (POC), total suspended matter (TSM), diurnal variation of water turbidity or aerosol optical depth and PM2.5, surface circulation, surface tidal currents and plume [7,8,9,10,11,12,13,14,15]. As with any ocean color sensors, the successful application of GOCI data depends on the quality of its data products, especially the normalized water-leaving radiance (nLw) or the remote sensing reflectance (Rrs) [16], which is mainly up to atmospheric correction.
Atmospheric correction is a fundamental step to remove the atmospheric influence and extract the water information. The atmospheric correction for GOCI data has been mainly performed using two operational algorithms: the Korea Ocean Satellite Center standard atmospheric correction algorithm, which can be achieved in the GOCI Data Processing System (GDPS) (hereafter, GDPS algorithm) [6], and the NASA standard atmospheric correction algorithm, which can be realized in Sea-Viewing Wide Field-of-View Sensor Data Analysis System (SeaDAS/l2gen package) (hereafter, SeaDAS algorithm) [17]. Huang et al. [18] found that the GDPS algorithm shows better performance in retrieving Rrs and aerosol optical information over the Yellow Sea region than the SeaDAS algorithm, although low accuracies were discovered at blue and near-infrared (NIR) bands, which is consistent with the research results of Concha et al. [19,20]. Kim et al. [19,21] evaluated the chlorophyll concentration derived from GOCI radiometric data acquired from the GDPS algorithm using 130 matchups between GOCI data and field data and concluded that the surface radiometric outcome needs to be improved primarily for clear waters and for the blue bands (412, 443, and 490 nm). Lamquin et al. [22] proved relative agreement between GOCI-derived seawater reflectance products based on GDPS algorithm and medium resolution imaging spectrometer (MERIS) and moderate-resolution imaging spectrometer (MODIS) results. Li et al. [23] also demonstrated that remote sensing reflectance, the concentration of standard chlorophyll-a, and suspended particulate matter products produced by the GDPS algorithm have the best agreement with in situ data in Liaodong Bay. Qi et al. [24] determined typical types of diurnal changing patterns in cyanobacteria blooms of Taihu Lake using SeaDAS algorithm-based GOCI products. However, Wu et al. [25] declared that either the GDPS algorithm or SeaDAS algorithm-based Rrs could not be retrieved successfully in the highly turbid coastal waters. Moreover, many studies have used the GDPS algorithm or SeaDAS algorithm, as well as improved algorithms, to retrieve other products, such as colored dissolved organic matter (CDOM) absorption coefficient, the diffuse attenuation coefficient, and chlorophyll-a concentration [6,16,21,22,26,27].
At present, most studies validated the feasibility and applicability of atmospheric correction algorithms on account of limited in situ data or time-limited ship-measured data. In this study, we will assess the uncertainties of GOCI nLw(λ) produced by GDPS algorithm and SeaDAS algorithm through comparing with field measurements from four AERONET-OC sites, namely, ARIAKE_TOWER, Ieodo_Station, Socheongcho, and Gageocho_Station, located within the GOCI observation range ranging in a rather long observation period covering both clear and turbid water (Figure 1; more details about these four sites are presented in Section 2.2), and aim to give data users an impression of how much uncertainties could exist in the surface radiometric data derived from these two operational atmospheric correction algorithms in different waters, and at different observation time (GOCI can provide eight every-hour observations daily). The paper is constituted as follows: Section 1 introduces the background of GOCI data processing; the data resources and methods used in the research are described in Section 2; in Section 3, the comparison results between GOCI-derived nLw(λ) based on different algorithms and nLw(λ) at four AERONET-OC sites are presented with corresponding figures and tables; Section 4 and Section 5 discuss the performance of the two algorithms and propose viewpoints and suggestions.

2. Materials and Methods

2.1. GOCI Data

The GOCI, launched on 26 June 2010 by the Republic of Korea, is the first geostationary spaceborne ocean color sensor. It provides images with 500 m ground resolution at hourly intervals up to eight times per day (from 00:16 UTC to 07:16 UTC) at eight spectral bands (six visible bands: 412, 443, 490, 555, 660, 680 nm, and two near-infrared bands: 745, 865 nm) around the Korean Peninsula [13,16,21,26]. The GOCI Level 1B (L1B) data are available for downloading from the KOSC website (http://kosc.kiost.ac.kr/). Data from 17 October 2011 to 5 March 2019 are collected in this study.

2.2. AERONET-OC Data

The AERONET is an assembly of ground-based remote sensing aerosol networks, which also supports marine applications through a new component called AERONET-OC through providing nLw data measured by the SeaPRISM autonomous radiometer systems deployed on offshore platforms. The SeaPRISM system acquires the radiance from the sea and the sky at viewing zenith angles of 40º and 140º with a relative azimuth angle of 90º, and then the nLw can be further calculated [28]. As shown in Figure 1, there are four AERONET-OC sites located within the GOCI’s footprint: ARIAKE_TOWER (Ariake, 33.104° N, 130.272° E, PIs: Joji Ishizaka and Kohei Arai, time span: 19 April 2018–5 March 2019, number of data: 503), Ieodo_Station (Ieodo, 32.123° N, 125.182° E, PIs: Young-Je Park and Hak-Yeol You, time span: 1 December 2013–27 March 2018, number of data: 42), Socheongcho (37.423° N, 124.738° E, PI: Young-Je Park, time span: 13 October 2015–30 November 2018, number of data: 165) and Gageocho_Station (Gageocho, 33.942° N, 124.593° E, PIs: Jae-Seol Shim and Joo-Hyung Ryu, time span: 17 October 2011–16 May 2012, number of data: 31). The Level 2.0 nLw data (obtained based on the f/Q correction [29]), which is cloud screened and quality assured, at the above four sites were downloaded from the AERONET-OC website (https://aeronet.gsfc.nasa.gov/, accessed on 21 December 2020). Note that the mean nLw (660) values with standard deviations at Ariake, Ieodo, Socheongcho, and Gageocho sites are 7.7876 ± 3.8878, 4.8363 ± 3.2161, 1.1993 ± 1.2842, and 1.0931 ± 0.6589 W/m2 · sr · μm, respectively, which implies the descending water turbidity. In addition, with the purpose to reveal the turbidity of four sites synoptically, annual average chlorophyll-a concentration based on MODIS-Aqua data were obtained from Ocean Color Website (https://oceancolor.gsfc.nasa.gov/, accessed on 21 December 2020) and visualized after logarithmic calculation in Figure 1. Both statistical calculation results of nLw at 660 nm wavelength and chlorophyll-a concentration distribution shown in Figure 1 illustrate that seawater at Ariake is most turbid, and become increasingly clear from Ieodo, to Socheongcho, to Gageocho sites.
Although the spectral band of AERONET-OC and GOCI data are not exactly the same (Table 1), comparable wavelengths of 412, 443, 490, 660, and 865 nm for both data were selected for comparison purpose in this study. The main difference is at 667 nm for AERONET-OC and 660 nm for GOCI. However, no spectral interpolation was performed here since we believe that the spectral difference is acceptable considering that the GOCI bandwidth is 20 nm. Hereafter, we use the wavelengths of GOCI in the following text for the sake of simplicity.

2.3. Methods

The GOCI L1B products (top-of-atmosphere radiance) were first processed into L2 products (surface water radiometric data, nLw(λ)) by both GDPS and SeaDAS/l2gen, and then we matched and assessed these two kinds of GOCI nLw(λ) data (nLw_xxx) with AERONET-OC nLw(λ) data (nLw_AERONET-OC).

2.3.1. Conversion to L2 Products

GOCI L1B data were processed both with the GDPS (Version 1.4.1, South Korea) and the SeaDAS/l2gen package (Version 7.5.3, United States). GDPS is a software for GOCI data processing dedicated to GOCI distributed by KOSC (http://kosc.kiost.ac.kr/eng/p30/kosc_p31.html, accessed on 1 October 2020) through which L2 data, including nLw, colored dissolved organic matter (CDOM), the diffused attenuation coefficient of down-welling irradiance (Kd), as well as ancillary information such as solar and sensor zenith angles and azimuth angles, can be obtained from L1B data [6]. The GDPS employed KOSC standard atmospheric algorithm to achieve data conversion. It is theoretically based on the SeaWiFS (NASA) standard atmospheric correction method developed by Gordon and Wang in 1994 (hereafter GW94) [30], with partial modification in aerosol models and additionally uses an iterative process to correct NIR reflectance alternatively in the case of case-2 waters [31]. As for aerosol models in GDPS, the GDPS algorithm adopts only 3 from 12 aerosol models used in GW94, namely, M99, M50, and C50, to reduce the processing time and avoid the image discontinuity problem. For the NIR correction model in turbid case-2 waters, it adapts an empirical relationship between normalized water-leaving reflectance (ρw) at 660 nm, 745 nm, and 865 nm [32].
SeaDAS distributed by NASA is a comprehensive software package for the processing, display, analysis, and quality control of ocean color data (https://seadas.gsfc.nasa.gov/). It can apply the standard NASA atmospheric correction algorithm [33] to the GOCI data through its multisensor L1 to L2 generator (l2gen). SeaDAS algorithm is also initially based on GW94 and has undergone a series of improvements [17,34,35]. When treating nonblack pixels, it first retrieves ρw(443) and ρw(555) based on the “black-pixel” assumption. Next, it obtains an initial estimate of the chlorophyll concentration and total absorption coefficient at 660 nm, a(660), via a bio-optical model and empirical relationship [17]. Then, particulate backscattering at 660 nm, bbp (660), can be derived from a(660) and ρw (660), which can make a further step to calculate the total backscattering of NIR bands. Finally, ρw values of at NIR bands are recalculated on the basis of the above steps, and this procedure will cycle until convergence is reached.
Both GDPS and SeaDAS output L2 processing flags reflecting warnings or errors generated concerning the data quality [20,36]; we applied these flags in the following data matchup procedure.

2.3.2. Matchup Procedure

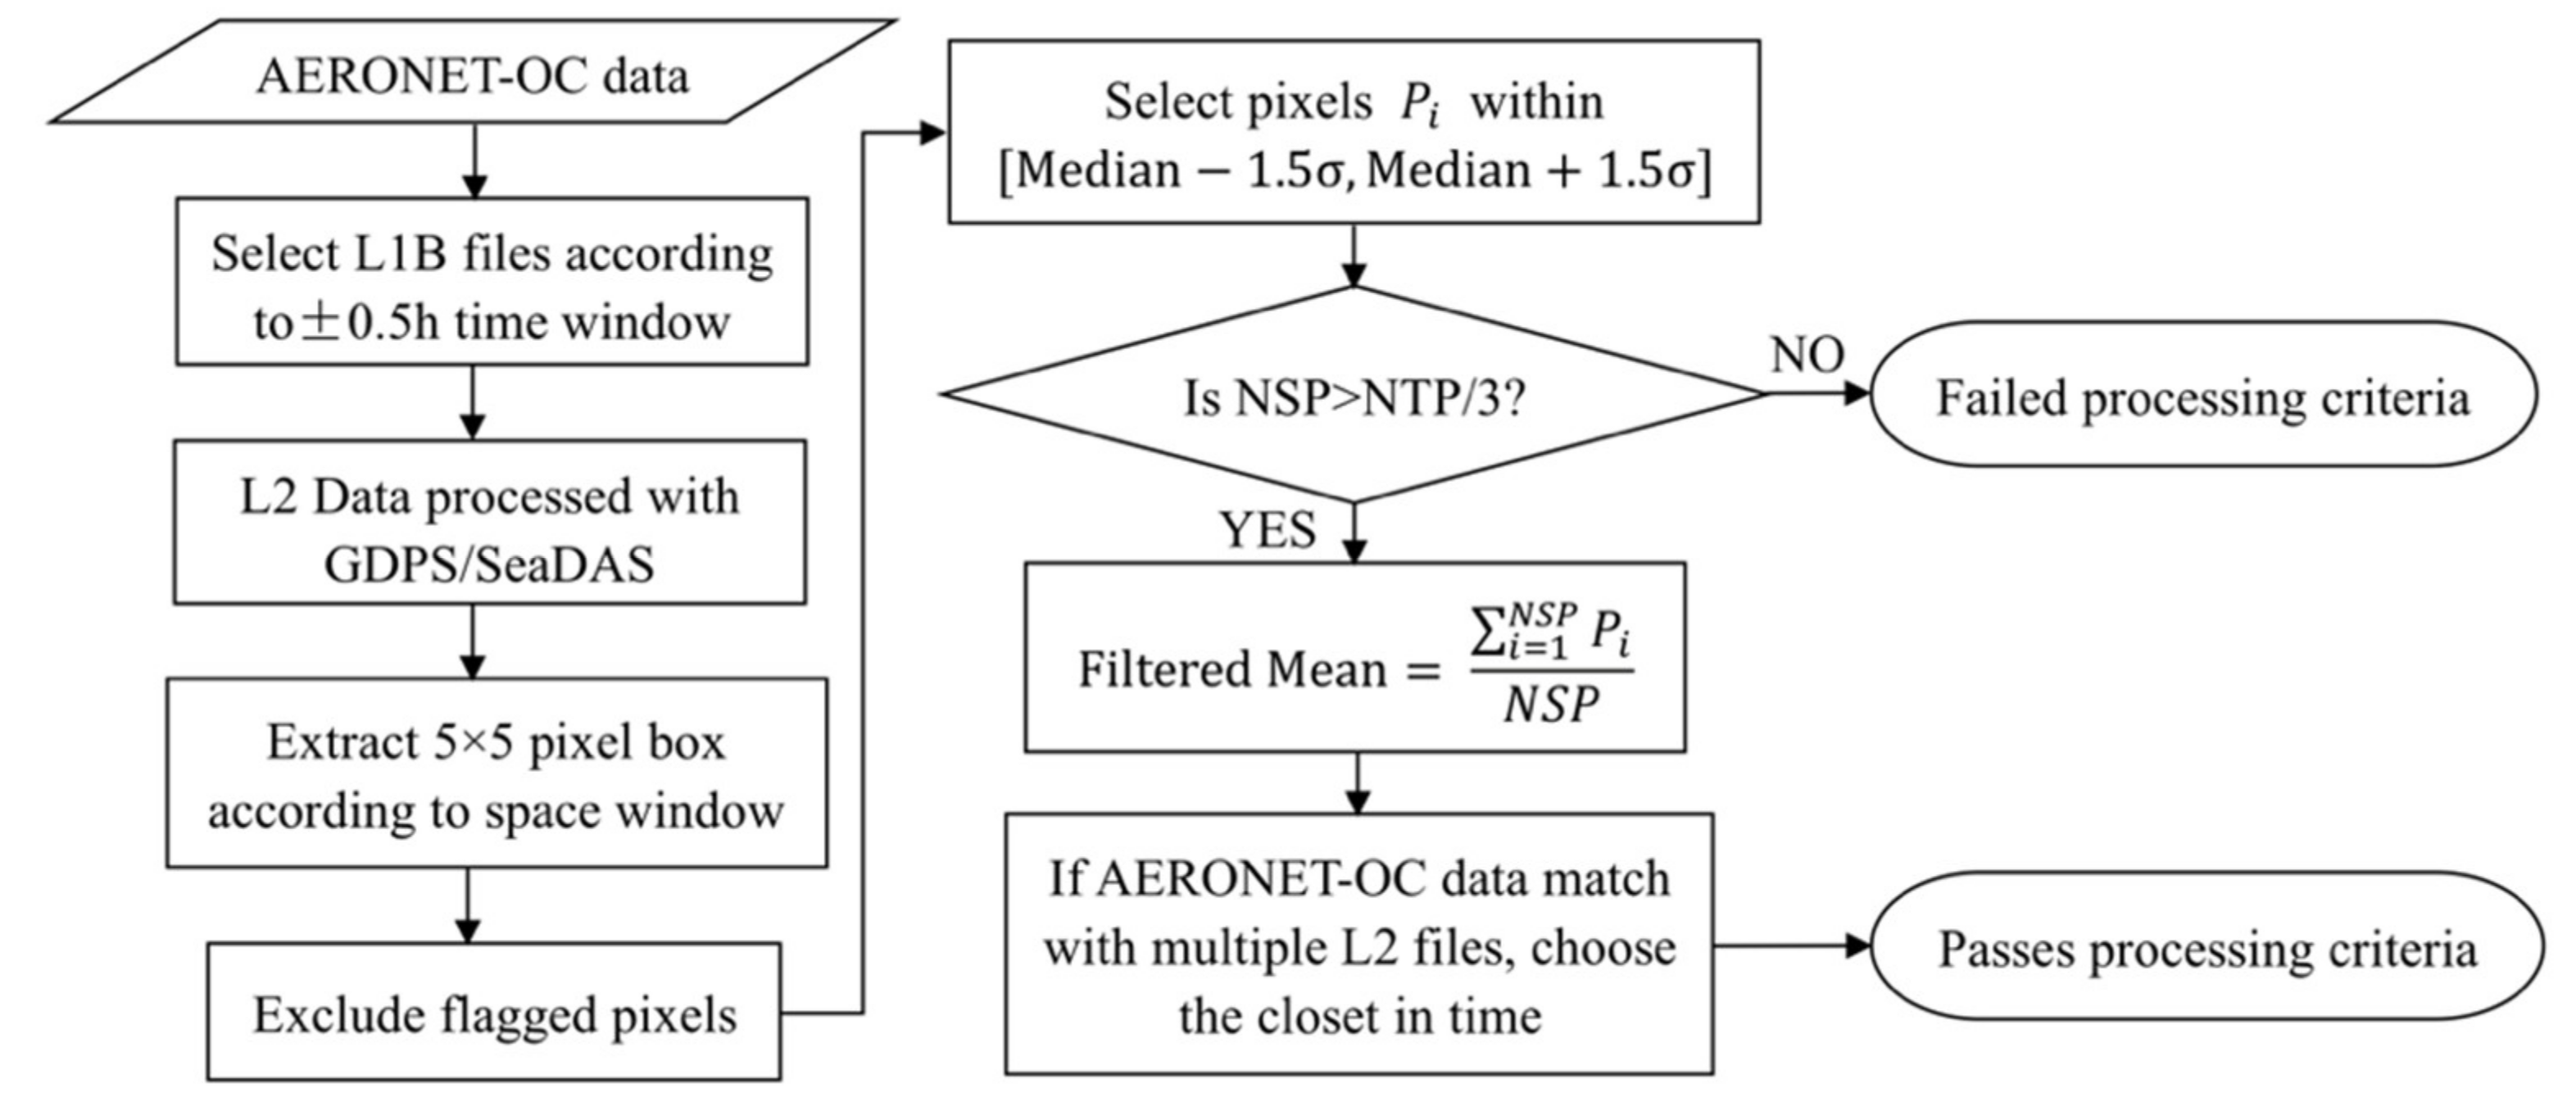
Through trial, a space–time window with 5 × 5 pixels and ±0.5 h was utilized to match GOCI data and AERONET-OC data. Specifically, the proposed space–time window is a compromise between minimizing geophysical variability and navigation error and ensuring a sufficient amount of data for statistical analysis. To process the matchup data, we followed the satellite validation protocol described in Bailey and Werdell [36] (Figure 2). We discarded GOCI pixels flagged as land, cloud edge in GDPS, and failure in products in SeaDAS. To minimize the influence of outliers, we also discarded those GOCI pixels whose values are outside ± 1.5 standard deviations of their respective median values. For the remaining data within the matchup window, we calculated arithmetic means for comparison. As GOCI observation times are every hour from 00:16 UTC to 07:16 UTC, whereas the time of AERONET-OC data is irregular; there may be a situation in which several AERONET-OC data matched simultaneously with one GOCI acquisition data. For each GOCI data, only temporally closest AERONET-OC data were first considered for availability. A total of 307 pairs of matchups were found between GDPS-derived data (nLw_GDPS, stands for the nLw results of the GDPS algorithm) and nLw_AERONET-OC, and 294 pairs between SeaDAS-derived data (nLw_SeaDAS, stands for the nLw results of SeaDAS algorithm) and nLw_AERONET-OC. For the GDPS algorithm, 221, 22, 55, and 9 matchup data were obtained at Ariake, Ieodo, Socheongcho, and Gageocho, Ieodo, respectively; for the SeaDAS algorithm, 193, 24, 68, and 9 matchup data were obtained at the four sites.

2.3.3. Accuracy Indicator

In order to quantify comparison results, we use mean absolute error (MAE) and mean percentage relative error (MPRE) to evaluate the accuracy of nLw_xxx (either nLw_GDPS or nLw_SeaDAS) in contrast to in situ observations (nLw_AERONET-OC) as follows:
M A E = i = 1 N n L w _ AERONET OC i n L w _ xxx i N
M P R E = 100 N i = 1 N n L w _ A E R O N E T O C i n L w _ xxx i n L w _ A E R O N E T O C i
where, nLw_AERONET-OC(i) and nLw_xxx(i) denote the nLw_AERONET-OC and nLw_xxx of the i-th matchup, respectively, and N denotes the total number of matchup pairs.

3. Results

3.1. Comparison between nLw_xxx and nLw_AERONET-OC

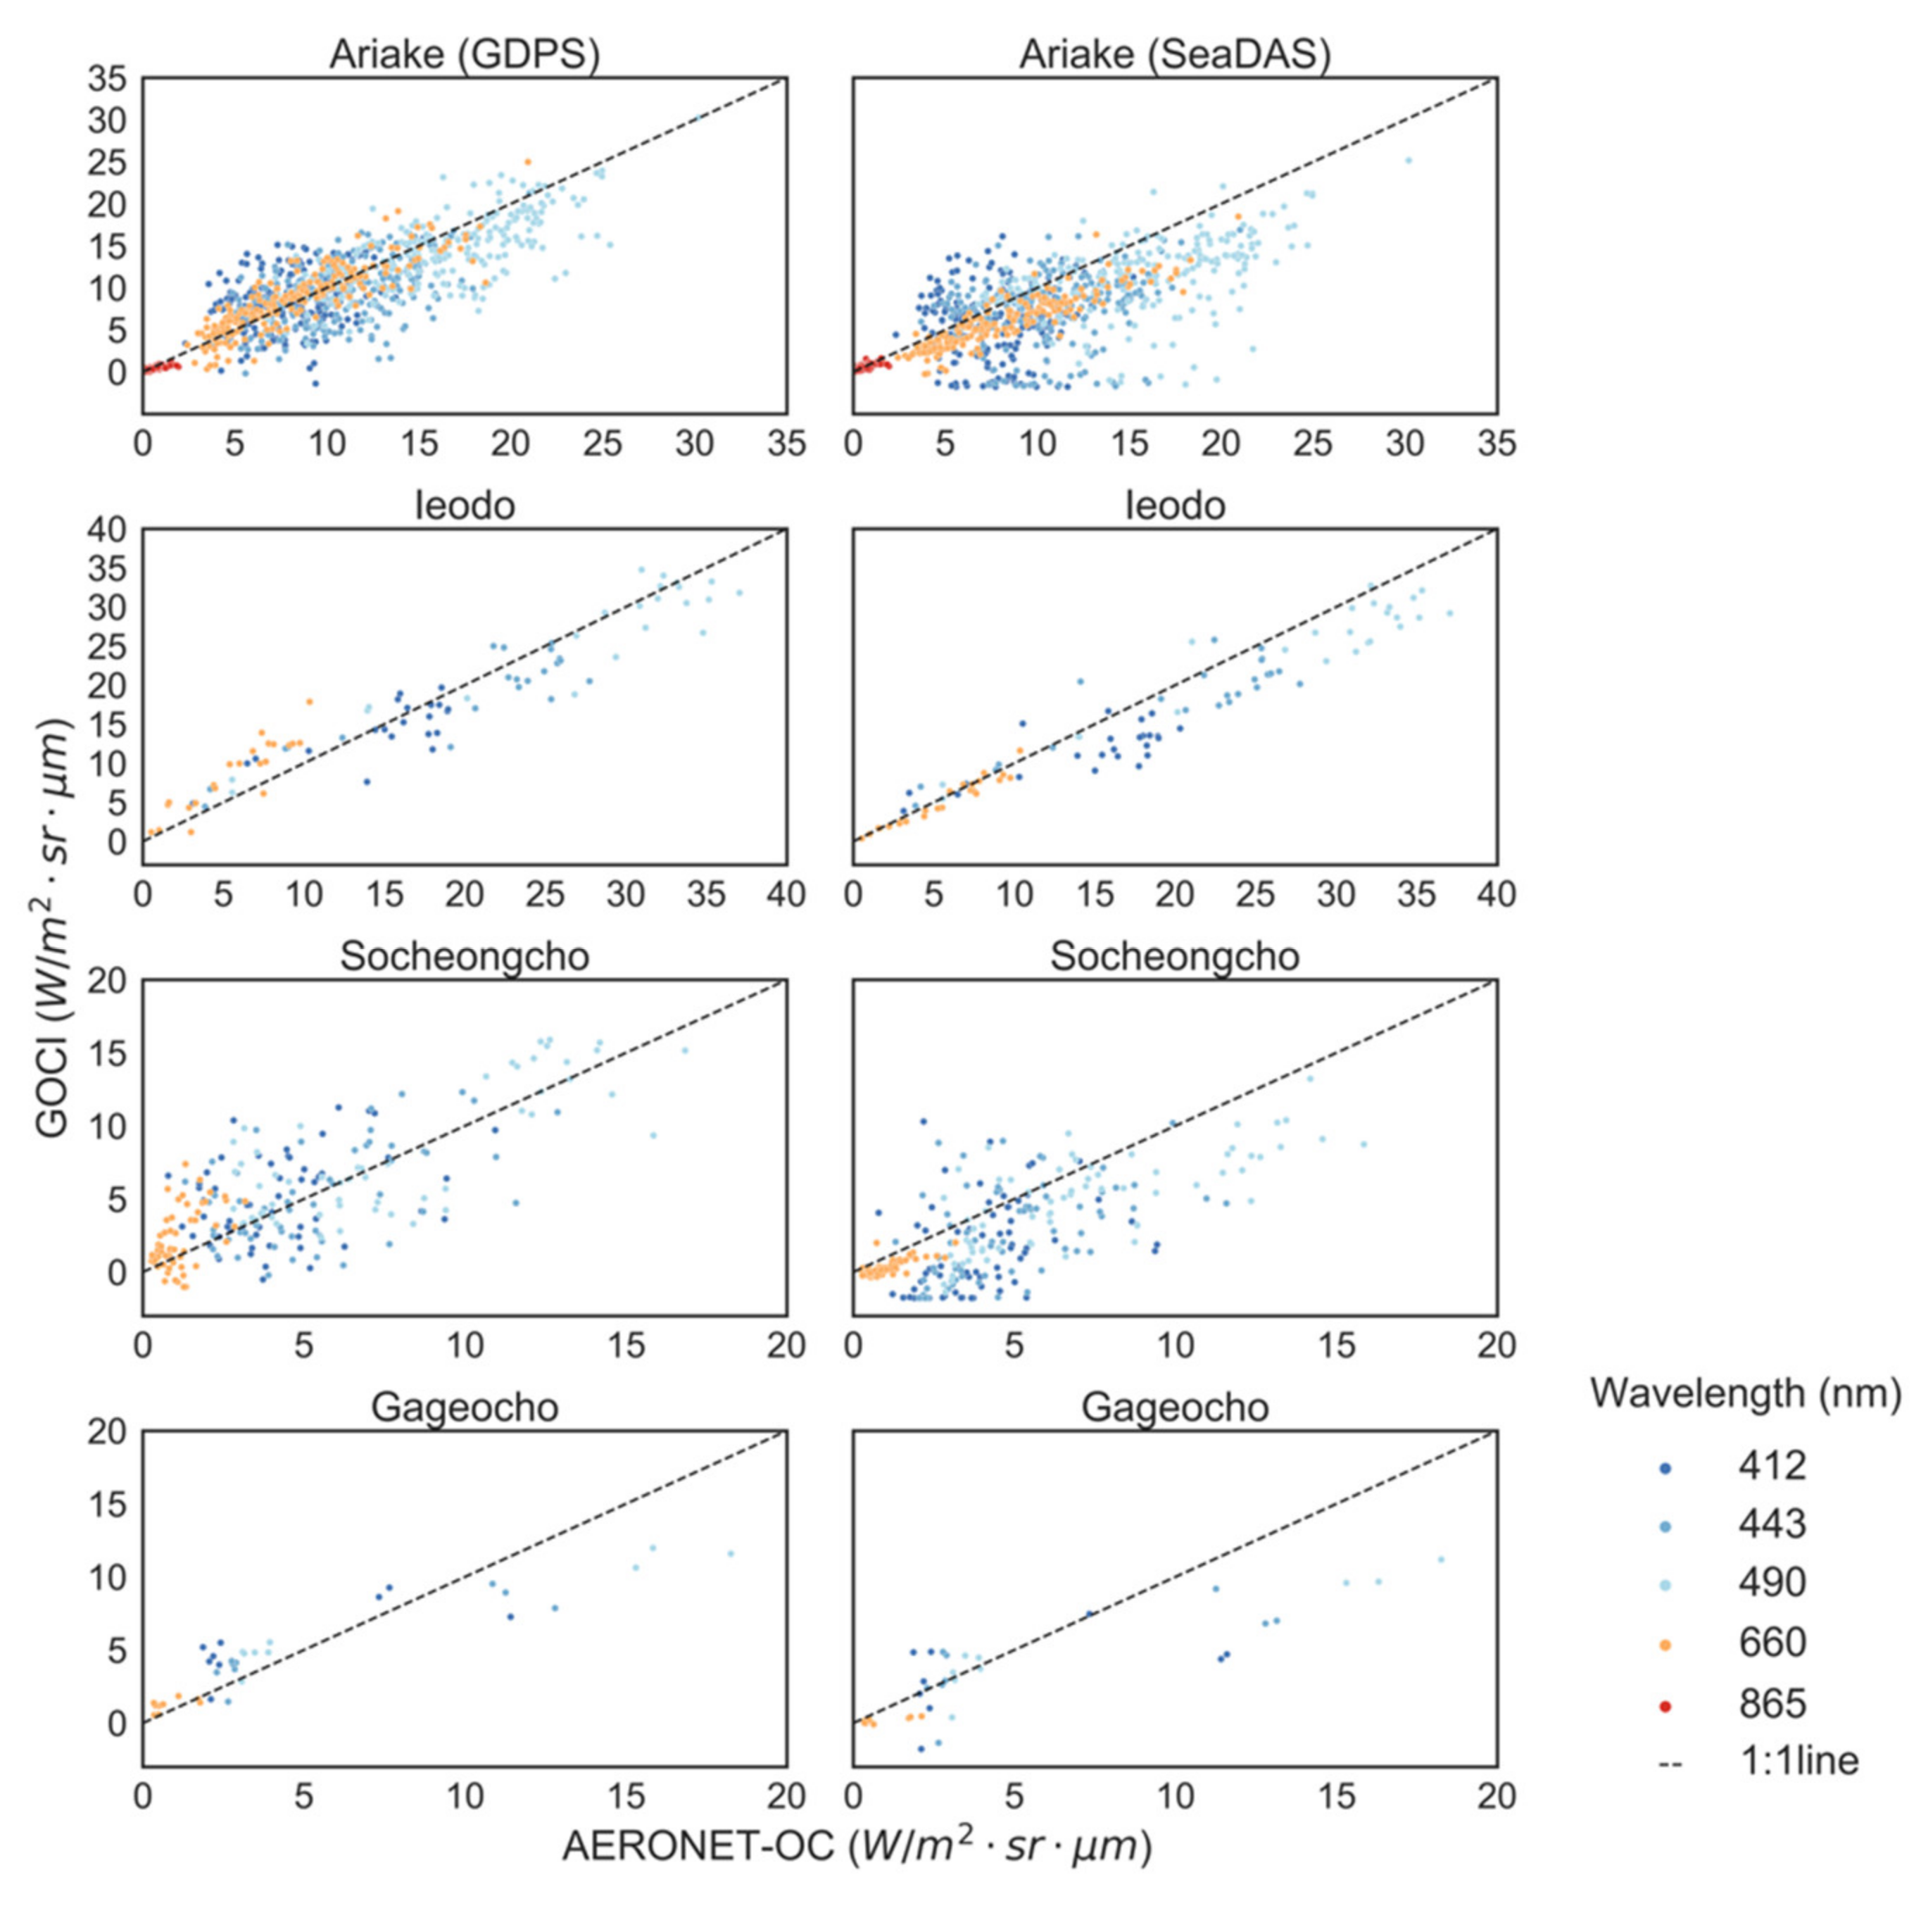
The performance of the GDPS algorithm and SeaDAS algorithm varies from site to site (Figure 3 and Figure 4). Figure 3 shows that most of the matchup points between nLw_SeaDAS and nLw_AERONET-OC are located below the 1:1 line, while the majority of the matchups between nLw_GDPS and nLw_AERONET-OC falls approximately evenly on both sides of the 1:1 line, although several matchups apparently lied below 1:1 line at Ariake site and with larger variance at Socheongcho site. Comparison results between nLw_SeaDAS and nLw_AERONET-OC indicate that relatively larger variance exists at Ariake and Gageocho sites than that between nLw_GDPS and nLw_AERONET-OC; besides, nLw_SeaDAS contains evident negative values at shorter wavelengths (e.g., 412-490 nm) at Ariake, Socheongcho, and Gageocho sites, while nLw_GDPS embodies negative values yet in less quantity at Ariake and Socheongcho sites. Therefore, to some extent, the GDPS algorithm is capable of higher stability and accuracy than the SeaDAS algorithm, particularly in turbid water (e.g., Ariake site).
Figure 4 reveals the density distribution of relative error between nLw_xxx and nLw_AERONET-OC. At each site, 75% of matching pairs between nLw_SeaDAS and nLw_AERONET-OC have relative errors less than zero, while the median values of relative error between nLw_GDPS and nLw_AERONET-OC are approximately zero at Ariake, Ieodo, and Socheongcho sites and slightly higher at Gageocho site. Both matching results exhibit long tail at Socheongcho and Gageocho sites, indicating that both algorithms entail large uncertainty in clean water. The two figures suggest that compared with the GDPS algorithm, the SeaDAS algorithm underestimates nLw, in general, especially at Ariake and Socheongcho sites. The related MAE and MPRE values of four sites between nLw_xxx and nLw_AERONET-OC summarized in Table 2 also support this result and further illustrate the degree of deviation. MAE between nLw_GDPS and nLw_AERONET-OC is smaller than MAE between nLw_SeaDAS and nLw_AERONET-OC at all four sites. Moreover, MPRE between nLw_GDPS and nLw_AERONET-OC is also less than that between nLw_GDPS and nLw_AERONET-OC at Ariake, Socheongcho, and Gageocho sites, however, conversely at Ieodo site, due to overestimated nLw_GDPS at 660 nm wavelength.
In conclusion, nLw_GDPS shows better agreement with nLw_AERONET-OC than nLw_SeaDAS. Noteworthy, two issues are discovered through the above analysis—one is that some blue band values of nLw_GDPS and nLw_SeaDAS are negative; the other is that the relative errors of nLw_GDPS and nLw_SeaDAS are even higher than 100% at Socheongcho and Gageocho sites, which are sites with clear waters. Overall, the applicability and serviceability of the GDPS algorithm are better than the SeaDAS algorithm regardless of turbidity in our research area; nevertheless, the stability of both the GDPS algorithm and SeaDAS algorithm in clean water is worthy of attention.
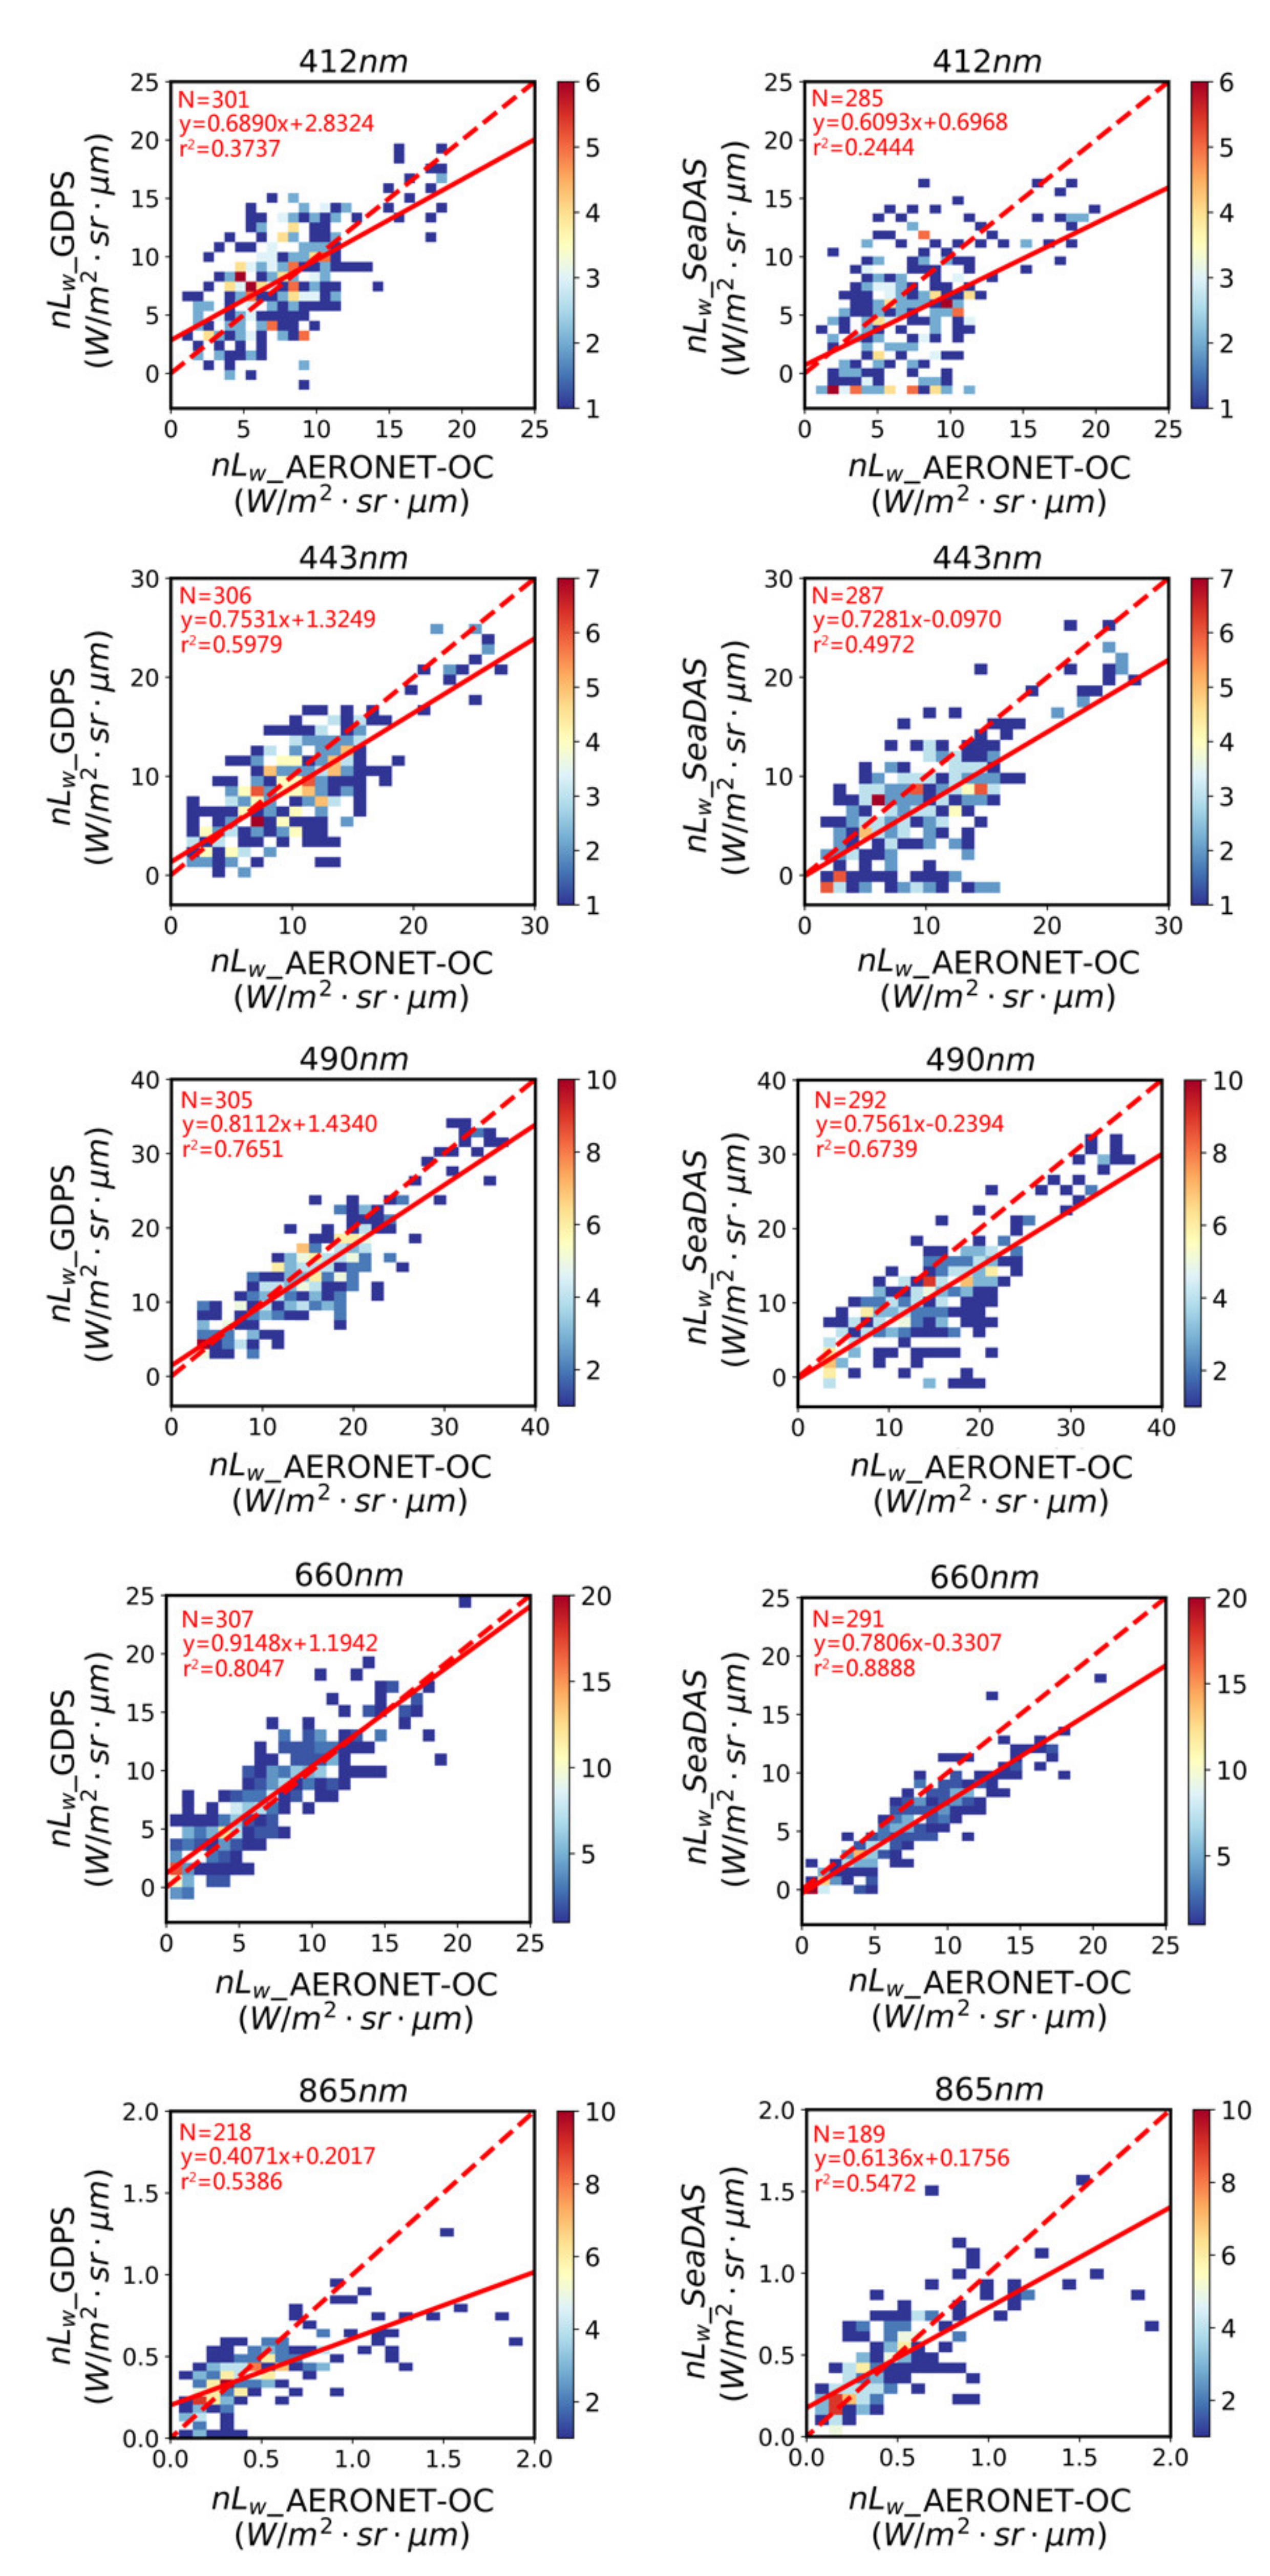
The performance of the GDPS algorithm and SeaDAS algorithm also varies with wavelengths, as shown in scatterplots of Figure 5 and violin plots of Figure 6, as well as statistical results listed in Table 3. As shown in Figure 5, for nLw_GDPS, the highest accuracy was found at 660 nm band among all bands, while at shorter wavelengths, nLw matching results are influenced by several underestimated valuations. More explicitly, when nLw_AERONET-OC is greater than 15, 20, 28 W / m 2 · sr · μ m at 412, 443, 490 nm wavelengths, respectively, nLw_GDPS is underestimated and slightly affects the overall results. Given this consideration, nLw_GDPS is well matched with nLw_AERONET-OC at all wavelengths except 865 nm. Similarly, the nLw_SeaDAS at 660 nm shows the best agreement with the nLw_AERONET-OC, although there still exists a linear underestimation trend; however, it can be observed that the underestimation issue is becoming severe with decreasing visible bands, and the performance is worse than nLw_GDPS at shorter bands. On the contrary, better performance at 865 nm was found with nLw_SeaDAS than that with nLw_GDPS.
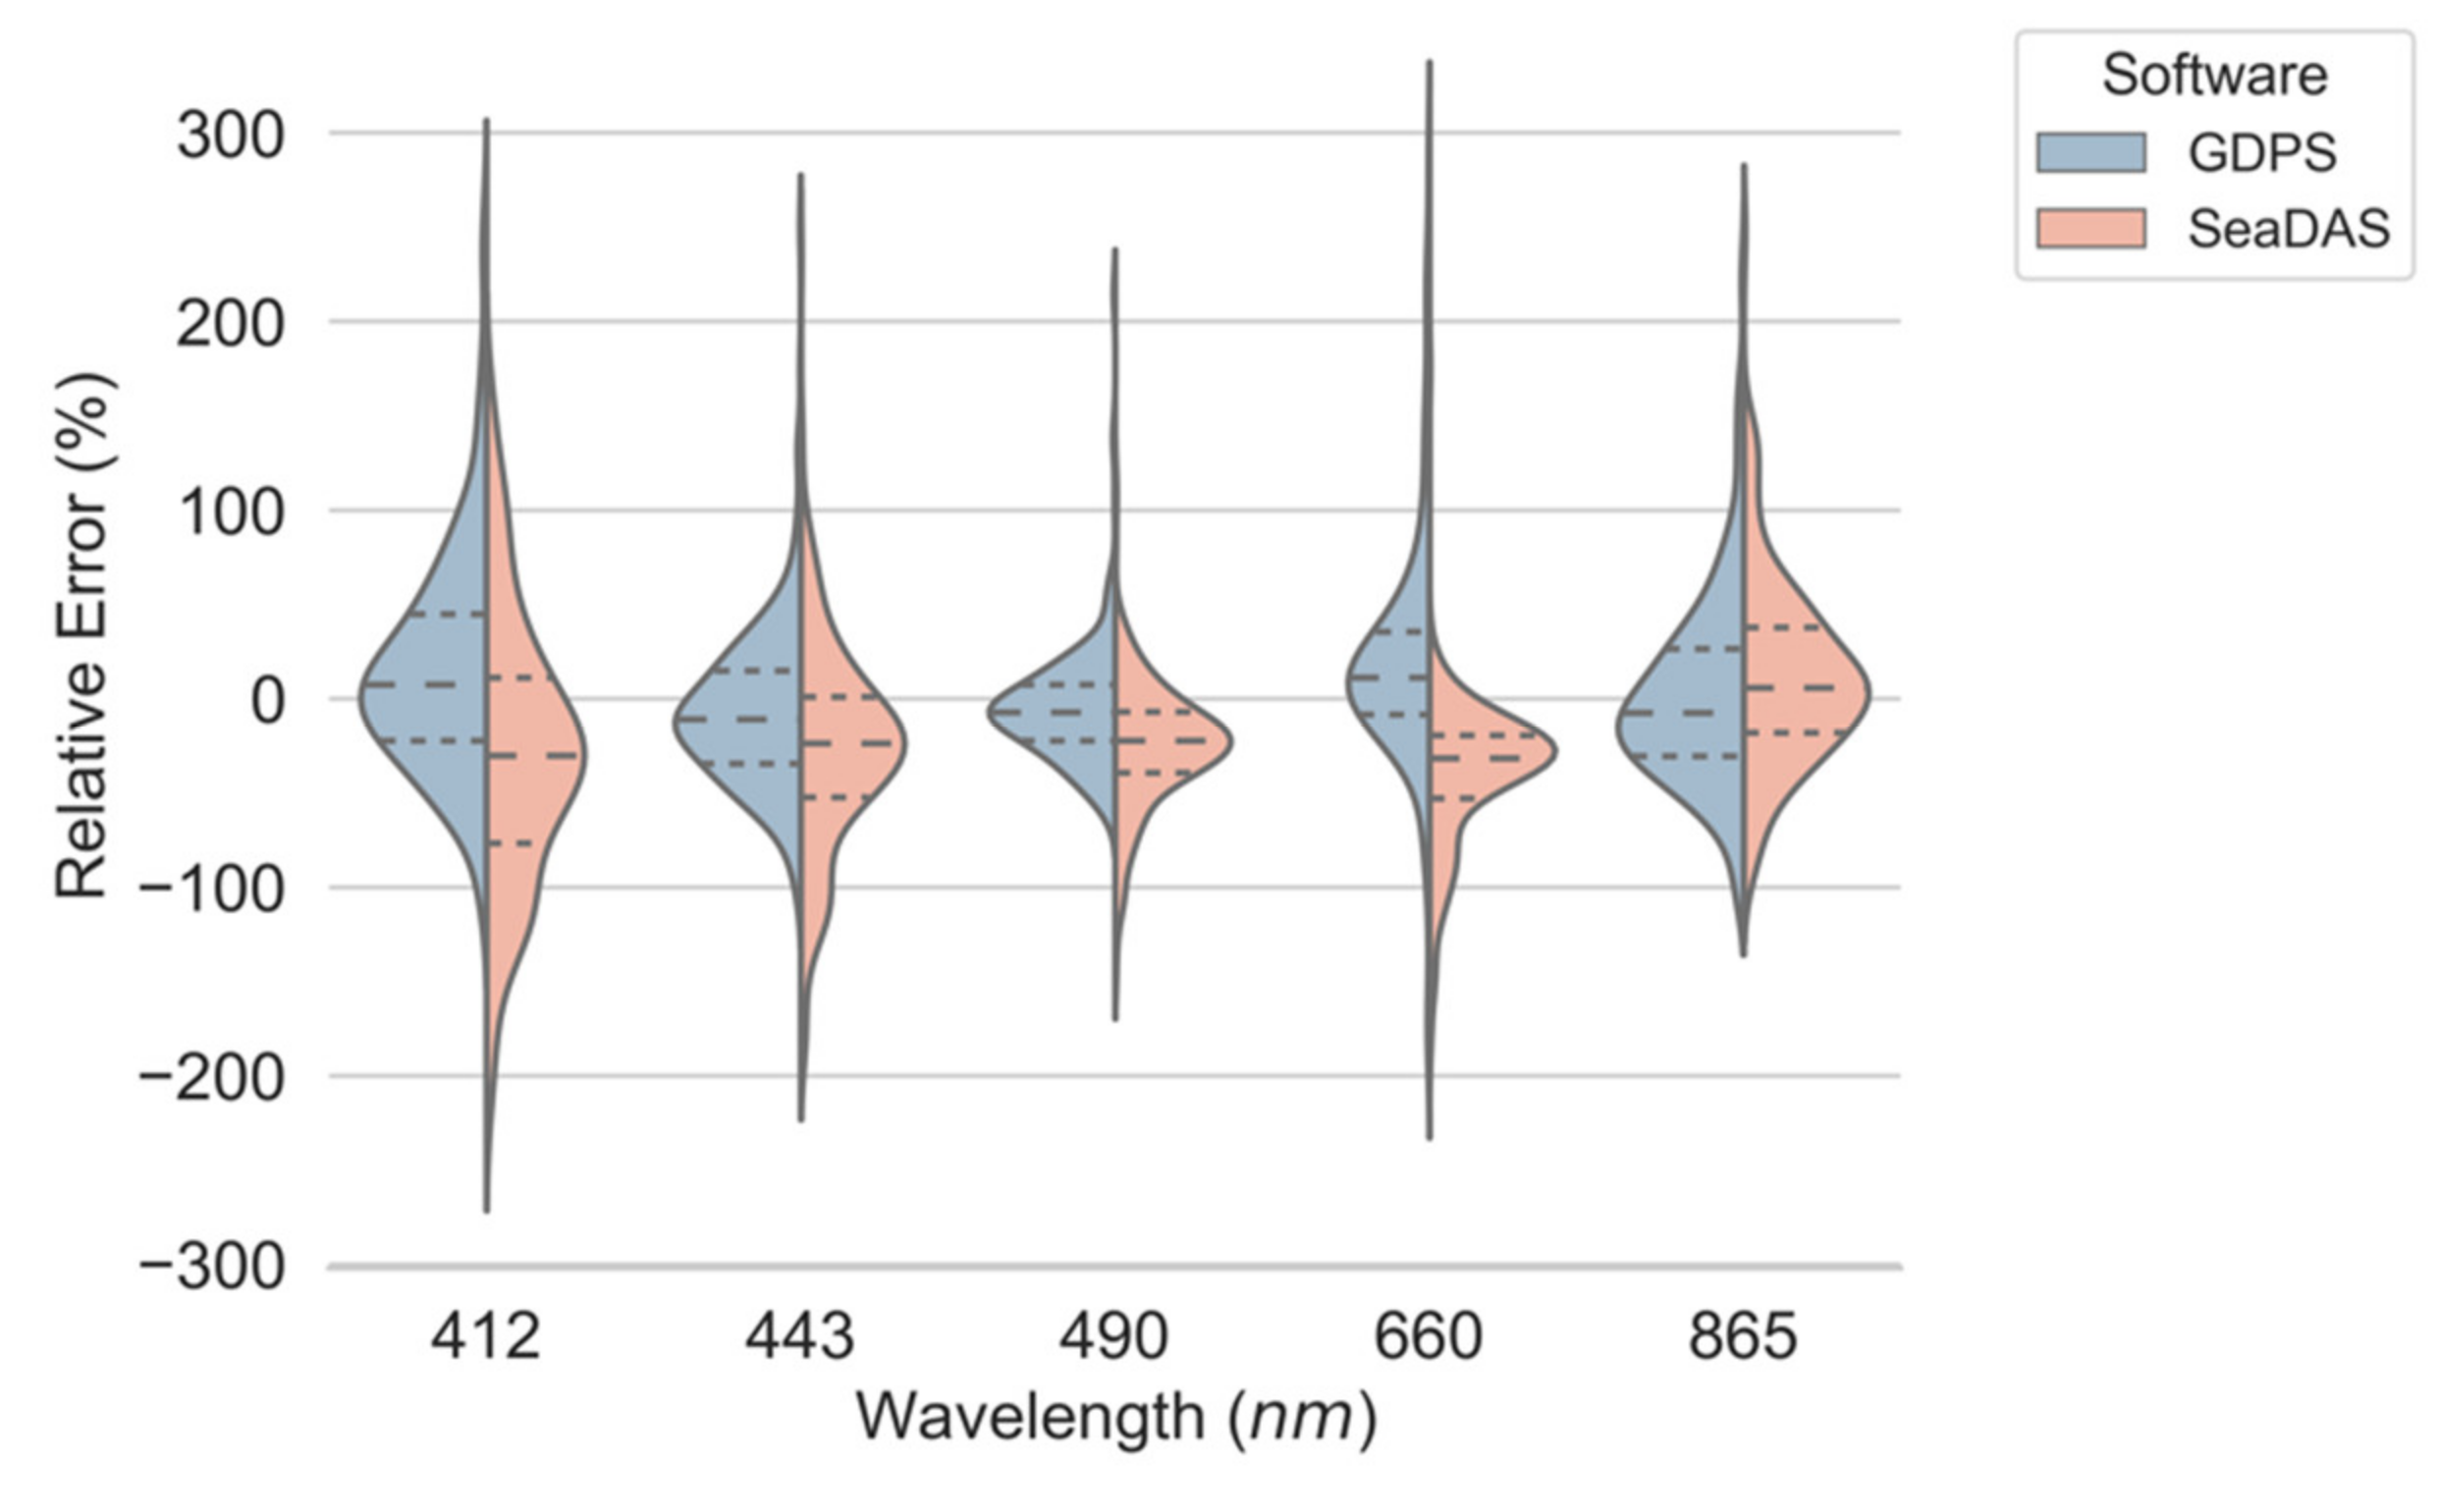
In Figure 6, the mean value of relative error distribution between nLw_GDPS and nLw_AERONET-OC is close to 0 from 412 to 660 nm and a bit lower than 0 at 865 nm, while that of nLw_SeaDAS and nLw_AERONET-OC is close to 0 only at 865 nm band and approaches −20% at visible bands. Moreover, as Table 3 shows quantitatively, for all matchup pairs, the MAE between nLw_GDPS and nLw_AERONET-OC are 2.66, 2.82, 2.80, 1.61, and 0.16 (W/m2∙sr∙μm) at 412, 443, 490, 660, and 865 nm, respectively; meanwhile, the MAE between nLw_SeaDAS and nLw_AERONET-OC are 3.93, 3.96, 4.36, 1.75, and 0.15 (W/m^2∙sr∙μm) at the corresponding wavelengths. The MPRE between nLw_GDPS and nLw_AERONET-OC are 44.19%, 31.75%, 22.15%, 41.94%, and 37.73% at 412, 443, 490, 660, and 865 nm, respectively; and the MPRE between nLw_SeaDAS and nLw_AERONET-OC are 63.33%, 47.60%, 32.68%, 42.89%, and 36.90% at the corresponding wavelengths. Clearly, MAE between nLw_xxx and nLw_AERONET-OC shows larger mean values at shorter bands, whereas MPRE shows larger mean values at both shorter and NIR bands.
Overall, both nLw_GDPS and nLw_SeaDAS show better agreement with nLw_AERONET-OC at 490 nm and 660 nm bands, followed by 865 nm and 443 nm bands, and poorest performance at 412 nm. The nLw data generated from the GDPS algorithm perform better than that from the SeaDAS algorithm at visible bands in this study area, while the SeaDAS algorithm is slightly better than the GDPS algorithm at the near-infrared band of 865 nm.
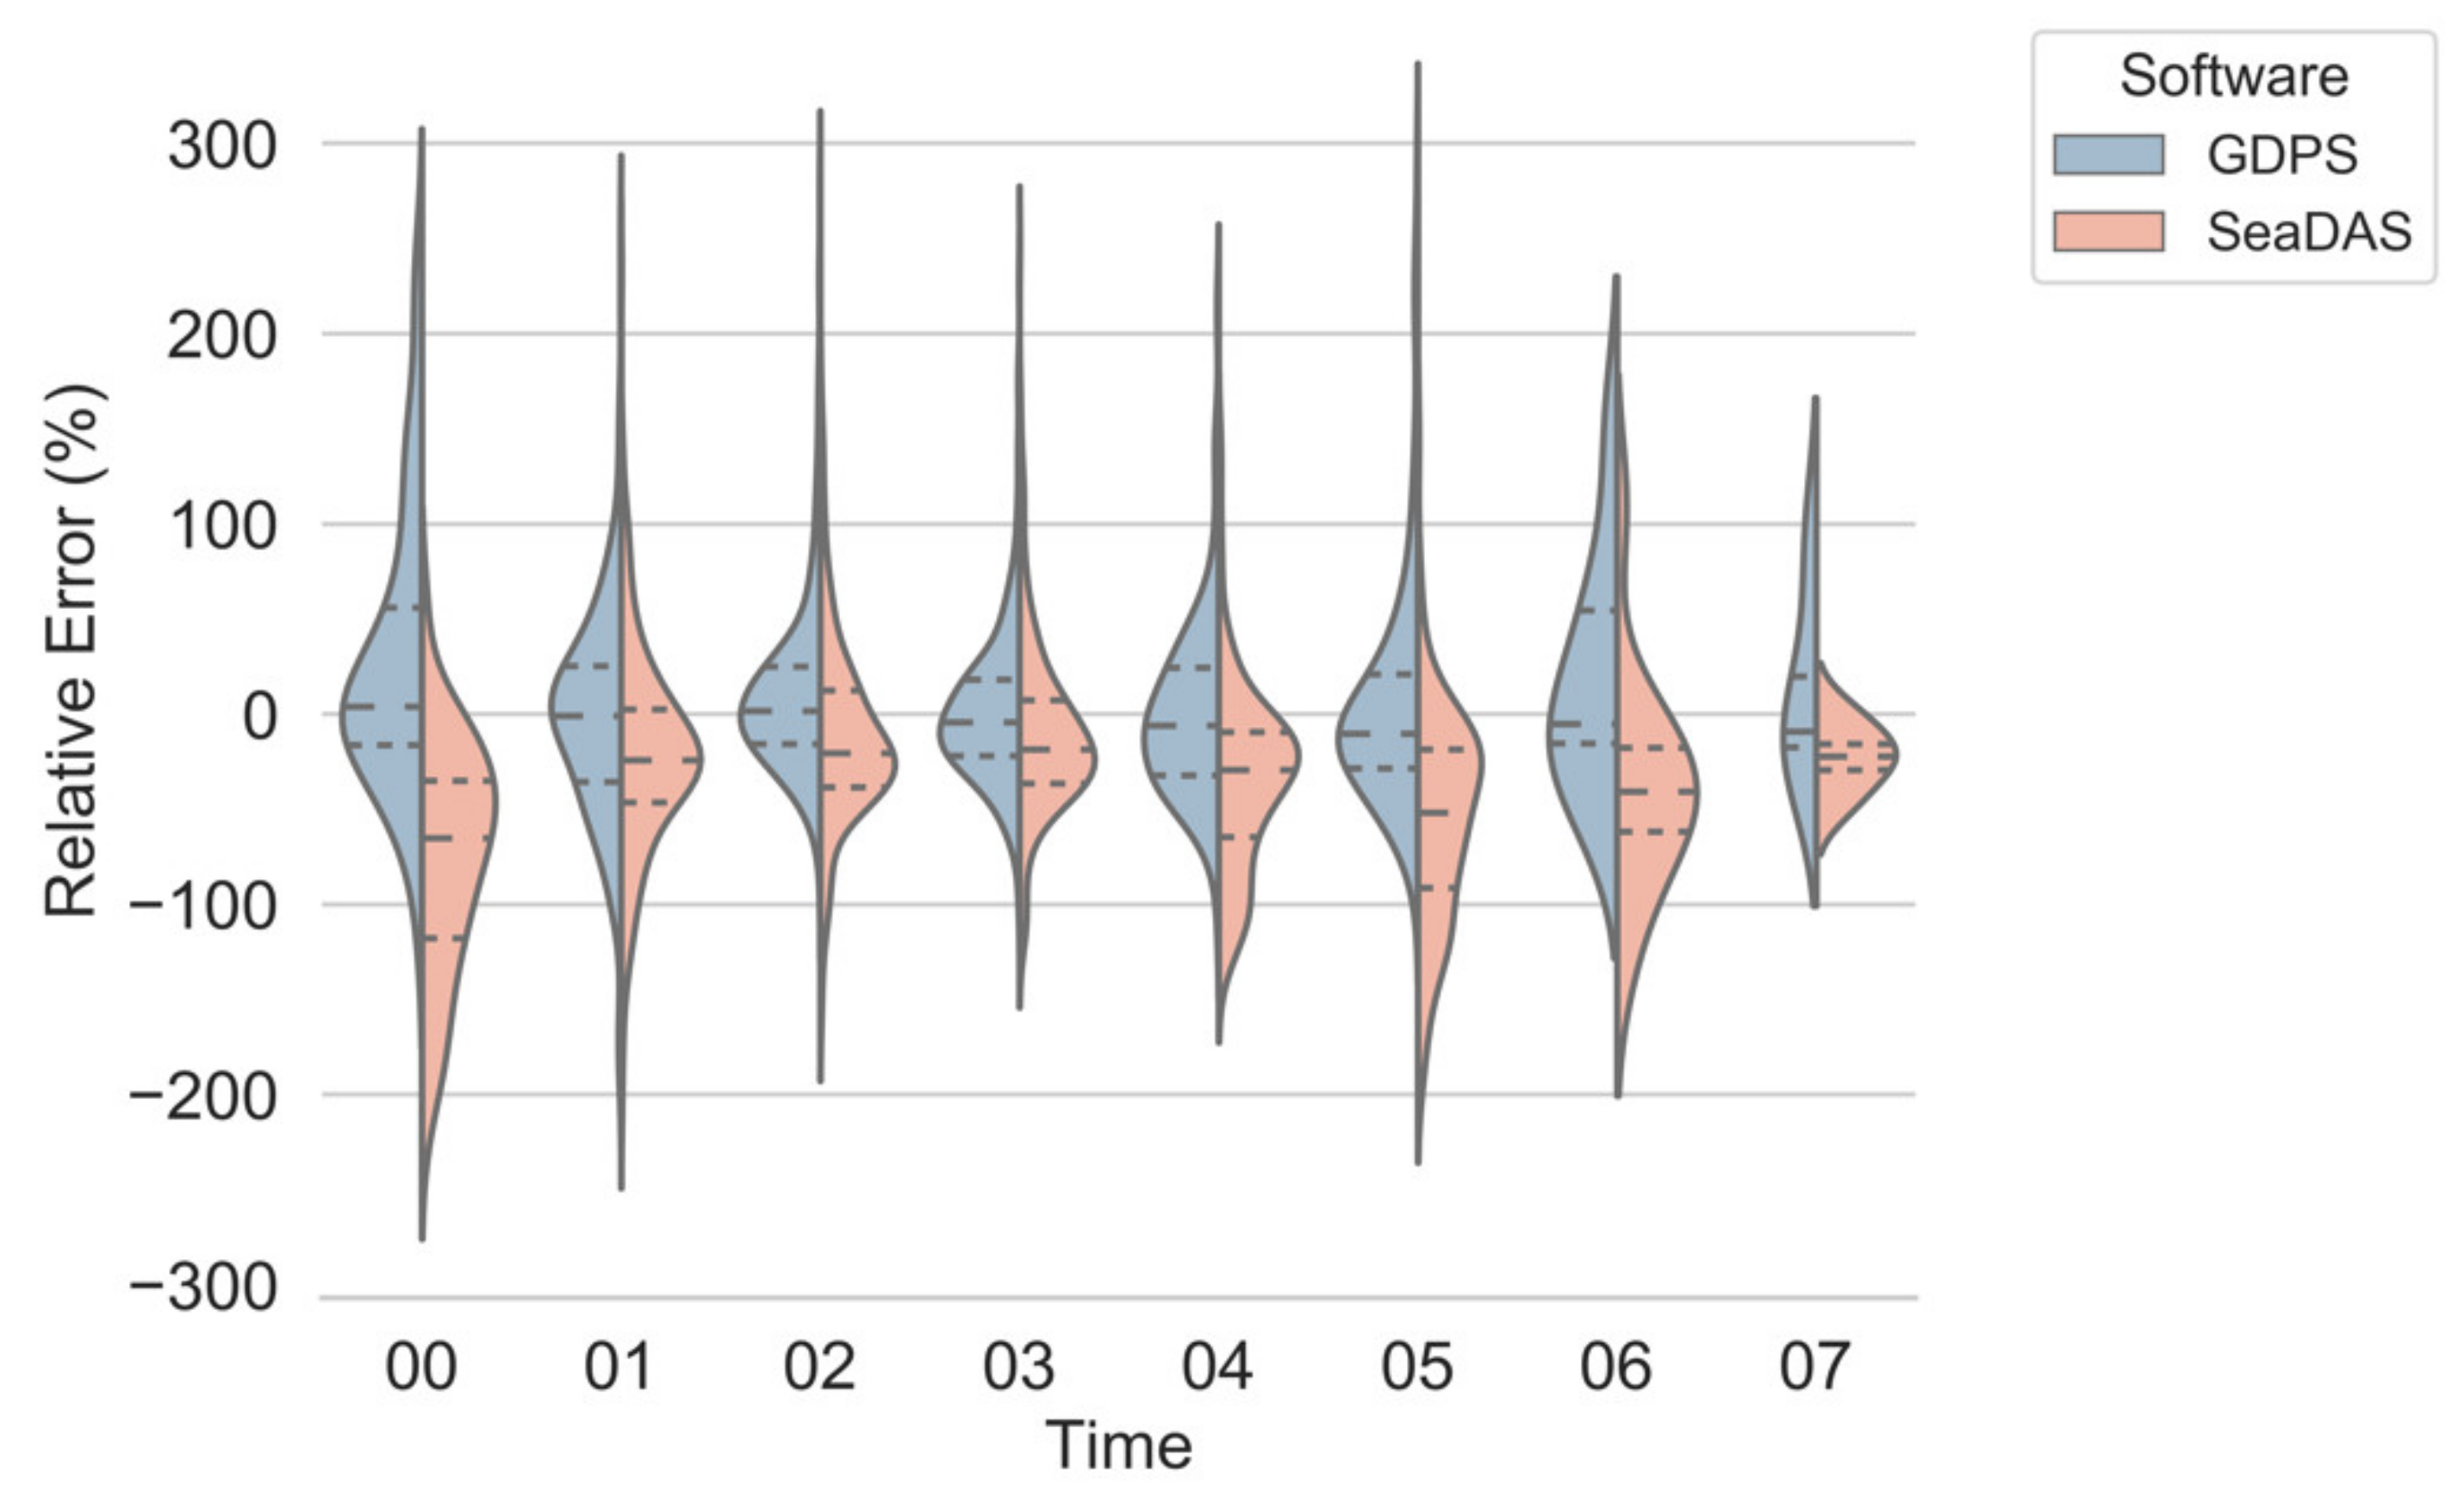
The GOCI data were acquired eight times per day; therefore, we also analyzed the relative errors between nLw_GDPS and nLw_AERONET-OC at different times from 00 to 07 UTC at one-hour intervals in Figure 7 in order to investigate whether the performance of the GDPS algorithm and SeaDAS algorithm changes with time. The statistical information of nLw_GDPS (nLw_SeaDAS) and nLw_AERONET-OC at each hour is also summarized in Table 4. From the 25, 50, and 75 percent percentile lines, nLw_GDPS performs better at 02, 03, and 04 hours, followed by 01 and 05 hours, and worst at 00, 06, and 07 hours. As for nLw_SeaDAS, it performs better at 02 and 03 hours, followed by 01 and 04 hours, and worsens at 05, 06, 07, and 00 hours. This means both algorithms behave better at noon and worse in the early morning and late afternoon.
Overall, the nLw_GDPS turns out slightly better than the nLw_SeaDAS with lower MAE and MPRE at each time (Table 4). However, for both algorithms, the relative errors at 00, 01, 05, 06, and 07 can even exceed 100% and approach 200%, which cannot be ignored in data applications.

3.2. Comparison between nLw_GDPS and nLw_SeaDAS

The nLw(λ) values derived from the GDPS algorithm and SeaDAS algorithm are also compared, and the result is presented by the density scatterplots in Figure 8. The nLw_GDPS and nLw_SeaDAS agree with each other well, with r2 of 0.6465, 0.7340, 0.7988, 0.8971, and 0.7760 at 412, 443, 490, 660, and 865 nm, respectively. Notably, nLw_GDPS and nLw_SeaDAS show better correlation at 660 nm and degrade as the wavelength moved to the blue end of the spectral range, which is consistent with the information reflected in Figure 5. From the linear regression results (red solid lines) and 1:1 line (red dashed lines) between nLw_GDPS and nLw_SeaDAS in Figure 8, it can be observed that the nLw_GDPS values are primarily greater than the nLw_SeaDAS at visible bands shorter than 660 nm, while smaller at NIR band of 865 nm.

4. Discussion

Although the GDPS algorithm and SeaDAS algorithm are both based on the atmospheric correction scheme developed by Gordon and Wang [30], their actual atmospheric correction processors are with different aerosol models, different near-infrared (NIR) water-leaving radiance corrections, and different vicarious calibration gains [18,19,20,31,32,33,37]; thus, as Section 3.2 indicated, the nLw_GDPS and nLw_SeaDAS show some deviations. When comparing with nLw(λ) data of four AERONET-OC sites in terms of clear and turbid water, nLw_GDPS shows better accuracy than nLw_SeaDAS. The nLw_GDPS values are underestimated at 865 nm. However, when nLw_AERONET-OC at 865 is larger than 0.5 W / m 2 · s r · μ m , a rather good agreement, albeit with a larger standard deviation, was observed at shorter bands. On the other hand, the nLw_SeaDAS values show better agreement at 865 nm but performing progressively worse toward short bands. The reason that the nLw_GDPS shows an overall better accuracy than nLw_SeaDAS is that the aerosol models in GDPS algorithm consider more coarse particles than that in SeaDAS algorithm. As aerosol reflectance of coarse aerosol particles has a smaller spectral slope, the underestimated nLw at 865 nm and a smaller spectral slope of aerosol reflectance could just lead to reasonable nLw values at green and blue bands for GDPS algorithms. Thus, even though SeaDAS algorithm uses 80 aerosol models based on AERONET observations [35], and the GDPS algorithm only uses three aerosol models (M99, M50, and C50) in atmospheric correction [31], our results show that GDPS algorithm performs better in correcting atmospheric signal and hence extracting nLw signal at the research sites than SeaDAS algorithm. The GDPS strategy is appropriate for estimating a comparative accurate surface contribution (the MPRE of all bands is ranging from 22% to 44%), and for a long-term further improvement goal, a group of more exact aerosol models is still needed. As mentioned before, the nLw_SeaDAS values at 865 nm agree well with AERONET-OC data. Because the AERONET-OC does not have the measurements at 745 nm, we speculate that if the nLw_SeaDAS values at 745 nm are also accurate, the degraded accuracy of nLw_SeaDAS with decreasing wavelength may arise from the incorrect extrapolation of aerosol reflectance approximation from NIR to short visible bands by the exponential spectral function (this was used by both GDPS and SeaDAS algorithms). However, if the nLw_SeaDAS values at 745 nm are not accurate, then the aerosol model selected using aerosol contribution at two NIR bands of 865 nm and 745 nm would not be appropriate. The aerosol properties in this study area can be further studied since aerosol properties are of high spatiotemporal variations [38], and it influences the accuracy of nLw retrieval and affects the vicarious calibration process of ocean color sensors. It is worth mentioning that the validation at 865 nm is particularly challenging since water-leaving radiance is relatively small as compared to the reflected sky radiance at the air–sea interface. A better validation at 865 nm will be helpful in better understanding the sources of nLw retrieval errors over turbid water.
As indicated in Figure 6 in Section 3.1, the mean relative error of nLw_SeaDAS at 865 nm is close to zero, while an apparent underestimation of nLw_GDPS can be observed. This indicates that the NIR correction model in the SeaDAS algorithm works better, and that of the GDPS algorithm can be further improved. In the GDPS algorithm, an empirical relationship between ρ w at 660 nm, 745 nm, and 865 nm is adopted, and its empirical coefficients were derived using in situ data in turbid waters around Korean Peninsula [21,39]. Since the correlation between red and NIR bands is not immutable but varies with concentrations of TSM, CDOM, and chlorophyll-a [40], a dataset covering different seasons and various water properties will be needed for further improving the NIR correction method of the GDPS algorithm. It is also worth noting that the optical saturation issue of water reflectance appears earlier at short bands with increasing turbidity, and water-leaving reflectance at 660 nm and NIR band can alter incompatibly in waters with different optical properties since 660 nm is close to the second peak of the chlorophyll absorption spectrum [41,42]. Concerning this problem, the GOCI-II mission added a 709 nm band and used it as a substitution for 660 nm in a later NIR correction model [42].
Based on comparison with nLw data from four AERONET-OC sites, we observe that the nLw_GDPS performs better with the MPRE around 30% in turbid water at Ariake and Ieodo, while worse with the MPRE larger than 55% in clearer water at Gageocho and Socheongcho; the nLw_SeaDAS is underestimated with the MPRE among 18–39% in clear water and 57–74% in turbid water. Combing with results in Figure 6 and Table 3, it is discovered that except for the 865 nm band, the errors mostly come from the 412 nm band. The farther the band is from NIR bands, the larger the error is since the estimation accuracy degrades with a longer distance extrapolation. Comparing with turbid water, it seems a better accuracy of nLw at 412 nm is more difficult to achieve in clear waters. Although from scatterplots (Figure 5), the nLw_GDPS agree well with AERONET-OC data in an overall trend, the MPRE is still among 18–55%, and it is far from the ideal goal of 10%. There is still a way to go in improving the atmospheric correction in this study area.
It can be clearly observed that the relative errors of nLw_GDPS and nLw_SeaDAS vary with hours in Figure 7. The better performance of nLw_GDPS and nLw_SeaDAS are at 02 and 03 UTC (11:00 and 12:00 for Korean local time) of one day, and the farther away from noon, the greater relative errors are. This error might be partly from incorrect aerosol estimations. The changing humidity due to solar illumination can affect the aerosol optical properties, low solar altitudes in the early morning and late afternoon can also lead to increasing aerosol contributions, and these will both bring more uncertainties in aerosol estimations in geostationary ocean color remote sensing. This error might be also partly caused by the bidirectional reflectance distribution function (BRDF) correction method, which is used to remove the solar-viewing dependence and nonisotropic distribution of the in-water light field [29,43], and the measured nLw values are more affected by low solar altitudes in the early morning or late afternoon. Both the GDPS algorithm and SeaDAS algorithm use the BRDF correction method of Morel and Gentilli [19,31,33,37], based on the chlorophyll concentration estimation. Results in Figure 7 indicate that the atmospheric correction algorithm in GDPS and SeaDAS algorithms is necessary to be improved when applied to GOCI data with a large solar zenith angle [44], especially when the observed time is far away from noon, since the relative errors at 00, 06, and 07 hours are even over 100% and approach 200%.

5. Conclusions

In this study, we assessed the nLw(λ) products generated from the GDPS algorithm and SeaDAS algorithm with AERONET-OC data from October 2011 to March 2019. The nLw_GDPS and nLw_SeaDAS are, respectively, matched and compared with nLw_AERONET-OC at four AERONET-OC sites of Ariake, Ieodo, Socheongcho, and Gageocho. Results show that the performance of the GDPS algorithm and SeaDAS algorithm varies with measure time, seawater turbidity, and spectral bands.
The nLw_GDPS is of better accuracy both in turbid and clear water, although with underestimations at the 865 nm band. The nLw_SeaDAS data are underestimated in both clear and turbid water, and the underestimation worsens toward short visible bands. Additionally, the negative nLw_SeaDAS values at blue bands are evident. The nLw data generated from the GDPS algorithm perform better than that from the SeaDAS algorithm at visible bands in this study area, while the SeaDAS algorithm performs better than the GDPS algorithm at the NIR band of 865 nm. A better near-infrared water-leaving radiance correction is needed for the GDPS algorithm, while aerosol optical properties and aerosol model selections can be further investigated for the SeaDAS algorithm in this study area.
The GDPS and SeaDAS algorithms perform better at noon (02 and 03 UTC) and worse in the early morning and late afternoon. The relative errors for both processors at 00, 06, and 07 even approach 200%. Thus, a better atmospheric correction performance is required for GOCI data acquired in the early morning and late afternoon.
The GDPS-generated nLw data are slightly better than that with SeaDAS at visible bands; however, the mean percentage relative errors for both algorithms at blue bands are over 30%. The nLw data derived by GDPS is better both in clear and turbid water, although underestimation is observed at the NIR band (865 nm) in turbid water. The nLw data derived by SeaDAS are underestimated in both clear and turbid water, and the underestimation worsens toward short visible bands. Generally, based on the combination of the NIR correction model and aerosol model setting, the GDPS algorithm performs better than the SeaDAS algorithm in this study area. The comparison results lead us to recommend GDPS as a first choice when processing GOCI data. However, its aerosol models and near-infrared water-leaving radiance correction method in atmospheric correction procedure can be further improved to ensure higher quality data in the further improvement in GDPS. Note that we applied the GDPS 1.4.1 version to process GOCI L1b data in this research. The latest GDPS 2.0 version with improvement for red wavelengths is available at the time of publication, but its corresponding algorithm theoretical basis document (ATBD) in English is not currently available. The performance of the improved algorithm adopted in GDPS 2.0 will be further explored and discussed in our future work.
The analysis performed in this study so far is based on a limited dataset from finite sites (four available sites), and the analysis results can only represent the current study area. The water and aerosol conditions in different regions are diverse, and therefore, further analysis might be needed for a performance assessment of the normalized water-leaving radiance in other oceanic regions with various seawater properties.

Author Contributions

Conceptualization, S.H. and M.H.; methodology, M.H. and S.H.; software, M.H.; validation, M.H.; data curation, M.H. and S.H.; writing—original draft preparation, M.H.; writing—review and editing, M.H., S.H., X.Z., and F.Z.; visualization, M.H. and S.H.; supervision, S.H.; funding acquisition, S.H., F.Z., and P.L. All authors have read and agreed to the published version of the manuscript.

Funding

This work was supported by the National Key Research and Development Plan of China (Grant No. 2016YFC1401603), the National Natural Science Foundation of China (Grant No. 41876031), the Major Science and Technology Project of Sanya (Grant No. SKJC-KJ-2019KY03), the Key Research and Development Plan of Zhejiang Province (Grant No. 2020C03012), and the High-level Personnel of Special Support Program of Zhejiang Province (Grant No. 2019R52045).

Institutional Review Board Statement

Not applicable.

Informed Consent Statement

Not applicable.

Acknowledgments

We thank Joji Ishizaka, Kohei Arai, Young-Je Park, Hak-Yeol You, Jae-Seol Shim, and Joo-Hyung Ryu for their efforts in establishing and maintaining in situ data at four AERONET-OC sites of ARIAKE_TOWER, Ieodo_Station, Socheongcho, and Gageocho_Station. We thank Korea Ocean Satellite Center for providing the GOCI L1b data and GDPS software. We thank NASA SeaDAS software development team.

Conflicts of Interest

The authors declare no conflict of interest.

References

  1. Platt, T.; Hoepffner, N.; Stuart, V.; Brown, C. Why Ocean Colour? The Societal Benefits of Ocean-Colour Technology; Reports of the International Ocean-Colour Coordinating Group, NO.7: Dartmouth, NS, Canada, 2008. [Google Scholar]
  2. McClain, C.R. A Decade of Satellite Ocean Color Observations. Annu. Rev. Mar. Sci. 2009, 1, 19–42. [Google Scholar] [CrossRef] [Green Version]
  3. Esaias, W.E.; Abbott, M.R.; Barton, I.; Brown, O.B.; Campbell, J.W.; Carder, K.L.; Clark, D.K.; Evans, R.H.; Hoge, F.E.; Gordon, H.R.; et al. An Overview of MODIS Capabilities for Ocean Science Observations. IEEE Trans. Geosci. Remote Sens. 1998, 36, 1250–1265. [Google Scholar] [CrossRef] [Green Version]
  4. Ruddick, K.; Neukermans, G.; Vanhellemont, Q.; Jolivet, D. Challenges and Opportunities for Geostationary Ocean Colour Remote Sensing of Regional Seas: A Review of Recent Results. Remote Sens. Environ. 2014, 146, 63–76. [Google Scholar] [CrossRef] [Green Version]
  5. Antoine, D. Ocean Color Observation from the Geostationary Orbit; Reports of the International Ocean-Colour Coordinating Group, NO.12: Dartmouth, NS, Canada, 2012. [Google Scholar]
  6. Ryu, J.-H.; Han, H.-J.; Cho, S.; Park, Y.-J.; Ahn, Y.-H. Overview of Geostationary Ocean Color Imager (GOCI) and GOCI Data Processing System (GDPS). Ocean Sci. J. 2012, 47, 223–233. [Google Scholar] [CrossRef]
  7. Yang, H.; Kim, M.; Park, Y.-J.; Bae, S.-S.; Han, H.-J. Marine Disaster Detection Using the Geostationary Ocean Color Imager (GOCI). Int. J. U-E-Serv. Sci. Technol. 2016, 9, 129–138. [Google Scholar] [CrossRef]
  8. Liu, X.; Wang, M. Analysis of Ocean Diurnal Variations from the Korean Geostationary Ocean Color Imager Measurements Using the DINEOF Method. Estuar. Coast. Shelf Sci. 2016, 180, 230–241. [Google Scholar] [CrossRef]
  9. Lennartson, E.M.; Wang, J.; Gu, J.; Castro Garcia, L.; Ge, C.; Gao, M.; Choi, M.; Saide, P.E.; Carmichael, G.R.; Kim, J.; et al. Diurnal Variation of Aerosol Optical Depth and PM2.5 in South Korea: A Synthesis from AERONET, Satellite (GOCI), KORUS-AQ Observation, and the WRF-Chem Model. Atmos. Chem. Phys. 2018, 18, 15125–15144. [Google Scholar] [CrossRef] [Green Version]
  10. Choi, J.-K.; Park, Y.J.; Lee, B.R.; Eom, J.; Moon, J.-E.; Ryu, J.-H. Application of the Geostationary Ocean Color Imager (GOCI) to Mapping the Temporal Dynamics of Coastal Water Turbidity. Remote Sens. Environ. 2014, 146, 24–35. [Google Scholar] [CrossRef]
  11. Hu, Z.; Qi, Y.; He, X.; Wang, Y.-H.; Wang, D.-P.; Cheng, X.; Liu, X.; Wang, T. Characterizing Surface Circulation in the Taiwan Strait during NE Monsoon from Geostationary Ocean Color Imager. Remote Sens. Environ. 2019, 221, 687–694. [Google Scholar] [CrossRef]
  12. Lou, X.; Hu, C. Diurnal Changes of a Harmful Algal Bloom in the East China Sea: Observations from GOCI. Remote Sens. Environ. 2014, 140, 562–572. [Google Scholar] [CrossRef]
  13. Son, Y.B.; Choi, B.-J.; Kim, Y.H.; Park, Y.-G. Tracing Floating Green Algae Blooms in the Yellow Sea and the East China Sea Using GOCI Satellite Data and Lagrangian Transport Simulations. Remote Sens. Environ. 2015, 156, 21–33. [Google Scholar] [CrossRef]
  14. Hu, Z.; Wang, D.-P.; Pan, D.; He, X.; Miyazawa, Y.; Bai, Y.; Wang, D.; Gong, F. Mapping Surface Tidal Currents and Changjiang Plume in the East China Sea from Geostationary Ocean Color Imager. J. Geophys. Res. Oceans 2016, 121, 1563–1572. [Google Scholar] [CrossRef] [Green Version]
  15. Son, Y.B.; Min, J.-E.; Ryu, J.-H. Detecting Massive Green Algae (Ulva Prolifera) Blooms in the Yellow Sea and East China Sea Using Geostationary Ocean Color Imager (GOCI) Data. Ocean Sci. J. 2012, 47, 359–375. [Google Scholar] [CrossRef]
  16. Hu, C.; Feng, L.; Lee, Z. Evaluation of GOCI Sensitivity for At-Sensor Radiance and GDPS-Retrieved Chlorophyll-a Products. Ocean Sci. J. 2012, 47, 279–285. [Google Scholar] [CrossRef]
  17. Bailey, S.W.; Franz, B.A.; Werdell, P.J. Estimation of Near-Infrared Water-Leaving Reflectance for Satellite Ocean Color Data Processing. Opt. Express 2010, 18, 7521–7527. [Google Scholar] [CrossRef]
  18. Huang, X.; Zhu, J.; Han, B.; Jamet, C.; Tian, Z.; Zhao, Y.; Li, J.; Li, T. Evaluation of Four Atmospheric Correction Algorithms for GOCI Images over the Yellow Sea. Remote Sens. 2019, 11, 1631. [Google Scholar] [CrossRef] [Green Version]
  19. Concha, J.; Mannino, A.; Franz, B.; Kim, W. Uncertainties in the Geostationary Ocean Color Imager (GOCI) Remote Sensing Reflectance for Assessing Diurnal Variability of Biogeochemical Processes. Remote Sens. 2019, 11, 295. [Google Scholar] [CrossRef] [Green Version]
  20. Concha, J.; Mannino, A.; Franz, B.; Bailey, S.; Kim, W. Vicarious Calibration of GOCI for the SeaDAS Ocean Color Retrieval. Int. J. Remote Sens. 2019, 40, 3984–4001. [Google Scholar] [CrossRef]
  21. Kim, W.; Moon, J.-E.; Park, Y.-J.; Ishizaka, J. Evaluation of Chlorophyll Retrievals from Geostationary Ocean Color Imager (GOCI) for the North-East Asian Region. Remote Sens. Environ. 2016, 184, 482–495. [Google Scholar] [CrossRef]
  22. Lamquin, N.; Mazeran, C.; Doxaran, D.; Ryu, J.-H.; Park, Y.-J. Assessment of GOCI Radiometric Products Using MERIS, MODIS and Field Measurements. Ocean Sci. J. 2012, 47, 287–311. [Google Scholar] [CrossRef]
  23. Li, H.; He, X.; Ding, J.; Hu, Z.; Cui, W.; Li, S.; Zhang, L. Validation of the Remote Sensing Products Retrieved by Geostationary Ocean Color Imager in Liaodong Bay in Spring. Acta Opt. Sin. 2016, 36, 17–28. [Google Scholar]
  24. Qi, L.; Hu, C.; Visser, P.M.; Ma, R. Diurnal Changes of Cyanobacteria Blooms in Taihu Lake as Derived from GOCI Observations. Limnol. Oceanogr. 2018, 63, 1711–1726. [Google Scholar] [CrossRef] [Green Version]
  25. Wu, J.; Chen, C.; Nukapothula, S. Atmospheric Correction of GOCI Using Quasi-Synchronous VIIRS Data in Highly Turbid Coastal Waters. Remote Sens. 2020, 12, 89. [Google Scholar] [CrossRef] [Green Version]
  26. Yongchao, W.; Shen, F.; Sokoletsky, L.; Sun, X. Validation and Calibration of QAA Algorithm for CDOM Absorption Retrieval in the Changjiang (Yangtze) Estuarine and Coastal Waters. Remote Sens. 2017, 9, 1192. [Google Scholar]
  27. Huang, C.; Yao, L. Semi-Analytical Retrieval of the Diffuse Attenuation Coefficient in Large and Shallow Lakes from GOCI, a High Temporal-Resolution Satellite. Remote Sens. 2017, 9, 825. [Google Scholar] [CrossRef] [Green Version]
  28. Zibordi, G.; Holben, B.; Slutsker, I.; Giles, D.; D’Alimonte, D.; Mélin, F.; Berthon, J.-F.; Vandemark, D.; Feng, H.; Schuster, G.; et al. AERONET-OC: A Network for the Validation of Ocean Color Primary Products. J. Atmos. Ocean. Technol. 2009, 26. [Google Scholar] [CrossRef]
  29. Morel, A.; Antoine, D.; Gentili, B. Bidirectional Reflectance of Oceanic Waters: Accounting for Raman Emission and Varying Particle Scattering Phase Function. Appl. Opt. 2002, 41, 6289–6306. [Google Scholar] [CrossRef]
  30. Gordon, H.; Wang, M. Retrieval of Water-Leaving Radiance and Aerosol Optical-Thickness Over the Oceans with Seawifs - a Preliminary Algorithm. Appl. Opt. 1994, 33, 443–452. [Google Scholar] [CrossRef]
  31. Park, Y.J.; Ahn, Y.H.; Han, H.J.; Yang, H.; Moon, J.E.; Ahn, J.H.; Lee, B.R.; Min, J.E.; Lee, S.J.; Kim, K.S. GOCI Level 2 Ocean Color Products (GDPS 1.3) Brief Algorithm Description; Korea Ocean Satellite Center: Busan Metropolitan City, Korea, 2014; Available online: http://kosc.kiost.ac.kr/index.nm?menuCd=55 (accessed on 21 December 2020).
  32. Ahn, J.-H.; Park, Y.-J.; Ryu, J.-H.; Lee, B.; Oh, I.S. Development of Atmospheric Correction Algorithm for Geostationary Ocean Color Imager (GOCI). Ocean Sci. J. 2012, 47, 247–259. [Google Scholar] [CrossRef]
  33. Mobley, C.D.; Werdell, J.; Franz, B.; Ahmad, Z.; Bailey, S. Atmospheric Correction for Satellite Ocean Color Radiometry; National Aeronautics and Space Administration: Greenbelt, MD, USA, 2016. Available online: https://ntrs.nasa.gov/citations/20160011399 (accessed on 21 December 2020).
  34. Stumpf, R.; Arnone, R.; Gould, R.; Martinolich, P.; Ransibrahmanakul, V. A Partially Coupled Ocean-Atmosphere Model for Retrieval of Water-Leaving Radiance from SeaWiFS in Coastal Waters. NASA Tech. Memo 2003, 206892, 51–59. [Google Scholar]
  35. Ahmad, Z.; Franz, B.A.; McClain, C.R.; Kwiatkowska, E.J.; Werdell, J.; Shettle, E.P.; Holben, B.N. New Aerosol Models for the Retrieval of Aerosol Optical Thickness and Normalized Water-Leaving Radiances from the SeaWiFS and MODIS Sensors over Coastal Regions and Open Oceans. Appl. Opt. 2010, 49, 5545–5560. [Google Scholar] [CrossRef]
  36. Bailey, S.W.; Werdell, P.J. A Multi-Sensor Approach for the on-Orbit Validation of Ocean Color Satellite Data Products. Remote Sens. Environ. 2006, 102, 12–23. [Google Scholar] [CrossRef]
  37. Ahn, J.-H.; Park, Y.-J.; Kim, W.; Lee, B.; Oh, I.S. Vicarious Calibration of the Geostationary Ocean Color Imager. Opt. Express 2015, 23, 23236–23258. [Google Scholar] [CrossRef] [PubMed]
  38. Eck, T.F.; Holben, B.N.; Reid, J.S.; Dubovik, O.; Smirnov, A.; O’Neill, N.T.; Slutsker, I.; Kinne, S. Wavelength Dependence of the Optical Depth of Biomass Burning, Urban, and Desert Dust Aerosols. J. Geophys. Res. Atmos. 1999, 104, 31333–31349. [Google Scholar] [CrossRef]
  39. Choi, J.-K.; Park, Y.J.; Ahn, J.H.; Lim, H.-S.; Eom, J.; Ryu, J.-H. GOCI, the World’s First Geostationary Ocean Color Observation Satellite, for the Monitoring of Temporal Variability in Coastal Water Turbidity. J. Geophys. Res. Oceans 2012, 117. [Google Scholar] [CrossRef]
  40. Goyens, C.; Jamet, C.; Ruddick, K.G. Spectral Relationships for Atmospheric Correction. I. Validation of Red and near Infra-Red Marine Reflectance Relationships. Opt. Express 2013, 21. [Google Scholar] [CrossRef] [PubMed] [Green Version]
  41. Wang, M.; Shi, W.; Jiang, L. Atmospheric Correction Using Near-Infrared Bands for Satellite Ocean Color Data Processing in the Turbid Western Pacific Region. Opt. Express 2012, 20, 741–753. [Google Scholar] [CrossRef]
  42. Ahn, J.-H.; Park, Y.-J. Estimating Water Reflectance at Near-Infrared Wavelengths for Turbid Water Atmospheric Correction: A Preliminary Study for GOCI-II. Remote Sens. 2020, 12, 3791. [Google Scholar] [CrossRef]
  43. Morel, A.; Gentili, B. Diffuse Reflectance of Oceanic Waters. III. Implication of Bidirectionality for the Remote-Sensing Problem. Appl. Opt. 1996, 35, 4850–4862. [Google Scholar] [CrossRef]
  44. Li, H.; He, X.; Bai, Y.; Shanmugam, P.; Park, Y.-J.; Liu, J.; Zhu, Q.; Gong, F.; Wang, D.; Huang, H. Atmospheric Correction of Geostationary Satellite Ocean Color Data under High Solar Zenith Angles in Open Oceans. Remote Sens. Environ. 2020, 249, 112022. [Google Scholar] [CrossRef]
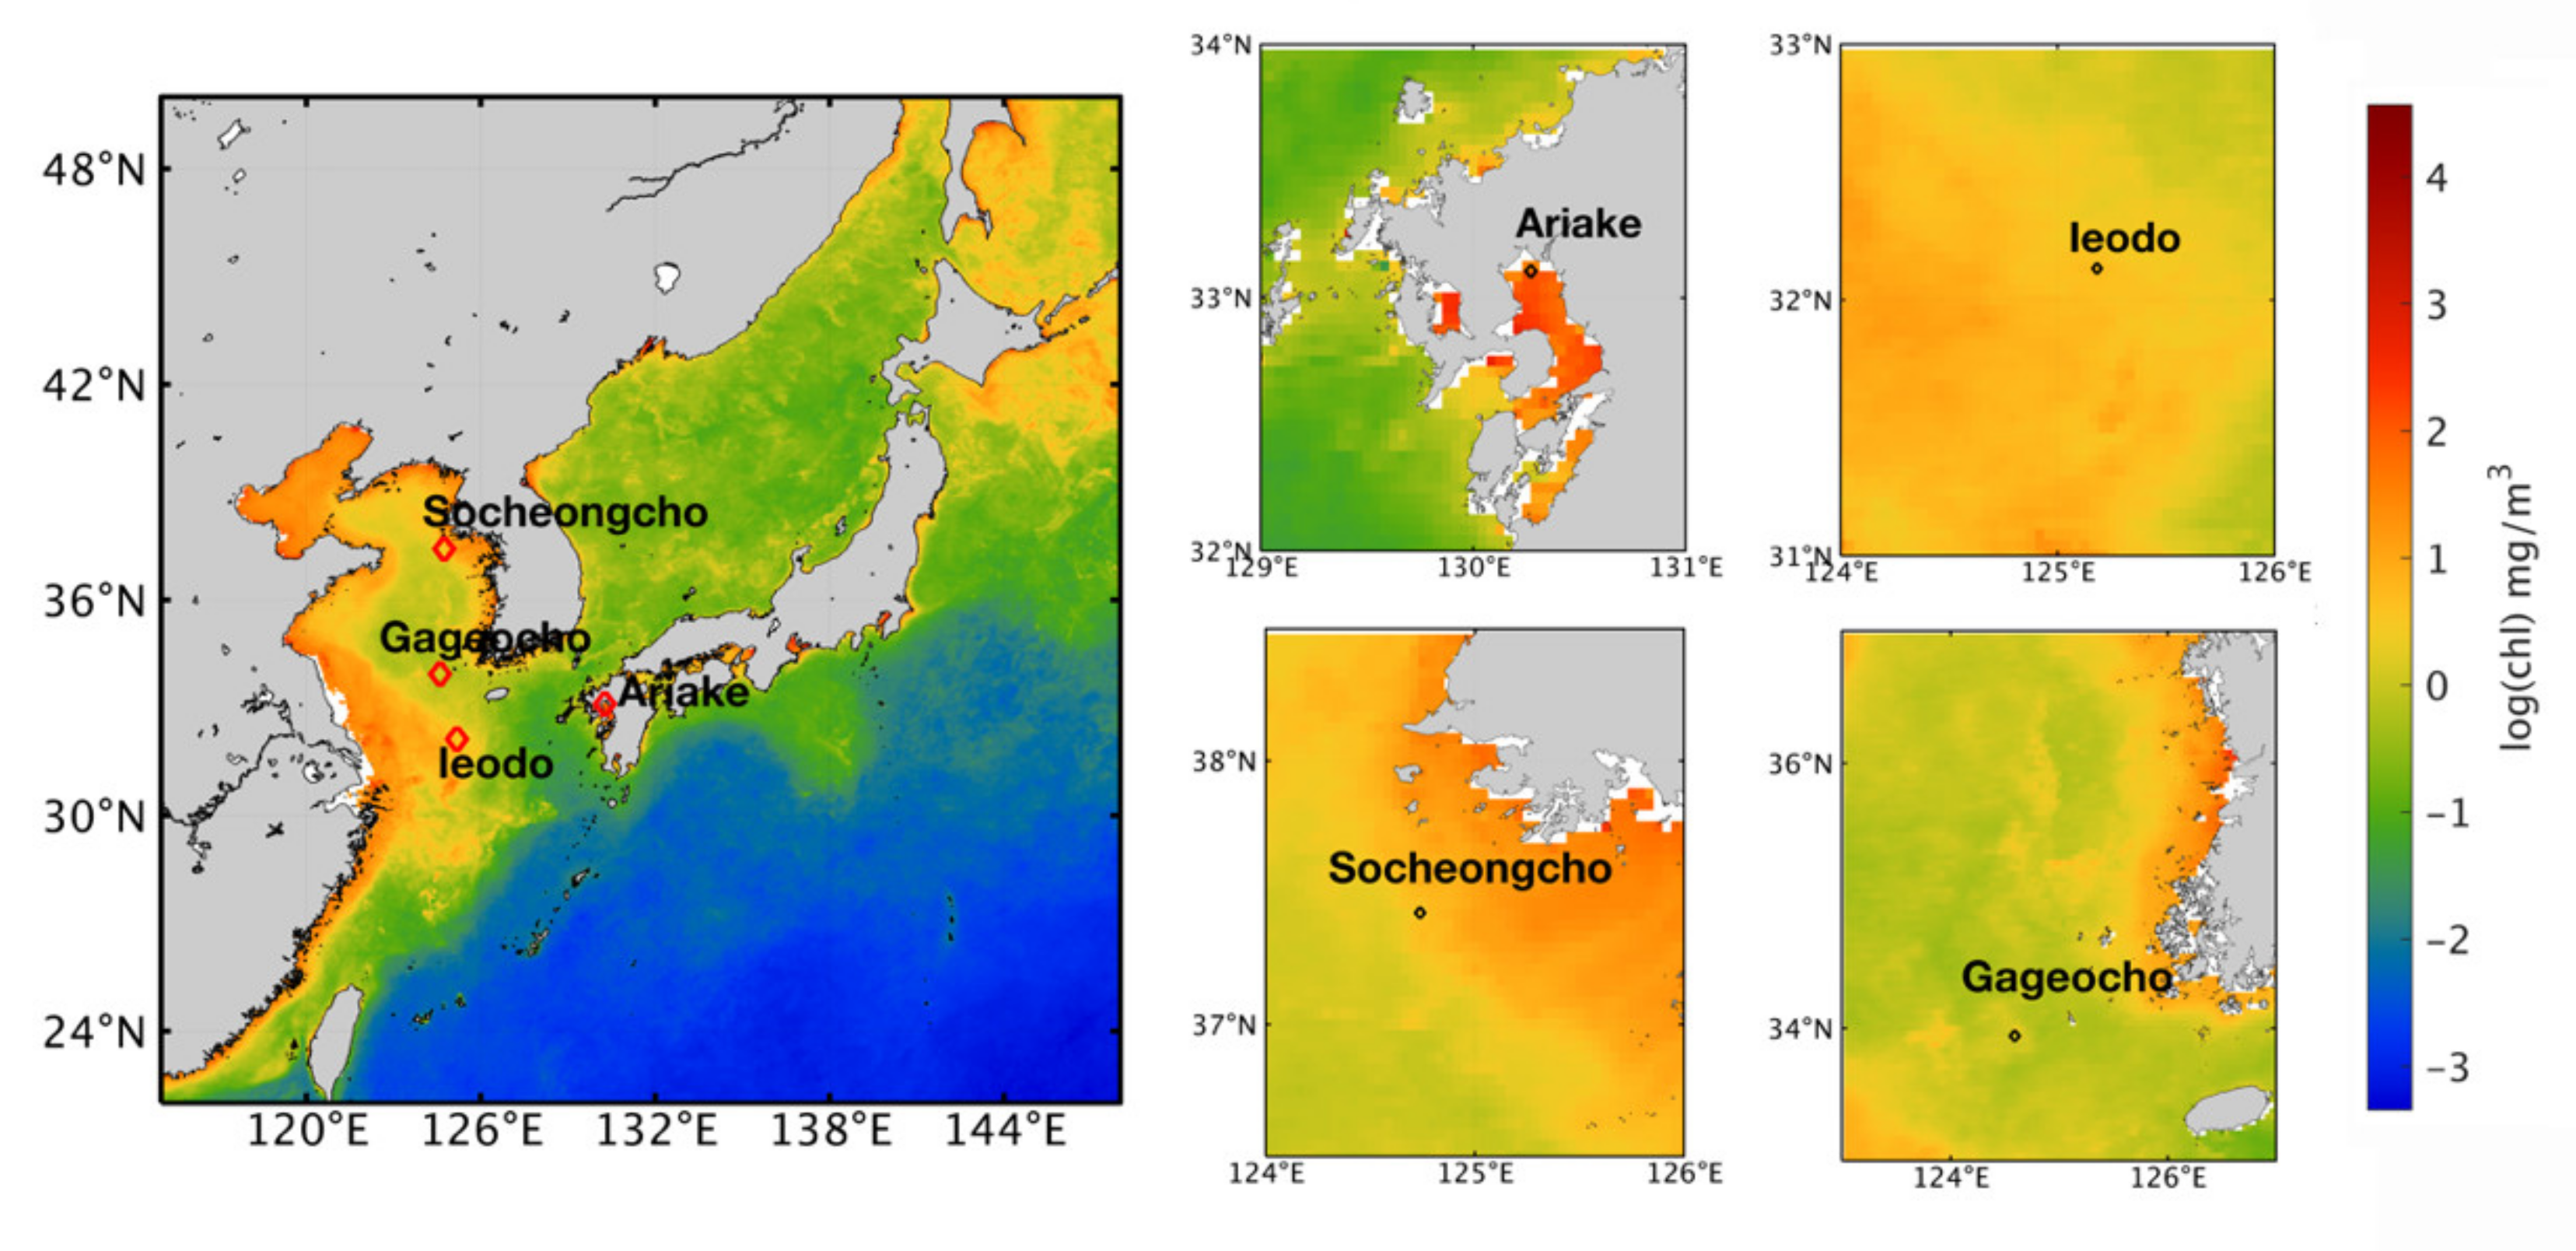
Figure 1. The distribution of chlorophyll-a concentration in the GOCI observation area (data from MODIS-Aqua) and the location of four AERONET-OC sites (Ariake, Ieodo, Socheongcho, Gageocho). The zoom-in figures at four sites are exhibited on the right side together with the color bar.
Remotesensing 13 01640 g001
Figure 2. Flowchart of exclusion criterion and matchup procedure. Median, median of valid pixel values; σ, standard deviation of valid pixel values; NSP, number of selected pixels; NTP, number of total pixels.
Remotesensing 13 01640 g002
Figure 3. Scatterplots between nLw_GDPS and nLw_AERONET-OC (left column), and nLw_SeaDAS and nLw_AERONET-OC (right column) at Ariake, Ieodo, Gageocho, and Socheongcho sites, respectively.
Remotesensing 13 01640 g003
Figure 4. Violin plots of relative error distribution of nLw_GDPS (shown in blue) and nLw_SeaDAS (shown in pink), compared to nLw_AERONET-OC at Ariake, Ieodo, Socheongcho, and Gageocho sites. The dotted lines represent the upper quartile, median, and lower quartile. The statistical information between nLw_GDPS (nLw_SeaDAS) and nLw_AERONET-OC at each site was summarized in Table 2.
Remotesensing 13 01640 g004
Figure 5. Scatterplots between nLw_GDPS and nLw_AERONET-OC (left column), and nLw_SeaDAS and nLw_AERONET-OC (right column) at 412, 443, 490, 660, and 865 nm, respectively. The color bar represents the number of matchup pairs. Note that the data at 865 nm are only from the Ariake site.
Remotesensing 13 01640 g005
Figure 6. Violin plots of relative error distribution of nLw_GDPS (shown in blue) and nLw_SeaDAS (shown in pink), compared to nLw_AERONET-OC, at 412, 443, 490, 660, and 865 nm (note that the data at 865 nm are only from the Ariake site). The dotted lines represent the upper quartile, median, and lower quartile. The statistical information between nLw_GDPS (nLw_SeaDAS) and nLw_AERONET-OC at each wavelength is summarized in Table 3.
Remotesensing 13 01640 g006
Figure 7. Violin plots of relative error distribution of nLw_GDPS (shown in blue) and nLw_SeaDAS (shown in pink), compared to nLw_AERONET-OC from 00 to 07 (UTC) at one-hour intervals. The dotted lines represent the upper quartile, median, and lower quartile. The statistical information of nLw_GDPS (nLw_SeaDAS) and nLw_AERONET-OC at each hour is summarized in Table 4.
Remotesensing 13 01640 g007
Figure 8. Density scatterplots between the GDPS-derived (abscissa) and SeaDAS-derived (ordinate) nLw values at 412, 443, 490, 660, and 865 nm bands. The color bar stands for the number of matchup pairs. The red solid lines are derived by linear regression between nLw_GDPS and nLw_SeaDAS. The red dashed lines are 1:1 lines.
Remotesensing 13 01640 g008
Table 1. GOCI spectral bands and corresponding wavebands of AERONET-OC data.
GOCIAERONET-OC
Band#𝛌 (nm)Δ𝛌(nm)Band#𝛌 (nm)Δ𝛌(nm)
B141220B441210
B244320B644310
B349020B749010
B455520---
B566020B1666710
B668010---
B774520---
B886540B2186510
Table 2. The MAE ( W / m 2 · sr · μ m ) and MPRE (%) of each site between nLw_AERONET-OC and nLw_xxx for all matchup pairs
Site AriakeIeodoSocheongchoGageocho
AERONET-OC vs. GDPSMAE2.07132.82502.08161.7582
MPRE28.989229.782067.686956.0459
N10988721035
AERONET-OC vs. SeaDASMAE3.24542.92152.43042.1949
MPRE39.250217.928674.109457.0899
N9439627036
Table 3. The MAE ( W / m 2 · sr · μ m ) and MPRE (%) of nLw(λ) between nLw_AERONET-OC and nLw_xxx for all matchup pairs.
λ (nm) 412 nm443 nm490 nm660 nm865 nm
AERONET-OC vs. GDPSMAE2.65532.82792.80161.61270.1550
MPRE44.185731.750022.152141.941437.7339
N304305305298218
AERONET-OC vs. SeaDASMAE3.92883.96144.36411.75310.1452
MPRE63.328947.596232.684342.891536.9046
N287287292291188
Table 4. The MAE ( W / m 2 · sr · μ m ) and MPRE (%) at different times between nLw_AERONET-OC and nLw_xxx for all matchup pairs.
Time 0001020304050607
AERONET-OC vs. GDPSMAE1.77052.26571.93212.07222.25482.53612.04843.7610
MPRE48.757340.897731.918926.998634.960642.506618.800832.2694
N9631142528915514644
AERONET-OC vs. SeaDASMAE2.25212.55002.68992.92873.73514.39464.72755.0621
MPRE78.582544.739039.073736.431747.252562.784655.567622.6875
N73259351341165139134
Publisher’s Note: MDPI stays neutral with regard to jurisdictional claims in published maps and institutional affiliations.