1. Introduction
Software defined radar (SDRadar) has gained attention in the past few years. SDRadar is a relatively new paradigm that arose from the natural evolution of radar system design. Early radars relied fully on analog hardware, including data presentation to the user. Throughout history, advances in electronic technology have allowed replacing analog parts of the system with digital ones. Digital processing allows high flexibility and robustness, while easing design by eliminating analog design difficulties. The natural evolution has been to replace parts that are later in the analog chain, beginning with data presentation and recording, and continuing to base-band and intermediate-frequency (IF) processing. As digital processing capabilities increase, more and more parts are being replaced by digital ones. SDRadar arises from this natural evolution and refers to the usage of software for implementing many processing operations formerly done with specialized analog or fixed digital hardware.
SDRadars are usually implemented using software defined radios (SDR). The concept of SDR is analogous to SDRadar, but more general since it refers to radios in general. SDRs in the market target mainly communication applications. Since the communications market is massive, SDRs have benefited from intensive investment and research and are nowadays highly integrated and robust. It has to be noted that the benefits of using a SDR for this task manifest themselves in the designer side rather than in the user one. In general, the benefits are related to the increased design flexibility and significantly reduced design cycles.
According to the Institute of Electrical and Electronic Engineers (IEEE), an SDR is a “radio in which some or all the physical layer functions are implemented in software” [
1]. IEEE clarifies this definition by stating that “a radio can be an SDR as long as the characteristics of the transmitted signal can be modified after manufacture through software and/or firmware downloads [
1]”.
One of the first authors to talk about SDRadar was Wiesbeck [
2]. In his paper, Wiesbeck proposed a new kind of synthetic aperture radar (SAR) that is software-defined, to reduce weight, increase its reliability and ease its calibration. Later publications focused on the design of radar prototypes built around commercial SDRs or digital processing blocks. The majority of them used the Universal Software Radio Peripheral (USRP) [
3,
4,
5,
6,
7]. Many applications of SDRadar have been described, including, but not limited to: passive radar using signals of opportunity [
8,
9], synthetic aperture radar [
10,
11,
12], hybrid radar and communication systems [
4,
10], ground penetrating radar [
13], MIMO Radar [
14,
15] and cognitive radar [
16,
17,
18].
This work is centered on the use of SDRs for a multi-frequency software defined ground based synthetic aperture radar (GBSAR). A GBSAR is a popular remote sensing system used in the local monitoring of landslides, civil infrastructure, mines, buildings, glaciers and other geological and physical phenomena [
19,
20]. A GBSAR exploits the synthetic aperture technique, a tool capable of generating high resolution images of the complex electromagnetic reflectivity of a target scene. GBSARs are complimentary to space-borne or air-borne SAR systems. The advantages of GBSARs over airborne or space-borne systems are: continuous and time-critical monitoring, ease of deployment, favorable geometrical configuration of the measurement in some situations, simpler data processing and lower cost. Their main disadvantage is their limitation to the imaging of much smaller areas.
Early GBSARs were based on vector network analyzers (VNA). These systems relied on VNAs to perform linear frequency sweeping and coherent signal recording. The VNA provided flexibility and a ready-to-use device to implement the radar core. However, those systems were bulky, extremely expensive due to the high cost of the VNA and suffered from a slow scanning time. Due to these drawbacks, GBSAR manufacturers gradually replaced VNAs for custom electronic designs that allowed custom functionalities and reductions in the scanning time by one order of magnitude (from few minutes to less than a minute) [
20], at the expense of flexibility. GBSAR systems can benefit from the SDRadar paradigm by gaining operational flexibility, integration and robustness, and having low costs.
Radar frequency plays an important role in the measurement. High frequencies lead to increased azimuth resolution and smaller systems. However, systems that operate at high frequencies are more sensitive to scene decorrelation effects, and suffer from increased free-space loss. On the other hand, low-frequency operation leads to bigger antennas, less resolution and less sensitivity to decorrelation effects [
19]. It has also been shown that high frequencies are more affected by atmospheric conditions such as turbulence and humidity gradients [
20,
21,
22].
It has been shown that frequency diversity has significant benefits [
23,
24,
25]. A notable advantage is the capability of exploiting the response of the target to each frequency. Certain geophysical parameters of a target interact in different ways depending on frequency. Often, a certain frequency band is more suitable than other to extract those parameters. For example, snow mapping is better done at C-band [
26,
27]. The sensing of surfaces with vegetation cover is also possible only at low-frequency bands, such as L-band and P-band, due to its high penetration regarding vegetation. The combination of two or more frequency bands when sensing the same target has also found other applications, such as biomass parameter extraction [
28].
The instrument described in this work is a multi-frequency GBSAR built around a high-performance SDR. The main goal of designing this instrument was for it to be employed as a demonstrator and experimental platform for multifrequency GBSAR campaigns. The system is capable of operating in P, L, C and X-bands.
Section 2 details the software and hardware design and an implementation of the system; and data system control and processing aspects.
Section 3 describes some of the measurement campaigns and their results. Finally,
Section 4 summarizes the main conclusions of this work.
2. System Description
This section aims at providing a high level description of the developed system. The system-level aspects are first described, followed by a description of its hardware and software parts.
2.1. System Requirements
The GBSAR system to be developed has to comply with certain performance requirements that depend, basically, on the intended application and on the target to be measured. In order to get a sense of an acceptable performance, two popular GBSARs in the industry are considered as references. The first one is the IBIS-FM from Ingegneria dei Sistemi (IDS) [
29], and the second one is the FastGBSAR-S from Metasensing [
30]. Their most important characteristics are summarized in
Table 1. Note that the parameters are very similar, with a notable disparity in the scan time and transmit power. These two parameters are directly related, as will be shown.
Although not specified by the manufacturers, it is considered that the worst accuracy occurs at maximum range. Considering these parameters, and after considering various trade-offs such as cost, hardware complexity and maximum range, the design goals of our system can be established as seen in
Table 2.
Note that the maximum range and displacement accuracy have been relaxed with respect to the two systems shown in
Table 1. This was done to limit the required transmission power, which reduces significantly the cost of the er, while keeping the scan time in the order of seconds. The accuracy and range values are considered acceptable for a prototype and the intended measurements.
A parameter necessary for the maximum range calculation is the scattering coefficient (
), which was set to −25 dB, a value common for relatively smooth surfaces at grazing angles around 30° [
31]. Using this relation and the other design parameters, the SNR budget determined that a 10 s acquisition time was sufficient.
2.2. Hardware Overview
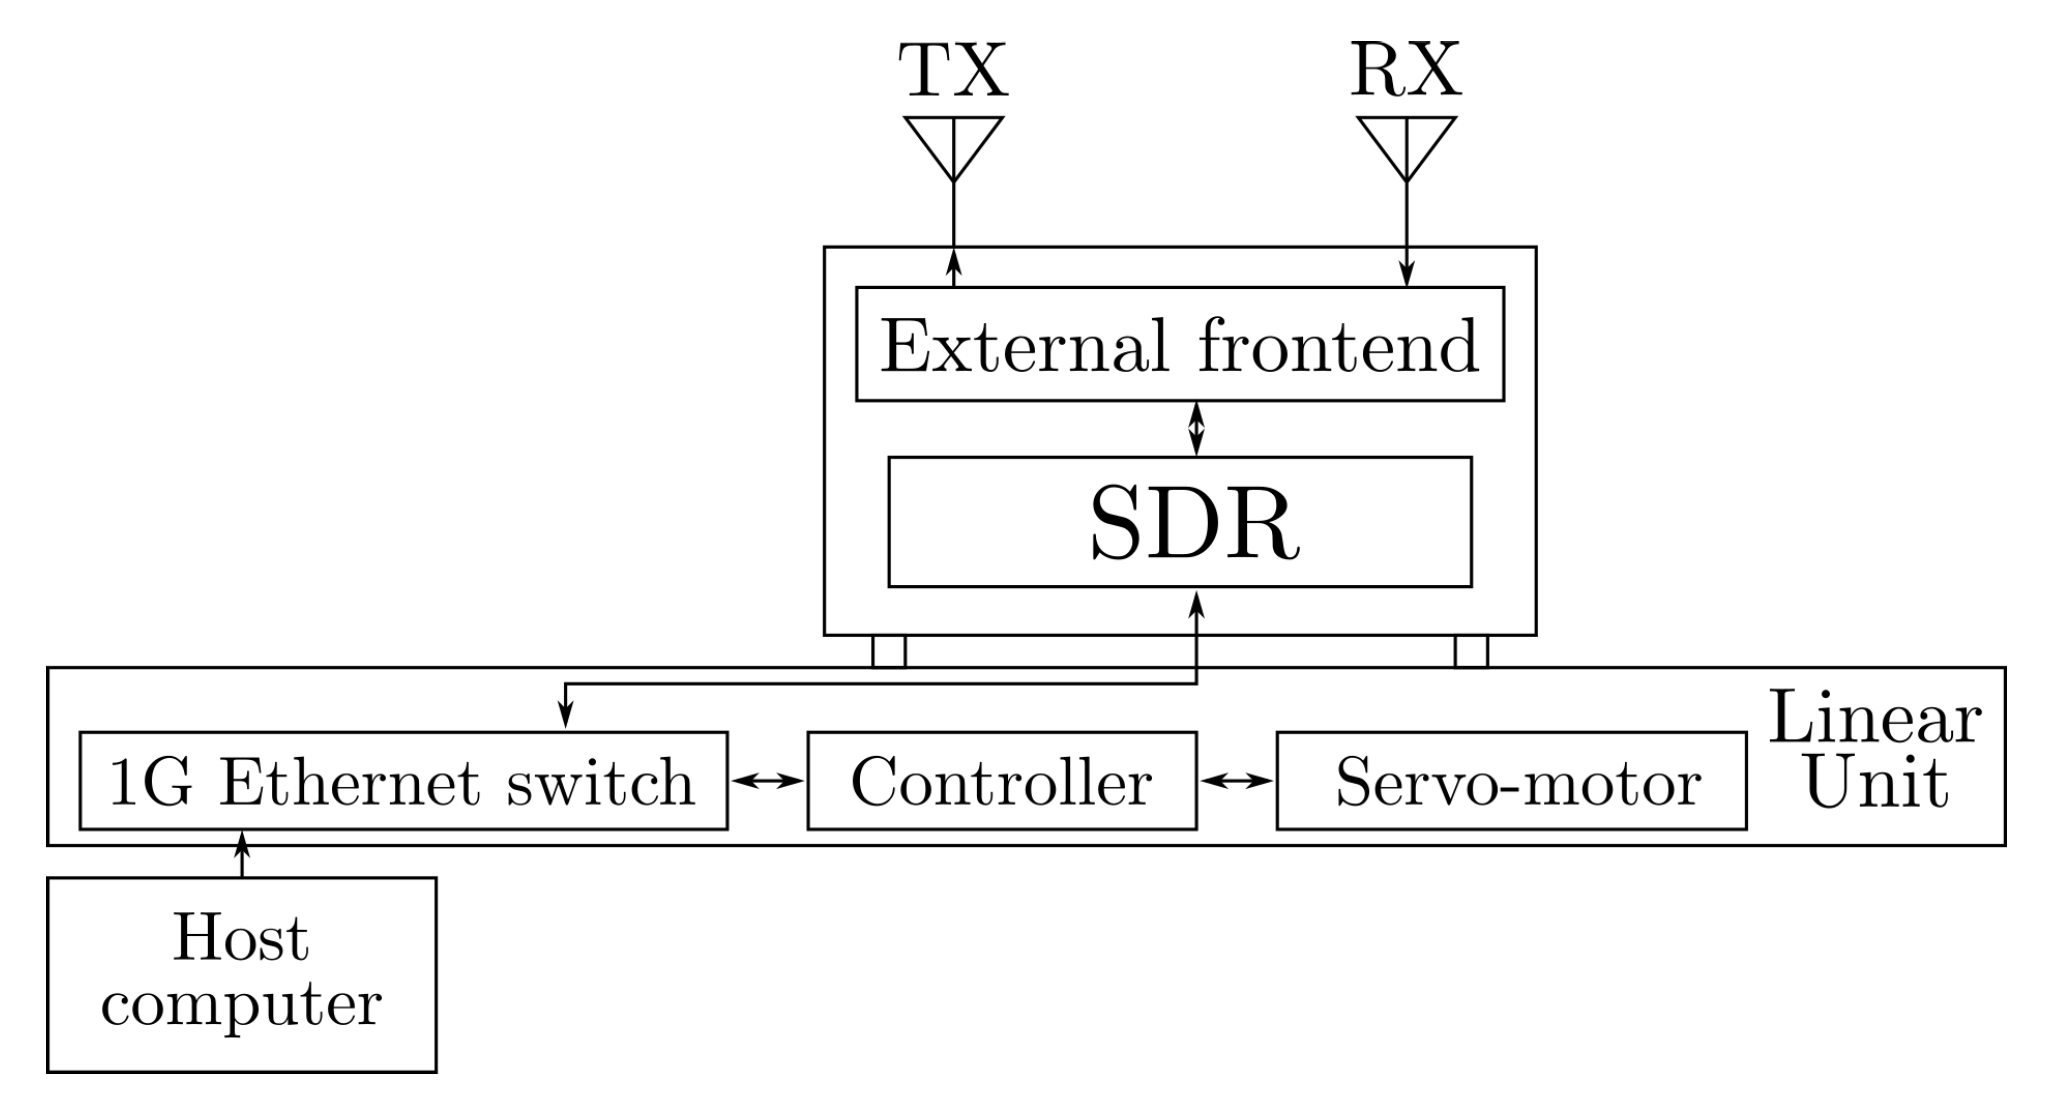
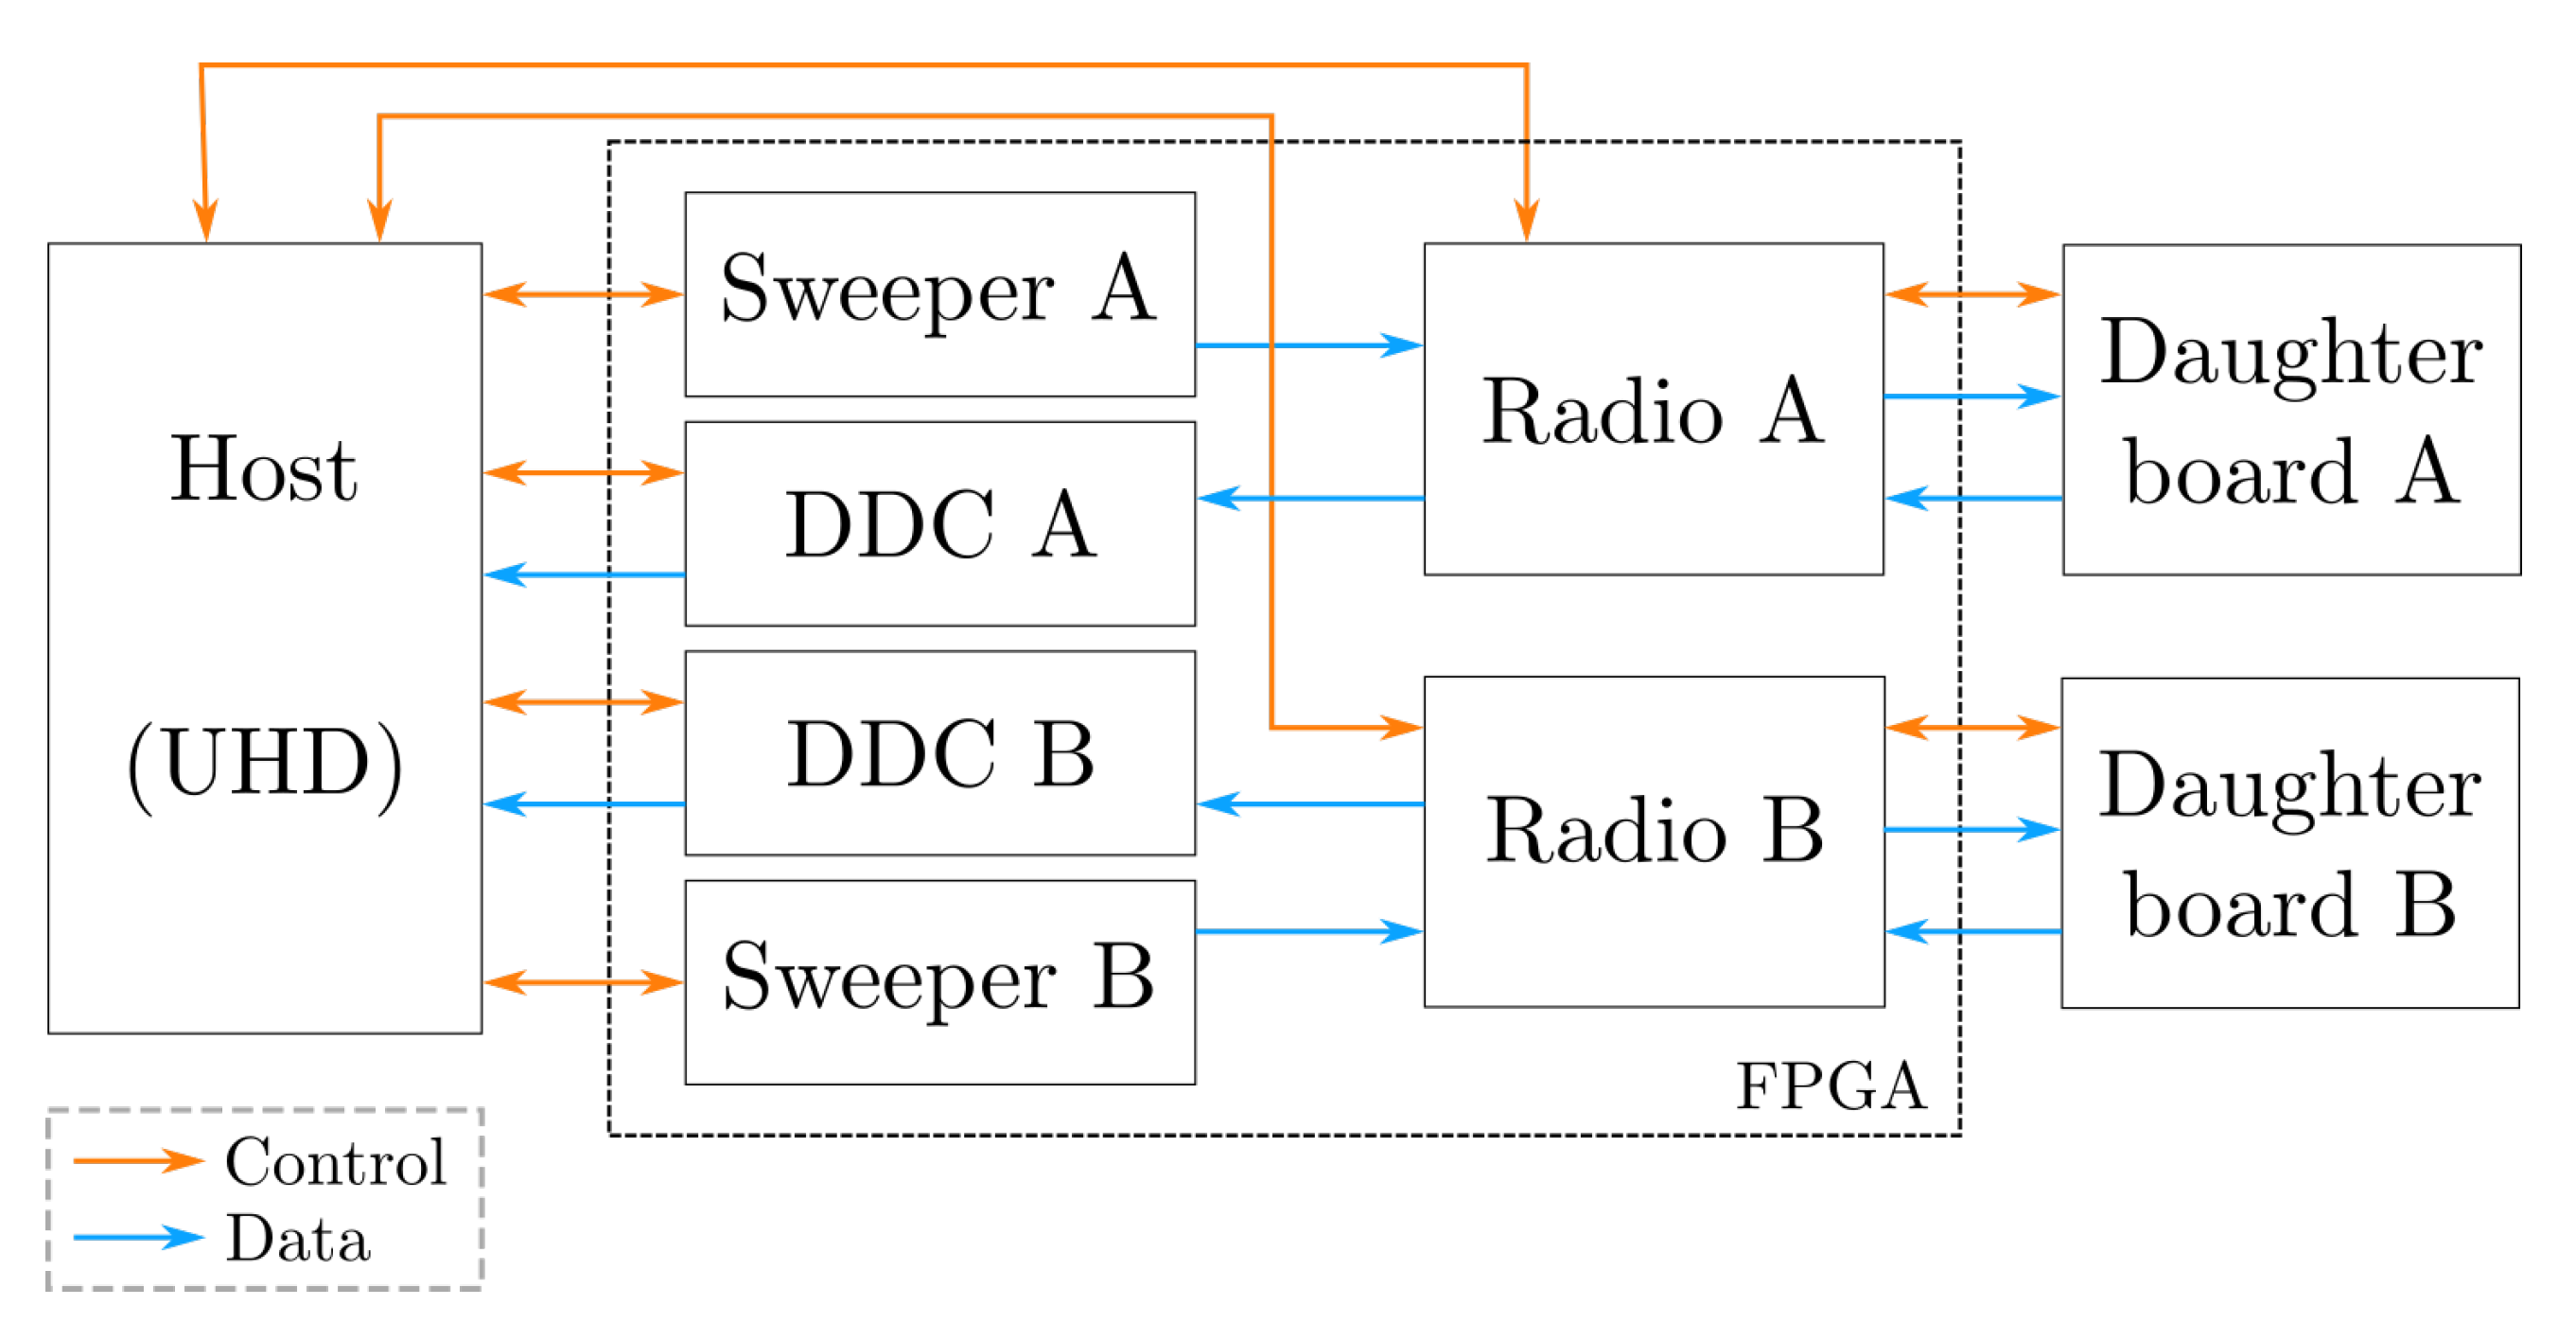
The implemented GBSAR system consists of a coherent transmit-receive unit mounted on a linear rail. The radar core includes a software defined radio (SDR) and an external front-end employed for frequency extension, filtering, frequency modulated continuous wave (FMCW) deramping and transmit-receive leakage mitigation. The linear unit consists of a robust steel rail and a control system comprising a servomotor, a motor controller and an Ethernet switch that provides a single interface for both the SDR and the motor controller. An external host computer commands all movements and all radar unit operations. It also stores the received data for further processing and image generation.
Figure 1 shows a high level diagram of the system.
2.2.1. SDR
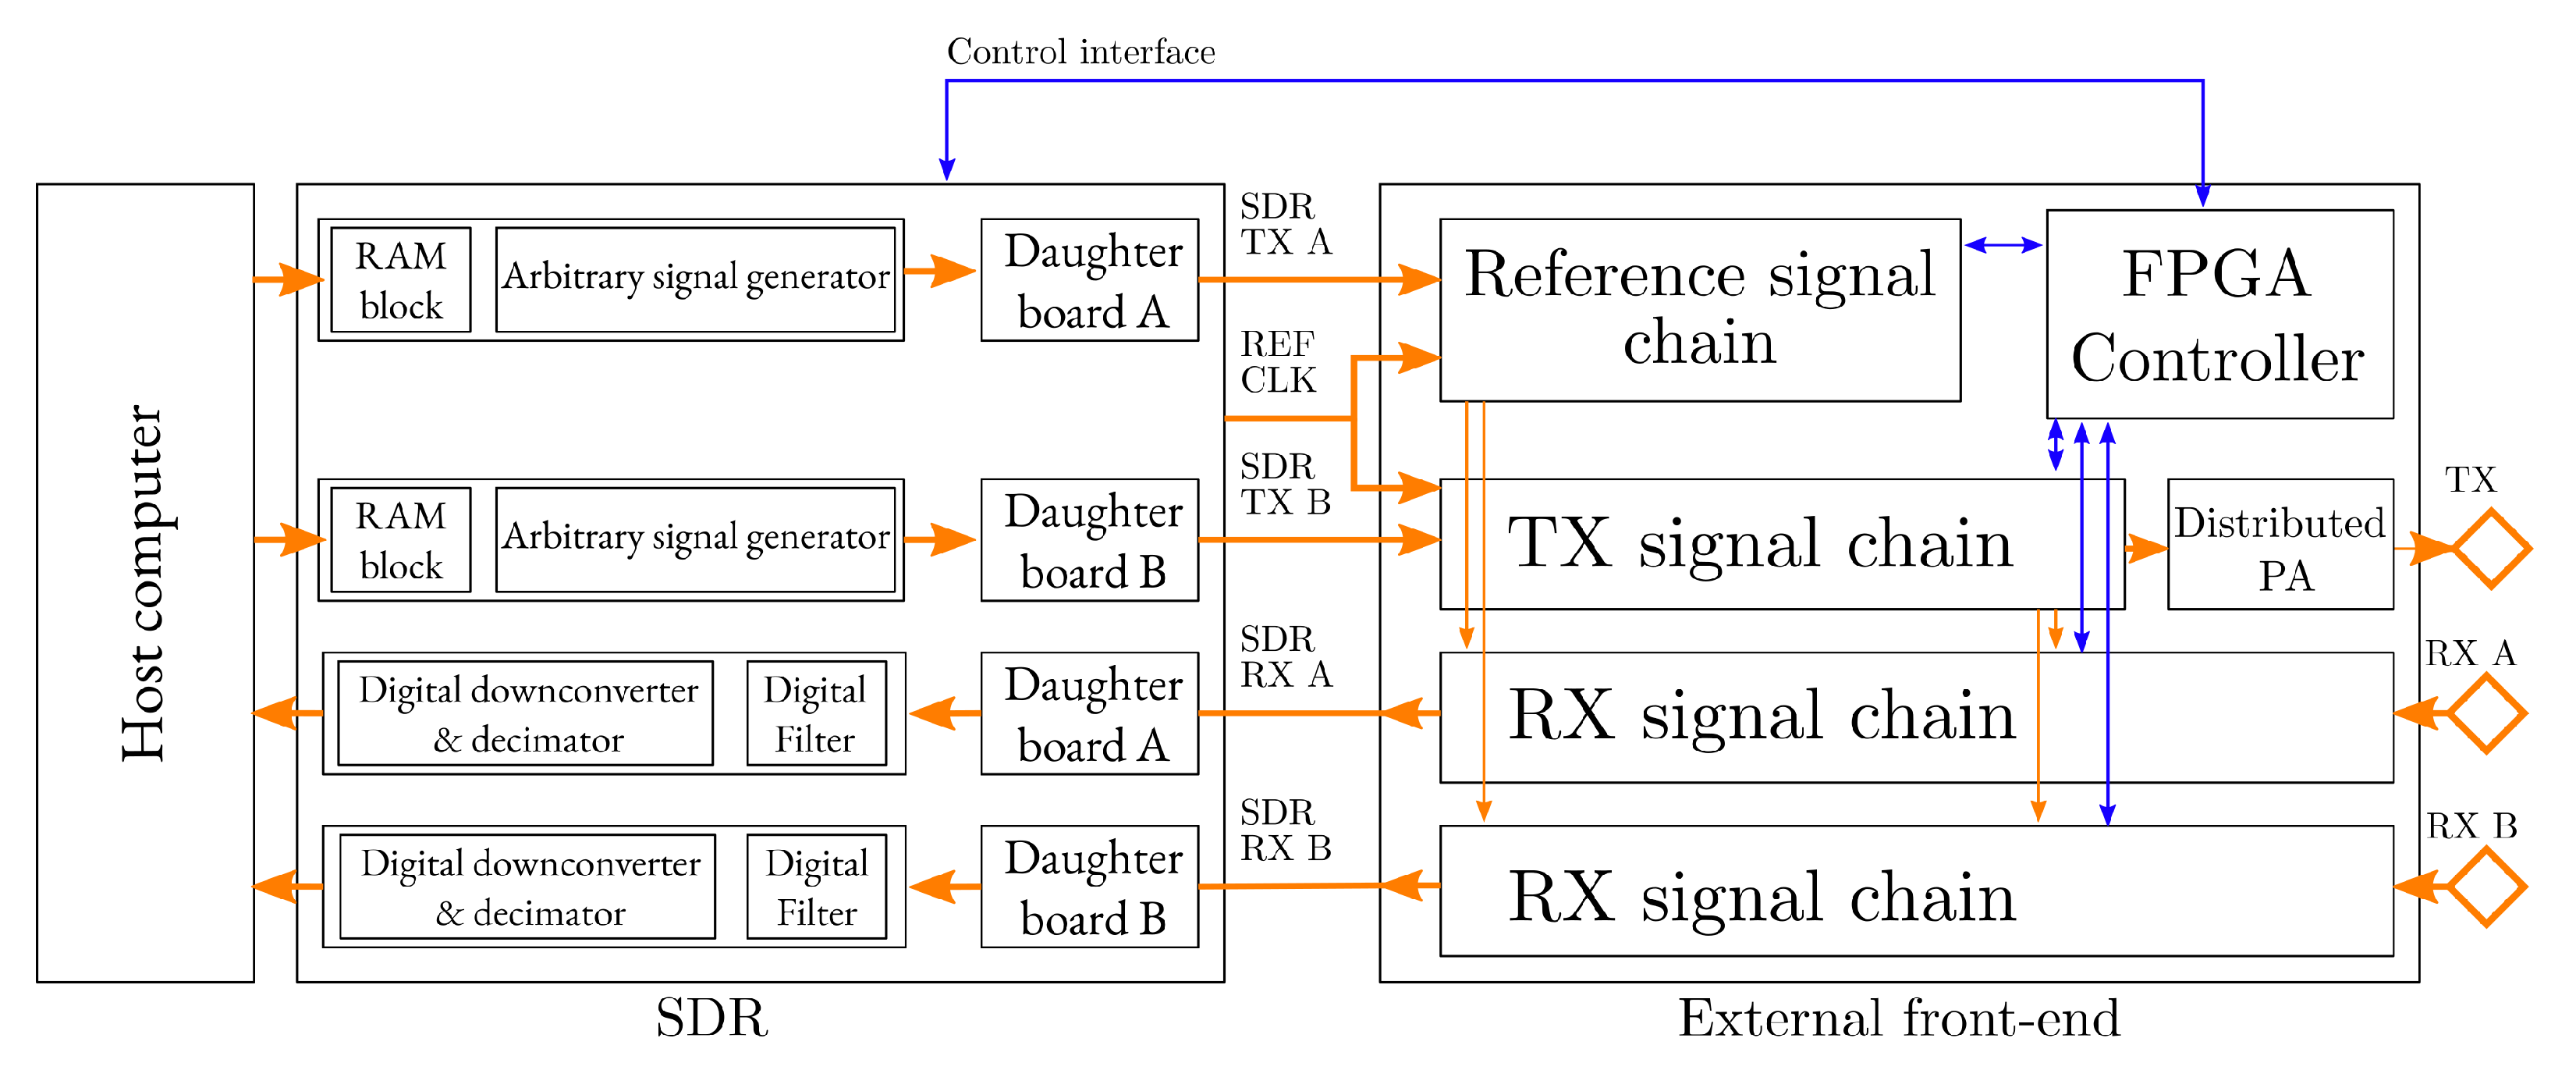
The SDR is the core of the system. It supplies signal generation, sampling, digital processing and interfacing with other devices. It has to be noted that the concept of SDR may be ambiguous in some instance due to the diffuse frontier that determines the necessary amount of physical software functions required to catalog a system as an SDR.
Figure 2 shows the processing chains implemented in the SDR. The transmitted signal is generated in software and loaded in a random access memory (RAM) block in the FPGA for full sampling rate transmission. On the receiver side, the signal is digitally filtered and decimated before being sent to the host computer for further processing.
When choosing an SDR from the available options, various aspects such as price, number of channels, processing power, transmission and receiving sampling rates and hardware interfaces, among others, play determinant roles. The most determinant aspects that conditioned the decision were the data interface throughput, a flexible processing system with enough room for experimentation and open source code.
A product that fits these requirements is the USRP X310 SDR from Ettus Research. The reasons to use this device were its powerful field programmable gate array (FPGA), its allowing experimentation and its ability to interchange the analog front-ends.
The internal SDR RF front-ends, commonly called daughter-boards, play an important role in the overall performance. The UBX-160 daughter-board from Ettus Research was employed. The UBX-160 board is a Zero-IF transceiver with complete RF front-ends providing carrier frequencies up to 6 GHz, with an RF bandwidth of 160 MHz.
2.2.2. RF Front-End
In order to extend the capabilities of the UBX-160 daughter-boards and implement FMCW analogue deramping, an external front-end has been implemented. It was designed with the requirements stated in
Section 2.1, and with a special emphasis on flexibility. Note all analog processing could be implemented in a single front-end, and the daughter-boards may be removed in the future. A simplified diagram is shown in
Figure 2. The roles of the front-end are:
Provide frequency extension to X-band.
Amplify the transmit and receive signals.
Implement analog FMCW.
Reduce the transmit-receive leakage.
Limit the signal power to avoid damaging the SDR ports.
The front-end assembly consists of a transmit chain, a reference signal chain and two receive chains to allow simultaneous receiving capability for dual polarization or dual baseline interferometry. Nevertheless, due to practical issues, this publication deals only with VV polarization. The front-end is designed to operate in P, L, C and X-bands and provides a mitigation scheme for transmit-receive leakage inspired by Edwards [
32]. Both receive chains are identical; and the transmit and reference chains are similar, differing in the presence of a distributed power amplifier covering frequencies from DC to 12 GHz, and the transmit signal sampling for calibration. It also includes a self observation path to track changes in system gain and phase. For coherent operation, all tones used for up-conversion are derived from the same reference from the USRP X310.
The transmit chain consists of a broadband up-conversion mixer, a frequency synthesized, a switched filter bank and broadband signal drivers, that feed the power amplifier. A resistive coupler samples the transmit signal used to feed the deramping mixers and to use it in system calibration procedures. The receive chain consists of a broadband LNA, deramping mixers, signal drivers and power limiters to avoid damaging the SDR.
The configuration state of the front-end is controlled via the USRP Hardware Driver (UHD) through the General Purpose Input Output (GPIO) signals connector in the USRP X310. A small FPGA receives commands from the SDR and is used mainly as an Input-Output (IO) expander to control the state of RF switches and the power state of components. The switches are used to implement filter banks, bypassing certain components or selecting specific RF sub-chains for each frequency configuration.
2.2.3. Antennas
The antennas of a GBSAR system play an important role in determining the area coverage and the maximum range that can be imaged.
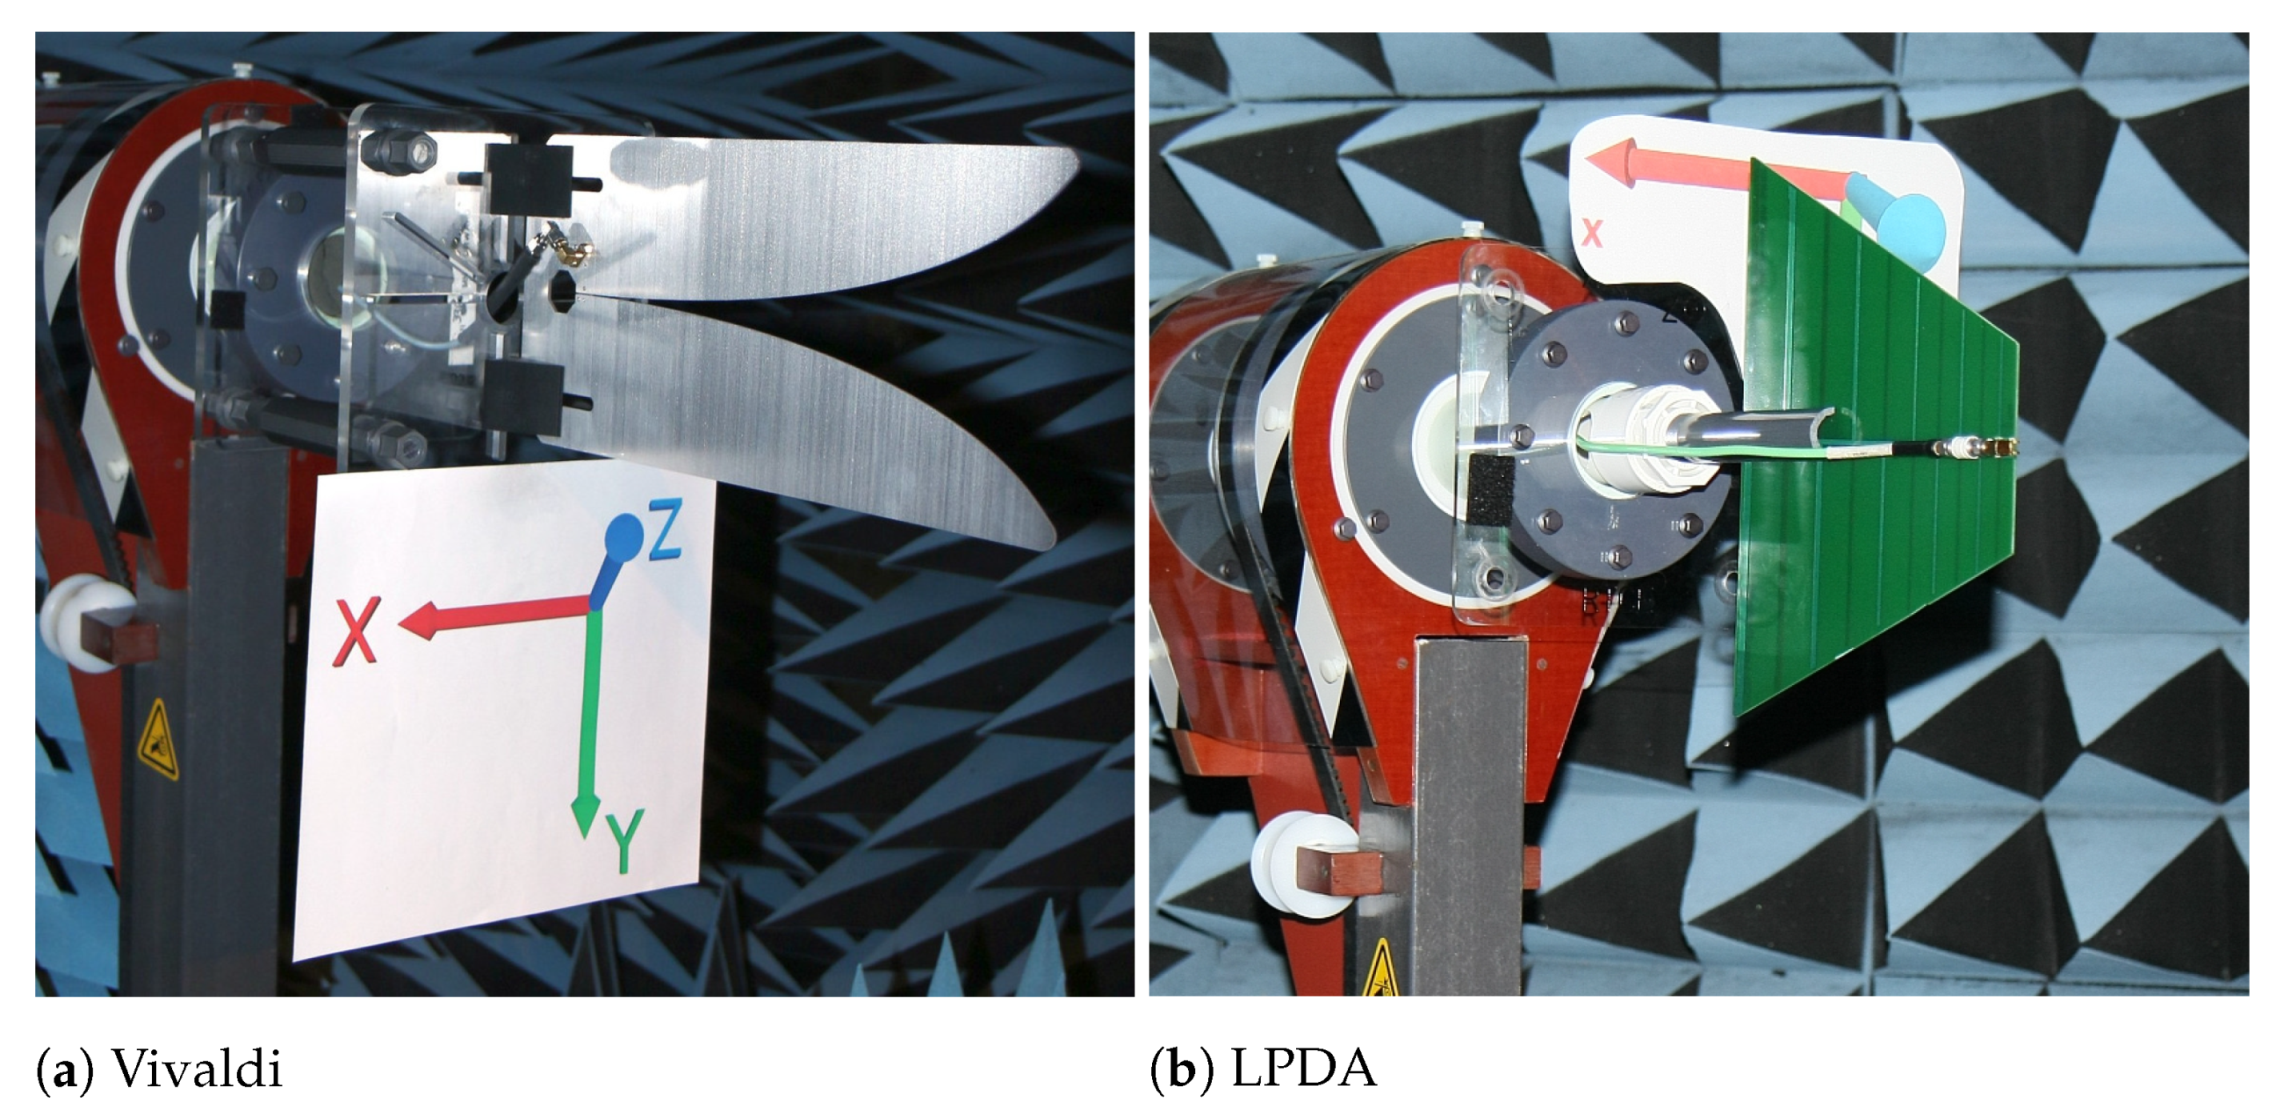
Two antennas were selected. The first one covers the L, C and X-bands, and consists of a wide-band Vivaldi tapered slot aluminum antenna and can be seen in
Figure 3a. It covers the full range between 675 MHz and 11 GHz. The second antenna, which covers the P-band and is implemented on a PCB substrate, is a log-periodic antenna covering the 400 MHz– 1000 MHz range. This antenna is shown in
Figure 3b.
Both antennas were selected for its low cost and readily available anechoic chamber polar test data. The polar gain plots of both antennas are shown in
Figure 4. If the antennas are operated in a vertical polarization configuration, the
cut corresponds to the gain over azimuth.
2.3. Zero-IF Impairments’ Effects on the Radar Signal
The non-ideal effects of the Zero-IF architectures, present in the majority of SDR front-ends, cannot be ignored when considered in a radar, especially in an FMCW system. The unbalancing effects of the Zero-IF architecture are the origins of two spurs: the carrier leakage and the image frequency [
33]. Typically, this imbalance can be calibrated at a certain frequency. However, classical calibration methods are narrow-band, and any departure from the calibration frequency is accompanied by a degradation in spur cancellation. There are wide-band methods that compensate the imbalances in a wider range of frequencies, but require more complicated calibration procedures.
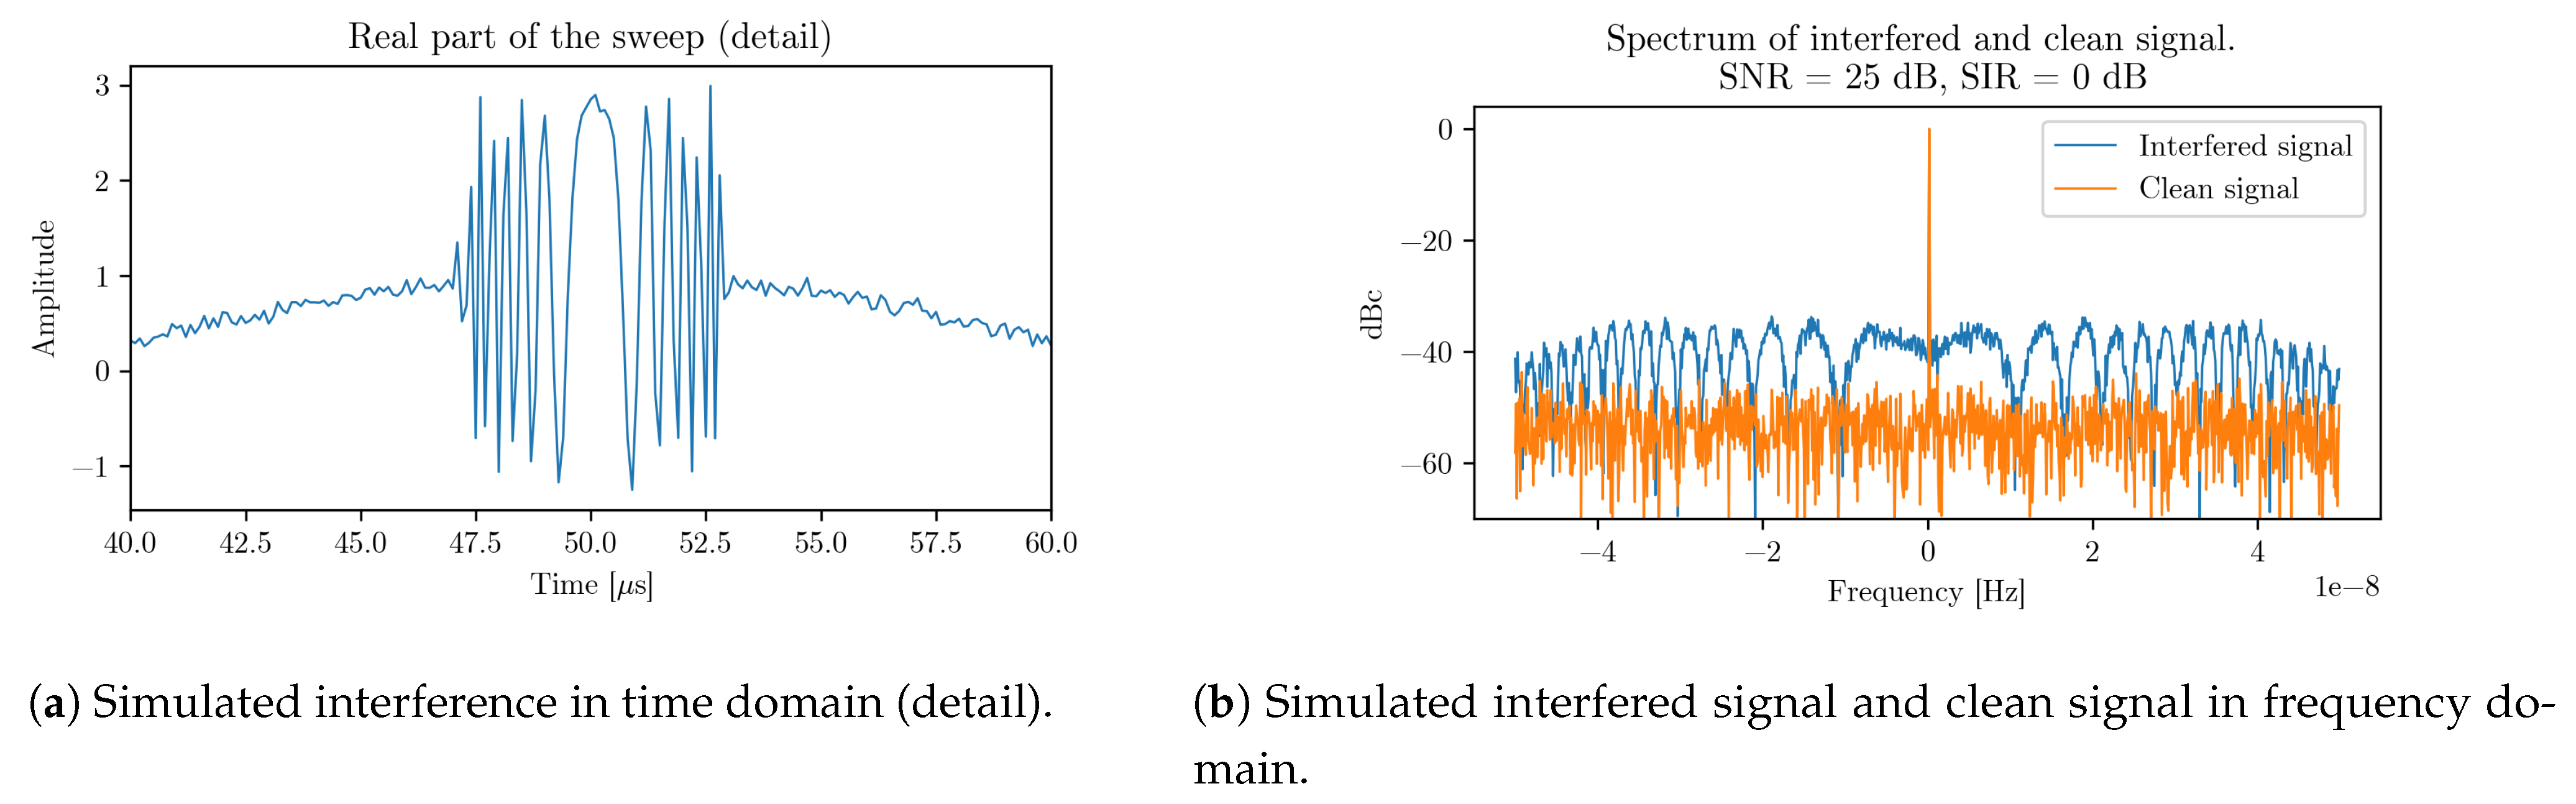
The signal at the RX port is a sum of the signal scattered to the scene and the direct leakage signal from TX. The leakage signal spurs, after deramping, are band-limited frequency sweeps and can mask the much weaker scattered signal.
As can be seen in
Figure 5b, the degradation of the noise floor is notable. The interference power cannot be reduced by coherent averaging, such as white Gaussian noise (WGN), because the interference is coherent along sweeps. A possible alternative to reduce the interference power would be to use a sweep spanning only a portion of the upper or lower side-band. This option has the drawback of reducing the range resolution. In order to avoid the degradation in range resolution, an alternative method that preserves the bandwidth has been implemented. This method consists of a model-based extrapolation of the beat frequencies in the STFT domain. The method description and implementation is presented in Neemat [
34]. The spur seen in
Figure 5a is zeroed and the missing data segment is filled with interpolated data, following a model of the FMCW radar signal. An advantage of this method is that the spur is eliminated completely while avoiding the side-lobe level degradation that would appear by only blanking the spur.
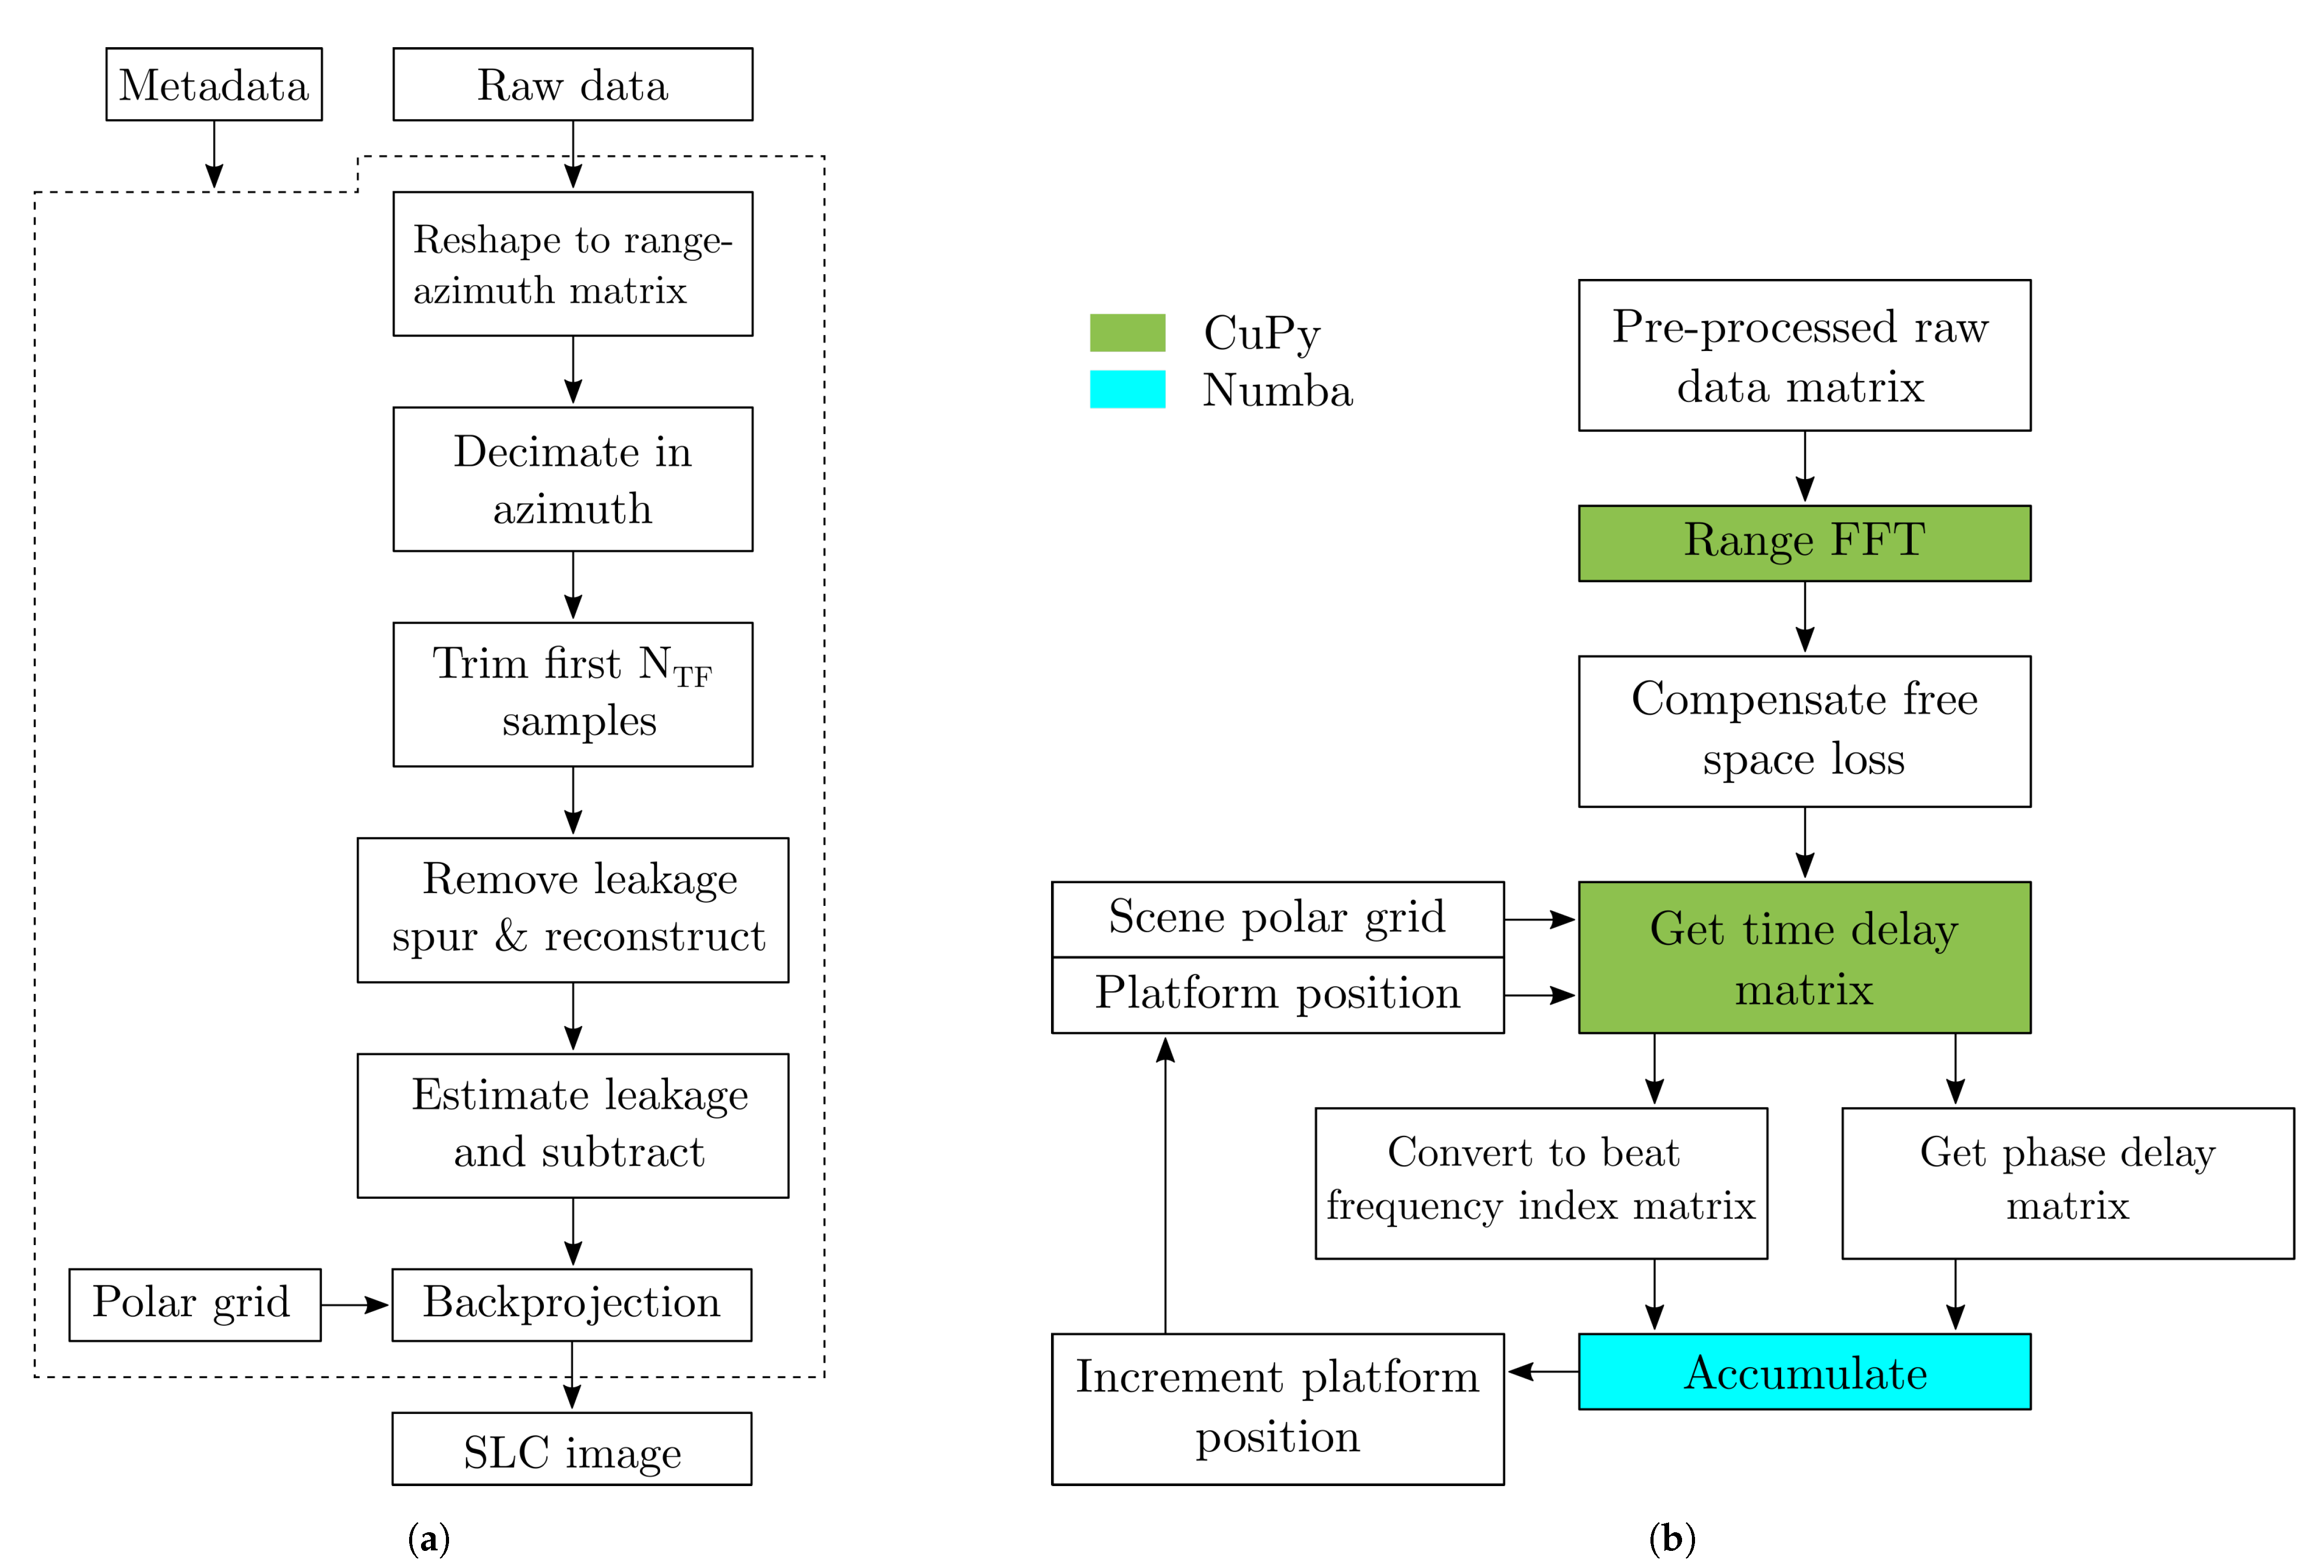
2.4. Digital Implementation
The high level implementation of the digital radar core can be seen in
Figure 6 and is implemented on top of an RF Network-on-Chip (RFNoC) architecture in the SDR FPGA. The radar core consists of two sweep generators implemented via RAM block signal players, which are programmed by the host. The transmitted signal is generated at full rate and sent directly to the radio core block, which is in charge of signal transmission and reception to and from the SDR daughter-boards. The deramped signal is sampled at full rate and is filtered and decimated by a DDC block. The output of the DDC block is connected to a stream endpoint which sends the data to the host computer.
The signal generation scheme implemented in this design is one of the innovations with respect to previously SDRadars reported in the literature (a notable exception is the paper by Prager [
35], which presented the same idea at the same time it was being implemented in the present work). The reason for generating the signal inside the FPGA instead of generating it in the host computer, as done in most cases in SDR systems, was to take full advantage of the transmitting bandwidth, avoiding the throughput limitations imposed by the physical link between host and the SDR, and being able to easily generate the transmit signal in software. Generating the transmission signal in software has the benefit that the chirp parameters can be very easily varied and that pre-distortion can be easily implemented to compensate for system non-linearities.
The radio cores interface with the ADC and the daughter-boards and are in charge of configuring the daughter-boards, managing the transmit and receive stream, and implement In-phase and Quadrature (IQ) imbalance correction through pre-distortion.
Finally, the DDC blocks perform digital down-conversion, decimation and digital frequency shifting at the same time.
2.5. Processing Chain and Instrument Control
2.6. Operational Modes
The system can operate in three basic modes. The most basic one is the real aperture mode, in which the radar unit does not move and only range discrimination can be performed. The second one is the stop-and-go mode, in which the radar unit moves along the rail stopping at each sampling position for SAR operation. The last one is the on-the-go mode, in which the radar unit does not stop and performs a continuous sampling along the rail. The image formation algorithms for the stop-and-go and on-the-go mode are slightly different, and each mode provides its own advantages. The stop-and-go mode is easier to process, provides more control on the total acquisition time and is able to deliver pre-averaged data, while the on-the-go mode is much less sensitive to atmospheric and de-correlation effects.
3. Measurement Campaigns and Results
Throughout the development of the system, extensive testing has been part of an agile design cycle. Small and progressively more complex tests have been carried out to validate different aspects of the GBSAR operation, such as signal generation, acquisition, RFI, leakage cancellation and image formation, among others. A sample of multi-frequency results is shown in this section.
3.1. Muntanya Rodona
One of the first test sites is located in the Muntanya Rodona area, in Subirats, south of Barcelona (Spain). It was chosen for its proximity to the company facilities, its easy accessibility and the presence of man-made targets such as buildings and other urban structures, which allowed for a fast assessment of correct synthetic image formation. The results presented here represent the two last iterations performed on this site.
The main objective pursued in this test campaign was to reach a system maturity point that ensured its robust operation in future campaigns. This objective can be divided in smaller milestones:
To ensure the reliable operation of the RF front-end, SDR and the linear unit.
To automate most software procedures and system configuration, while ensuring the reliability of the software.
To test the on-the-go acquisition mode.
To perform a qualitative assessment of the characteristics of measurements done at all frequencies.
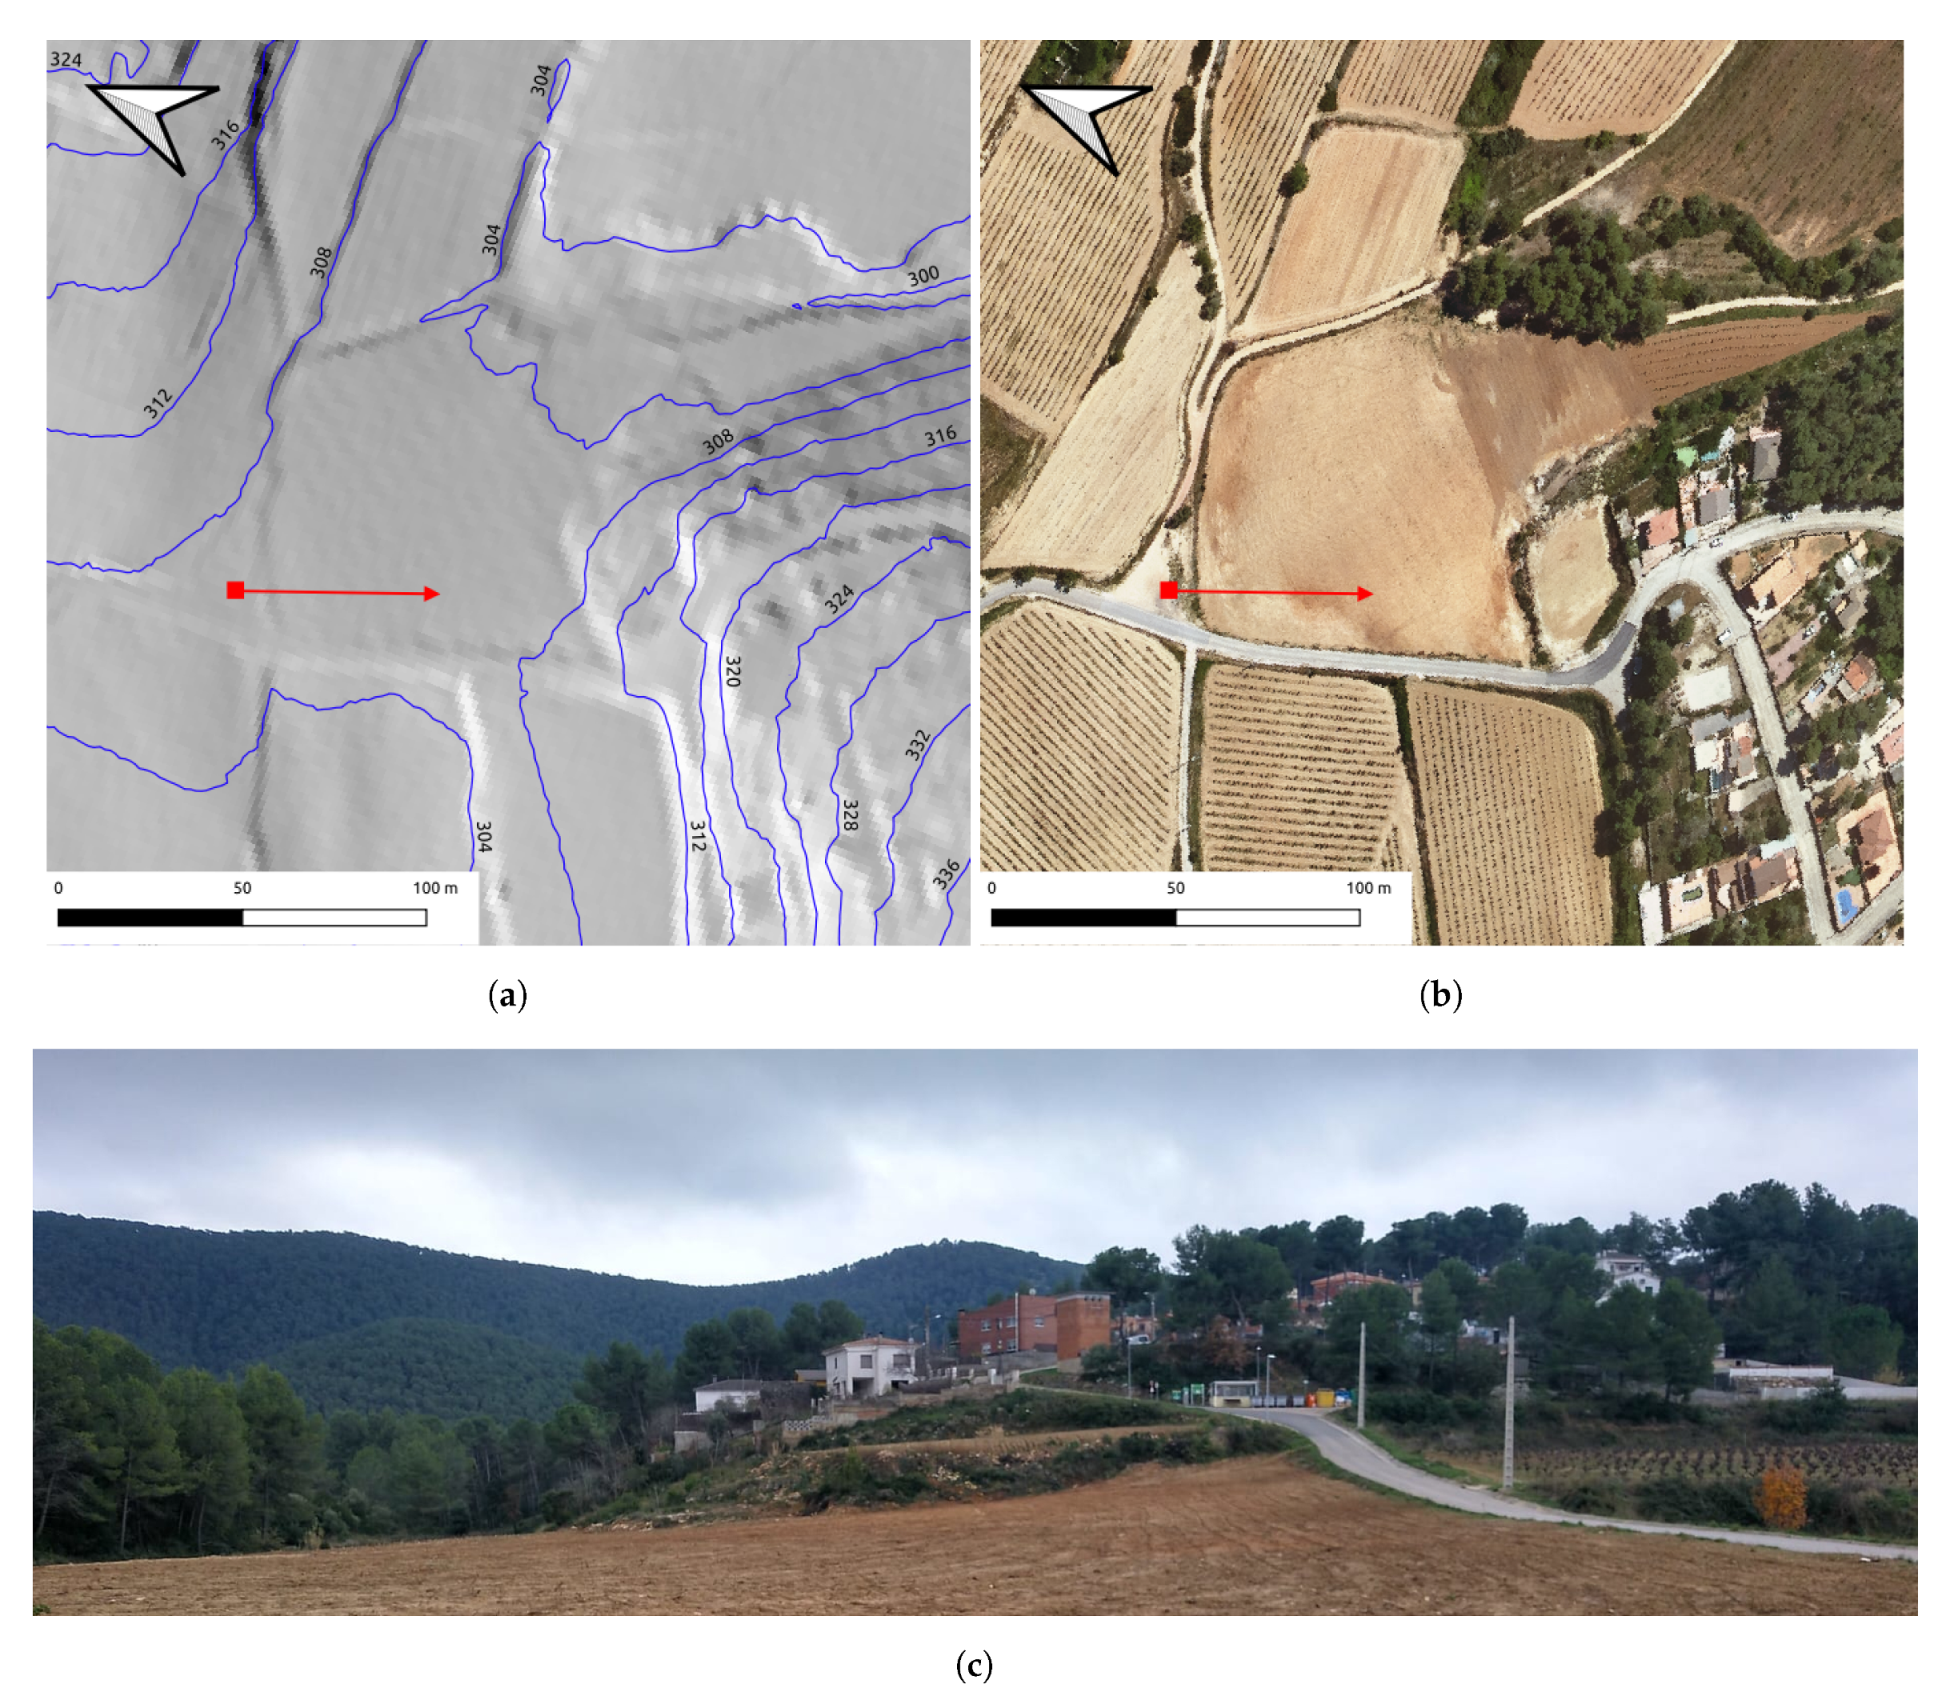
In all the cases, the radar was located at 41°22′41.6″N 1°49′00.7″E; see the urban area as shown in
Figure 8b. The urban area is on top of a small hill, with a maximum approximate elevation of 36 m with respect to the radar location as can be seen in
Figure 8a. The targets imaged lie within a range from 100 m to 200 m. The scene can be seen from the radar point of view in
Figure 8c. A small corner reflector was placed at 100 m range, approximately. Although stop-and-go and on-the-go acquisitions were performed in the first measurements, all results presented from now on were acquired using the on-the-go mode. The reason for this is that once the on-the-go mode processing was operational, the stop-and-go mode was deemed inferior in all aspects, the acquisition time being the worst one in practical terms.
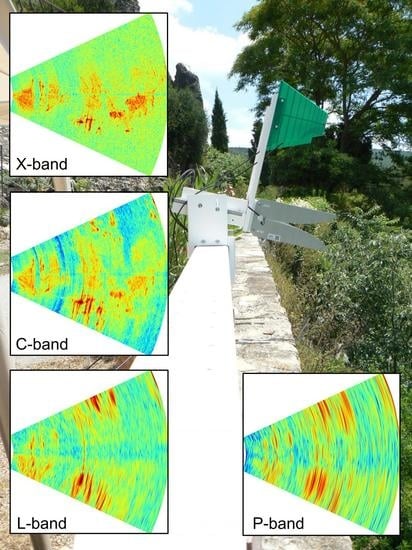
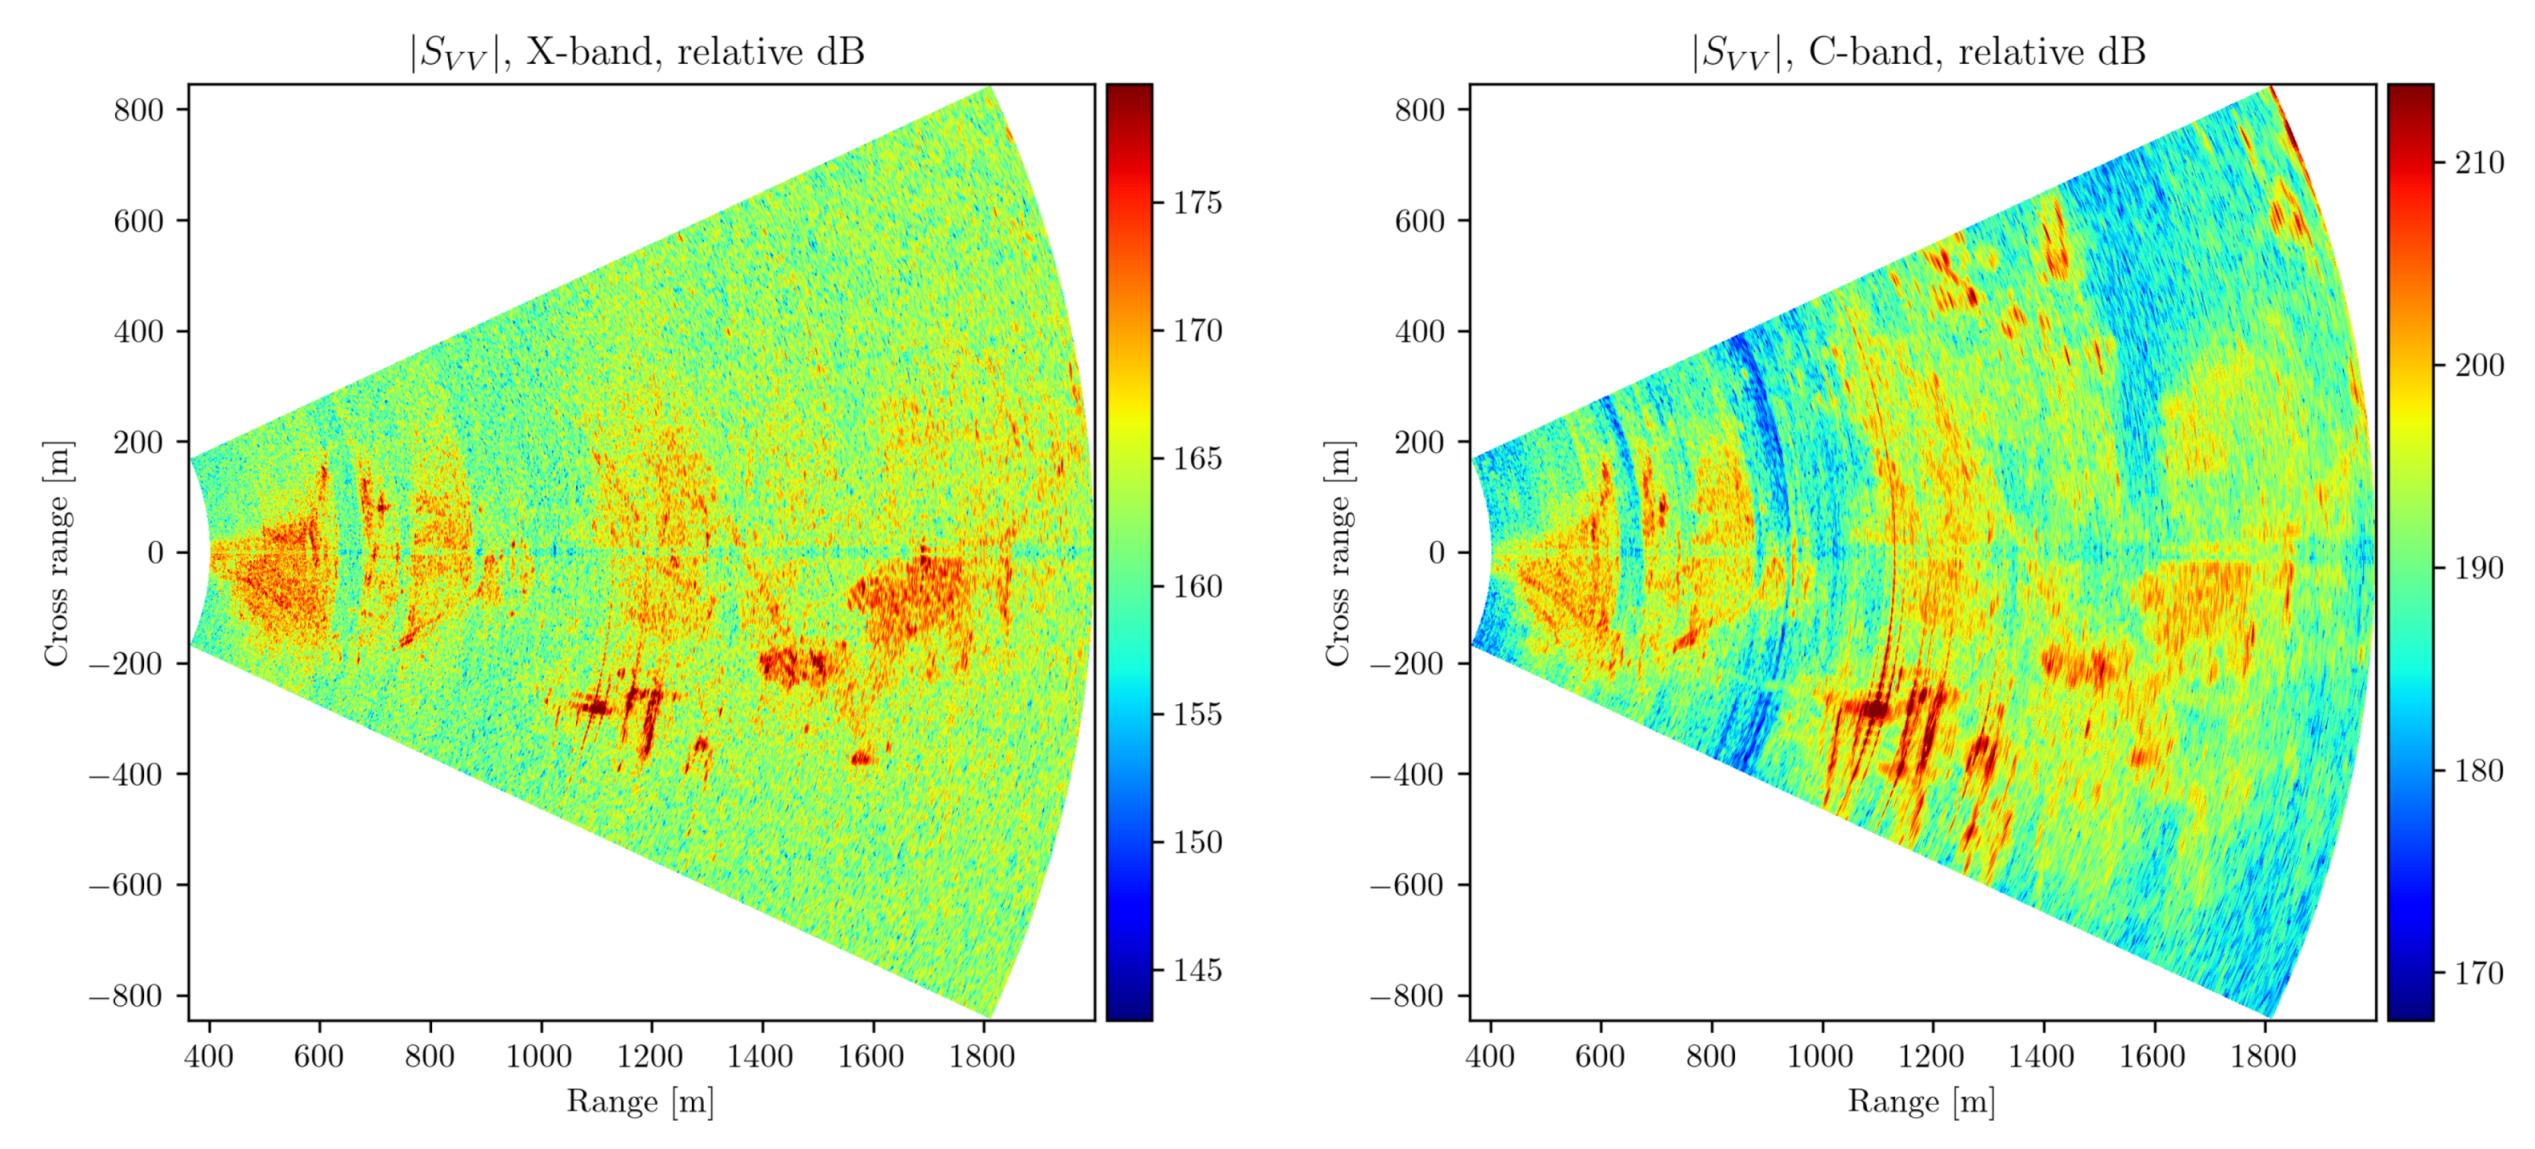
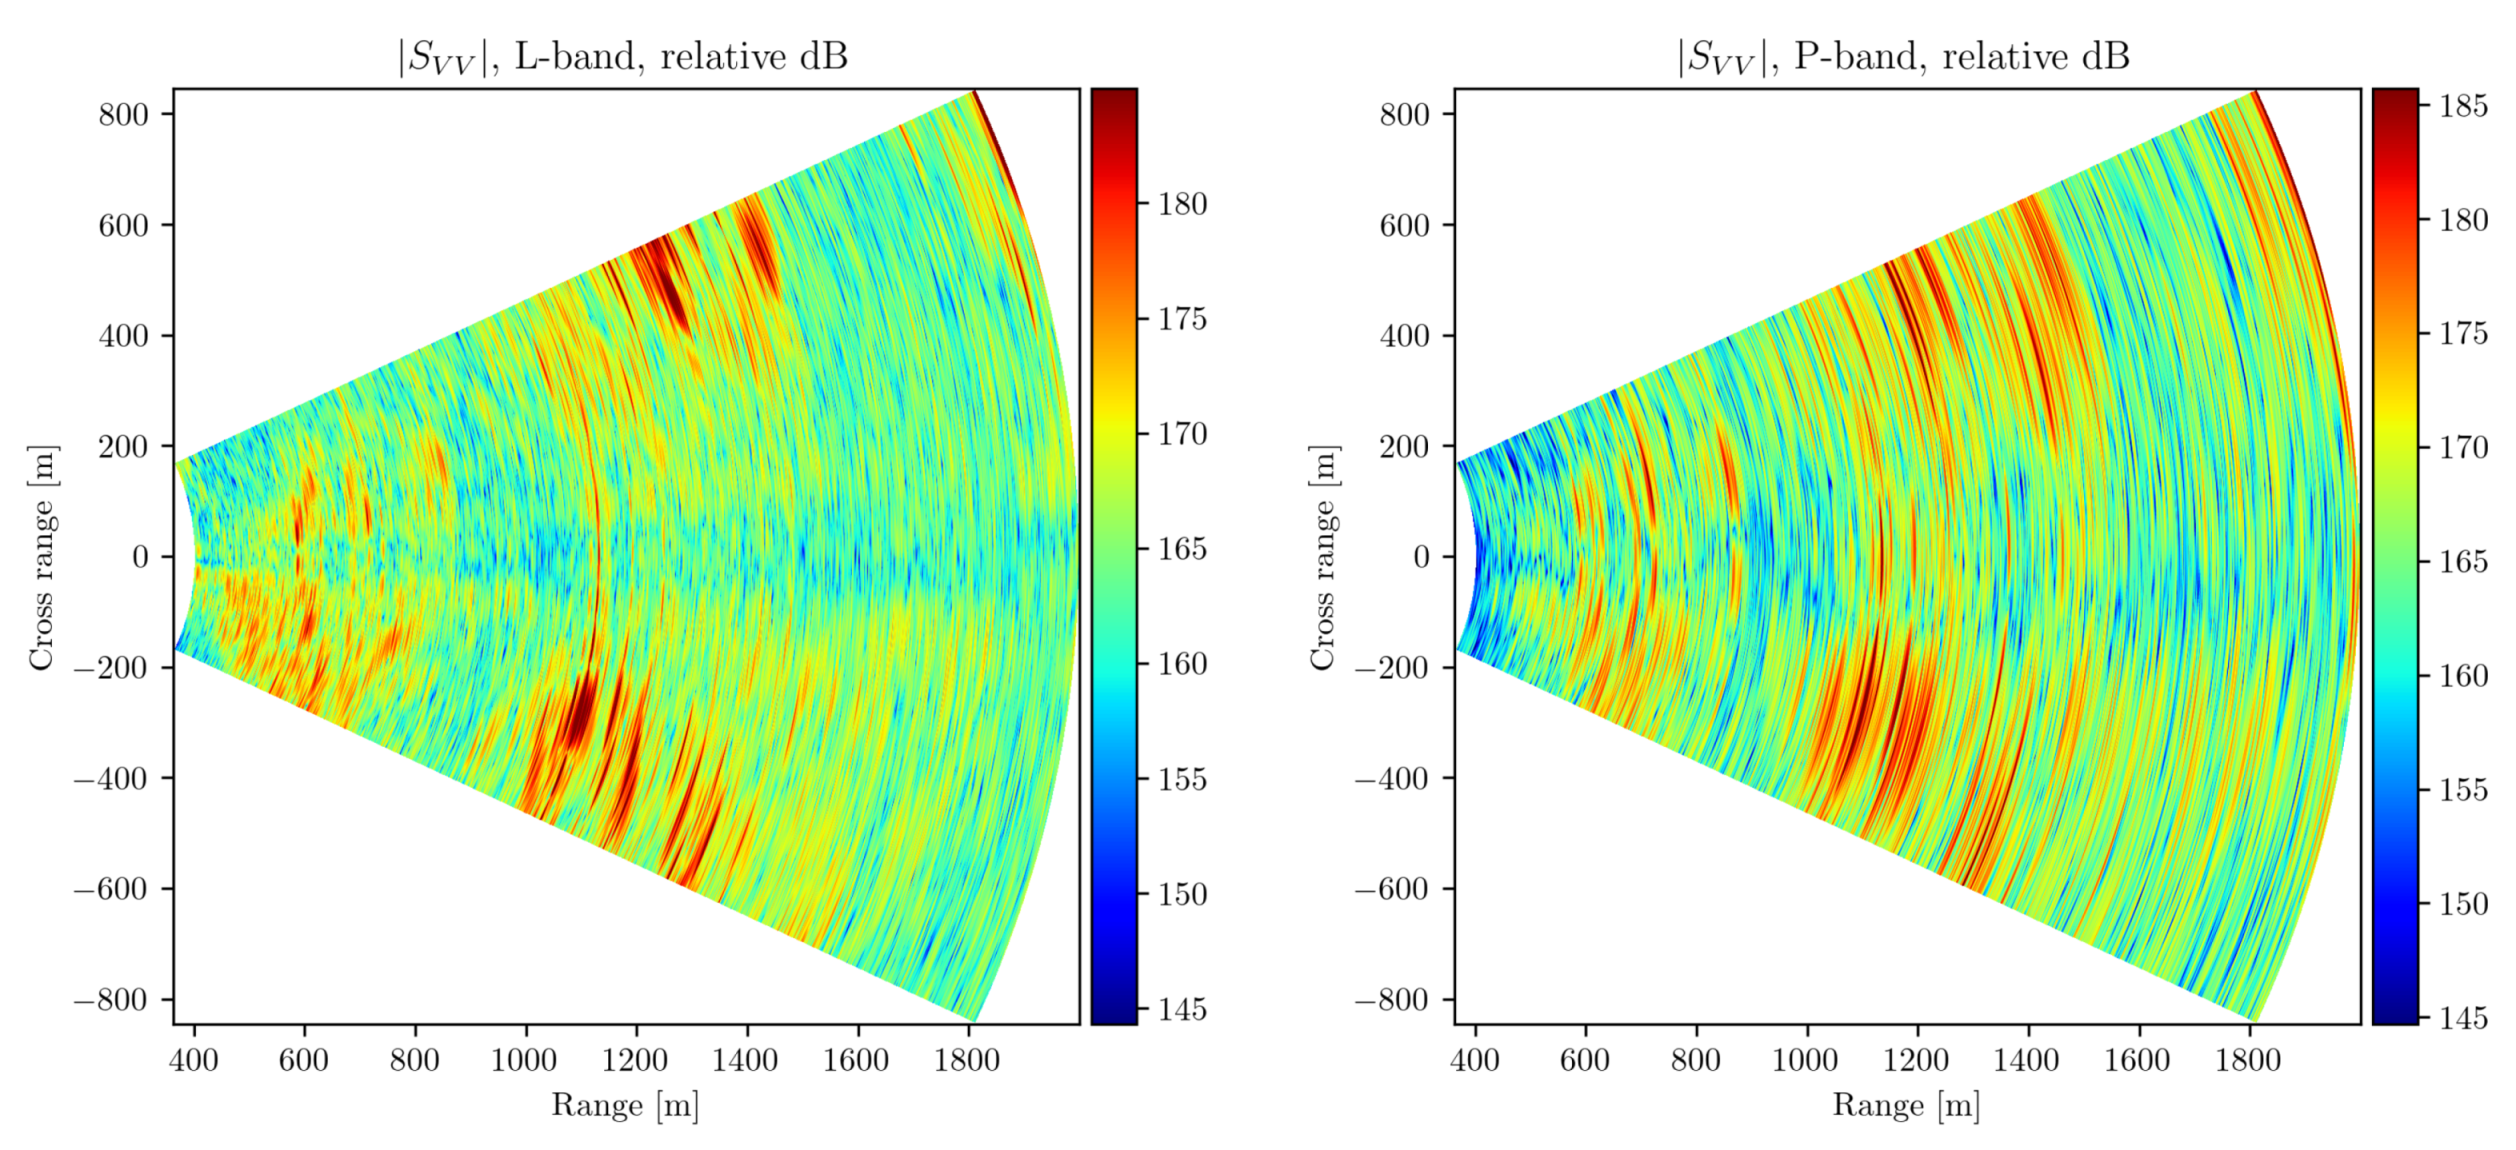
The logarithmic power Single Look Complex (SLC) images can be seen in
Figure 9. From these, a qualitative assessment can be done about the characteristics of each band. The first effect to note is the evident loss of resolution, which worsens progressively as the frequency decreases. At X- and C-bands, the resolution is high enough to be able to correlate the orthophoto from
Figure 8b with the radar images, the buildings and the staggered geometry of the terrain being the most distinctive features. At L-band, this correlation is more difficult to observe, while at P-band the shape of the scene is lost. The second effect to note is the progressive broadening of the illuminated scene, consistent with the broadening of the antenna beam patterns shown in
Figure 4b–d. Another relevant aspect is the superior vegetation penetration characteristics in L and P-bands, as can be seen, for example, at coordinates (170,−70). Additionally, a noticeable aspect is the dimming of the reflector as the frequency decreases, an effect of the decrease of the reflector radar cross section (RCS), combined with its smaller contribution within a bigger pixel.
3.2. Castell de Subirats
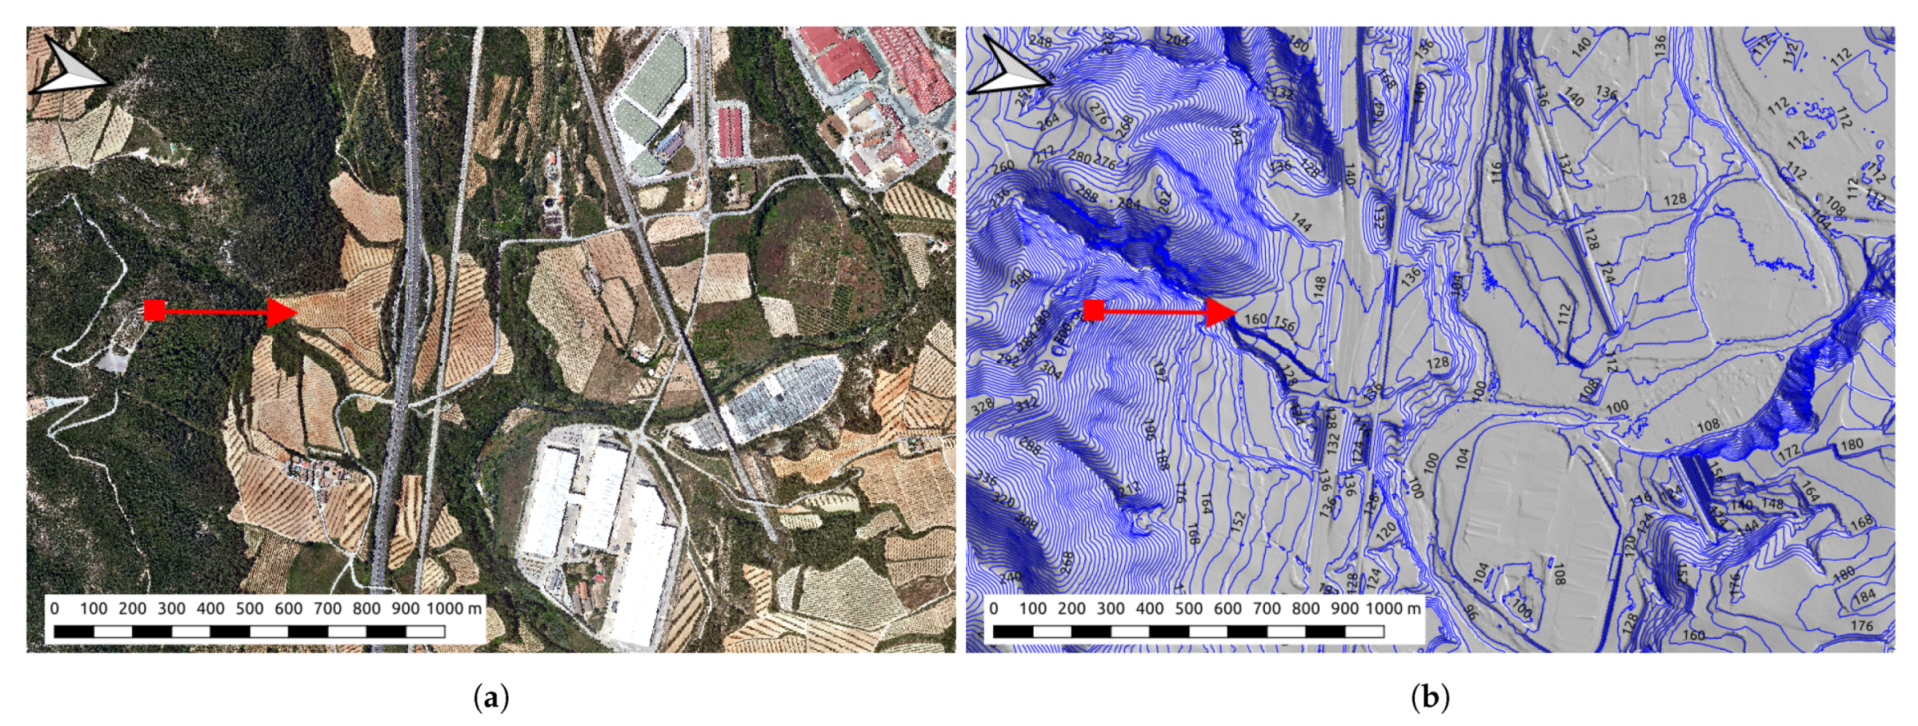
The second batch of tests was done in the Subirats Castle in Subirats, south of Barcelona (Spain). These tests were aimed at performing more advanced tests that consisted on the generation of multi-frequency images of big areas.
The northern view from the Subirats castle is diverse. A speedway, various roads, industrial buildings and a high speed train bridge can be seen, combined with vineyards and other vegetated zones. The radar was located at 41°24′59.0″N 1°48′59.5″E, at an altitude of 285 m above sea level. As a reference, the height difference between the radar and the speedway is 146 m. An orthophoto and its corresponding elevation map are shown in
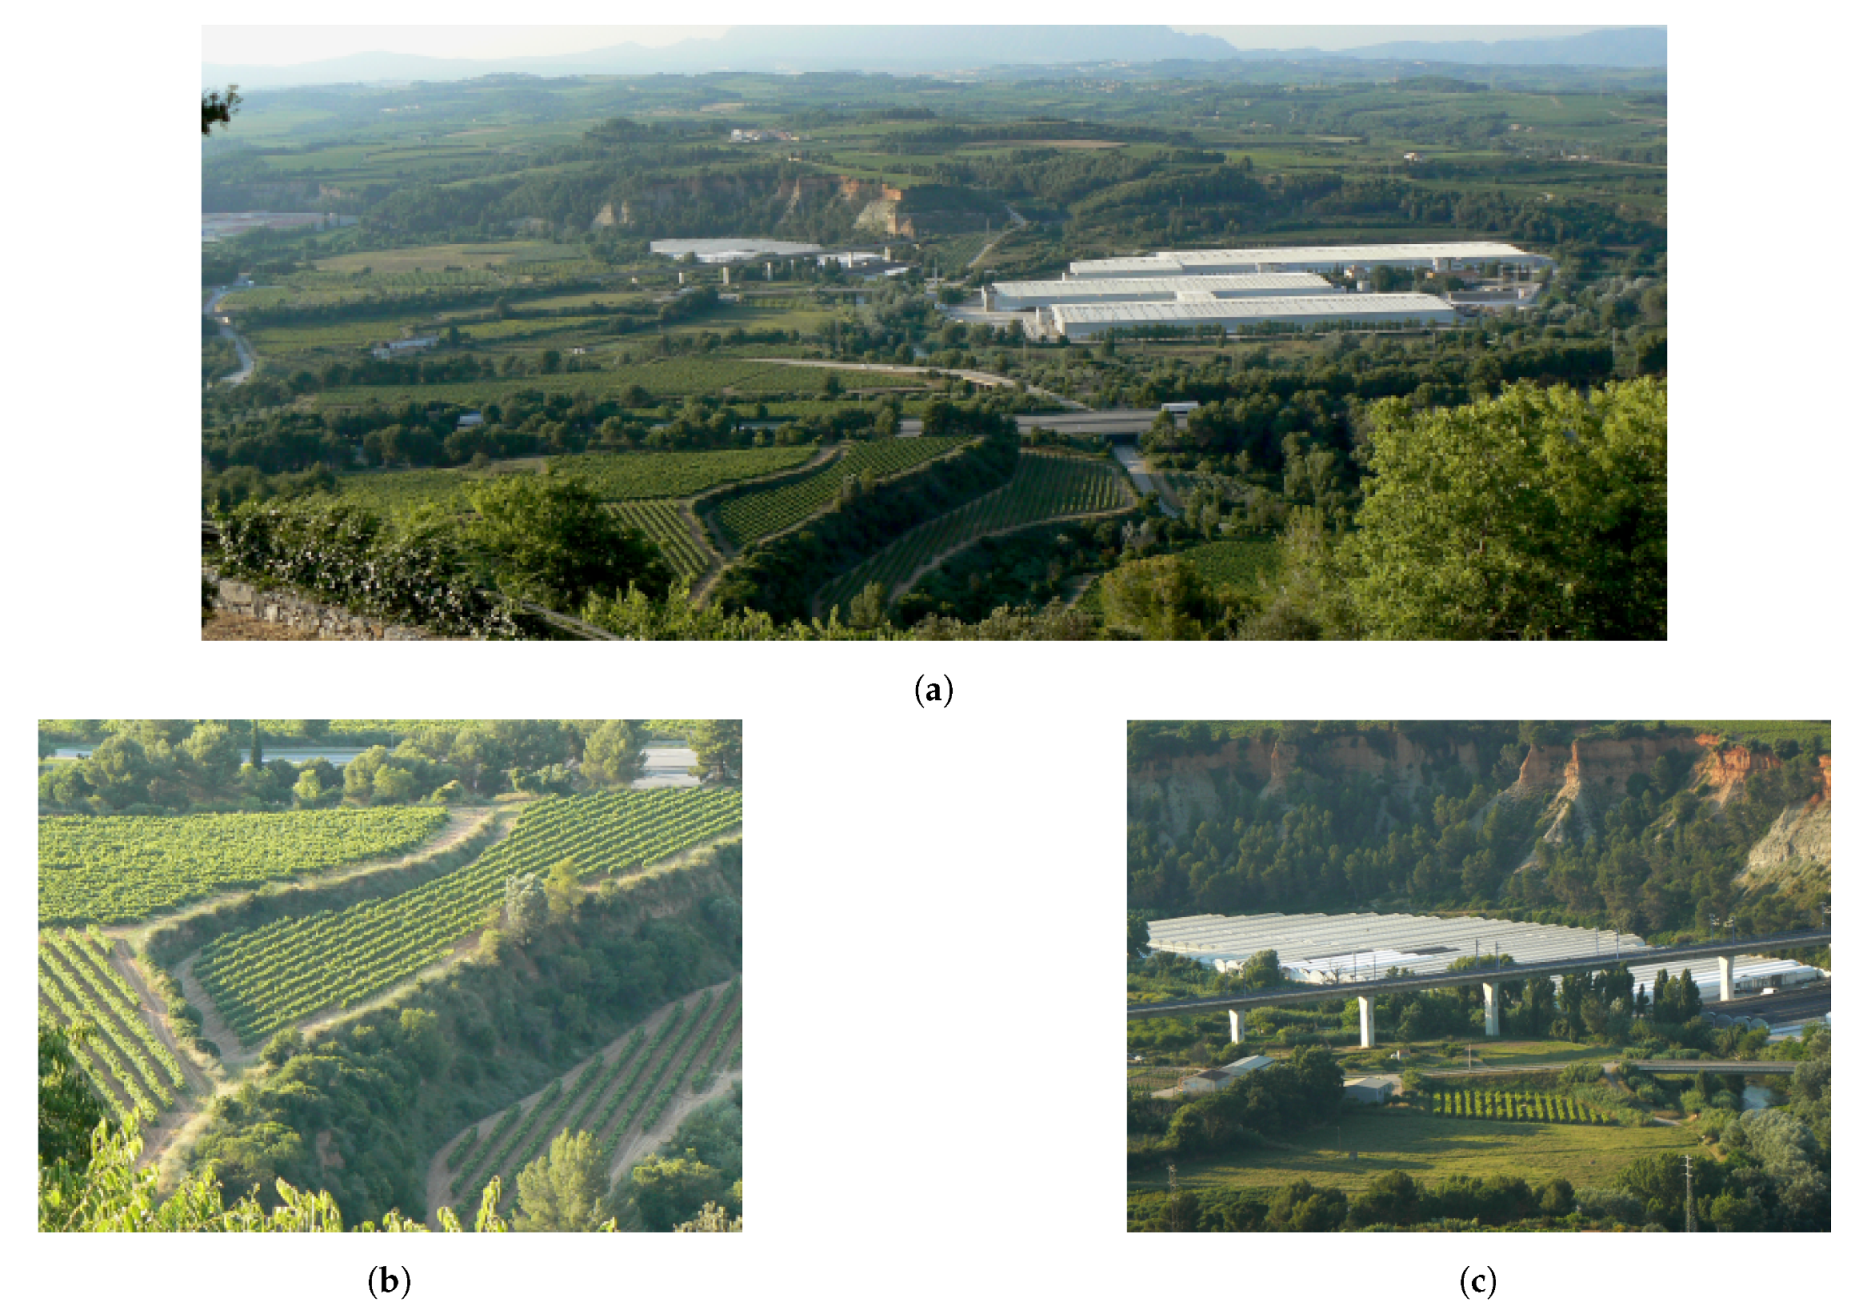
Figure 10. The radar was configured to image an area between 200 m and 2 km. Only two images were taken in each band. The objectives of this test were the same as at the second test site, but in this case the imaged area was more diverse. In
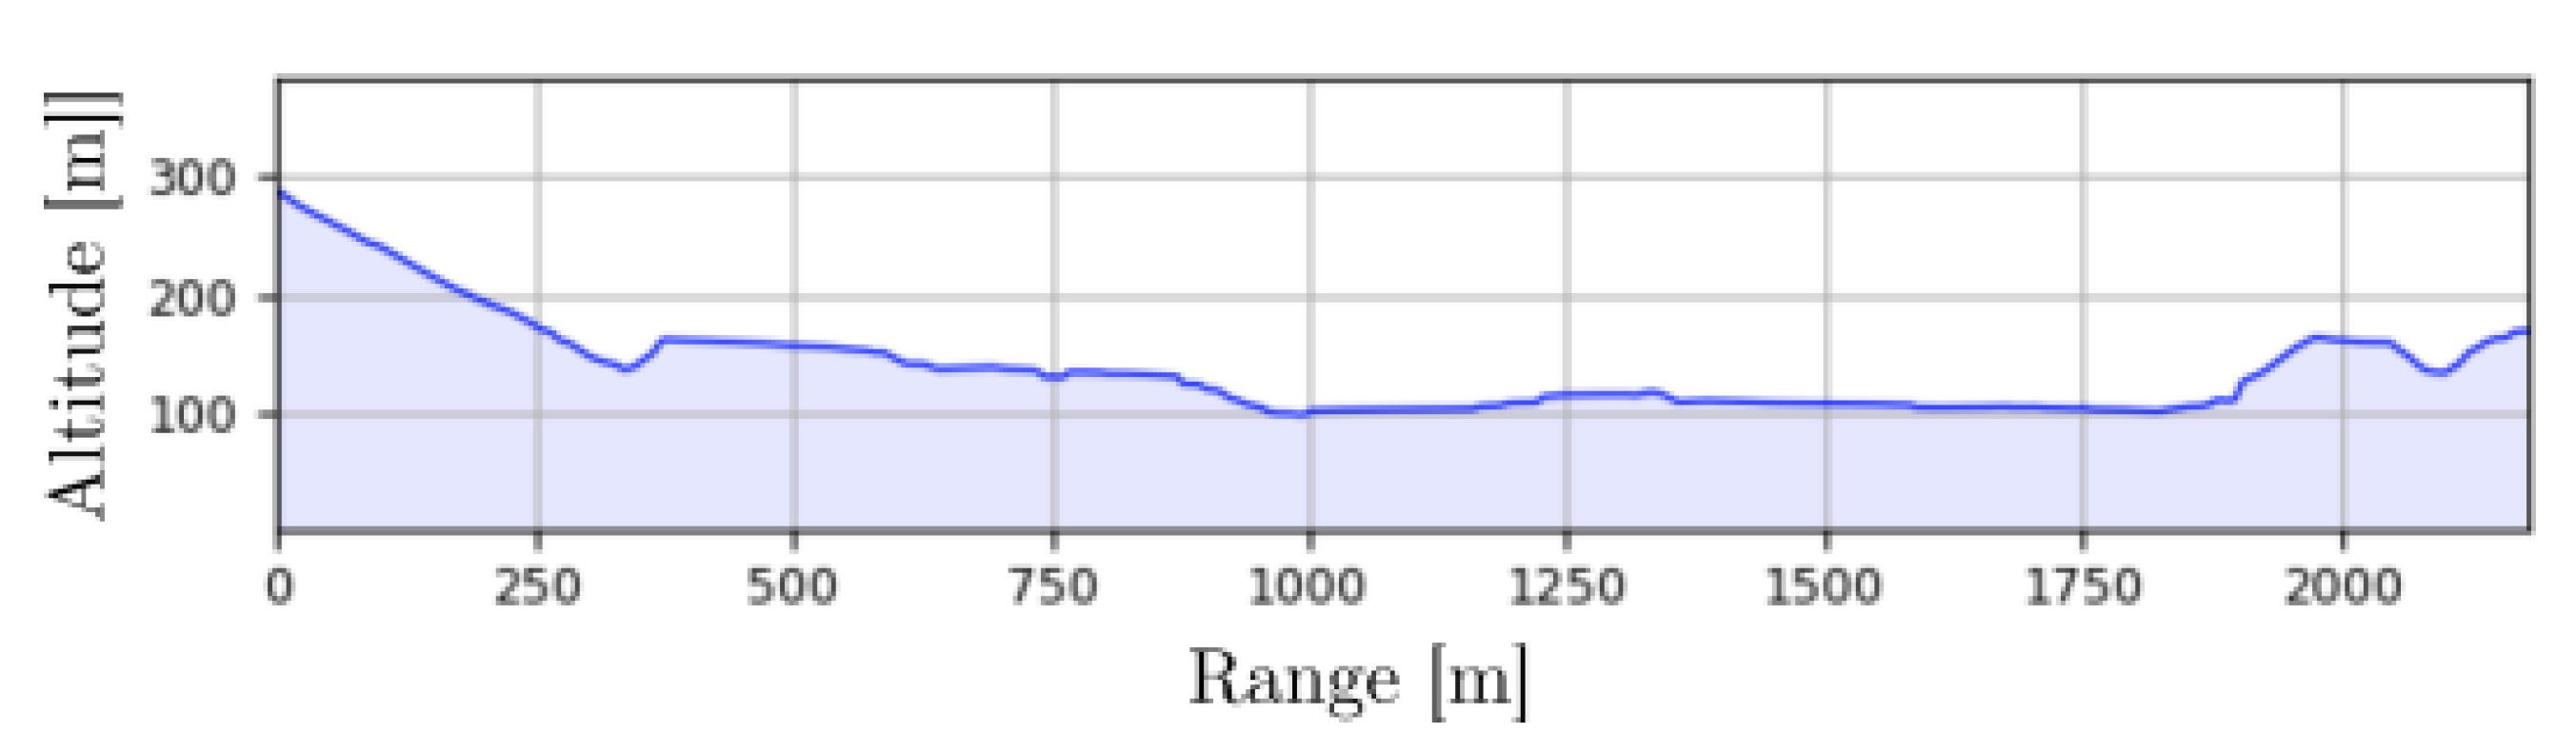
Figure 11 the area from the radar point of view is shown, along with a detail of some vineyards and artificial structures. To assist in the comprehension of the geometry of the area, height and slope profiles are shown in
Figure 12.
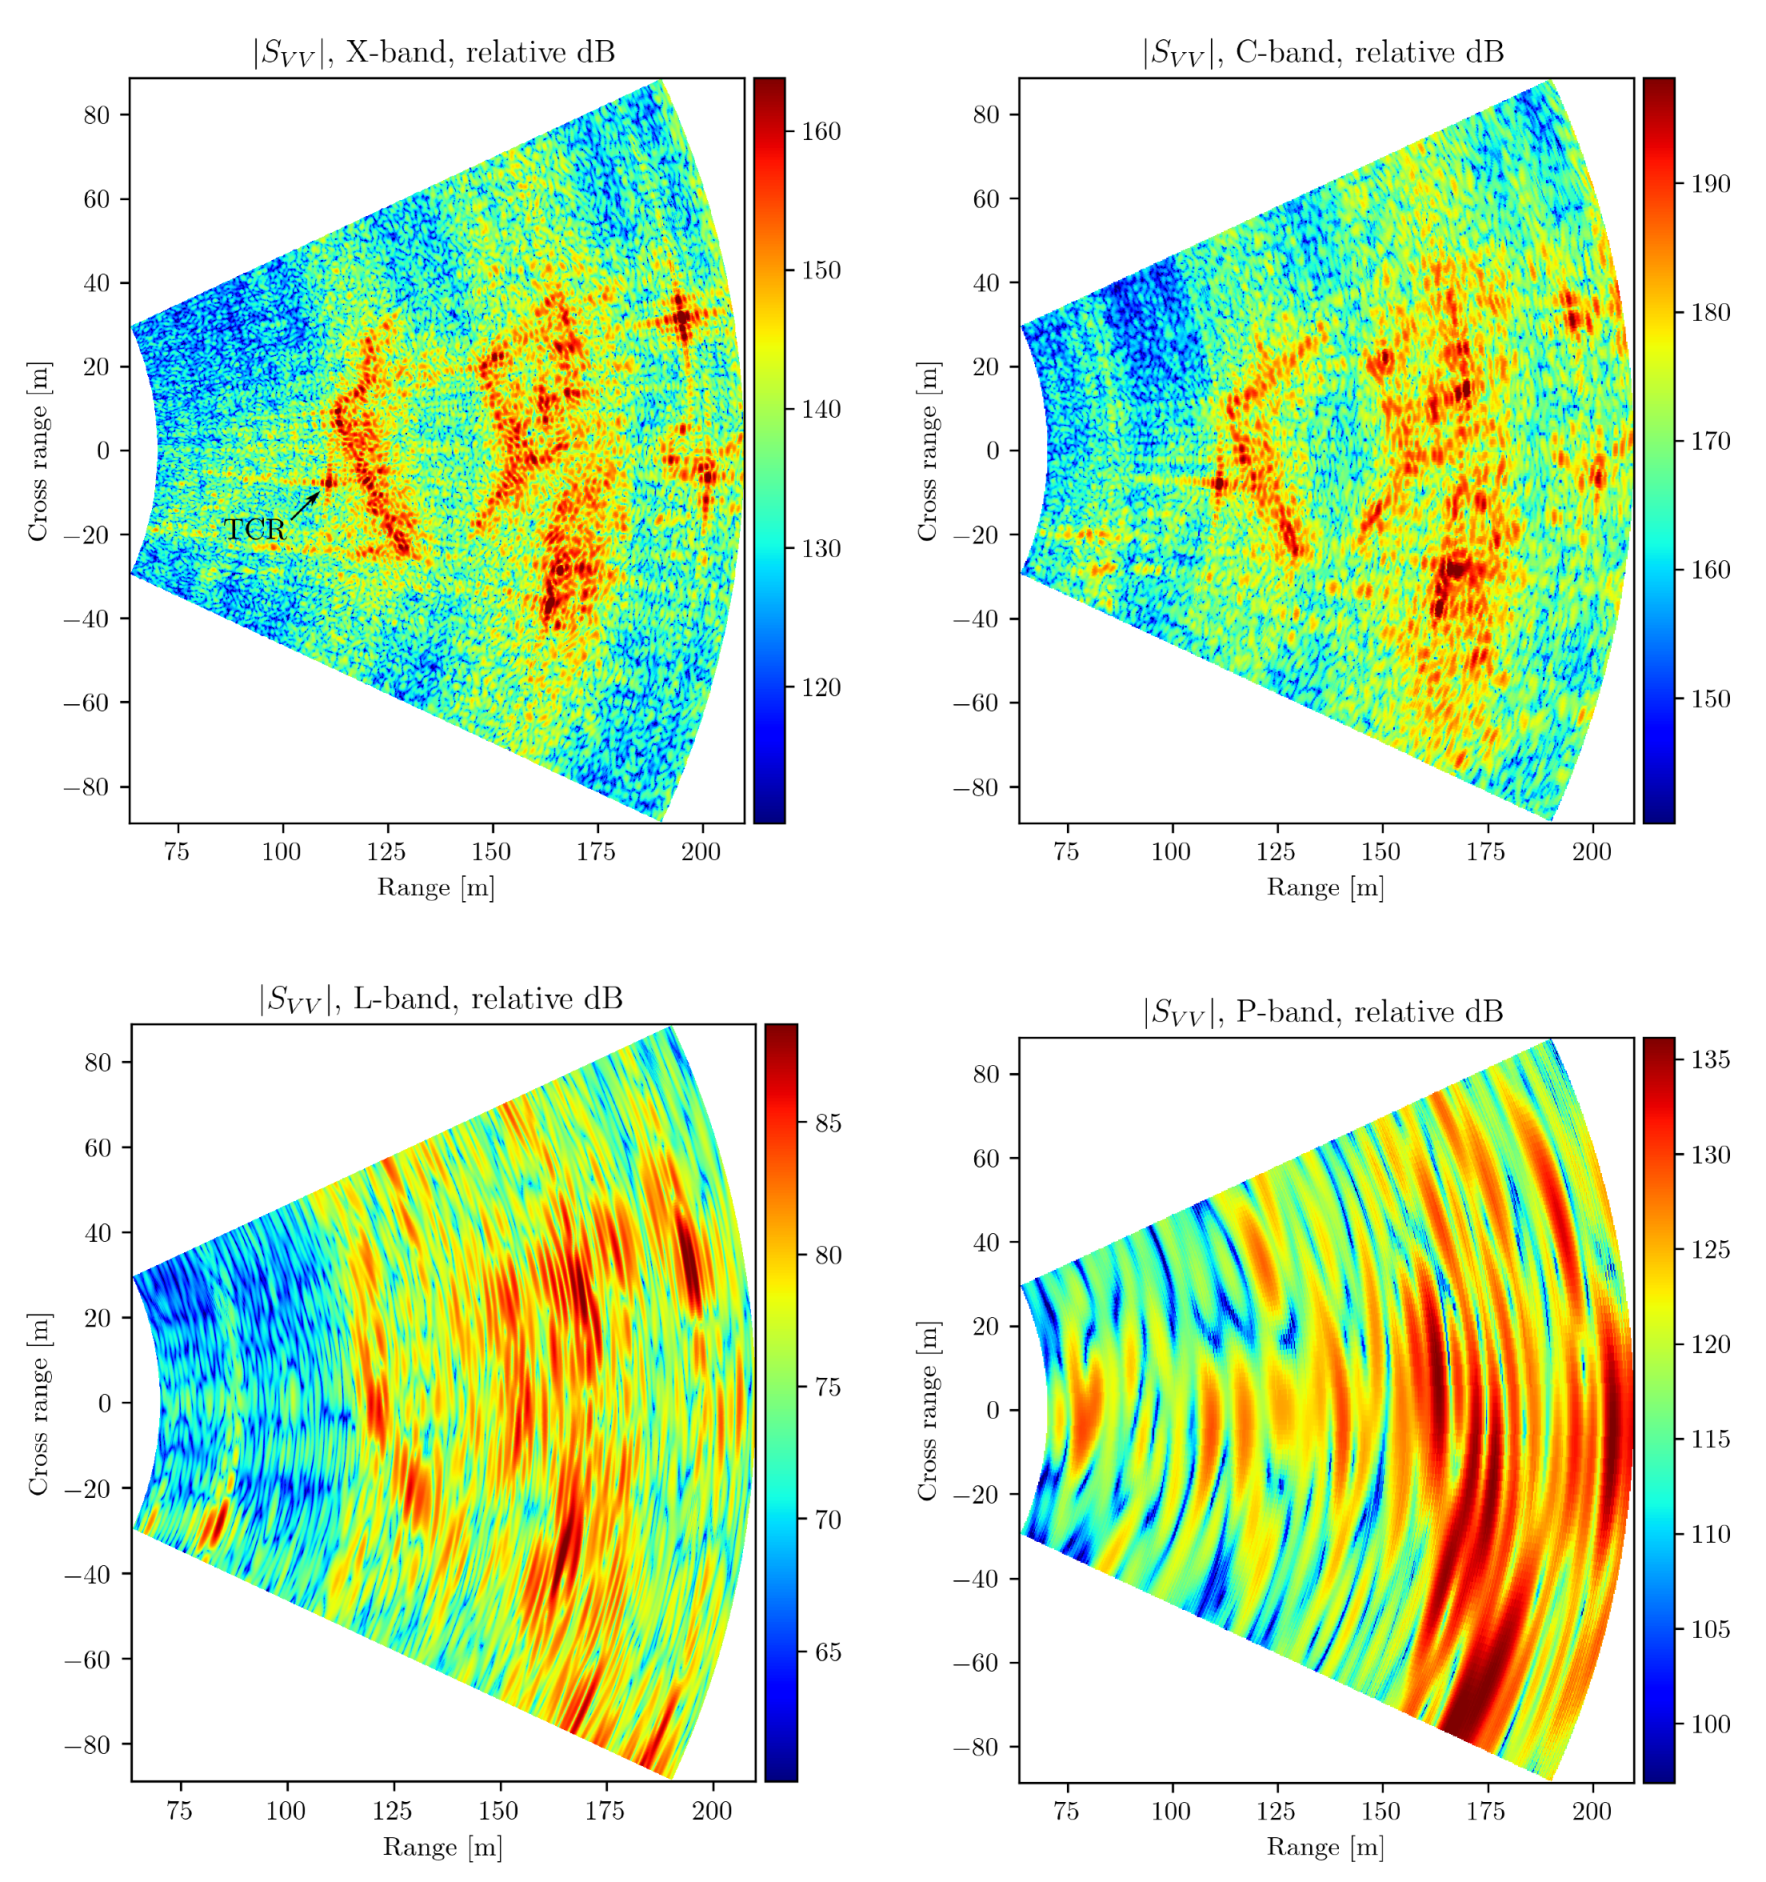
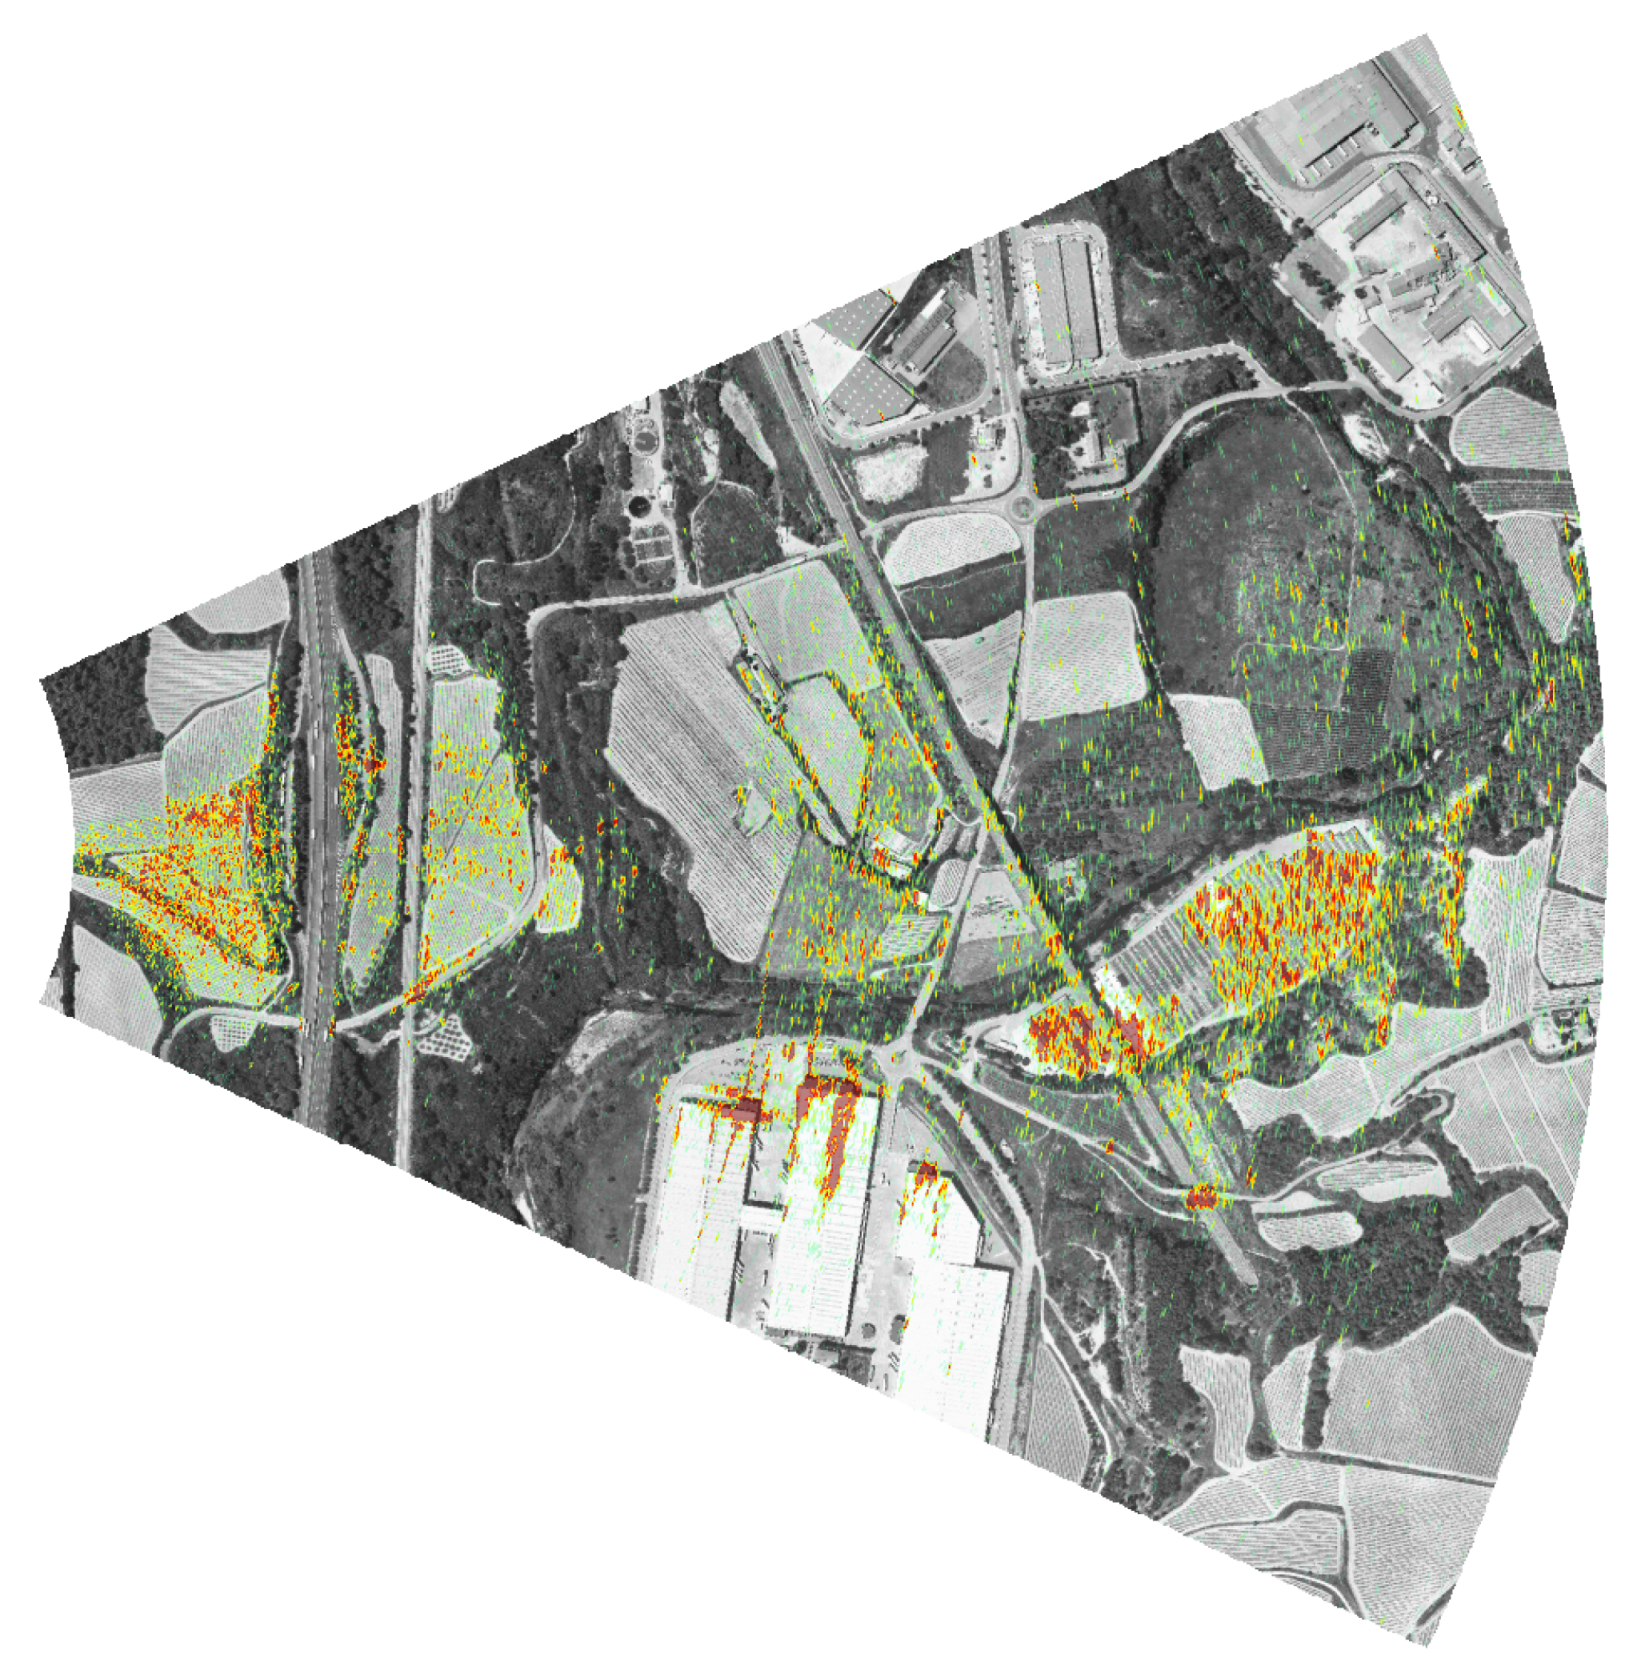
The magnitude images are shown in
Figure 13, and the accompanying X-band thresholded magnitude composite image is shown in
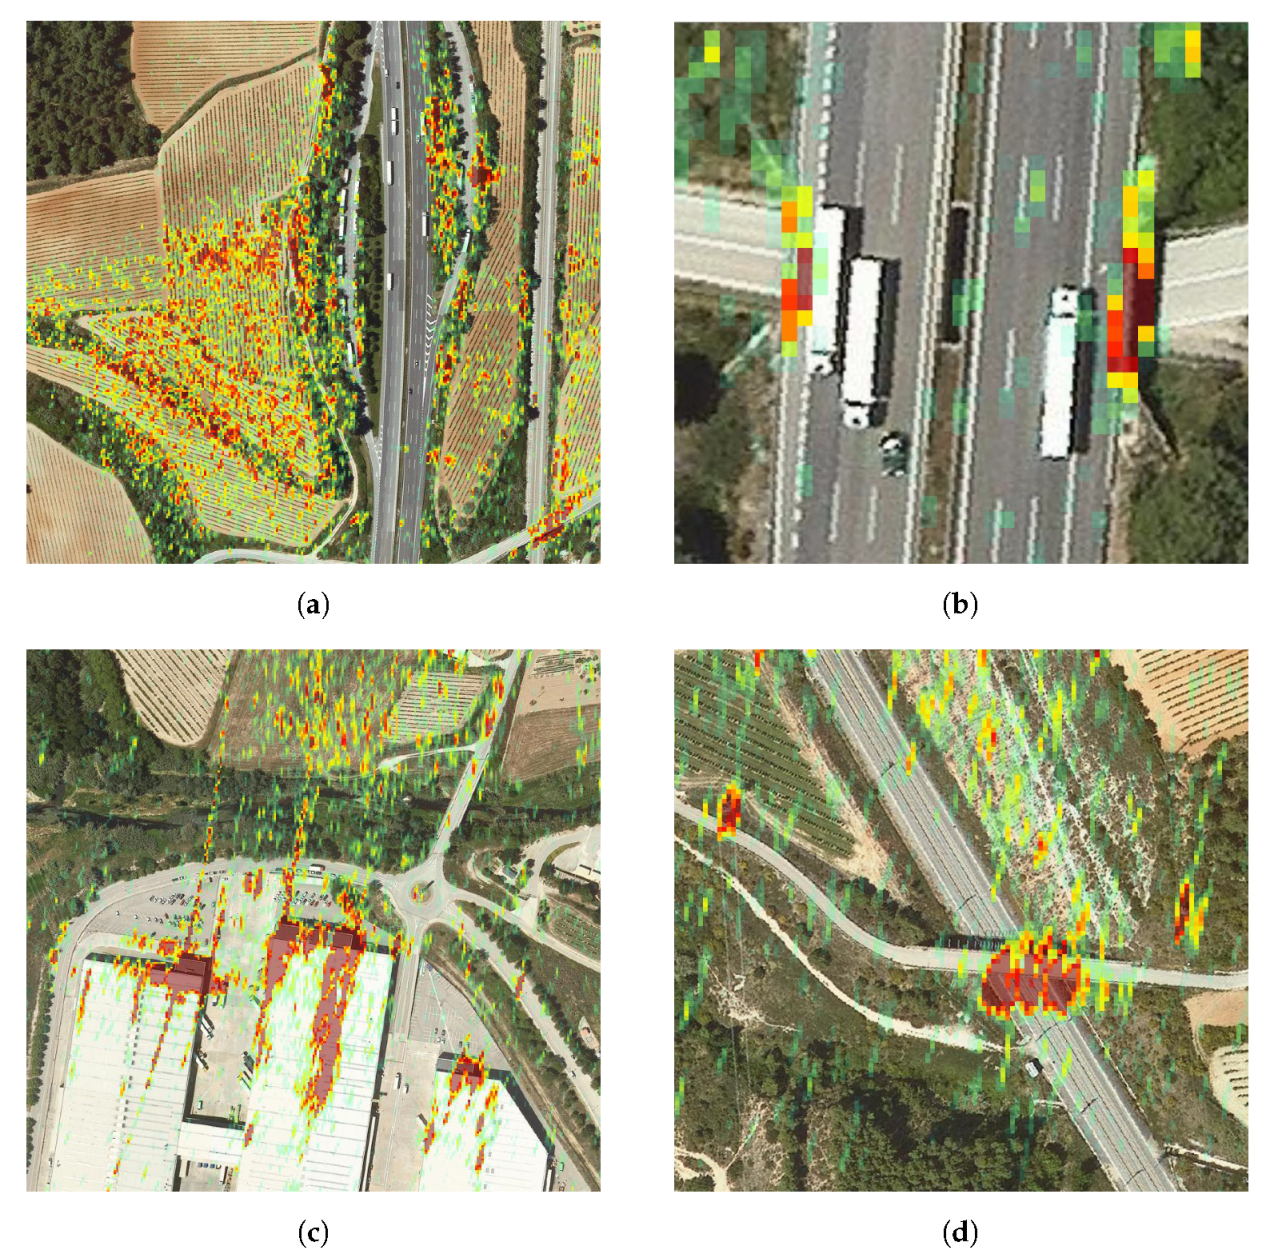
Figure 14 for reference. Unexpectedly, a spur at zero azimuth is present in the focused images, which was not present in the near range ones. This spur was determined to be related with insufficient isolation between the front-end reference clock and the RF signals. It is only visible at far ranges due to its high power with respect to the backscattered power from the scene. An isolation improvement was implemented in the subsequent front-end revision. In the images shown here, the spur was removed through the removal and interpolation of the DC bin in the slow time Fourier domain. When inspecting the X-band image, a good correlation can be seen between the magnitude and the characteristics of the area. From low to high, the vineyard appears relatively strongly (
Figure 15a), followed by various smaller artificial reflectors, such as metallic bridge railings (
Figure 15b) and parked vehicles in a motorway rest area. Starting at 1 km, the strongest reflectors in the image can be seen to have originated from the metallic shapes present in industrial buildings (
Figure 15c). Advancing in range, other artificial buildings and structures such as bridges and electrical towers result in strong returns (
Figure 15d), and the train bridge is also clearly seen.
In C-band the same effect observed in the test site n°2 took place, including the appearance of targets at high azimuth angles due to the broadening of the antenna beam, and an increase in the dynamic range resulted from significantly less free-space loss. In L-band, the degradation in resolution and the central spur made interpretation more difficult. An interesting observation is that the artificial structures around (1700,−100) m yielded a much lower return relative to the rest of the image, indicating that the contributing reflectors were small compared with the L-band wavelength. For P-band the same observation can be made.
4. Conclusions
The main contribution of this work lies in the demonstration that the most common SDR architecture can be exploited for the implementation of high performance radars, especially a GBSAR. Differently from other works, this work specifically demonstrated the implementation of a GBSAR comparable in performance to other commercial systems. This was possible by working on two fundamental problems observed in previous works: the limited processing performance of the host device, which limits the range resolution, and the spurious content of Zero-IF transceivers, which prevented the generation of full-bandwidth chirps. A signal generation block was implemented in the FPGA, taking full advantage of the available signal bandwidth. Another relevant contribution was the usage of signal reconstruction algorithms to circumvent the effects of the SDR transceiver, once again pursuing the objective of using all the available RF bandwidth.
The multi-frequency GBSAR system opens up new possibilities. One of them, for instance, is the selection of a frequency band depending on the strength of decorrelation effects, such as the movement of vegetation or scatterers, such as small rocks, that yield low interferometric coherence values, and hence, low-quality data. In the case of differential interferometry, the multi-frequency capability would allow one to select a low-frequency band when the terrain movement causes severe phase wrapping problems, or to even use a low-frequency band to assist in the phase unwrapping process of a high-frequency image. Another potential application is the usage of data fusion algorithms that fuse together the information of multiple bands to yield richer datasets. For instance, areas that exhibit high coherence at the high frequencies can be sensed with the high-frequency bands, exploiting the high azimuth resolution; and areas exhibiting low coherence can be sensed instead with low-frequency bands that—even with low resolutions—can provide valuable information. Other potential applications are the ones that arise from the combination of multi-frequency and hyper-temporal (acquisitions densely spaced in time) imagery.


