Article

Modeling Water Quality Parameters Using Landsat Multispectral Images: A Case Study of Erlong Lake, Northeast China

1
Institute of Natural Disaster Research, School of Environment, Northeast Normal University, Changchun 130024, China
2
Key Laboratory for Vegetation Ecology, Ministry of Education, Changchun 130024, China
3
State Environmental Protection Key Laboratory of Wetland Ecology and Vegetation Restoration, Northeast Normal University, Changchun 130024, China
4
Environmental Studies Department, National Authority for Remote Sensing and Space Sciences, Cairo 11769, Egypt
*
Author to whom correspondence should be addressed.
Remote Sens. 2021, 13(9), 1603; https://doi.org/10.3390/rs13091603
Submission received: 24 March 2021 / Revised: 11 April 2021 / Accepted: 15 April 2021 / Published: 21 April 2021
(This article belongs to the Special Issue Applications of Remote Sensing in Limnology)

Abstract

:
Erlong Lake is considered one of the largest lakes in midwest Jilin, China, and one of the drinking water resources in neighboring cities. The present study aims to explore the usage of Landsat TM5, ETM7, and OLI8 images to assess water quality (V-phenol, dissolved oxygen (DO), NH4-N, NO3-N) in Erlong Lake, Jilin province, northeast China. Thirteen multispectral images were used in this study for May, July, August, and September in 2000, 2001, 2002, and October 2020. Radiometric and atmospheric corrections were applied to all images. All in situ water quality parameters were strongly correlated to each other, except DO. The in situ measurements (V-phenol, dissolved oxygen, NH4-N, NO3-N) were statistically correlated with various spectral band combinations (blue, green, red, and NIR) derived from Landsat imagery. Regression analysis reported that there are strong relationships between the estimated and retrieved water quality from the Landsat images. Moreover, in calibrations, the highest value of the coefficient of determination (R2) was ≥0.85 with (RMSE) = 0.038; the lowest value of R2 was >0.30 with RMSE= 0.752. All generated models were validated in different statistical indices; R2 was up to 0.95 for most cases, with RMSE ranging from 1.390 to 0.050. Finally, the empirical algorithms were successfully assessed (V-phenol, dissolved oxygen, NH4-N, NO3-N) in Erlong Lake, using Landsat images with very good accuracy. Both in situ and model retrieved results showed the same trends with non-significant differences. September of 2000, 2001, and 2002 and October of 2020 were selected to assess the spatial distributions of V-phenol, DO, NH4-N, and NO3-N in the lake. V-phenol, NH4-N, and NO3-N were reported low in shallow water but high in deep water, while DO was high in shallow water but low in deep water of the lake. Domestic sewage, agricultural, and urban industrial pollution are the most common sources of pollution in the Erlong Lake.

Graphical Abstract

1. Introduction

Surface water quality is a sensitive global environmental issue, as it is important for long-term economic development and environmental sustainability [1,2,3]. However, water quality monitoring is the systematic collection and evaluation of data related to the chemical, physical, and biological quality of water bodies. Likewise, how external changes, whether natural or human, affect that quality of water is of great concern [4]. Furthermore, surface freshwater is an important requirement for the terrestrial environment and the main drinking water resource on the earth. Over the past three decades, industrialization and urbanization have had an adverse effect on water quality; mutating marine species, such as fish; polluting drinking water; and altering the aquatic ecosystem food chain on the globe [5]. Contaminated water supplies raise the cost of water treatment and minimize water oxygenation by limiting sunlight transfer [6]. On the other hand, human activities, such as gushing releases, agrarian concoctions, and misusing water supplies, have a significant impact on surface water quality. Moreover, numerous waterways are highly contaminated due to anthropogenic activities in the world [7].
Laboratory analysis is used to measure and analyze water quality parameters, which is a conventional, time-consuming, and expensive approach as compared to remote sensing (RS) methods, especially in large areas [8]. With the advancement and growing role of technology, new techniques and methods for assessing water quality are being developed. Such methods are remote sensing (RS) and geographic information systems (GIS) using satellite data to monitor water quality in order to reduce time and cost as well as increase accuracy [9]. In general, several parameters (physiochemical, organic, and microbiological) have been considered using a remote sensing technique [9]. This considers that optical properties of water bodies can be altered with the concentration of parameters related to its quality [10]. Such changes could be monitored and detected by spectral bands of RS [11]. Furthermore, RS techniques have witnessed significant development in the environmental field. Notably, it has been applied in monitoring and estimating water quality, such as chlorophyll concentration and turbidity [12,13,14,15], by developing professional algorithms through the analysis of multispectral and hyperspectral images [16,17,18]. Satellite images have already been widely used in assessing several substances in water bodies [19]. Dissolved oxygen (DO), total nitrogen, and nutrients (e.g., NH4-N, NO3-N) related to water pollution are considered non-optically active because they cannot be sensed from the water surface due to its poor visual properties [20]. In addition, they are closely related to optical variables, such as chlorophyll-a and total suspended solids [21,22,23,24]. There is a strong relationship between water quality parameters and radiance or reflectance, which is affected by changing one or more of these parameters [8]. Meanwhile, empirical relationships between spectral properties and water quality parameters were recognized as early as the 1970s [25].
Erlong Lake is an important source of water supply in Siping City, which is one of the 50 major cities suffering from water shortage in the country. The water quality of Erlong Lake directly affects the drinking water health of more than 600,000 people in Siping City. However, human economic activities are the root cause of the unreasonable use of water resources in the lake. As a source of drinking water in Siping City, Erlong Lake has multiple negative effects, such as low water volume, deteriorating water quality, silt accumulation in the reservoir, and sediment pollution. It poses a serious threat to drinking water safety and exacerbates regional water shortages in lakes. The present study proposes empirical algorithms to retrieve water quality parameters (V-phenol, DO, NH4-N, NO3-N) based on Landsat TM5, ETM7, and OLI8 images (2000, 2001, 2002, and 2020) of Erlong Lake, Jilin, northeast China. Additionally, water quality parameters are mapped and assessed using the established models.

2. Materials and Methods

2.1. Study Area

The Erlong Lake (43.08–43.33 N, 124.76–124.96 E) (Figure 1) is located in the east of Siping City of the Jilin province, China. It is located in the transitional zone of a humid climate and semi-humid climate, with an average air temperature of 5.8 °C and annual precipitation of 650 mm [26]. The primary supply and pollution source of Erlong Lake is east of the Liaohe River. The lake area above the dam site is 170 km2, and it is located in the middle and upper reaches of the east Liaohe River basin. The water surface of Erlong Lake spans two provinces and five counties. Residents of Siping City rely on three cities for their water, as well as irrigation, for approximately 6700 hectares of cultivated land. The total storage capacity is 1.762 billion m3, and the average flow rate of the designed flow is 10,100 m3/s.

2.2. Data Collection

2.2.1. Field Data

The field data used in this study (Figure 1) were provided by the School of Environment, Northeast Normal University (NENU). To analyze the change of water quality from late spring to autumn, two sample points located in Erlong Lake were considered (Table 1), and the samples were mainly collected in May, July, August, and September of each year (2000, 2001, and 2002), while seven samples were taken in October of 2020.
The distribution of sampling points is shown in Figure 1. The water samples were held by clean plastic bottles with a size of 500 mL and then transferred quickly to the School of Environment lab in NENU for analysis. DO was determined in the field, and the NH4N, NO3-N, and V-phenol were measured using a fluorescence spectrophotometer (6G-2000).

2.2.2. Landsat Image Acquisition and Processing

Thirteen multispectral Landsat images (Table 1) were collected and used in this study, including TM5, ETM, and OLI 8 images. These images were freely downloaded from http://glovis.usgs.gov/ (accessed on 23 October 2020). The study area is included in one scene; path 118 and raw 030.
In this study, two technical processes were used to calibrate the images: radiometric and atmospheric corrections. The radiometric correction was first used to convert the digital numbers or pixel values to radiance or reflectance. Then, we applied the atmospheric correction to remove atmospheric factors that affect the movement of surface reflections and transform the radiometric values into radiation or surface reflectance. After that, the natural materials on the surface were estimated and smoothly compared in time and space, such as water quality parameters. The dark object subtraction method was used in atmospheric correction [27], which had reflectance values close to zero. However, due to dispersion and atmospheric absorption, values of reflectance different from zero were recorded in the pixels where such objects were located. These values should be subtracted from the various spectral bands of the image [28]. In the present study, we only selected blue, green, red, and near-infrared bands that were available in whole Landsat images. Exelis Visual Information Solutions (ENVI, version 5.3) software was used to process all of the images.

2.3. Changes in the Amount of Water in the Lake

The changes in the amount of water in Erlong Lake are among the most serious issues. Consequently, this causes a rise in sediments, plants, and algae, resulting in a deterioration of water quality; on the other hand, it has an effect on fishes, due to the decrease in water volume. In this study, Landsat images were used to monitor changes in the water column in Erlong Lake. September of 2000, 2001, and 2002 and October 2020 were chosen to display the changes in the amount of water in the lake, as well as to show the spatial distribution of water quality parameters. Firstly, the mask was conducted for Erlong Lake, where the region of interest (ROI) tool was applied to locate the observation scope. The near-infrared band, which is highly sensitive to water bodies, was selected. Then, the value of 0.145 µw was chosen for all of the selected images. The pixels containing water that were identical to the water’s surface were taken, and non-conformer pixels were considered zero.
Moreover, based on the maximum likelihood classification in ArcGIS version 10.3, we classified all of the selected images. After that, reclassified images were transferred from raster to polygon to easily calculate the water body for the selected years. Masking was performed after radiometric and atmospheric corrections using ENVI v. 5.3 software.

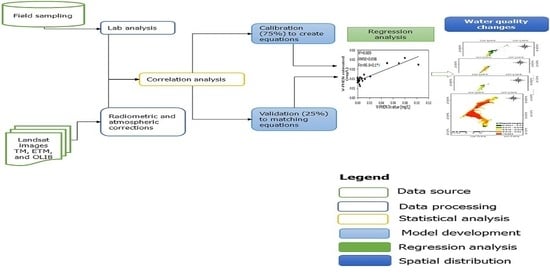
2.4. Statistical Analysis

In the field of water quality, a correlation analysis method is useful and reliable [29]. In this section, we performed two steps of statistical analysis: (I) Test of the correlation coefficient for field data (V-phenol, DO, NH4-N, NO3-N) with each other in each month and all years, according to the time sequence. This step was an initial essential step of the analysis to ascertain whether there is a relationship between the water parameters. (II) Test of the correlation coefficient between water quality parameter data and reflectance of remote sensing data. We used multiplication, addition, division, and subtraction of (visible and near-infrared) bands of TM, ETM, and OLI8 imagery, and then examined them with water quality (V-phenol, DO, NH4-N, and NO3-N). This step was carried out to find the best reflectance highly correlated with water quality in Erlong Lake. Correlation analysis was performed using the Pearson correlation coefficient, which can have values ranging from −1 to +1, passing through zero. As the values close to −1 indicate a strong inverse relationship between the variables, the values close to +1 indicate a strong positive between the variables. In contrast, the values close to zero indicate no relationship between the variables [30].

2.5. Empirical Model Development for Water Quality

2.5.1. Calibration

In our study, we followed empirical method [29,30,31], which started with a correlation between the field data and the corresponding remote sensing data. Then, after creating equations for water quality parameters using remote sensing data, we applied a regression technique. In this section, we ensured that band combinations of blue, green, red, and near-infrared of Landsat images had a clear correlation with field data, based on “r “and p-value (Table 2). Thus, we chose them to create/or develop the algorithms for V-phenol, DO, NH4-N, and NO3-N. After that, we used simple linear regression analysis to determine relationships between water quality and the results from algorithms derived via band combinations. According to these studies [32,33,34,35], various algorithms have been used to investigate relationships between water quality and remote sensing data. In this step, 75% of samples (24 samples) were chosen from the total data for building equations as calibration for water quality (V-phenol, DO, NH4-N, NO3-N) in Erlong Lake.

2.5.2. Validation

The model’s training samples (75%) were used to build the equations for checking the water quality, but it was unable to validate the model’s performance. Hence, 25% of datasets were used to reveal the accuracy of calculating water quality. All statistical analyses were established by IBM SPSS statistics (v. 26) and Microsoft Excel software (v. 2016). Furthermore, the final results of calibration and validation were evaluated based on RMSE (Equation (1)).
RMSE = i = 1 n ( x i y i ) 2 n
where x i is the in situ water quality parameter values, y i is the estimation from the models, and n is the number of observations.

3. Results

3.1. Changes in the Amount of Water in the Lake

Previous studies proved that the storage capacity of the Erlong Lake tank witnessed a remarkable deterioration, especially in the period from 2000 to 2003. The storage capacity was about 2 × 10⁸ m3, less than the normal limit for storage (2.36 × 10⁸ m3). This is due to the dams that blocked the incoming water into the lake, leaving only the Dongliao River from Liaoyuan City and Dongliao County. In addition, it carries industrial wastewater and domestic sewage to the lake. In 2020, the average capacity was 223.42 million cubic meters. In this study, Landsat images were used to confirm the changes in water level in the lake and found that the lowest area of the water column was in 2002 (2835.220331 ha) (Figure 2), and the highest value of the water column was in 2020 (10,620.82961 ha). This can be explained as being due to the excess amount of rainfall in 2020.

3.2. Relationship Between Water Quality and Spectral Bands

Based on “r” and p-value, the water quality parameters show significant positive correlations with each other (Table 3), where p-value was less than 0.001 and “r” was reported as being up to 0.81 for V-phenol, NH4-N, and NO3-N concentrations. However, DO was not correlated with other parameters due to the abundance of plants in the water in 2000, 2001, and 2002. In this case, the nitrogen decreased and the DO increased, which led to weakening the relationship with DO.
Table 2 shows the correlation coefficient for in situ data and the band combinations that were used for developing the empirical models. It was found that the correlation of V-PHEN was more than 0.90 with (R + NIR) + (B/NIR), and (G/NIR)/(B + G) ∗ (G). Further, correlation of NH4-N was more than 0.90 with (R + NIR) + (B/NIR), and more than 0.80 with (G/NIR)/(B + G) ∗ (G). In addition, NO3-N was higher than 0.80 with (R + NIR) + (B/NIR) and (G/NIR)/(B + G) ∗ (G). However, dissolved oxygen was only correlated up to 0.60 with (NIR − R) ∗ (NIR/G).

3.3. Model Development for Water Quality Estimation

3.3.1. Calibration

All variables (in situ data and reflectance data of Landsat) were tested to reveal the best reflectance to be used in the regression analysis to estimate selected water quality parameters from Landsat images [36].
The developed relational equations of the Landsat reflectance value and the water quality parameters were determined mathematically using regression analysis. Table 3 shows the results of regression analysis for calibration and validation. In calibration (Table 3 and Figure 3), the V-phenol, NH4-N, NO3-N, and DO indicated significant positive correlations (R2 = 0.805, 0.862, 0.878, and 0.304, respectively) with mathematical equations obtained from Landsat selected data. Meanwhile, RMSE values were 0.038, 0.645, 8.495, and 0.752, where p-value was less than 0.001.

3.3.2. Validation

In validation, the V-phenol, NH4-N, NO3-N, and DO were highly correlated with models established from Landsat reflectance, as shown in Table 3, where R2 was 0.979, 0.954, 0.992, and 0.619 respectively, with very low RMSE (0.050, 0.525, 0.992, and 1.390).

3.4. In Situ and Model Trends

This section aims to show how the accuracy of results from the models and in situ data was ensured. The monthly mean values (May, July, August, and September) were selected from 2000, 2001, and 2002 and October of 2020. Table 4 and Figure 4 show the mean values of the lab analysis and the model results retrieved from Landsat images of Erlong Lake. According to the results, the in situ and model data estimated for V-phenol have the same behavior and show only slight differences. On 19 October 2020 (Table 4 and Figure 4a), the highest mean concentration of V-phenol was on 18 September (0.0161 mg/L), with the average being comparable to that of the model average (0.0116 mg/l). In 2001, the V-phenol concentration average was high on 16 August (0.0068 mg/L), along with the average resulting from the model (0.0095 mg/L). Further, in 2002, V-phenol was high on 15 May (0.0075 mg/L). In regard to the model average (0.0096 mg/L), V-phenol showed the highest average concentration on 19 October 2020, where it was 0.0761 mg/L compared to the average obtained from the model (0.0186 mg/L).
The highest average concentration of nitrate nitrogen (NO3-N) in 2000 was on 18 September (0.9400 mg/L) (Table 4 and Figure 4b), offset by an increase in the average from the model (1.1680 mg/L). In 2001, the concentration average of (NO3-N) was high in July (1.3150 mg/L) compared with the average from the model (0.6613), while the highest rate in 2002 was on 15 September (2.7100 mg/L), followed by an increase in the average generated by the model (0.6944 mg/L). On 19 October 2020, the average of NO3-N concentration increased to 9.5714 mg/L, which corresponds to the average obtained from the model (4.8026 mg/L).
The average concentration of ammonium nitrogen (NH4-N) was high on 15 May 2000 (0.2130 mg/L) (Table 4 and Figure 4c), followed by the average result from the model (0.3275 mg/L). It also shows the highest average concentration in 2001, which was on 15 May (0.3575 mg/L), compared to the average from the model (0.3648 mg/L). For 2002, the highest in situ average of the ammonium nitrogen was on 15 May (0.5675 mg/L), followed by the average of the model (0.4013 mg/L). Furthermore, on 19 October 2020, the average concentration of ammonium nitrogen was 1.8000 mg/L, and the average retrieved from the model was 1.5055 mg/L.
For DO (Table 4 and Figure 4d), the highest average concentration on 15 May 2000 was 7.4850 mg/L, and from the model, it was 7.4090 mg/L. In 2001, DO showed the highest in situ average on 15 September (6.1450 mg/L) compared with that of the model in the same month (6.3393 mg/L). In 2002, the highest average DO on 15 September was 7.9100 mg/L, compared with the average from the model (7.5570 mg/L), as well as on 19 October 2020, where the average concentration of DO was 6.1000 mg/L, compared with the average from the model (5.2707 mg/L).

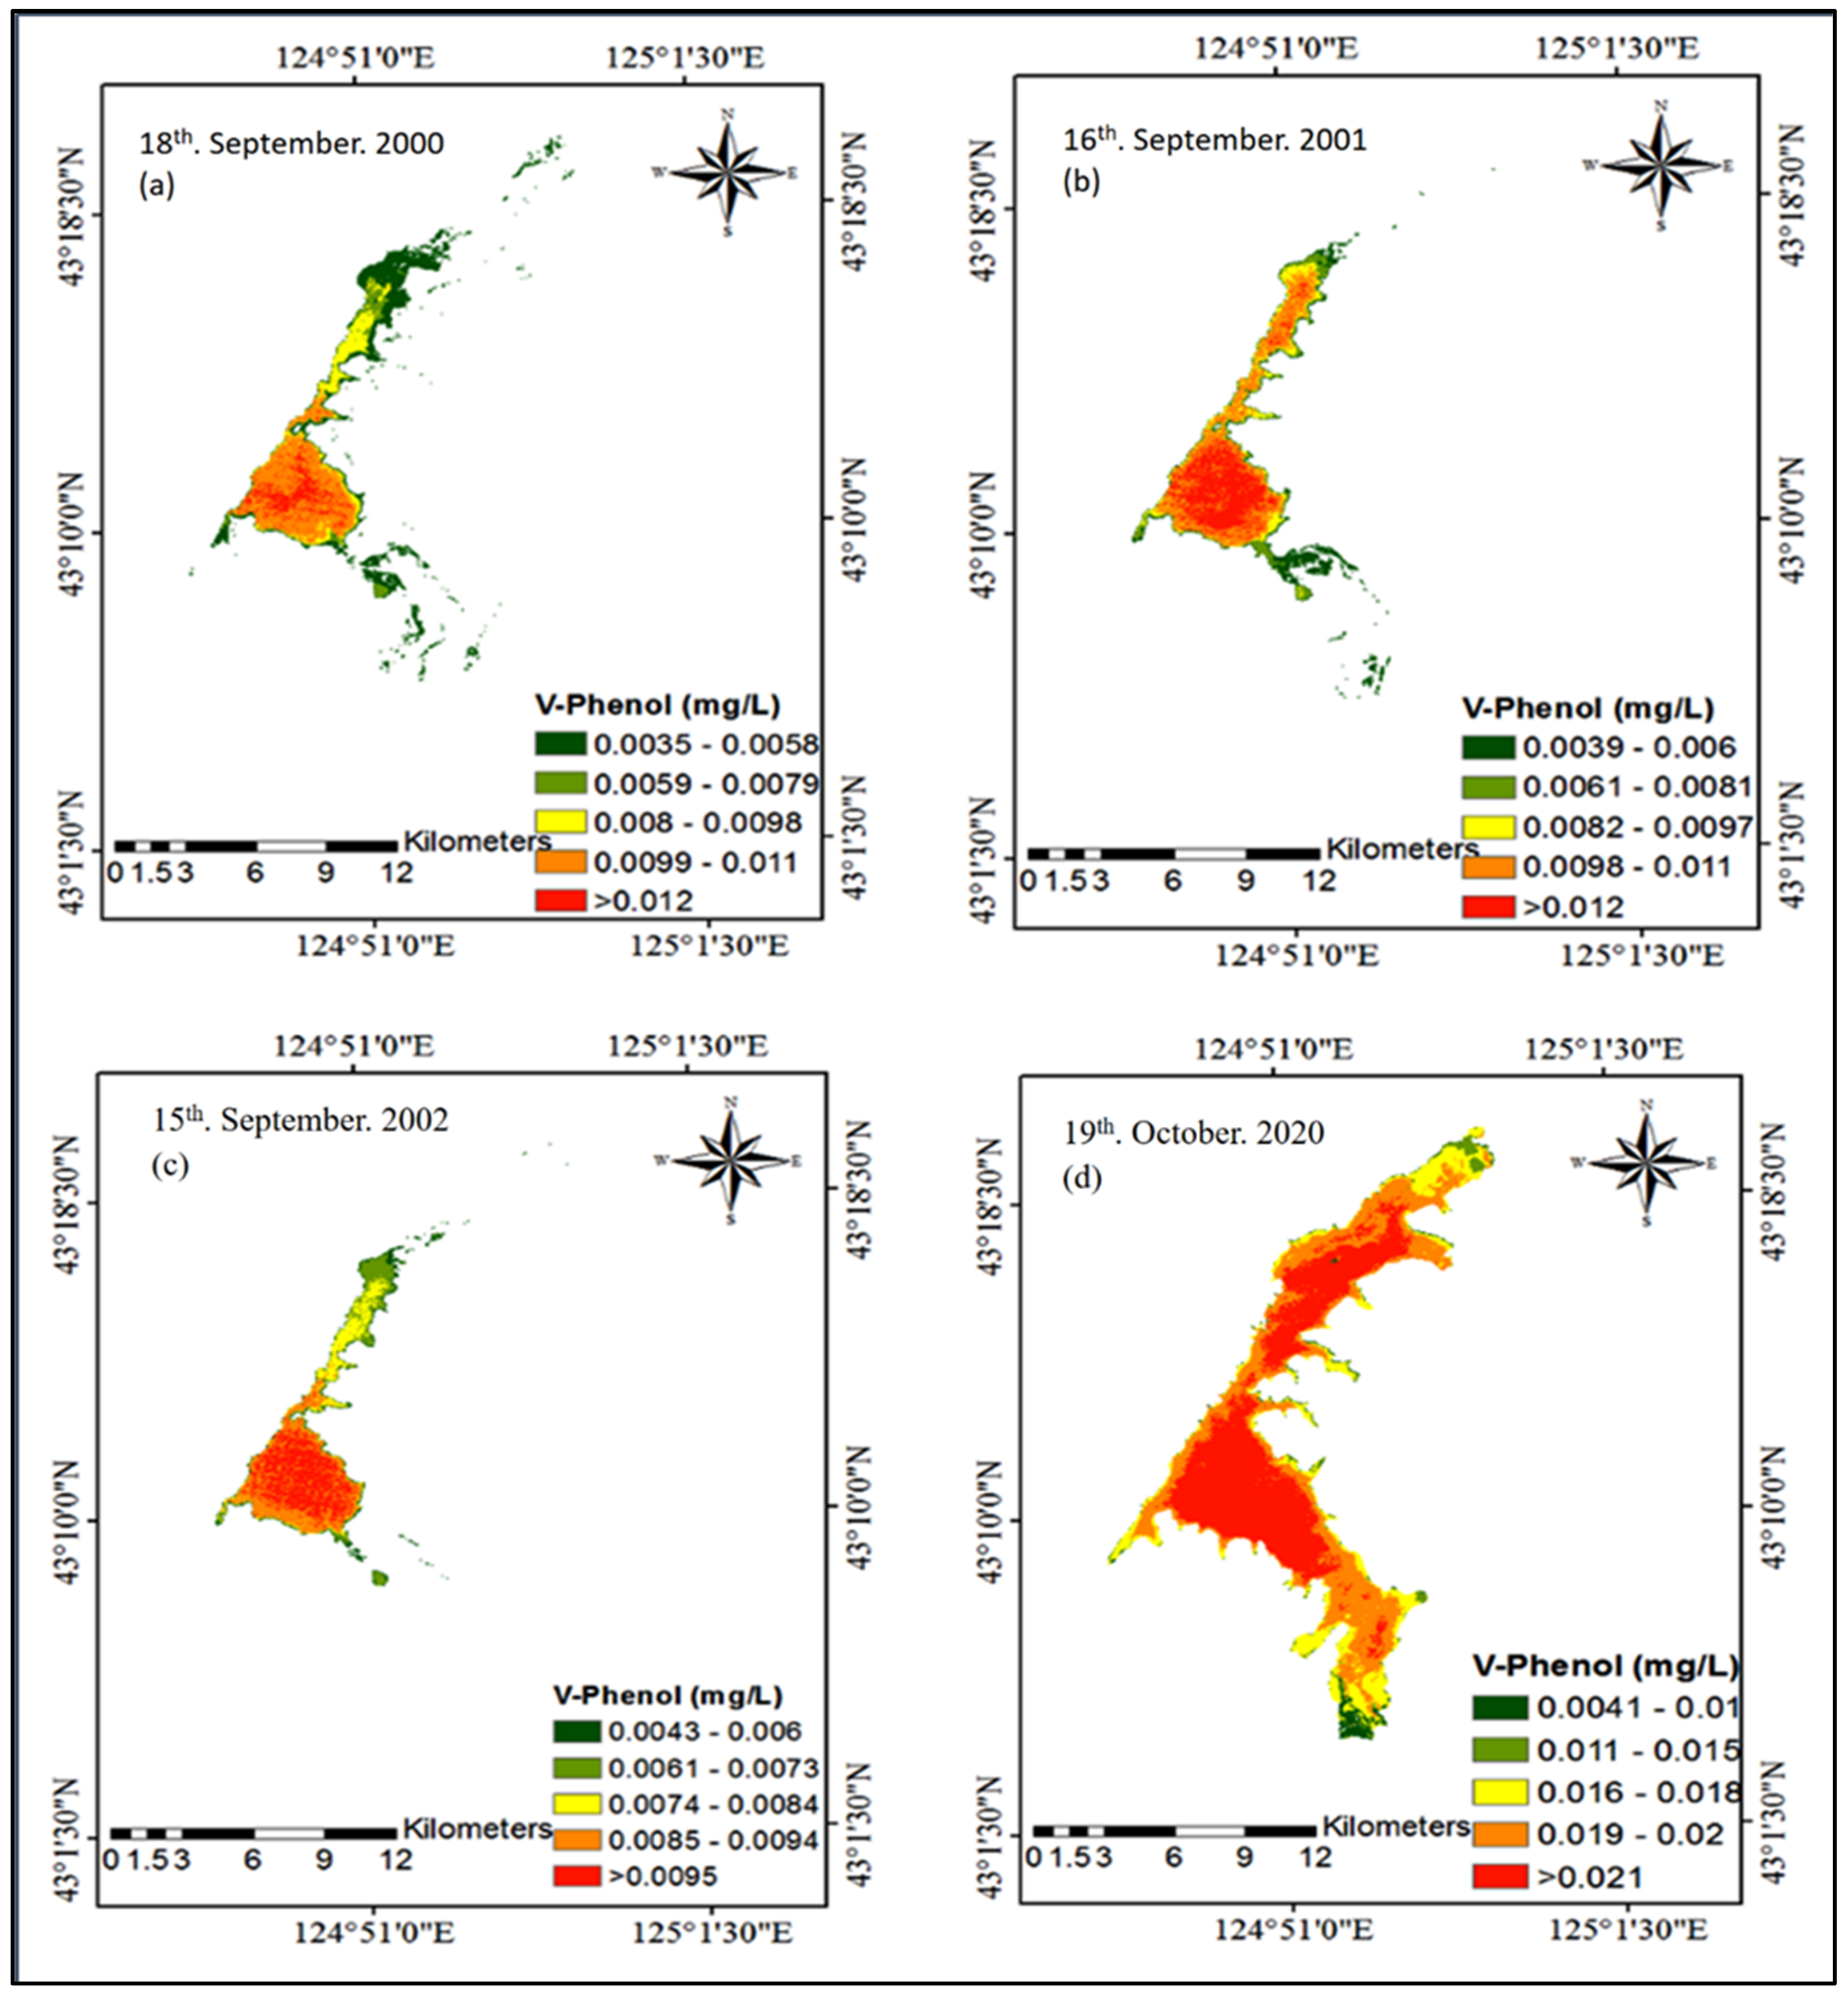
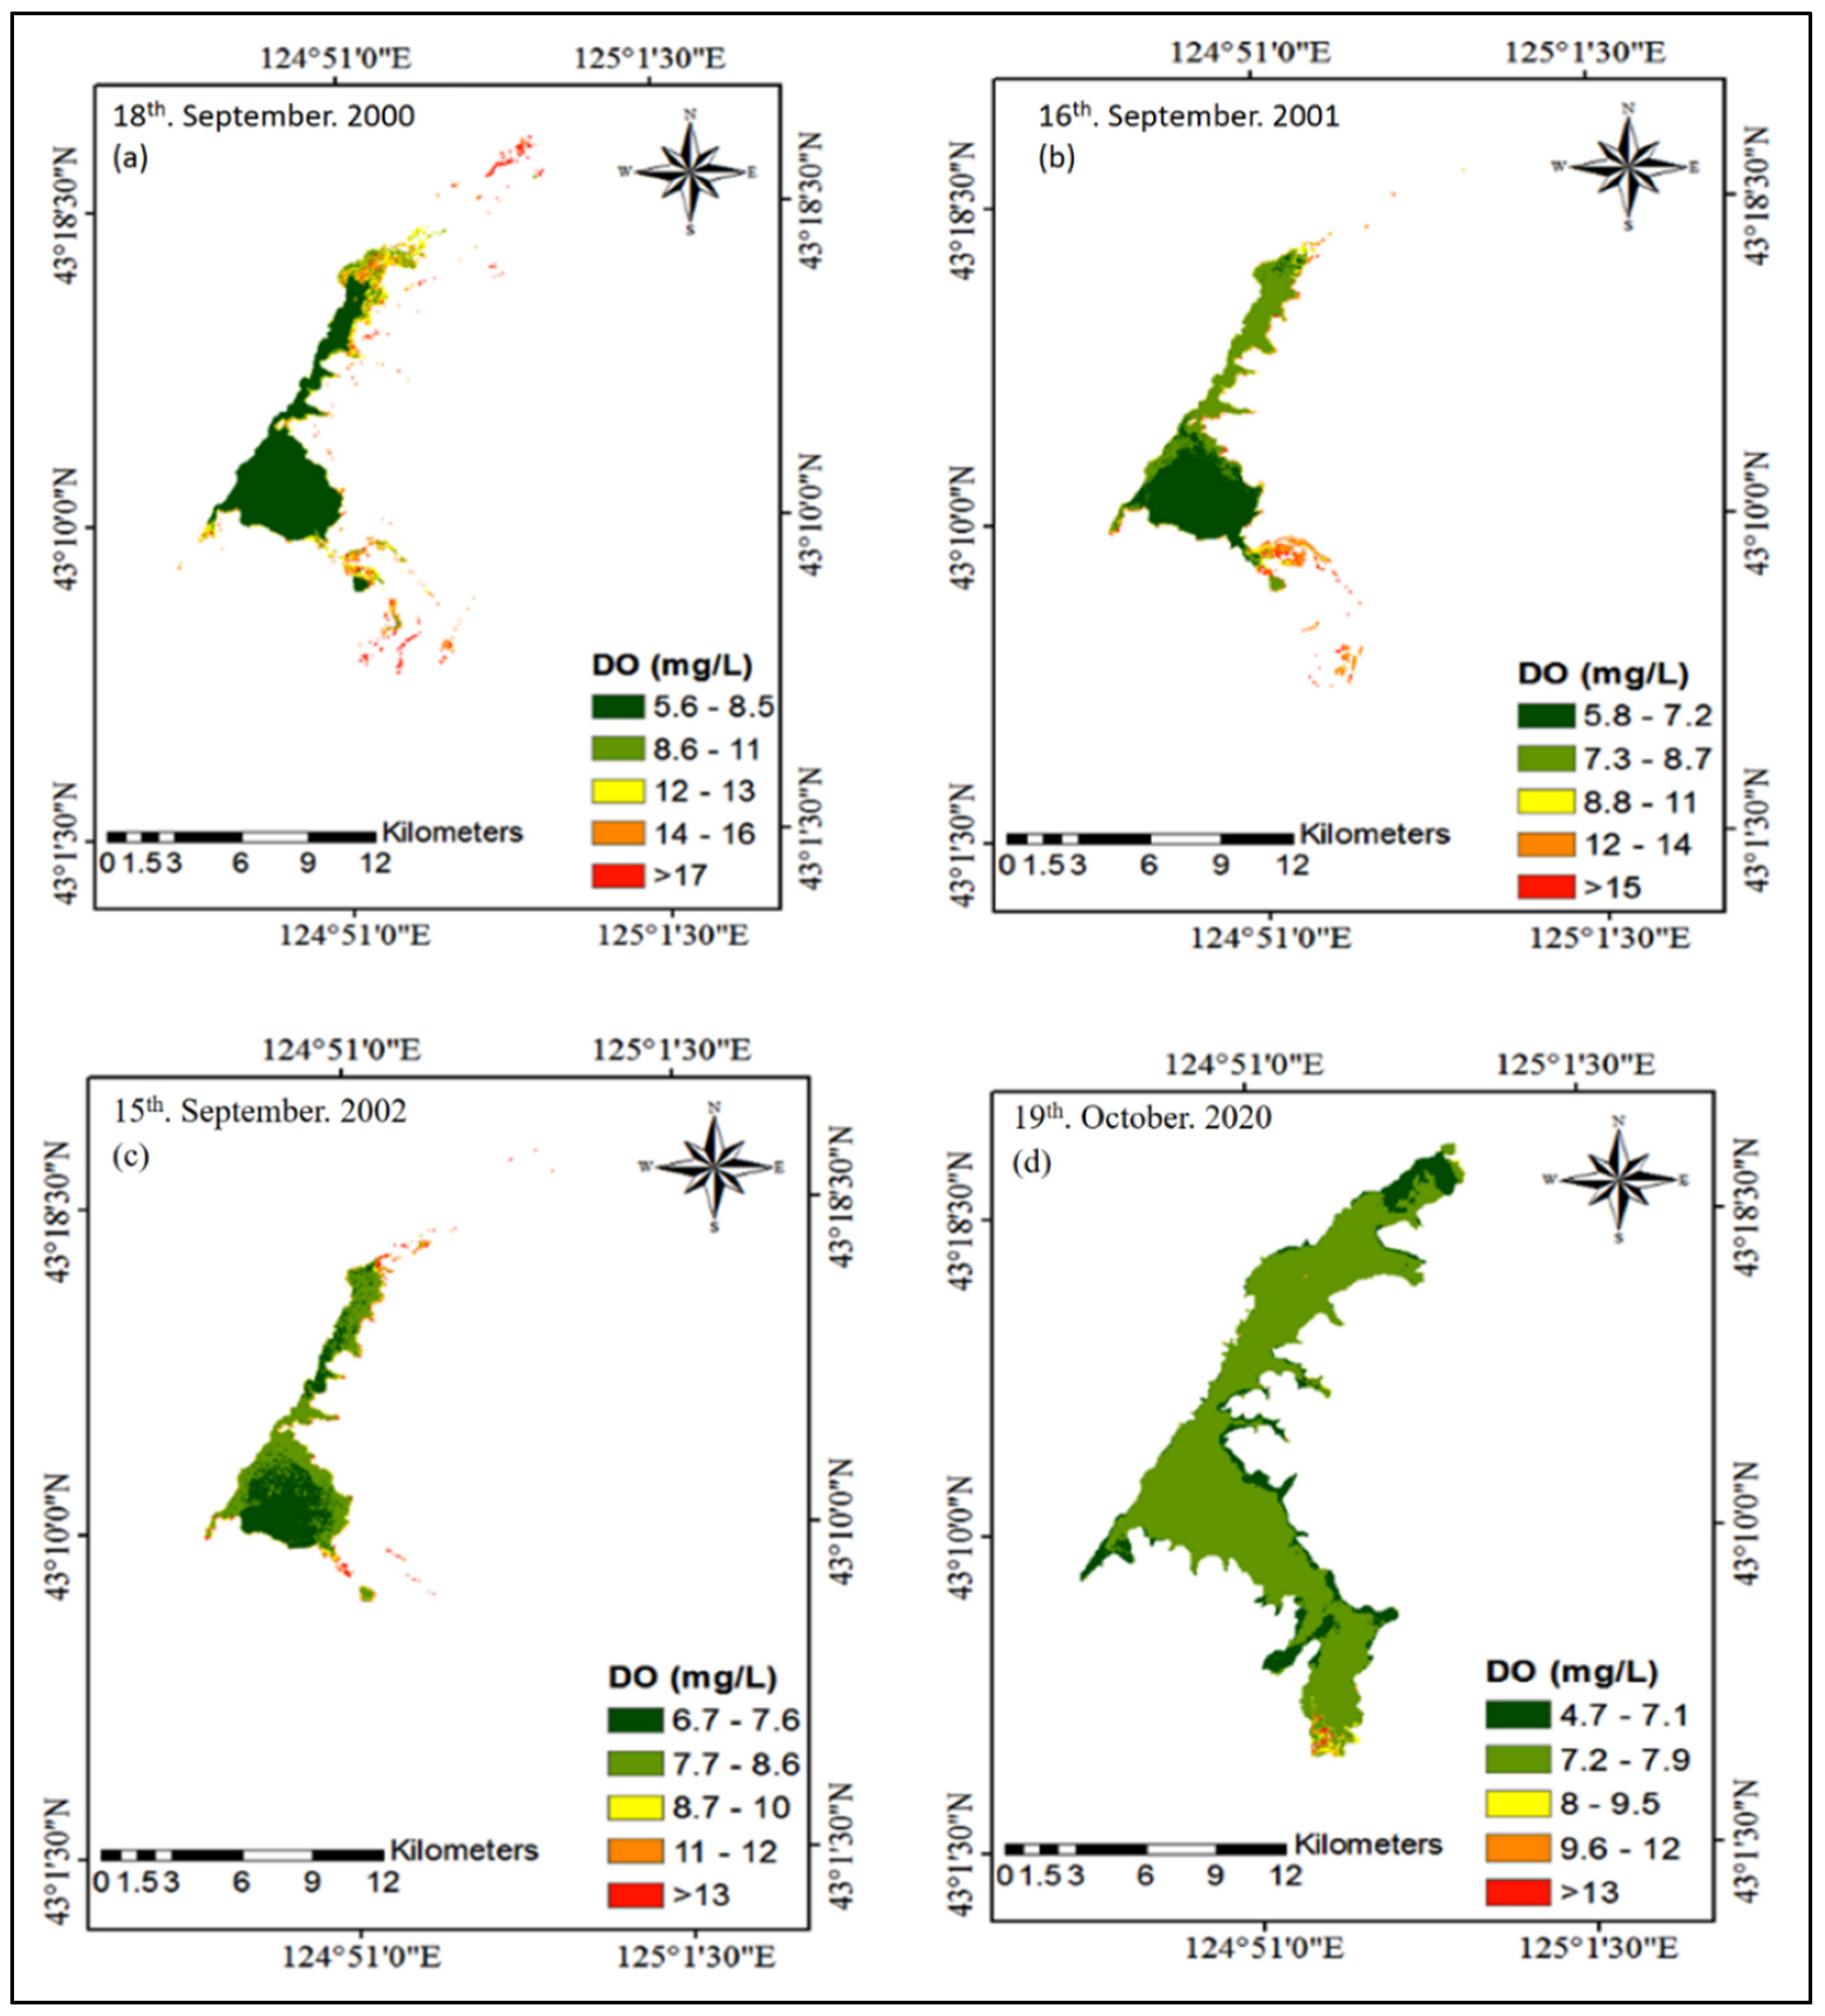
3.5. Water Quality Mapping

Synoptic mapping was conducted to show spatial distribution of water quality (V-phenol, NH4-N, DO, and NO3-N) changes in 2000, 2001, 2002, and 2020 by applying the developed models (Table 3) derived from the satellite images (TM, ETM, and OLI8). To assess this, we selected data from 18 September 2000, 16 September 2001, 15 September 2002, and 19 October 2020 in Erlong Lake.

3.5.1. Volatile Phenol

Volatile phenol is considered a toxic alcohol, especially when it is present to a high degree in water bodies, such as lakes or rivers, leading to death and reducing the productivity of aquatic organisms, such as fish. Phenol is transported to lakes and rivers through water flow from its sources of use, such as industrial sources. It includes oil refinery waste, municipal treatment plant discharges, agricultural chemicals, animal waste, and waste from other human activities that lead to an increase in volatile phenol in water bodies. The highest concentrations of volatile phenol on 18 September 2000 was found closest to the middle of the lake (>0.012 mg/L) (Figure 5a), followed by that on 16 September 2001 (Figure 5b).
The same value was distributed in the middle and north regions of the lake. On 15 September 2002 (Figure 5c), volatile phenol was low, where the highest value was 0.0095 mg/L and concentrated in abundance in the middle part and the southeast side, which is closed settlement land near the lake. Furthermore, on 19 October 2020 (Figure 5d), the volatile phenol was more than 0.021 mg/L. It spread in the northern regions to the southeastern parts of the lake. It was found that the change in the amount of volatile phenol during the periods 2000, 2001, and 2002 may indicate that the sources were due to the decomposition of organic matter as well as waste water and industrial waste water across the Liaoyuan River from the southeast of the lake resulting from urban land. Furthermore, 2020 showed increases in volatile phenol, which might due to the fast growth of urban land around the lake.

3.5.2. Nitrate and Ammonium

NO3-N and NH4-N are primary indicators of water quality. Both of their concentrations are highly variable during seasonal lake cycles, where for deep stratified lakes, nitrate is higher during mixing events and usually decreases in late summer–fall [37]. For the trophogenic zone of shallow lakes, both concentrations are lower during periods of water column stability, and they increase during vertical mixing events. NH4-N is generated by heterotrophic bacteria as the primary nitrogenous end product of the decomposition of organic matter and is readily assimilated by plants in the trophogenic zone [38].
NH4-N concentrations are usually low in oxygenated waters of oligotrophic to mesotrophic deep lakes because of its utilization by plants in the photic zone and nitrification to N oxidized forms. At relatively low dissolved oxygen, nitrification of ammonia ceases, the absorptive capacity is reduced, and a marked increase in the release of NH4-N from the sediments then occurs [37].
In this study, the spatial distribution of NH4-N witnessed a change during the selected time, where on 18 September 2000, NH4-N had special distribution mostly in the middle with its highest value (>0.56 mg/L) (Figure 6a). The highest value was reported on 16 September 2001 and also with a slight spread at the northeast and middle of the lake (Figure 6b). On 15 September 2002 (Figure. 6c), the value of NH4-N decreased to <0.4 mg/L, encompassing the middle of the lake to the southeast, near the mouth of a Liaoyuan River. On 19 October 2020 (Figure 6d), a remarkable increase in the value of ammonia was witnessed in the lake, as it reached >1.8 mg/L. This distributed from the southeast to the center and then to the northeast of the lake, confirming the decrease in the sediment’s absorption of NH4-N and the low percentage of dissolved oxygen.
Nitrate (NO3-N) is one of the most important nutritional factors in any water body, as it indicates the rate of eutrophication in the system. NO3-N is incorporated in water bodies from natural sources, such as sewage, household runoff, and runoff from agricultural fields [39]. Fish and aquatic insects can be affected indirectly by increased nitrate concentrations in the water.
On 18 September 2000 (Figure 7a), the highest level of NO3-N was more than 1.4 mg/L, distributed in the middle of the lake. On 16 September 2001 (Figure 7b), NO3-N was higher than 1.3mg/L in the middle and southeast of the lake. Furthermore, on 15 September 2002 (Figure 7c), the NO3-N in the lake decreased, where the highest level was greater than 0.73 mg/L. On 19 October 2020 (Figure 7d), the NO3-N level increased to >6.6 mg/L. It was concentrated in a vast area of the lake, from the southeast side to the center of the lake until reaching the northern regions.
The explanation for the decrease in nitrates in the periods 2000, 2001, and 2002 is the decrease in the water level due to the many dams around the lake, especially in 2002. This led to the creation of an environment for the growth of plants and algae that consume nitrates. The source of pollution was mainly sewage water from a Liaoyuan River in the southeast of the lake. On 19 October 2020, the sources of NO3-N increased from agricultural lands at different sectors of the lake, especially in the southwest part. In addition to sewage and household water from urban land, the east Liaohe River is considered the primary supply source and pollution source of the Erlong Lake.

3.5.3. Dissolved Oxygen

Previous studies have proven that dissolved oxygen is one of the most important environmental variables that affect the biology of living organisms in water, such as fish. The fish community structure and its composition can be affected by lethal and non-lethal oxygen concentrations [40,41]. Furthermore, the high levels of dissolved oxygen usually result from the photosynthesis of a large number of plants. Remarkable uncontrolled plant growth, especially algal blooms, is often the result of fertilizer runoff. This phenomenon is called cultural eutrophication.
Figure 8 presents the spatial distribution of dissolved oxygen. On 18 September 2000 (Figure 8a), DO was high in the northern and southeastern parts of the lake, exceeding 17 mg/L. However, the high values of dissolved oxygen (>15 mg/L) (Figure 8b) were concentrated in the southeast region and slightly on the northeastern edges of the lake on 16 September 2001 (Figure 8c). On 15 September 2002, high values of DO (>13 mg/L) were noted to be distributed in the southeast of the lake. The same high concentration of DO witnessed in the lake on 19 October 2020 (>13 mg/L) (Figure 8d) contributed to the edge of the southeastern region. Simultaneously, there was a severe decrease (<7.1 mg/L) in the other areas of the lake. It was found that the increase in the amount of DO (Figure 8) in the lake during the periods of 2000, 2001, and 2002 indicated that the water was shallow, which led to an abundance of algae, plankton, and nutrients in the lake, especially in 2002. On 19 October 2020, the lake saw a drop in dissolved oxygen concentration, possibly due to the fish and organisms consuming most of the oxygen in it [42,43,44,45].

4. Discussion

The use of remote sensing technology, particularly with large-scale data, is an appropriate approach for monitoring phenomena on an evolutionary time scale. Besides, limnology can take advantage of this technology, which allows for near-real-time data collection at scale, thus, achieving a more robust understanding of ecosystem response [46]. Multispectral sensors of Landsat images (e.g., TM, ETM, and OLI8) are more widely used in research than hyperspectral sensors [47] in the monitoring of water quality changes, even with limited field sampling [20,48]. This is widely accepted, and thus, it was among the primary motivations to consider this for the present study.
Most previous studies focused on monitoring the concentrations of substances with optical properties in the water, such as chlorophyll [49,50,51,52,53] and turbidity [54,55,56]. Few studies focused on components that lack optical properties in the water, e.g., NH4-N, NO3-N), and DO [20]. Likewise, [57] used band combinations (B2, B3, and B4) of HJ-1, but there was a low association with their estimation models, where NO3-N was 0.7 and NH4-N was negligible < 0.5. Furthermore, [58] used blue, green, red, and NIR of TM Landsat images to monitor total nitrogen, but this was unsuccessful (R2 = 0.24). Furthermore, [46] created a model for NH4 using B1, B3, B4 of Landsat OLI8, with R2 = 0.26. On the other hand, there were no studies that used Landsat images to estimate V-phenol.
According to the present study, water quality parameters (V-phenol, NH4-N, NO3-N, but not DO) show that there are generally perfect correlations with band combinations (blue, green, red, and NIR) of Landsat images (TM, ETM, and OLI8). The results, through calibration and validation, suggest that the empirical algorithms (Table 3) are powerful enough to be used to retrieve and predict water quality in Erlong Lake for the same parameters in many months and years to come, which is considered a significant contribution of this study. Moreover, the results suggest that water quality can be successfully derived through remote sensing data [59].
It was found that the lab analysis results and models created from Landsat images for V-phenol, NH4-N, NO3-N, and DO in Erlong Lake were reported with the same trends (Table 2 and Figure 3). However, there were simple differences, especially in July and August 2002, which can only be attributed to the difference in the time (Table 1) between in situ data collection and the satellite image acquisition date [54]. This difference affects the results, especially with V-phenol, NO3-N, and NH4-N (Table 4 and Figure 4). Furthermore, there was a brief difference between in situ and model averages in 2020, especially with NO3-N and V-phenol (Table 4 and Figure 4). This may be due to the difference in sample locations (Figure 1). On the other hand, by comparing the averages of V-phenol, NH4-N, and NO3-N in 2000, 2001, 2002, and 2020, we found that 2020 had the highest concentration (V-phenol, NH4-N, and NO3-N). We also conclude that NH4-N concentrations change seasonally [37], and V-phenol and NO3-N concentrations increase in deep and mixed lakes, while V-phenol, NH4-N, and NO3-N concentrations decrease in shallow water. Unlike DO, which showed high concentrations in shallow water and low concentrations in deep and stable water in lakes.
The spatial distributions of water quality parameters (V-phenol, NH4-N, NO3-N, and DO) in Erlong Lake were verified by applying algorithms created via models from the selected satellite images. Remote sensing images can provide high-accuracy interpolation and create explicit spatial distribution for water quality maps more efficiently [20,48]. Therefore, the spatial distribution of V-phenol, NH4-N, and NO3-N (Figure 5, Figure 6 and Figure 7) showed an increase with time. The results show that the highest spatial distribution was in 2020 compared to 2000, 2001, and 2002 due to an increasing population and extensive land use. Moreover, it was observed that water quality is strongly related to land uses [60], such as agriculture, sewage, industrial and household water, and animal waste. Moreover, due to the changes in water level as the environmental factor, which has a significant influence on water quality in the lake [61]. The spatial distribution of DO (Figure 8) was high in the years 2000, 2001, and 2002, which indicates the shallowness of the water compared to the spread of plants and algae during those years, as well as compared to the year 2020. The concentration of DO decreased, perhaps due to a large number of marine organisms, such as fish and other aquatic animals. [42,43,44,45].
In general, the results of this study show that monitoring water quality through remote sensing data is crucial, especially the concentration of non-interacting objects with reflections, such as nitrates and ammonium. There have been a few attempts by several researchers, such as [46], but they have not succeeded, as the studies were conducted within a few months. Present results prove that it is possible to monitor and estimate water quality from Landsat images for several months and several years, as it was accurate in performance. Moreover, it can predict with broad spatial homogeneity. Seasonal water quality changes (V-phenol, NH4-N, and NO3-N, and DO) during 2000, 2001, 2002, and 2020 in the Erlong Lake were not considered, which represents the limitations of the current study. In terms of performance, it is possible to use algorithms for continuous monitoring in the lake, especially for V-phenol, NH4-N, and NO3-N. Models can also be used to monitor and control other lakes for the same selected parameters. In addition to the regression model, the neural network model can be used in future research to monitor and estimate the water quality in the Erlong Lake, which may help, spread knowledge, and protect the lake’s ecosystem of water quality.

5. Conclusions

Through the results, this study explains the relationship between the water quality parameters (V-phenol, NH4-N, DO, and NO3-N) and the reflectance data of the Landsat images (TM5, ETM7, OLI8). For all of the selected months across the years, we found a strong relationship according to the use of equations as general equations that we could use to monitor and estimate the amount of pollution in the lake, except for dissolved oxygen.
This study also clarified the correlation between the Landsat data and the measured data. It was found that blue, green, red, and NIR showed the best correlations, except for dissolved oxygen. This study also illustrates the direction of the V-phenol, NH4-N, DO, and NO3-N results from the lab and the results created from the model, where we found that both have the same trends.
The current study presents the spatial distribution of water parameters in the lake, which showed that the V-phenol, NH4-N, and NO3-N in shallow water were low, while in deep water they were high. Unlike DO, which showed high value in shallow water and low value in deep water.

Author Contributions

All authors contributed significantly to the preparation of this manuscript. Conceptualization, B.A.-S.; Methodology, B.A.-S., X.L., Z.T., M.Z. and A.E.-Z.; Software, B.A.-S. and C.F.; Validation., J.Z.; Formal analysis, B.A.-S. and J.Z.; Investigation, Z.T.; Resources, X.L.; Data curation, B.A.-S. and X.L.; Writing-original, B.A.-S.; Writing—review and editing, B.A.-S., X.L., A.E.-Z., M.H. and M.T.; Visualization, B.A.-S., X.L. and A.E.-Z.; Supervision, X.L.; Project administration, X.L.; Funding acquisition, X.L. and Z.T. All authors have read and agreed to the published version of the manuscript.

Funding

This research was supported by the Major Scientific and Technological Program of Jilin Province (Grant No. 20200503002SF), the Science and Technology Development Planning of Jilin Province (Grant No. 20190303081SF), and National Key Laboratory of soil and water pollution control and remediation for environmental protection (GHBK-2020-007).

Data Availability Statement

The supporting used in this article can be accessed from these sources. The remote sensing data such as Landsat TM, ETM, and OLI8 images used in the article can be found on the websites https://earthexplorer.usgs.gov/, accessed on 23 October 2020. The whole field data used in this research is available in on link link: https://pan.baidu.com/s/1R3R36Z120g26f9KX9PcHjA with code “ssd0”, accessed on 18 April 2021.

Acknowledgments

We would like to express our gratitude to the editors and anonymous reviewers for their valuable comments and constructive suggestions that improve the manuscript’s quality. We also would like to thank Kashif Allah for his valuable revision. The authors would like to extend their gratitude to the United States Geological Survey (USGS) for image data from Landsat TM, ETM and Landsat OLI.

Conflicts of Interest

The authors declare no conflict of interest.

References

  1. Nagy-Kovács, Z.; Davidesz, J.; Czihat-Mártonné, K.; Till, G.; Fleit, E.; Grischek, T. Water Quality Changes during Riverbank Filtration in Budapest, Hungary. Water 2019, 11, 302. [Google Scholar] [CrossRef] [Green Version]
  2. Sandhu, C.; Grischek, T.; Börnick, H.; Feller, J.; Sharma, S.K. A Water Quality Appraisal of Some Existing and Potential Riverbank Filtration Sites in India. Water 2019, 11, 215. [Google Scholar] [CrossRef] [Green Version]
  3. El-Batrawy, O.A.; Ibrahim, M.S.; Fakhry, H.; El-Aassar, M.R.; El-Zeiny, A.M.; El-Hamid, H.T.A.; El-Alfy, M.A. Anthropogenic Impacts on Water Quality of River Nile and Marine Environment, Rosetta Branch Using Geospatial Analyses. J. Environ. Sci. 2018, 47, 89–101. [Google Scholar] [CrossRef]
  4. Abdullah, H.S.A.; Mahdi, M.S.M.; Ibrahim, H.M.I. Water Quality Assessment Models for Dokan Lake Using Landsat 8 OLI Satellite Images. J. Zankoy Sulaimani Pure Appl. Sci. 2017, 4, 25–44. [Google Scholar] [CrossRef]
  5. Wang, Y.; Xia, H.; Fu, J.; Sheng, G. Water quality change in reservoirs of Shenzhen, China: Detection using LANDSAT/TM data. Sci. Total Environ. 2004, 328, 195–206. [Google Scholar] [CrossRef] [PubMed]
  6. Tolk, B.L.; Han, L.; Rundquist, D.C. The impact of bottom brightness on spectral reflectance of suspended sediments. Int. J. Remote Sens. 2000, 21, 2259–2268. [Google Scholar] [CrossRef]
  7. Zhang, C.X.; Liu, C.M.; Yang, H. Rational Allocation and Management of River Basin Water Resources; China Water Power Press: Beijing, China, 2007. [Google Scholar]
  8. Abdelmalik, K. Role of statistical remote sensing for Inland water quality parameters prediction. Egypt. J. Remote Sens. Space Sci. 2018, 21, 193–200. [Google Scholar] [CrossRef]
  9. Pavelsky, T.M.; Smith, L.C. Remote sensing of suspended sediment concentration, flow velocity, and lake recharge in the Peace-Athabasca Delta, Canada. Water Resour. Res. 2009, 45. [Google Scholar] [CrossRef]
  10. El-Zeiny, A.; El-Kafrawy, S. Assessment of water pollution induced by human activities in Burullus Lake using Landsat 8 operational land imager and GIS. Egypt. J. Remote Sens. Space Sci. 2017, 20, S49–S56. [Google Scholar] [CrossRef] [Green Version]
  11. Ritchie, J.C.; Zimba, P.V.; Everitt, J.H. Remote Sensing Techniques to Assess Water Quality. Photogramm. Eng. Remote Sens. 2003, 69, 695–704. [Google Scholar] [CrossRef] [Green Version]
  12. Hellweger, F.; Schlosser, P.; Lall, U.; Weissel, J. Use of satellite imagery for water quality studies in New York Harbor. Estuar. Coast. Shelf Sci. 2004, 61, 437–448. [Google Scholar] [CrossRef]
  13. Doña, C.; Chang, N.-B.; Caselles, V.; Sánchez, J.M.; Camacho, A.; Delegido, J.; Vannah, B.W. Integrated satellite data fusion and mining for monitoring lake water quality status of the Albufera de Valencia in Spain. J. Environ. Manag. 2015, 151, 416–426. [Google Scholar] [CrossRef] [Green Version]
  14. Hadjimitsis, D.G.; Hadjimitsis, M.G.; Toulios, L.; Clayton, C. Use of space technology for assisting water quality assessment and monitoring of inland water bodies. Phys. Chem. Earth Parts A/B/C 2010, 35, 115–120. [Google Scholar] [CrossRef]
  15. Rajitha, K.; Mukherjee, C.; Chandran, R.V. Applications of remote sensing and GIS for sustainable management of shrimp culture in India. Aquac. Eng. 2007, 36, 1–17. [Google Scholar] [CrossRef]
  16. Alexandridis, T.K.; Topaloglou, C.A.; Lazaridou, E.; Zalidis, G.C. The performance of satellite images in mapping aquacultures. Ocean Coast. Manag. 2008, 51, 638–644. [Google Scholar] [CrossRef]
  17. Abd-Elrahman, A.; Croxton, M.; Pande-Chettri, R.; Toor, G.S.; Smith, S.; Hill, J. In situ estimation of water quality parameters in freshwater aquaculture ponds using hyperspectral imaging system. ISPRS J. Photogramm. Remote Sens. 2011, 66, 463–472. [Google Scholar] [CrossRef]
  18. Wu, M.; Zhang, W.; Wang, X.; Luo, D. Application of MODIS satellite data in monitoring water quality parameters of Chaohu Lake in China. Environ. Monit. Assess. 2008, 148, 255–264. [Google Scholar] [CrossRef]
  19. Gholizadeh, M.H.; Melesse, A.M.; Reddi, L. A Comprehensive Review on Water Quality Parameters Estimation Using Remote Sensing Techniques. Sensors 2016, 16, 1298. [Google Scholar] [CrossRef] [PubMed] [Green Version]
  20. Yu, X.; Yi, H.; Liu, X.; Wang, Y.; Liu, X.; Zhang, H. Remote-sensing estimation of dissolved inorganic nitrogen concentration in the Bohai Sea using band combinations derived from MODIS data. Int. J. Remote Sens. 2016, 37, 327–340. [Google Scholar] [CrossRef]
  21. Singh, A.; Jakubowski, A.R.; Chidister, I.; Townsend, P.A. A MODIS approach to predicting stream water quality in Wisconsin. Remote Sens. Environ. 2013, 128, 74–86. [Google Scholar] [CrossRef]
  22. Mathew, M.M.; Rao, N.S.; Mandla, V.R. Development of regression equation to study the Total Nitrogen, Total Phosphorus and Suspended Sediment using remote sensing data in Gujarat and Maharashtra coast of India. J. Coast. Conserv. 2017, 21, 917–927. [Google Scholar] [CrossRef]
  23. Politi, E.; Prairie, Y.T. The potential of Earth Observation in modelling nutrient loading and water quality in lakes of southern Québec, Canada. Aquat. Sci. 2017, 80, 8. [Google Scholar] [CrossRef]
  24. Morel, A.Y.; Gordon, H.R. Report of the working group on water color. Bound. Layer Meteorol. 1980, 18, 343–355. [Google Scholar] [CrossRef]
  25. Wang, N.; Zhang, H.-Y.; Wang, H.-L.; Zhang, Z.-X. Spatial analysis of soil erosion and non-point source pollution based on gis in Erlong Lake watershed, Jilin Province. Chin. Geogr. Sci. 2004, 14, 355–360. [Google Scholar] [CrossRef]
  26. Chavez, P.S. Image-based atmospheric corrections-revisited and improved. Photogramm. Eng. Remote Sens. 1996, 62, 1025–1035. [Google Scholar]
  27. González-Márquez, L.C.; Torres-Bejarano, F.M.; Torregroza-Espinosa, A.C.; Hansen-Rodríguez, I.R.; Rodríguez-Gallegos, H.B. Use of LANDSAT 8 images for depth and water quality assessment of El Guájaro reservoir, Colombia. J. South Am. Earth Sci. 2018, 82, 231–238. [Google Scholar] [CrossRef]
  28. Sharma, J.N.; Kanakiya, R.S.; Singh, S.K. Characterisation study and correlation analysis for water quality of Dal Lake, India. Int. J. Lakes Rivers 2015, 8, 25–33. [Google Scholar]
  29. He, S.; Fischer, J.; Schaale, M.; He, M.-X. Optical closure of parameterized bio-optical relationships. Chin. J. Oceanol. Limnol. 2014, 32, 480–489. [Google Scholar] [CrossRef]
  30. Cheng, Q.; Liu, B.; Li, T.; Zhu, L. Research on remote sensing retrieval of suspended sediment concentration in Hangzhou Bay by GF-1 satellite. Mar. Environ. Sci. 2015, 34, 558–563. [Google Scholar]
  31. Brown, P.M.B.L.C.; Hambley, D.F. Statistics for Environmental Engineers. Environ. Eng. Geosci. 2002, 8, 244–245. [Google Scholar] [CrossRef]
  32. Zhou, D.; Wang, D. Quantitative Estimation of Chlorophyll-a and Suspended Solids in Taihu Based on Landsat TM. Environ. Sci. Technol. 2015, 38, 362–367. [Google Scholar]
  33. Khattab, M.F.O.; Merkel, B.J. Application of Landsat 5 and Landsat 7 images data for water quality mapping in Mosul Dam Lake, Northern Iraq. Arab. J. Geosci. 2013, 7, 3557–3573. [Google Scholar] [CrossRef]
  34. El Saadi, A.M.; Yousry, M.M.; Jahin, H.S. Statistical estimation of Rosetta branch water quality using multi-spectral data. Water Sci. 2014, 28, 18–30. [Google Scholar] [CrossRef] [Green Version]
  35. Yüzügüllü, O.; Aksoy, A. Determination of Secchi Disc depths in Lake Eymir using remotely sensed data. Procedia Soc. Behav. Sci. 2011, 19, 586–592. [Google Scholar] [CrossRef] [Green Version]
  36. Ross, H.; Mannion, G. Curriculum Making as the Enactment of Dwelling in Places. Stud. Philos. Educ. 2012, 31, 303–313. [Google Scholar] [CrossRef]
  37. Shahzad, M.I.; Meraj, M.; Nazeer, M.; Zia, I.; Inam, A.; Mehmood, K.; Zafar, H. Empirical estimation of suspended solids concentration in the Indus Delta Region using Landsat-7 ETM+ imagery. J. Environ. Manag. 2018, 209, 254–261. [Google Scholar] [CrossRef] [PubMed]
  38. Bhateria, R.; Jain, D. Water quality assessment of lake water: A review. Sustain. Water Resour. Manag. 2016, 2, 161–173. [Google Scholar] [CrossRef] [Green Version]
  39. Das, B.D. Assessment of Surface Water Quality of Chimdi Lake of Sunsari District, Nepal. Int. J. Nat. Resour. Ecol. Manag. 2017, 2, 20. [Google Scholar] [CrossRef] [Green Version]
  40. Alabaster, J.S.; Calamari, D.; Dethlefsen, V.; Konemann, H.; Lloyd, R.; Solbé, J.F. Water Quality Criteria for European Freshwater Fish. Chem. Ecol. 1988, 3, 165–253. [Google Scholar] [CrossRef]
  41. Franklin, P. Dissolved oxygen criteria for freshwater fish in New Zealand: A revised approach. N. Z. J. Mar. Freshw. Res. 2013, 48, 112–126. [Google Scholar] [CrossRef]
  42. Pollock, M.; Clarke, L.; Dubé, M. The effects of hypoxia on fishes: From ecological relevance to physiological effects. Environ. Rev. 2007, 15, 1–14. [Google Scholar] [CrossRef]
  43. Davis, J.C. Minimal Dissolved Oxygen Requirements of Aquatic Life with Emphasis on Canadian Species: A Review. J. Fish. Res. Board Can. 1975, 32, 2295–2332. [Google Scholar] [CrossRef]
  44. Champman, G. Ambient Water Quality Criteria for Dissolved Oxygen. 1986. Available online: https://scholar.google.com/scholar?hl=ar&as_sdt=2005&scodt=0%2C5&cites=8744966817855990050&scipsc=&q=47.%09Champman%2C+G.+Ambient+Water+Quality+Criteria+for+Dissolved+Oxygen.+1986.+&btnG= (accessed on 19 January 2021).
  45. Kramer, D.L. Dissolved oxygen and fish behavior. Environ. Boil. Fishes 1987, 18, 81–92. [Google Scholar] [CrossRef]
  46. Markogianni, V.; Kalivas, D.; Petropoulos, G.P.; Dimitriou, E. An Appraisal of the Potential of Landsat 8 in Estimating Chlorophyll-a, Ammonium Concentrations and Other Water Quality Indicators. Remote Sens. 2018, 10, 1018. [Google Scholar] [CrossRef] [Green Version]
  47. Wang, X.; Yang, W. Water quality monitoring and evaluation using remote sensing techniques in China: A systematic review. Ecosyst. Health Sustain. 2019, 5, 47–56. [Google Scholar] [CrossRef] [Green Version]
  48. Giardino, C.; Bresciani, M.; Villa, P.; Martinelli, A. Application of Remote Sensing in Water Resource Management: The Case Study of Lake Trasimeno, Italy. Water Resour. Manag. 2010, 24, 3885–3899. [Google Scholar] [CrossRef]
  49. Ritchie, J.C.; Cooper, C.M.; Schiebe, F.R. The relationship of MSS and TM digital data with suspended sediments, chlorophyll, and temperature in Moon Lake, Mississippi. Remote Sens. Environ. 1990, 33, 137–148. [Google Scholar] [CrossRef]
  50. Lathrop, R.G. Landsat Thematic Mapper monitoring of turbid inland water quality. Photogramm. Eng. Remote Sens. 1992, 58, 465–470. [Google Scholar]
  51. Quibell, G. The effect of suspended sediment on reflectance from freshwater algae. Int. J. Remote Sens. 1991, 12, 177–182. [Google Scholar] [CrossRef]
  52. Lim, J.; Choi, M. Assessment of water quality based on Landsat 8 operational land imager associated with human activities in Korea. Environ. Monit. Assess. 2015, 187, 1–17. [Google Scholar] [CrossRef]
  53. Guo, Q.; Wu, X.; Bing, Q.; Pan, Y.; Wang, Z.; Fu, Y.; Wang, D.; Liu, J. Study on Retrieval of Chlorophyll-a Concentration Based on Landsat OLI Imagery in the Haihe River, China. Sustainability 2016, 8, 758. [Google Scholar] [CrossRef] [Green Version]
  54. Allam, M.; Khan, M.Y.A.; Meng, Q. Retrieval of Turbidity on a Spatio-Temporal Scale Using Landsat 8 SR: A Case Study of the Ramganga River in the Ganges Basin, India. Appl. Sci. 2020, 10, 3702. [Google Scholar] [CrossRef]
  55. El Din, E.S. Enhancing the accuracy of retrieving quantities of turbidity and total suspended solids using Landsat-8-based-principal component analysis technique. J. Spat. Sci. 2019, 1–20. [Google Scholar] [CrossRef]
  56. Zheng, Z.; Ren, J.; Li, Y.; Huang, C.; Liu, G.; Du, C.; Lyu, H. Remote sensing of diffuse attenuation coefficient patterns from Landsat 8 OLI imagery of turbid inland waters: A case study of Dongting Lake. Sci. Total. Environ. 2016, 573, 39–54. [Google Scholar] [CrossRef] [PubMed]
  57. Huang, Y.; Fan, D.; Liu, D.; Song, L.; Ji, D.; Hui, E. Nutrient estimation by HJ-1 satellite imagery of Xiangxi Bay, Three Gorges Reservoir, China. Environ. Earth Sci. 2016, 75, 633. [Google Scholar] [CrossRef]
  58. Isenstein, E.M.; Park, M.-H. Assessment of nutrient distributions in Lake Champlain using satellite remote sensing. J. Environ. Sci. 2014, 26, 1831–1836. [Google Scholar] [CrossRef]
  59. Kapalanga, T.S.; Hoko, Z.; Gumindoga, W.; Chikwiramakomo, L. Remote-sensing-based algorithms for water quality monitoring in Olushandja Dam, north-central Namibia. Water Supply 2020. [Google Scholar] [CrossRef]
  60. Pu, F.; Ding, C.; Chao, Z.; Yu, Y.; Xu, X. Water-Quality Classification of Inland Lakes Using Landsat8 Images by Convolutional Neural Networks. Remote Sens. 2019, 11, 1674. [Google Scholar] [CrossRef] [Green Version]
  61. Bai, X.; Hu, W. Effect of water depth on concentration of TN, TP and Chla in Taihu Lake, China. Adv. Water Sci. 2006, 17, 732. [Google Scholar]
Figure 1. Study area map and locations of the water samples.
Remotesensing 13 01603 g001
Figure 2. Water surface area changes (ha).
Remotesensing 13 01603 g002
Figure 3. Relational plot of the in situ water quality parameters and estimations from Landsat (TM, ETM, and OLI) in Erlong Lake.
Remotesensing 13 01603 g003
Figure 4. The trend of laboratory-measured results ((a) V-phenol, (b) NO3-N, (c) NH4-N, and (d) DO), and model results for water parameters in Erlong Lake.
Remotesensing 13 01603 g004
Figure 5. Spatial distributions of V-phenol ((a) spatial distributions of V-phenol on 18 September 2000, (b) spatial distributions of V-phenol on 16 September 2001, (c) spatial distributions of V-phenol on 15 September 2002, (d) spatial distribution of V-phenol on 19 October 2020), estimated via models generated from Landsat (TM, ETM, and OLI8) in Erlong Lake.
Remotesensing 13 01603 g005
Figure 6. Spatial distributions of NH4-N ((a) spatial distributions of NH4-N on 18 September 2000, (b) spatial distributions of NH4-N on 16 September 2001, (c) spatial distributions of NH4-N 15 September 2002, (d) spatial distributions of NH4-N on19 October 2020), estimated via models generated from Landsat (TM, ETM, and OLI8) in Erlong Lake.
Remotesensing 13 01603 g006
Figure 7. Spatial distributions of NO3-N ((a) spatial distributions of NO3-N on 18 September 2000, (b) spatial distributions of NO3-N on 16 September 2001, (c) spatial distributions of NO3-N on 15 September 2002, (d) spatial distributions of NO3-N on 19 October 2020), estimated via models generated from Landsat (TM, ETM, and OLI8) in Erlong Lake.
Remotesensing 13 01603 g007
Figure 8. Spatial distributions of dissolved oxygen ((a) spatial distributions of DO on 18 September 2000, (b) spatial distributions of DO on 16 September 2001, (c) spatial distributions of DO on 15 September 2002, (d) spatial distributions of DO on 19 October 2020), estimated via models generated from Landsat (TM, ETM, and OLI8) in Erlong Lake.
Remotesensing 13 01603 g008
Table 1. Landsat images selected, based on measured field data.
Water Quality Sampling DateSamples NOSpectral Bands SelectedSensor NameDate of ImagesDifference Days
15 May 2000Two(B-G-R-NIR)TM 528 May 200013
17 July 2000Two(B-G-R-NIR)TM 58 July 20009
15 August 2000Two(B-G-R-NIR)ETM 717 August 20002
18 September 2000Two(B-G-R-NIR)TM 526 September 20008
15 May 2001Two(B-G-R-NIR)ETM 716 May 20011
16 July 2001Two(B-G-R-NIR)TM 518 July 20012
16 August 2001Two(B-G-R-NIR)TM 512 August 20014
16 September 2001Two(B-G-R-NIR)TM 513 September 20013
15 May 2002Two(B-G-R-NIR)TM 518 May 20023
14 July 2002Two(B-G-R-NIR)TM 528 June 200216
15 August 2002Two(B-G-R-NIR)TM 531 August 200216
15 September 2002Two(B-G-R-NIR)TM 516 September 20021
19 October 2020Seven(B-G-R-NIR)OLI 819 October 20200
Table 2. Correlation matrix for in situ data and surface reflectance of visible and near-infrared of Landsat TM5, ETM+7, and OLI8 bands.
Water QualityV-PHENNH4-NDONO3-N(R + NIR) + (B/NIR)(G/NIR)/(B + G) ∗ (G)(NIR − R) ∗ (NIR/G)
V-PHEN (mg/L)1
NH4-N (mg/L)0.849 **1
DO (mg/L)−0.181−0.0541
NO3-N (mg/L)0.823 **0.915 **−0.0321
(R + NIR) + (B/NIR)0.918 **0.901 **−0.130.864 **1
(G/NIR)/(B + G) ∗ (G)0.909 **0.859 **−0.2580.838 **0.966 **1
(NIR − R) ∗ (NIR/G)−0.351−0.280.639 **−0.284−0.355−0.542 **1
** Correlation is significant at the 0.01 level (2-tailed), where B, G, R, and NIR means blue, green, red, and near-infrared, respectively.
Table 3. Models generated from Landsat images (TM, ETM, and OLI8) to estimate water quality.
Water Quality ParametersEquationsCalibration Validation
R2RMSESigR2RMSE
V-PHENOL (mg/L) = ( ( R + N I R ) + ( B N I R ) ) × ( 0.004257 ) 0.8050.0380.0000.9790.050
NH4-N (mg/L) = 0.8 × ( ( R + N I R ) + ( B N I R ) × ( B + N I R ) + ( B N I R ) ) × 0.099 0.8620.6450.0000.9540.525
NO3-N (mg/L) = ( R + NIR ) + e ( B N I R ) × ( 0.029 ) + e G N I R B + G × ( G ) ×(0.5)0.8788.4950.0000.9921.048
DO (mg/L) = ( N I R R ) × ( ( N I R G ) × 80 ) + 8.3 0.3040.7520.0000.6191.390
Table 4. Mean values of water quality from in situ measurements and mean values generated from the models along Erlong Lake.
Date In Situ Water Quality ParametersEstimated Water Quality from the Models
YearsMonthsStatisticsV-PHEN In Situ (mg/L)NH4-N In Situ (mg/L)DO In Situ (mg/L)NO3-N In Situ (mg/L)V-PHEN Estimated (mg/L)NH4-N Estimated (mg/L)DO Estimated (mg/L)NO3-N Estimated (mg/L)
2000MayMean0.00620.21307.48500.66050.00880.32757.40900.5278
JulyMean0.01700.01206.29000.54500.01050.47966.77240.8457
AugustMean0.00710.14507.07500.76250.00910.35536.23700.6604
SeptemberMean0.01610.01206.07500.94000.01160.58585.29371.1680
2001MayMean0.00360.35755.90001.23500.00920.36485.31680.6144
JulyMean0.00340.04605.07501.31500.00650.18765.34780.6613
AugustMean0.00680.01204.98501.16750.00950.38904.05620.9469
SeptemberMean0.00370.01206.14500.53750.01050.48316.33930.9028
2002MayMean0.00750.56757.32001.39500.00960.40137.72080.6611
JulyMean0.00150.00105.68501.83250.00880.33566.76310.6509
AugustMean0.00010.00106.52501.37500.00900.35697.57720.6356
SeptemberMean0.00010.00107.91002.71000.00980.42127.55700.6944
2020OctoberMean0.07611.80006.10009.57140.01861.50555.27074.8026
Publisher’s Note: MDPI stays neutral with regard to jurisdictional claims in published maps and institutional affiliations.

