Article

Warm Arctic Proglacial Lakes in the ASTER Surface Temperature Product

1
Department of Environment and Geography, Heslington West Campus, University of York, York YO10 5NG, UK
2
Department of Geography, University of Sheffield, Sheffield S10 2TN, UK
3
Department of Physics and Astronomy, University of Leicester, Leicester LE1 7RH, UK
*
Author to whom correspondence should be addressed.
Remote Sens. 2021, 13(15), 2987; https://doi.org/10.3390/rs13152987
Submission received: 31 May 2021 / Revised: 9 July 2021 / Accepted: 17 July 2021 / Published: 29 July 2021
(This article belongs to the Special Issue Applications of Remote Sensing in Limnology)

Abstract

:
Despite an increase in heatwaves and rising air temperatures in the Arctic, little research has been conducted into the temperatures of proglacial lakes in the region. An assumption persists that they are cold and uniformly feature a temperature of 1 °C. This is important to test, given the rising air temperatures in the region (reported in this study) and potential to increase water temperatures, thus increasing subaqueous melting and the retreat of glacier termini from where they are in contact with lakes. Through analysis of ASTER surface temperature product data, we report warm (>4 °C) proglacial lake surface water temperatures (LSWT) for both ice-contact and non-ice-contact lakes, as well as substantial spatial heterogeneity. We present in situ validation data (from problematic maritime areas) and a workflow that facilitates the extraction of robust LSWT data from the high-resolution (90 m) ASTER surface temperature product (AST08). This enables spatial patterns to be analysed in conjunction with surrounding thermal influences, such as parent glaciers and topographies. This workflow can be utilised for the analysis of the LSWT data of other small lakes and crucially allows high spatial resolution study of how they have responded to changes in climate. Further study of the LSWT is essential in the Arctic given the amplification of climate change across the region.

Graphical Abstract

1. Introduction

Lake systems are sentinels of climate change and can be used to gauge terrestrial response to changes in climate [1]. They also represent a major component of liquid freshwater storage on Earth and support biodiversity, as well as providing vital ecosystem services [2,3]. Long-term (annual/decadal) changes in lake surface water temperatures (LSWTs; following Merchant et al. [4]) are closely correlated with shifts in regional air temperature patterns, making them useful indicators of regional climate fluctuations [1,2,5]. Within this context, O’Reilly et al. [2] reported a significant warming of 0.34 °C decade−1 for 235 globally distributed LSWTs (data spanning from 1985 to 2009) and noted the “consistency” with recorded synchronous global increases in air temperatures of 0.25 °C decade−1 (1979 to 2012) [6]. However, the patterns for LSWT increases are not homogeneous, and regional patterns are apparent with some individual LSWT trends diverging from air temperature trends as a range of other lake characteristics and meteorological conditions can also have a strong influence on the LSWT [2,5]. Consequently, it is essential to constrain and monitor proglacial lake LSWTs, as they are subject to climatic influences (increasingly so as lake ice cover durations decrease) and also cooling influences from the addition of glacial meltwater [7,8].
Significant lake-derived warming trends have been reported from night-time thermal infrared imagery analysis (ATSR—Along-Track Scanning Radiometer and AVHRR—Advanced Very High Resolution Radiometer) in the middle to high latitudes of the Northern Hemisphere, with maximum regional rates of 0.08 °C a−1 in lakes across Northern Europe [5]. Some of the most rapid increases in LSWT have been reported (from in situ measurements and/or satellite data) for seasonally ice-covered lakes (0.72 °C decade−1), particularly in areas that have also experienced marked increases in air temperature and solar radiation [2]. Given that the studies mentioned above [2,5] have only report data from large lakes (minimum of 500 km2, thereby excluding most proglacial lakes) with relatively coarse resolutions (1 km2 minimum) and the paucity of in situ data, in order to better understand the responses of small lake systems to climate change, we need to systematically investigate the thermal regimes of high-latitude lake systems. High-resolution satellite-based thermal sensors provide an adequate spatial resolution to achieve this [9]. This is particularly important as proglacial lakes (within Little Ice Age; LIA maximum glacier extents) are currently not included in Global Lake and Wetland Database (for Arctic areas at least). As such, Arctic proglacial lakes are effectively unmonitored systems and we argue that this must be addressed as they are highly sensitive to climatic and environmental changes (e.g., via glacial meltwater inputs), as well as being highly influential on downstream catchments [10].
In Arctic areas, annual air temperatures have been reported to have warmed at rates that are 1.7 times those of Northern Hemisphere average between 1971 and 2017 [11]. This is likely associated with the Arctic amplification of rising global temperatures through a series of feedbacks, in particular the effect of reductions in sea ice cover leading to decreased albedo values and decreased reflectance for incoming solar radiation [11,12]. A widespread reduction in lake ice cover (LIC) has been observed across the Northern Hemisphere, which increases both the annual duration of open water and susceptibility to warming [13]. Surface waters of seasonally ice-covered lakes are predicted to warm by 2.3 ± 0.6 °C by 2080 to 2100 under RCP 6.0 [3]. The observed increases in Arctic air temperatures, LSWTs, decreases in seasonal lake ice cover, and predicted future continuation of these trends makes it essential to further constrain proglacial LSWT responses to the climate, particularly as in situ data for these systems are limited and regional variability is poorly constrained [1,2,3,13].
The LSWT is driven by the absorbed solar irradiance and heat exchange with the atmosphere, which is controlled by the air temperature, solar radiation, humidity, ice cover, and wind [2,14]. Proglacial lakes also have the added factor of glacial meltwater input, which is likely to have a cooling effect [7]. These factors can vary substantially between lakes in different locations, particularly where distinct microclimates exist. For example, south-facing lakes at lower warmer elevations would experience more solar irradiance and greater positive heat exchange with higher air temperatures than higher north-facing lakes shaded by topography [2]. As such, it is essential to consider the topoclimatic situation of an individual lake when assessing the response of LSWT to climatic changes, as well as the geometric and hydrological factors (e.g., lake depth and surface area) which influence the cooling or warming of surface waters, in addition to potential mixing with deeper water [2,15]. The varied warming responses of lakes to changes in climate requires detailed analysis to assess the driving factors controlling changes at each lake [2]. Despite the warming trends in air and lake surface water temperatures discussed above, a general assumption persists that smaller lakes in contact with glacier termini have uniform temperatures of 1 °C [16]. It is important to test whether proglacial lakes remain a uniform 1 °C, especially given Arctic amplification of climatic warming in the Northern Hemisphere [12].
The water temperatures of proglacial lakes will also affect the recipient river water temperatures and geochemistry, particularly through nutrient cycling and the solubility of gases such as CO2 (which is temperature-dependent) [10,17,18]. Recent research by Pierre et al. [19] has also suggested that proglacial freshwaters are potentially a substantial sink for atmospheric CO2 through the chemical-based weathering of suspended sediment (glacial flour). Fellman et al. [10] found that there was a 0.9 °C to 1.5 °C rise in stream water temperature for every 1% change in watershed lake area coverage of catchments with a <30% glaciated area in Southeast Alaska through May to August in 2011. Given the predicted increases in future lake temperatures and glacial recession, it is essential to constrain the water temperatures of proglacial lakes through time as they respond to changes in climate [3].
Constraining ice-contact proglacial lake surface water temperatures is essential as thermal undercutting of the glacier may occur where water temperatures are high enough and may further enhance rates of glacier mass loss, which has been observed in several studies [20,21,22,23,24,25,26]. Furthermore, proglacial lakes are a key part of the hydrological system and have been increasing in number as glaciers retreat [27,28,29,30]. An increased input of meltwater is likely to have a cooling influence on proglacial lakes, depending on the length of the feeder stream [31]. Furthermore, contact with parent glaciers will have a cooling influence on the proglacial lake, although the spatial extent and persistence through time of this cooling zone has not been previously constrained [21,32]. Consequently, it is essential to constrain surface temperatures across proglacial lakes (ice proximal to ice distal) in order to assess the balance between the cooling influence from parent glaciers and the warming influence from meteorological conditions. In this regard, we analyse 12 proglacial lakes in a variety of stages of deglaciation in this work in order to assess the connectivity between the parent glacier system, and, most importantly, how both systems have responded to climatic changes. As such, this work assesses the responses of extremely valuable sentinels of climate change.
The relatively high resolution of ASTER satellite thermal imagery (90 m) facilitates the detection of land-emitted radiance of relatively small lakes and facilitates study of intralake LSWT variability [33]. The study of Wessels et al. [33] was one of the first to utilise ASTER thermal imagery (bands 10 to 12) to calculate mean brightness (radiant) temperatures for two supraglacial lakes (size unreported) on Ngozumpa Glacier of 276.6° K (3.45 °C) and 282.2° K (9.05 °C), which suggests that they can be warmer than the uniform 1 °C that has been previously assumed [16]. The only other study to utilise ASTER thermal imagery for the extraction of glacial lake surface temperatures to date is that of Watson et al. [26], who calculated average LSWTs for three Nepalese glacial lakes, with respective maximums of 9.6 °C, 7.2 °C and 10.8 °C between 2000 and 2018. The results presented by Watson et al. [26] represent an important advance in constraining high-altitude glacial lake seasonal thermal regimes throughout the melt season. In these examples, the authors highlighted the advantages that the five thermal bands of the ASTER satellite sensor have over alternative sensors (e.g., Landsat 8), particularly through deriving emissivity from the TES algorithm (see Section 2.2). It is worth noting that Watson et al. [26] acknowledged that uncertainties remain in these data and called for further validation of satellite-derived glacial LSWT data.

Aims and Objectives

The overall aim of this article is to investigate the thermal regimes of proglacial lakes (with ice-contact and non-ice-contact) across Arctic Sweden using the ASTER surface temperature product AST08. This research will underpin a wider need to quantify and account for the impact of rising lake temperatures on coupled glacial/proglacial systems, which is missing from the current scientific literature. To facilitate this, the principal objectives of this article are the following:
  • Provide one of the first validations of data from the AST08 surface temperature product against in situ lake body temperatures in maritime climates by using data from Arctic Sweden and Patagonia.
  • Measure surface temperatures for the 12 largest proglacial lakes in Arctic Sweden using calibrated AST08 data and analyse inter-lake variability in relation to the climate.
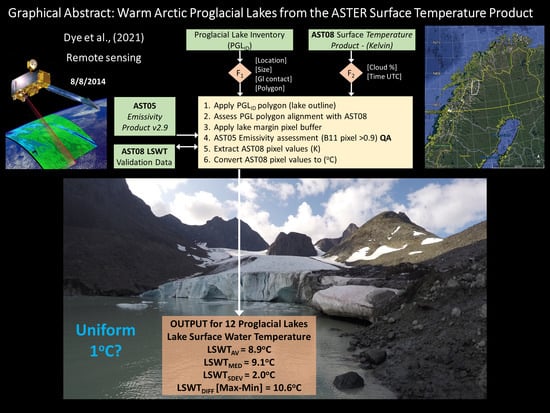
  • Analyse within-lake geospatial patterns in surface temperature to test the assumption that smaller lakes in contact with glacier termini have uniform temperatures of 1 °C and investigate the impacts of climate drivers and ice-contact on the LSWT across proglacial lakes greater than 129,600 m2.
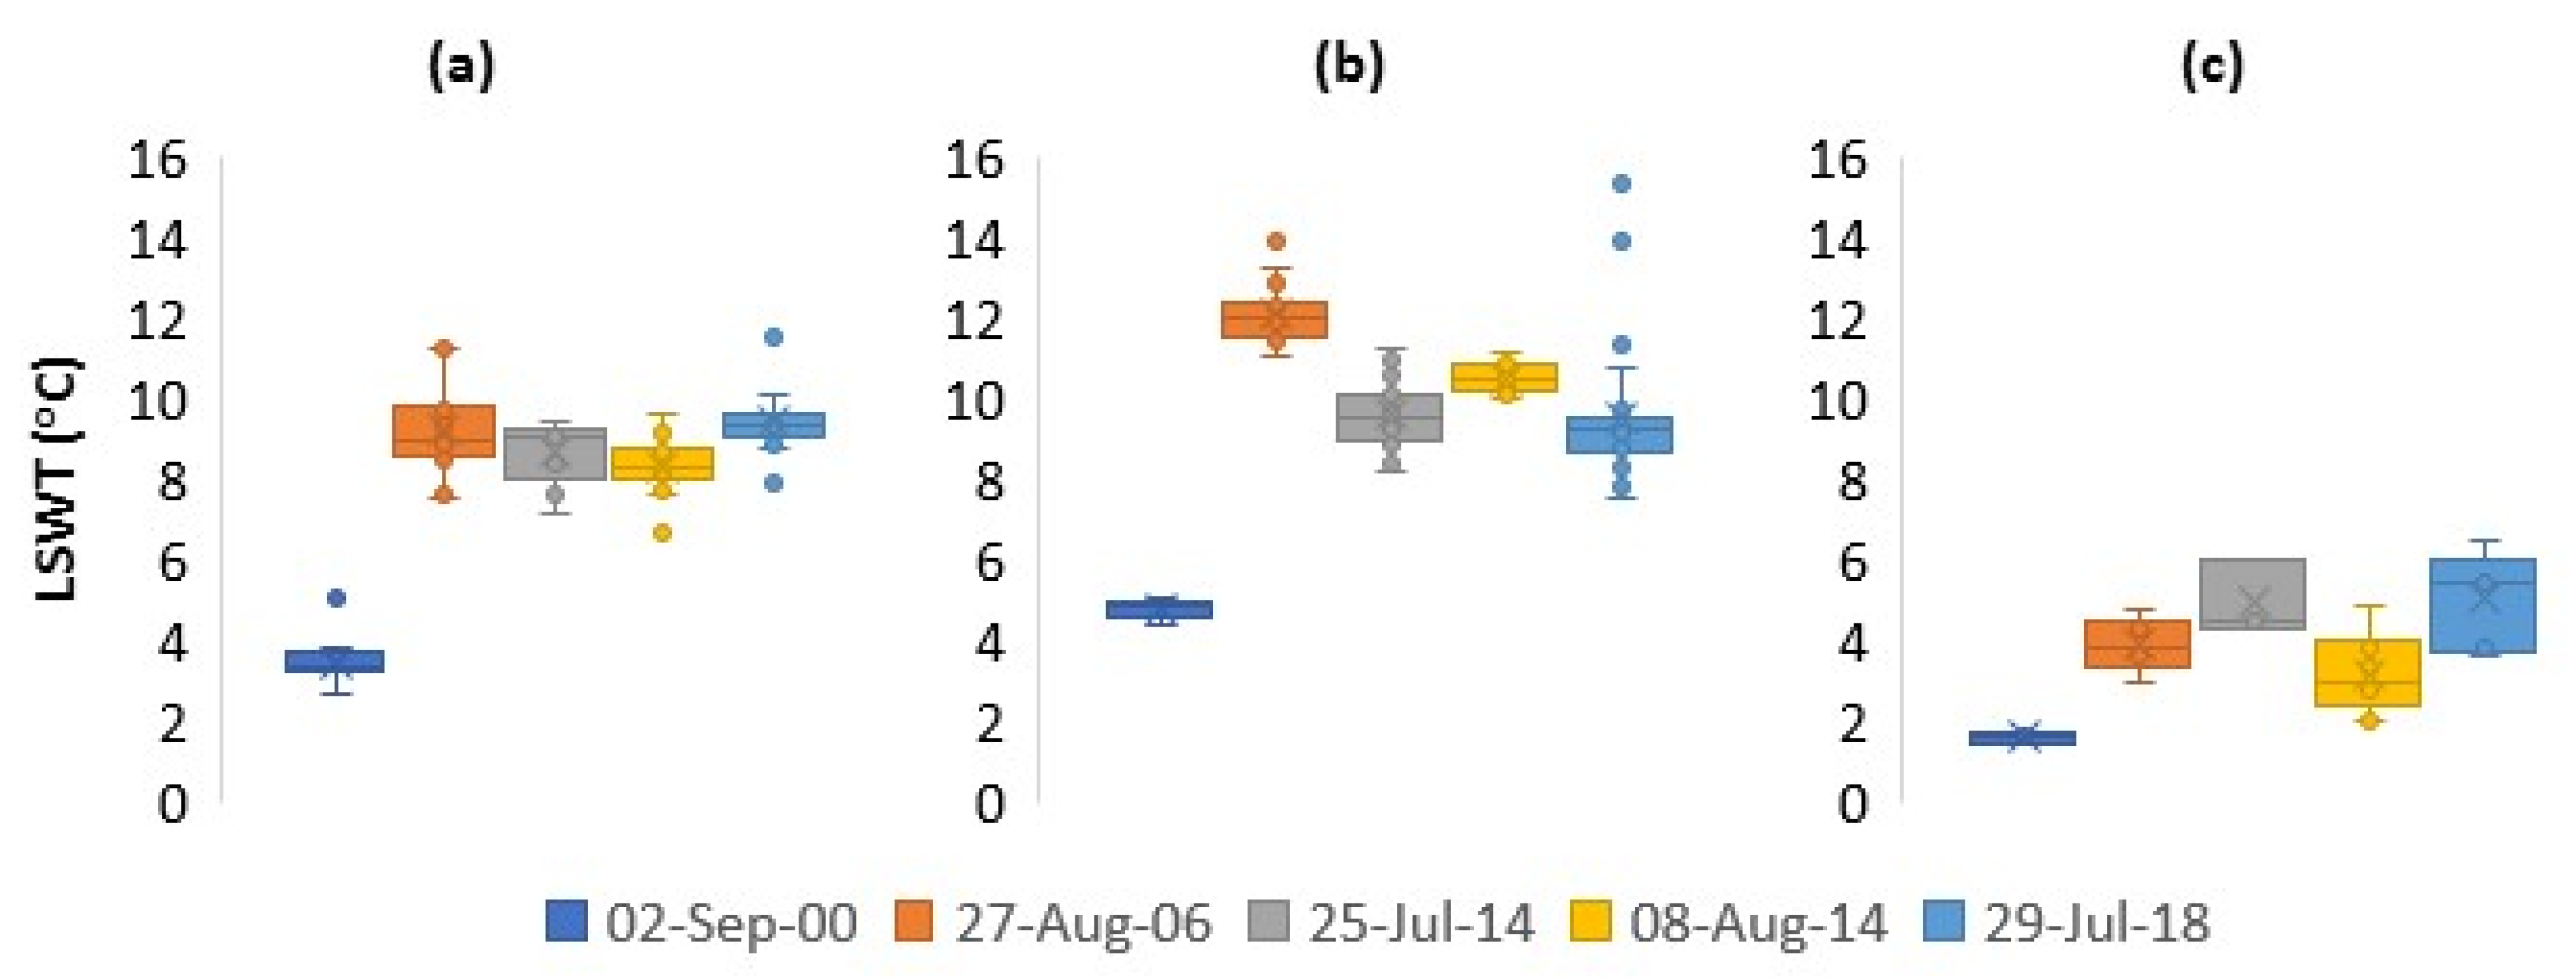
  • Assess summer proglacial lake surface temperature variability since 2000 using ASTER surface temperature product (AST08) data to investigate whether higher than 1 °C temperatures occur in several years and are not just associated with individual climate events.

2. Materials and Methods
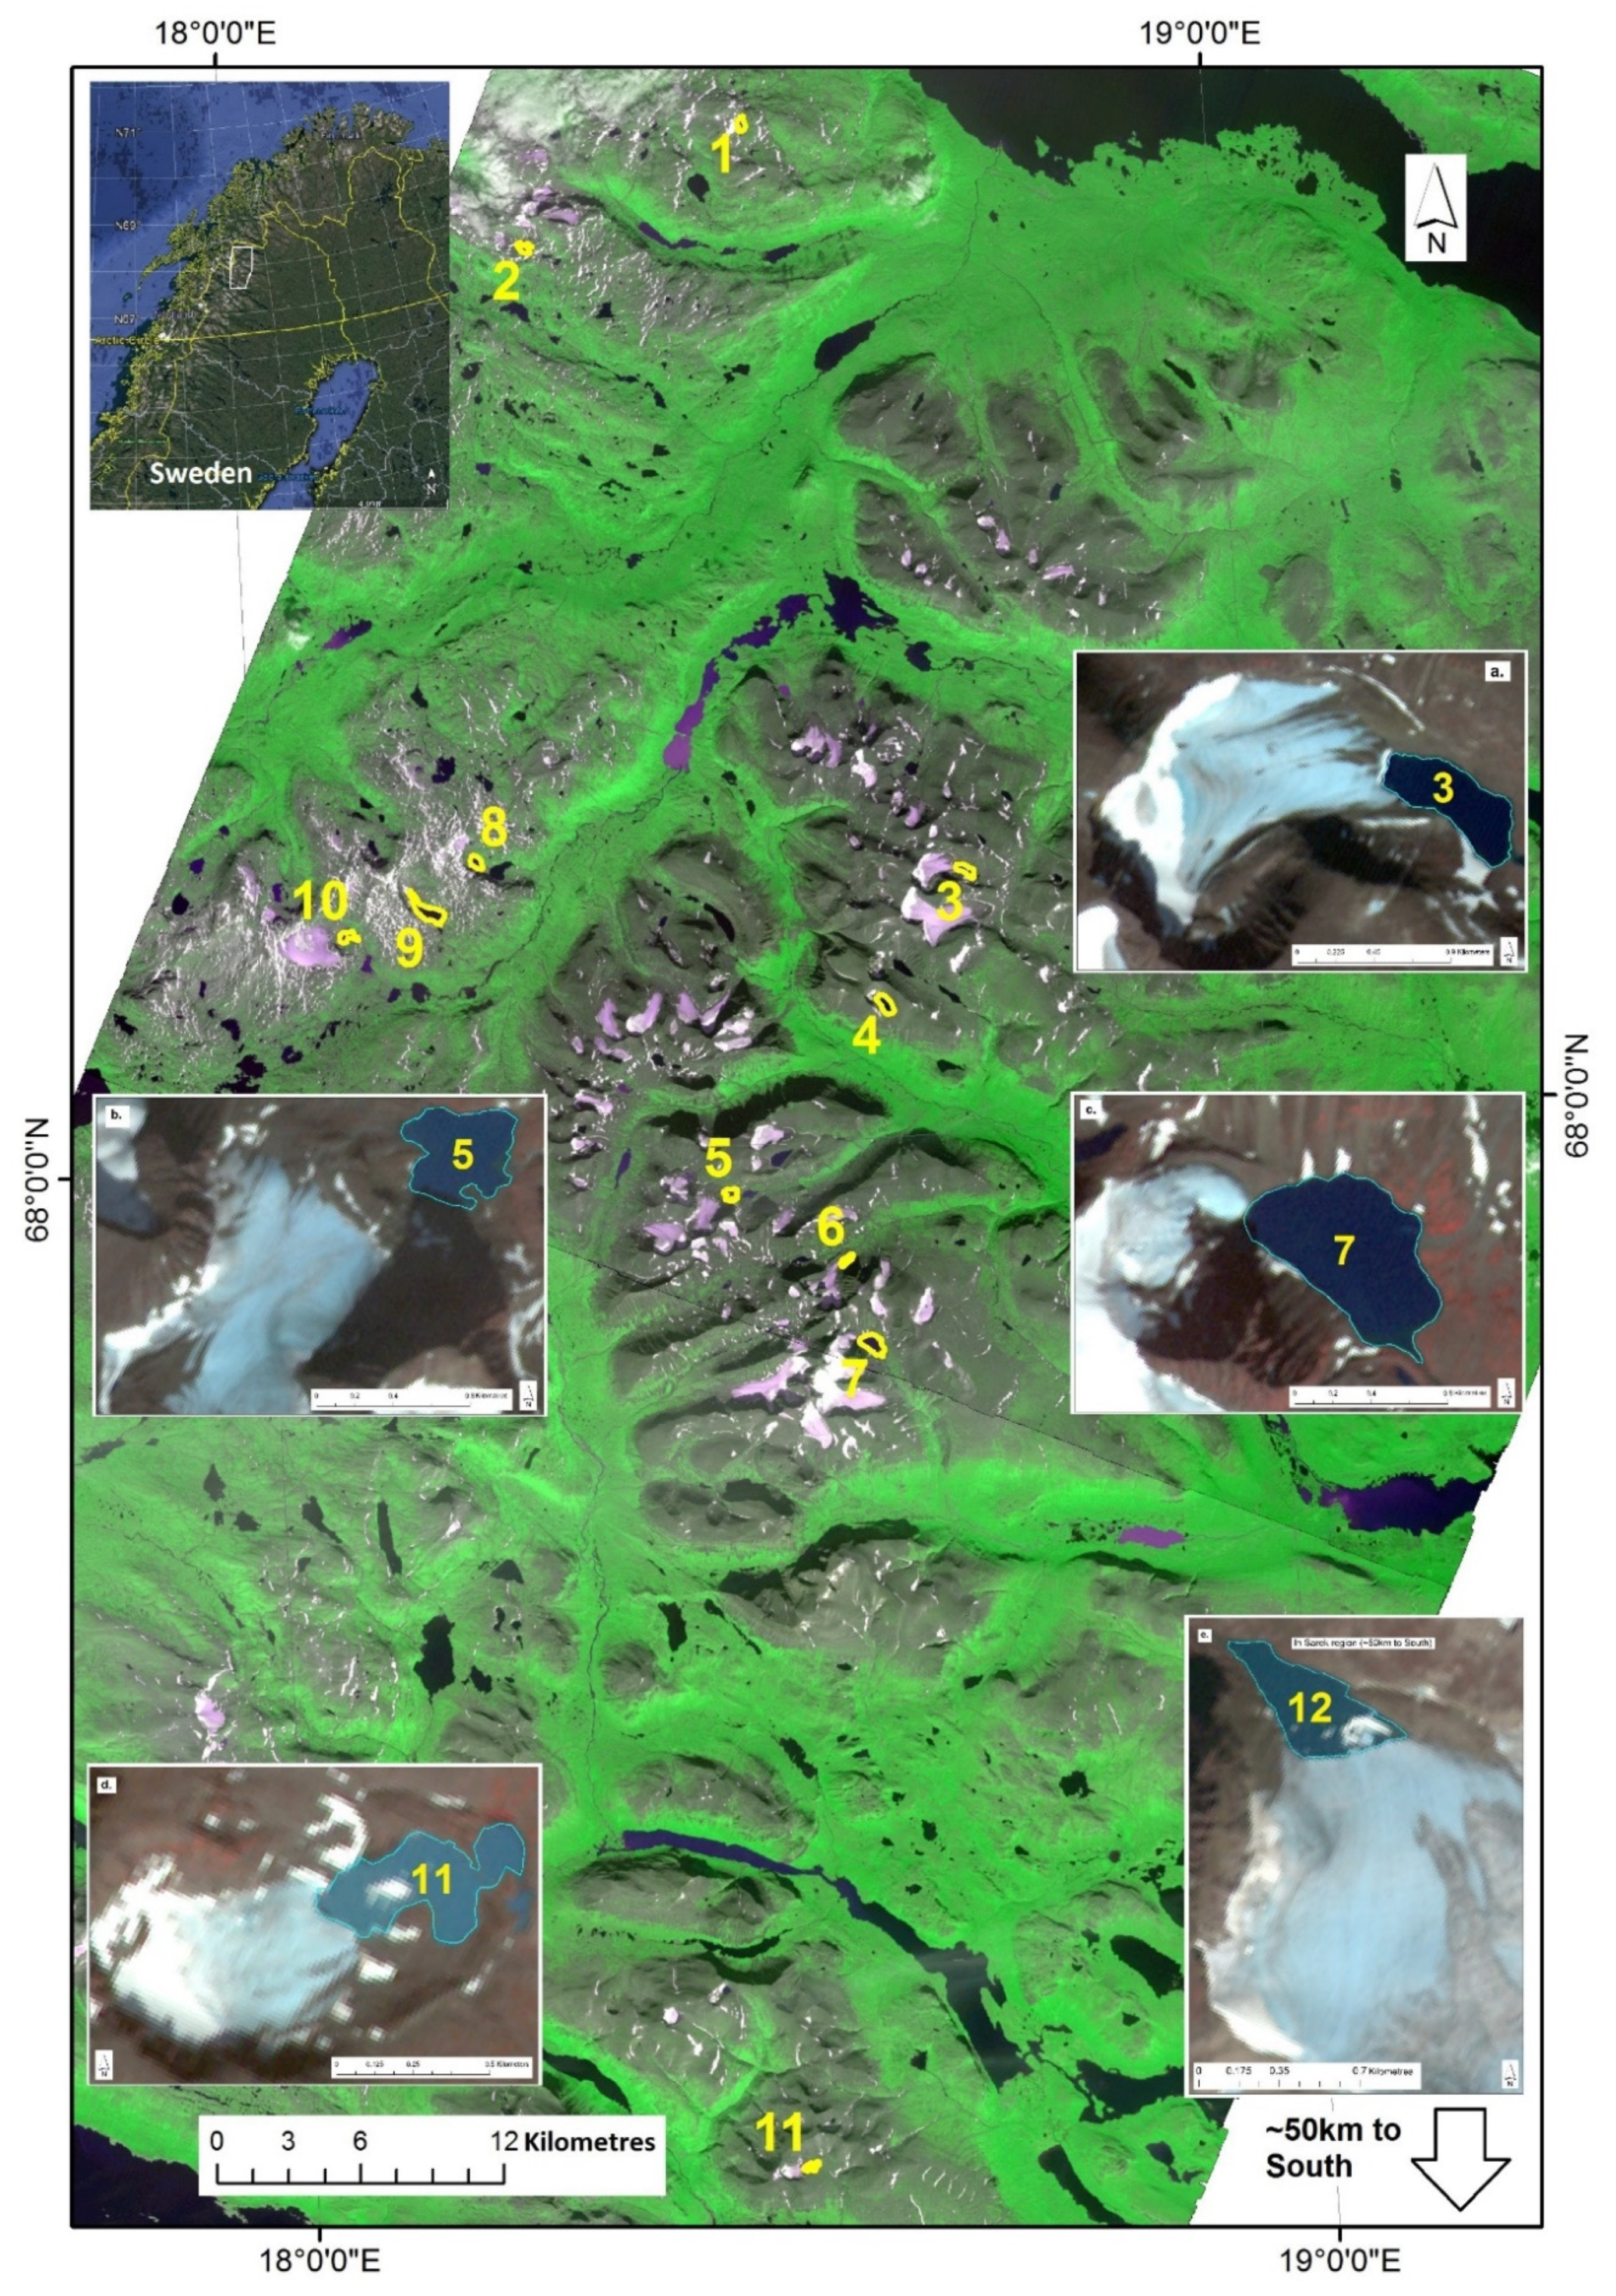
2.1. Study Area

This study focuses on an area of Arctic Sweden where increases in air temperature of 0.042 °C a−1 (1965–2011) have been reported at Tarfala Research Station, which is located at 1130 m above sea level in a valley containing proglacial lakes [34]. The mean annual air temperature (MAAT) for Tarfala is −3.5 ± 0.9 °C (1965–2011) and proglacial lakes in the area have historically developed seasonal ice cover [34]. The timing of ice onset and breakup for proglacial lakes in the study area is largely unconstrained and requires further investigation, particularly given the decreasing trend in annual duration of ice cover as observed for global lakes by 13.
The Swedish Meteorological Hydrological Institute (SMHI) meteorological data from Tarfala AWS are readily available for download (SMHI. Available online: https://www.smhi.se/data/meteorologi/ladda-ner-meteorologiska-observationer accessed on 31 May 2021) and the monthly average air temperatures are available to download from the Bolin Centre for Climate Research (Bolin Centre. Available online: https://bolin.su.se/data/tarfala/climate.php accessed on 31 May 2021). Data were downloaded for between 1980 and 2019. The average monthly air temperature at Tarfala for July 2014 was 12.4 °C and the average weekly air temperature for the week prior to the main image capture on 8 August 2014 was also 12.4 °C (Figure 1), which is 5.4 °C above the long-term (1965–1994) average air temperature for July (7.0 °C) [34]. The average air temperature for July between 1990 and 2019 was 8.09 °C (standard deviation of 1.74 °C). An independent t-test was conducted and the difference in means between these two periods was statistically significant. The periods of warm temperatures in 2003, 2014, and 2018 have been described as “heatwaves”, which provides some climatological context for this study [35].
Proglacial lake (defined as within the LIA maximum glacier extent [36]) polygons derived from the manual mapping of ASTER L1B data were used to define the proglacial lake areas of the 12 largest lakes in the study area. The lakes are numbered sequentially here for simplicity. Please see the results section for the lake geometry/characteristics from the Proglacial Lake Inventory (PGLID). The depth data for lake 6 were acquired from sonar surveys (Dye et al., in prep.). Tarfala Research Station is located next to lake 7 (Tarfalasjon) and the maximum depth data for this lake were sourced from [8]. Lakes 1, 3, 4, 6, 11, and 12 were all classed as ice-contact lakes on 8 August 2014, while lakes 2, 5, 7, 8, 9, and 10 were all classed as non-ice-contact lakes for the same day (Figure 2).

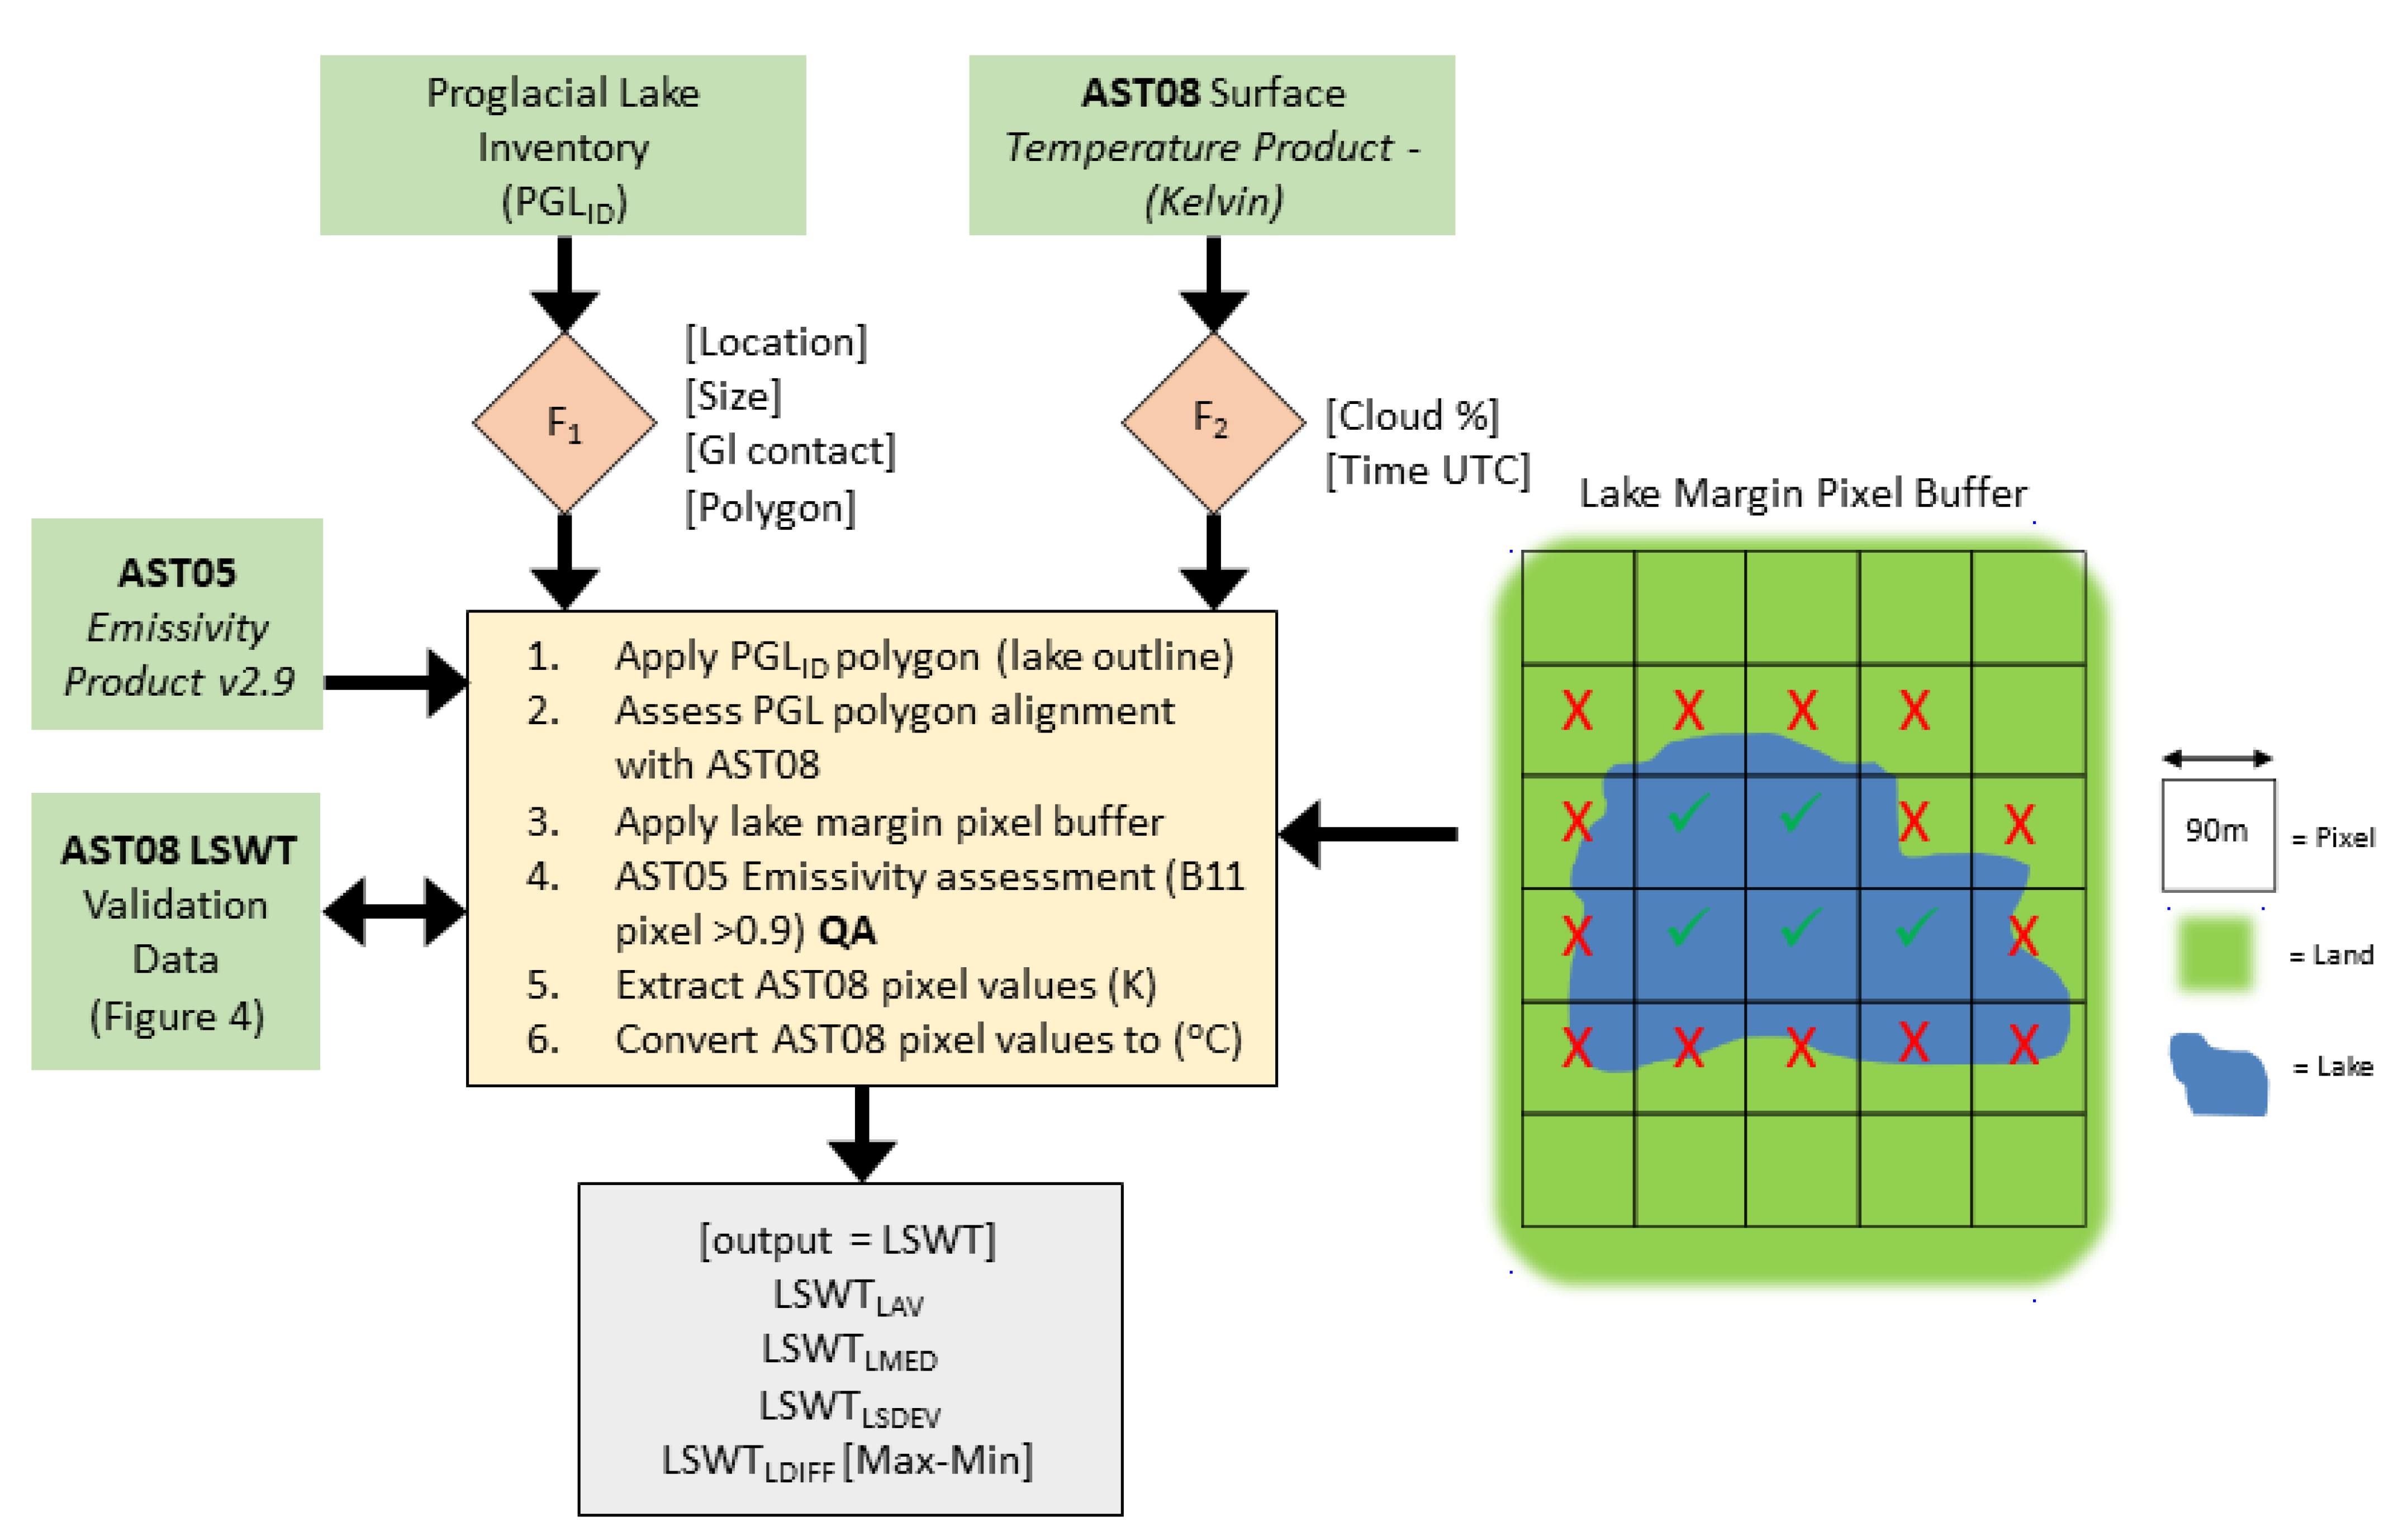
2.2. ASTER Satellite Data Used for the Extraction of the Lake Surface Water Temperature (LSWT)

The Advanced Spaceborne Thermal Emission and Reflection Radiometer (ASTER) satellite has 5 bands across the thermal infrared (TIR) range, with central wavelengths of 8.30 µm (band 10), 8.65 µm (band 11), 9.05 µm (band 12), 10.60 µm (band 13), and 11.30 µm (band 14) [37]. ASTER L1B product bands 1 (green), 2 (red), and 3 (near infrared) (all 15 m resolution) were used for manual delineation of lake boundaries for each date of image capture analysed in the study. Crucially, the pixel orientations of L1B data are the same as the AST08 surface temperature product (i.e., not north to south), so errors from misalignment were minimised.
High-latitude Lakes, especially those that are pro-glacial, are discrete and present highly dynamic landscape features (Figure 2). Thus, when assessing their thermal regimes, it is clear that remote sensing data need to be of an appropriately high spatiotemporal resolution (i.e., below 100 m and below one month with recording over multiple years) and are able to detect within-lake temperature variability with reasonable accuracy (i.e., ±1.5 °C) [38]. At this spatiotemporal scale, the only currently available data that are applicable are those ASTER and Landsat (5/7/8). Of these, as ASTER has five thermal infrared bands, it enables use of a temperature emissivity separation (TES) algorithm to first of all derive emissivity and then improve the surface temperature calculation. These data are then atmospherically calibrated (typically over continental areas) to produce the ASTER surface temperature product (i.e., AST08), thereby providing the opportunity to extract reliable lake surface water temperatures (LSWT) over proglacial lakes within a stated accuracy of ±1.5 °C [39]. This study supports this claim further through some of the first validation of AST08 data from in situ thermistor data from lakes in maritime areas. This validation has been lacking, as validation for lakes has previously been conducted for continental areas, such as Lake Tahoe [40,41,42].
ASTER satellite thermal infrared (TIR) imagery was utilised for investigating proglacial lake surface temperature (LSWT) in this study, as it has the highest spatial resolution (90 m) and best apparent calibration accuracy of any readily available satellite TIR imagery. TIR data from the Landsat series were also evaluated, which often require calibration using ASTER GED data for operational use [43,44,45]; however, the spectral resolution (1 or 2 TIR wavebands) and (for all Landsat TIR products) interpolation using the SWIR bands to 30 m pixels [46] makes it less useful for observing lake temperatures. The interpolation of these data is problematic for data extraction from discrete targets, particularly in cases where pixels are a mixture of lake and land surfaces, where the thermal signal of the lake will be subject to significant thermal contamination from the land surface. Consequently, interpolation from the native Landsat sensor resolution made it challenging to identify native pixel boundaries and to extract lake surface water pixel temperature values from available Landsat TIR imagery with greater than 95% confidence of no thermal contamination from surrounding land. This study utilised the core ASTER satellite surface temperature product (AST08) for extraction of proglacial lake temperatures as outlined in the workflow below (Figure 3); however, further work to carefully integrate ASTER and Landsat LSWT [45] data for high-latitude lakes will form the basis of future work.
Surface temperatures of proglacial lakes (LSWT; Figure 3) across Arctic Sweden were analysed via the systematic extraction of pixel values from the ASTER surface temperature product (AST08 v2.9). The primary AST08 imagery analysed in this study were obtained at 10:46 UTC+1 (overpass time) on 8 August 2014 when the average hourly air temperature at Tarfala was 13.9 °C (at 10:00 UTC+1). A series of three AST08 scenes from 8 August 2014 (10:46 UTC+1) were downloaded from the Earthdata website [Available online: https://earthdata.nasa.gov/ accessed on 01 September 2020] in a geotiff format, along with the NCEP NCAR reanalysis and MODTRAN radiative transfer model for atmospheric correction. Lake surface water temperatures (LSWT) were also extracted over three proglacial lakes (that were sufficiently free of clouds) from the AST08 product from 2 September 2000, 27 August 2006, 27 July 2014, and 29 July 2018, where all data were downloaded from the Earthdata website.
For our analyses, a threshold of 129,600 m2 as a minimum proglacial lake area was set, which equates to a grid of 4 × 4 AST08 90 m pixels (Figure 3). This enabled the surface temperature to be extracted from at least four pixels in the centre of the lake, ensuring high confidence that the pixel was purely over water (Figure 3). This effectively allowed a single-pixel buffer to be maintained around the margin of each lake, where thermal contamination due to the presence of land surface within the pixel would be likely (Figure 3). This buffer also minimised the impact of any geolocational alignment errors, as misalignment between the optical and thermal imagery could result in an incorrect identification of lake boundary pixels in the temperature product.
The AST05 GED emissivity product data (also derived from TES; 38) were downloaded for each scene and data (in band 11) over each proglacial lake (with a spatial referencing system) and were analysed to assess pixel emissivity values for deriving lake surface temperature at each location. The AST05 GED emissivity values for proglacial lakes were relatively uniform (93.75% > 0.94) and were similar to those found at the validation data sites [37]. We assumed that the uncertainties in the AST08 temperatures for proglacial lakes arising from use of ASTER GED were negligible. We included pixels containing icebergs in our analysis for three reasons, namely (i) iceberg cover within sample windows was rarely greater than 15% (Figure 2); (ii) iceberg melting will have a direct cooling effect on LSWT, so while there is some thermal emission contamination from the iceberg it is still representative of LSWT at the time of image capture; and (iii) the removal of pixels with icebergs would also remove colder pixels from each lake and therefore introduce some positive bias into the derived lake temperatures.

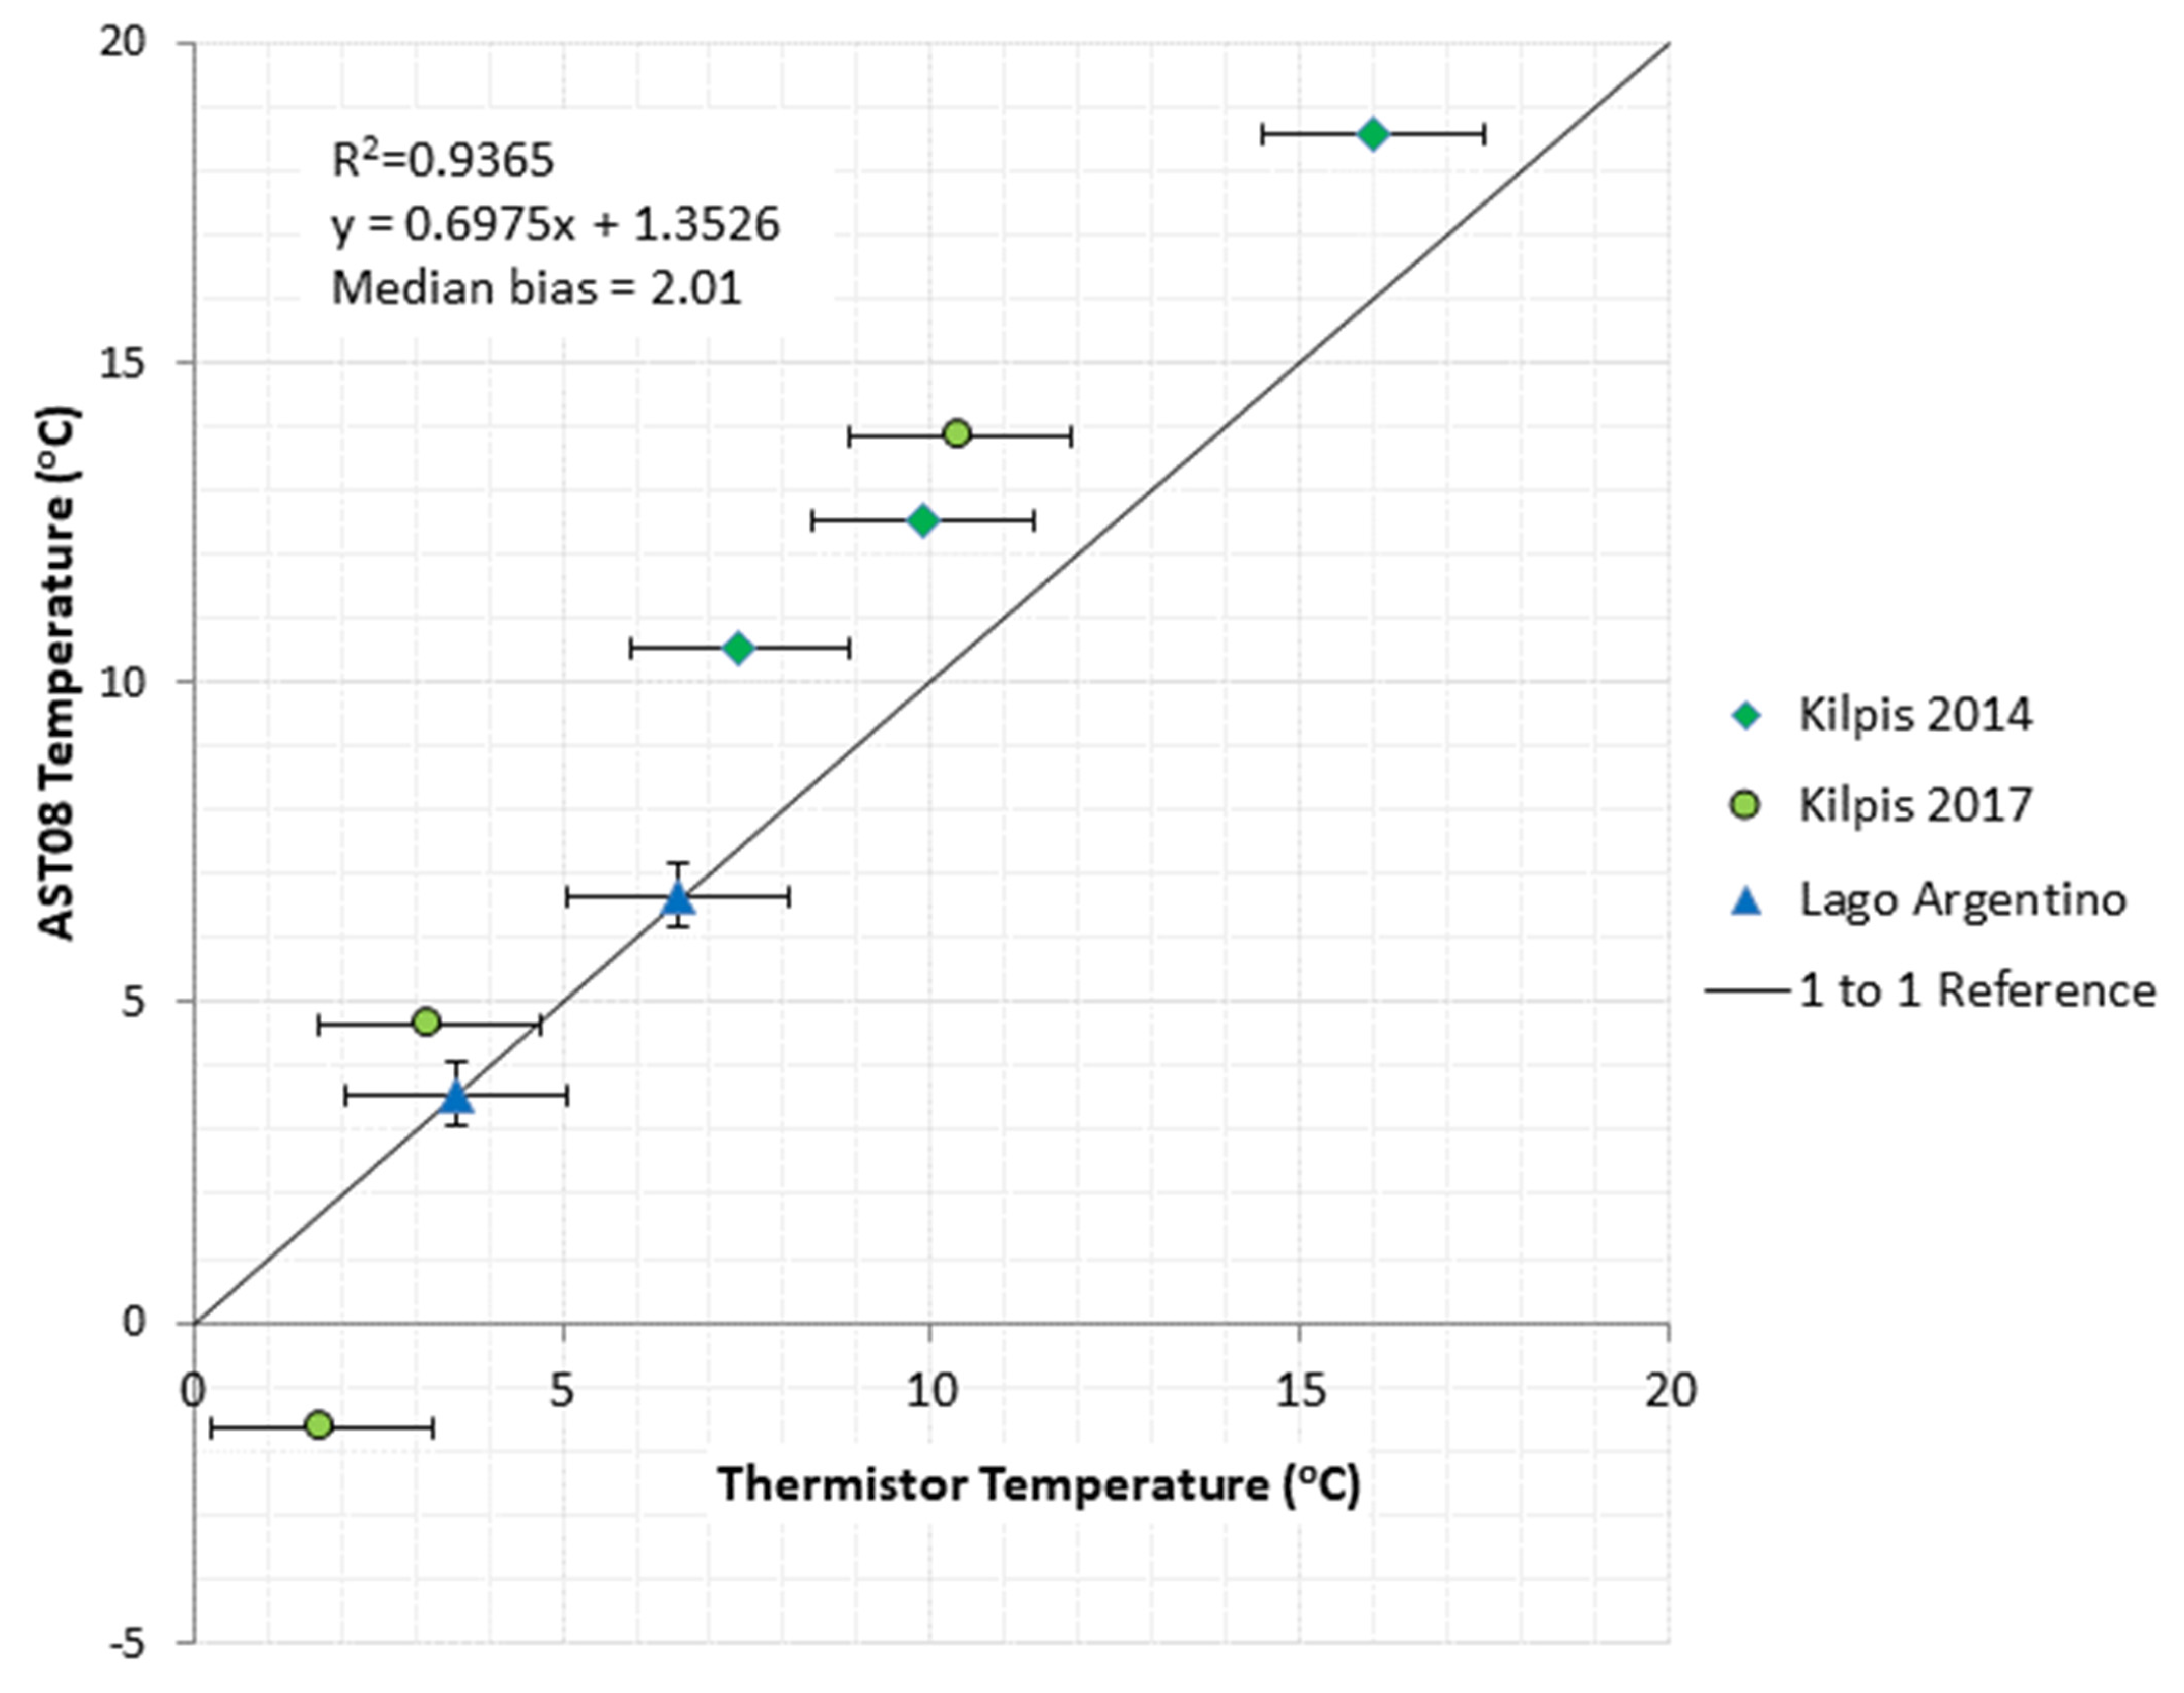
2.3. Validation of AST08 with In Situ Observations from Lakes in Maritime Climates

The AST08 temperature product has had limited validation over maritime areas [39]. This study provides some of the first data for validating the AST08 product for high-latitude lakes in Patagonia (see below) and Arctic Scandinavia. This is an important advance when considering the challenges associated with atmospheric correction over such maritime areas. We use in situ thermistor data (collected at a 0.75 m depth) from buoy moorings in the central part of Kilpisjarvi (69.033408°N, 20.77333°E, Arctic Sweden, ~50 km north of the study area) for 2014 and 2017. An extensive search for cloud-free ASTER imagery for the Kilpisjarvi buoy site was conducted for 2014 and 2017 (Figure 3 and Table A1). A series of suitable AST08 images was obtained for 7 July 2014 (overpass ~10:46 UTC+1), 11 July 2014, 27 July 2014, 13 June 2017, 29 June 2017 and 4 August 2017. In-situ lake near-surface temperature data were also provided for the proglacial lake Brazo Rico (50.453°S, 73.023°W) next to the Perito Moreno Glacier in Patagonia for 2011 and 2012. An extensive search of ASTER imagery was also conducted for Brazo Rico in 2011 and 2012. Only a single image from 31 May 2011 and an image from 31 May 2012 were found to be sufficiently free of clouds for analysis. The sensor was positioned near the edge of the lake and care was taken to avoid thermal emission contamination in the AST08 pixel (Figure 3).
For all images, areas around the sensor buoy location were deemed to be cloud-free via initial visual inspection; however, some clouds were noted in the data in other parts of the scene, and these images were included within the analysis to strengthen the validation of the AST08 product for less than nominal conditions, to test whether localised varying humidity was captured by the atmospheric correction [47]. The presence of undetected high cirrus clouds may also be a source of uncertainty but were not visibly observed [39]. The AST05 GED product was also downloaded and visually inspected to check for potential sources of error that can result from poor characterisation of emissivity values over inland water. No problematic (<0.9) pixel values within close proximity of the buoy data were found in any of the chosen images [37]. Contemporaneous temperatures for the buoy location were extracted from the AST08 90 m pixel data and plotted against the thermistor temperature data (logging every minute).

3. Results

3.1. Validation of AST08 Data against In Situ Data from Lakes in Maritime Areas

A series of eight AST08 surface temperature product images (between 2011 and 2017) were analysed and pixel values were extracted from the AST08 90 m pixel data corresponding to the position of a thermistor with available temperature data. The AST08 pixel values were plotted against the contemporaneous thermistor temperature (logging every minute), the details of which are given in the Table A1 (Appendix A). There was a relatively strong correlation (linear regression of R2 = 0.9365) between the temperatures from AST08 and those measured by thermistors that were <2 m deep for the 8 data points (Figure 4). Although there was a difference of up to ~3 °C between the AST08 temperatures and the thermistor temperatures (particularly for data point with an in situ temperature of 15.98 °C and the AST08 temperature of 18.55 °C), this is within the stated accuracy of the AT08 product of ±1.5 °C [38]. It should be further noted that the data point with a sensor temperature of 1.75 °C and AST08 temperature of −1.65 °C was due to the sensor being under ice cover.

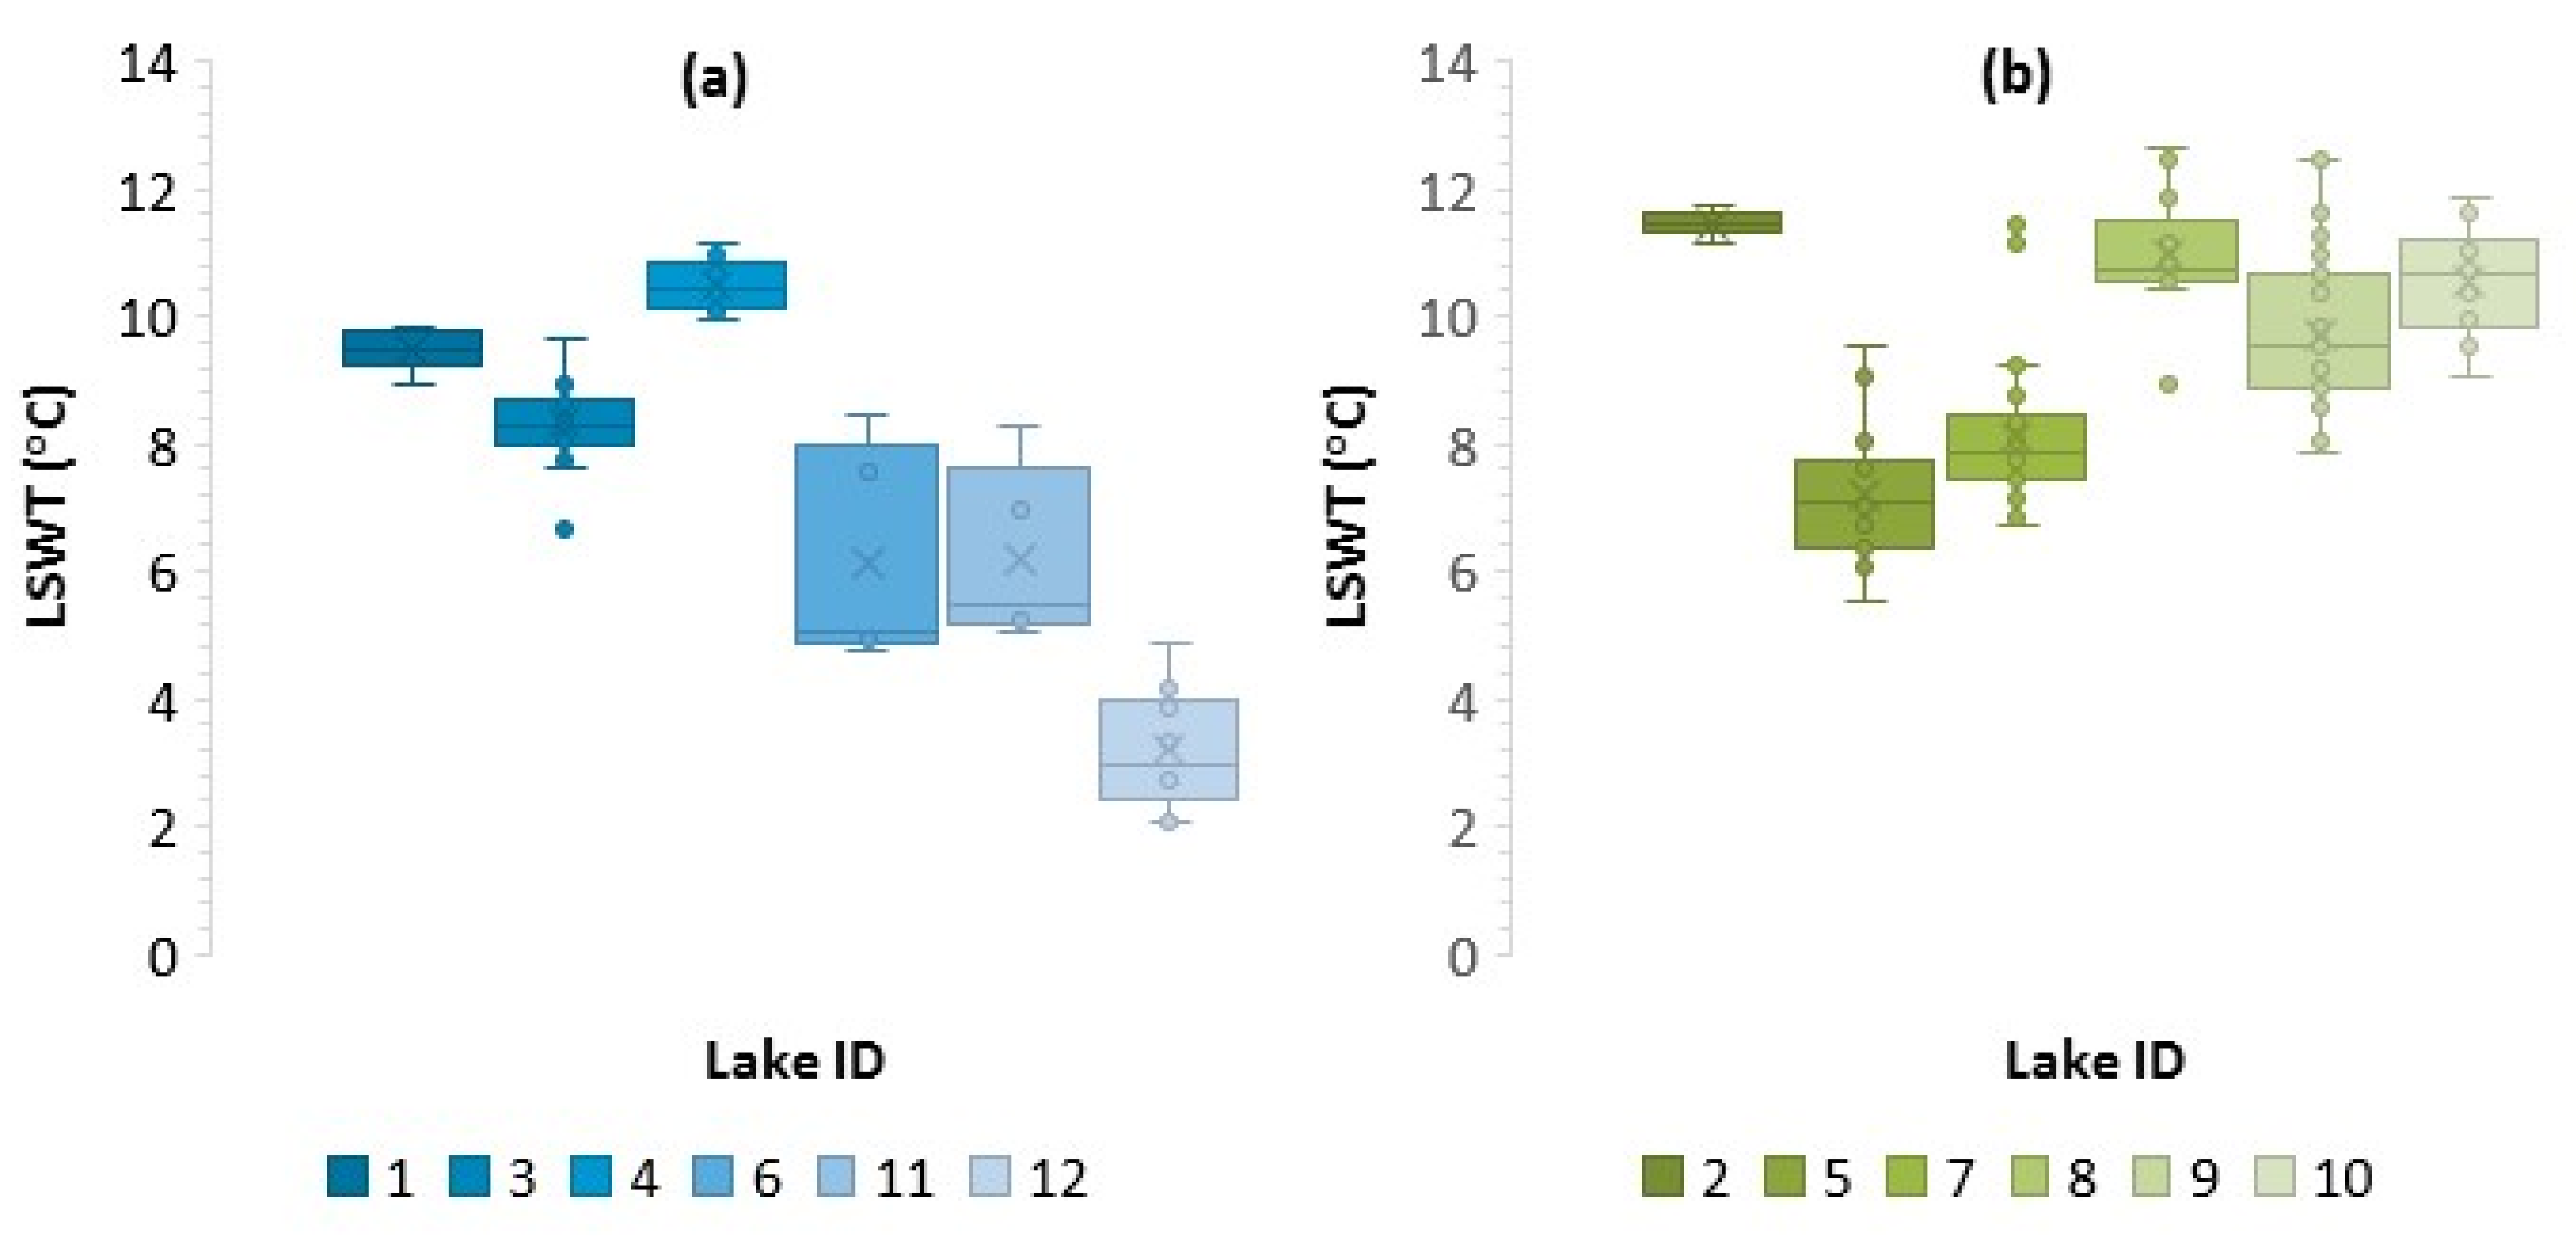
3.2. Surface Temperatures (LSWT) for Proglacial Lakes in Arctic Sweden from AST08 Temperature Product in 2014

Temperatures were extracted from the AST08 product from 8 August 2014 for a total of 205 pixels over 12 proglacial lakes in Arctic Sweden. The average proglacial lake surface temperature (LSWTAV) for all 12 lakes was 8.9 °C, with a median (LSWTMED) of 9.1 °C and a standard deviation (LSWTSDEV) of 2.0 °C. The table below summarises the geometry and characteristics of proglacial lakes, with summary statistics of the parent glacier from the Randolph Glacier Inventory (RGI) [48] and the ID used in AST08 analysis (AST08ID Figure 2) with LSWTAV and LSWTSDEV for each proglacial lake.
Proglacial lake elevation and LSWT were investigated, as it is reasonable to assume that air temperature decreases with elevation due to the atmospheric lapse rate. We found no correlation between LSWT values and elevation (R2 = 0.1254) at 10:46 UTC+1 on 8 August 2014 (Table 1). The 12 largest proglacial lakes that were analysed had parent glaciers with aspects between 20° and 110° (RGI) [48]. There was a moderate positive correlation of R2 = 0.5932 between LSWTAV and parent glacier aspect (Figure 5a). There was also a weak positive correlation of R2 = 0.2927 between LSWTAV and the ratio of parent glacier to proglacial lake area (Figure 5b).
The temperatures described above were extracted from both ice-contact proglacial lakes and non-ice-contact proglacial lakes. The sample presented here included six ice-contact proglacial lakes (AST08ID lakes 1, 3, 4, 6, 11, 12) and six non-ice-contact proglacial lakes (AST08ID lakes 2, 5, 7, 8, 9, 10); all with an area greater than 129,600 m2 (Table 1). A Mann–Whitney U-test was performed to test whether there was a significant difference in LSWT between ice-contact proglacial lakes and non-ice-contact and using this test, the null hypothesis (Ho; no significant difference between the two datasets) was accepted. Although there was no significant difference in LSWT between ice-contact and non-ice-contact proglacial lakes in Arctic Sweden, for data recorded on 8 August 2014, there are notable differences in the temperature distribution between each proglacial lake population and some similarities (Figure 6). Consequently, we undertook further analyses for the two different populations to investigate additional impacts of the decoupling/coupling of the lakes with the parent glaciers.

3.3. LSWT for Ice and Non-Ice-Contact Proglacial Lakes

The LSWTAV from ice-contact proglacial lakes was 8.2 °C (from 65 pixels in total across the 6 lakes), with LSWTMED of 8.9 °C and LSWTSDEV of 2.6 °C. The coldest proglacial lake was lake 12, with LSWTAV of 3.2 °C and LSWTMED of 3.0 °C and low variation in temperature across the lake as indicated by the low LSWTSDEV of 0.89 °C (Figure 6). The next coldest lakes were lake 6 and lake 11, both of which had an LSWTAV of 6.2 °C, although lake 11 had a higher LSWTMED of 5.5 °C compared to 5.1 °C for lake 12 (Figure 6). Lake 6 had the highest LSWTSDEV of 1.54 °C of any proglacial lake and had greater range (LSWTDIFF of 3.7 °C) than lake 11 (LSWTDIFF = 3.2 °C and LSWTSDEV = 1.23 °C) (Figure 6). Note that lake 6 (132,172 m2) and 11 (149,143 m2) are of a similar area. Lake 3 had a comparable range (LSWTDIFF = 3.0 °C) to lakes 12, 11 and 6, but had a higher LSWTAV of 8.3 °C (Figure 6). Lake 1 had the smallest LSWTSDEV (0.30 °C) and LSWTDIFF (0.9 °C) of any ice-contact proglacial lake and had the second highest LSWTAV of 9.5 °C (Figure 6). The highest LSWTAV for any ice-contact proglacial lake was 10.5 °C for lake 4, which also had a low LSWTDEV of 0.38 °C and low LSWTDIFF of 1.2 °C (Figure 6). These data show high variability in LSWT across the ice-contact proglacial lake population, with a group of colder lakes (lakes 6, 11, and 12) and lake 3 having a slightly higher LSWTs. All of these lakes have substantial parent glaciers. Lake 4 has a relatively small parent glacier and lake 1 has a parent glacier that is of a similar area to the lake. There was no correlation between ice-contact proglacial lake LSWTAV and lake elevation (R2 = 0.0012) at 10:46am on 8 August 2014 (Table 1).
There was a negative correlation between non-ice-contact proglacial lake (LSWTLAV) and lake elevation (R2 = 0.7545) at 10:46am on 8 August 2014 (Table 1). The LSWTAV for non-ice-contact proglacial lakes was 9.2 °C, with LSWTMED of 9.1 °C and LSWTSDEV of 1.6 °C. For the 6 non-ice-contact proglacial lakes LSWTMAX was 12.7 °C, with LSWTMED of 5.6 °C and a range (LSWTDIFF) of 7.1 °C. The lowest LSWTAV and LSWTMED for a non-ice-contact proglacial lake was 7.2 °C and 7.1 °C for lake 5, which also had a large range in temperature (LSWTDIFF = 4.0 °C) (Figure 6). The next coldest non-ice-contact proglacial lake was lake 7 with LSWTAV of 8.1 °C and LSWTMED of 7.9 °C, which had the largest range of any proglacial lake (LSWTLDIFF = 4.7 °C) (Figure 6). Lake 9 had the next highest LSWTAV of 9.7 °C and had the second largest range in temperatures (LSWTDIFF = 4.6 °C) (Figure 6), with the largest proglacial lake area (686,233 m2) of any lake analysed in this study. Lake 8 had the maximum LSWT (12.7 °C) of any proglacial lake analysed in this study and a relatively large range with LSWTDIFF of 3.7 °C (Figure 6). In contrast, lake 2 had the smallest temperature variation (LSWTDIFF = 0.6 °C and LSWTSDEV = 0.19 °C) and highest LSWTAV (11.5 °C) of any proglacial lake analysed in this study (Figure 6).

3.4. Proglacial Lake Surface Temperature (LSWT) from AST08 since 2000

To investigate variability and range in the LSWT data, a short time series of melt season data was extracted from the AST08 product (with corresponding air temperatures from Tarfala SMHI at 11 a.m. in brackets) from 2 September 2000 (3.7 °C), 27 August 2006 (12.6 °C), 25 July 2014 (19.7 °C), 8 August 2014 (13.9 °C) and 29 July 2018 (17.6 °C) for 3 proglacial lakes (all with ice contact) in Arctic Sweden (Figure 7). For all three lakes, the LSWT values were lower in the AST08 2/9/2000 imagery, such that LSWT values from 2 September 2000 were outside the range of LSWT values analysed on the other dates. There was no clear pattern between LSWT values for all lakes for the 27 August 2006, 27 July 2014, 8 August 2014 and 29 July 2018 AST08 data, although they were consistently higher than the LSWTs from the 02/09/00 image. LSWT values for all lakes for 27 August 2006, 27 July 2014 and 29 July 2018, were similar (with overlapping ranges) to the LSWT values for 8 August 2014. Note that lake 12 remained the coldest of the 3 throughout.

4. Discussion

We have presented some of the first validated satellite-derived temperatures to be reported from proglacial lakes in the Arctic and some of the first validation of the AST08 temperature product over lakes in maritime high-latitude climates. We derived a significant correlation (linear regression of R2 = 0.9365) between temperatures from AST08 and those measured by thermistors <2 m deep at validation sites. This provides a robust and viable validation of the AST08 temperature product (Figure 4). These data suggest the observed relationship works well for lake temperatures in the 0–15 °C range and agrees with Sabol et al. [37], who also found that AST08 performed well over water for temperatures up to 17 °C. The strong linear regression also suggests a consistent relationship exists between surface (top 1 µm) temperature (LSWT) (from AST08) and near-surface water temperature (LNSWT) derived from in situ thermistors [49]. The overlap between error bars (from the stated accuracy of these sensors) and the AST08 temperature product would suggest that the stated accuracy of ±1.5 °C appears to be realistic for the assessment of lakes in maritime climates when covering the times and dates of image capture analysed here.

4.1. Comparison to Reported Temperatures in Other Proglacial Lakes

The overall LSWTAV of 8.9 °C in Arctic Sweden on 8 August 2014 is substantially higher than the 1 °C that has previously been assumed for all proglacial lakes [16]. The significantly warmer proglacial lake temperatures presented here are directly comparable to the maximum water temperatures reported from thermistors in ice-contact proglacial lakes by Roehl [23] of 10 °C in New Zealand, Watson et al. [26] of 10 °C in Nepal, and Minowa et al. [24] of 8 °C in Patagonia. The study of Peter and Sommaruga [50] reported maximum temperatures of 16 °C from non-ice-contact proglacial lakes in the Austrian Alps. These consistently high recorded temperatures have substantial implications where glaciers are in contact with lakes due to rapid thermal erosion undercutting glacier fronts and enhancing ice calving rates [20,21,22,23,24,25]. Warm proglacial glacial lake temperatures will also influence downstream temperatures and geochemistry, with ecological consequences, particularly for temperature sensitive species such as invertebrates [10].
The 12 proglacial lakes analysed here are located in a similar macro-climatic region in the Kebnekaise area of Arctic Sweden. Air temperatures for July 2014 were substantially (5.4 °C) above the long-term (1965–1994) monthly average air temperature for July (7.0 °C) [34] and 4.31 °C (>2 sd) above the 1990 to 2019 average (8.09 °C). This departure in monthly mean air temperature from the long-term average gives stark climatological context of the meteorological conditions preceding AST08 proglacial lake temperature results from 8 August 2014. Nevertheless, despite a strong climatic warming influence, we observe substantial variability in LSWT between (and across) the 12 proglacial lakes, which is a key result given that all proglacial lakes analysed in this study are within a narrow elevation band and therefore may be assumed to have experienced similar air temperatures. Furthermore, we report no correlation with elevation and LSWT for proglacial lakes overall. We tentatively suggest that this high heterogeneity in LSWT is partly a reflection of the different levels of coupling between lakes and their parent glaciers and the wide range of topographic settings observed across the region [31,50]. While individual lake characteristics (particularly depth) also need to be considered in proglacial lake thermal regime studies, we report a moderate strong correlation between aspect and LSWT (R2 = 0.5932) and argue that this is partly due to topographic controls, which is further discussed in Section 4.2 below [7,50].

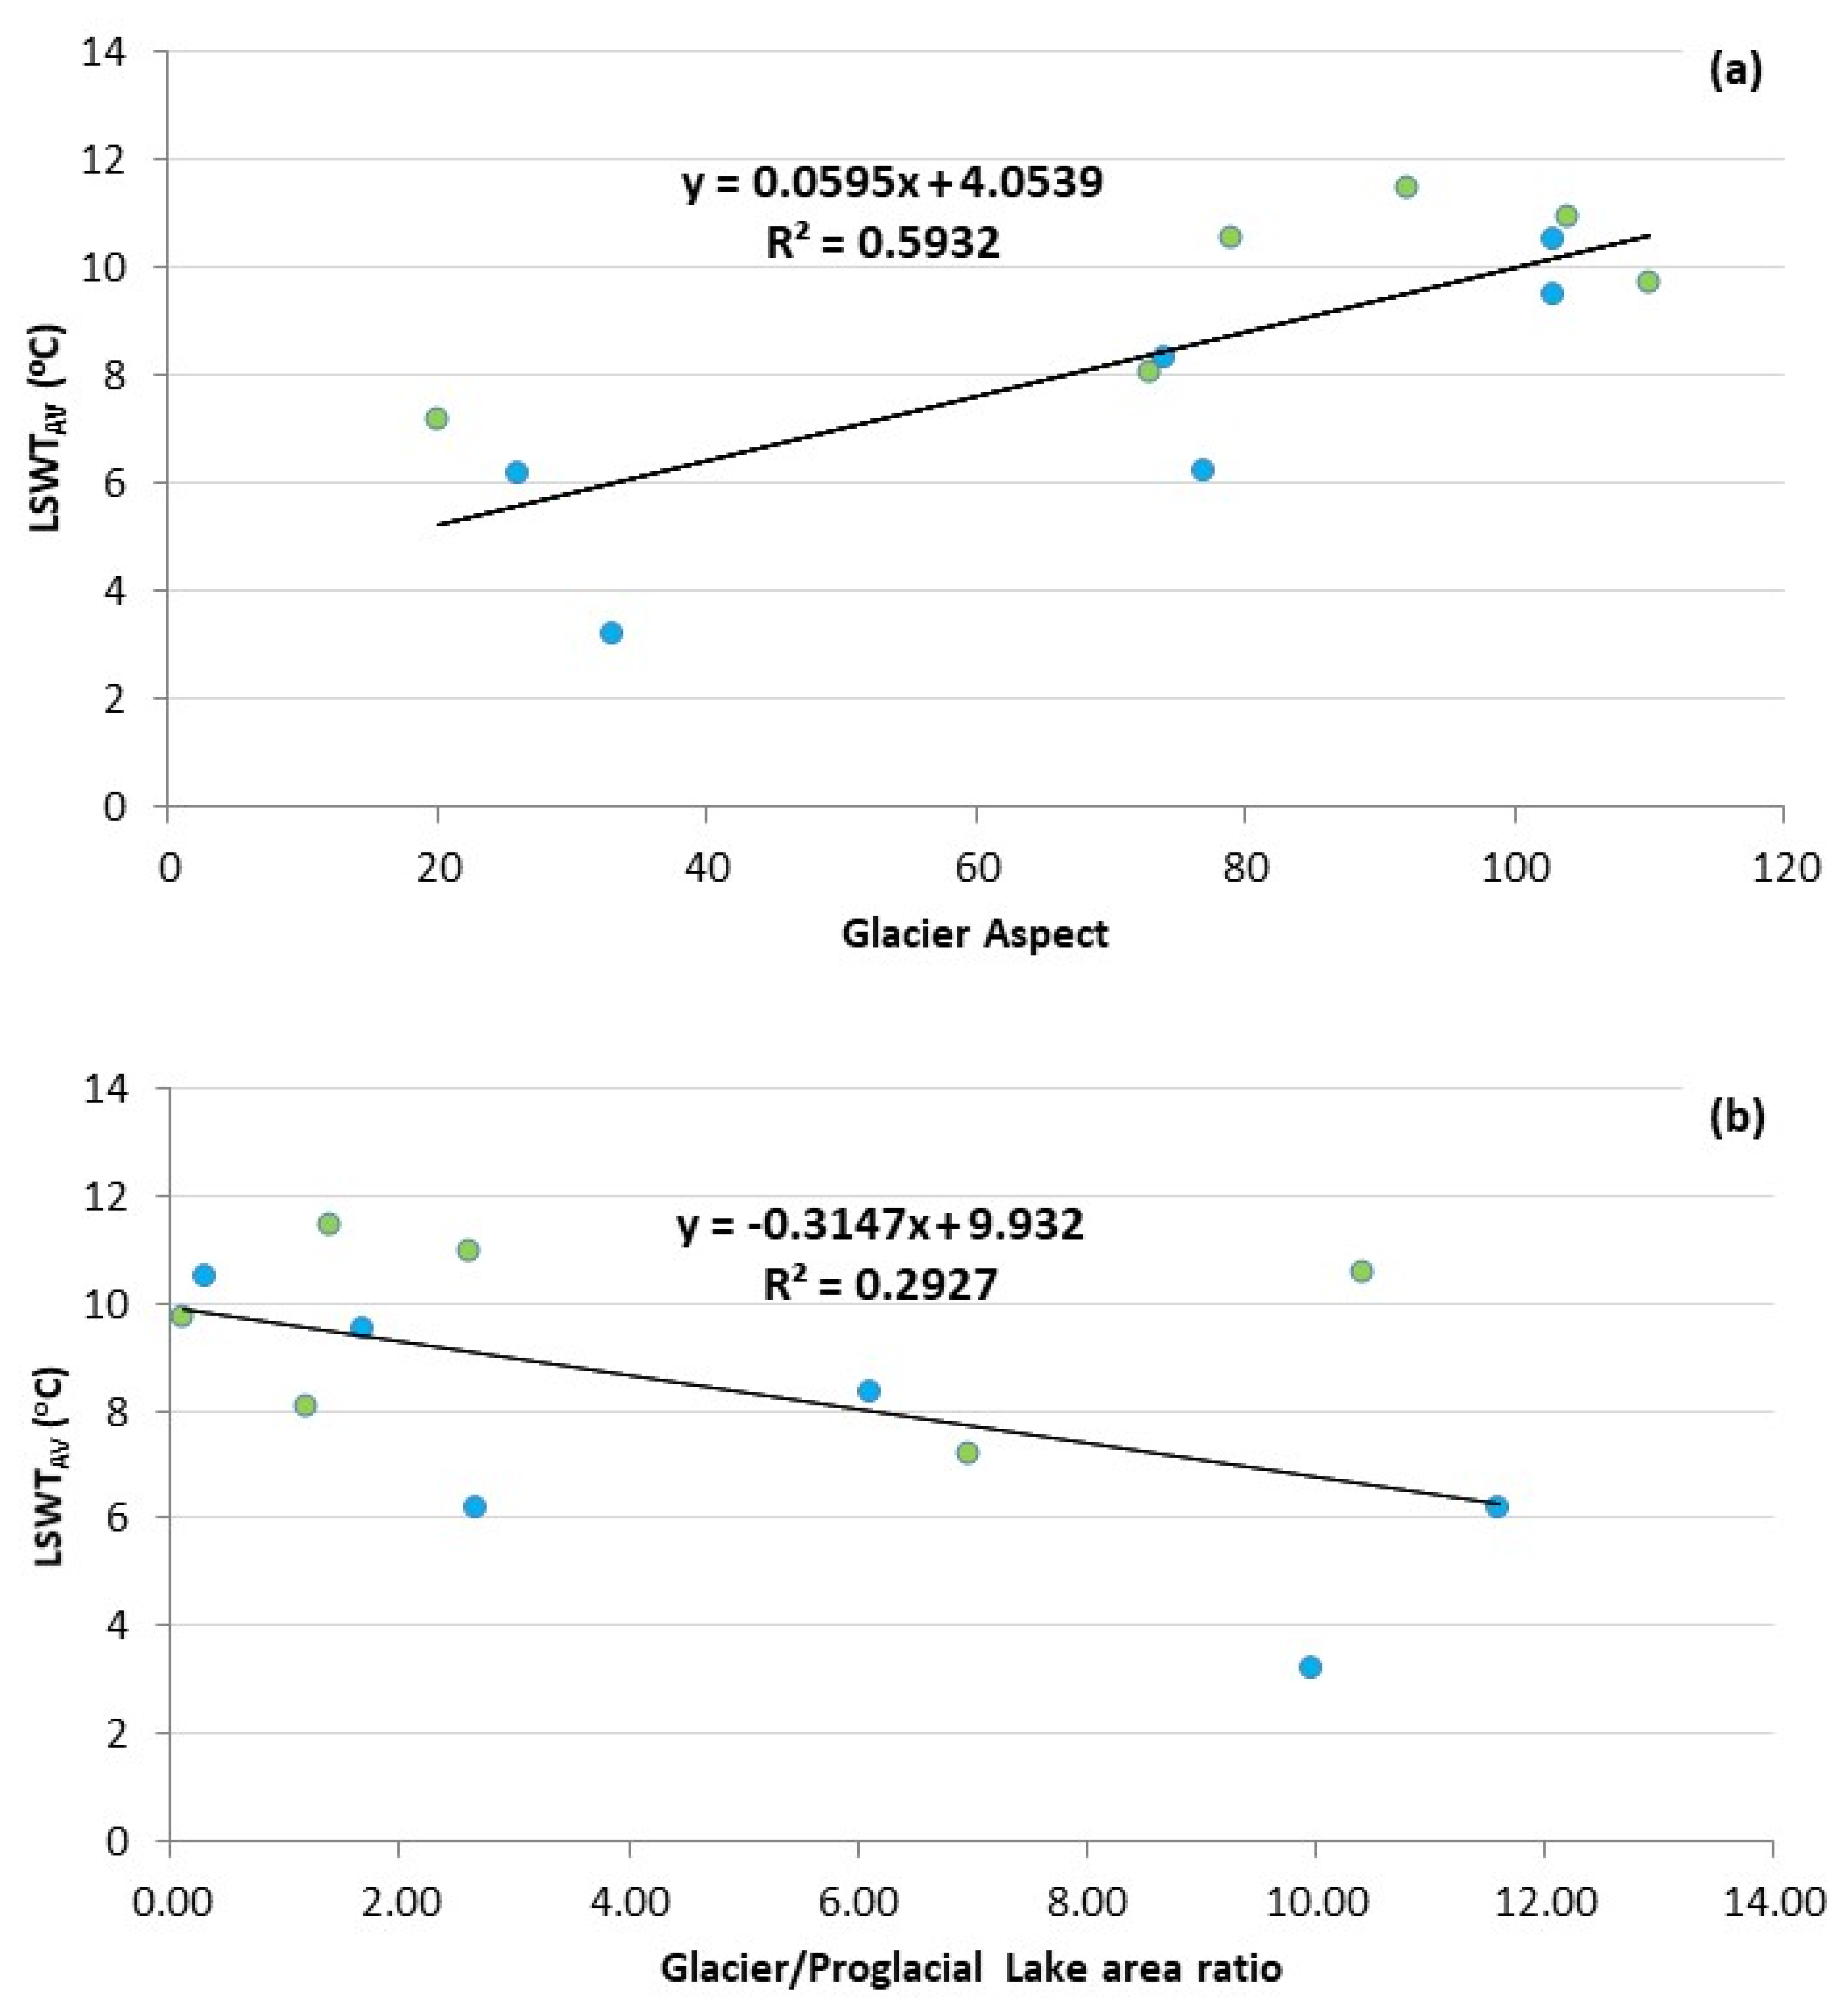
4.2. Relationship between Topographic Microclimate and LSWT

The high standard deviation (LSWTSDEV = 2.0 °C) and large range in proglacial lake surface temperatures (LSWT) suggests that there is clearly a high level of complexity for such temperatures relating to microclimate and relationship with parent glacier [50]. This is an important finding, as it highlights the heterogeneity of proglacial lake surface temperatures (LSWT), therefore calling for detailed analysis of LSWT spatial patterns and the need for reliable high spatial resolution thermal satellite data. Therefore, facilitating a higher level of interpretation of proglacial lake LSWT patterns in relation to factors particular to each individual lake location and surroundings.
The lack of a correlation between proglacial lake surface temperatures (LSWT) and elevation, would tentatively suggest that there was also disequilibrium between proglacial lake LSWT and air temperature (if one assumes it decreases with height) at the time of image capture (10:46 UTC+1), particularly for ice-contact proglacial lakes [51]. This complexity would suggest that proglacial lake LSWT (at the time of image capture) was more closely controlled by factors independent to each proglacial lake situation, such as proximity and coupling with neighbouring glacier and topoclimatic factors (e.g., shading from incoming solar radiation) [2,7,50]. There was a moderate positive correlation (R2 = 0.5932) between LSWTAV and parent glacier aspect (Figure 5a). These findings suggest that topographic situations can have a moderately strong influence on proglacial lake LSWT.
The dominance of relatively cloud-free conditions on 8 August 2014 means that lakes absorb more incoming shortwave solar radiation (particularly in a region with 24 h of daylight) [2,52]. Therefore, proglacial lakes with easterly aspects are likely to have higher LSWT during the morning, as they are more exposed to incoming solar radiation in the earlier part of the day that will raise temperatures quicker following the night-time cooling period [2,52]. This is evident from the higher LSWTAV (all above 9.5 °C) of lakes 1, 2, 4, 8, 9, and 10, which all have parent glaciers with an easterly aspect (Figure 5a). In contrast, proglacial lakes with increased northerly and westerly aspects will be subject to less incoming shortwave solar radiation during the early part of the day, particularly where the topography also creates substantial shading [2]. Therefore, proglacial lakes with a northerly aspect and substantial shading are likely to have lower surface temperatures (LSWT) during the morning (when image capture occurred at 10:46 UTC+1 on 8 August 2014) and when they are at a colder part of their individual diurnal cycle. This is evident from the lower LSWTAV (all below 8.0 °C) of lakes 5, 6 and 12, which all have parent glaciers with a northerly aspect (Figure 5a). We therefore argue that topoclimatic situation of proglacial lakes can have a substantial influence on surface temperatures; however, within these broader patterns there is substantial intralake variability in LSWT.
An important result from this study is the intra-lake variability in LSWT. Whilst some lakes display relatively little variability in LSWT across the surface, with the lowest LSWTSDEV being 0.19 °C for lake 2, which is a non-ice-contact lake (Table 1). Indeed, overall non-ice-contact lakes had lower LSWTSDEV (1.6 °C) than ice-contact lakes (2.6 °C). There was a weak negative correlation (R2 = 0.2927) between LSWTAV and glacier to proglacial lake area ratio, therefore weakly suggesting that larger glaciers exert a stronger cooling influence on proglacial lakes (Figure 5b). It should be noted that this analysis includes proglacial lakes in varying stages of deglaciation (distance to parent glacier), so non-ice-contact proglacial lakes with longer feeder streams are likely to have meltwater input that has undergone warming during the passage in the proglacial stream and counter the cooling impact of a relatively large glacier (e.g., for lake 10) [31]. The reasons behind this variability are discussed separately for ice-contact and non-ice-contact proglacial lakes below.

4.3. LSWT Variability across Ice-Contact Proglacial Lakes

The maximum LSWTSDEV of any lake was 1.54 °C for lake 6, which has contact with its parent glacier (Figure 7). This raises the question of regarding the extent of the cooling influence that glaciers can have on proglacial lakes, thus resulting in lower temperatures at the proximal part of the lake. It should also be considered whether this cooling influence dominates the whole lake, as if this is not the case then a strong temperature gradient may exist across it when distal parts are more dominated by warming influences. As such, it is imperative to constrain the proglacial lake geometry and influences of surrounding features on thermal regime.
The geometry of Lake 6 is particularly crucial as it demonstrates a relatively short contact point with the glacier in relation to the length of the lake (Figure 8). Lake 6 has a distal area where the most warming is likely to occur [2], further away from the cooling influence of the glacier [50]. This is evident in the temperature gradient across lake 6 in AST08 imagery (Figure 8), with darker (LSWT values of 4.8 °C and 5.1 °C) pixels near the terminus and lighter pixels (LSWT values of 7.6 °C and 8.5 °C) at the distal end of the lake. Whilst this temperature difference is close to the stated uncertainty for the AST08 temperature product (±1.5 °C) for absolute temperatures, field observations at the same lake during July 2017 showed a similar temperature pattern (Dye et al. in prep.). With daytime maximum near-surface (<1 m depth) temperatures of 8 °C observed at the distal end and maximum near-surface temperatures (<1 m depth) of 4.2 °C were observed near the terminus (Dye et al., in prep). As such, proglacial lakes can have a substantial cooling influence from contact with glacier ice and meltwater (Figure 5b) [7,32,50]; however, this cooling may be limited in spatial extent and lake area expansion may be sufficient for the distal areas to be far enough away from the terminus that they are more dominated by warming influences, as in the case of proglacial lakes 6 and 11 (Figure 6a) on 8 August 2014 and lake 3 on 27 August 2006, 25 July 2014, 8 August 2014 and 29 July 2018 (Figure 7).

4.4. LSWT Variability across Non-Ice-Contact Proglacial Lakes

The least influence of glacier cooling on LSWT on the 12 proglacial lakes analysed is represented by lake 2, which is located ~0.5 km away from the neighbouring glacier and has a proglacial stream flowing through a southeast-facing fore-field with a smaller proglacial lake (1144 m asl). As such, diurnal warming of the proglacial stream feeding into lake 2 before image capture could be substantial. Magnusson et al. [31] found temperatures of up to 11.4 °C for ~1.5 km in a proglacial stream from a glacier in Switzerland. The lack of cooling influence on lake 2 from meltwater input is also illustrated by it having the lowest LSWTSDEV (0.19 °C) of any proglacial lake and also highest LSWTAV of 11.5 °C. It is suggested that lake 2 is in an advanced stage of deglaciation, with no evidence of meltwater cooling on the lake LSWT at the time of image capture on 8 August 2014. In contrast, lake 7 has a short proglacial feeder stream (<50 m) and a relatively high (3rd highest) LSWTSDEV for a non-ice-contact proglacial lake (1.03 °C). It is important to note that large meltwater input events will have a stronger cooling influence on proglacial lakes, which may be perpetuated across the full area of the lake (depending on relative areas and circulation patterns) as Kirchner et al. [8] argue happened at Lake Tarfala (lake 7) following the July 2018 heatwave.

4.5. Influence of Meltwater on LSWT

The influx of glacial meltwater will lead to cooling of proglacial lake water temperatures, if substantial warming has not occurred in the feeder stream [7,31,50]. The relative density difference across the water column and between any incoming meltwater will dictate where the latter sits within the water column. Critical conditions for this include whether the lower water column is at or near the temperature density maximum (3.98 °C) and if the suspended sediment concentration (SSC) is high enough to have a higher density than water that is at 3.98 °C [21,32]. As such, the turbid glacial meltwater is likely to have a high density and sit lower down the water column, so it may not be distinctly visible as a body of water (i.e., cold pool) in lake LSWTs [32,50]; however, the input of turbid glacial meltwater may have an overall cooling influence on lake water temperatures, which results in a lower LSWT, particularly after mixing occurs [7,50]. In contrast, where meltwater with low SSC has been inputted this may be present in the surface layers of the lake if it overlies denser water (either at the temperature density maximum or higher SSC) [7,21].
This input of meltwater with low turbidity is likely near glacier fronts where subaqueous melt of glacier ice occurs (where ice is relatively debris free) [32]. The level of SSC does not only control the density of the water but will also control the depth of shortwave solar penetration of water [32]. Consequently, where proglacial lakes have high SSC, then light penetration will be limited in depth, which will concentrate warming in the upper water layers [32]. This may lead to “super-heated” surface layers and the formation of a relatively thin (metres) warm surface layer (hypolimnion) [32,33]. Therefore, where (and when) glacial meltwater has a high suspended sediment concentration any subsequent meltwater input is also likely to be an important control on the thermal regime of proglacial lakes, particularly regarding the temperature structure vertically through the water column.

4.6. Wider Considerations and Recommendations for Future Study

When analysing proglacial lake surface temperatures derived from satellite imagery, we fully acknowledge the restricted time (i.e., relative to the diurnal/seasonal cycle) and surface contexts (i.e., for a very thin water layer) within the lake systems here. Consequently, the validation data presented here are of twofold importance in that they (i) provide a relatively robust validation of the AST08 LSWT (linear regression R2 = 0.9365), and (ii) indicate that a relatively strong relationship exists between the derived remote sensing temperatures and in situ temperatures measured in the top two metres of the water column. This relationship is crucial in underpinning the wider use of surface water (skin) temperatures to interpret dynamic changes in near-surface water (body) temperatures of proglacial lakes over time.
We also note that the LSWT values derived from imagery (27 August 2006, 25 July 2014, 8 August 2014, and 29 July 2018) for lakes 3, 4, and 12 are all similar, with overlapping ranges and a degree of internal consistence. This suggests that the LSWT data extracted from AST08 data on 8 August 2014 are unlikely to be anomalously warm when compared to other AST08 data in the period post-2000. By contrast, the LSWT extracted from AST08 imagery from 2 September 2000 are notably colder, indeed beyond the ranges of LSWT values extracted from AST08 imagery from other dates. This raises the question as to whether warming influences on proglacial lakes in Arctic Sweden have increased widely since 2000, particularly given the heatwaves in 2003, 2014, and 2018 and the increase in July average air temperatures reported above [35,53]; however, we argue that the structure of the water column (and depth) in specific lake systems also needs to be considered alongside absolute temperature changes, particularly where warm surface water layers persist above denser cold layers (with a high SSC or at 3.98 °C) through the melt season [32]. Thus, we suggest that further analysis of proglacial lake water temperatures through the water column is required through the melt season to constrain the evolution of warm surface layers and the timings of mixing events. This should include bathymetry data, as shallower lakes (with smaller volumes) will require less climatic forcing to warm up to the temperature density maximum of 3.98 °C and therefore likely to mix through the water column quicker. Thus, facilitating near-surface layers to exceed 3.98 °C earlier in the melt season if warming influences are sufficient, as observed by Kirchner et al. [8] at Tarfala lake (49.8 m deep) where temperatures at a 10 m depth exceeded 4 °C (peaking at 8 °C) in late July 2018 (which was 5.6 °C above average). Note that they [8] reported temperatures at 10 m reached a maximum of 4.1 °C during 2017, suggesting the warming factors during summer 2017 were insufficient to create a warm near-surface layer (July 2017 was 0.2 °C above the long-term average monthly air temperature). The collation of pan-melt season thermal remote sensing data for proglacial lakes data will allow further advances in understanding of proglacial lake thermal regimes and form the basis of ongoing research by the authors.
Crucially, we note the importance of constraining the spatial extents of cooling inputs from glaciers into proglacial lakes in order to further understand their thermal regimes, in particular where increased meltwater inputs and iceberg influx are likely over time [7,26]. We feel that this assessment should be undertaken coincidently with quantification of coupled glacier retreat rates in order to provide complete understanding of the likely feedbacks in the proglacial lake system that can directly influence, and perhaps accelerate changes in glacier melting rates. Thus, detailed analysis of proglacial lake thermal regimes may be of particular importance to the management of downstream catchment areas where temperature changes may also impact on dependent species, such as Salmonids [10].

5. Conclusions

The ASTER Swedish proglacial lake surface water temperatures (LSWT) presented here are the first satellite-derived temperatures to be reported from proglacial lakes in the Arctic. From this study, we have derived a range of important findings which will underpin future systematic spatial and temporal analyses of proglacial temperatures from space, which are detailed below.
The strong correlation (linear regression R2 = 0.93) between temperatures from AST08 and those measured by thermistors <2 m deep provides one of the first systematic validations of AST08 temperature data from high-latitude maritime climates (i.e., Sweden and Patagonia). Our data suggest that a robust operational relationship exists between the AST08 LSWT and near-surface temperatures of water from in situ thermistors at the time of image capture [49].
The average recorded LSWT (LSWTAV) of 8.9 °C for proglacial lakes in Arctic Sweden (8 August 2014) is substantially higher than the 1 °C baseline commonly assumed for small proglacial lake systems [16]. Warm proglacial lake surface temperatures were also observed over three ice-contact lakes from the AST08 product (27 August 2006, 25 July 2014, and 29 July 2018) with notable intra- and inter-lake variability in temperatures. Significant heterogeneity in temperatures was noted between proglacial lakes. The large standard deviation and range in observed LSWT suggests that temperatures may also be impacted to some extent by local microclimate and coupling with parent glaciers [50]. The positive correlation of R2 = 0.59 between LSWTAV and the parent glacier aspect suggests that the relative exposure to incoming solar radiation has an influence on the LSWT of the 12 proglacial lakes in this study and should be factored into future assessments. We also note that several proglacial lakes also had regions of cooler LSWT in close proximity to the parent glaciers, which also confirms the likelihood of localized cooling influences from parent glaciers on temperature derivations for some proglacial lakes.
We suggest that future analysis of proglacial lake temperatures should include systems that exhibit grossly contrasting relationships with the parent glacier. We feel that such an approach will provide important insights as to how the LSWT may vary at different stages of the deglaciation process and relationship to meteorological events (e.g., heatwaves). This, combined with further analysis of the entire satellite thermal imagery archive, forms the basis of ongoing research, and will facilitate clearer understanding of how proglacial lake thermal regimes evolve in response to pervasive changes in climate.

Author Contributions

Conceptualization, A.D., D.M.R., R.B. and E.D.; methodology, A.D., D.M.R. and R.B.; validation, A.D., D.M.R. and R.B.; formal analysis, A.D., D.M.R. and R.B.; investigation, A.D., D.M.R., R.B. and F.F.; resources, A.D., D.M.R., R.B. and E.D.; data curation, A.D., D.M.R., R.B. and E.D.; writing—original draft preparation, A.D., D.M.R., R.B., E.D. and F.F.; writing—review and editing, A D., D.M.R., R.B., E.D. and F.F.; supervision, D.M.R. and R.B.; project administration, University of York; funding acquisition, D.M.R. All authors have read and agreed to the published version of the manuscript.

Funding

This research was funded by the NERC ACCE PhD doctoral scheme.

Institutional Review Board Statement

Not applicable.

Informed Consent Statement

Not applicable.

Data Availability Statement

The data is currently unavailable online due to an embargo, but is available by email arrangement.

Acknowledgments

Thanks to Georgiy Kirrillin for kindly providing the in situ lake temperature data from Kilpisjarvi (Sweden). Thanks to M. Minowa and P. Skvarca for kindly providing in situ lake temperature data from Lago Argentino (Argentina). Both of these datasets were used in the validation of AST08 product lake surface water temperatures (LSWT). Thanks to the freely available AST08 temperature product (and optical imagery) scenes that were downloaded from the Earthdata website (Earthdata. Available online: https://earthdata.nasa.gov/ accessed 1 September 2020), along with the NCEP NCAR reanalysis and MODTRAN radiative transfer model for atmospheric correction.

Conflicts of Interest

The authors declare no conflict of interest. The funders had no role in the design of the study; in the collection, analyses, or interpretation of data; in the writing of the manuscript, or in the decision to publish the results.

Appendix A

Table A1. Data points compiled for this survey for validation of the AST08 temperature product. Data measured in Kilpisjarvi (Sweden) from G. Kirrilin with an RBR Duo thermistor (accuracy ±0.002 °C) for temperatures (every minute) less than 1 m deep with an in situ buoy mooring. Data Brazo Rico arm of Lago Argentino, Argentina are from Onset HOBO U20 sensor (accuracy ±0.5 °C) mounted on a metal pole at <2 m depth and were kindly provided by M. Minowa and P. Skvarca.
DateAST08 TimeAST08 Temp. (°K)AST08 Temp. (°C)Sensor Temp. (°C)
Kilpisjarvi69.033408°N20.77333°E 0.75 m Depth
7 July 201410.46283.710.557.41
11 July 201410.22285.712.559.88
27 July 201410.21291.718.5515.98
Kilpisjarvi69.02637274°N20.8027558°E 1 m depth
13 June 201710.46271.5−1.651.75
29 June 201710.46277.84.653.20
4 August 201710.22287.013.8510.39
Brazo Rico50.453°S73.023°W <2 m depth
31 May 20113.57276.73.553.55
31 May 20124.09279.86.656.58

References

  1. Adrian, R.; O’Reilly, C.M.; Zagarese, H.; Baines, S.B.; Hessen, D.O.; Keller, W.; Livingstone, D.M.; Sommaruga, R.; Straile, D.; Van Donk, E.; et al. Lakes as sentinels of climate change. Limnol. Oceanogr. 2009, 54, 2283–2297. [Google Scholar] [CrossRef]
  2. O’Reilly, C.M.; Sharma, S.; Gray, D.K.; Hampton, S.E.; Read, J.S.; Rowley, R.J.; Schneider, P.; Lenters, J.D.; McIntyre, P.B.; Kraemer, B.M.; et al. Rapid and highly variable warming of lake surface waters around the globe. Geophys. Res. Lett. 2015, 42, 10–773. [Google Scholar] [CrossRef] [Green Version]
  3. Woolway, R.I.; Merchant, C.J. Worldwide alteration of lake mixing regimes in response to climate change. Nat. Geosci. 2019, 12, 271. [Google Scholar] [CrossRef]
  4. Merchant, C.J.; Matthiesen, S.; Rayner, N.A.; Remedios, J.J.; Jones, P.D.; Olesen, F.; Trewin, B.; Thorne, P.W.; Auchmann, R.; Corlett, G.K.; et al. The surface temperatures of Earth: Steps towards integrated understanding of variability and change. Geosci. Instrum. Methods Data Syst. 2013, 2, 305–321. [Google Scholar] [CrossRef] [Green Version]
  5. Schneider, P.; Hook, S.J. Space observations of inland water bodies show rapid surface warming since 1985. Geophys. Res. Lett. 2010, 37. [Google Scholar] [CrossRef] [Green Version]
  6. Hartmann, D.L.; Tank, A.M.; Rusticucci, M.J. IPCC fifth assessment report, climate change 2013: The physical science basis. Ipcc Ar5 2013, 5, 31–39. [Google Scholar]
  7. Richards, J.; Moore, R.D.; Forrest, A.L. Late-summer thermal regime of a small proglacial lake. Hydrol. Process. 2012, 26, 2687–2695. [Google Scholar] [CrossRef]
  8. Kirchner, N.; Kuttenkeuler, J.; Rosqvist, G.; Hancke, M.; Granebeck, A.; Weckström, J.; Weckström, K.; Schenk, F.; Korhola, A.; Eriksson, P. A first continuous three-year temperature record from the dimictic arctic–alpine Lake Tarfala, northern Sweden. Arct. Antarct. Alp. Res. 2021, 53, 69–79. [Google Scholar] [CrossRef]
  9. Huang, C.; Yunmei, L.; Liu, G.; Guo, Y.; Yang, H.; Zhu, A.X.; Song, T.; Huang, T.; Zhang, M.; Shi, K. Tracing high time-resolution fluctuations in dissolved organic carbon using satellite and buoy observations: Case study in Lake Taihu, China. Int. J. Appl. Earth Obs. Geoinf. 2017, 62, 174–182. [Google Scholar] [CrossRef]
  10. Fellman, J.B.; Nagorski, S.; Pyare, S.; Vermilyea, A.W.; Scott, D.; Hood, E. Stream temperature response to variable glacier coverage in coastal watersheds of Southeast Alaska. Hydrol. Process. 2014, 28, 2062–2073. [Google Scholar] [CrossRef]
  11. Box, J.E.; Colgan, W.T.; Christensen, T.R.; Schmidt, N.M.; Lund, M.; Parmentier, F.J.W.; Brown, R.; Bhatt, U.S.; Euskirchen, E.S.; Romanovsky, V.E.; et al. Key indicators of Arctic climate change: 1971–2017. Environ. Res. Lett. 2019, 14, 045010. [Google Scholar] [CrossRef]
  12. Serreze, M.C.; Francis, J.A. The Arctic amplification debate. Clim. Chang. 2006, 76, 241–264. [Google Scholar] [CrossRef] [Green Version]
  13. Sharma, S.; Blagrave, K.; Magnuson, J.J.; O’Reilly, C.M.; Oliver, S.; Batt, R.D.; Magee, M.R.; Straile, D.; Weyhenmeyer, G.A.; Winslow, L.; et al. Widespread loss of lake ice around the Northern Hemisphere in a warming world. Nat. Clim. Chang. 2019, 9, 227. [Google Scholar] [CrossRef]
  14. Edinger, J.E.; Duttweiler, D.W.; Geyer, J.C. The response of water temperatures to meteorological conditions. Water Resour. Res. 1968, 4, 1137–1143. [Google Scholar] [CrossRef]
  15. Schmid, M.; Hunziker, S.; Wüest, A. Lake surface temperatures in a changing climate: A global sensitivity analysis. Clim. Chang. 2014, 124, 301–315. [Google Scholar] [CrossRef]
  16. Truffer, M.; Motyka, R.J. Where glaciers meet water: Subaqueous melt and its relevance to glaciers in various settings. Rev. Geophys. 2016, 54, 220–239. [Google Scholar] [CrossRef] [Green Version]
  17. Caissie, D. The thermal regime of rivers: A review. Freshw. Biol. 2006, 51, 1389–1406. [Google Scholar] [CrossRef]
  18. Webb, B.W.; Hannah, D.M.; Moore, R.D.; Brown, L.E.; Nobilis, F. Recent advances in stream and river temperature research. Hydrol. Process. Int. J. 2008, 22, 902–918. [Google Scholar] [CrossRef]
  19. Pierre, K.A.S.; Louis, V.L.S.; Schiff, S.L.; Lehnherr, I.; Dainard, P.G.; Gardner, A.S.; Aukes, P.J.; Sharp, M.J. Proglacial freshwaters are significant and previously unrecognized sinks of atmospheric CO2. Proc. Natl. Acad. Sci. USA 2019, 116, 17690–17695. [Google Scholar] [CrossRef] [PubMed] [Green Version]
  20. Kirkbride, M.P. The temporal significance of transitions from melting to calving termini at glaciers in the central Southern Alps of New Zealand. Holocene 1993, 3, 232–240. [Google Scholar] [CrossRef]
  21. Warren, C.R.; Kirkbride, M.P. Temperature and bathymetry of ice-contact lakes in Mount Cook National Park, New Zealand. N. Z. J. Geol. Geophys. 1998, 41, 133–143. [Google Scholar] [CrossRef]
  22. Warren, C.R.; Kirkbride, M.P. Calving speed and climatic sensitivity of New Zealand lake-calving glaciers. Ann. Glaciol. 2003, 36, 173–178. [Google Scholar] [CrossRef] [Green Version]
  23. Röhl, K. Thermo-erosional notch development at fresh-water-calving Tasman Glacier, New Zealand. J. Glaciol. 2006, 52, 203–213. [Google Scholar] [CrossRef] [Green Version]
  24. Minowa, M.; Sugiyama, S.; Sakakibara, D.; Skvarca, P. Seasonal variations in ice-front position controlled by frontal ablation at Glaciar Perito Moreno, the Southern Patagonia Icefield. Front. Earth Sci. 2017, 5, 1. [Google Scholar] [CrossRef] [Green Version]
  25. Mallalieu, J.; Carrivick, J.L.; Quincey, D.J.; Smith, M.W. Calving seasonality associated with melt-undercutting and lake ice cover. Geophys. Res. Lett. 2020, 47, e2019GL086561. [Google Scholar] [CrossRef] [Green Version]
  26. Watson, C.S.; Kargel, J.S.; Shugar, D.H.; Haritashya, U.K.; Schiassi, E.; Furfaro, R. Mass loss from calving in Himalayan proglacial lakes. Front. Earth Sci. 2020, 7, 342. [Google Scholar] [CrossRef] [Green Version]
  27. Komori, J. Recent expansions of glacial lakes in the Bhutan Himalayas. Quat. Int. 2008, 184, 177–186. [Google Scholar] [CrossRef]
  28. Gardelle, J.; Arnaud, Y.; Berthier, E. Contrasted evolution of glacial lakes along the Hindu Kush Himalaya mountain range between 1990 and 2009. Glob. Planet. Chang. 2011, 75, 47–55. [Google Scholar] [CrossRef] [Green Version]
  29. Carrivick, J.L.; Quincey, D.J. Progressive increase in number and volume of ice-marginal lakes on the western margin of the Greenland Ice Sheet. Glob. Planet. Chang. 2014, 116, 156–163. [Google Scholar] [CrossRef]
  30. Hanshaw, M.N.; Bookhagen, B. Glacial areas, lake areas, and snow lines from 1975 to 2012: Status of the Cordillera Vilcanota, including the Quelccaya Ice Cap, northern central Andes, Peru. Cryosphere 2014, 8, 359–376. [Google Scholar] [CrossRef] [Green Version]
  31. Magnusson, J.; Jonas, T.; Kirchner, J.W. Temperature dynamics of a proglacial stream: Identifying dominant energy balance components and inferring spatially integrated hydraulic geometry. Water Resour. Res. 2012, 48. [Google Scholar] [CrossRef] [Green Version]
  32. Chikita, K.; Jha, J.; Yamada, T. Hydrodynamics of a supraglacial lake and its effect on the basin expansion: Tsho Rolpa, Rolwaling Valley, Nepal Himalaya. Arct. Antarct. Alp. Res. 1999, 31, 58–70. [Google Scholar] [CrossRef]
  33. Wessels, R.L.; Kargel, J.S.; Kieffer, H.H. ASTER measurement of supraglacial lakes in the Mount Everest region of the Himalaya. Ann. Glaciol. 2002, 34, 399–408. [Google Scholar] [CrossRef] [Green Version]
  34. Jonsell, U.; Hock, R.; Duguay, M. Recent air and ground temperature increases at Tarfala Research Station, Sweden. Polar Res. 2013, 32, 19807. [Google Scholar] [CrossRef]
  35. Kim, S.; Sinclair, V.A.; Räisänen, J.; Ruuhela, R. Heat waves in Finland: Present and projected summertime extreme temperatures and their associated circulation patterns. Int. J. Climatol. 2018, 38, 1393–1408. [Google Scholar] [CrossRef]
  36. Karlén, W. Holocene glacier and climatic variations, Kebnekaise mountains, Swedish Lapland. Geogr. Ann. Ser. A Phys. Geogr. 1973, 55, 29–63. [Google Scholar] [CrossRef]
  37. Sabol, D.E., Jr.; Gillespie, A.R.; Abbott, E.; Yamada, G. Field validation of the ASTER temperature–emissivity separation algorithm. Remote Sens. Environ. 2009, 113, 2328–2344. [Google Scholar] [CrossRef]
  38. Gillespie, A.; Rokugawa, S.; Matsunaga, T.; Cothern, J.S.; Hook, S.; Kahle, A.B. A temperature and emissivity separation algorithm for Advanced Spaceborne Thermal Emission and Reflection Radiometer (ASTER) images. IEEE Trans. Geosci. Remote Sens. 1998, 36, 1113–1126. [Google Scholar] [CrossRef]
  39. Gillespie, A.R.; Abbott, E.A.; Gilson, L.; Hulley, G.; Jiménez-Muñoz, J.C.; Sobrino, J.A. Residual errors in ASTER temperature and emissivity standard products AST08 and AST05. Remote Sens. Environ. 2011, 115, 3681–3694. [Google Scholar] [CrossRef]
  40. Hook, S.J.; Chander, G.; Barsi, J.A.; Alley, R.E.; Abtahi, A.; Palluconi, F.D.; Markham, B.L.; Richards, R.C.; Schladow, S.G.; Helder, D.L. In-flight validation and recovery of water surface temperature with Landsat-5 thermal infrared data using an automated high-altitude lake validation site at Lake Tahoe. IEEE Trans. Geosci. Remote Sens. 2004, 42, 2767–2776. [Google Scholar] [CrossRef]
  41. Steissberg, T.E.; Hook, S.J.; Schladow, S.G. Characterizing partial upwellings and surface circulation at Lake Tahoe, California–Nevada, USA with thermal infrared images. Remote Sens. Environ. 2005, 99, 2–15. [Google Scholar] [CrossRef]
  42. Hook, S.J.; Vaughan, R.G.; Tonooka, H.; Schladow, S.G. Absolute radiometric in-flight validation of mid infrared and thermal infrared data from ASTER and MODIS on the Terra spacecraft using the Lake Tahoe, CA/NV, USA, automated validation site. IEEE Trans. Geosci. Remote Sens. 2007, 45, 1798–1807. [Google Scholar] [CrossRef]
  43. Hulley, G.C.; Hook, S.J.; Abbott, E.; Malakar, N.; Islam, T.; Abrams, M. The ASTER Global Emissivity Dataset (ASTER GED): Mapping Earth’s emissivity at 100 m spatial scale. Geophys. Res. Lett. 2015, 42, 7966–7976. [Google Scholar] [CrossRef]
  44. Malakar, N.K.; Hulley, G.C.; Hook, S.J.; Laraby, K.; Cook, M.; Schott, J.R. An Operational Land Surface Temperature Product for Landsat Thermal Data: Methodology and Validation. IEEE Trans. Geosci. Remote Sens. 2018, 56, 5717–5735. [Google Scholar] [CrossRef]
  45. Ermida, S.L.; Soares, P.; Mantas, V.; Göttsche, F.M.; Trigo, I.F. Google earth engine open-source code for land surface temperature estimation from the landsat series. Remote Sens. 2020, 12, 1471. [Google Scholar] [CrossRef]
  46. Kraaijenbrink, P.D.; Shea, J.M.; Litt, M.; Steiner, J.F.; Treichler, D.; Koch, I.; Immerzeel, W.W. Mapping surface temperatures on a debris-covered glacier with an unmanned aerial vehicle. Front. Earth Sci. 2018, 6, 64. [Google Scholar] [CrossRef] [Green Version]
  47. Tonooka, H. Accurate atmospheric correction of ASTER thermal infrared imagery using the WVS method. IEEE Trans. Geosci. Remote Sens. 2005, 43, 2778–2792. [Google Scholar] [CrossRef]
  48. Arendt, A.; Bliss, A.; Bolch, T.; Cogley, J.G.; Gardner, A.S.; Hagen, J.O.; Hock, R.; Huss, M.; Kaser, G.; Kienholz, C.; et al. Randolph Glacier Inventory–A Dataset of Global Glacier Outlines: Version 5.0; Global Land Ice Measurements from Space: Boulder, CO, USA, 2015. [Google Scholar]
  49. Donlon, C.J.; Martin, M.; Stark, J.; Roberts-Jones, J.; Fiedler, E.; Wimmer, W. The operational sea surface temperature and sea ice analysis (OSTIA) system. Remote Sensing of Environment. 2012, 116, 140–158. [Google Scholar] [CrossRef]
  50. Peter, H.; Sommaruga, R. Alpine glacier-fed turbid lakes are discontinuous cold polymictic rather than dimictic. Inland Waters 2017, 7, 45–54. [Google Scholar] [CrossRef] [PubMed] [Green Version]
  51. Stone, P.H.; Carlson, J.H. Atmospheric lapse rate regimes and their parameterization. J. Atmos. Sci. 1979, 36, 415–423. [Google Scholar] [CrossRef] [Green Version]
  52. Becker, M.W.; Daw, A. Influence of lake morphology and clarity on water surface temperature as measured by EOS ASTER. Remote Sens. Environ. 2005, 99, 288–294. [Google Scholar] [CrossRef]
  53. Sinclair, V.A.; Mikkola, J.W.; Rantanen, M.; Raisanen, J. The summer 2018 heatwave in Finland. Weather 2019, 74, 403–409. [Google Scholar] [CrossRef]
Figure 1. Monthly average air temperatures (°C) measured at 2 m above ground at Tarfala Research Station (67.9°N, 1143 m a.s.l.) for 1980 to 2019 with 5 year running means for June (blue), July (red), and August (green) (from SMHI and Bolin Centre). Data from 1980 to 1987 are from chart recorder-based automated data collection and from an automated weather station after 1987 (Bolin and SMHI).
Remotesensing 13 02987 g001
Figure 2. ASTER satellite composite (green, red, and NIR) image showing the locations of the 12 proglacial lakes (Arctic Sweden) with a sufficient area to have sufficient pixels for surface temperature analysis via the AST08 temperature product. Note that lake 12 is situated ~50 km to the south in the area of Sarek.
Remotesensing 13 02987 g002
Figure 3. Workflow for extracting surface temperatures (LST) for proglacial lakes (LSWT) from the ASTER surface temperature product (AST08 v2.9) over Arctic Sweden. The proglacial lake inventory (PGLID) geometry and characteristics (including associated glacier geometry from the Randolph Glacier Inventory) are used in the analysis. The PGLID was filtered for lakes >129,600 m2 (see text) and also by the classification of contact (0 = no contact, 1 = contact with glacier) with glaciers in corresponding ASTER optical imagery. The ASTER emissivity product (AST05) was inspected for quality assessment (QA) of emissivity data used in the production of the AST08 surface temperature product (AST08; see below). A lake margin pixel buffer was used in the selection of AST08 surface temperatures to ensure that temperatures were from water areas. Mixed pixels from around the margins of the lake were not included in the analysis. Data validation is presented in Figure 4.
Remotesensing 13 02987 g003
Figure 4. Validation of AST08 surface temperatures (±1.5 °C shown as error bars) plotted against contemporaneous near-surface (<2 m depth) in situ lake water temperatures. The full dataset linear regression value is R2 = 0.9365 and median bias = 2.01 (AST08 thermistor values). Green data points from an RBR Duo thermistor (accuracy ±0.002 °C) temperatures (every minute) from in situ buoys in Kilpisjarvi, Sweden (from G. Kirrilin). Blue data points are from Onset HOBO U20 sensor (accuracy ± 0.5 °C) mounted on a metal pole at a <2 m depth in Brazo Rico (near Perito Moreno Glacier), arm of Lago Argentino, Argentina (from M. Minowa).
Remotesensing 13 02987 g004
Figure 5. (a) Plot of average surface temperature (LSWTAV) for each proglacial lake from AST08 analysis (8 August 2014) against the aspect of the parent glacier (RGI) [48]. (b) Plot of average surface temperature (LSWTAV) for each proglacial lake from AST08 analysis (8 August 2014) against the ratio of parent glacier (RGI)/proglacial lake area [48]. Blue data points denote ice-contact proglacial lakes. Green data points denote non-ice-contact proglacial lakes.
Remotesensing 13 02987 g005
Figure 6. Box and whisker plots of lake surface water temperatures extracted from AST08 temperature product pixels over Arctic Sweden on 8 August 2014 at 10:46 a.m. for (a) ice-contact proglacial lakes and (b) non ice-contact proglacial lakes. Whiskers extend to points within 1.5 times the interquartile range (IQR) from the upper and lower quartile. Points 1.5 times the IQR from the upper and lower quartile are plotted as outliers. With x = mean and central line = median. Lake ID = AST08ID.
Remotesensing 13 02987 g006
Figure 7. Box and whisker plots of lake surface water temperatures extracted from AST08 temperature product pixels for: (a) lake 3, (b) lake 4 and (c) lake 12 in Arctic Sweden on 2 September 2000 (dark blue), 27 August 2006 (orange), 25 July 2014 (yellow), 8 August 2014 (grey) and 29 July 2018 (light blue). Whiskers extend to points within 1.5 times the interquartile range (IQR) from the upper and lower quartile. Points 1.5 times the IQR from the upper and lower quartile are plotted as outliers. With x = mean and central line = median.
Remotesensing 13 02987 g007
Figure 8. Proglacial lake 6 and Kaskapakte Glacier; (a) ASTER satellite composite image (green, red, NIR) and (b) ASTER surface temperature product image (AST08) at 10:46 a.m. on 8 August 2014.
Remotesensing 13 02987 g008
Table 1. Summary table of the 12 proglacial lakes analysed. The left columns contain the AST08 ID (as used in Figure 1) and the LSWTAV (°C) and LSWTDEV (°C) for each proglacial lake (ProGL) and associated lake geometry/characteristics from the ASTER 8 August 2014 manual mapping in central columns. Maximum depth data for lake 6 and 7 are from Dye et al. (unpublished) and [8]. Right hand columns contain geometry/characteristics of parent glaciers from the Randolph Glacier Inventory (2008). Perim. = perimeter; elev. = elevation; ice cont. = ice contact (1 = yes).
AST08IDLSWT AV (°C)LSWT SDEVProGL Area (m2)Depth (m)Perim.
(m)
Elev.
(m)
Ice ContactGlacier AreaGlacier Aspect
19.50.30157,516-175012671265,647103
211.50.19163,140-242511440227,51892
38.30.67242,736-234913181148,666574
410.50.38346,719-251913821105,949103
57.21.06230,764-2372124301,608,39820
66.21.54132,172~201717112411,533,95926
78.11.03560,58949.8329711940670,18673
811.00.91211,513-179111230552,809104
99.71.13686,233-46921169071,160110
1010.60.84220,826-2626109002,301,46879
116.21.23149,143-218912271398,24477
123.20.89175,832-2092144111,755,47433
Publisher’s Note: MDPI stays neutral with regard to jurisdictional claims in published maps and institutional affiliations.

