1. Introduction
Soil organic matter (SOM) is the product of the onsite biochemical decomposition of dead tissues of flora and fauna. It controls the chemical and physical properties of the soil and is responsible for its overall health [
1,
2]. In addition, the ongoing SOM sequestration process is one of the main cost-effective climate change mitigation strategies for removing carbon dioxide (CO
2) from the atmosphere [
3] in the fight against global warming.
The stage of SOM decomposition is determined by the activity of soil microorganisms, which use fresh organic matter (OM) as an available energy source for reproduction. The young stage in the OM decomposition process refers to the initial phase of the microorganisms’ activity, in which the C:N ratio should be over 26 [
4]. The mature stage refers to the final stage of microorganism activity, in which the C:N ratio is around 10–15 and new complex compounds, often called humus, are formed [
5]. Thus, the C:N ratio allows one to evaluate the decomposition stage of OM in both natural soil and compost substances.
Sustainable soil utilization, management, and environmental protection require a more precise understanding of SOM content and its spatial variability. The importance of SOM is reflected in the approximately 2,330,000 papers related to this topic in Google Scholar alone (as of February 2021). Soil spectroscopy is one of the most developed, rapid, and cost-free practices to assess soil attributes in any domain, and it is most commonly used in remote sensing of soil. As a result, a large and growing body of literature on soil spectroscopy has focused on spectral-based assessments of SOM using different wavelengths. Nevertheless, it is interesting to note that there is no consensus regarding what wavelengths are the most indicative for SOM assessment.
In general, increasing OM content darkens the soil in the visible (VIS) and near-infrared (NIR) spectral regions. Unfortunately, other soil attributes may have a similar effect, such as texture, structure, moisture, and mineralogy [
6]. This calls for precaution when assessing SOM content using spectral-based means, as demonstrated recently by Heller Pearlshtien and Ben-Dor [
7], who showed how the overlapping spectral signals of SOM and iron oxides may affect one another in the VIS–NIR region.
The VIS region is widely used for soil and geological applications that require color determinations [
8]. In the VIS range, wavelengths at around 410, 570, 660 [
9], 600 [
10], 520, 540, 550 [
11], 570 to 630 [
12], and 623 nm [
13] tend to be used to estimate SOM content, because the OM reduces reflectance in the range of 350–700 nm. In the NIR and shortwave infrared (SWIR) ranges, radiance at wavelengths of around 960, 1100 [
14], 1400, 1900 [
15], 1720, 2180, 2309 [
16], 1744, 1870, 2052 [
17], 1100, 1600, 1700, 1800 to 2000, and 2000 to 2400 nm [
18] are more likely to be absorbed by SOM. Recently it was reported by Bircher et al. [
19] that microwave radiation using the L-band can produce a relative permittivity that enables organic substrate detection. Therefore, the wide spectral range in which SOM is active is affected by the diverse chemical composition of the OM sources, as well as the degradation status of the OM in question [
1].
Inbar and Chen published two studies showing that the OMs that they examined were diverse in their spectroscopy and chemistry, based on stage of decomposition [
20,
21]. Another factor that affects the spectral feature extraction to predict SOM from spectral measurements is the soil type and background [
22]. Recently, Ogen et al. [
23] suggested using the soil spectral detection limit (SSDL) index, derived from the limit of detection concept of Shrivastava and Gupta [
24] and adapted to the discipline of soil spectroscopy, to evaluate the detection limit of OM spectrally.
The objective of this study was to examine the performance of the generic and traditional approach (where the soil matrix is made up of different OM types) using spectral-based models to estimate the SOM content in a selected bright soil analogue. The variability of the SSDL using different sources of OM (composts) was evaluated and reported.
2. Materials and Methods
2.1. Laboratory Measurements
For this study, five different commercial composts were acquired from commercial vendors. Each compost was air-dried and sieved through a 2 mm sieve. Then, the hygroscopic water was removed by heating at 105 °C for 24 h, and the OM content was calculated following the loss on ignition (LOI) method at 405 °C for 8 h [
23,
25,
26]. OM content was calculated from the difference in weight.
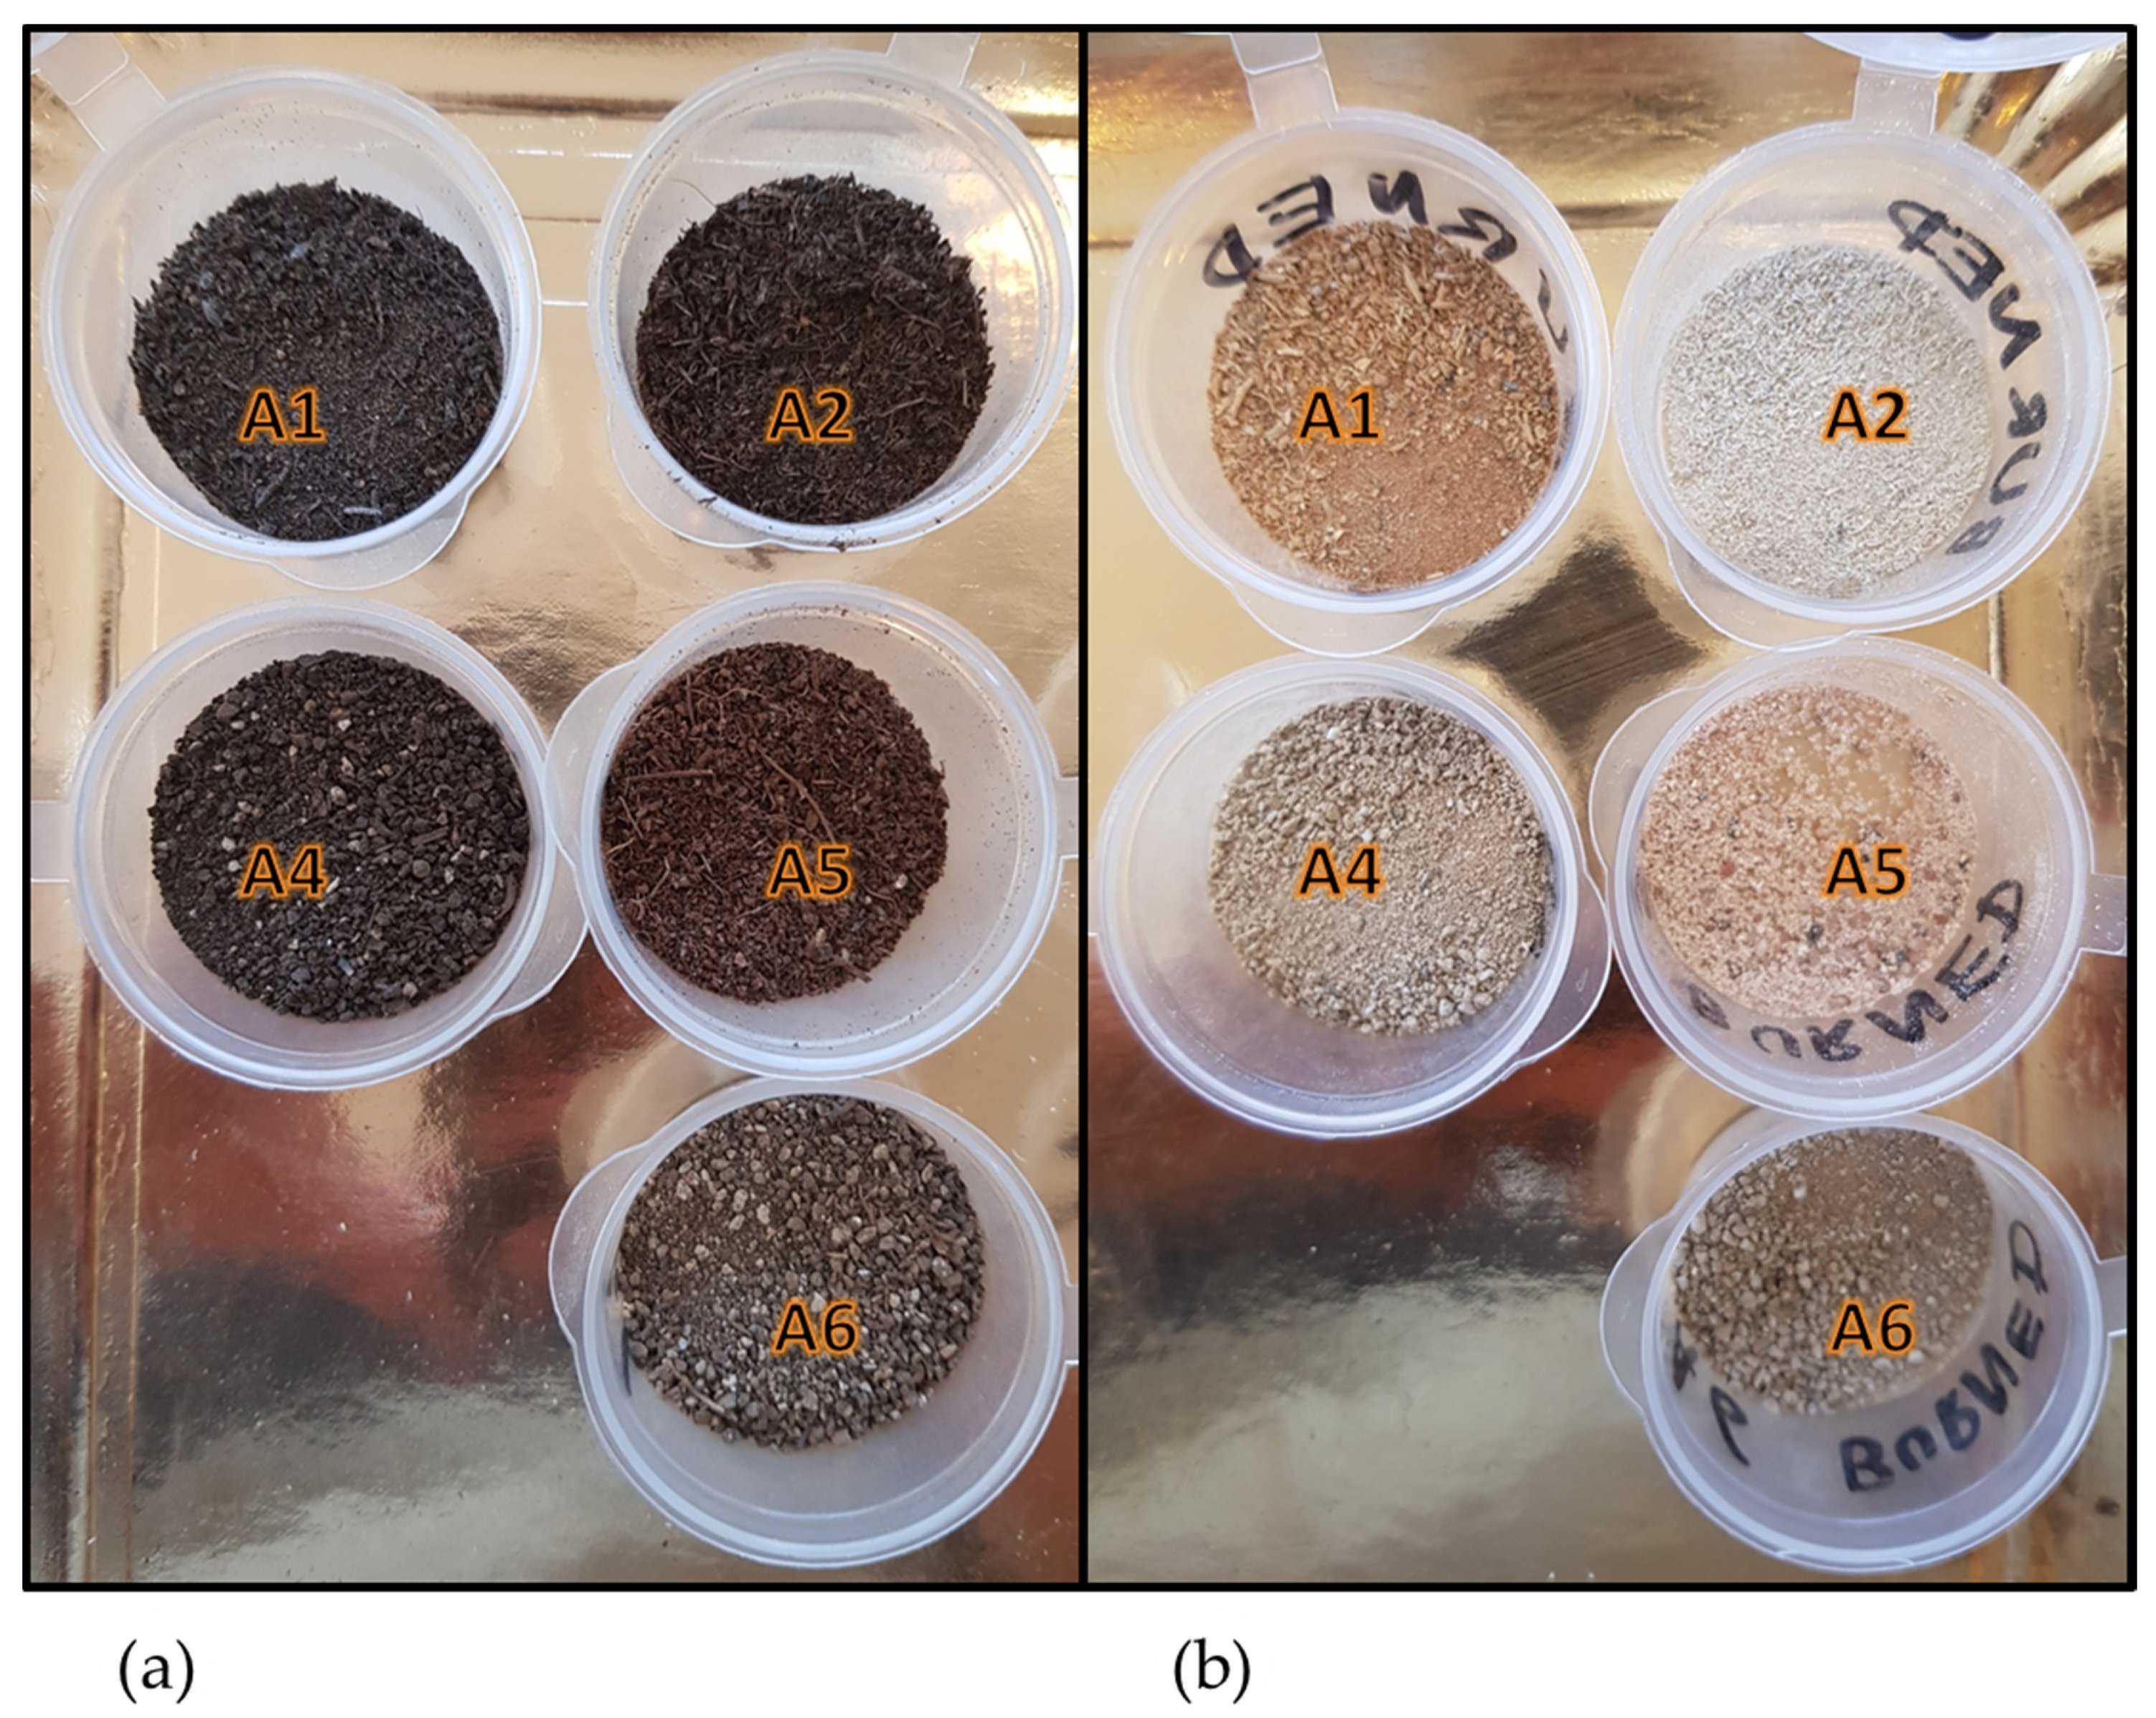
Figure 1 illustrates the composts before and after the OM removal. This process was also repeated with pure dune sand (B2) from the coast of Ashdod, Israel. The dune sand texture was measured with a laser diffraction particle size analyzer (Mastersizer 2000,
www.malvernpanalytical.com, accessed on 8 April, 2021) that obtained 100% of sand with no silt and clay fractions. Dry sieving confirmed that the dune sand grain size was <2 mm.
Table 1 lists the OM content and code of every compost.
Once the OM content in each of the composts was calculated, 122 soil samples were artificially prepared by mixing dune sand with gradually increasing amounts of each compost separately. This was carried out to assess how much OM was added to every sand sample and what the total OM was (% content in every sample) under controlled conditions. The result was 610 artificial soils with different (and known) OM types and contents on the same background (dune sand).
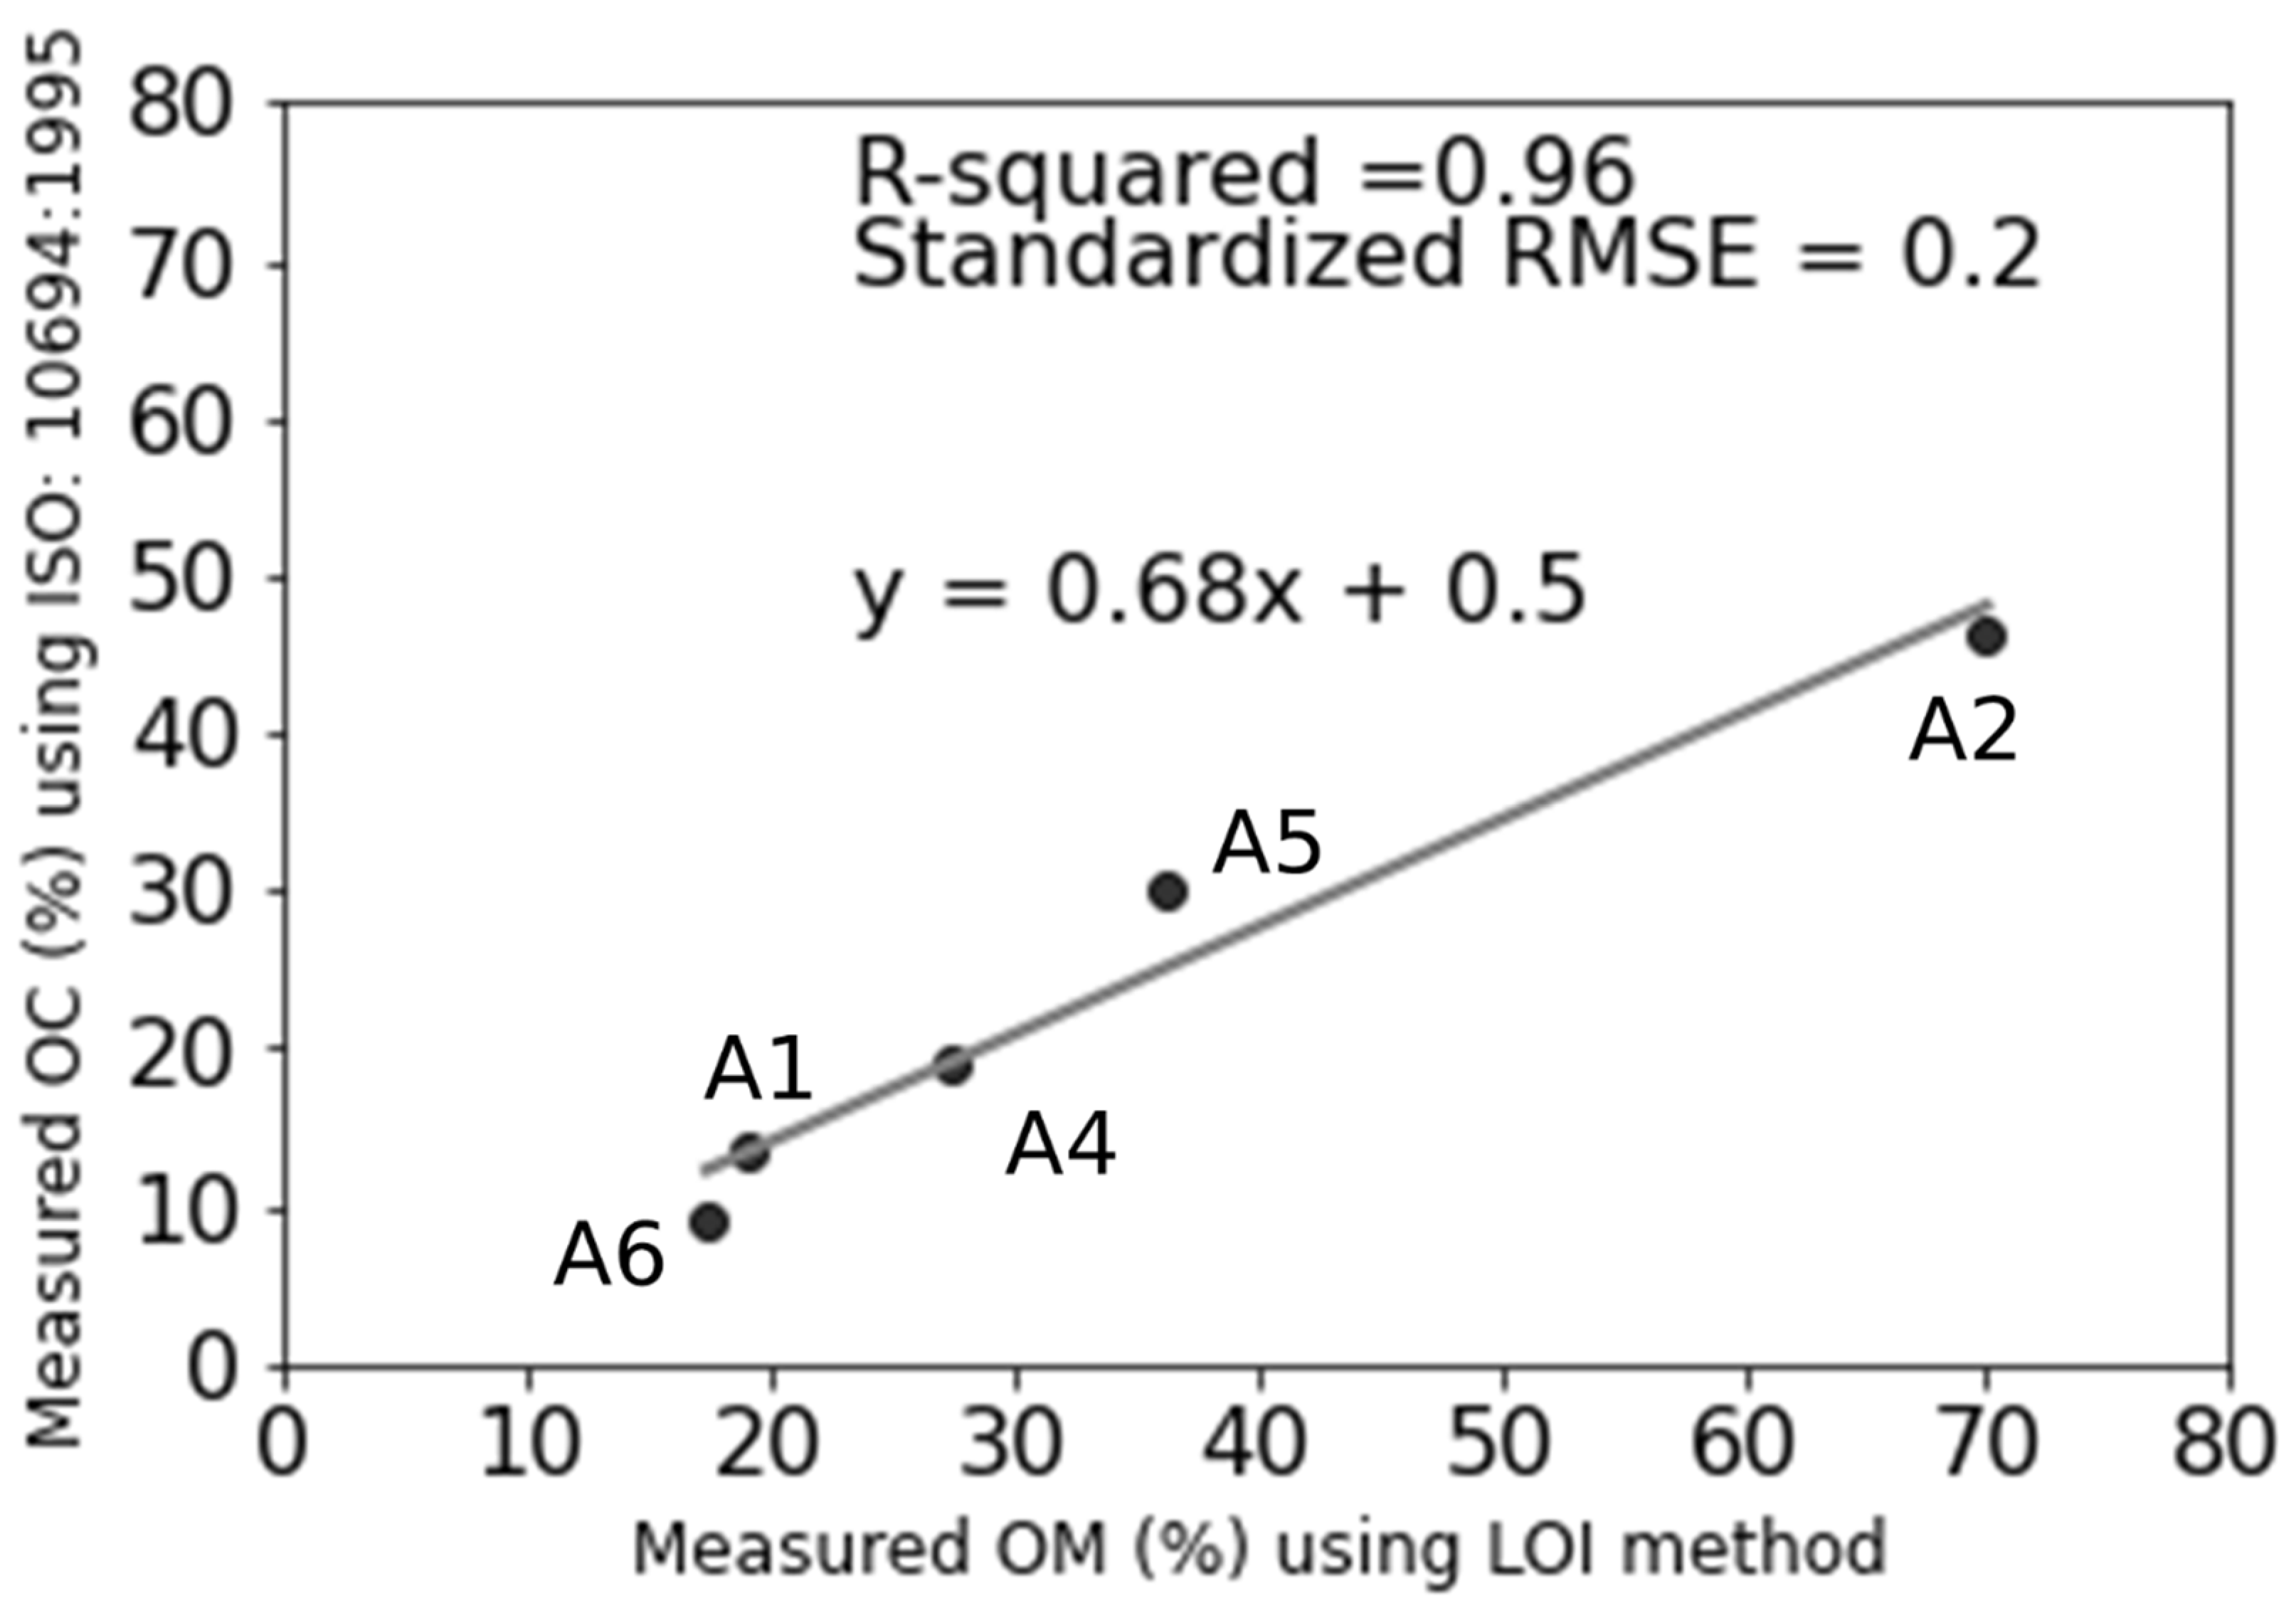
For each OM source, the compost content of the sand–OM samples ranged between 0 and 12%, where two sand–OM samples were created with the same compost content, obtaining an interval of 0.2% of added compost for each OM source. Thus, for each 0.2% interval, two independent replications were created. The calculation of the OM in the artificial soil mixture took into account the OM fraction in each compost. The OM in the dune sand was negligible (<0.01%) and was not taken into consideration in the OM calculation. It is important to mention that although the LOI method has some limitations in defining the exact OM content, it was used as it was found to be highly correlated with the method of Walkley and Black [
25]. For further corroboration of the LOI method, we examined the correlation between the LOI and traditional dry combustion (ISO 10694:1995) methods in the selected composts; where a high correlation (R
2 = 0.96) was observed (
Figure 2). The organic carbon content of the composts is determined after dry combustion (ISO 10694:1995) with a FLASH2000 Elemental Analyser (Thermo Scientific).
Accordingly, the LOI method was proven to be a reliable method for determining OM in this study and was selected to keep the discussion relevant with the study of Ogen et al. [
23], who examined different soil types and one compost using the LOI method.
The spectral measurements were carried out using an ASD spectrometer (Analytical Spectral Devices, Boulder, CO, USA) following the internal soil standard protocol presented in Ben Dor et al. [
27] using a Lucky Bay sample as the reference soil. The ASD spectrometer has three detectors with 1 nm interpolated spectral resolution which provides 2151 bands in the VIS–NIR (350–1000 nm), SWIR1 (1000–1800 nm), and SWIR2 (1800–2500 nm) regions.
2.2. Data Analysis
We evaluated the OM detection limit by adopting the SSDL index of Ogen et al. [
23]. The SSLD index is based on the relationship between the compost indicative wavelength (CIW) and the soil indicative wavelength (SIW). According Ogen et al. [
23], the CIW presents the highest first-derivative value of the examined compost (OM) spectrum across the 850–950 nm spectral range, and the SIW presents the highest first-derivative spectrum of the background soil in the 500–650 nm spectral range. Ogen et al. [
23] describes a detailed protocol to determine the minimal detectable amount of a specific compost. In this study, we evaluated this method but determined the minimal detectable amount of the added OM content and not that of the added compost. This task consisted of the following stages:
Savitzky–Golay (SG) smoothing [
28]: first-derivative and secondary SG smoothing was applied to the reflectance data.
The SIW of the background soil (dune sand) was identified, and the CIW was identified in every examined series of OM source samples.
The CIW/SIW ratio was calculated for each soil sample.
The mean () and standard deviation (SD) of the CIW/SIW ratio for the blank measurements (dune sand) were calculated. The blank measurements were 20 spectral measurements of the background soil (pure dune sand) with no addition of OM.
The first 10 samples with the lowest OM content in each compost series were chosen, and a linear correlation curve was created between the CIW/SIW ratio and the OM content.
The coefficient of determination (R2) was calculated.
Additional samples were added, while the R2 was measured continuously until the highest correlation between the CIW/SIW ratio and the added OM content was obtained.
The linear equation for the highest correlation was selected.
Then, the SSDL was calculated using the following equation:
where SSDL is the soil spectral detection limit of OM,
a and
b are the designated constants, and
and
σ are the calculated mean and SD of the CIW/SIW ratio of the blank sample. Further information about this method can be found in Ogen et al. [
23].
To examine the effect of the remaining non-organic material in the compost, we analyzed the spectral signature of the pure composts before and after the LOI procedure. The spectral angle mapper (SAM) algorithm [
29] was applied to the composts’ spectra before and after the LOI method, where the endmember is a featureless spectrum in which the reflectance value at every wavelength is 1. Thus, it became possible to determine the impact of OM sources on the spectral-based estimation of different composts.
Next, the spectral-based estimation of OM content (wt.%) was carried out using partial least squares regression (PLSR) analysis [
30] through the scikit-learn package of Python [
31]. Before application of the model, the spectral reflectance data were preprocessed by SG [
28]. The entire dataset contained 610 samples in total, where 122 samples were for the sample sequence of each compost. For the development of all spectral-based models, for every sand–OM mixture and in the generic group (which included all sand–OM samples), 75% of the samples were selected for the calibration stage, and the other 25% were used for the validation stage. Moreover, all the spectral-based models were further validated through a full leave-one-out-cross-validation (LOOCV) that was executed to the training groups to assess the effect of the training set selection. To improve the performance of the spectral-based models, some of the samples were omitted because they were considered outliers following the method of Hawkes and Webb [
32]. For this procedure, we removed all of the samples that presented any reflectance or OM content values with an absolute z-score value greater than 3 [
32,
33].
The evaluation of the models’ performance was based mainly on the results that presented statistical parameters such as: coefficient of determination (R
2), root mean square error (RMSE), and ratio of performance to deviation (RPD) indices. The RMSE values were evaluated in relation to the range of added OM for every sample. RMSE is an indicator of the differences between values predicted by a model and those that are actually observed [
34], and RPD is the ratio between the SD of the reference method and the RMSE [
35]. To classify the performance of the models, we defined the reliability of every model according to Chang et al. [
36] using the following rules:
Excellent model, RPD > 2;
Fair model, 1.4 < RPD < 2;
Unreliable model, RPD < 1.4.
3. Results
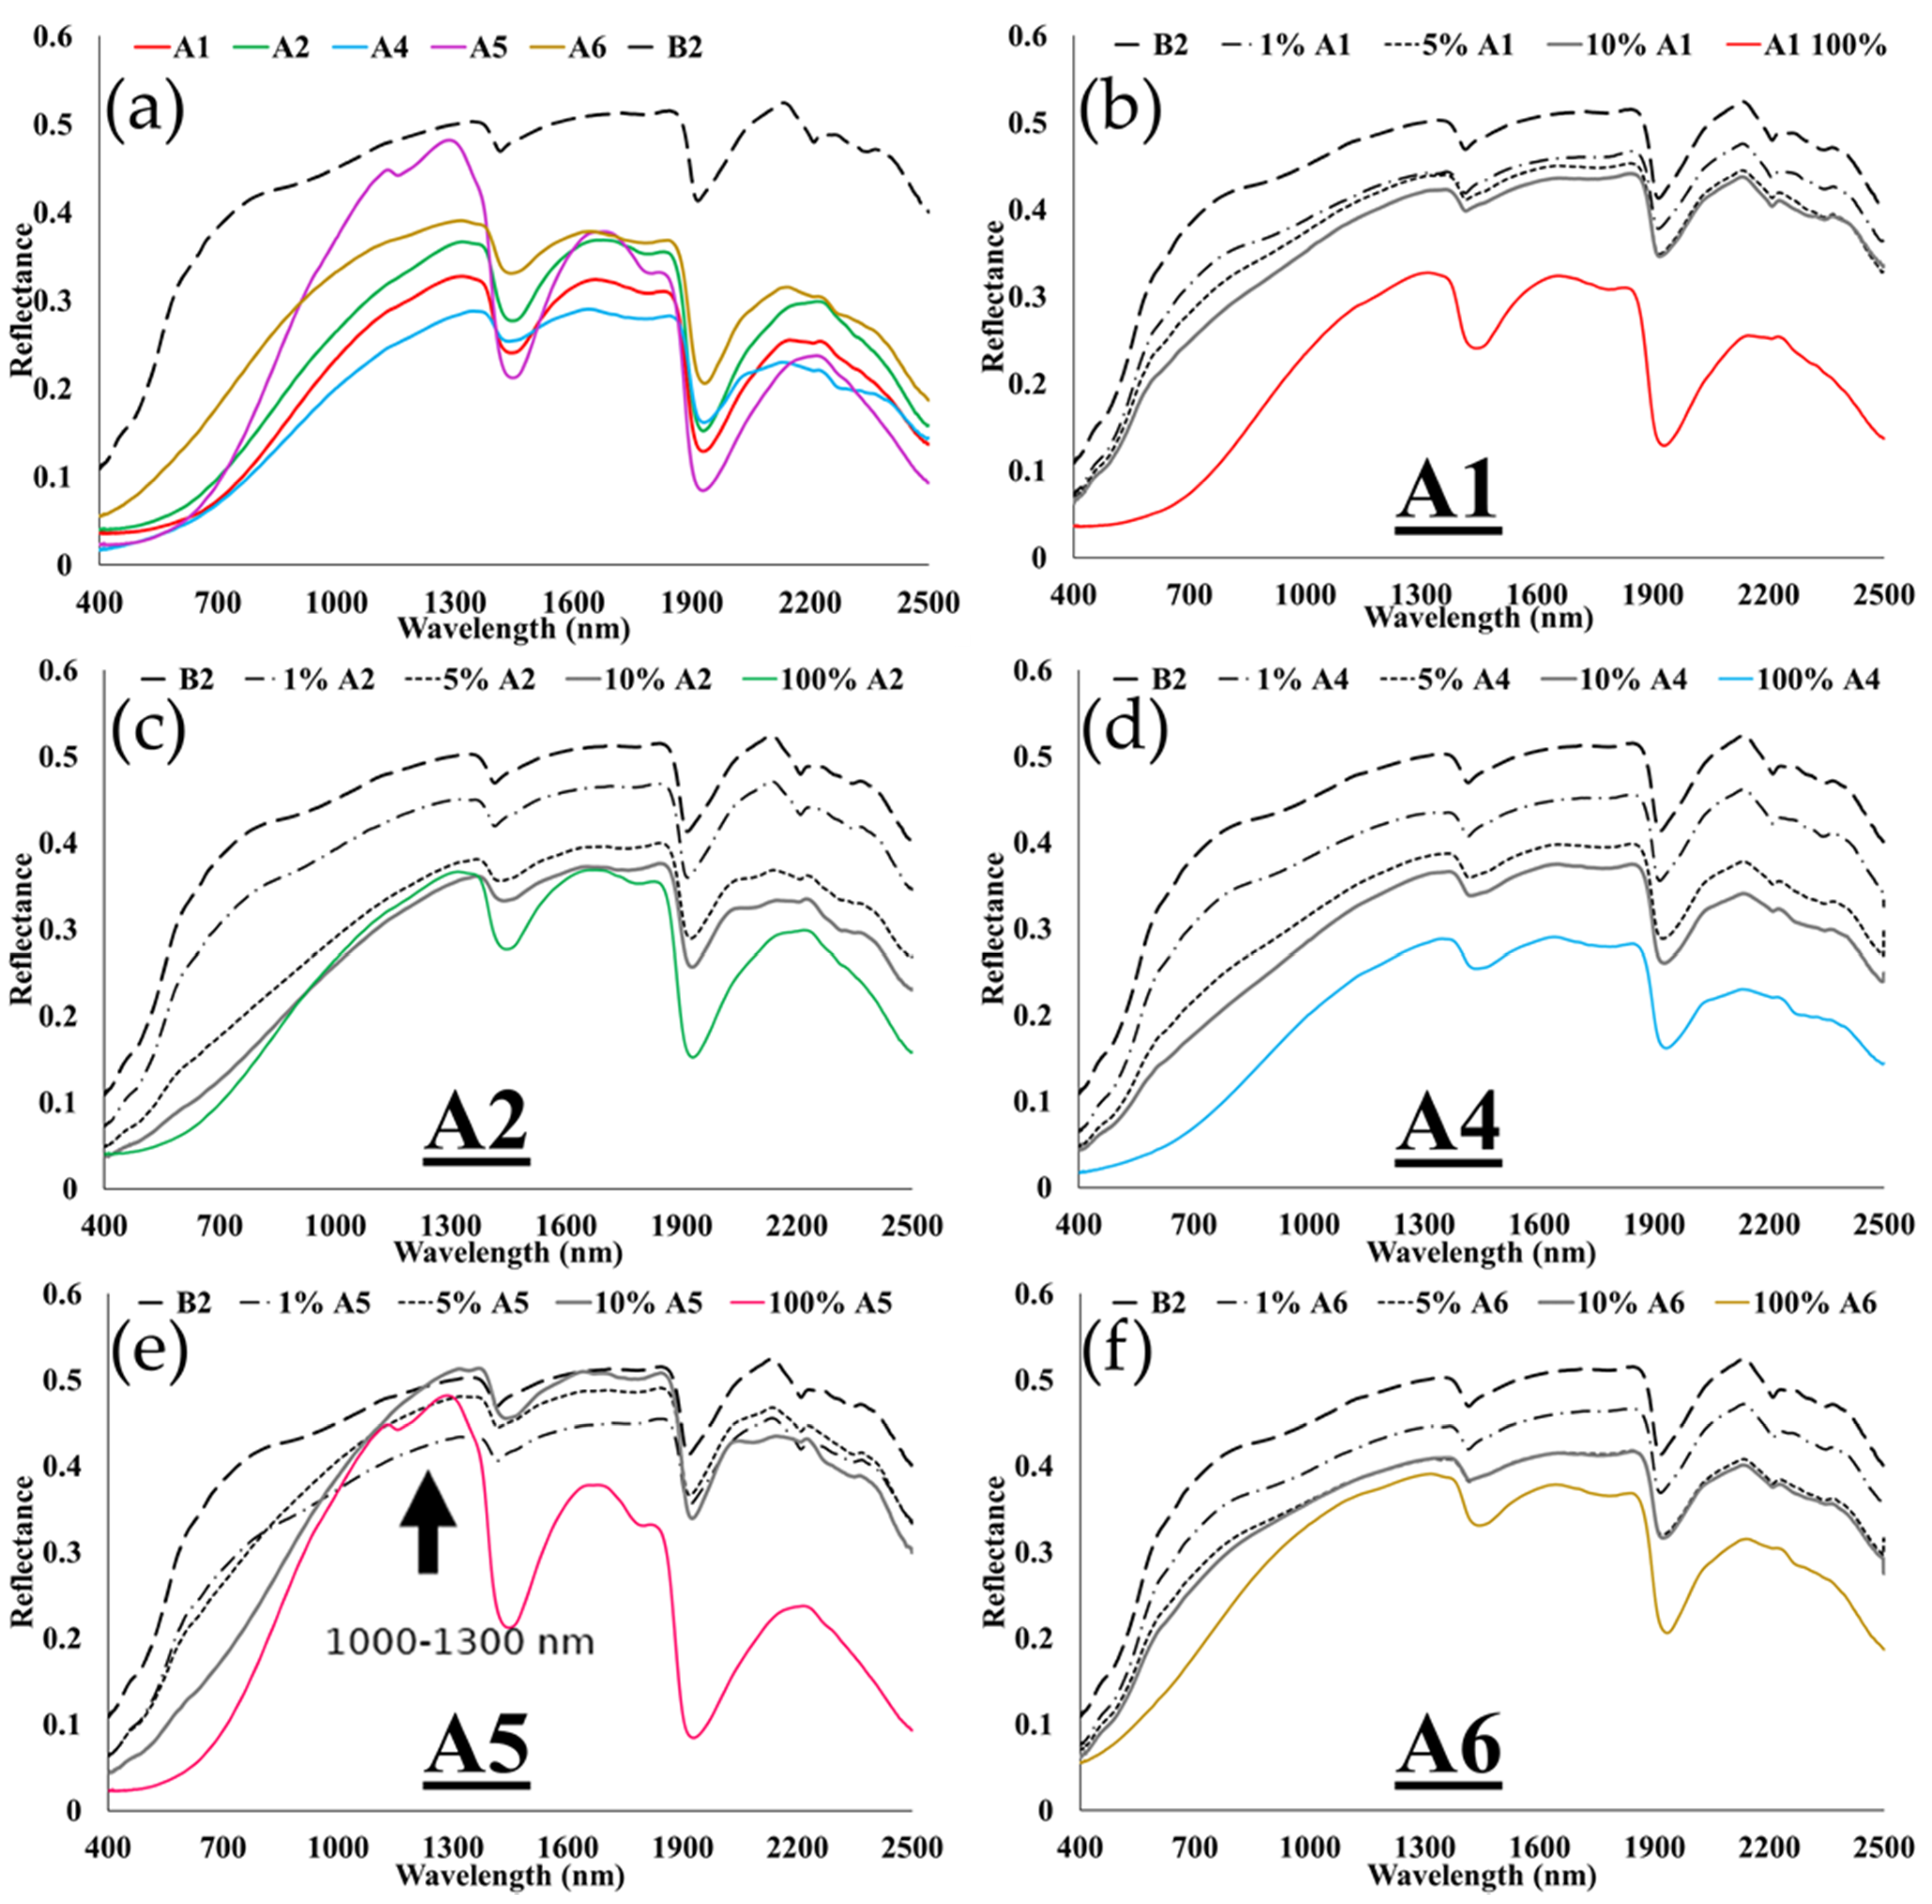
Figure 3a illustrates the diverse spectra of the composts that we evaluated and the soil background (dune sand (B2)). Although the composition of each compost was varied with dissimilar OM contents, all of the composts presented low reflectance in the VIS–NIR spectral range (
Figure 3).
Only compost A5 showed a higher reflectance than that of some sand–OM mixtures between 1000 and 1300 nm, probably because of foliar remains that are characterized by high reflectance values toward the NIR spectral region. It is clear that many spectral features of the analogue soil will change when different sources of OM are added, and this is shown in
Figure 3b–f. Every compost material affected the sand–OM mixture spectrum differently. Nonetheless, there were also some spectral features shared by all OM sources: the water absorption features at approximately 1400 and 1900 nm and the low slope in the VIS range. All of the compost slopes showed a concave behavior until approximately 1250 nm, except A5, which presented an absorption at approximately 1200 nm. In general, all of the composts shared some spectral properties that expert users could immediately identify as OM, but not to the same extent. The water absorptions are very marked at 1400 and 1900 nm, suggesting that water molecules produce a masking effect that might hinder many small but known features of dry OM [
37,
38]. Such spectral variability may affect the performance of the quantitative spectral analysis in estimating the OM content through a generic approach.
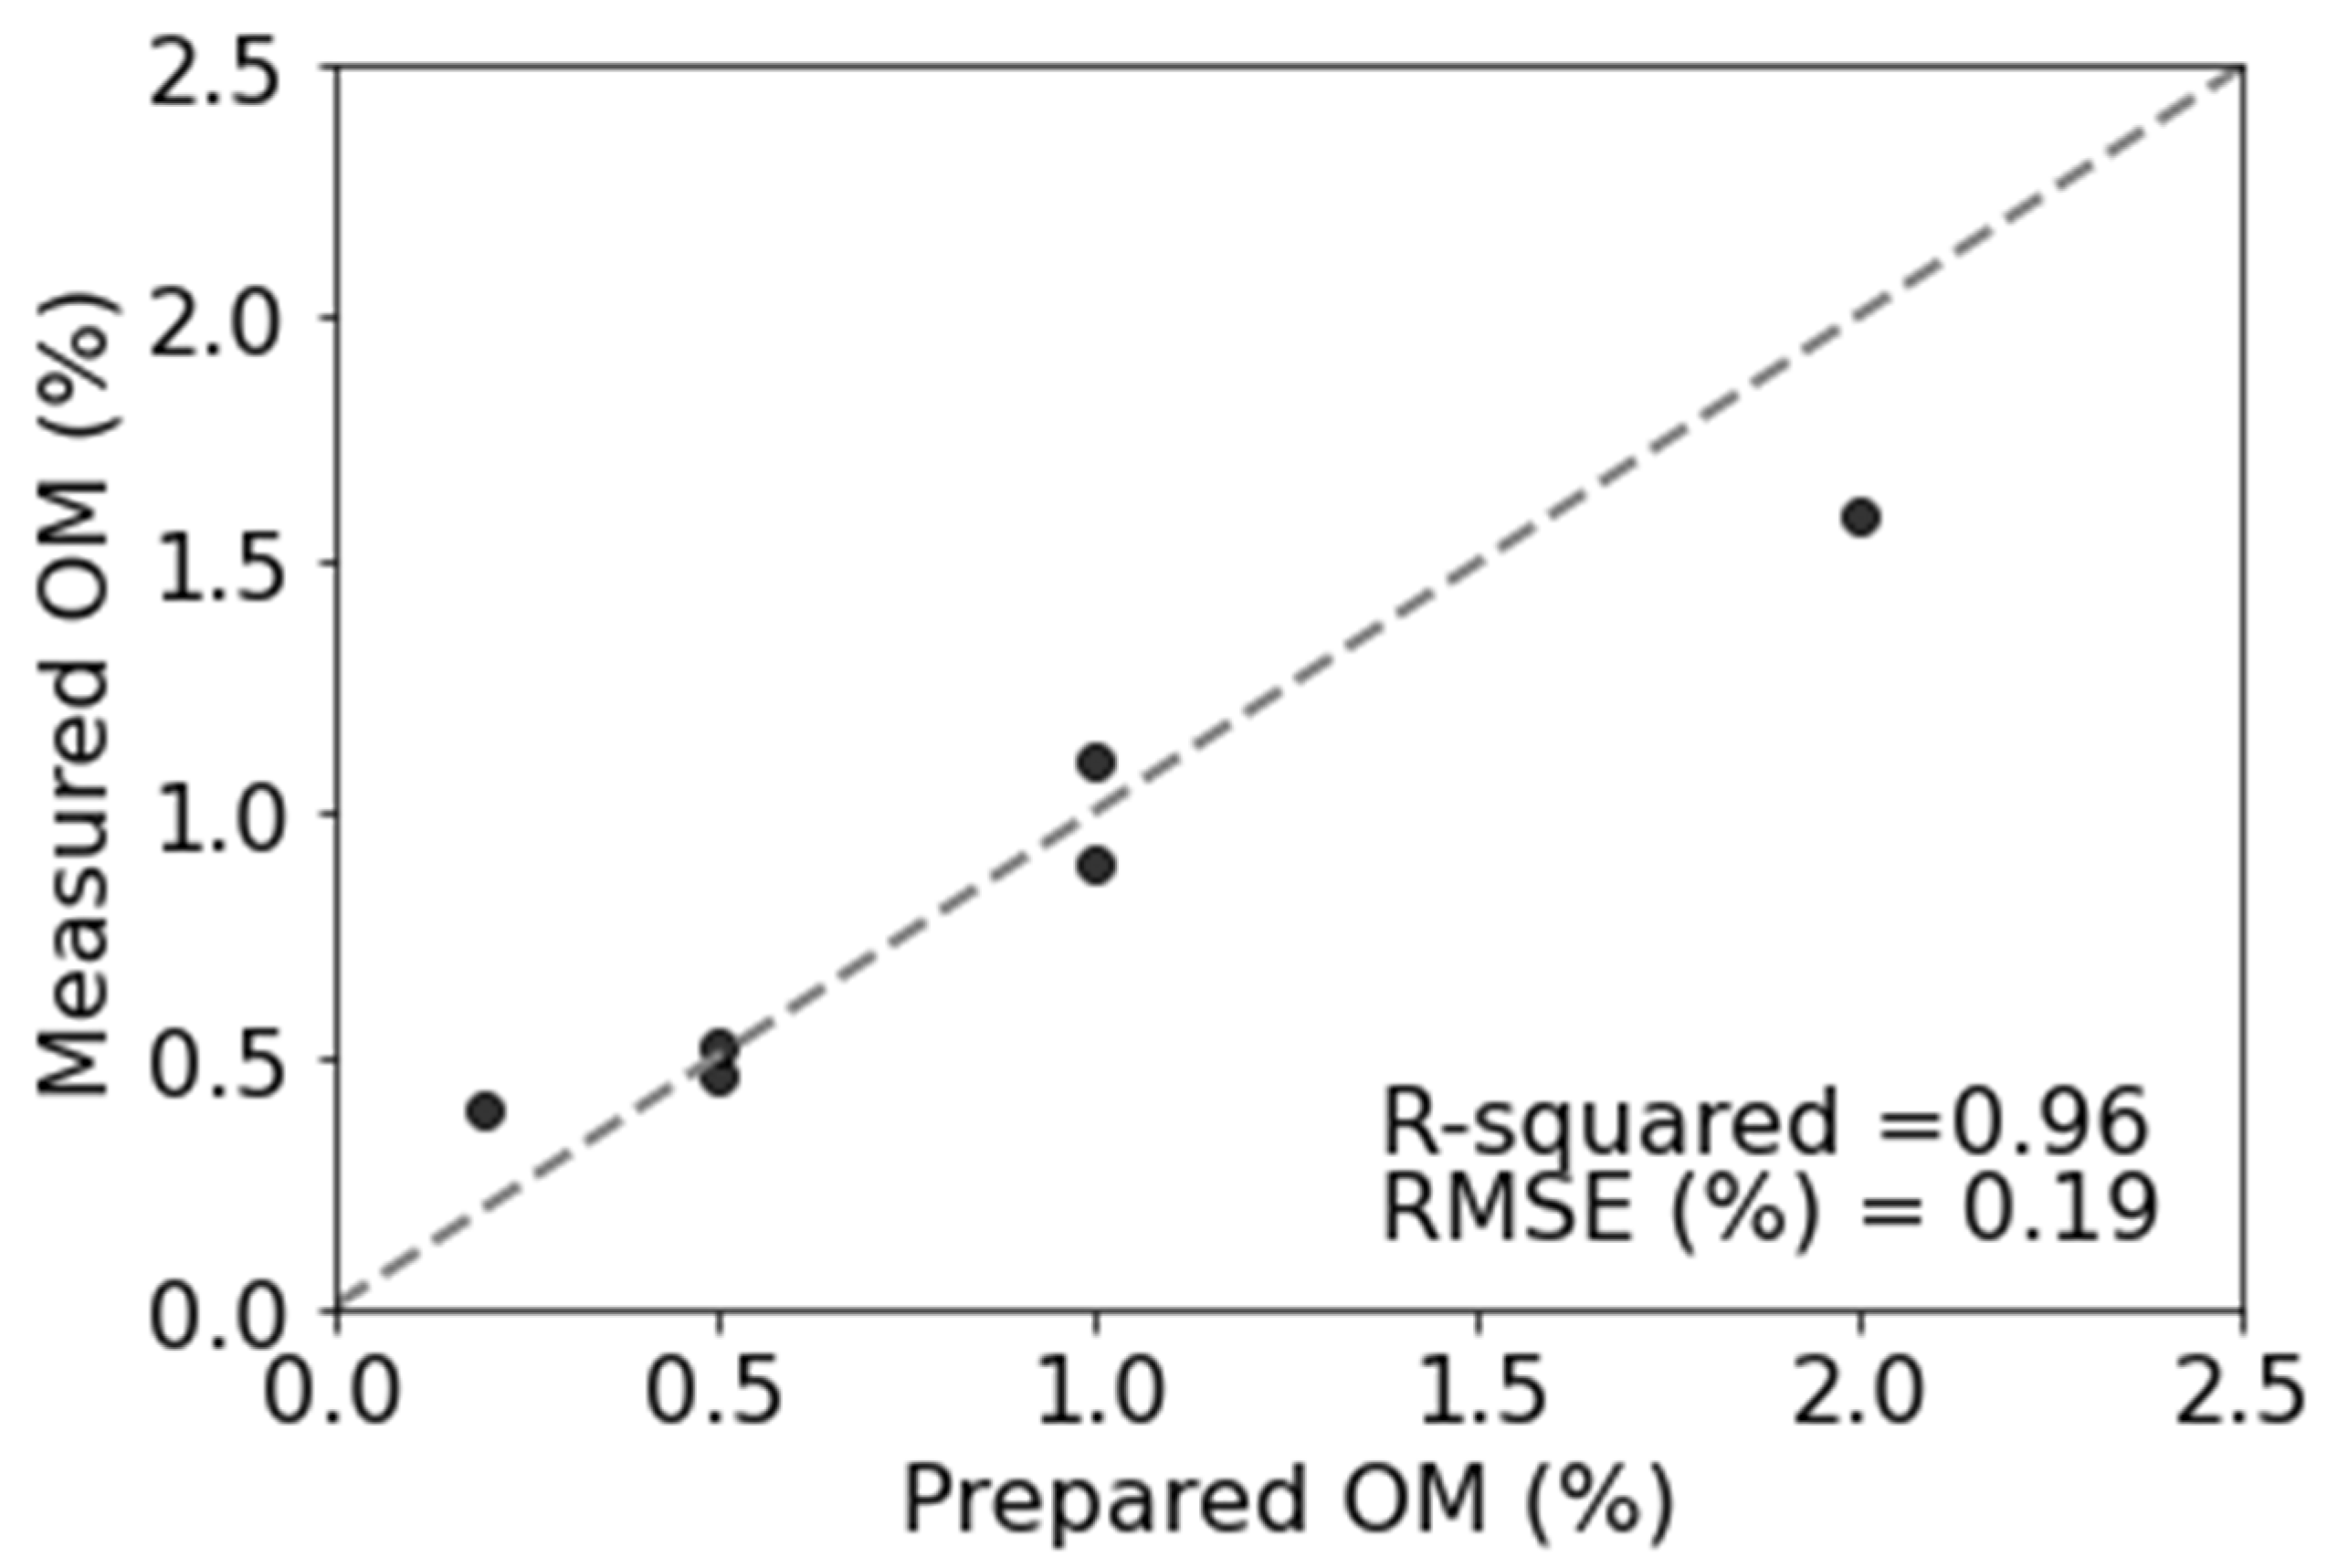
3.1. Validation of the Preparation Method for the Sand–OM Mixtures
To confirm that the sand–OM mixtures had the SOM content measured by the LOI method, six samples that were not part of any analysis were generated from two sources of OM (three from A2 and three from A5) in different amounts.
Figure 4 shows the methodology that we used to prepare the sand–OM mixtures during this study with a correlative chart. The
x-axis represents the OM content, assuming that the OM content in each compost is stable as it is added to each sand–OM mixture (as we did in this study). The
y-axis represents the OM content measured by the LOI method in each sand–OM mixture. This chart (
Figure 4) shows satisfactory validation of the implemented methodology (R
2 = 0.96).
3.2. SSDL and SAM
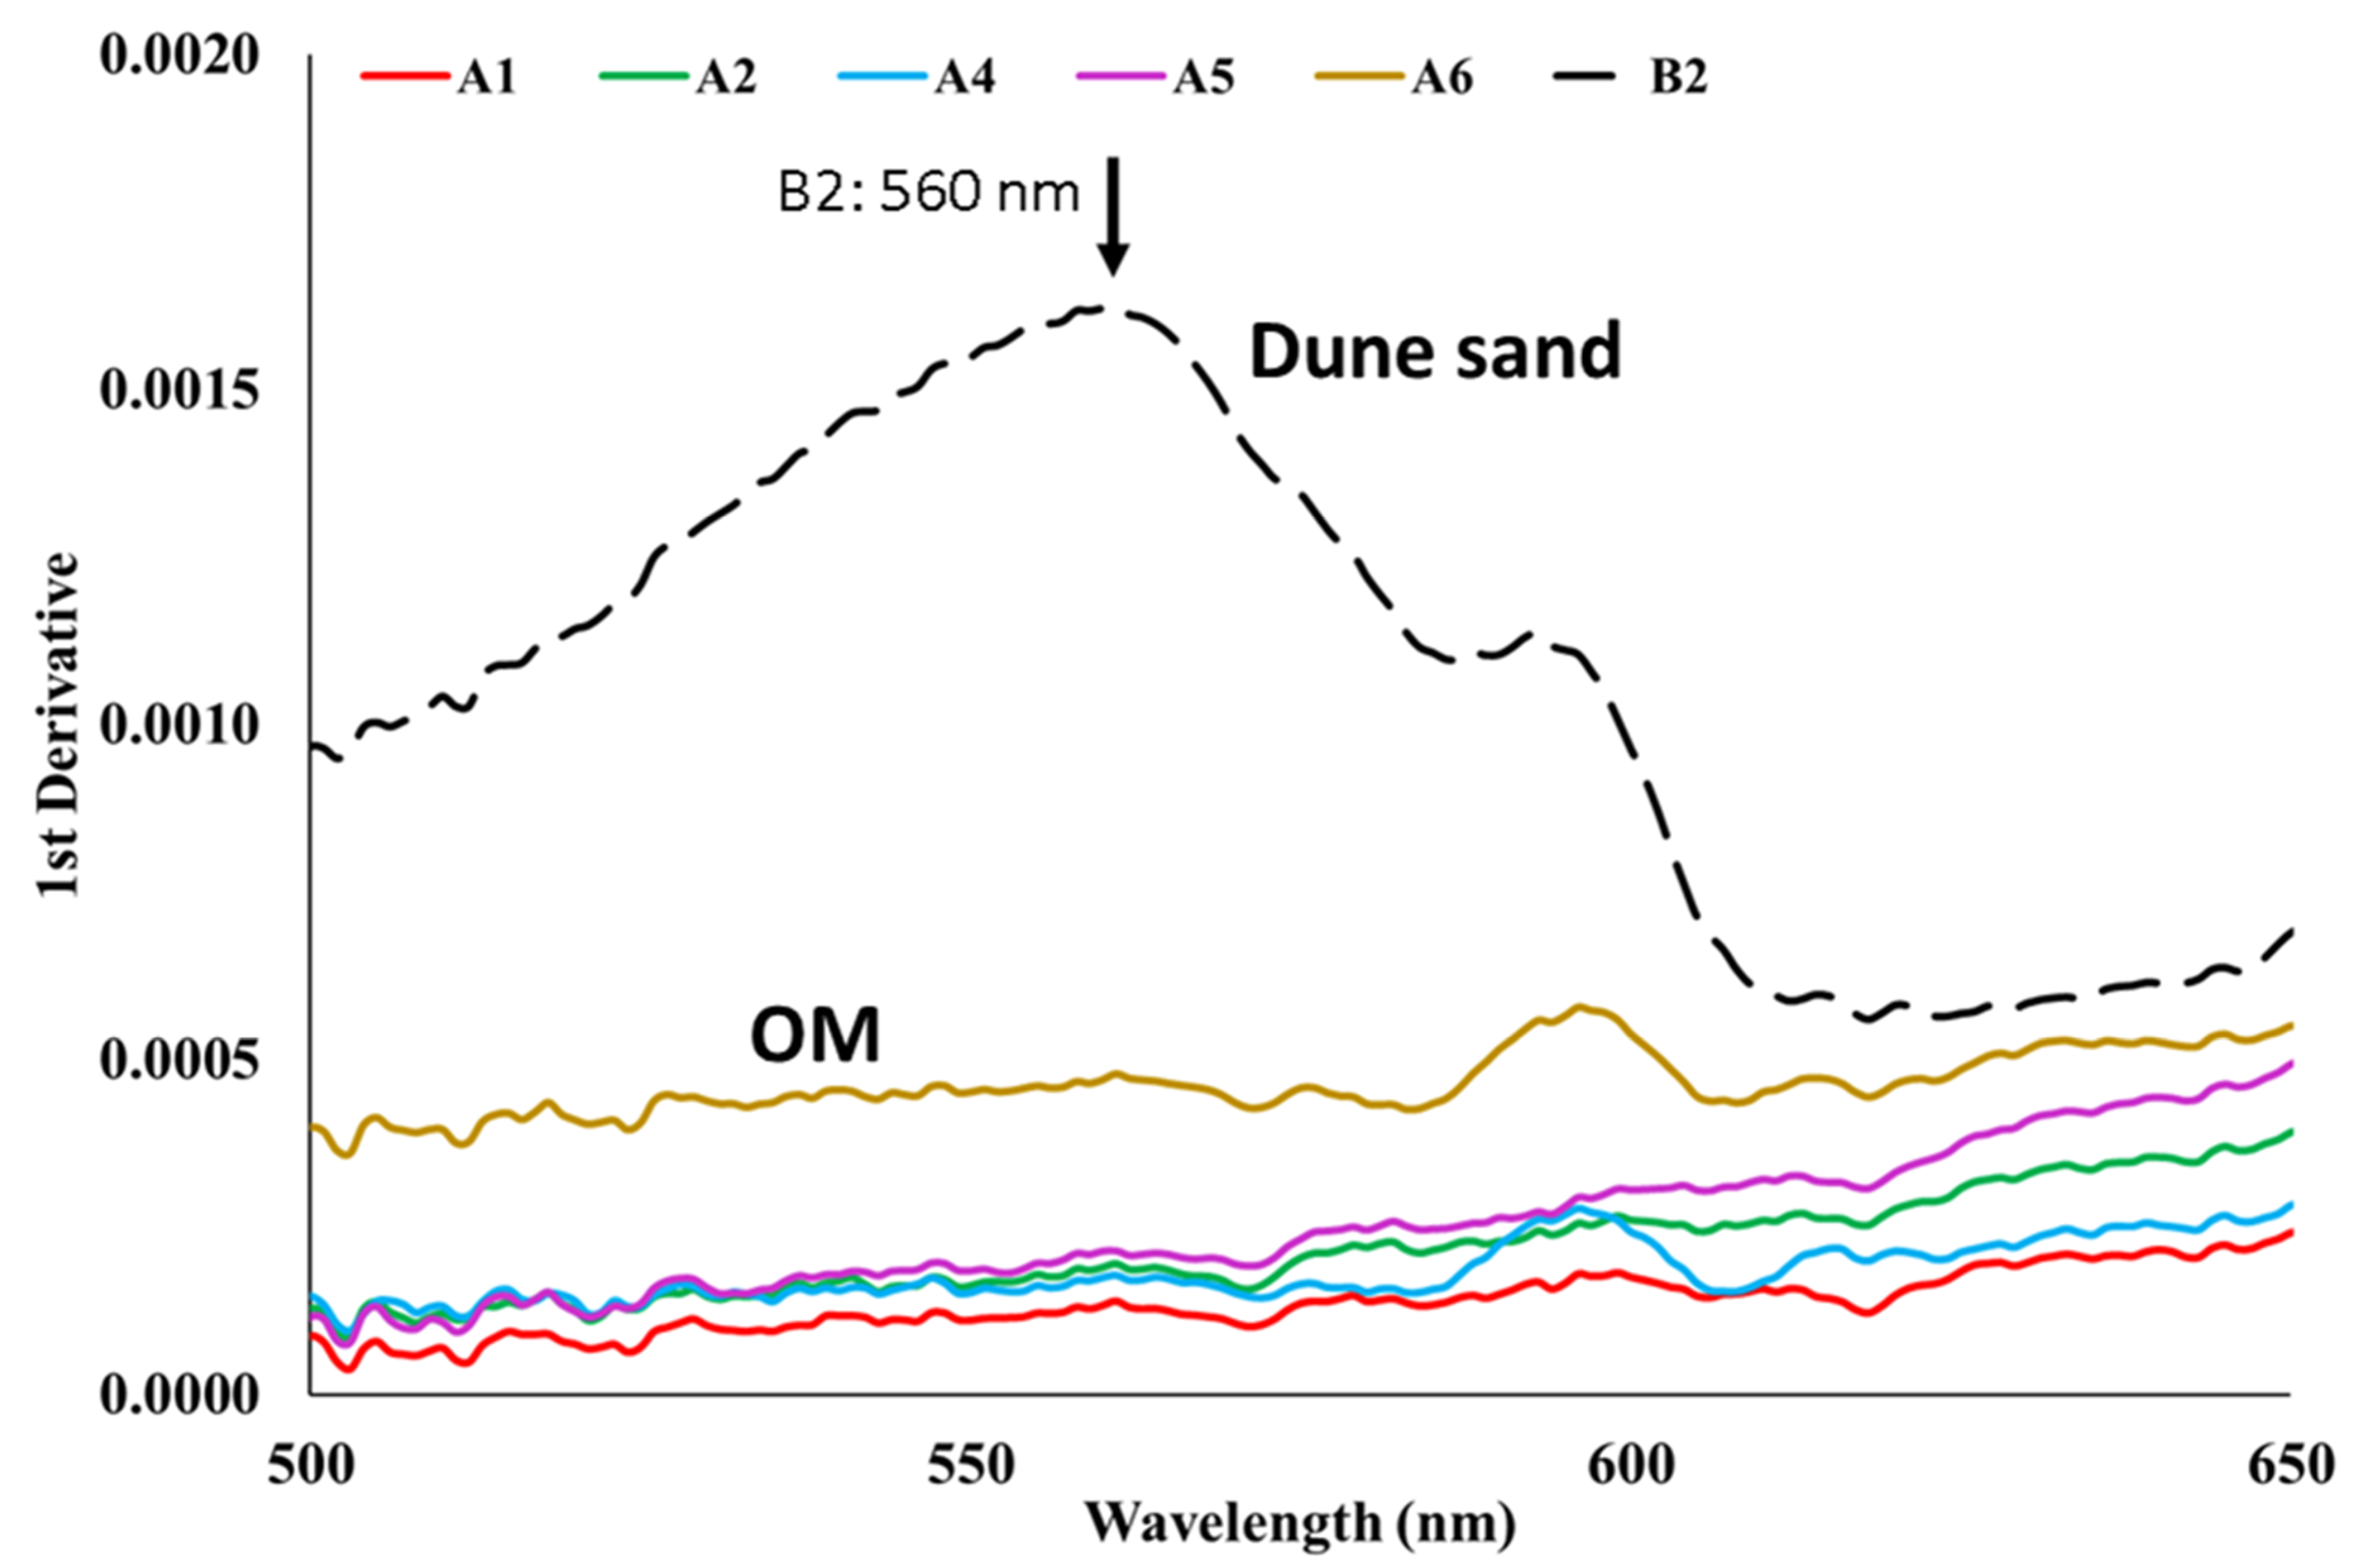
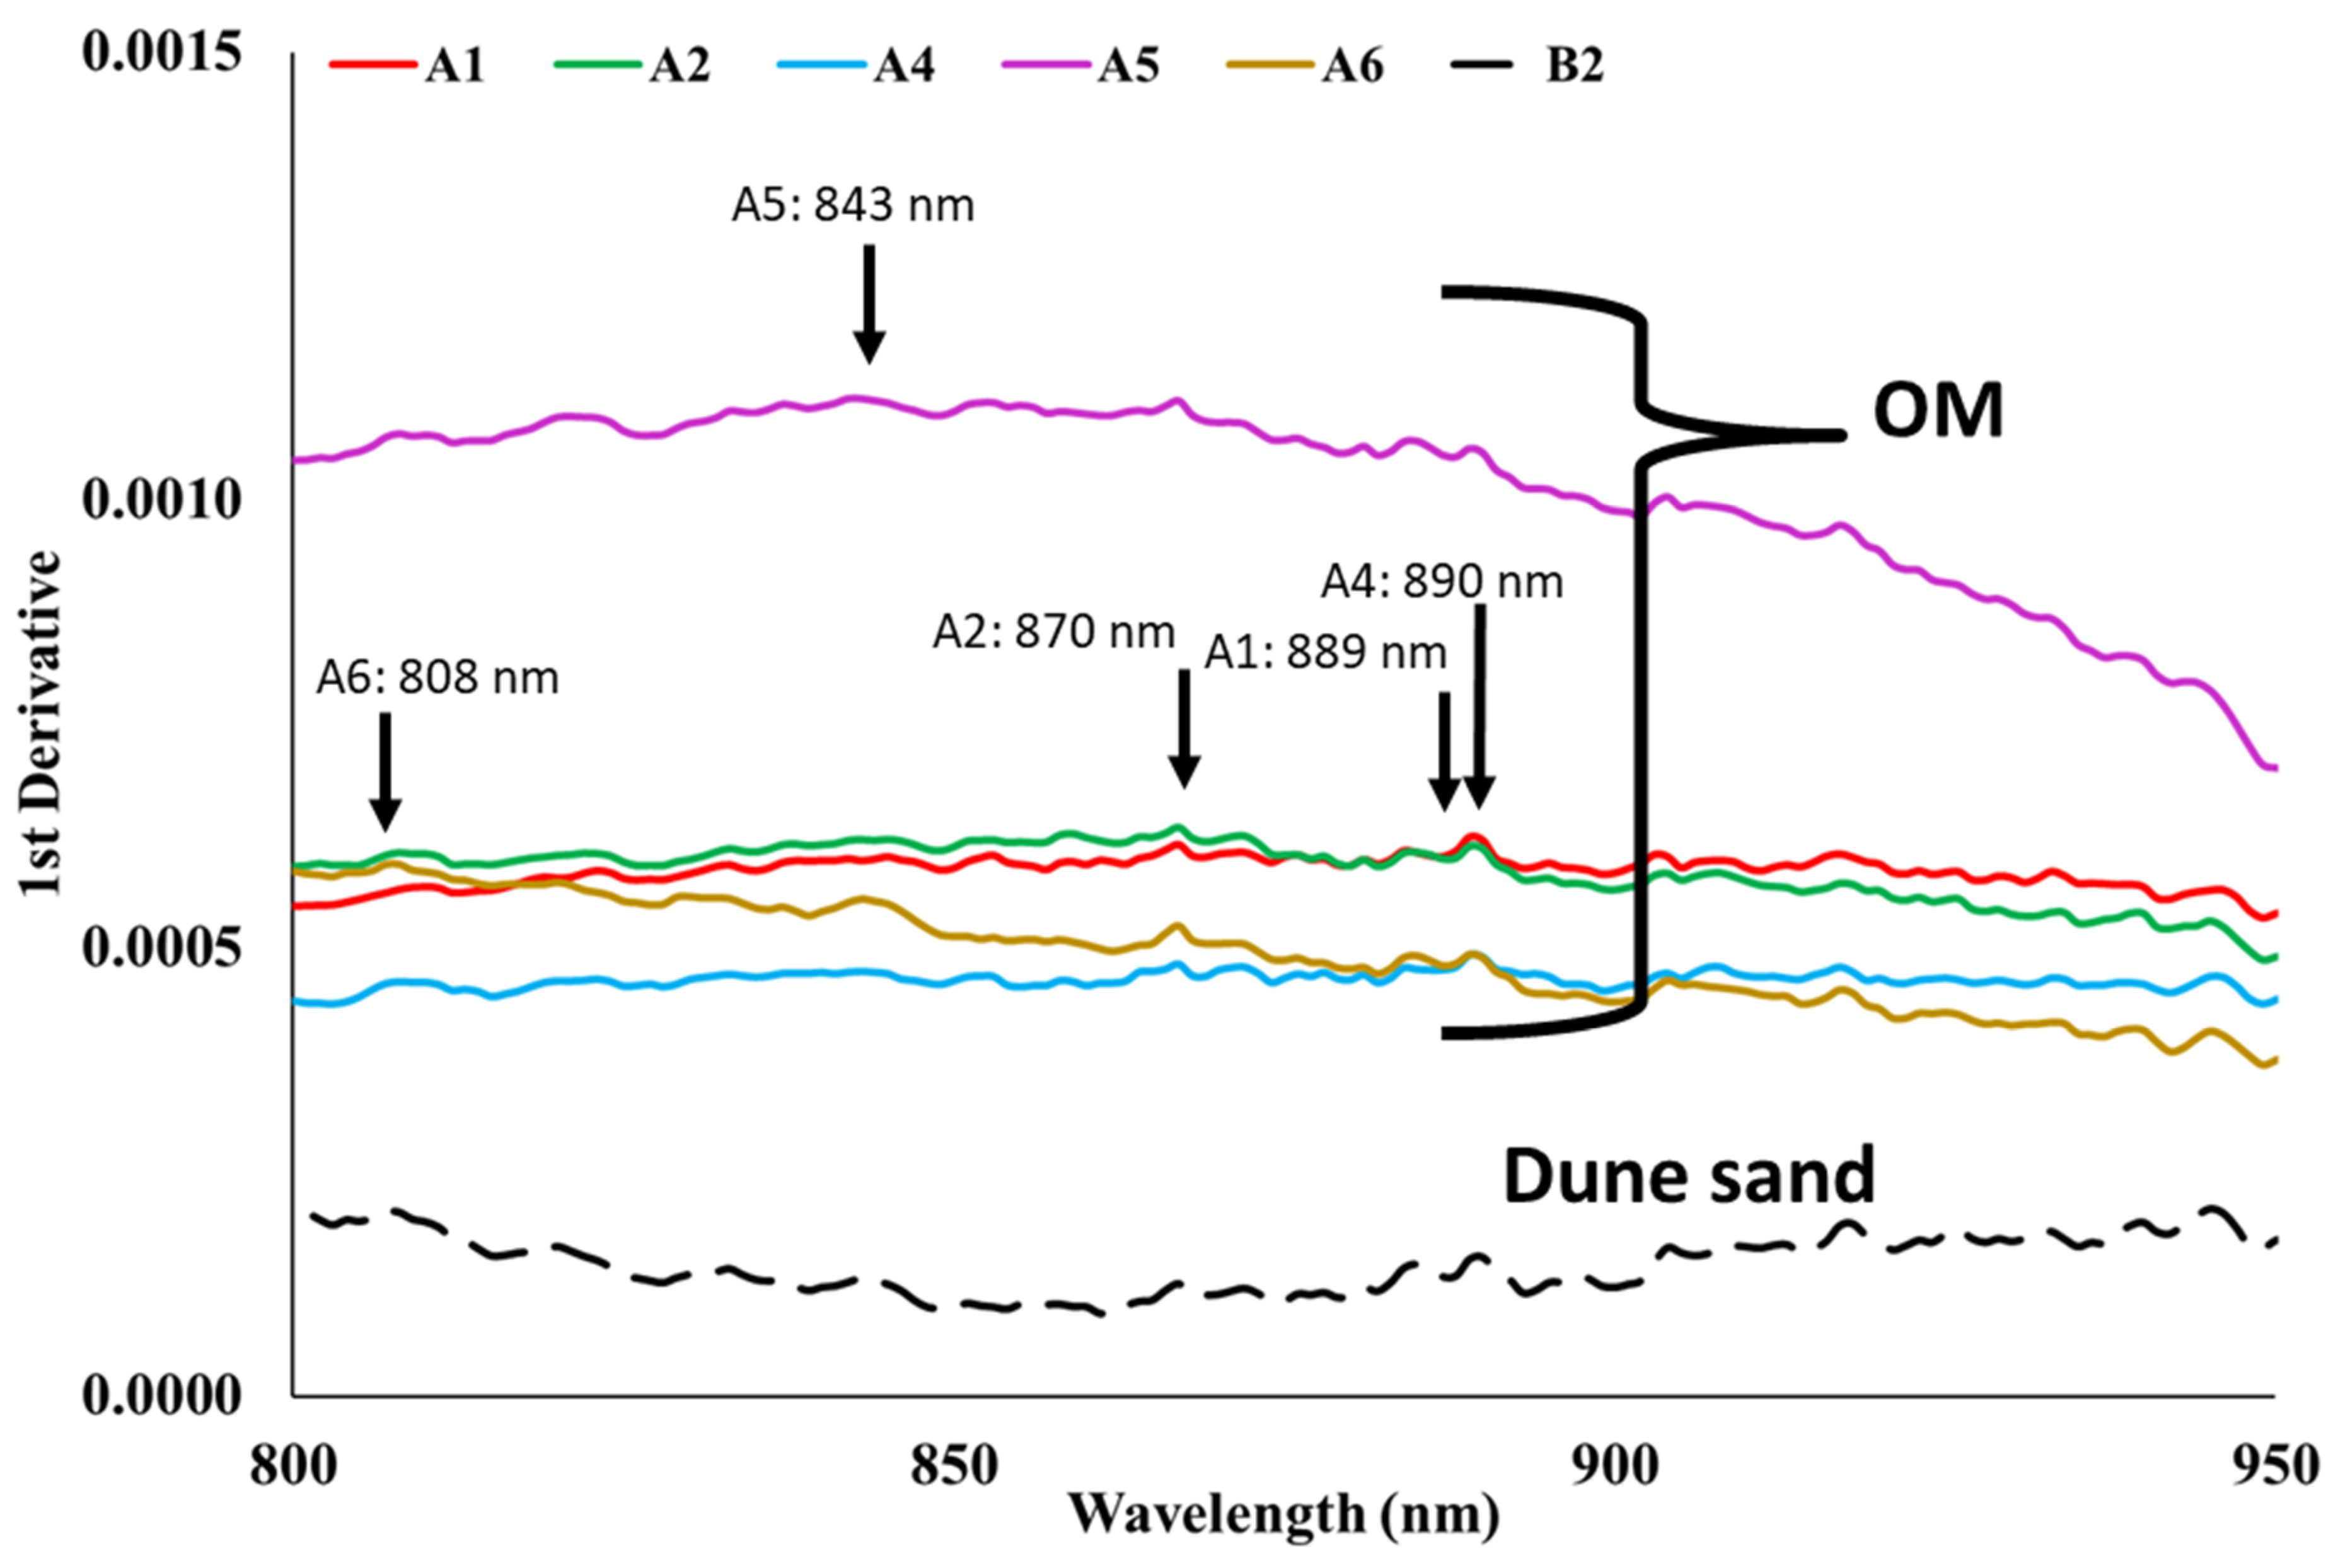
Figure 5 and
Figure 6 illustrate the SSDL calculation, showing the first-derivative spectra of the dune sand (B2) and of the different composts. In
Figure 5, which illustrates the 500–650 nm spectral range, the first-derivative spectrum of the dune sand (B2) is exceptionally high compared to the composts, whereas in the 800–950 nm spectral range (
Figure 6), the first-derivative spectrum of the dune sand (B2) is remarkably lower than the different sources of OM.
Figure 5 shows the SIW identified at 560 nm, and
Figure 6 shows the CIW determined for each of the composts. Although the chemical composition of the composts is diverse, all of their spectra share similar features in this latter range (800–950 nm) that contrast with those of the dune sand. Note that Ogen et al. [
23] recommended identifying the CIW in the 850–950 nm spectral range, but as seen in
Figure 6, the CIW can be identified below 850 nm.
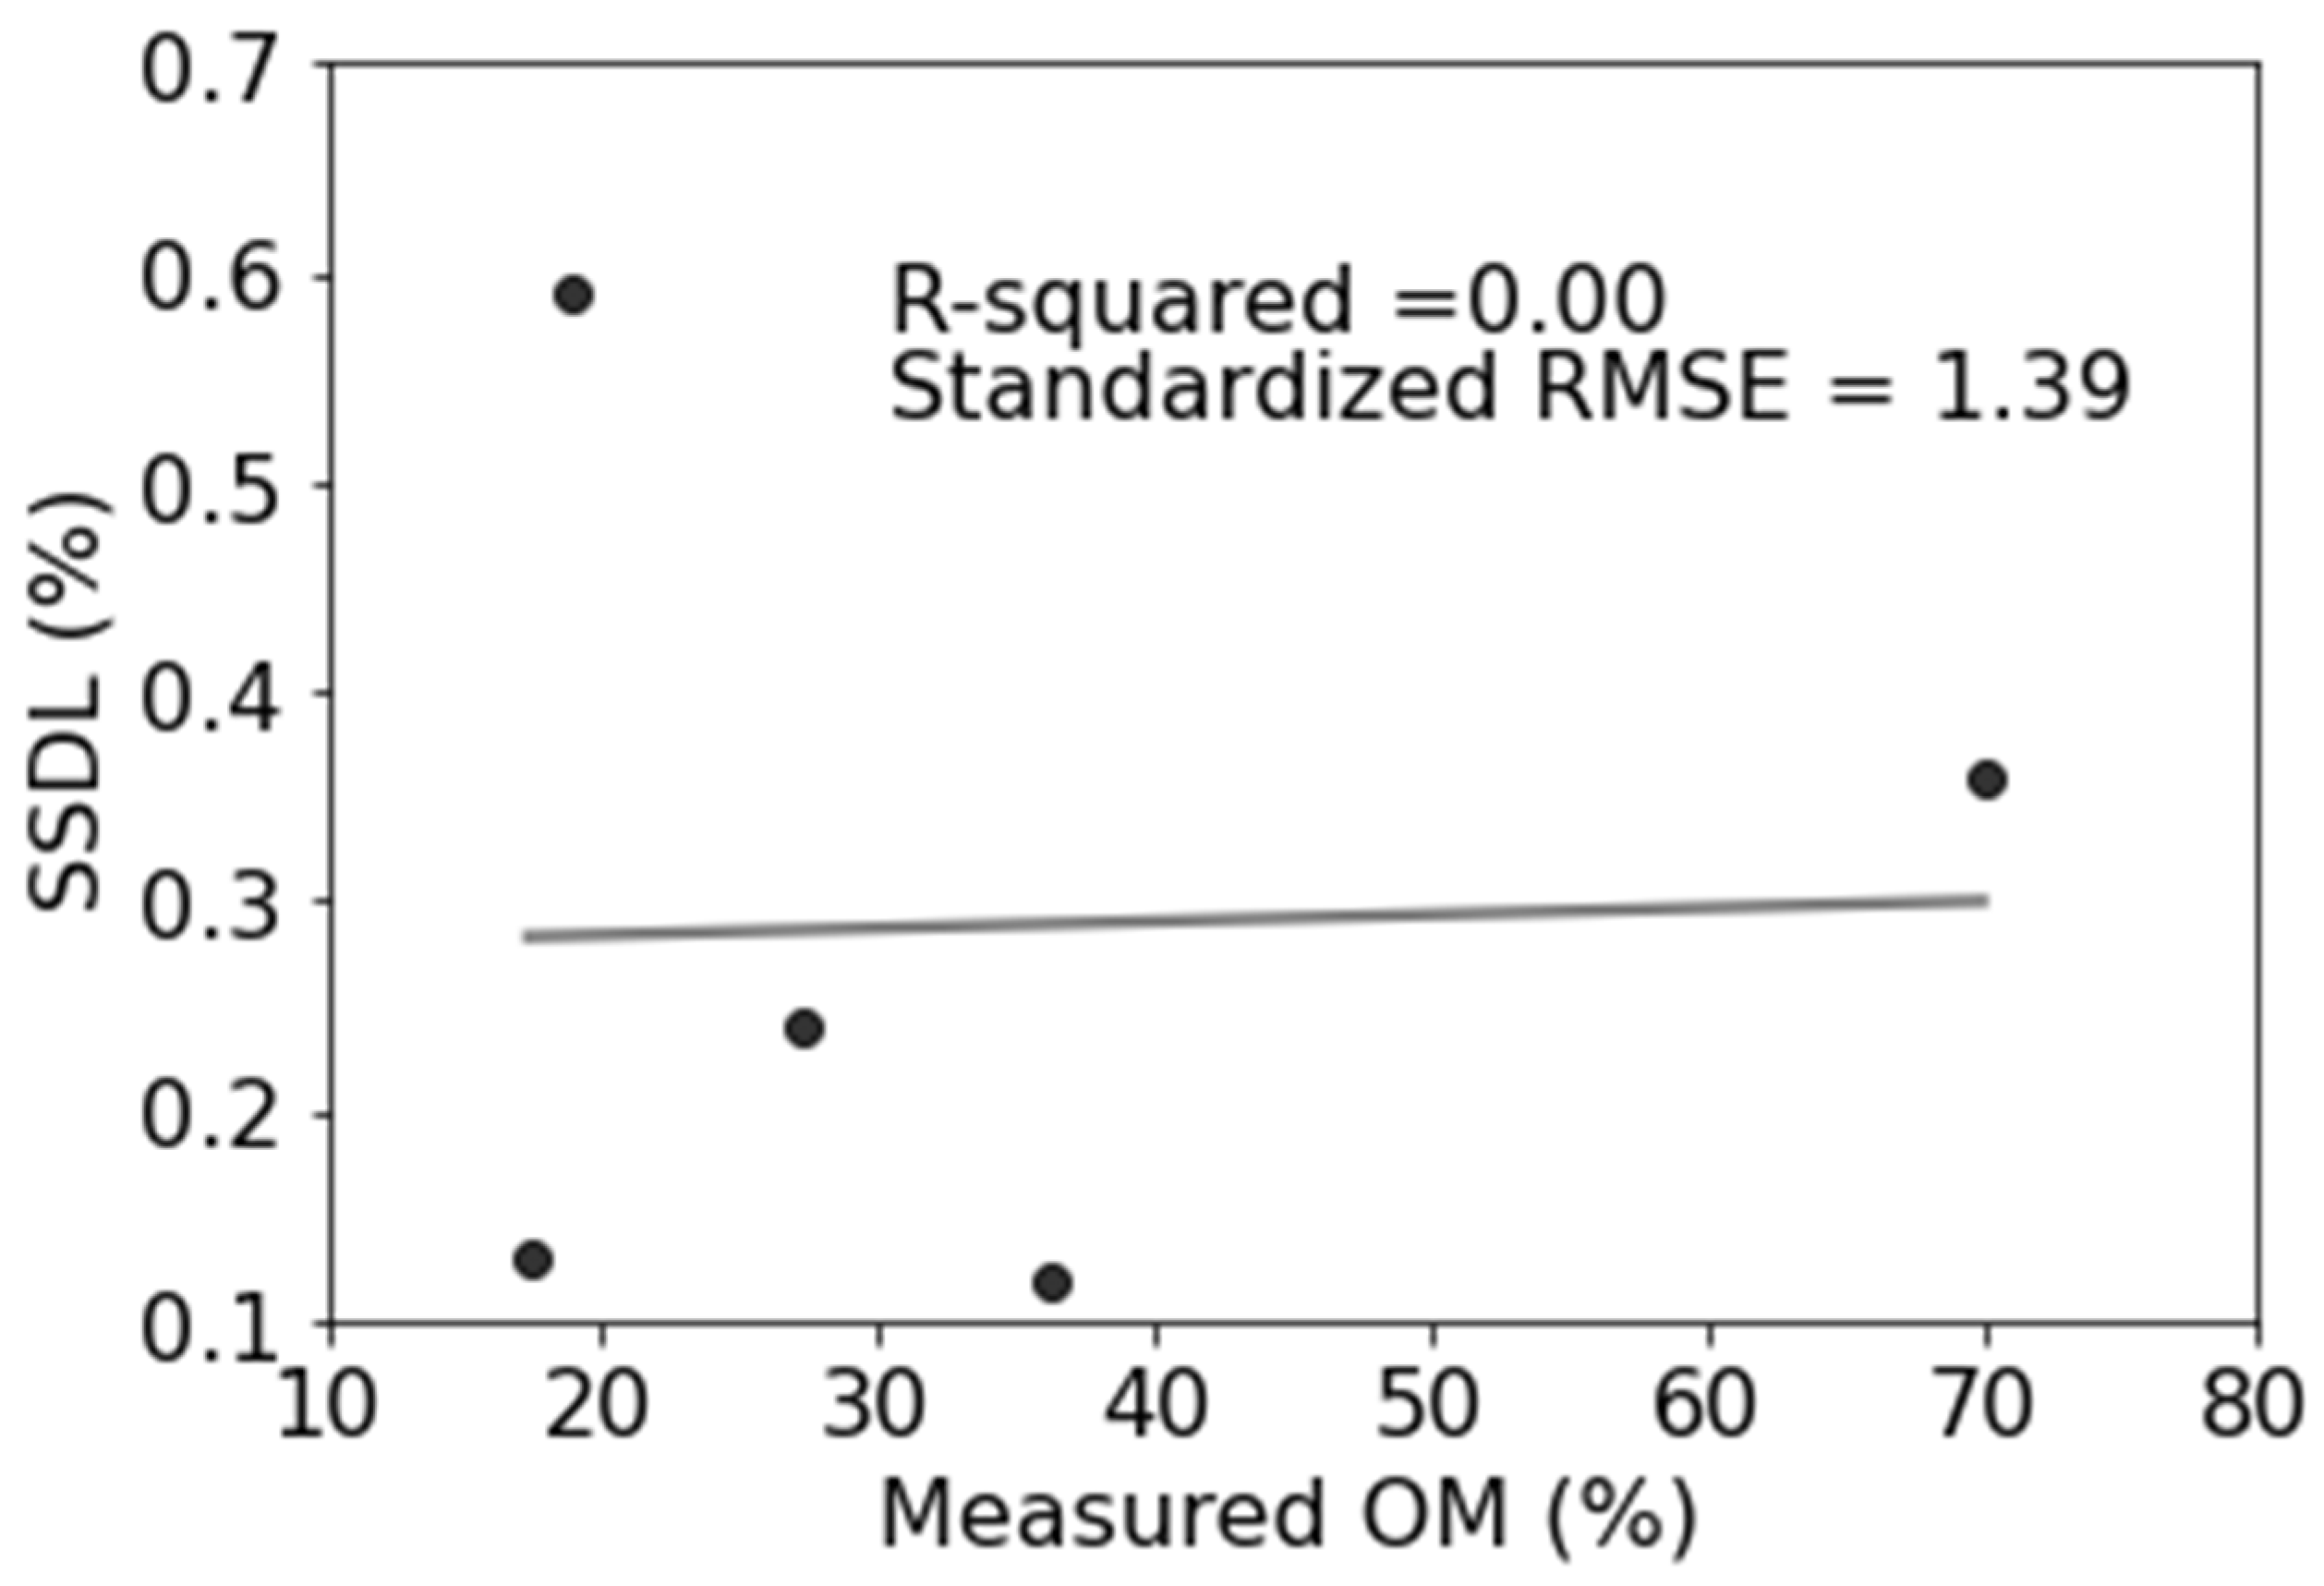
As seen in
Figure 7, the SSDL of the OM in the examined composts shows no correlation with their respective OM contents (R
2 = 0). This is probably because the SSDL is not affected by the OM content in the composts but, rather, by both the OM and the mineral residual composition (see
Table 1).
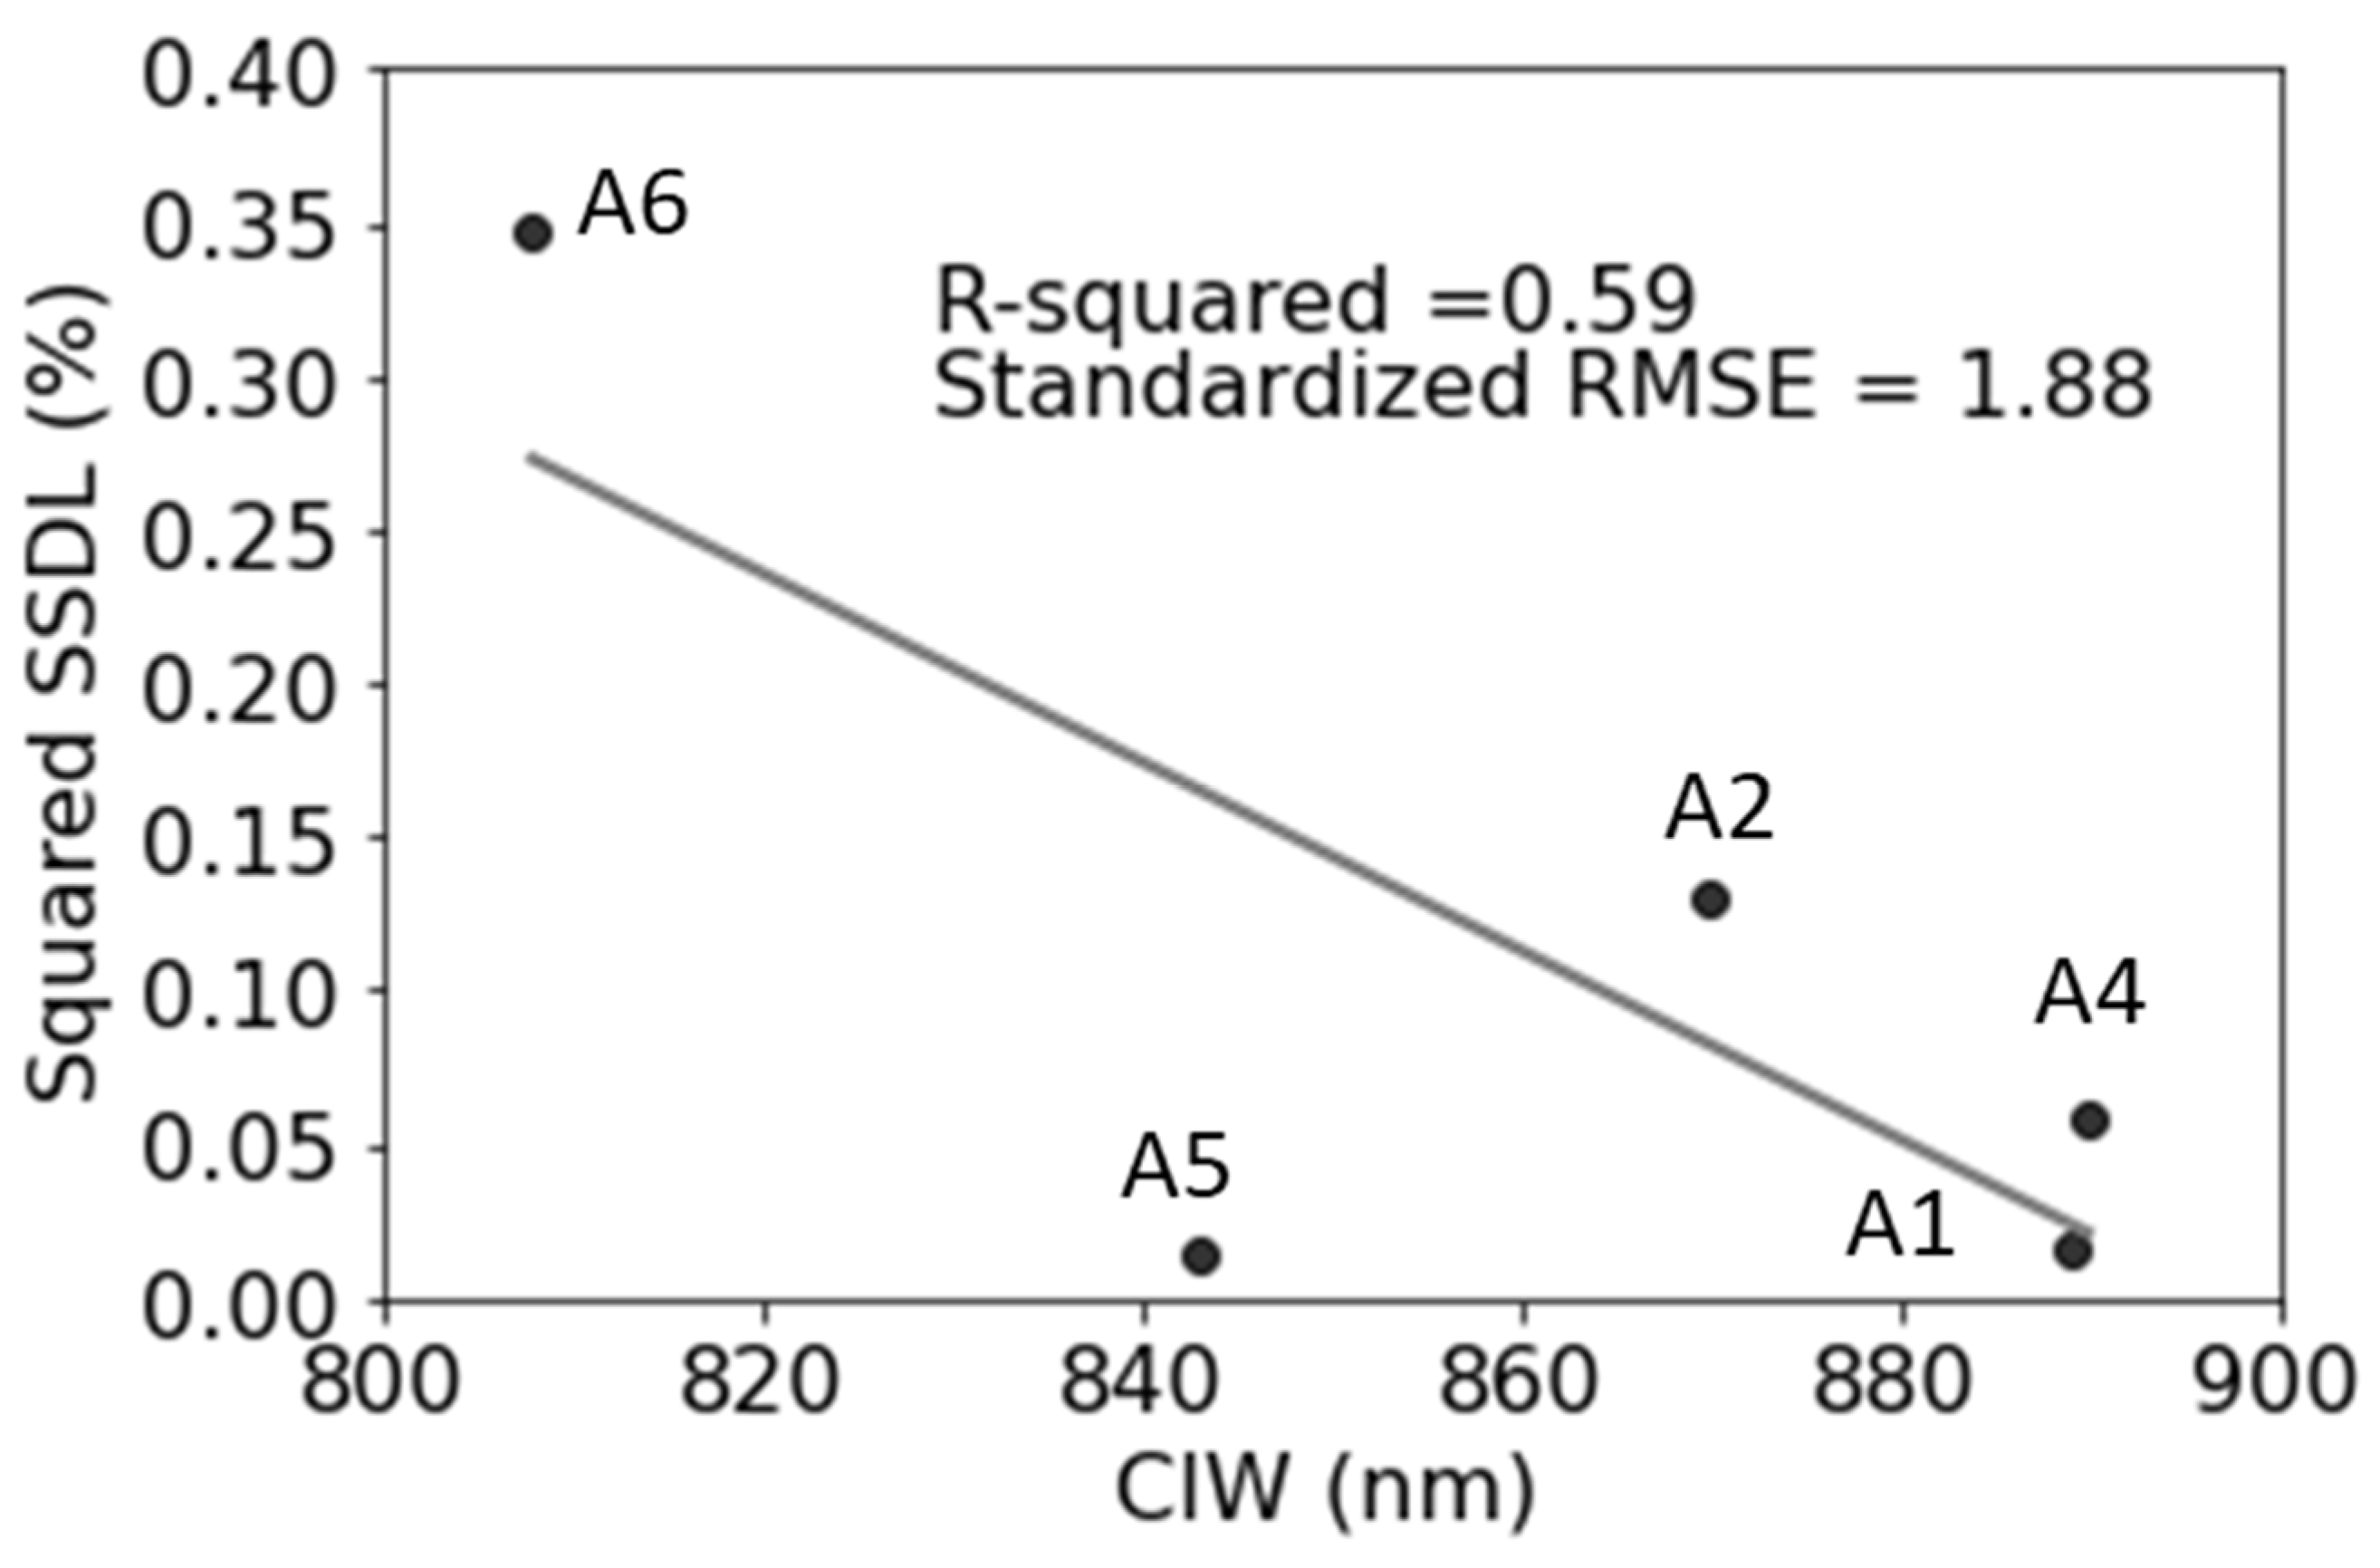
Figure 8 shows to what extent the identified CIW can determine the squared SSDL. Although this analysis was carried out using only five composts and it is therefore not possible to draw any conclusions that might be relevant for all existing sources of OM, there is a marked trend between these variables (R
2 = 0.59). This might lead to the understanding that the quantitative detection of OM content is not only manifested by all of the VIS–NIR reflectance value bands but can also be determined by the extent of the OM slope. As the CIW is identified at longer wavelengths, the OM content may be detected in lower amounts.
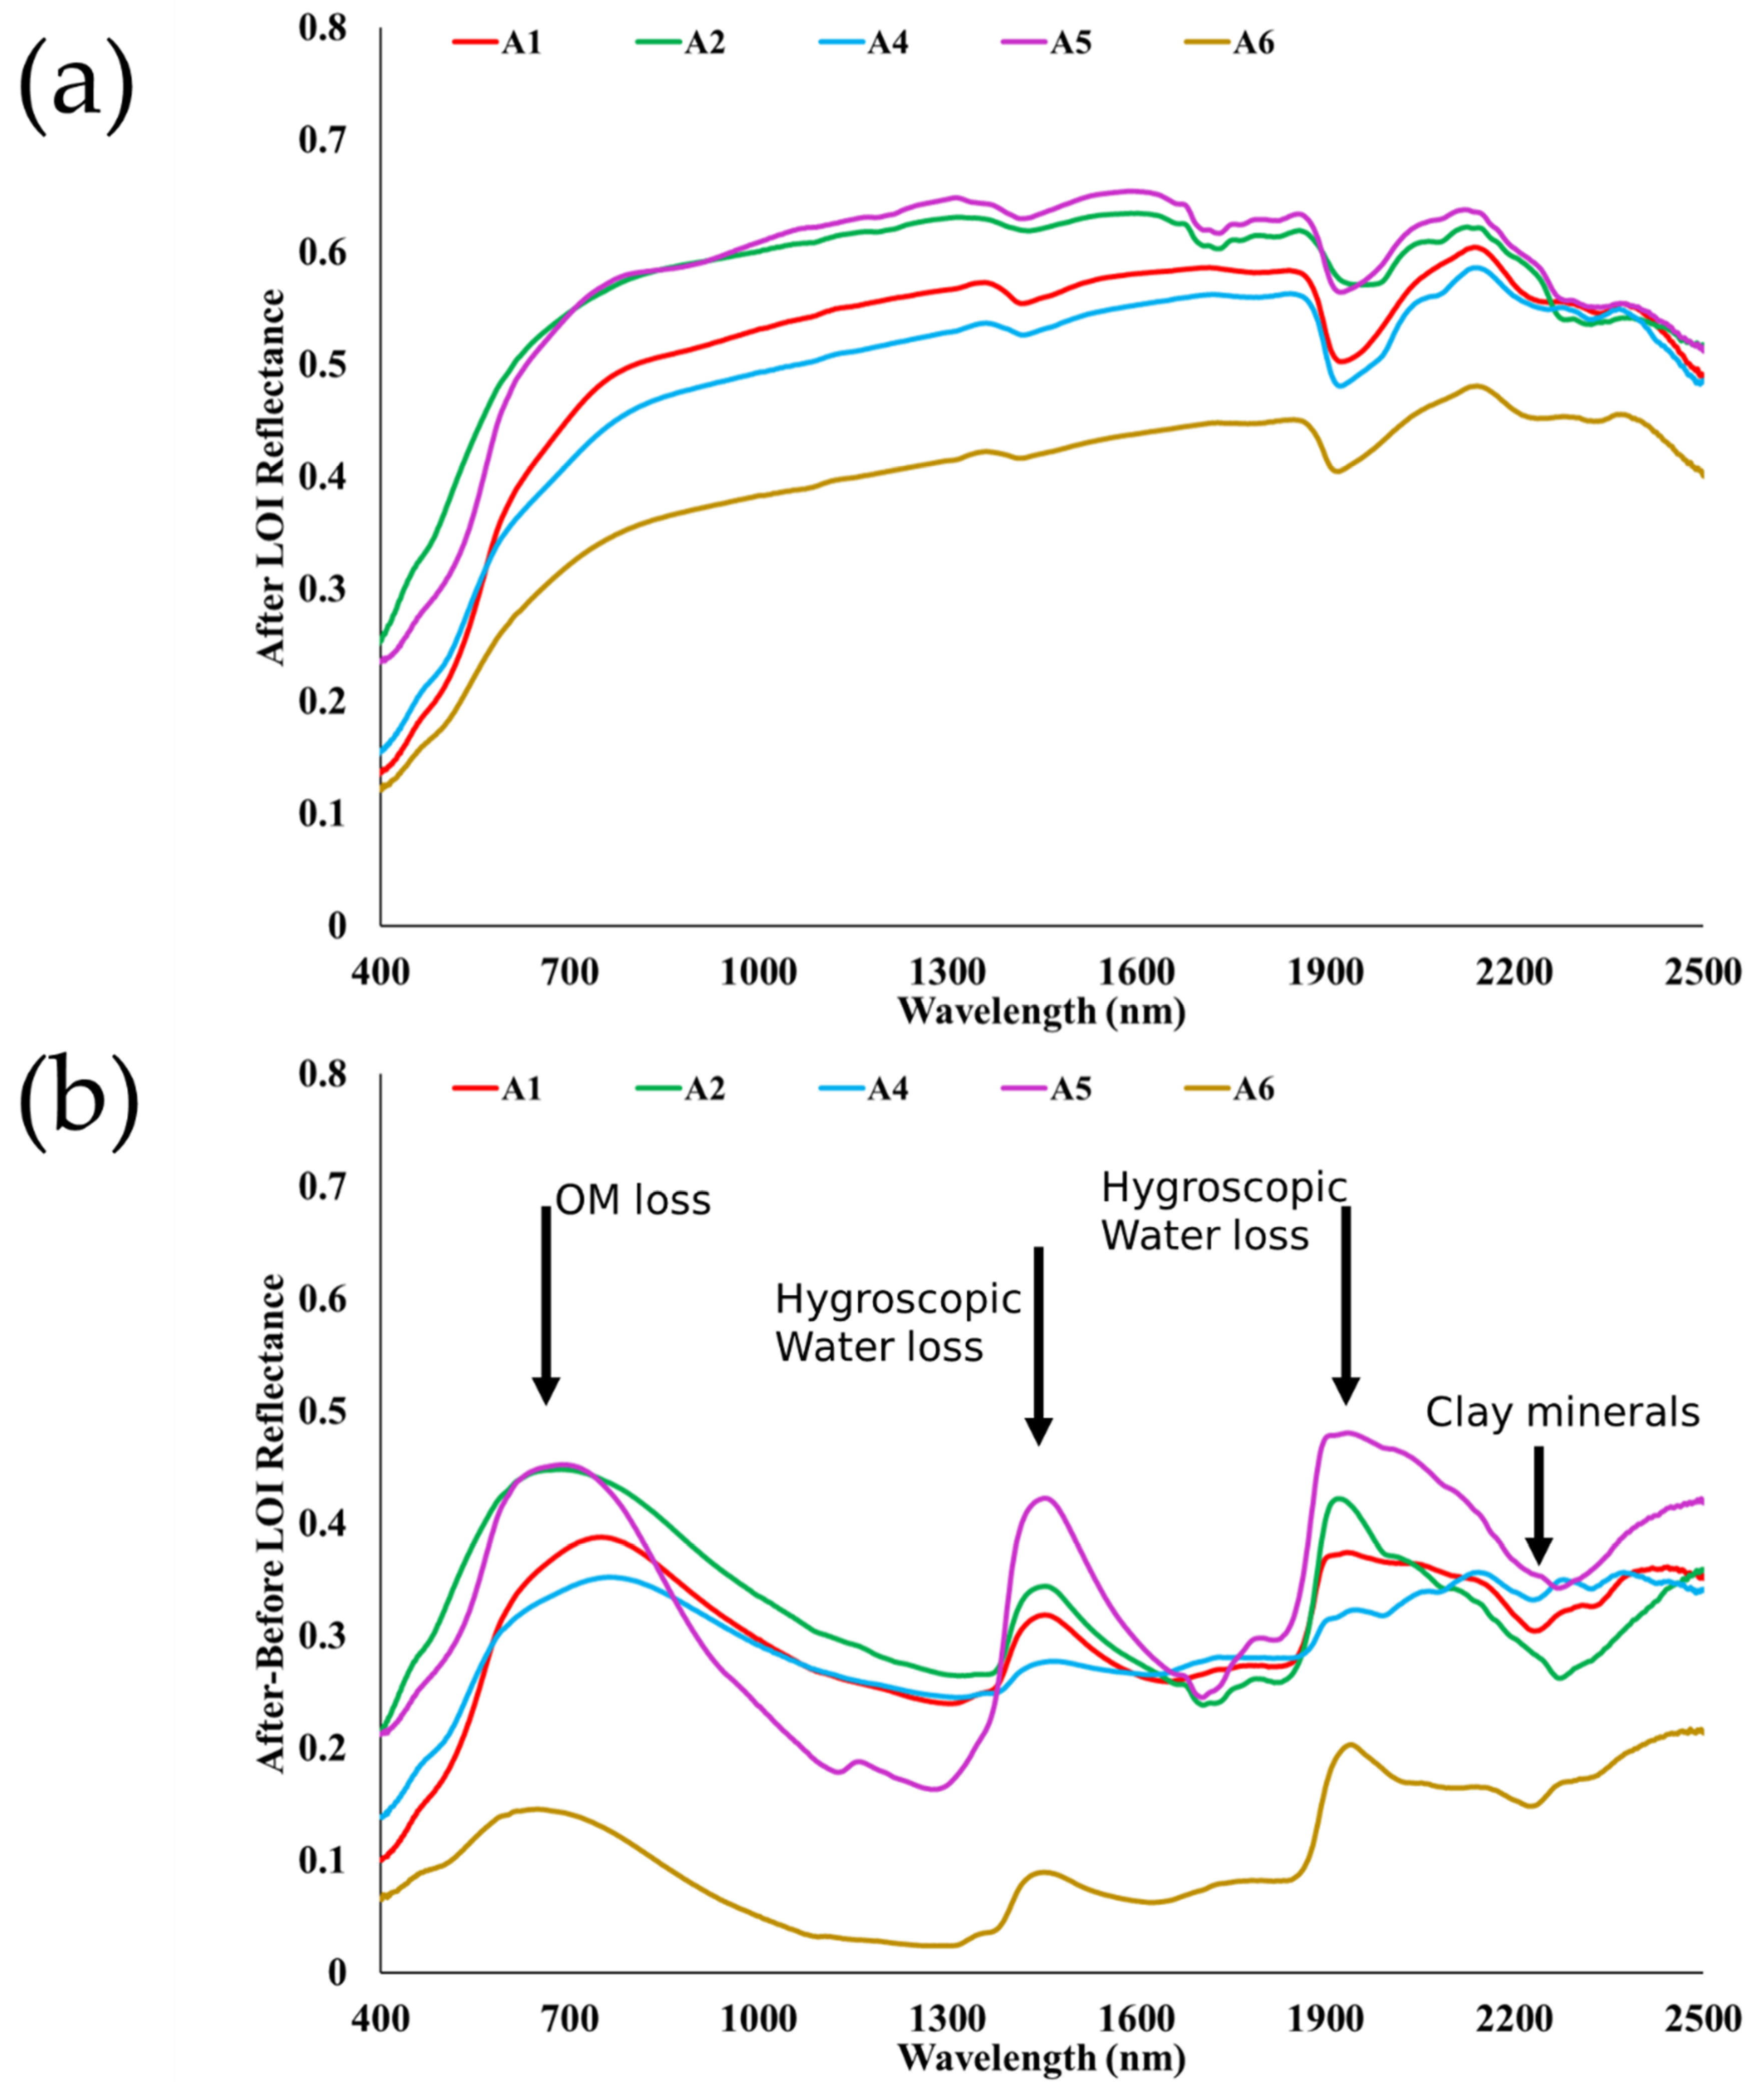
To prove that the spectral-based detection of SOM can be biased not only by the organic composition but also by the residual minerals in the compost, we extracted the compost spectra after the LOI procedure, representing the mineral portion in each compost (
Figure 9a). Extracting the mineral fraction from the organic soil (
Figure 9b) yielded the spectral signal of OM (at around 650 mm) and hygroscopic moisture loss (at around 1400 and 1900 nm), as well as enhancement of the clay mineral features (around 2200 mm) due to the removal of the masking volatile component by the heating. As seen, both the mineral part and the organic part of the composts (representing organic soils) varied.
Accordingly, both CIW (representing the organic part of the compost) and SIW (representing the mineral (residual) part of the compost) are varied and cannot maintain stable SSDL values in any of the cases.
As dune sand is considered a mineral soil, for the sand–OM mixtures used in this study, the SSDL might be considered a reasonable parameter because the influence of the mineral component of the OM sources may be negligible in the spectral-based detection.
As seen in
Table 2, the spectral signatures of the analyzed composts after the LOI method present SAM values ranging from 0.13 to 0.2. Note that the endmember was a featureless spectrum in which the reflectance value at every wavelength was 1 (see
Section 2.2). These results again indicate that the spectra of varied sources of OM are also affected by their mineralogy, because the OM influence is annulled through the LOI method. Nevertheless, the SAM values of the composts before the LOI method also varied, ranging from 0.31 to 0.51 (also shown in
Table 2).
These observations may explain why we obtained a varied range of SSDL values (from 0.13 to 0.59), as well as why the CIW was identified at different wavelengths in all of the examined composts.
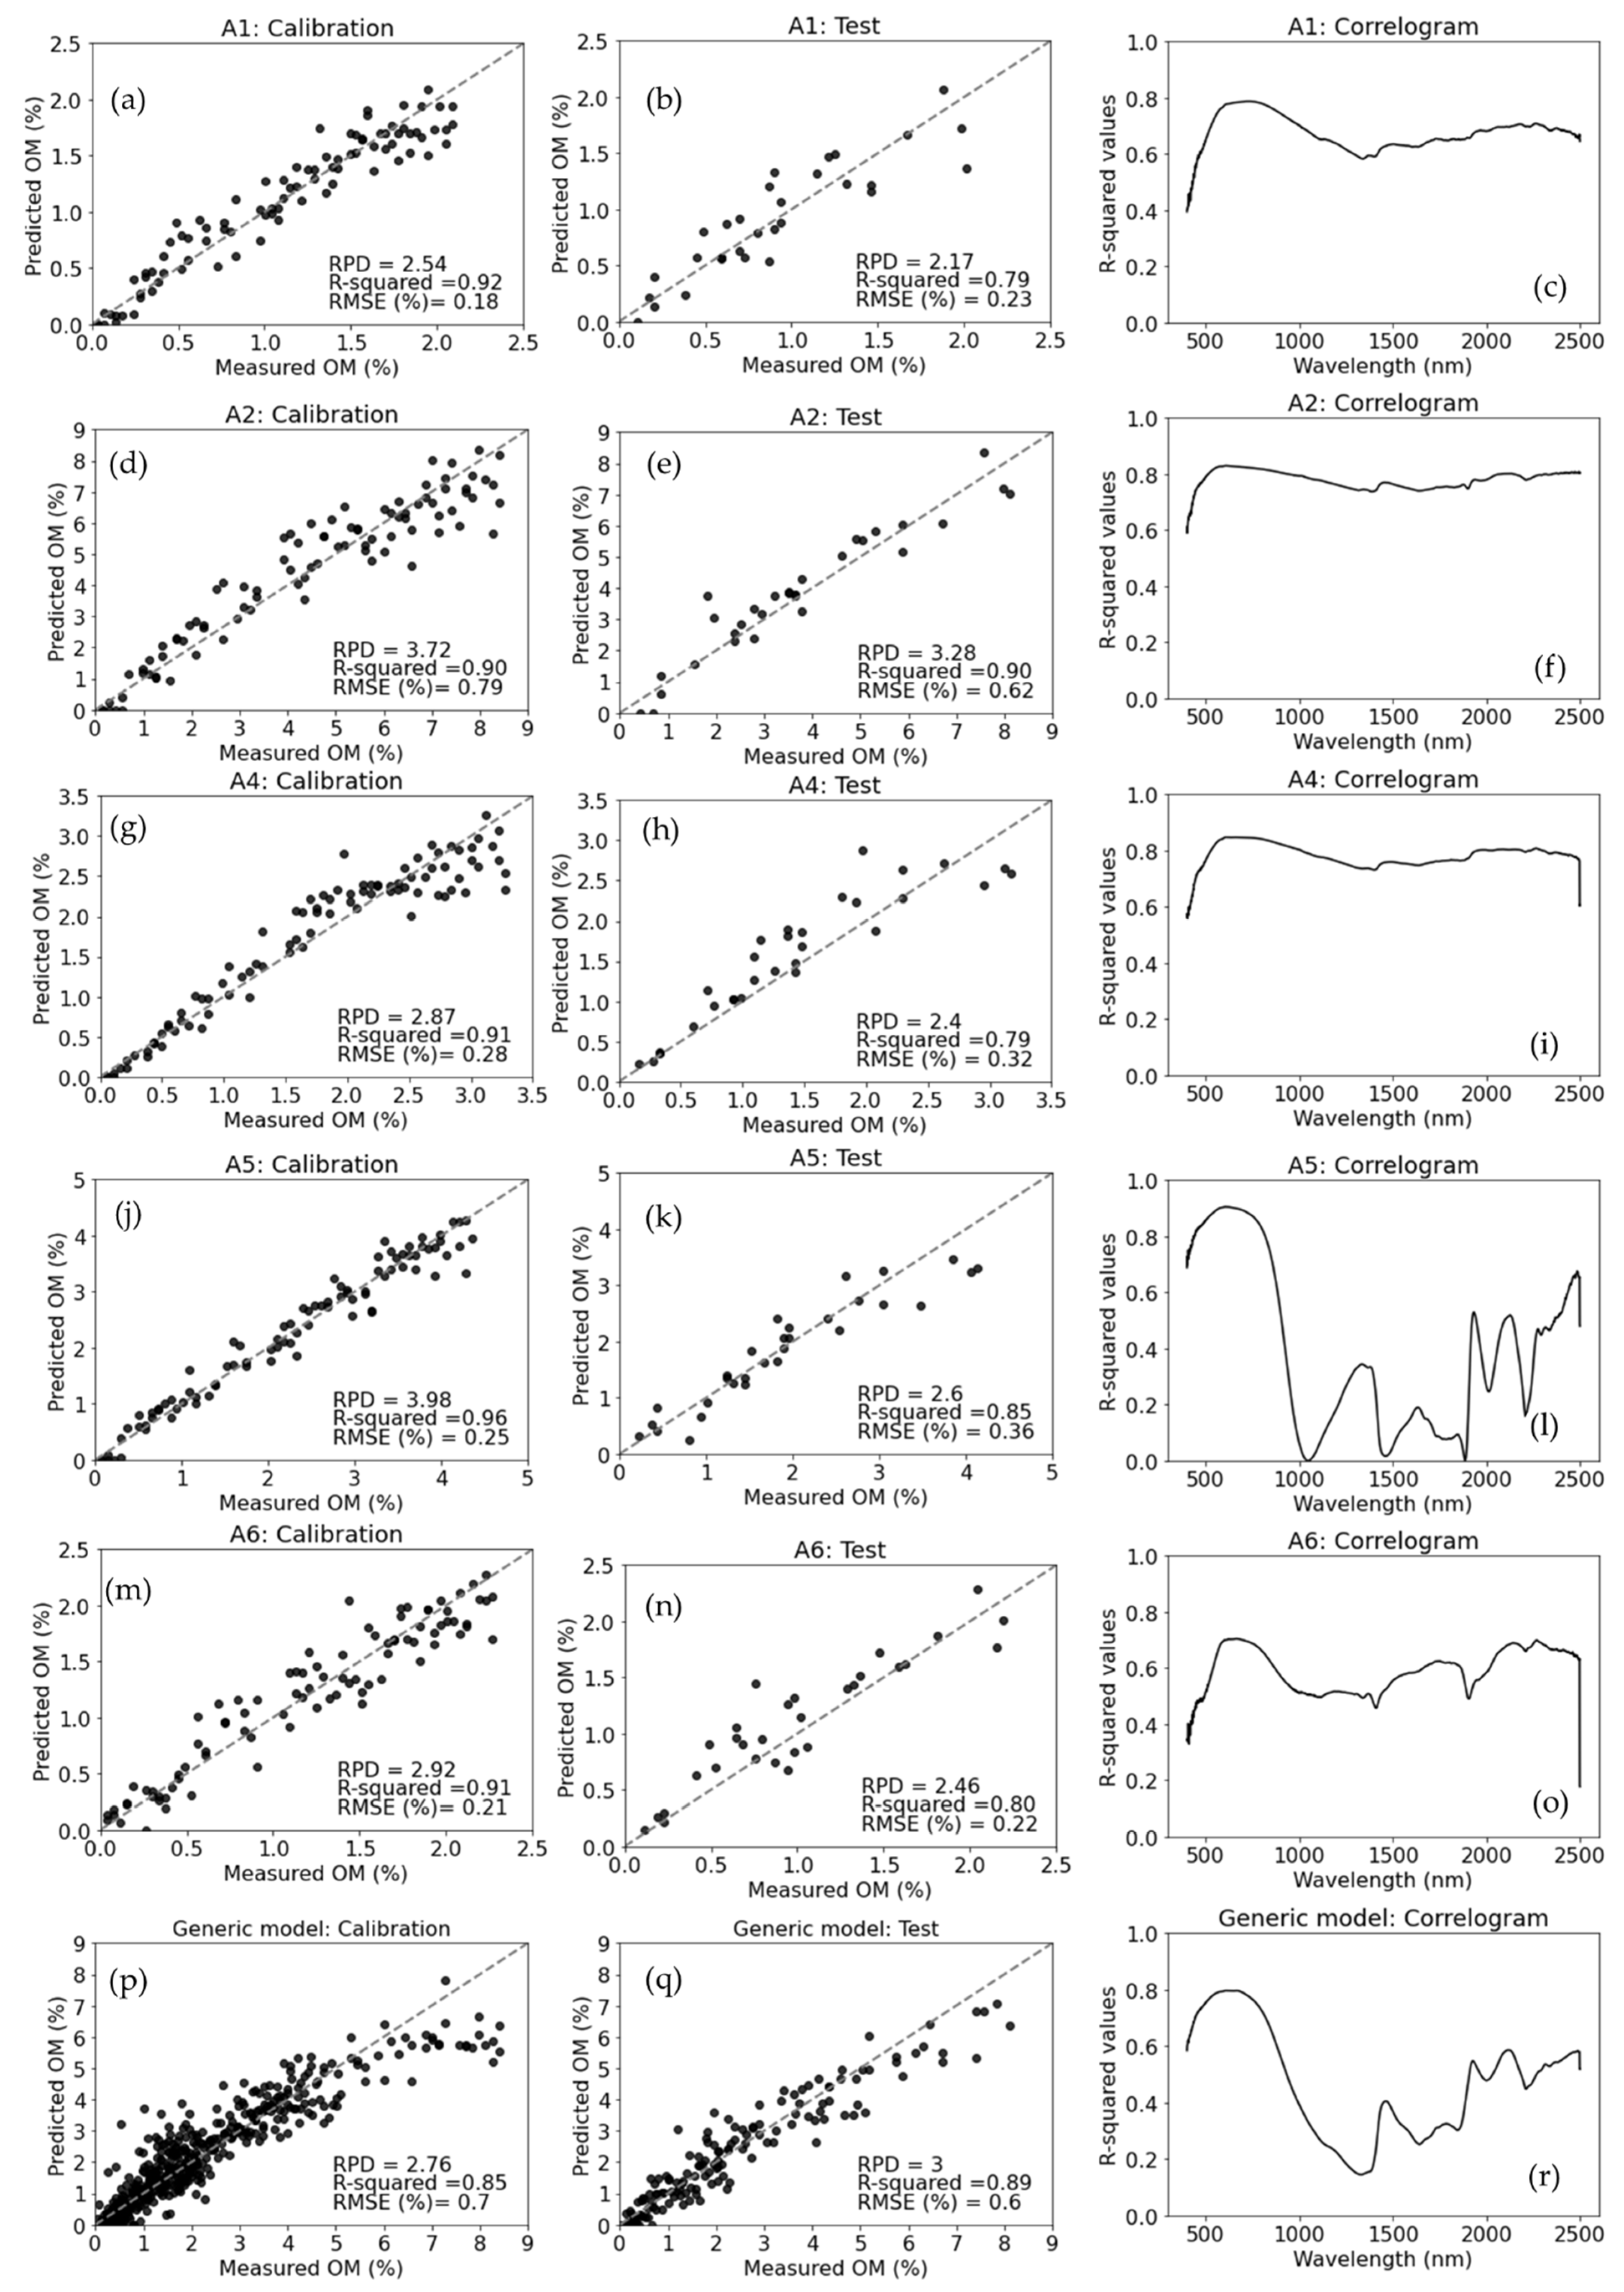
3.3. PLSR Models
We executed PLSR spectral-based models between the spectra and the OM content as calculated for each sand–OM mixture (soil analogue). This was carried out for every compost group as well as for the merged (all sand–OM mixtures) group. The statistical parameters of all of the models are presented in
Table 3, and the performances of the spectral-based models with their correlograms are presented in
Figure 10. The correlogram is a chart that presents the R
2 between a property of interest (OM content in this case) and every wavelength. As shown in
Figure 10, the correlative spectral properties presented by the correlograms are varied, but all of them have their highest values across the VIS–NIR range and tend to decrease at wavelengths neighboring the water absorptions at 1400 and 1900 nm.
Spectral-based predictions of SOM are mostly reported from the VIS–NIR region [
37,
38] and can also be well observed in the compost spectra. The generic model (consisting of all compost mixture groups) was developed using all of the artificially prepared samples after removing outliers (589 out of 610 sand–OM mixtures).
The results of this analysis show that the higher the variation in OM sources, the lower the predictive capacity of the models. All of the spectral-based models presented excellent RPD values (over 2), including the generic one. Nevertheless, it should be noted that the generic model showed the second highest RMSE (0.6), after compost A6 (RMSE = 0.62). This indicates that there are some cases in which the estimation of OM could be lower than in the generic approach and the latter is probably affected by the OM species that do not have fair performance in the spectral analysis. Compost A6 consisted of pure worm humus (
Table 1) and thus represented an OM source that is drifting away from the spectral model accuracy. However, the mineralogical residual of compost A6 also presented a spectral response that differed from that of the other composts (
Figure 9a). Therefore, the non-organic composition of the OM sources may contribute to biases in the spectral-based assessment of the OM content adopting a generic approach.
Another problem with the generic model is that among 610 samples, 21 were identified as outliers and accordingly removed from the analysis. Thus, the generic model had to ignore 3.44% of the dataset, which is relatively more samples than all of the other models. The models that were created for composts A1, A2, and A4 ignored only two samples (1.63% of the samples), and the models created for A5 and A6 ignored three samples (2.46%). Still, the performance of the generic model at the validation stage was fairly good (R2 = 0.89, RMSE = 0.6, RPD = 3) and appeared to present no problems.
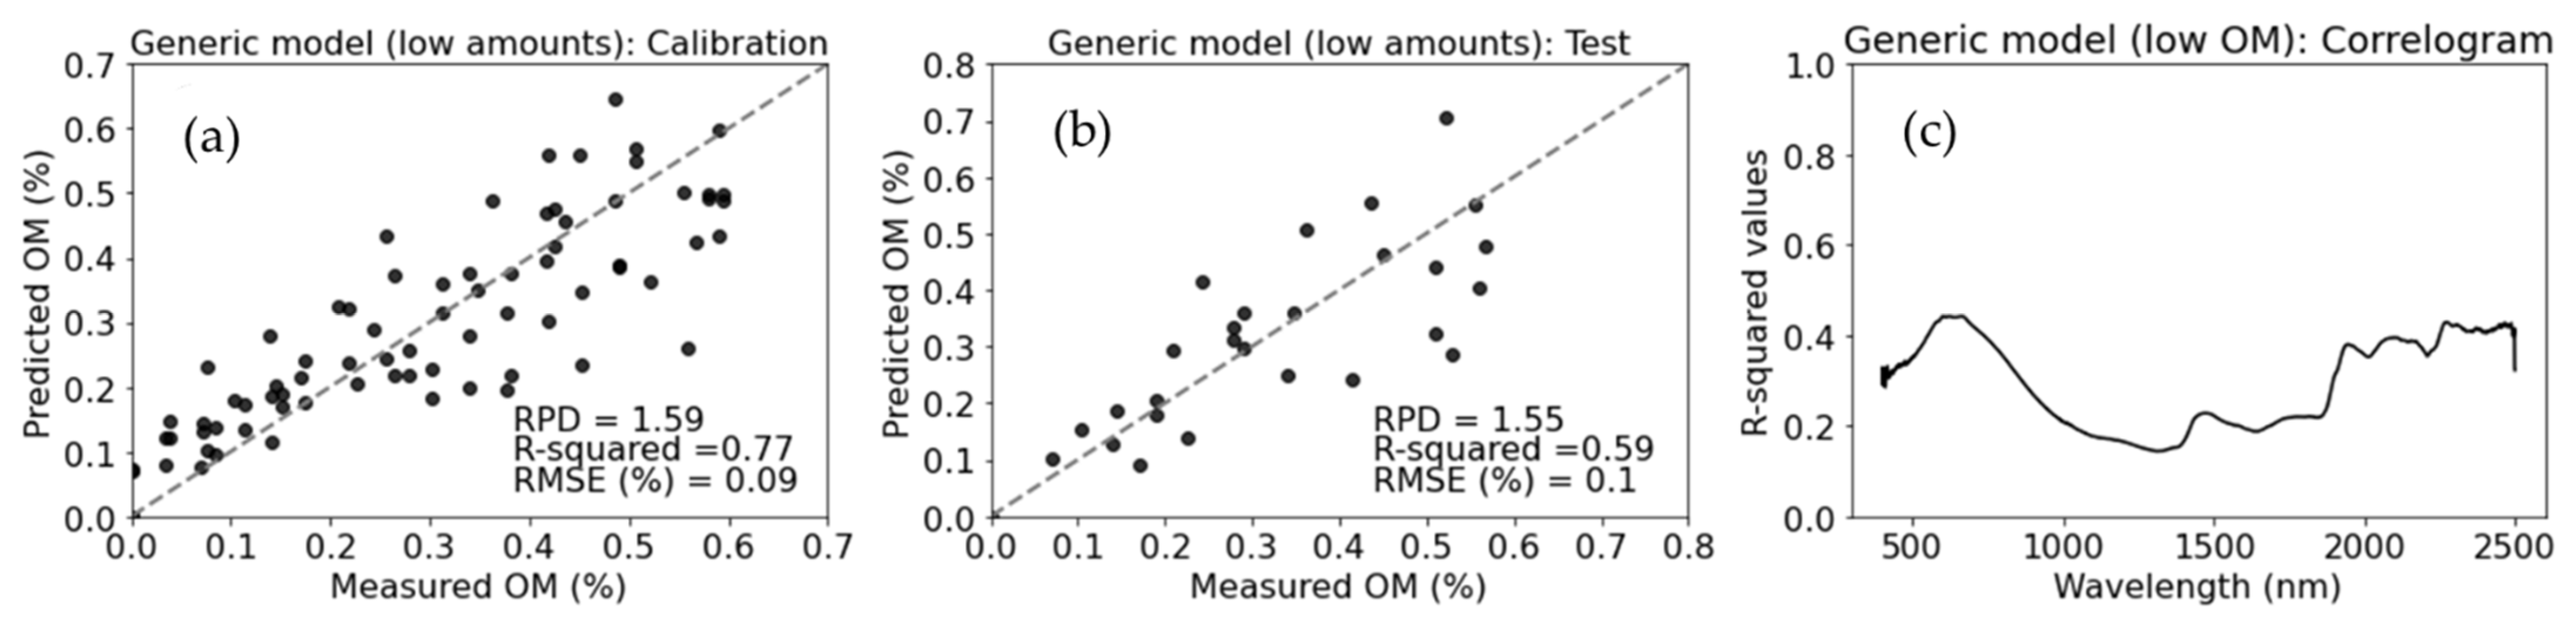
The highest SSDL found in this study was 0.59, in compost A6. Thus, a new generic model was developed that considered only the samples with measured OM content below 0.6 (rounding 0.59) in order to focus on this problematic range (see
Figure 11 and
Table 4). In this case, the performance of the generic model decreased considerably in the validation stage (from R
2 = 0.89 to R
2 = 0.59 and from RPD = 3 to RPD = 1.55). These results coincide with the conclusions that emerged from the SSDL analysis, again suggesting that low amounts of SOM are difficult to quantify (or detect) by the generic approach.
Then, a full LOOCV analysis was conducted on all of the spectral-based models. In this stage, despite the fact that all of the models presented very high accuracies, the generic model that contained all the samples presented the lowest performances (R
2 = 0.85; RMSE = 0.73) when compared with all of the individual composts. Nevertheless, the performance of the generic model that used samples with low OM content (<0.6%) decreased considerably (R
2 = 0.68; RMSE = 0.11) in relation to the generic model that used all of the sand–OM samples. The results of the LOOCV analysis reaffirm the conclusions that were obtained in the previous validation stage. All of these results are summarized in
Table 5.
4. Discussion
The important differences presented in the different composts’ spectra, once the LOI procedure had been performed, indicate that the OM, as well as the mineralogical composition of the composts, varied. The spectra of the composts were measured before and after the LOI method to calculate the SAM values, considering a featureless spectrum with the same values in all bands as the endmember. This analysis suggested that the varied mineralogical composition of the composts can affect the generic approach. Nevertheless, the varied OM content (and composition) may be even more unfavorable for the spectral-based assessment of SOM. Therefore, precaution is needed when predicting SOM with a generic model (i.e., using soils of different origin and with different OM sources).
The results of the SSDL analysis showed that low amounts of OM are difficult to distinguish using VIS–NIR–SWIR spectroscopy, even if the soil background is very bright (e.g., dune sand). This is because the SSDL values of the OM sources that were evaluated range between 0.12 and 0.59%, and OM estimation through a generic approach may not be precise in this range. Accordingly, SOM estimation using a generic approach may not be precise in the lower SOM range that meets the above (lower than 0.6%). Moreover,
Figure 7 reveals that the OM content of the examined composts is not correlated to the SSDL (R
2 = 0). Accordingly, SOM estimation through a generic approach may not be precise in the lower SOM range that is found mostly in arid–mineral soils. This supports the notion that the spectral-based detection of OM can be affected by the mineralogical composition of the OM sources, because the composition of the composts is varied and they are not totally pure organic components (see
Table 2).
On the other hand, the CIWs could be an important parameter for evaluating the detectable characteristics of the OM of interest: the longer the wavelength at which the CIW is identified, the lower the amount of OM necessary for the spectral-based detection (
Figure 8). However, this trend was identified in the evaluation of only five composts. Nonetheless, the fair correlation (R
2 = 0.59) found between the square of the SSDL and the CIW (representing different OM sources) led us to assume that this trend could be relevant for many other OM sources. This conclusion requires further investigation with more than five sources of OM and other soil types as background.
The CIWs for each compost varied, but all of them were in the 800–900 nm spectral region (
Table 3). In composts A5 and A6, the CIW was identified at 843 and 808 nm, respectively, so in some cases, the CIW could be found in spectral bands below the 850–950 nm spectral range recommended by Ogen et al. [
23]. These variations in the identification of the CIW can be considered further proof of different OM sources having different spectral assignments as well as different chemistry.
All individual spectral-based models showed excellent performance, and almost no samples were ignored in regard to their development. The performance of the generic model was fairly good when we considered all of the samples for calibration and validation (without the outliers). However, when we generated a new generic model using samples with low OM content (below 0.6%), its accuracy decreased considerably. This finding strengthens the conclusions that arose from the other examinations (SAM and SSDL). The study suggests that spectral-based detection (or estimation) for OM monitoring should be performed with caution, especially with mineral soils that are poor in OM content and contain different OM sources and minerals.
It should be borne in mind that our soil mixtures were prepared with a high-albedo soil (dune sand), thus providing optimal conditions for the detection of SOM [
23]. Accordingly, it is assumed that the lower limit that we found in this study may be higher for other (lower-albedo) mineral soils.
To create a generic model based on soil samples from a specific farm, OM from different sources that are added to the field should be distributed homogeneously. Moreover, some species of OM require special attention, because they may present worse quantitative spectral features than the generic approach.
We believe that variations due to the type of chemical analysis will not change the conclusions of the spectral based variation in this study, as exists a high correlation between the LOI and Walkley and Black methods [
25], as well as between the former and the ISO 10694:1995 method (
Figure 2). Checking the effect of the “wet analytical“ methods on the spectral assessment is beyond the scope of this paper and requires a new study.
5. Conclusions
The purpose of this research was to evaluate the quantitative performance of spectral-based models in estimating OM from different sources in an optimal way. To this end, we created a robust and artificial dataset with several samples, mixing different OM sources in increasing amounts with pure dune sand. This enabled generating an optimal scenario characterized by good contrast between the added OM sources and the chosen soil (dune sand). All of the PLSR models presented excellent results, including the generic model. Nevertheless, when a new generic model was created using samples with low OM content (<0.6%), the accuracy decreased considerably. The SSDL method was also examined, and it was concluded that the detection of a given class of OM is not necessarily affected only by its OM content but also by the non-organic components of the OM source, which change the signals accordingly. This observation coincides with the results of the SAM analysis that was applied to the spectral signatures of the composts after the LOI procedure. In that analysis, we found that different sources of OM may contain not only varied OM content but also varied mineralogy. We also found that different sources of OM may present different SSDL values, ranging between 0.13% and 0.59% at least. Thus, the PLSR and the SSDL analyses showed that the estimation of SOM through a generic approach is problematic, especially for samples with OM content below 0.6%. In the analyzed composts, the CIW was identified at different wavelengths, indicating important differences in their chemical compositions. Thus, the estimation of OM using reflectance spectroscopy be may inaccurate, especially for samples with low OM content (<0.6%). In the future, similar work should be conducted using more OM sources at different stages of decomposition (e.g., different C:N ratio). This is essential to check the robustness of the SOM determination process. This study used analog soil mixtures that were composed of an optimal soil background (bright sand) and different OM sources (composts). The idea was to demonstrate the complexity of the spectral-based assessment to provide a solid generic OM model.
As a high correlation exists between the LOI and dry combustion (ISO 10694:1995) methods, similar conclusions may be obtained with other traditional laboratory methods. Nonetheless, based on this controlled study which examined a simulated soil system, another, more complex study should be planned to assess the SSDL variation in different natural soil types with varying SOM origin and content.
Author Contributions
Conceptualization, N.F., Y.O., E.B.-D.; methodology, N.F., Y.O., E.B.-D.; validation, N.F.; formal analysis, N.F.; investigation, N.F., Y.O., E.B.-D.; resources, E.B.-D.; data curation, N.F.; writing—original draft preparation, N.F., E.B.-D.; writing—review and editing, N.F., Y.O., E.B.-D.; visualization, N.F.; supervision, E.B.-D.; project administration, E.B.-D.; funding acquisition, E.B.-D. All authors have read and agreed to the published version of the manuscript.
Funding
This work has been partially funded by the “WORLDSOILS” project, supported by the European Space Agency developed within the EO Science for Society slice of the 5th Earth Observation Envelope.
Institutional Review Board Statement
Not applicable.
Informed Consent Statement
Not applicable.
Data Availability Statement
Data sharing is not applicable to this article.
Acknowledgments
We acknowledge the support of all members in the Remote Sensing Laboratory (RSL) at Tel Aviv University (TAU).
Conflicts of Interest
The authors declare no conflict of interest.
References
- Ben-Dor, E.; Inbar, Y.; Chen, Y. The Reflectance Spectra of Organic Matter in the Visible Near-Infrared and Short Wave Infrared Region (400–2500 Nm) during a Controlled Decomposition Process. Remote Sens. Environ. 1997, 61, 1–15. [Google Scholar] [CrossRef]
- Maia, C.; Novotny, E.; Rittl, T.; Hayes, M.H. Soil Organic Matter: Chemical and Physical Characteristics and Analytical Methods. A Review. Curr. Org. Chem. 2013, 17, 2985–2990. [Google Scholar] [CrossRef]
- Kuzyakov, Y.; Horwath, W.R.; Dorodnikov, M.; Blagodatskaya, E. Chapter Eight—Effects of Elevated CO2 in the Atmosphere on Soil C and N Turnover. In Developments in Soil Science; Horwath, W.R., Kuzyakov, Y., Eds.; Climate Change Impacts on Soil Processes and Ecosystem Properties; Elsevier: Amsterdam, The Netherlands, 2018; Volume 35, pp. 207–219. [Google Scholar]
- Mote, C.R.; Griffis, C.L. Variations in the Composting Process for Different Organic Carbon Sources. Agric. Wastes 1980, 2, 215–223. [Google Scholar] [CrossRef]
- Inbar, Y.; Chen, Y.; Hadar, Y.; Hoitink, H.A.J. New Approaches to Compost Maturity. Biocycle 1990, 31, 64–69. [Google Scholar]
- Mirzaee, S.; Ghorbani-Dashtaki, S.; Mohammadi, J.; Asadi, H.; Asadzadeh, F. Spatial Variability of Soil Organic Matter Using Remote Sensing Data. Catena 2016, 145, 118–127. [Google Scholar] [CrossRef]
- Heller Pearlshtien, D.; Ben-Dor, E. Effect of Organic Matter Content on the Spectral Signature of Iron Oxides across the VIS–NIR Spectral Region in Artificial Mixtures: An Example from a Red Soil from Israel. Remote Sens. 2020, 12, 1960. [Google Scholar] [CrossRef]
- Kosmas, C.S.; Franzmeier, D.P.; Schulze, D.G. Relationship among Derivative Spectroscopy, Color, Crystallite Dimensions, and Al Substitution of Synthetic Goethites and Hematites. Clays Clay Miner. 1986, 34, 625–634. [Google Scholar] [CrossRef]
- Viscarra Rossel, R.A.; Walvoort, D.J.J.; McBratney, A.B.; Janik, L.J.; Skjemstad, J.O. Visible, near Infrared, Mid Infrared or Combined Diffuse Reflectance Spectroscopy for Simultaneous Assessment of Various Soil Properties. Geoderma 2006, 131, 59–75. [Google Scholar] [CrossRef]
- Nocita, M.; Stevens, A.; Toth, G.; Panagos, P.; van Wesemael, B.; Montanarella, L. Prediction of Soil Organic Carbon Content by Diffuse Reflectance Spectroscopy Using a Local Partial Least Square Regression Approach. Soil Biol. Biochem. 2014, 68, 337–347. [Google Scholar] [CrossRef]
- Brown, D.J.; Shepherd, K.D.; Walsh, M.G.; Dewayne Mays, M.; Reinsch, T.G. Global Soil Characterization with VNIR Diffuse Reflectance Spectroscopy. Geoderma 2006, 132, 273–290. [Google Scholar] [CrossRef]
- Xie, H.T.; Yang, X.M.; Drury, C.F.; Yang, J.Y.; Zhang, X.D. Predicting Soil Organic Carbon and Total Nitrogen Using Mid- and near-Infrared Spectra for Brookston Clay Loam Soil in Southwestern Ontario, Canada. Can. J. Soil. Sci. 2011, 91, 53–63. [Google Scholar] [CrossRef]
- Wang, J.; He, T.; Lv, C.; Chen, Y.; Jian, W. Mapping Soil Organic Matter Based on Land Degradation Spectral Response Units Using Hyperion Images. Int. J. Appl. Earth Obs. Geoinf. 2010, 12 (Suppl. S2), S171–S180. [Google Scholar] [CrossRef]
- Daniel, K.W.; Tripathi, N.K.; Honda, K.; Apisit, E. Analysis of VNIR (400–1100 Nm) Spectral Signatures for Estimation of Soil Organic Matter in Tropical Soils of Thailand. Int. J. Remote Sens. 2004, 25, 643–652. [Google Scholar] [CrossRef]
- Palacios-Orueta, A.; Ustin, S.L. Remote Sensing of Soil Properties in the Santa Monica Mountains I. Spectral Analysis. Remote Sens. Environ. 1998, 65, 170–183. [Google Scholar] [CrossRef]
- Jin, X.; Du, J.; Liu, H.; Wang, Z.; Song, K. Remote Estimation of Soil Organic Matter Content in the Sanjiang Plain, Northest China: The Optimal Band Algorithm versus the GRA-ANN Model. Agric. For. Meteorol. 2016, 218–219, 250–260. [Google Scholar] [CrossRef]
- Dalal, R.C.; Henry, R.J. Simultaneous Determination of Moisture, Organic Carbon, and Total Nitrogen by Near Infrared Reflectance Spectrophotometry1. Soil Sci. Soc. Am. J. 1986, 50, 120–123. [Google Scholar] [CrossRef]
- Rossel, R.A.V.; Behrens, T. Using Data Mining to Model and Interpret Soil Diffuse Reflectance Spectra. Geoderma 2010, 158, 46–54. [Google Scholar] [CrossRef]
- Bircher, S.; Demontoux, F.; Razafindratsima, S.; Zakharova, E.; Drusch, M.; Wigneron, J.-P.; Kerr, Y.H. L-Band Relative Permittivity of Organic Soil Surface Layers—A New Dataset of Resonant Cavity Measurements and Model Evaluation. Remote Sens. 2016, 8, 1024. [Google Scholar] [CrossRef]
- Inbar, Y.; Chen, Y.; Hadar, Y. Solid-State Carbon-13 Nuclear Magnetic Resonance and Infrared Spectroscopy of Composted Organic Matter. Soil Sci. Soc. Am. J. 1989, 53, 1695–1701. [Google Scholar] [CrossRef]
- Chen, Y.; Inbar, Y.; Hadar, Y.; Malcolm, R.L. Chemical Properties and Solid-State CPMAS 13C-NMR of Composted Organic Matter. Sci. Total Environ. 1989, 81, 201–208. [Google Scholar] [CrossRef]
- He, T.; Wang, J.; Lin, Z.; Cheng, Y. Spectral Features of Soil Organic Matter. Geo-Spat. Inf. Sci. 2009, 12, 33–40. [Google Scholar] [CrossRef]
- Ogen, Y.; Neumann, C.; Chabrillat, S.; Goldshleger, N.; Ben Dor, E. Evaluating the Detection Limit of Organic Matter Using Point and Imaging Spectroscopy. Geoderma 2018, 321, 100–109. [Google Scholar] [CrossRef]
- Shrivastava, A.; Gupta, V.B. Methods for the Determination of Limit of Detection and Limit of Quantitation of the Analytical Methods. Chron. Young Sci. 2011, 2, 21. [Google Scholar] [CrossRef]
- Ben-Dor, E.; Banin, A. Determination of Organic Matter Content in Arid-zone Soils Using a Simple “Loss-on-ignition” Method. Commun. Soil Sci. Plant Anal. 1989, 20, 1675–1695. [Google Scholar] [CrossRef]
- Schulte, E.E.; Hopkins, B.G. Estimation of Soil Organic Matter by Weight Loss-On-Ignition. Soil Org. Matter Anal. Interpret. 1996, 46, 21–31. [Google Scholar] [CrossRef]
- Ben Dor, E.; Ong, C.; Lau, I.C. Reflectance Measurements of Soils in the Laboratory: Standards and Protocols. Geoderma 2015, 245–246, 112–124. [Google Scholar] [CrossRef]
- Savitzky, A.; Golay, M.J.E. Smoothing and Differentiation of Data by Simplified Least Squares Procedures. Anal. Chem. 1964, 36, 1627–1639. [Google Scholar] [CrossRef]
- Kruse, F.A.; Lefkoff, A.B.; Boardman, J.W.; Heidebrecht, K.B.; Shapiro, A.T.; Barloon, P.J.; Goetz, A.F.H. The Spectral Image Processing System (SIPS)—Interactive Visualization and Analysis of Imaging Spectrometer Data. Remote Sens. Environ. 1993, 44, 145–163. [Google Scholar] [CrossRef]
- Haaland, D.M.; Thomas, E.V. Partial Least-Squares Methods for Spectral Analyses. 1. Relation to Other Quantitative Calibration Methods and the Extraction of Qualitative Information. Anal. Chem. 1988, 60, 1193–1202. [Google Scholar] [CrossRef]
- Pedregosa, F.; Varoquaux, G.; Gramfort, A.; Michel, V.; Thirion, B.; Grisel, O.; Blondel, M.; Müller, A.; Nothman, J.; Louppe, G.; et al. Scikit-Learn: Machine Learning in Python. arXiv 2012, arXiv:1201.0490. [Google Scholar]
- Hawkes, H.E.; Webb, J.S. Geochemistry in Mineral Exploration. Soil Sci. 1963, 95, 283. [Google Scholar] [CrossRef]
- Yang, J.; Rahardja, S.; Fränti, P. Outlier Detection: How to Threshold Outlier Scores? In Proceedings of the International Conference on Artificial Intelligence, Information Processing and Cloud Computing, Association for Computing Machinery, New York, NY, USA, 19 December 2019; pp. 1–6. [Google Scholar]
- Hyndman, R.; Koehler, A. Another Look at Measures of Forecast Accuracy. Int. J. Forecast. 2006, 22, 679–688. [Google Scholar] [CrossRef]
- Chang, C.-W.; Laird, D.A. Near-Infrared Reflectance Spectroscopic Analysis of Soil C and N. Soil Sci. 2002, 167, 110–116. [Google Scholar] [CrossRef]
- Chang, C.-W.; Laird, D.A.; Mausbach, M.J.; Hurburgh, C.R. Near-Infrared Reflectance Spectroscopy–Principal Components Regression Analyses of Soil Properties. Soil Sci. Soc. Am. J. 2001, 65, 480–490. [Google Scholar] [CrossRef]
- Ogen, Y.; Faigenbaum-golovin, S.; Granot, A.; Shkolnisky, Y.; Goldshleger, N.; Ben-dor, E. Removing Moisture Effect on Soil Reflectance Properties: A Case Study of Clay Content Prediction. Pedosphere 2019, 29, 421–431. [Google Scholar] [CrossRef]
- Ben-Dor, E. Quantitative remote sensing of soil properties. Adv. Agron. 2002, 75, 173–243. [Google Scholar] [CrossRef]
Figure 1.
The different composts before (a) and after (b) heating at 405 °C.
Figure 1.
The different composts before (a) and after (b) heating at 405 °C.
Figure 2.
The LOI method versus the ISO 10694:1995 measurements of the OM sources used in this study.
Figure 2.
The LOI method versus the ISO 10694:1995 measurements of the OM sources used in this study.
Figure 3.
(a) Spectra of all composts used in this study and of pure dune sand. (b–f) Spectra of dune sand (B2) with increasing amounts (1, 5, 10, and 100%) of the different composts.
Figure 3.
(a) Spectra of all composts used in this study and of pure dune sand. (b–f) Spectra of dune sand (B2) with increasing amounts (1, 5, 10, and 100%) of the different composts.
Figure 4.
Validation of the sand–OM mixture preparations: The x-axis represents the calculated OM content in the preparation of the soil–OM mixtures. The y-axis represents the OM content measured by the LOI method in each sand–OM mixture after the preparation stage.
Figure 4.
Validation of the sand–OM mixture preparations: The x-axis represents the calculated OM content in the preparation of the soil–OM mixtures. The y-axis represents the OM content measured by the LOI method in each sand–OM mixture after the preparation stage.
Figure 5.
First-derivative preprocessing spectra of the different sources of OM (A1, A2, A4, A5, and A6) and dune sand (B2) in the range of 500–650 nm. Arrow—soil indicative wavelength (SIW).
Figure 5.
First-derivative preprocessing spectra of the different sources of OM (A1, A2, A4, A5, and A6) and dune sand (B2) in the range of 500–650 nm. Arrow—soil indicative wavelength (SIW).
Figure 6.
First-derivative preprocessing spectra of the different sources of OM (A1, A2, A4, A5, and A6) and dune sand (B2) in the range of 800–950 nm. The selected compost indicative wavelength (CIW) values are marked.
Figure 6.
First-derivative preprocessing spectra of the different sources of OM (A1, A2, A4, A5, and A6) and dune sand (B2) in the range of 800–950 nm. The selected compost indicative wavelength (CIW) values are marked.
Figure 7.
Soil spectral detection limit (SSDL) vs. measured OM content (%) in the initial composts.
Figure 7.
Soil spectral detection limit (SSDL) vs. measured OM content (%) in the initial composts.
Figure 8.
Squared soil spectral detection limit (SSDL) values vs. selected compost indicative wavelengths (CIW).
Figure 8.
Squared soil spectral detection limit (SSDL) values vs. selected compost indicative wavelengths (CIW).
Figure 9.
Composts’ spectra after LOI. (a) After LOI reflectance; (b) reflectance after LOI minus reflectance before LOI.
Figure 9.
Composts’ spectra after LOI. (a) After LOI reflectance; (b) reflectance after LOI minus reflectance before LOI.
Figure 10.
Partial least squares regression (PLSR) models with their predictions in the calibration (a,d,g,j,m,p) and validation (b,e,h,k,n,q) stages, and their correlograms (c,f,i,l,o,r).
Figure 10.
Partial least squares regression (PLSR) models with their predictions in the calibration (a,d,g,j,m,p) and validation (b,e,h,k,n,q) stages, and their correlograms (c,f,i,l,o,r).
Figure 11.
Generic model for samples with low OM content. Its predictions in the calibration (a) and validation (b) stages, and the correlogram (c).
Figure 11.
Generic model for samples with low OM content. Its predictions in the calibration (a) and validation (b) stages, and the correlogram (c).
Table 1.
Organic matter (OM) content using the loss on ignition (LOI) method, codes, and description of the composts and soils examined in this research.
Table 1.
Organic matter (OM) content using the loss on ignition (LOI) method, codes, and description of the composts and soils examined in this research.
| Code | Description | OM Content (%) |
|---|
| A1 | Compost “Biocompost”: cow dung compost | 17.36 |
| A2 | Planting mix titanium: soil with peat | 70 |
| A4 | Compost “Garin”: 85% cow dung, 15% leaves | 27.33 |
| A5 | Compost “Aben Ari”: baltic peat, coconut fibers, ventilation materials | 36.26 |
| A6 | Worm humus “Green 4 Ever” | 18.89 |
| B2 | Dune sand | <0.01 |
Table 2.
The spectral angle mapper (SAM) value of every compost before and after the LOI procedure. The endmember to which the SAM was applied was a featureless spectrum.
Table 2.
The spectral angle mapper (SAM) value of every compost before and after the LOI procedure. The endmember to which the SAM was applied was a featureless spectrum.
| Code | SAM (before LOI) | SAM (after LOI) | OM Content (%) |
|---|
| A1 | 0.41 | 0.20 | 17.36 |
| A2 | 0.40 | 0.13 | 70 |
| A4 | 0.40 | 0.19 | 27.33 |
| A5 | 0.51 | 0.16 | 36.26 |
| A6 | 0.31 | 0.20 | 18.89 |
Table 3.
The statistical parameters of all models prepared for the estimation of OM (wt.%), including SSDL and CIW.
Table 3.
The statistical parameters of all models prepared for the estimation of OM (wt.%), including SSDL and CIW.
| Parameter | A1 | A2 | A4 | A5 | A6 | Generic Model |
|---|
| RPD (Cal) | 2.54 | 3.72 | 2.87 | 3.98 | 2.91 | 2.76 |
| RPD (Test) | 2.17 | 3.28 | 2.4 | 2.6 | 2.46 | 3 |
| R2 (Cal) | 0.92 | 0.90 | 0.91 | 0.96 | 0.91 | 0.85 |
| R2 (Test) | 0.79 | 0.90 | 0.79 | 0.85 | 0.80 | 0.89 |
| RMSE (%) (Cal) | 0.18 | 0.79 | 0.28 | 0.25 | 0.21 | 0.7 |
| RMSE (%) (Test) | 0.23 | 0.62 | 0.32 | 0.36 | 0.22 | 0.6 |
| No. of samples (Total) | 120 | 120 | 120 | 119 | 119 | 589 |
| No. of samples (Cal) | 90 | 90 | 90 | 89 | 89 | 442 |
| No. of samples (Test) | 30 | 30 | 30 | 30 | 30 | 147 |
| SSDL (%) | 0.13 | 0.36 | 0.24 | 0.12 | 0.59 | - |
| CIW (nm) | 889 | 870 | 890 | 843 | 808 | - |
| OM range (%) | (0.03–2.08) | (0.14–8.4) | (0.05–3.28) | (0.07–4.35) | (0.04–2.27) | (0.00–8.4) |
Table 4.
The statistical parameters of the generic model for samples with low (<0.6%) OM content.
Table 4.
The statistical parameters of the generic model for samples with low (<0.6%) OM content.
| Parameter | Generic Model (Low Amounts) |
|---|
| RPD (Cal) | 1.59 |
| RPD (Test) | 1.55 |
| R2 (Cal) | 0.77 |
| R2 (Test) | 0.59 |
| RMSE (%) (Cal) | 0.09 |
| RMSE (%) (Test) | 0.1 |
| No. of samples (Total) | 110 |
| No. of samples (Cal) | 82 |
| No. of samples (Test) | 28 |
| OM range (%) | (0–0.6) |
Table 5.
The statistical parameters of all models prepared for the estimation of OM (wt.%), including SSDL and CIW.
Table 5.
The statistical parameters of all models prepared for the estimation of OM (wt.%), including SSDL and CIW.
| Parameter | A1 | A2 | A4 | A5 | A6 | Generic Model | Generic Model (Low Amounts) |
|---|
| RPD (LOOCV) | 3.07 | 2.64 | 2.85 | 4.38 | 2.75 | 2.51 | 1.75 |
| R2 (LOOCV) | 0.89 | 0.86 | 0.88 | 0.95 | 0.87 | 0.85 | 0.68 |
| RMSE (%) (LOOCV) | 0.2 | 0.94 | 0.34 | 0.29 | 0.25 | 0.73 | 0.11 |
| No. of samples (Cal) | 90 | 90 | 90 | 89 | 89 | 442 | 82 |
| OM range (%) | (0.03–2.08) | (0.14–8.4) | (0.05–3.28) | (0.07–4.35) | (0.04–2.27) | (0.00–8.4) | (0–0.6) |
| Publisher’s Note: MDPI stays neutral with regard to jurisdictional claims in published maps and institutional affiliations. |
© 2021 by the authors. Licensee MDPI, Basel, Switzerland. This article is an open access article distributed under the terms and conditions of the Creative Commons Attribution (CC BY) license (https://creativecommons.org/licenses/by/4.0/).


