Article

An Improved Index for Urban Population Distribution Mapping Based on Nighttime Lights (DMSP-OLS) Data: An Experiment in Riyadh Province, Saudi Arabia

1
National Center for Remote Sensing Technology, Space and Aeronautics Research Institute, King Abdulaziz City for Science and Technology, P.O. Box 6086, Riyadh 11442, Saudi Arabia
2
Geography Department, College of Arts and Social Sciences, Sultan Qaboos University, P.O. Box 42, Al-Khoud P.C. 123, Muscat, Oman
3
Department of Geography and GIS, Faculty of Arts, Alexandria University, Al Shatby P.O. Box 21526, Alexandria, Egypt
4
Geography and Environment, University of Southampton, Southampton SO17 1BJ, UK
5
Lancaster Environment Centre, Lancaster University, Bailrigg, Lancaster LA1 4YR, UK
6
Institute of Geographic Sciences and Natural Resources Research, Chinese Academy of Sciences, 11A Datun Road, Beijing 100101, China
*
Author to whom correspondence should be addressed.
Remote Sens. 2021, 13(6), 1171; https://doi.org/10.3390/rs13061171
Submission received: 1 February 2021 / Revised: 12 March 2021 / Accepted: 16 March 2021 / Published: 19 March 2021
(This article belongs to the Special Issue Data Fusion for Urban Applications)

Abstract

:
Knowledge of the spatial pattern of the population is important. Census population data provide insufficient spatial information because they are released only for large geographic areas. Nighttime light (NTL) data have been utilized widely as an effective proxy for population mapping. However, the well-reported challenges of pixel overglow and saturation influence the applicability of the Defense Meteorological Program Operational Line-Scan System (DMSP-OLS) for accurate population mapping. This paper integrates three remotely sensed information sources, DMSP-OLS, vegetation, and bare land areas, to develop a novel index called the Vegetation-Bare Adjusted NTL Index (VBANTLI) to overcome the uncertainties in the DMSP-OLS data. The VBANTLI was applied to Riyadh province to downscale governorate-level census population for 2004 and 2010 to a gridded surface of 1 km resolution. The experimental results confirmed that the VBANTLI significantly reduced the overglow and saturation effects compared to widely applied indices such as the Human Settlement Index (HSI), Vegetation Adjusted Normalized Urban Index (VANUI), and radiance-calibrated NTL (RCNTL). The correlation coefficient between the census population and the RCNTL (R = 0.99) and VBANTLI (R = 0.98) was larger than for the HSI (R = 0.14) and VANUI (R = 0.81) products. In addition, Model 5 (VBANTLI) was the most accurate model with R2 and mean relative error (MRE) values of 0.95% and 37%, respectively.

Graphical Abstract

1. Introduction

According to the United Nations [1], the number of people in the world is increasing due to high fertility in developing countries, accompanied by immigration to developed countries due to economic growth. The global population was 7.7 billion in 2019 and is expected to increase by 52% by 2050, with the majority of the increase in the developing countries of Asia and Africa [1]. Detailed and accurate information on the spatial distribution of the population is of great importance for government and private agencies [2,3]. The changes in population distribution are core factors in decision-making about where and when to construct public facilities (such as mosques, schools, and health centers), public utilities (such as sewage treatment plants, roads, and trains), and commercial facilities (such as stores, restaurants, and supermarkets). In addition, population information and change in population are two of the most important variables for environmental and socio-economic analysis; for example, land use planning, housing, policy impact analysis, pollution, and disaster management [2,3].
Censuses are the primary and most reliable source of population data in most countries of the world. However, censuses cannot meet the continuous and accelerating changes in socio-economic and environmental impacts because: (1) they are often published for large administrative areas to protect the privacy of inhabitants (e.g., governorate level in Saudi Arabia) and, therefore, omit spatial variation within the published units; (2) they are inconsistent with gridded-environmental data (e.g., land surface temperature, rainfall, air pollution) and, thus, cannot easily be analyzed with them; (3) administrative boundaries may be adjusted or deleted over time making analysis of population change between census years difficult. Downscaling population data to a gridded population surface at finer resolution is a potential solution to these problems [4].
Since the 1970s, nighttime light (NTL) data obtained by the Defense Meteorological Program (DMSP) Operational Line-Scan System (OLS) have been a useful source of data, employed in a wide range of urban [5,6], population [3,7,8], economic [9,10], and environmental applications [11,12]. NTL data generally reflect illumination from residential buildings, parking lots, streetlights, industrial buildings, and fires. This means that the NTL data do not represent human settlements directly. Moreover, researchers need to pay attention to uncertainties in the NTL data [13], for example, in terms of the radiometric resolution (6-bit) and coarse spatial resolution (1 km). These sources of uncertainty cause lit urban areas to appear much larger than the actual lit areas on the ground, referred to as overglow and saturation effects [13] and, in turn, this may affect the accuracy of predictions made using NTL data.
Different methods have been developed to mitigate the overglow and saturation impacts and they vary in terms of the application region, spatial scale, input data, algorithm, and accuracy [2]. These methods can be categorized into four groups: (1) threshold-based [5,14,15,16,17]; (2) classification-based [18,19,20,21]; (3) land use/cover overlay-based [3,7,8,22]; and (4) fusion-based [4,18,23,24].
The threshold approach has been commonly used because it is simple and achieves reasonable accuracy [25]. Ma et al. [15] excluded NTL pixels with DN values smaller than 12 to measure the relationship between different time-series of nighttime data (1994 to 2009) and some urban variables in China. Began and Yamagata [16] compared land use/cover data with NTL data, selecting threshold values of 62 and 46 for 1992 and 2006, respectively, in the NTL data in Japan. However, a global threshold usually overestimates the extents of larger settlements and underestimates smaller ones [26]. Thus, overglow and saturation effects remain important when applying a global threshold.
Spatial variation in economic development, urban structure, and population density results in variation in NTL pixel values between and within cities [14]. Approaches have been developed to address this problem by adopting multiple and optimal thresholds using socio-economic information. Henderson et al. [26] derived three different thresholds based on the degree of urbanization and economic development in some cities in the USA (San Francisco, threshold of 92%) and China (Lahasa and Beijing, thresholds 88% and 97%, respectively). Yu et al. [27] divided China into 10 parts and then evaluated the urban areas from the statistical yearbook (similarly to He et al. [28]) with the urban areas derived from the NTL data using different thresholds: the threshold that minimized the error between the two products was selected as the optimal threshold. This kind of approach is subjective, complex, time-consuming, and highly affected by the accuracy and availability of socio-economic information [18,29]. Recognizing the issues of threshold uncertainty, semi-automatic classification methods were developed to maximize the usefulness of the NTL data. Cao et al. [18] and Pandey et al. [19] applied a supervised non-parametric support vector machine (SVM). In a detailed study, Jing et al. [21] analyzed the NTL data using four different supervised algorithms such as k-nearest-neighbors and random forests (RF). The machine learning algorithms are sensitive to the training areas and this may affect the accuracy of the results [30].
The above challenges have encouraged researchers to use ancillary spatial data sources. Remotely sensed data have been widely used to measure urban morphology, which can be valuable for different applications [31]. Wang et al. [3] addressed the over-glow effect by overlaying three types of land use/cover data (urban, rural, and industry-traffic areas) with the NTL data to a downscale population in China for the years 1990, 2000, and 2010 using generalized linear regression (GLM) and geographically weighted regression (GWR) models. Similarly, cultivated and residential land use classes were integrated with the NTL data to predict population at the pixel level (1 km) in China for 2000 and 2010 [8]. Moderate Resolution Imaging Spectroradiometer (MODIS) land use/cover data are a valuable free source of information utilized with the NTL data to derive two main classes called habitable and uninhabitable lit areas to model urban and rural population densities in Guangdong, China [22]. Fine spatial resolution land cover data (30 m) have also been utilized with the radiance corrected NTL data to estimate the population at 1 km spatial resolution in China [7].
Due to the inverse relationship between vegetation land cover and urban areas [32], researchers have investigated the usefulness and efficiency of vegetation land cover to enhance NTL data [4,18,23,33]. The normalized difference vegetation index (NDVI) has been the most common daytime product to address overglow and saturation effects. Lu et al. [23] combined the NDVI and NTL data to enhance urban areas by constructing a human settlement index (HSI), whereas Zhang et al. [33] developed the vegetation adjusted normalized urban index (VANUI). Yang et al. [4] improved Lu’s method using the enhanced vegetation index (EVI) and a digital elevation model (DEM) to estimate population in Zhejiang province, China. However, NDVI values are relatively similar for urban areas, bare land, and water bodies [34,35]. Thus, the HSI and VANUI models were of limited utility for heterogeneous areas.
Methods for dealing with the overglow and saturation effects are dependent on the urban morphology of those study areas examined. For example, the fusion-based approach was constructed based on vegetation land cover because such areas are commonly found within the built-up areas of cities in the USA, Europe, and China. Unfortunately, this is not the case in less-vegetated areas such as the Gulf countries and other African countries (e.g., Libya, Mauritania) where bare land is found within the built-up areas.
According to the authors’ knowledge, there is a paucity of studies on the use of remotely sensed data in population estimation especially in the countries of the Arabian Gulf and the Middle East. Thus, this research contributes to the literature by developing an urban extent index for population mapping.
This research aims to: (1) develop a new index based on a composite of nighttime lights, vegetation, and bare land covers, namely, the Vegetated-Bare Adjusted NTL Index (VBANTLI) and (2) use the VBANTLI to characterize and analyze the spatiotemporal pat-tern of population in Riyadh province in 2004 and 2010. Riyadh Province, Saudi Arabia, was chosen as a case study with which to test the proposed methodology because it has experienced different phases of urban development and population growth and exhibits a variety of urban morphologies. For example, most of the ministries, commissions, universities, and companies are located there. Moreover, some of the largest projects have been constructed in Riyadh province including the King Abdullah Financial Centre and Riyadh Metro. This makes it an appropriate choice of the study area, representing a part of the world that has not been investigated in detail in terms of population studies using NTL data.

2. Study Area and Data Processing

2.1. Study Area

The Kingdom of Saudi Arabia is located in the western zone of the continent of Asia. The total land area is approximately 2 million km2 and this makes it the largest country in the Middle East and Gulf states. Saudi Arabia consists of 13 administrative provinces and each province includes a number of governorates. Riyadh province is the second most populous province in Saudi Arabia after Makkah province, with a total population of 6.7 million, and it is the second-largest province after Eastern province, with a total land area of 374,000 km2. Riyadh province is located in the middle of Saudi Arabia (Figure 1) and includes Riyadh city (the most populous city), the capital of both the Kingdom and province. Riyadh province is divided into 20 governorates.

2.2. Data and Processing

Table 1 lists the remotely sensed satellite sensor data, census data, and GIS data used to develop and validate the different population estimation models.

2.2.1. Population and Administrative Boundaries

Census population data are important for constructing and validating spatial population models. In Saudi Arabia, censuses are planned and carried out by the General Authority for Statistics (GASTAT). Censuses were conducted in Saudi Arabia in 1974, 1992, 2004, and 2010. The census population data for 1974 and 1992 are available only at the national-level and province-level administrative boundaries, respectively. By contrast, the census population data for 2004 and 2010 are available for the governorate-level administrative boundaries. The 2004 and 2010 data were downloaded from the GASTAT website (https://www.stats.gov.sa/) (accessed on 5 August 2019) in table format. The governorate-level and municipality-level administrative boundaries were obtained from the Royal Commission for Riyadh City (RCRC) and used for model calibration and validation, respectively.
The WorldPop datasets (http://www.worldpop.org.uk/) (accessed on 5 August 2019) were produced using a wide range of geospatial data sources and applying random forest modeling to estimate population counts at 100 m spatial resolution [36]. The years 2004 [37] and 2010 [38] were used here as further validation data.

2.2.2. Land Use/Cover Data

Global land cover (GLC) data have great potential for a variety of socio-economic and environmental applications. A variety of GLC datasets has been created [39] such as the Global Land Cover 2000 (GLC2000) produced by the European Commission’s Joint Research Centre; GlobCover produced by the European Space Agency; and Moderate Resolution Imaging Spectroradiometer (MODIS) land cover produced by the National Aeronautics and Space Administration (NASA).
The MODIS product is commonly used for a variety of socio-economic applications [40,41] and, therefore, was used in this research. The MODIS Collection 6 Global Land Cover Type product (MCD12Q1) for 2004 and 2010 was downloaded from the Land Processes Distributed Active Archive Center (LP DAAC) with a spatial resolution of 500 m and 17 classes based on the Annual International Geosphere-Biosphere Programme (IGBP) scheme. In addition, the monthly MODIS vegetation indices (NDVI) from January to December in 2004 and 2010 were obtained from the MOD13A3 dataset with a spatial resolution of 1 km.
Vegetation land cover data with national extent were obtained from the Ministry of Environment Water and Agriculture (MEWA). The vegetation land cover data were produced from Satellite Pour l’Observation de la Terre (SPOT) 5 data with a spatial resolution of 10 m in summer 2010 and winter 2011.

2.2.3. Satellite Sensor Data

DMSP-OLS nighttime imagery (version 4) was obtained from the National Oceanic and Atmospheric Administration/National Geographical Data Center (NOAA/NGDC) website. The stable nighttime light (DMSP-OLS SNT) product is commonly used because ephemeral lights and background noise are corrected and, therefore, the product represents mainly the lights from socio-economic activities. The DMSP-OLS sensor includes two spectral channels: the visible near-infrared (VNIR) band and the thermal infrared band with radiometric resolutions of 6-bit and 8-bit, respectively, and characterized by a spatial resolution of 30 arc seconds and a swath width of 3000 km [13]. The DMSP-OLS SNT data in 2004 (F152004 and F162004) and 2010 (F182010) were analyzed to downscale the 2004 and 2010 census populations, respectively.
The DMSP-OLS imagery is inconsistent between the different sensors (F10-F18) for the time-series 1992 to 2013 due to the lack of an on-board calibration instrument. Two approaches were applied to ensure the consistency of the DMSP-OLS time-series data: (1) a stepwise calibration approach [42] and (2) intra- and inter-annual correction [5]. The results of the two approaches increased the consistency and comparability of the DMSP-OLS time-series data. A detailed explanation of the calibrated DMSP-OLS imagery in the Kingdom of Saudi Arabia was presented by Alahmadi and Atkinson [6] and these data were called calibrated NTL (CNTL).
The DMSP-OLS radiance calibrated data were downloaded from the NOAA/NGDC website for the years 2004 and 2010. This product addressed the saturation effect by processing the DMSP-OLS data at different gain settings (low, medium, and high) for the years 1996, 1999, 2000, 2002, 2004, and 2010 [43]. This product, radiance-calibrated NTL (RCNTL), was used for comparison with the new index developed in this research.
All the remotely sensed satellite sensor data, land use/cover information, and GIS boundaries were projected using the Albers Equal Area projection to ensure compatibility and the accurate calculation of area.

3. Methodology

3.1. Modeling Theories

A relationship exists between the urban population distribution and urban morphology ranging from more populated (built-up and residential areas) to un-populated (vegetation, bare lands, and water) [33]. Urban morphology can, therefore, be used to help estimate the presence of population.
In Saudi Arabia, the incidence of bare lands within urban boundaries has increased, with land left bare for years without development to increase its value. This, in turn, results in a reduced supply of land for residential or commercial use and also affects sustainable development. The Saudi government issued an Executive Regulation (no. 379 on 13 June 2016) for the Bare Land Fee System to be implemented in 2020. Bare land is defined as vacant land with a total area of more than 10,000 m2 that is suitable for residential, commercial, or mixed-use within urban boundaries [44]. The resolution aimed to increase the supply of land within urban boundaries and, thus, provide land at affordable prices and eliminate monopolies.
The Ministry of Municipal Rural Affairs and Housing (MOMRAH) has responsibility for implementing the Bare Land Fee System. MOMRAH has started using fine spatial resolution satellite data to produce bare land cover data for Saudi cities.

3.2. Land Cover Quality

The MODIS land cover dataset has been used widely in different studies due to its coverage and temporal resolution [41]. The accuracies of different global land cover datasets were assessed using 140 reference cities and the MODIS land cover dataset (Collection 5) showed the highest overall accuracy of 93% [45]. Substantial refinements and improvements in terms of algorithms and input features were made to produce the MODIS Collection 6 compared with Collection 5 [41]. Thus, the MODIS Collection 6 (MCD12Q1) land cover dataset was adopted for this research.
The SPOT-5 vegetation land cover data (overall accuracy = 95%) obtained from MEWA were available only for 2010–2011 [46]. The authors made empirical comparisons between the MOD13A3 (NDVI) 2004 and 2010 (sum of NDVI values) and MCD12Q1 (vegetation cover) 2004 and 2010 (sum of vegetation areas). The former evaluation revealed a 9% increase by 2010, whereas the latter suggested a 7% increase in vegetation area by 2010.
In addition, an overlay analysis was undertaken between the MCD12Q1 2004 and 2010 data which showed that the change occurred only between vegetation cover and bare land cover. This means that vegetation areas in 2004 rarely changed to built-up areas in 2010. For these reasons, we used the 2010 SPOT-5 vegetation land cover to develop the population models for 2004 and 2010.

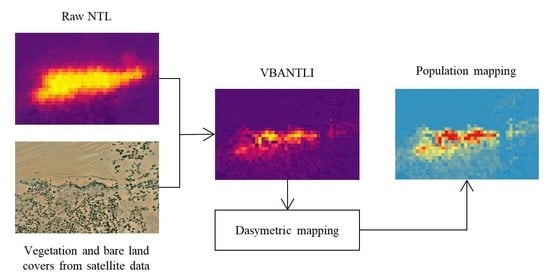
3.3. Vegetation-Bare Adjusted NTL Index (VBANTLI)

A variety of studies [3,7,8,22] have demonstrated the utility of nighttime lights data for population estimation. The overglow and saturation effects in the NTL data exaggerate the size of populated areas and, thus, will influence model calibration and validation. In this research, a novel Vegetation-Bare Adjusted NTL Index (VBANTLI) was developed, based on the vegetation and bare land covers, to reduce the overglow and saturation effects of the CNTL data for population mapping.
The principle behind the VBANTLI is that the relationship between the vegetation-bare land cover (un-populated areas) and nighttime lights is inverse. Figure 2 shows clearly the inverse relationship between the two remotely sensed variables along a transect. It is clear that high values of vegetation-bare proportion (Figure 2b) are located, for example, in the north part (locations between 5 and 20) and recorded a light intensity value of 0. In addition, locations (25 to 40 and 205 to 250) are clear examples of light reflection from un-populated areas (Figure 2a). The VBANTLI was proposed to address these uncertainties in the CNTL data by reducing the saturation effect in un-populated areas.
V B A N T L I = ( 1 ( V G p r p + B L p r p ) ) C N T L n o r
where V G p r p is vegetation proportion, B L p r p is bare land proportion, and C N T L n o r is the normalized value of the CNTL image. The term ( 1 ( V G p r p + B L p r p ) ) assigns larger weights to populated areas. A longitudinal transect was drawn to represent a variety of land use/cover classes associated with different degrees of human activity. Therefore, large VBANTLI values (close to 1) indicate populated areas, whereas small VBANTLI values (close to 0) indicate un-populated areas. The VBANTLI is developed based on freely accessible datasets and, thus, it is transferrable and readily replicated.
Two widely-used vegetation-based indices, HIS [23] and VANUI [33], were compared with the proposed index (VBANTLI). The maximum values of the multi-temporal NDVI products were calculated to minimize the effect of cloud contamination, as expressed in Equation (2), to reduce the confusion between settlements and other land covers (bare lands and water bodies) that have similar NDVI values [23].
N D V I m a x = M a x i m u m   ( N D V I 1 , N D V I 2 , N D V I 3 , N D V I n )
H S I = ( 1 N D V I m a x ) + C N T L n o r ( 1 C N T L n o r ) + N D V I m a x + C N T L n o r N D V I m a x
V A N U I = ( 1 N D V I m a x ) C N T L n o r
where N D V I m a x indicates the maximum value of NDVI in 2004 or 2010, N D V I 1 , N D V I 2 , N D V I 3 , and N D V I n are the time-serious NDVI products (MOD13A3) during January to December, n indicates the calendar month, HSI represents the human settlement index, and V A N U I is the vegetation adjusted normalized urban index.
There are some noticeable limitations in the HSI and VANUI models. For example, in densely and healthy vegetated areas (NDVI = 1), the HSI simply reduces the NTL value by 50%. This implies that socio-economic activities still exist in dense and healthy vegetated areas. This is generally unrealistic, as socio-economic activities across the world are expected to occur in areas with low vegetation proportion [33]. In addition, the NDVI values of non-vegetated phenomena such as urban areas, bare land, and water bodies are similar [34,35] and making it difficult to distinguish between them using the NDVI data. Thus, the HSI and VANUI models are not appropriate to be implemented in less-vegetated areas. VBANTLI aims to address these problems to minimize the overglow and saturation effects.

3.4. Implementing VBANTLI

The VBANTLI was used to downscale governorate-level urban population data to a 1 km2 grid for Riyadh province. The entire framework of the VBANTLI is shown in Figure 3 and can be explained in four steps.
  • The MODIS and SPOT-5 data have different spatial resolutions compared with the NTL data. To allow the harmonization and integration of these data, the NTL and MODIS data were resampled to 10 m. Then, the CNTL data (10 m) were used as a reference raster during the projection of the MODIS and SPOT-5 data so that the cell alignments all match.
  • The IGBP scheme of the MODIS land cover data (MCD12Q1) includes 17 classes. The MCD12Q1 product was clipped to the Riyadh province boundary, resulting in five land cover classes: open shrubland, grassland, cropland, urban and built-up land, and bare land. These five classes were reclassified as populated (shrubland, grassland, cropland, and urban and built-up lands) and unpopulated (bare land) areas [22]. The coarse spatial resolution of the MODIS land cover (500 m) is a source of uncertainty, as there may be inhabitants within the vegetated classes [22], especially in rural areas. In the present research, we categorized the MODIS vegetated, urban, and built-up classes as populated. Later, vegetation areas within fine spatial resolution data (SPOT-5) were used to exclude the ground-referenced vegetation as un-populated areas.
  • MODIS bare land (0, 1) and SPOT-5 vegetation (0, 1) covers were overlaid at 10 m spatial resolution and pixels scoring 1 in either layer were classed as un-populated. Although the agreement between the two sources is not guaranteed, both contribute to the identification of un-populated areas. Then, the proportion of the un-populated areas was computed at 1 km spatial resolution.
  • Finally, the VBANTLI was computed to downscale the governorate census population to produce 1 km population maps in 2004 and 2010.

3.5. Dasymetric Mapping

Areal interpolation was developed to transform data between incompatible zones [47]. Dasymetric mapping is a widely-used areal interpolation method that employs ancillary data and is frequently used for transforming socio-economic data from an arbitrary coarse spatial resolution to a meaningful fine spatial resolution using (usually) urban remote sensing information [48]. In this research, the governorates were the source zones from which census population data were disaggregated to 1 km grid cells as target zones. The general equation of dasymetric mapping is:
P ^ i = P s i = 1 n V B A N T L I s V B A N T L I i s
where P ^ i is the estimated population of the ith target grid pixel, Ps is the census population of source zone s, V B A N T L I s is the total sum of Vegetation-Bare Adjusted NTL Index of source zone s, V B A N T L I i s is the value of Vegetation-Bare Adjusted NTL Index of the ith target grid pixel in source zone s, and n is the number of grid pixels.

3.6. Accuracy Assessment

Accuracy assessment is an essential element of population modeling; it measures the reliability of the predicted maps compared with census data. Two widely used approaches have been proposed to evaluate the results of population simulation models [4]. One form of validation utilizes finer spatial resolution census data to calculate the mean relative error (MRE).
M R E = i = 1 C | P ^ c P c | P c C
where P ^ and P are the total estimated and census population counts of the validation dataset (24 cities), P ^ c and Pc are the estimated and census population of c cities, respectively, and C is the number of cities.
In countries where finer spatial resolution census data are not available, the coefficient of determination (R2) has been used to quantify the association between the reported and fitted variables [3,7]. Fortunately, finer spatial resolution census data were available in Riyadh province and, therefore, the coefficient of determination (R2) between the reported and estimated population data was calculated as well as the MRE.

4. Results

4.1. Evaluation of the Remotely Sensed Products

The uncertainties in the NTL data, in terms of instability and incomparability, were addressed using hybrid methods [6]. The results (R > 0.95) indicated that the CNTL data are strongly indicative of socio-economic development and, thus, are highly reliable [6].
Populated areas (residential built-up areas) are geographical places inhabited by people and include basic infrastructures such as services (mosques, schools, and health centers) and utilities (water, electricity, and roads). To evaluate the utility of VBANTLI for minimizing the overglow and saturation effects, it was compared with four remotely sensed products (CNTL, HSI, VANUI, and RCNTL). Figure 4 shows a longitudinal transect of Riyadh and Kharj cities from the north to south over the CNTL, HSI, VANUI, RCNTL, and VBANTLI. As shown in Figure 4a, the CNTL data are overglowed and saturated into the unpopulated areas surrounding the cities, while reaching a maximum (CNTL = 1.0) in most parts of Riyadh and Kharj cities. The HSI index shows more spatial fluctuation (Figure 4b) but greatly overestimates the magnitude of the CNTL data, especially when the NDVI values are close to zero.
It is clear that the CNTL (Figure 4a) and VANUI variables (Figure 4c) have the same fluctuating pattern. However, the VANUI values vary only slightly, especially over the populated areas in Kharj city showing NTL values ranging from 0.6 to 0.95 (Figure 4c). In contrast, the RCNTL variable (Figure 4d) shows a Gaussian form with large values in the center, and values decreasing towards peripheral areas. The RCNTL product minimized the overglow and saturation effect of the NTL data over populated areas as demonstrated in locations 40 to 115 (Figure 4d).
The VBANTLI (Figure 4e) has more variation across populated areas (Riyadh and Kharj cities) than the RCNTL. This means that ancillary information such as vegetation and bare land cover data affords the ability to capture greater inter-population variability compared with the other remotely sensed products.
The spatial pattern in the different remotely sensed products was further analyzed by applying the percent clip stretch function. Three sample cities, namely, Riyadh, Kharj, and Wadi Aldawaser, were compared spatially in Figure 5. These cities were selected for the following reasons. Riyadh is the capital of Saudi Arabia and Riyadh province and most of the Saudi ministries are located in Riyadh. It has more job opportunities than other cities in the Kingdom, making it the most populous city in the country. Kharj city is distinguished by its economic and natural potential that attracts investment and settlement. It is the second city in Riyadh province by population size. Kharj is a center of agricultural production, producing more than 26% and 65% of all vegetable and milk production, respectively, in Saudi Arabia [49]. Wadi Aldawaser is the largest agricultural city in Saudi Arabia. It produces large numbers of camels and sheep in addition to crops such as wheat, dates, alfalfa, and vegetables [49].
It can be seen that the CNTL, HSI, and VANUI products (Figure 5b, Figure 5c, and Figure 5d, respectively) were saturated into some unpopulated areas and the spatial heterogeneity of the populated areas was not recognized. For example, the entire extent of Riyadh, Kharj, and Wadi Aldawaser cities was saturated and only the general outlines (which are inaccurate) of the cities were delineated.
By contrast, the RCNTL (Figure 5e) and VBANTLI (Figure 5f) products have the ability to separate the unpopulated areas that are formed by vegetation and bare land and maximize spatial heterogeneity within the populated areas. The borders of the different cities were clearly delineated compared with the other products. Hence, the RCNTL and VBANTLI products could usefully be applied in various socio-economic applications.

4.2. Relationship between Population Data and the Remotely Sensed Products

Previous studies confirmed the usefulness of nighttime data as a proxy to estimate population [3,7]. Pearson’s correlation coefficient (R) identifies the strength and direction of the relationship between the variables examined. The cumulative DN values of CNTL, HSI, VANUI, RCNTL, and VBANTLI were analyzed with the 2010 census population data at the governorate level.
Riyadh governorate has a population (5.2 million) more than twelve times larger than the second most populous city (Kharj, population 376,000) and, thus, a scatterplot of VBANTLI vs population is unreadable when using linear axes. For this reason, a log10 transformation was applied prior to the correlation analysis. R values resulting from the original data are written in bold-text, whereas those resulting from the log10 transformation are written in normal-text (Figure 6).
The relationship between the CNTL product and census population is shown in Figure 6a. The R value was 0.81, indicating a moderate linear correlation. This result can potentially be increased when the overglow and saturation effects are addressed. Different studies have incorporated a vegetation index (NDVI) in terms of HSI [22,23] to minimize the uncertainty of the nighttime data. Unfortunately, the HSI product (Figure 6b) reported a very small linear correlation (R = 0.14) as a result of its complicated calculation that caused exaggeration of the human settlement, particularly in unpopulated areas. By contrast, the VANUI product that utilized the same vegetation index reported a much stronger correlation (R = 0.81) than for the HSI product. The correlation coefficients of the VANUI and CNTL were similar, due to the urban structure of Riyadh province, which comprises fewer vegetated areas. The VANUI may be helpful in regions characterized by greater vegetation and urban land covers. Therefore, the uncertainty of the nighttime data remains an issue in the VANUI product.
On the other hand, the RCNTL and VBANTLI products have larger linear correlations (R = 0.99 and 98 respectively) with the census population data, confirming that the overglow and saturation effects are taken into account. Therefore, the RCNTL and the newly developed VBANTLI products are more efficient proxies for the population compared with the other remotely sensed products. It should be noted that the scatterplots of the 2004 data are similar to those for 2010 and, therefore, are not separately reported here.

4.3. Validation of the Remotely Sensed Products

Validation was undertaken at the municipality level (44 municipalities in Riyadh province). Riyadh municipality comprises three sectors, each of which was added to the validation dataset in place of Riyadh municipality. Thus, the validation dataset consisted of 46 samples (43 municipalities and three sectors), all at a finer spatial scale than the governorate level.
Most published research used general linear models [16,22,24] to map population at the pixel level (1 km). However, the dasymetric mapping approach is different, and potentially more robust, because it matches the spatial heterogeneity of the included variables to each source zone. Five dasymetric mapping models were developed based on the CNTL (Model 1), HSI (Model 2), VANUI (Model 3), RCNTL (Model 4), and VBANTLI (Model 5) datasets to downscale population to the pixel level.
Failure to identify unpopulated areas will cause a twofold problem. It will reduce the population density and allocate the population to areas that are, in reality, vacant. Figure 7 shows the relationship between the 2010 simulated population and census population based on the five fitted models. The CNTL model (Figure 7a) suggests a moderate correlation (R2 = 0.63) and mean relative error (MRE) of 72%. These results are caused by the existence of irrelevant spatial phenomena around built-up areas in this model.
Incorporating vegetation information to address the uncertainty of Model 1 relies on the logic that inhabitants are usually located in built-up areas or less vegetated areas and rarely found in densely vegetated areas. The results of Model 2 (Figure 7b) and Model 3 (Figure 7c) did not increase (R2 = 0.63, 0.63 and MRE = 152%, 74%, respectively) compared with Model 1. The low accuracy of Models 2 and 3 compared with Model 1 was expected because the study area examined has a small amount of vegetation cover within the built-up areas and, thus, the NDVI variable has a weak influence on reducing the challenges of overglow and saturation.
The main uncertainty of Models 1, 2, and 3, which caused the low accuracy, was due to the unsuccessful identification of unpopulated areas that were represented by overglow and saturation effects, particularly for bare land. Model 4, based on the enhancement of the DMSP-OLS dynamic range using the instrument pre-flight calibration, increases the R2 (0.89) and MRE (0.45) values compared with the previous three models. Model 5 (Figure 7e), the proposed VBANTLI model, composites the vegetation and bare land covers with the CNTL data to capture the spatial variability and heterogeneity of the study area and, thus, account for the biases of the previous models, especially Models 1, 2, and 3. The application of the VBANTLI product to downscale population achieves high accuracies with an R2 of 0.95 and MRE of 37% compared with Models 1, 2, 3, and 4.
Further comparison was conducted with the WorldPop product (Figure 7f). The MRE value (119%) is lower for the WorldPop product than for Models 1 and 3. The inaccurate WorldPop dataset especially for Riyadh province may be attributed to the limited or insufficient data inputs used to estimate the population at a spatial grid resolution of 100 m, as well as that WorldPop is a global dataset that is not fitted locally to the same extent as here.

4.4. Analysis of Spatiotemporal Change in Population between 2004 and 2010 in Riyadh Province

Based on Model 5, which uses the VBANTLI, the governorate census population was downscaled to a grid resolution of 1 km for 2004 and 2010. The gridded population estimates of Riyadh province increased 29% from 5.4 million in 2004 to 6.7 million in 2010. The spatial distribution of population estimates in Riyadh province in 2004 and 2010 are presented in Figure 8 and Figure 9, respectively, where pixels with red and blue colors denote high and low population estimates, respectively. It is obvious that the estimated population maps reveal inter- and intra-governorate variation, which is not detectable at the published governorate census level due to census confidentiality.
In Riyadh province, it is shown that most of the populated areas were concentrated in the northern part, forming a belt that crosses Kharj, Riyadh, Diriyah, Dhurma, Shagra, Dawadmi, Majmah, Ghat, and Zulfi governorates. This belt is characterized by asphalt roads and flatlands as well as natural resources such as groundwater and vegetation cover and is a link between the eastern, northern, and western parts of Saudi Arabia. In contrast, other areas of Riyadh province lie undeveloped due to the lack of residential attractions in terms of services and utilities.
At the governorate level, Riyadh governorate is the most populated (76% and 77% in 2004 and 2010, respectively) because it contains Riyadh city. At the city level, the population estimates reveal detailed information and spatial heterogeneity. For example, population patterns in most cities (Riyadh and Kharj in Figure 8 and Figure 9, respectively) are concentrated generally in the urban centers and gradually decrease to the peripheral areas, somewhat consistent with the distance decay model.
Table 2 categorizes the estimated-population pixels into seven groups representing four levels of population density, namely, low-density (groups 1 and 2), medium density (group 3), high-density (groups 4 and 5), and very high-density (groups 6 and 7) areas. Most groups increased in terms of both population and built-up area between 2004 and 2010, except group 5 at the high-density level. For example, the built-up areas of the districts (populated pixels) for the very high-density areas (group 7) with population density larger than 4000 persons km−2 show a significant increase of 22% from 667 km2 in 2004 to 815 km2 in 2010. As a consequence, these districts reported a population increase of 27% from 3.3 million in 2004 to 4.2 million in 2010, and most of these districts are located in Riyadh governorate. On the other hand, the built-up areas of the districts with low-density areas (1–250 persons km−2) are the largest category with values of 1735 km2 and 2785 km2 in 2004 and 2010, respectively. These low-density areas are concentrated in Kharj, Wadi Aldawaser, and Dawadmi governorates, reflecting the importance of agricultural areas within these governorates.
Figure 10 shows the spatial distribution of population change in Riyadh province between 2004 and 2010. It indicates clear inequalities because Riyadh governorate attracted 84% (1.1 million) of the total increase (1.3 million). Meanwhile, the other governorates show small population increases ranging from 1 to 100 persons per km2, represented in green in Figure 10. It is noticeable that a population increase between 101 to 500 persons per km2 is the dominant pattern in Riyadh city, whereas the population growth of more than 1000 persons per km2 is concentrated in the eastern and southern parts of Riyadh city, reflecting lower land prices in these areas.
The findings of this research may be of great importance for Saudi agencies and commissions as well as for other nation states in semi-arid and arid regions of the world. For example, in Saudi Arabia, the RCRC and MOMRAH could use this information to ensure balanced socio-economic development between governorates to achieve sustainable development in Riyadh province. The gridded population dataset has important potential for supporting the evaluation of the current state of the health and education services at the province scale and for drawing up plans and policies to mitigate shortages in these services. In addition, it may be used as a basis for a variety of other socio-economic applications because (1) it is the first detailed and accurate product and (2) it avoids significant biases in other products.

5. Discussion

DMSP-OLS nighttime lights data have been widely used for population mapping at different spatial levels [3,7,24]. However, the character of nighttime lights data has some limitations including the coarse spatial (1 km) and radiometric (6-bit) resolutions, resulting in overglow and saturation effects [13]. Thus, different methods have been developed to reduce the uncertainty in the DMSP-OLS nighttime data, for example, the HSI [23], VANUI [33], and RCNTL products [43].
This research developed a new index, based on NTL, vegetation, and bare land data, called the Vegetation-Bare Adjusted NTL Index (VBANTLI) to (1) account for the uncertainty in the NTL data and then (2) downscale census population data to a spatial resolution of 1 km in Riyadh province, in the Arabian Gulf, a region that has received little attention.
The accuracy of the VBANTLI was examined by comparing it with CNTL, HSI, VANUI, and RCNTL variables. Visual comparison across the components of Figure 4 confirms that the CNTL fails to reveal spatial variation across populated areas. In comparison, the HSI does capture inter- and intra-populated variabilities but is greatly overestimated (Figure 4b). A functional problem of the HSI index is that it appears in unpopulated areas. For example, bare land areas with small NDVI values and large NTL values would be recorded with a large HSI value that is close or similar to those of built-up areas. Thus, the HSI model produced the lowest accuracies in model calibration (R = 0.14) and model validation (MRE = 152%).
Although the VANUI model revealed a degree of spatial variation (Figure 4c), the coefficients were not increased compared with the CNTL model (R = 0.81, MRE = 74% and R = 0.81, MRE = 72%, respectively). The limited contribution of the VANUI in reducing the overglow and saturation effects in this research is due to (1) the type of urban morphology in Riyadh region which includes sparse vegetated areas within the populated areas and (2) the similarity of NDVI values between unpopulated (bare lands) and populated (built-up areas) areas. The un-populated areas have two side effects: (1) they lead to a decrease in the density of the dependent variable and (2) the models distribute population into vacant places.
In contrast to the above models, the RCNTL (Model 4) and the VBANTLI (Model 5) were the most accurate models in the calibration (R = 0.99 and 0.98) and validation (MRE = 45% and 37%) phases, respectively. It is clear that the newly developed index (VBANTLI) is more accurate than Model 4 because the RCNTL product does not guarantee that un-populated areas have an intensity light value of 0. By visual inspection using Landsat data, acquired in 2013, it is found that un-populated areas were assigned different light intensity values based on their locations in relation to the populated areas. Therefore, integrating vegetation and bare land covers is suggested as a highly effective strategy for reducing the uncertainty in the nighttime imagery, particularly reflectance from unpopulated areas, increasing the accuracy of the population spatialization model. As expected, Riyadh city accounted for the highest percentage of the population, reflecting the availability of job opportunities, services, and utilities.
The accuracy of any population model is influenced greatly by the spatial resolution and accuracy of the source land use/cover data. The VBANTLI model was developed based on CNTL, SPOT-5 vegetation land cover (10 m), and MODIS bare land cover (500 m) data. The coarse spatial resolution of the MODIS land cover data is a source of uncertainty due to the mixed pixel problem (i.e., a pixel can represent more than one land use/cover class). The VBANTLI accounts for the overglow and saturation effects in un-populated areas but overglow and saturation are still an issue within the populated areas.
Future research should focus on incorporating: (1) ancillary data, for example, detailed land use/cover data [7], data on impervious surface area [50], climate data such as land surface temperature [51], and geospatial data such as points of interest [52] to further resolve the spatial heterogeneity within human settlements and (2) finer spatial and radiometric resolution nighttime lights data and on-board calibrated data such as from the Visible Infrared Imager Radiometer Suite (VIIRS) [53] and Luojia 1-01 [54].
Finally, population estimation at 1 km spatial resolution is important for a range of environmental and socioeconomic perspectives at the regional, national, and global scales and is of value to multiple Saudi agencies and international organizations.

6. Conclusions

Nighttime remotely sensed data have been utilized widely to estimate population distributions at the global, national, and provincial levels. However, the nighttime data suffer from uncertainties due to their coarse spatial and radiometric resolutions. Different methods have been developed to minimize the uncertainty in the NTL data. Of these methods, NDVI and EVI were the most commonly used ancillary indices to maximize the usefulness of the NTL product. Unfortunately, vegetation indices have little influence on the NTL data where regions have only sparse vegetation cover, particularly within populated areas.
This research demonstrates the application of NTL data to downscale population from the governorate-census level to gridded maps of Riyadh province at 1 km spatial resolution for 2004 and 2010. In this research, the uncertainty of the NTL data was diminished by developing a new index called the vegetation-bare adjusted NTL index, VBANTLI, by combining nighttime, vegetation, and bare land information. The efficiency of the VBANTLI was assessed through visual comparisons with the CNTL, HSI, VANUI, and RCNTL products (Figure 4 and Figure 5). The VBANTLI greatly clarified the spatial heterogeneity within the populated areas, more so than the other remotely sensed products. Furthermore, statistical comparisons were conducted between census population data and the CNTL, HSI, VANUI, RCNTL, and VBANTLI products at the governorate level by computing the correlation coefficient (R). The VBANTLI product produced the largest correlation with the census population data with an R value of 0.98, compared with the other remotely sensed products.
Dasymetric mapping was applied to downscale the census population to a grid of 1 km spatial resolution. Five population spatialization models and the WorldPop dataset were assessed. The VBANTLI (Model 5) outperformed four benchmark models as well as the WorldPop dataset, confirming its potential utility to (1) mitigate the overglow and saturation effects in the NTL data and (2) accurately map urban population. Using the newly generated fine-resolution maps, it was observed that most of the population was distributed in Riyadh governorate, as expected due to the availability of socio-economic opportunities. The proposed index represents an important advance in population mapping that is of great relevance to nations in the semi-arid and arid regions of the world. It has the potential to transform the utility of nightlights data in these regions for the purposes of land management and planning.

Author Contributions

Conceptualization, data curation, formal analysis, investigation, methodology, writing—original draft, M.A.; investigation, methodology, writing–review and editing, S.M., P.A., and D.M. All authors have read and agreed to the published version of the manuscript.

Funding

This research received no external funding.

Acknowledgments

The authors acknowledge support from King Abdulaziz City for Science and Technology (KACST), Royal Commission for Riyadh City (RCRC), and General Authority for Statistics (GASTAT). The authors would like to thank Adel Alfassam from RCRC for his help in obtaining the spatial information.

Conflicts of Interest

The authors declare no conflict of interest.

References

  1. United Nations. World Population Prospects 2019: Highlights; Department of Economic and Social Affairs Population Division: New York, NY, USA, 2019. [Google Scholar]
  2. Li, X.; Zhou, Y. Urban mapping using DMSP/OLS stable night-time light: A review. Int. J. Remote Sens. 2017, 38, 6030–6046. [Google Scholar] [CrossRef]
  3. Wang, L.; Wang, S.; Zhou, Y.; Liu, W.; Hou, Y.; Zhu, J.; Wang, F. Mapping population density in China between 1990 and 2010 using remote sensing. Remote Sens. Environ. 2018, 210, 269–281. [Google Scholar] [CrossRef]
  4. Yang, X.; Yue, W.; Gao, D. Spatial improvement of human population distribution based on multi-sensor remote-sensing data: An input for exposure assessment. Int. J. Remote Sens. 2013, 34, 5569–5583. [Google Scholar] [CrossRef]
  5. Liu, Z.; He, C.; Zhang, Q.; Huang, Q.; Yang, Y. Extracting the dynamics of urban expansion in China using DMSP-OLS nighttime light data from 1992 to 2008. Landsc. Urban Plan. 2012, 106, 62–72. [Google Scholar] [CrossRef]
  6. Alahmadi, M.; Atkinson, P.M. Three-Fold Urban Expansion in Saudi Arabia from 1992 to 2013 Observed Using Calibrated DMSP-OLS Night-Time Lights Imagery. Remote Sens. 2019, 11, 2266. [Google Scholar] [CrossRef] [Green Version]
  7. Li, X.; Zhou, W. Dasymetric mapping of urban population in China based on radiance corrected DMSP-OLS nighttime light and land cover data. Sci. Total Environ. 2018, 643, 1248–1256. [Google Scholar] [CrossRef]
  8. Tan, M.; Li, X.; Li, S.; Xin, L.; Wang, X.; Li, Q.; Xiang, W. Modeling population density based on nighttime light images and land use data in China. Appl. Geogr. 2018, 90, 239–247. [Google Scholar] [CrossRef]
  9. Wu, J.; Wang, Z.; Li, W.; Peng, J. Exploring factors affecting the relationship between light consumption and GDP based on DMSP/OLS nighttime satellite imagery. Remote Sens. Environ. 2013, 134, 111–119. [Google Scholar] [CrossRef]
  10. Wang, X.; Sutton, P.C.; Qi, B. Global Mapping of GDP at 1 km2 Using VIIRS Nighttime Satellite Imagery. ISPRS Int. J. Geo-Inf. 2019, 8, 580. [Google Scholar] [CrossRef] [Green Version]
  11. Shi, K.; Chen, Y.; Yu, B.; Xu, T.; Chen, Z.; Liu, R.; Wu, J. Modeling spatiotemporal CO2 (carbon dioxide) emission dynamics in China from DMSP-OLS nighttime stable light data using panel data analysis. Appl. Energy 2016, 168, 523–533. [Google Scholar] [CrossRef]
  12. Zhang, X.; Wu, J.; Peng, J.; Cao, Q. The uncertainty of nighttime light data in estimating carbon dioxide emissions in China: A comparison between DMSP-OLS and NPP-VIIRS. Remote Sens. 2017, 9, 797. [Google Scholar] [CrossRef] [Green Version]
  13. Elvidge, C.D.; Cinzano, P.; Pettit, D.R.; Arvesen, J.; Sutton, P.; Small, C.; Ebener, S. The Nightsat mission concept. Int. J. Remote Sens. 2007, 28, 2645–2670. [Google Scholar] [CrossRef]
  14. Small, C.; Pozzi, F.; Elvidge, C.D. Spatial analysis of global urban extent from DMSP-OLS night lights. Remote Sens. Environ. 2005, 96, 277–291. [Google Scholar] [CrossRef]
  15. Ma, T.; Zhou, C.; Pei, T.; Haynie, S.; Fan, J. Quantitative estimation of urbanization dynamics using time series of DMSP/OLS nighttime light data: A comparative case study from China’s cities. Remote Sens. Environ. 2012, 124, 99–107. [Google Scholar] [CrossRef]
  16. Bagan, H.; Yamagata, Y. Analysis of urban growth and estimating population density using satellite images of nighttime lights and land-use and population data. GISci. Remote Sens. 2015, 52, 765–780. [Google Scholar] [CrossRef]
  17. Lu, H.; Zhang, M.; Sun, W.; Li, W. Expansion analysis of yangtze river delta urban agglomeration using dmsp/ols nighttime light imagery for 1993 to 2012. ISPRS Int. J. Geo-Inf. 2018, 7, 52. [Google Scholar] [CrossRef] [Green Version]
  18. Cao, X.; Chen, J.; Imura, H.; Higashi, O. A SVM-based method to extract urban areas from DMSP-OLS and SPOT VGT data. Remote Sens. Environ. 2009, 113, 2205–2209. [Google Scholar] [CrossRef]
  19. Pandey, B.; Joshi, P.; Seto, K.C. Monitoring urbanization dynamics in India using DMSP/OLS night time lights and SPOT-VGT data. Int. J. Appl. Earth Obs. Geoinf. 2013, 23, 49–61. [Google Scholar] [CrossRef]
  20. Zhou, Y.; Smith, S.J.; Elvidge, C.D.; Zhao, K.; Thomson, A.; Imhoff, M. A cluster-based method to map urban area from DMSP/OLS nightlights. Remote Sens. Environ. 2014, 147, 173–185. [Google Scholar] [CrossRef]
  21. Jing, W.; Yang, Y.; Yue, X.; Zhao, X. Mapping urban areas with integration of DMSP/OLS nighttime light and MODIS data using machine learning techniques. Remote Sens. 2015, 7, 12419–12439. [Google Scholar] [CrossRef] [Green Version]
  22. Sun, W.; Zhang, X.; Wang, N.; Cen, Y. Estimating population density using DMSP-OLS night-time imagery and land cover data. IEEE J. Sel. Top. Appl. Earth Obs. Remote Sens. 2017, 10, 2674–2684. [Google Scholar] [CrossRef]
  23. Lu, D.; Tian, H.; Zhou, G.; Ge, H. Regional mapping of human settlements in southeastern China with multisensor remotely sensed data. Remote Sens. Environ. 2008, 112, 3668–3679. [Google Scholar] [CrossRef]
  24. Yu, S.; Zhang, Z.; Liu, F. Monitoring population evolution in China using time-series DMSP/OLS nightlight imagery. Remote Sens. 2018, 10, 194. [Google Scholar] [CrossRef] [Green Version]
  25. Milesi, C.; Elvidge, C.D.; Nemani, R.R.; Running, S.W. Assessing the impact of urban land development on net primary productivity in the southeastern United States. Remote Sens. Environ. 2003, 86, 401–410. [Google Scholar] [CrossRef]
  26. Henderson, M.; Yeh, E.T.; Gong, P.; Elvidge, C.; Baugh, K. Validation of urban boundaries derived from global night-time satellite imagery. Int. J. Remote Sens. 2003, 24, 595–609. [Google Scholar] [CrossRef]
  27. Yu, B.; Shu, S.; Liu, H.; Song, W.; Wu, J.; Wang, L.; Chen, Z. Object-based spatial cluster analysis of urban landscape pattern using nighttime light satellite images: A case study of China. Int. J. Geogr. Inf. Sci. 2014, 28, 2328–2355. [Google Scholar] [CrossRef]
  28. He, C.; Shi, P.; Li, J.; Chen, J.; Pan, Y.; Li, J.; Ichinose, T. Restoring urbanization process in China in the 1990s by using non-radiance-calibrated DMSP/OLS nighttime light imagery and statistical data. Chin. Sci. Bull. 2006, 51, 1614–1620. [Google Scholar] [CrossRef]
  29. Wei, Y.; Liu, H.; Song, W.; Yu, B.; Xiu, C. Normalization of time series DMSP-OLS nighttime light images for urban growth analysis with pseudo invariant features. Landsc. Urban Plan. 2014, 128, 1–13. [Google Scholar] [CrossRef]
  30. Zhang, Q.; Wang, P.; Chen, H.; Huang, Q.; Jiang, H.; Zhang, Z.; Sun, S. A novel method for urban area extraction from VIIRS DNB and MODIS NDVI data: A case study of Chinese cities. Int. J. Remote Sens. 2017, 38, 6094–6109. [Google Scholar] [CrossRef]
  31. Forster, B.C. Principles and Tools for Remote Sensing of Human Settlements. In Remote Sensing of Human Settlements: Manual of Remote Sensing; Ridd, M.K., Hipple, J.D., Eds.; ASPRS: Bethesda, MD, USA, 2006; Volume 5, pp. 37–147. [Google Scholar]
  32. Xu, H. Analysis of impervious surface and its impact on urban heat environment using the normalized difference impervious surface index (NDISI). Photogramm. Eng. Remote Sens. 2010, 76, 557–565. [Google Scholar] [CrossRef]
  33. Zhang, Q.; Schaaf, C.; Seto, K.C. The vegetation adjusted NTL urban index: A new approach to reduce saturation and increase variation in nighttime luminosity. Remote Sens. Environ. 2013, 129, 32–41. [Google Scholar] [CrossRef]
  34. Liu, X.; Hu, G.; Ai, B.; Li, X.; Shi, Q. A normalized urban areas composite index (NUACI) based on combination of DMSP-OLS and MODIS for mapping impervious surface area. Remote Sens. 2015, 7, 17168–17189. [Google Scholar] [CrossRef] [Green Version]
  35. Ma, T.; Xu, T.; Huang, L.; Zhou, A. A human settlement composite index (HSCI) derived from nighttime luminosity associated with imperviousness and vegetation indexes. Remote Sens. 2018, 10, 455. [Google Scholar] [CrossRef] [Green Version]
  36. Gaughan, A.E.; Stevens, F.R.; Linard, C.; Jia, P.; Tatem, A.J. High resolution population distribution maps for Southeast Asia in 2010 and 2015. PLoS ONE 2013, 8, e55882. [Google Scholar]
  37. WorldPop. Available online: https://www.worldpop.org/doi/10.5258/SOTON/WP00645 (accessed on 1 February 2021).
  38. Population Counts. Available online: https://www.worldpop.org/doi/10.5258/SOTON/WP00227 (accessed on 1 February 2021).
  39. Liang, D.; Zuo, Y.; Huang, L.; Zhao, J.; Teng, L.; Yang, F. Evaluation of the consistency of MODIS Land Cover Product (MCD12Q1) based on Chinese 30 m GlobeLand30 datasets: A case study in Anhui Province, China. ISPRS Int. J. Geo-Inf. 2015, 4, 2519–2541. [Google Scholar] [CrossRef] [Green Version]
  40. Li, G.; Zhang, F.; Jing, Y.; Liu, Y.; Sun, G. Response of evapotranspiration to changes in land use and land cover and climate in China during 2001–2013. Sci. Total Environ. 2017, 596, 256–265. [Google Scholar] [CrossRef] [PubMed]
  41. Sulla-Menashe, D.; Gray, J.M.; Abercrombie, S.P.; Friedl, M.A. Hierarchical mapping of annual global land cover 2001 to present: The MODIS Collection 6 Land Cover product. Remote Sens. Environ. 2019, 222, 183–194. [Google Scholar] [CrossRef]
  42. Li, X.; Zhou, Y. A stepwise calibration of global DMSP/OLS stable nighttime light data (1992–2013). Remote Sens. 2017, 9, 637. [Google Scholar]
  43. Hsu, F.-C.; Baugh, K.E.; Ghosh, T.; Zhizhin, M.; Elvidge, C.D. DMSP-OLS radiance calibrated nighttime lights time series with intercalibration. Remote Sens. 2015, 7, 1855–1876. [Google Scholar] [CrossRef] [Green Version]
  44. Ministry of Housing. White Lands; Ministry of Housing: Riyadh, Saudi Arabia, 2016.
  45. Schneider, A.; Friedl, M.A.; Potere, D. A new map of global urban extent from MODIS satellite data. Environ. Res. Lett. 2009, 4, 044003. [Google Scholar] [CrossRef] [Green Version]
  46. MEWA. Geodatabase Design for the Agricultural Areas in Saudi Arabia; MEWA: Riyadh, Saudi Arabia, 2011. [Google Scholar]
  47. Goodchild, M.F.; Lam, N.S.-N. Areal interpolation: A variant of the traditional spatial problem. Geo-Processing 1980, 1, 297–312. [Google Scholar]
  48. Eicher, C.L.; Brewer, C.A. Dasymetric mapping and areal interpolation: Implementation and evaluation. Cartogr. Geogr. Inf. Sci. 2001, 28, 125–138. [Google Scholar] [CrossRef]
  49. Riyadh Principality. Governorates of Riyadh Province. 2021. Available online: https://www.riyadh.gov.sa/ar/pages/provinces.aspx (accessed on 23 February 2021).
  50. Guo, W.; Lu, D.; Kuang, W. Improving fractional impervious surface mapping performance through combination of DMSP-OLS and MODIS NDVI data. Remote Sens. 2017, 9, 375. [Google Scholar] [CrossRef] [Green Version]
  51. Li, F.; Yan, Q.; Bian, Z.; Liu, B.; Wu, Z. A POI and LST Adjusted NTL Urban Index for Urban Built-Up Area Extraction. Sensors 2020, 20, 2918. [Google Scholar] [CrossRef]
  52. Ye, T.; Zhao, N.; Yang, X.; Ouyang, Z.; Liu, X.; Chen, Q.; Li, Z. Improved population mapping for China using remotely sensed and points-of-interest data within a random forests model. Sci. Total Environ. 2019, 658, 936–946. [Google Scholar] [CrossRef] [PubMed]
  53. He, M.; Xu, Y.; Li, N. Population Spatialization in Beijing City Based on Machine Learning and Multisource Remote Sensing Data. Remote Sens. 2020, 12, 1910. [Google Scholar] [CrossRef]
  54. Wang, L.; Fan, H.; Wang, Y. Improving population mapping using Luojia 1-01 nighttime light image and location-based social media data. Sci. Total Environ. 2020, 730, 139148. [Google Scholar] [CrossRef] [PubMed]
Figure 1. Location of Riyadh province and its 20 governorates within Saudi Arabia, showing Calibrated Night-Time Light (CNTL) values.
Remotesensing 13 01171 g001
Figure 2. Longitudinal transects of Riyadh and Kharj cities from north to south over (a) CNTL and (b) vegetation-bare proportion.
Remotesensing 13 01171 g002
Figure 3. Flowchart of the methodology for downscaling the census population data.
Remotesensing 13 01171 g003
Figure 4. Longitudinal transects of Riyadh and Alkharj cities from north to south over (a) CNTL; (b) Human Settlement Index (HSI); (c) Vegetation Adjusted Normalized Urban Index (VANUI); (d) RCNTL and (e) the Vegetation-Bare Adjusted NTL Index (VBANTLI).
Remotesensing 13 01171 g004
Figure 5. Comparison of (a) Landsat-8; (b) CNTL; (c) HSI; (d) VANUI; (e) RCNTL; and (f) VBANTLI of Riyadh, Kharj, and Wadi Aldawaser cities, respectively.
Remotesensing 13 01171 g005
Figure 6. Correlation of the log of (a) CNTL, (b) HSI, (c) VANUI, (d) RCNTL, (e) VBANTLI on the log of urban population in 2010 at the governorate level in Riyadh province.
Remotesensing 13 01171 g006
Figure 7. Validation of the simulated population in 2010 using (a) CNTL, (b) HSI, (c) VANUI, (d) RCNTL, (e) VBANTLI and (f) WorldPop.
Remotesensing 13 01171 g007
Figure 8. Spatial pattern of population estimates in Riyadh province in 2004.
Remotesensing 13 01171 g008
Figure 9. Spatial pattern of population estimates in Riyadh province in 2010.
Remotesensing 13 01171 g009
Figure 10. Urban population change in Riyadh province during 2004 and 2010.
Remotesensing 13 01171 g010
Table 1. Summary of sensor data, statistics, and GIS data used to develop and validate alternative population estimation models.
DatasetFormat and DateResolution or ScaleSource
DMSP-OLS nighttime dataGrid (2004 and 2010)1 kmNational Oceanic and Atmospheric Administration/National Geographical Data Center (NOAA/NGDC).
DMSP-OLS radiance calibrated nighttime data Grid (2004 and 2010)1 kmNational Oceanic and Atmospheric Administration/National Geographical Data Center (NOAA/NGDC)
MODIS land cover dataGrid (2004 and 2010)500 mNASA-LAADS Web
Vegetation land cover Grid (2010–2011)10 mMinistry of Environment Water and Agriculture (MEWA)
WorldPop dataGrid (2004 and 2010)100 mWorldPop Web
Census population dataTable (2004 and 2010)GovernorateGeneral Authority for Statistics (GASTAT)
Census population dataShape (2004 and 2010)MunicipalityRoyal Commission for Riyadh City (RCRC)
Table 2. Changes in population estimates and built-up areas in 2004 and 2010 in Riyadh province.
20042010
Density TypeGroup No.Population Density (Persons/km2)Built-Up Area (km2)Population EstimatesBuilt-Up Areas (km2)Population Estimates
Low-density areas11–2501735165,6532785239,213
2251–500444157,650620223,847
Medium-density areas3501–1000463334,172608428,116
High-density areas41001–2000411567,281532721,941
52001–3000198485,885170428,544
Very high-density areas63001–4000107389,839118456,811
7>40006773,357,7938154,278,673
Publisher’s Note: MDPI stays neutral with regard to jurisdictional claims in published maps and institutional affiliations.

