
Long-Term Subsidence Monitoring of the Alluvial Plain of the Scheldt River in Antwerp (Belgium) Using Radar Interferometry

 , and
, and
Abstract
1. Introduction
2. Geographical and Geological Settings of the Studied Area
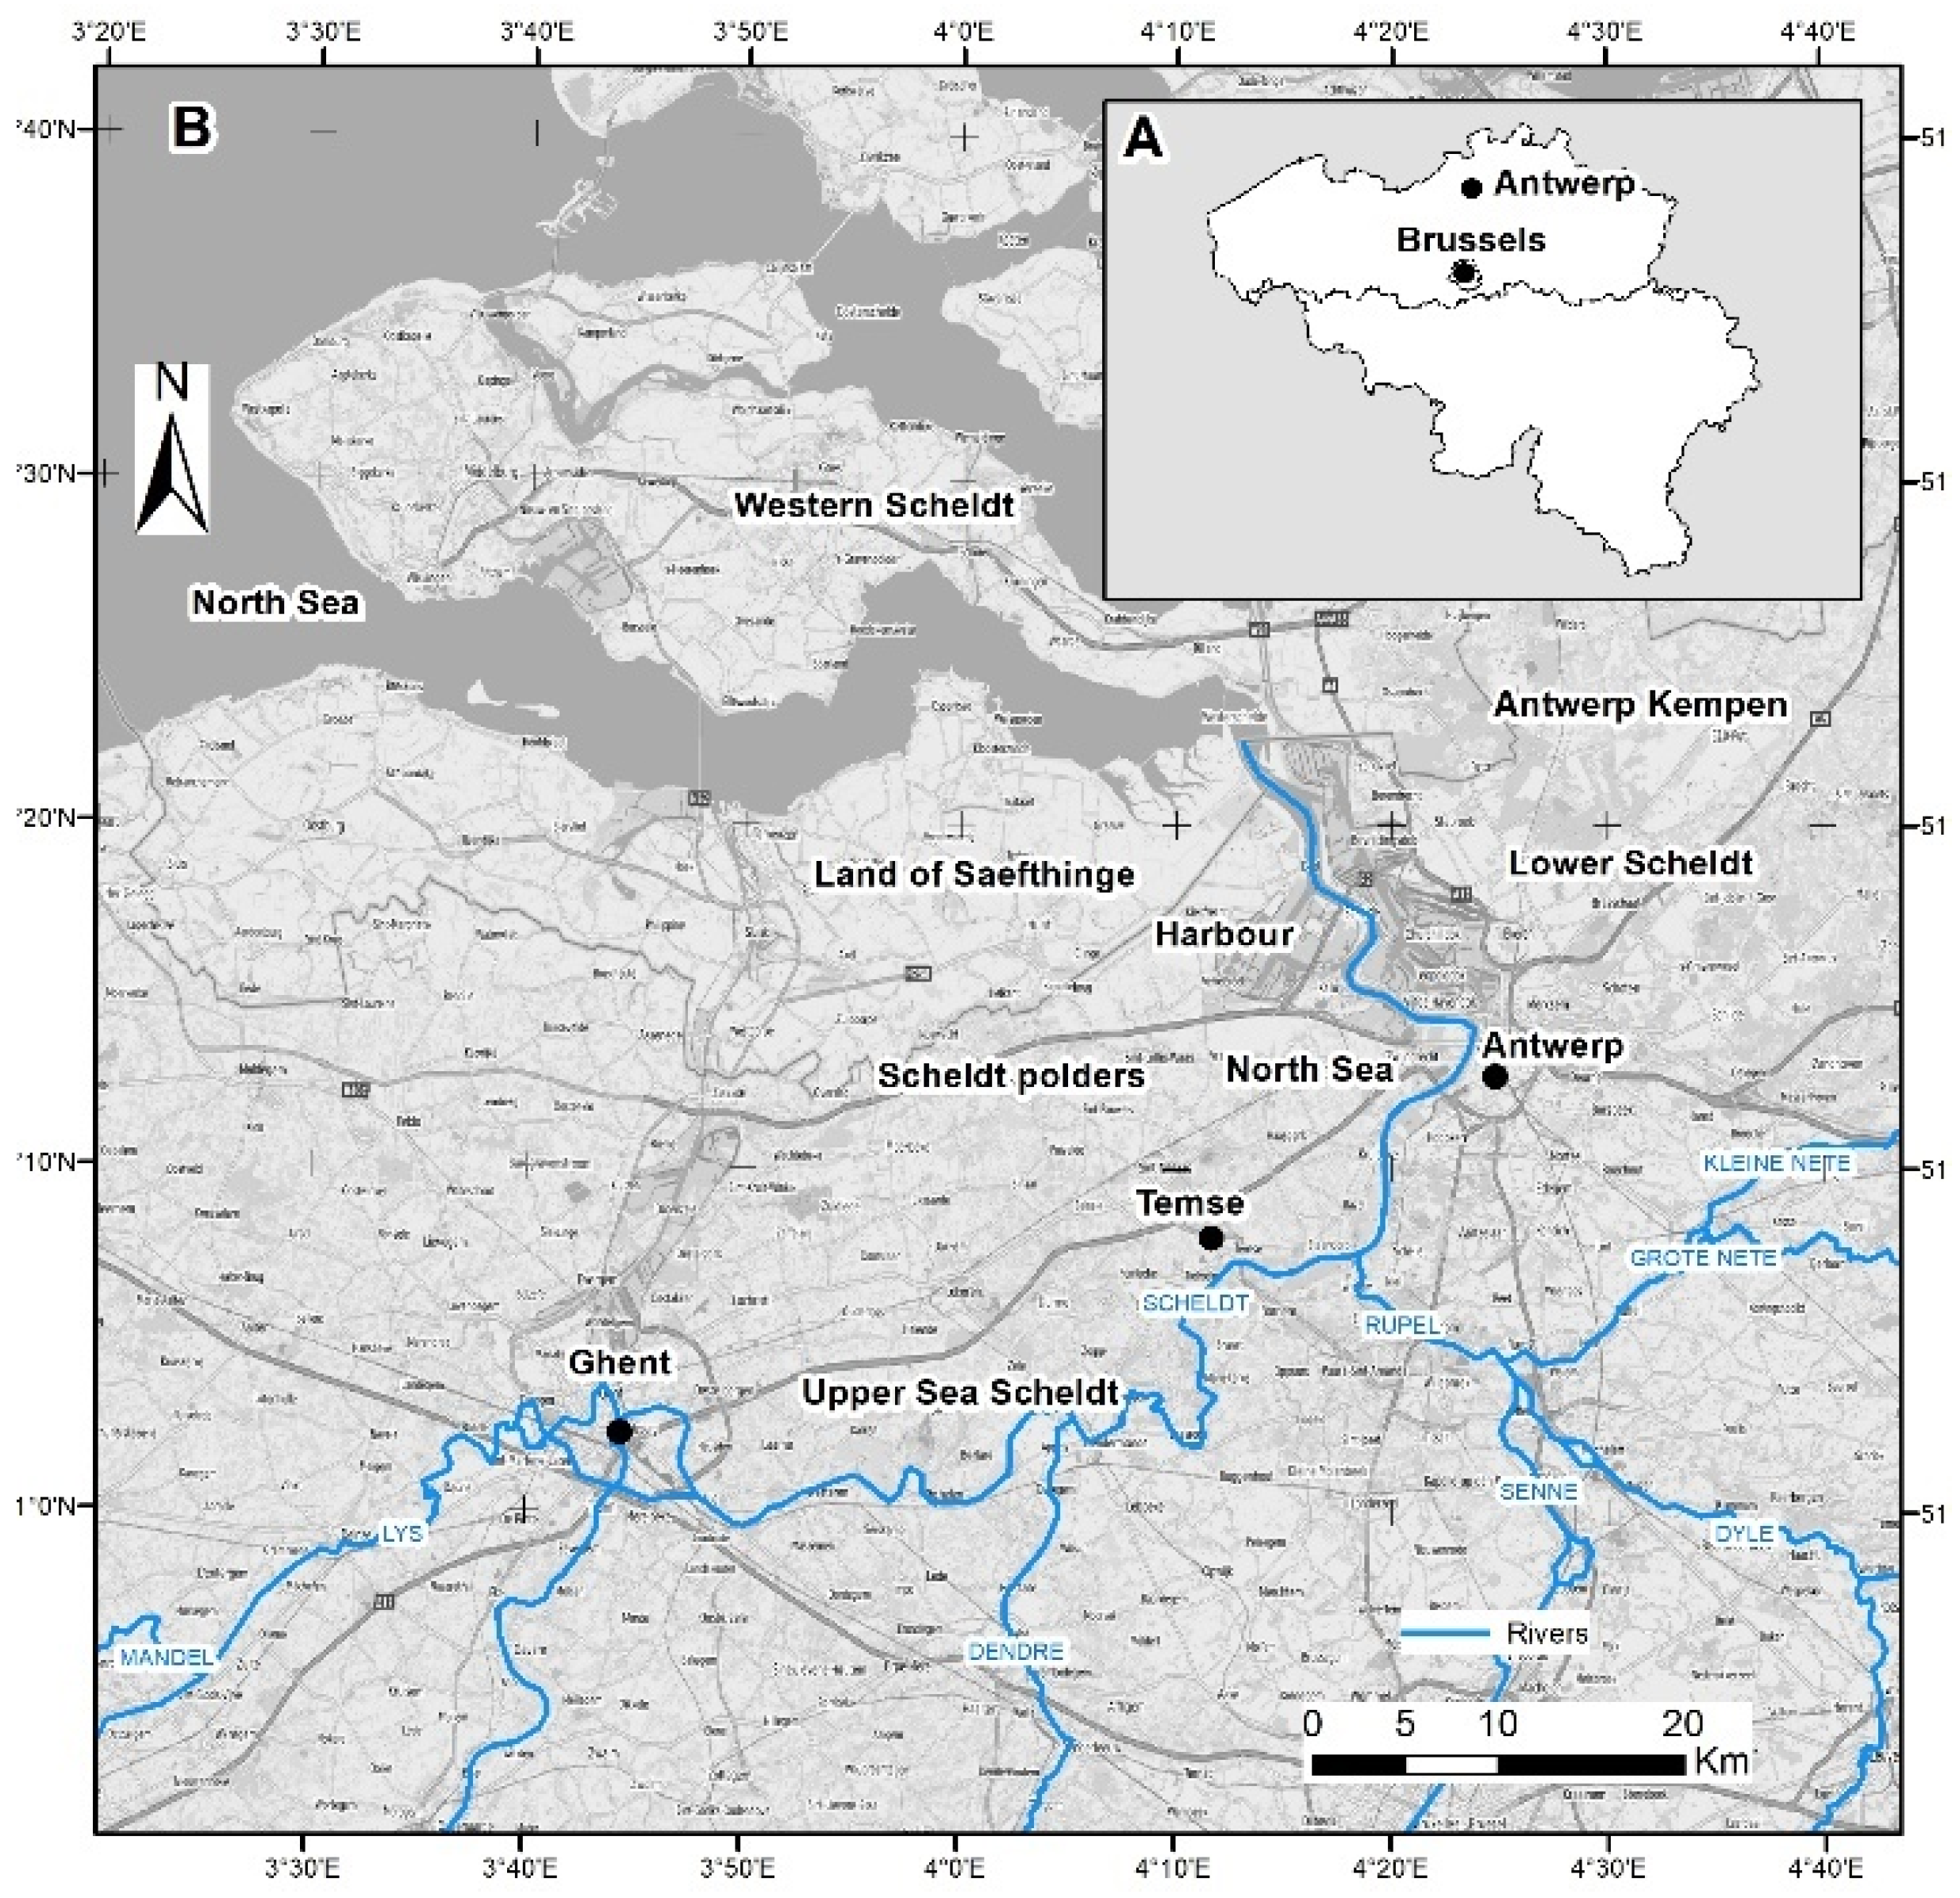
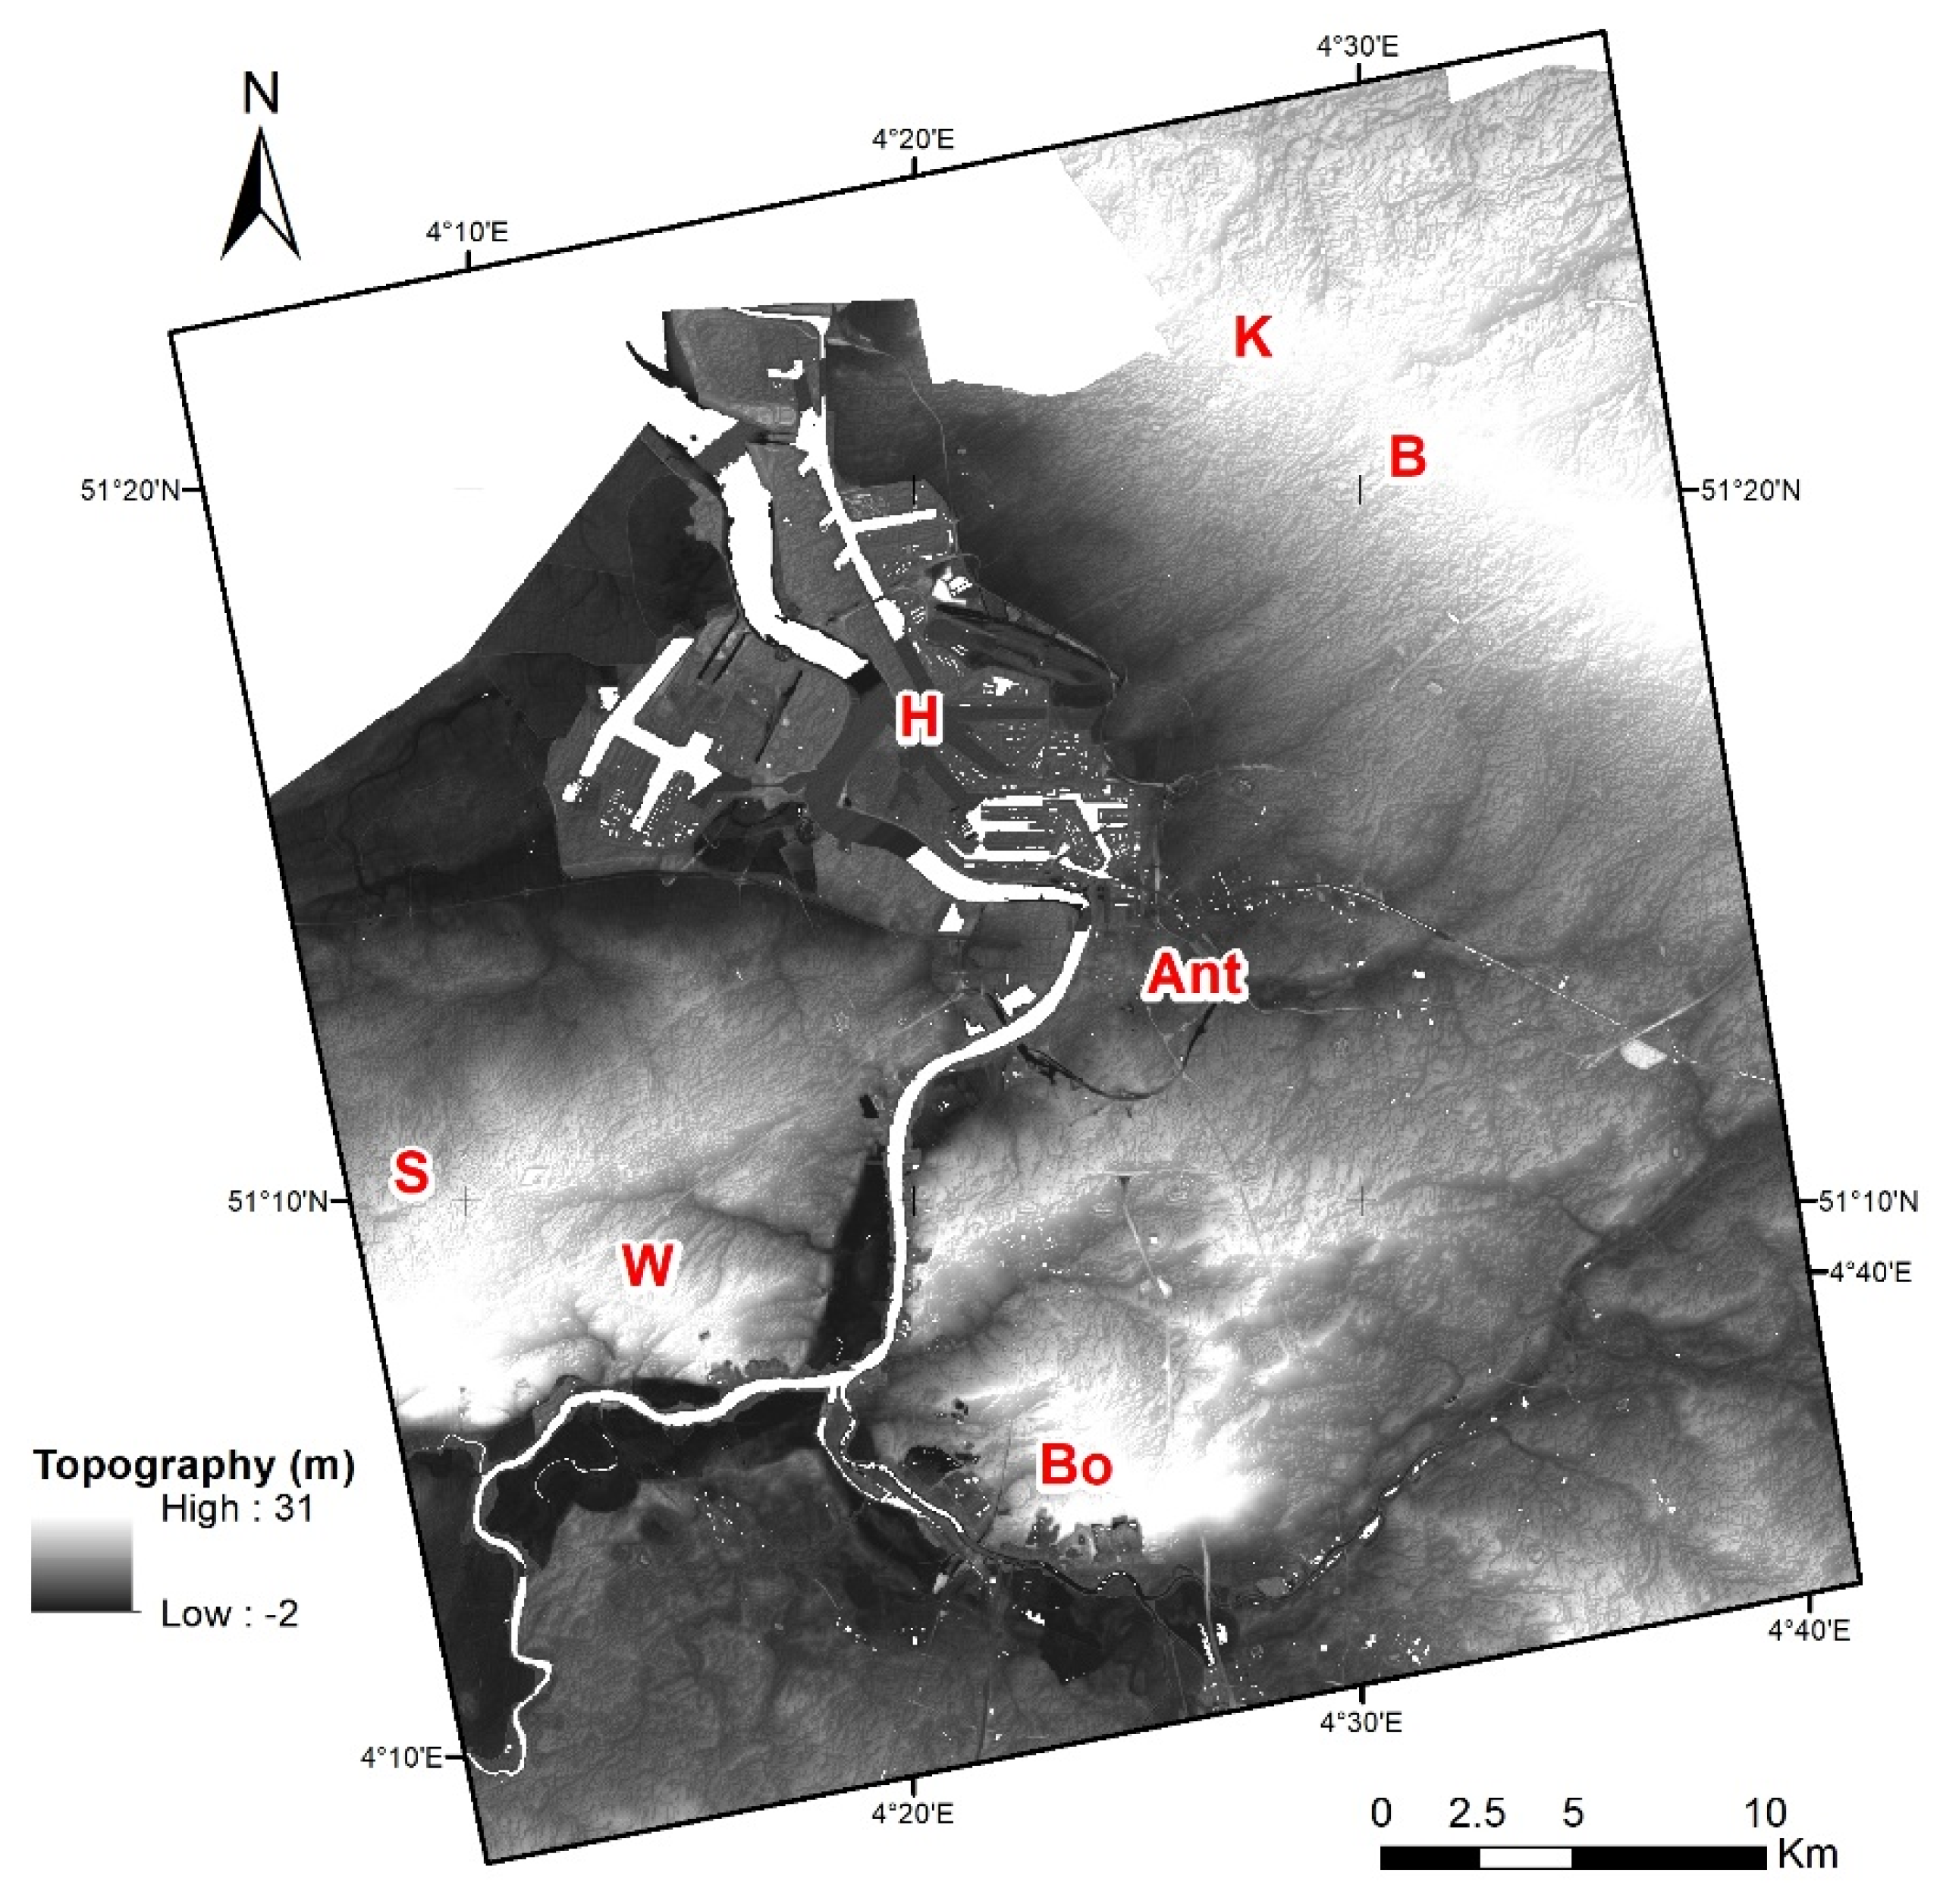
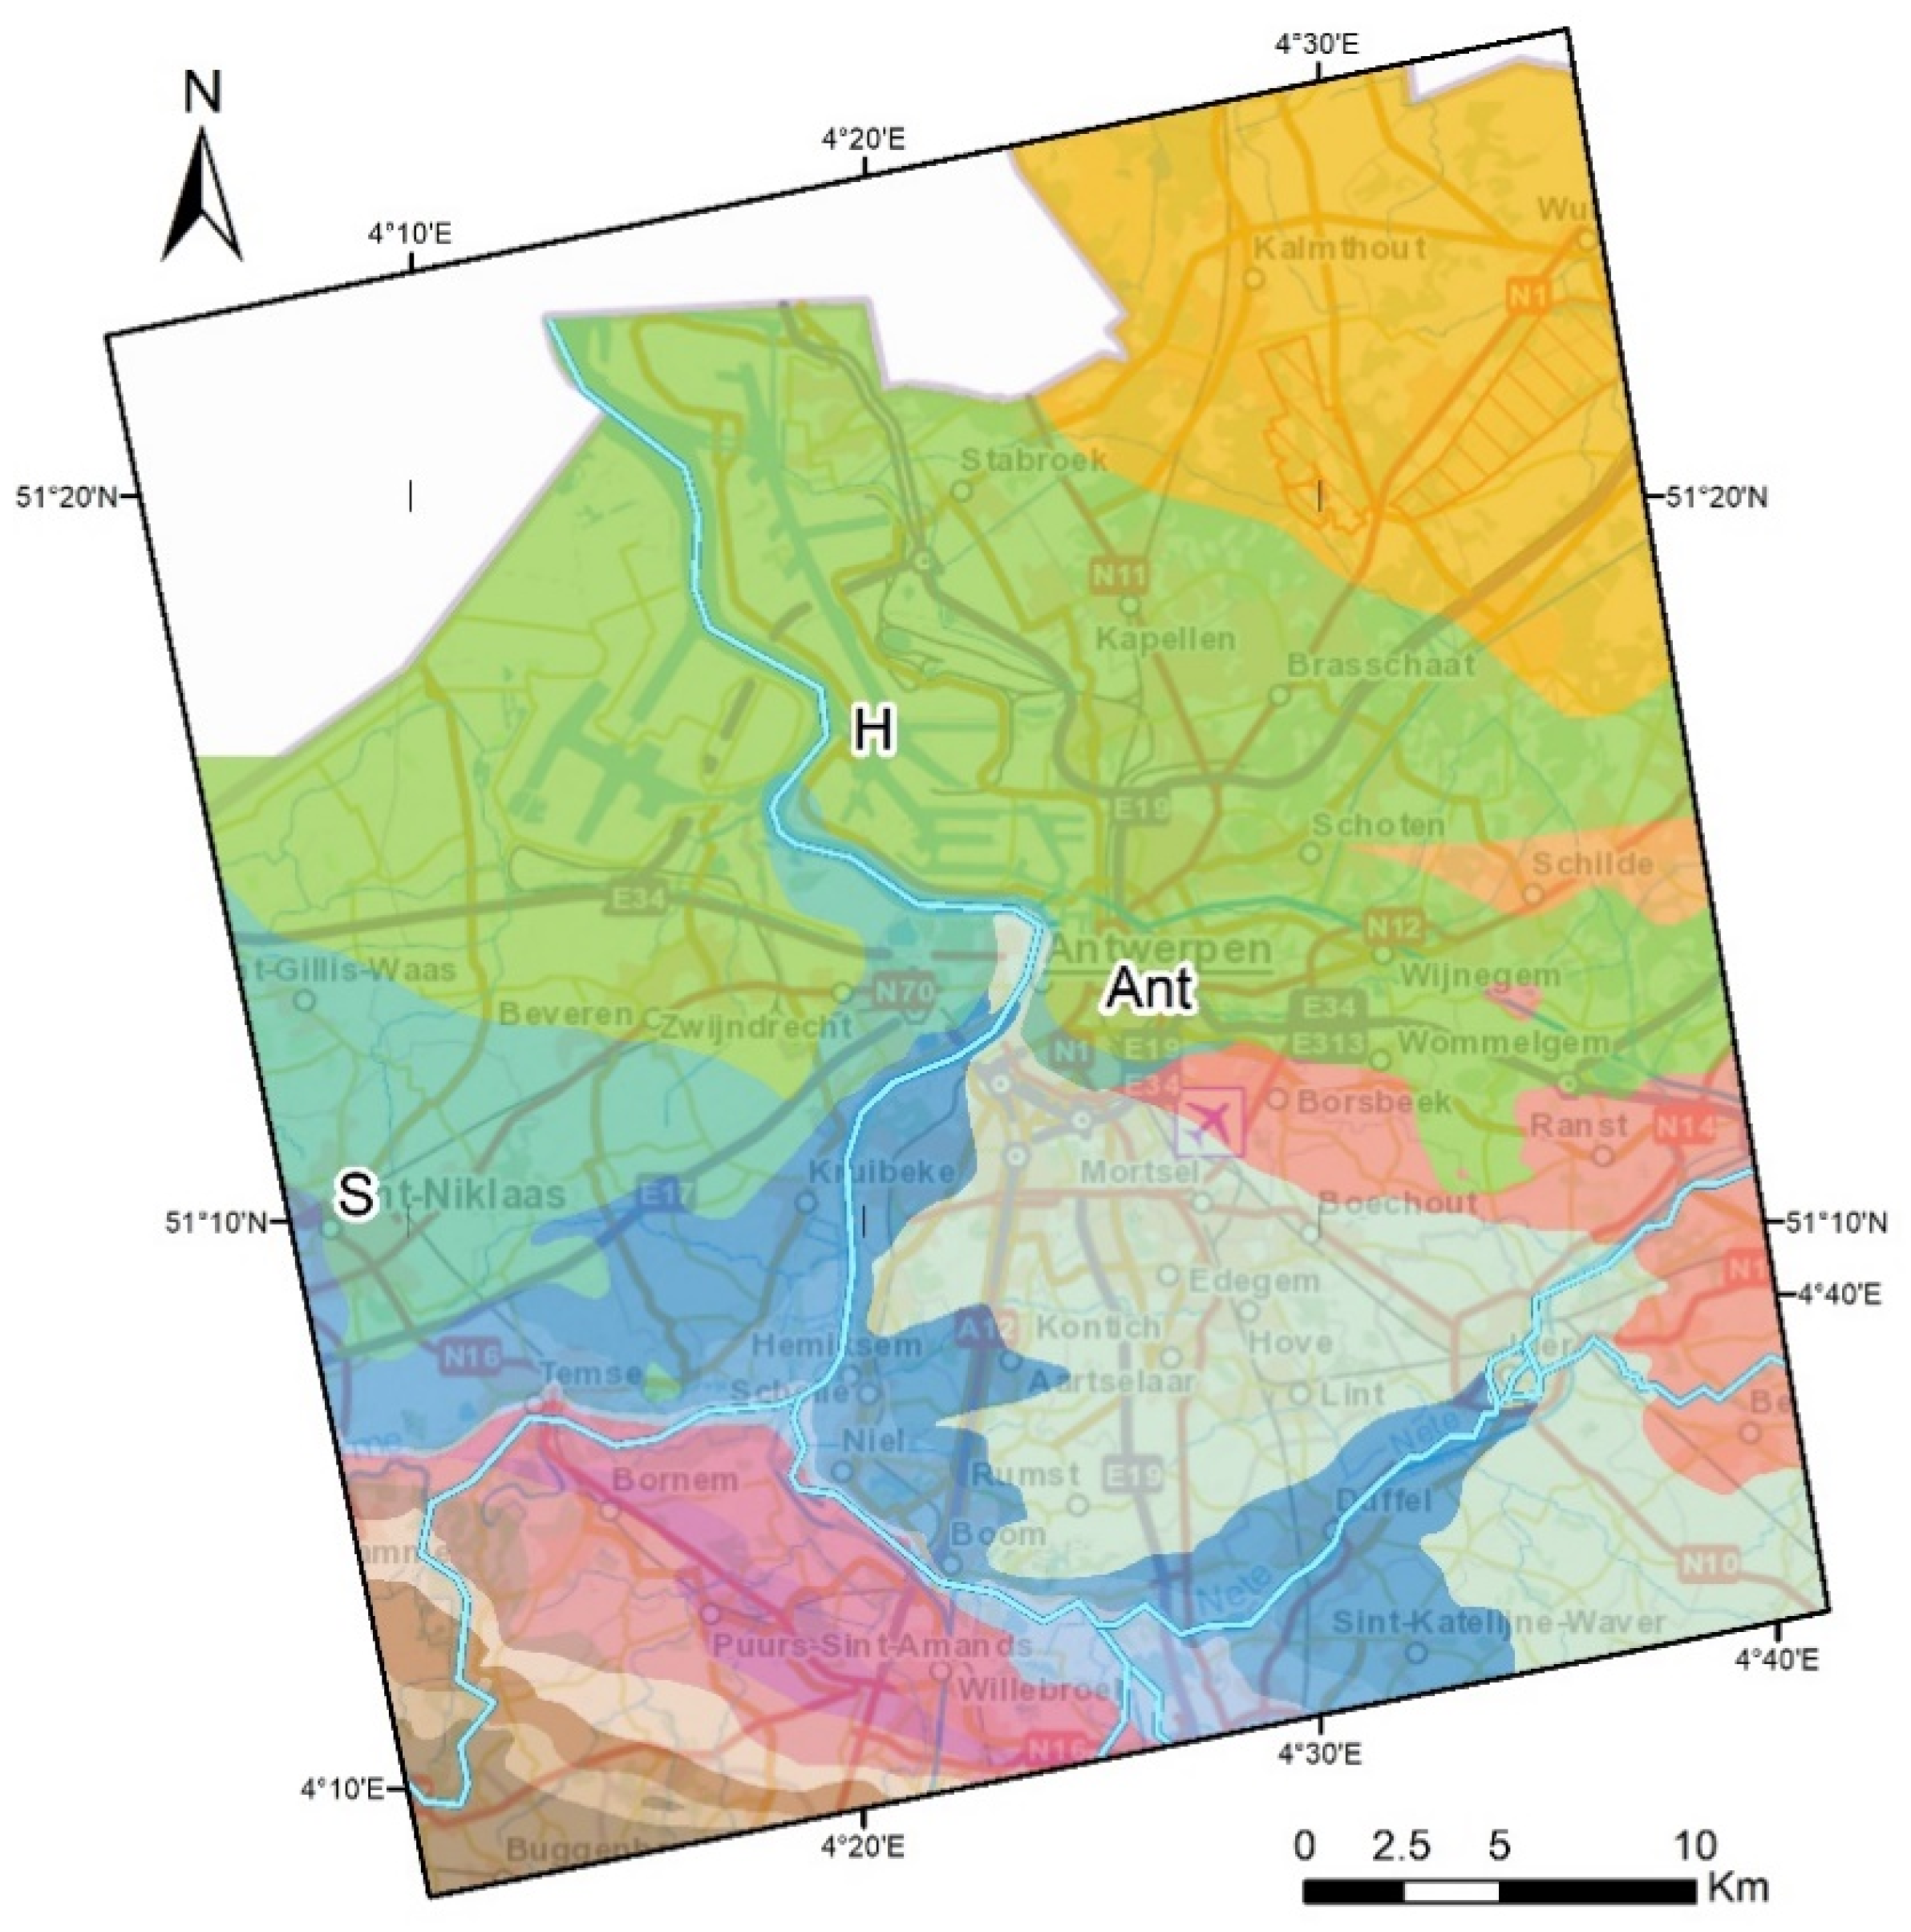
2.1. Geographical Context
2.2. Geological Context
2.2.1. The Late Pleistocene Evolution of the Scheldt
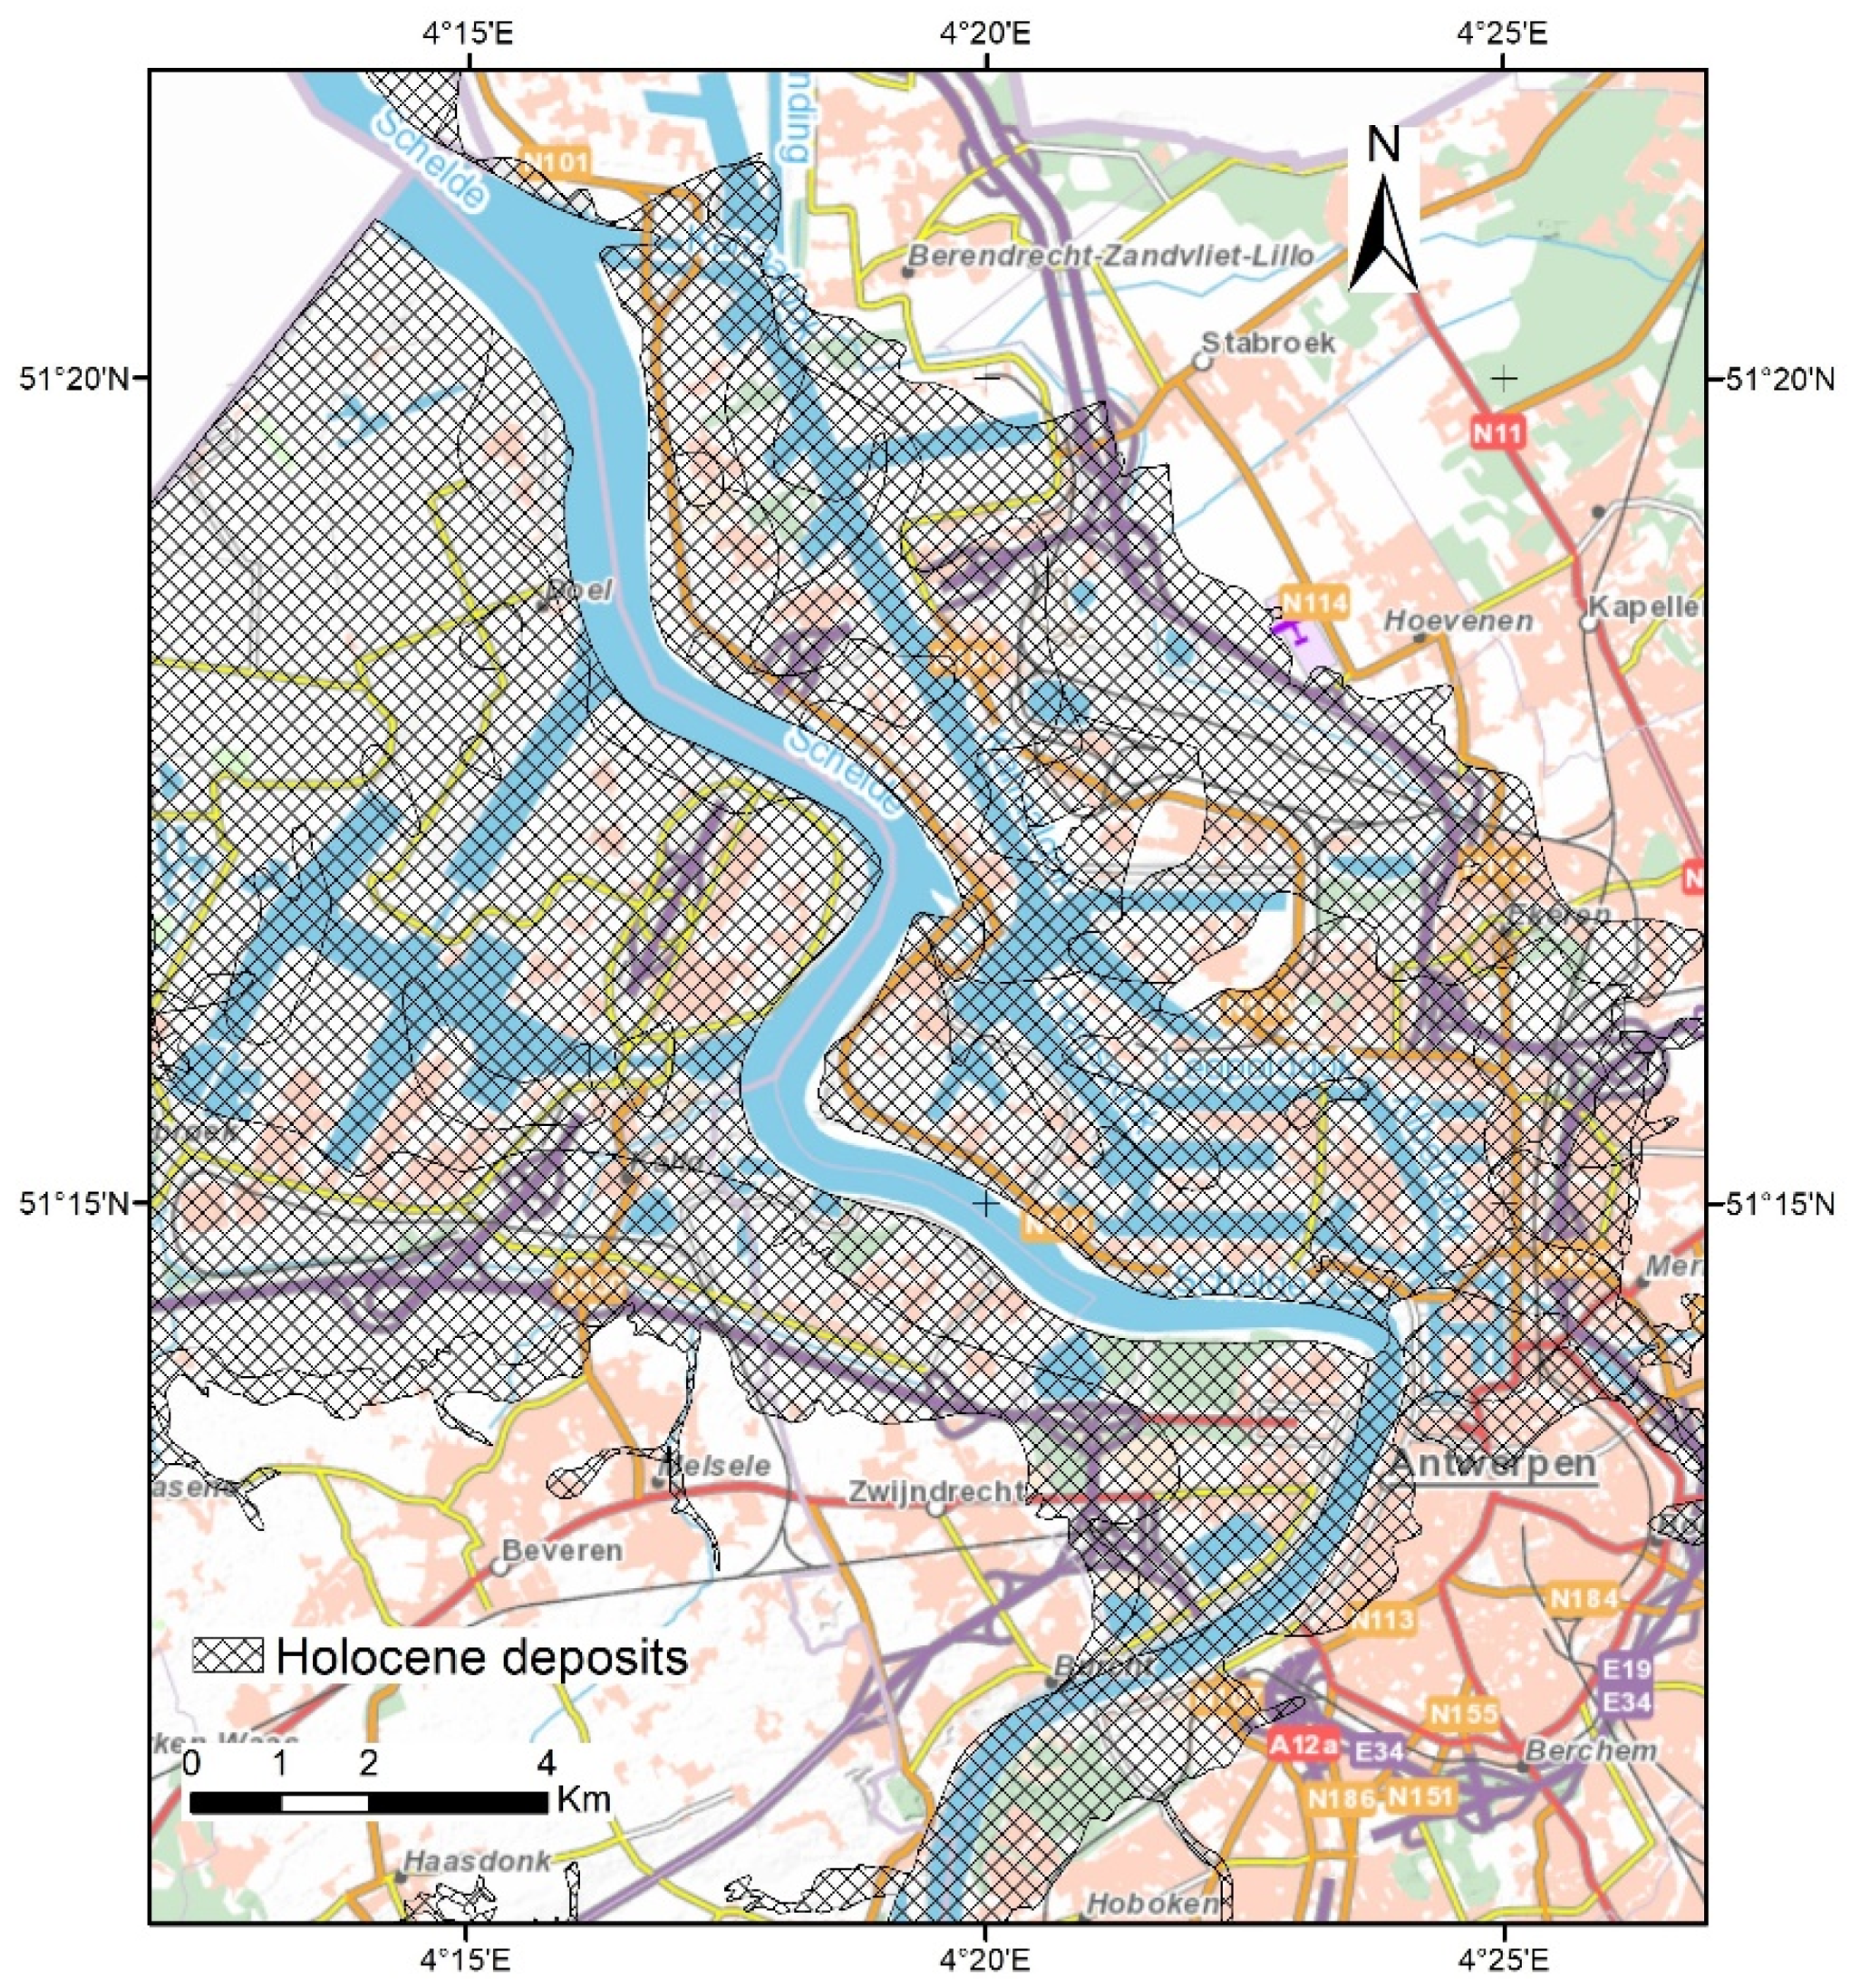
2.2.2. Quaternary Deposits
2.2.3. Tertiary (Paleogene–Neogene) Deposits
3. Methodology
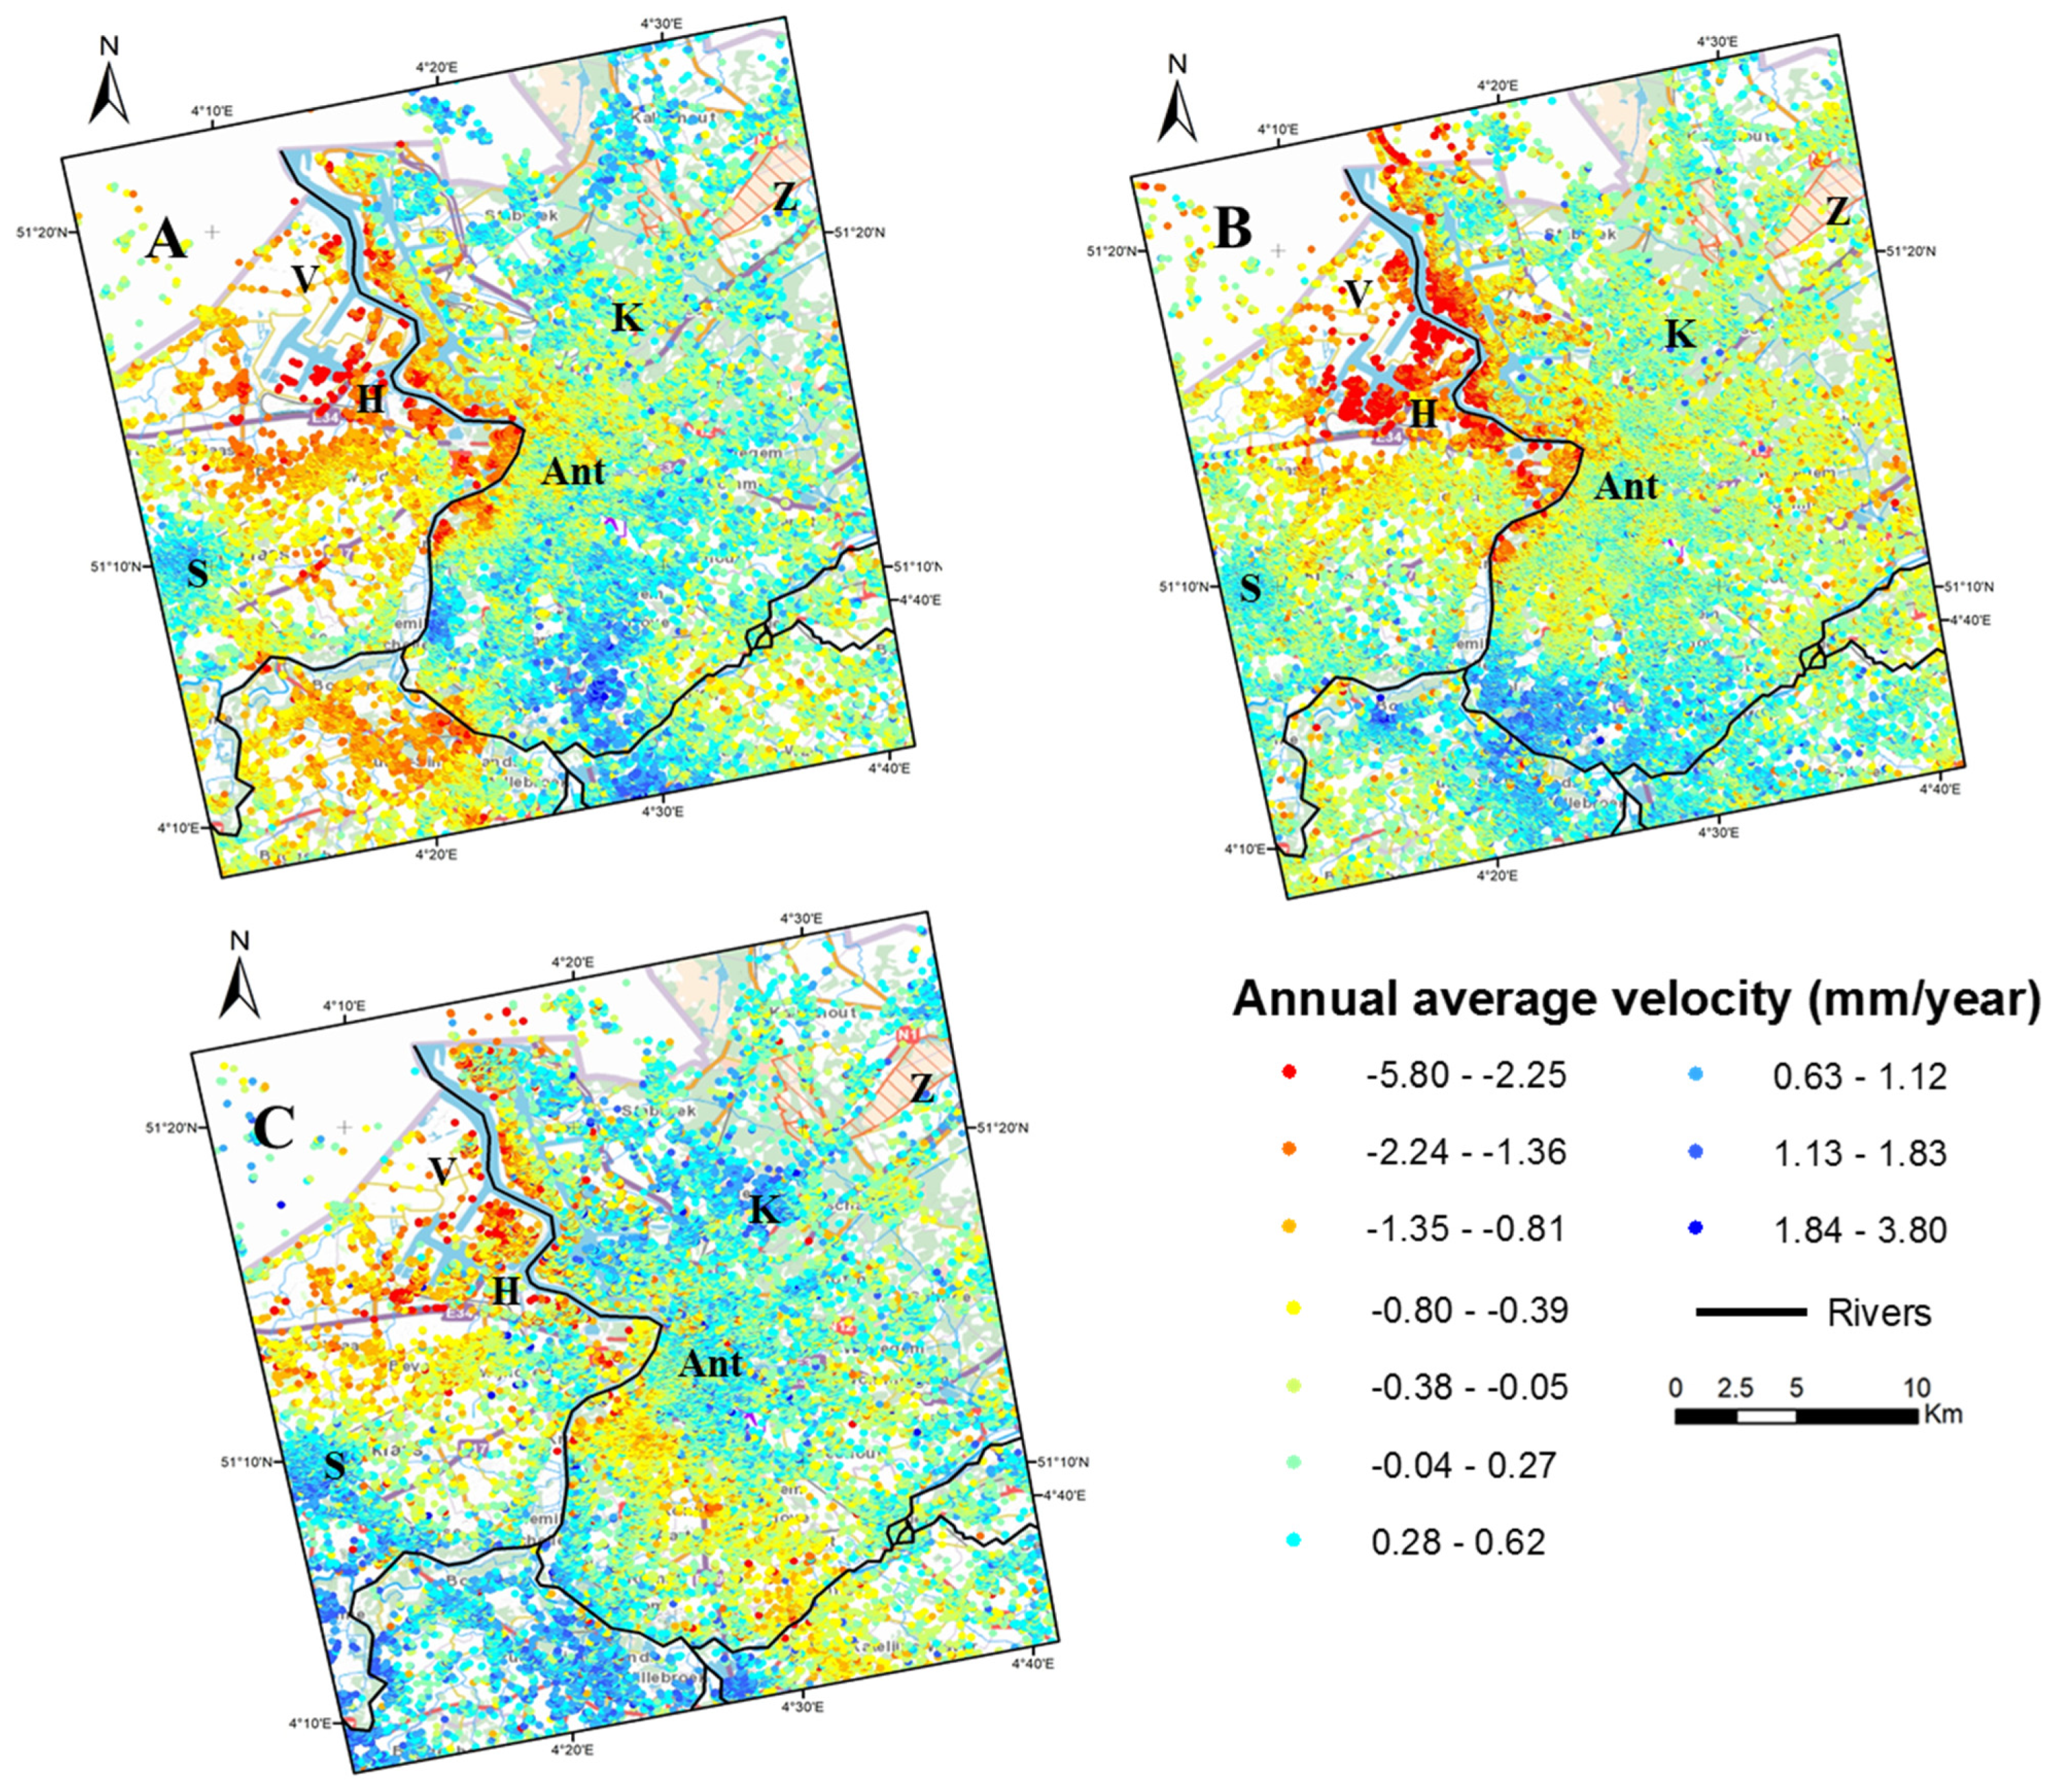
4. Results
5. Interpretation and Discussion
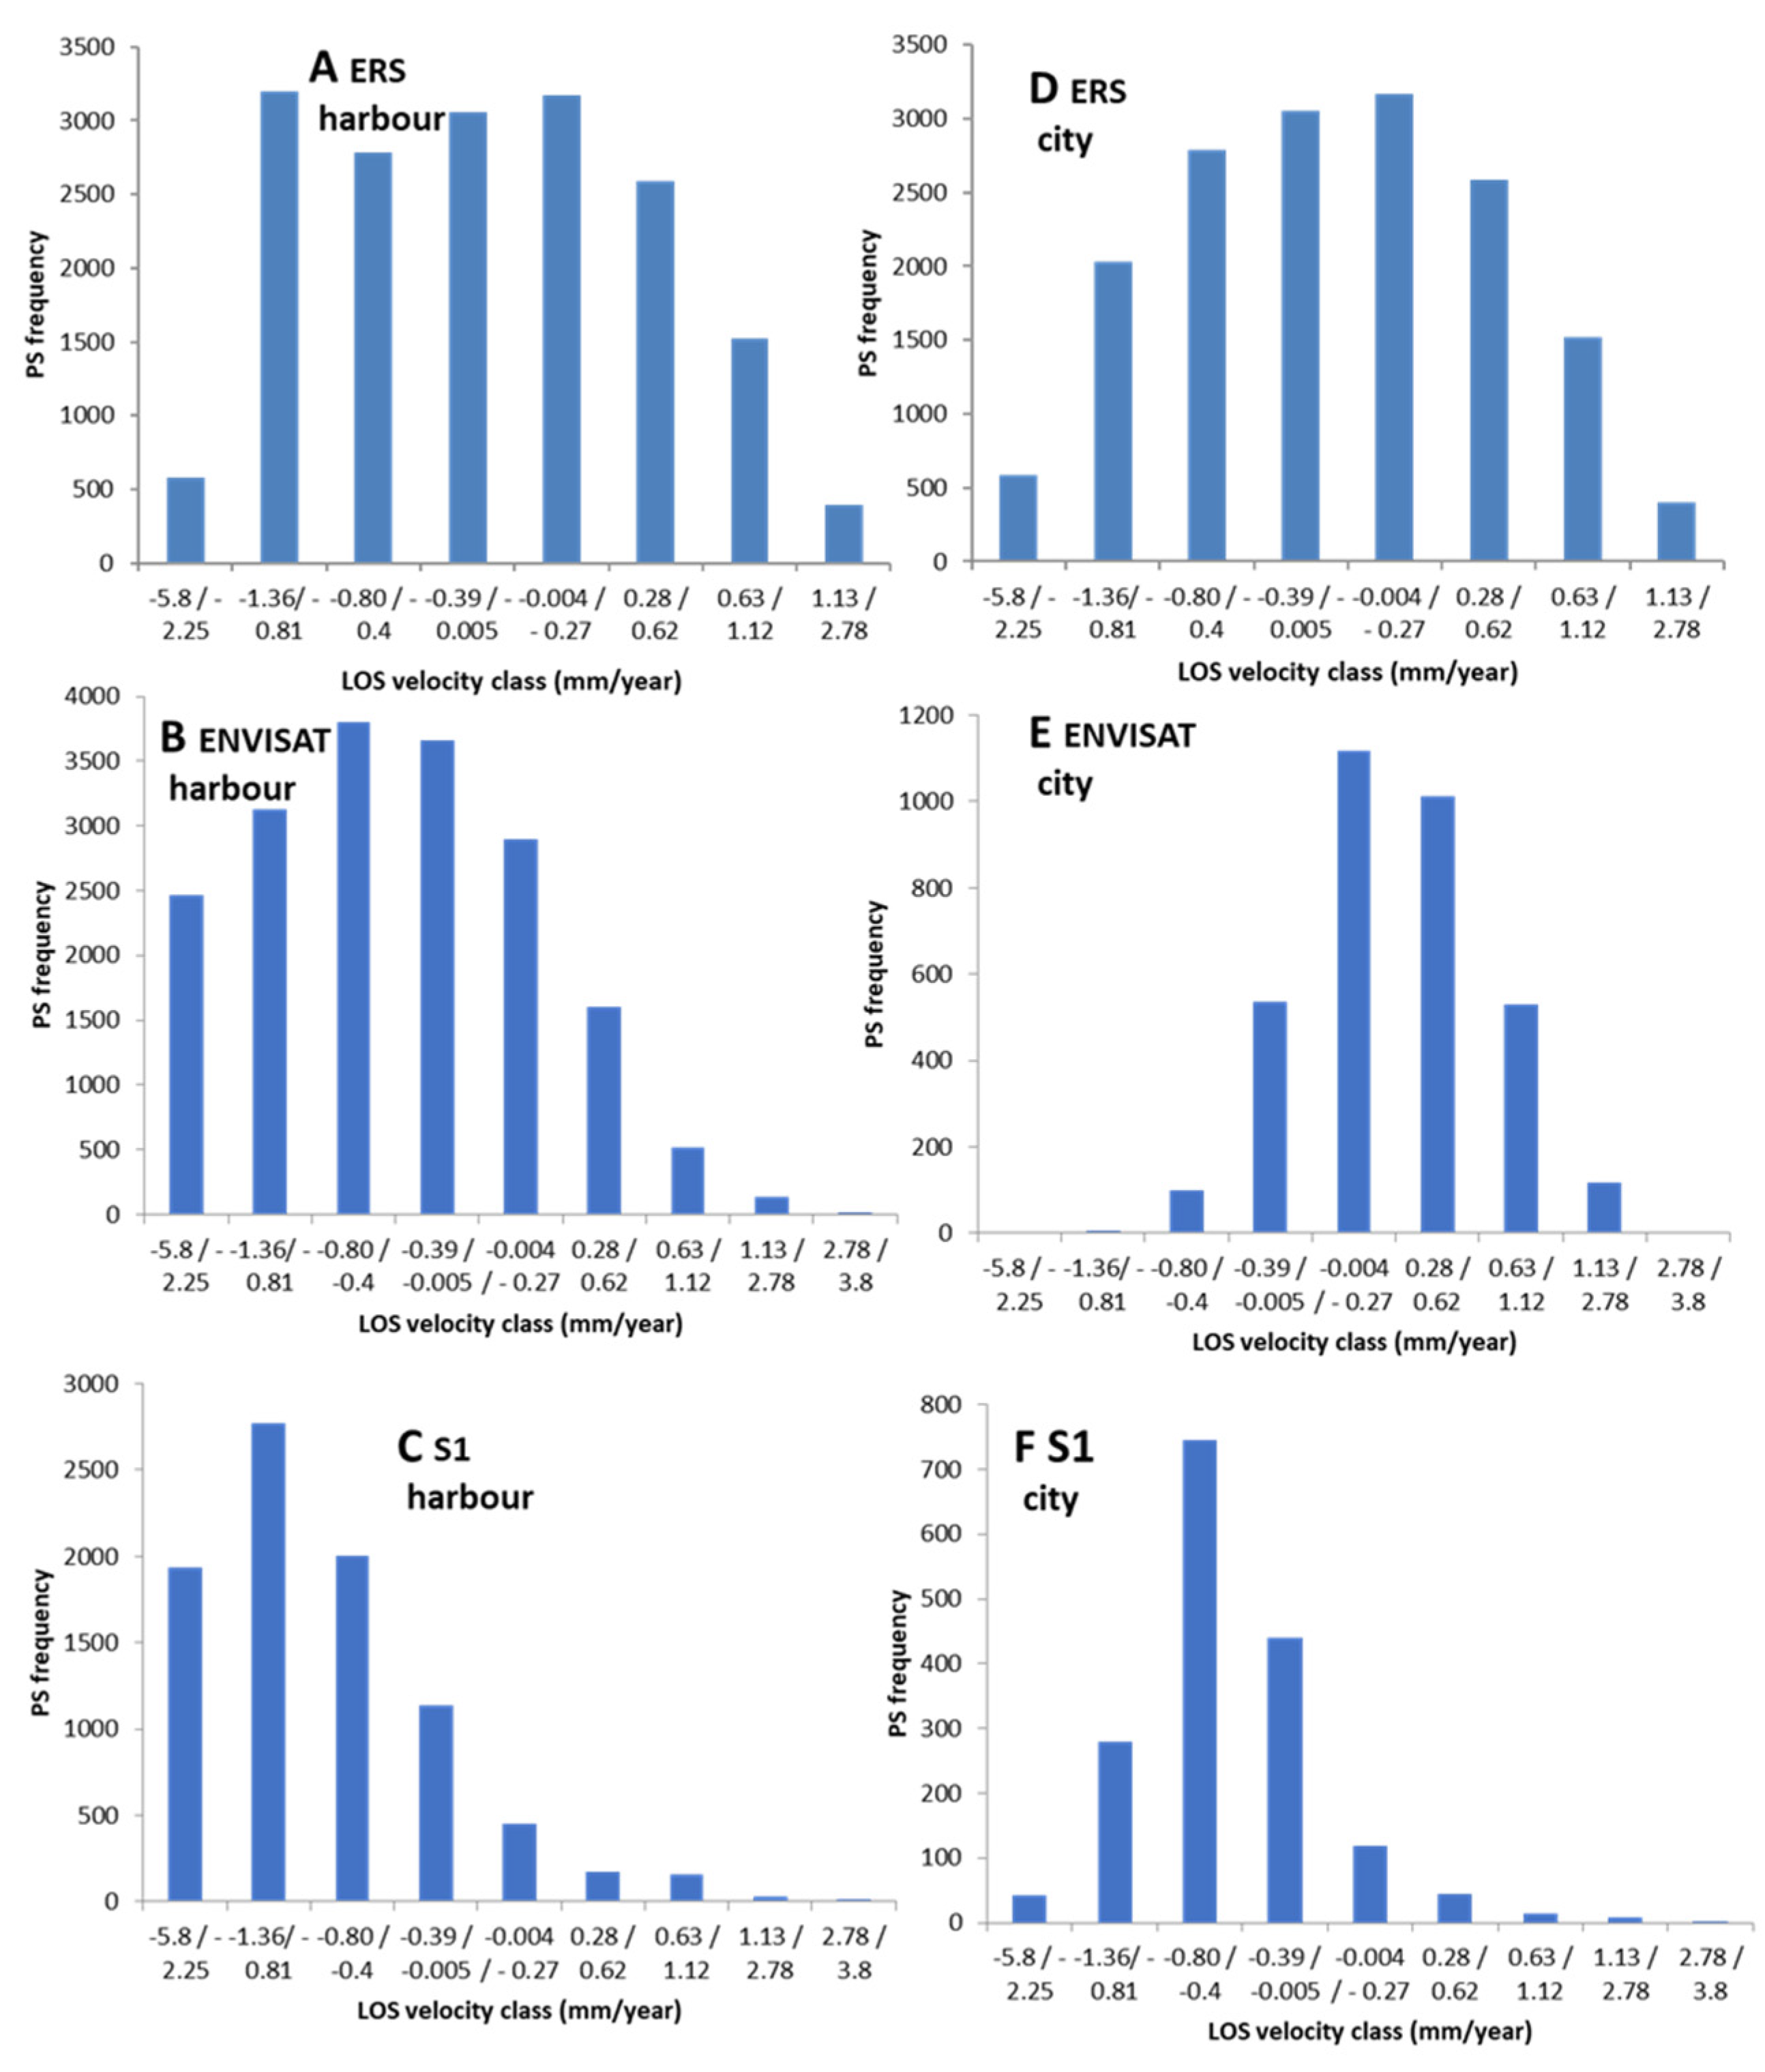
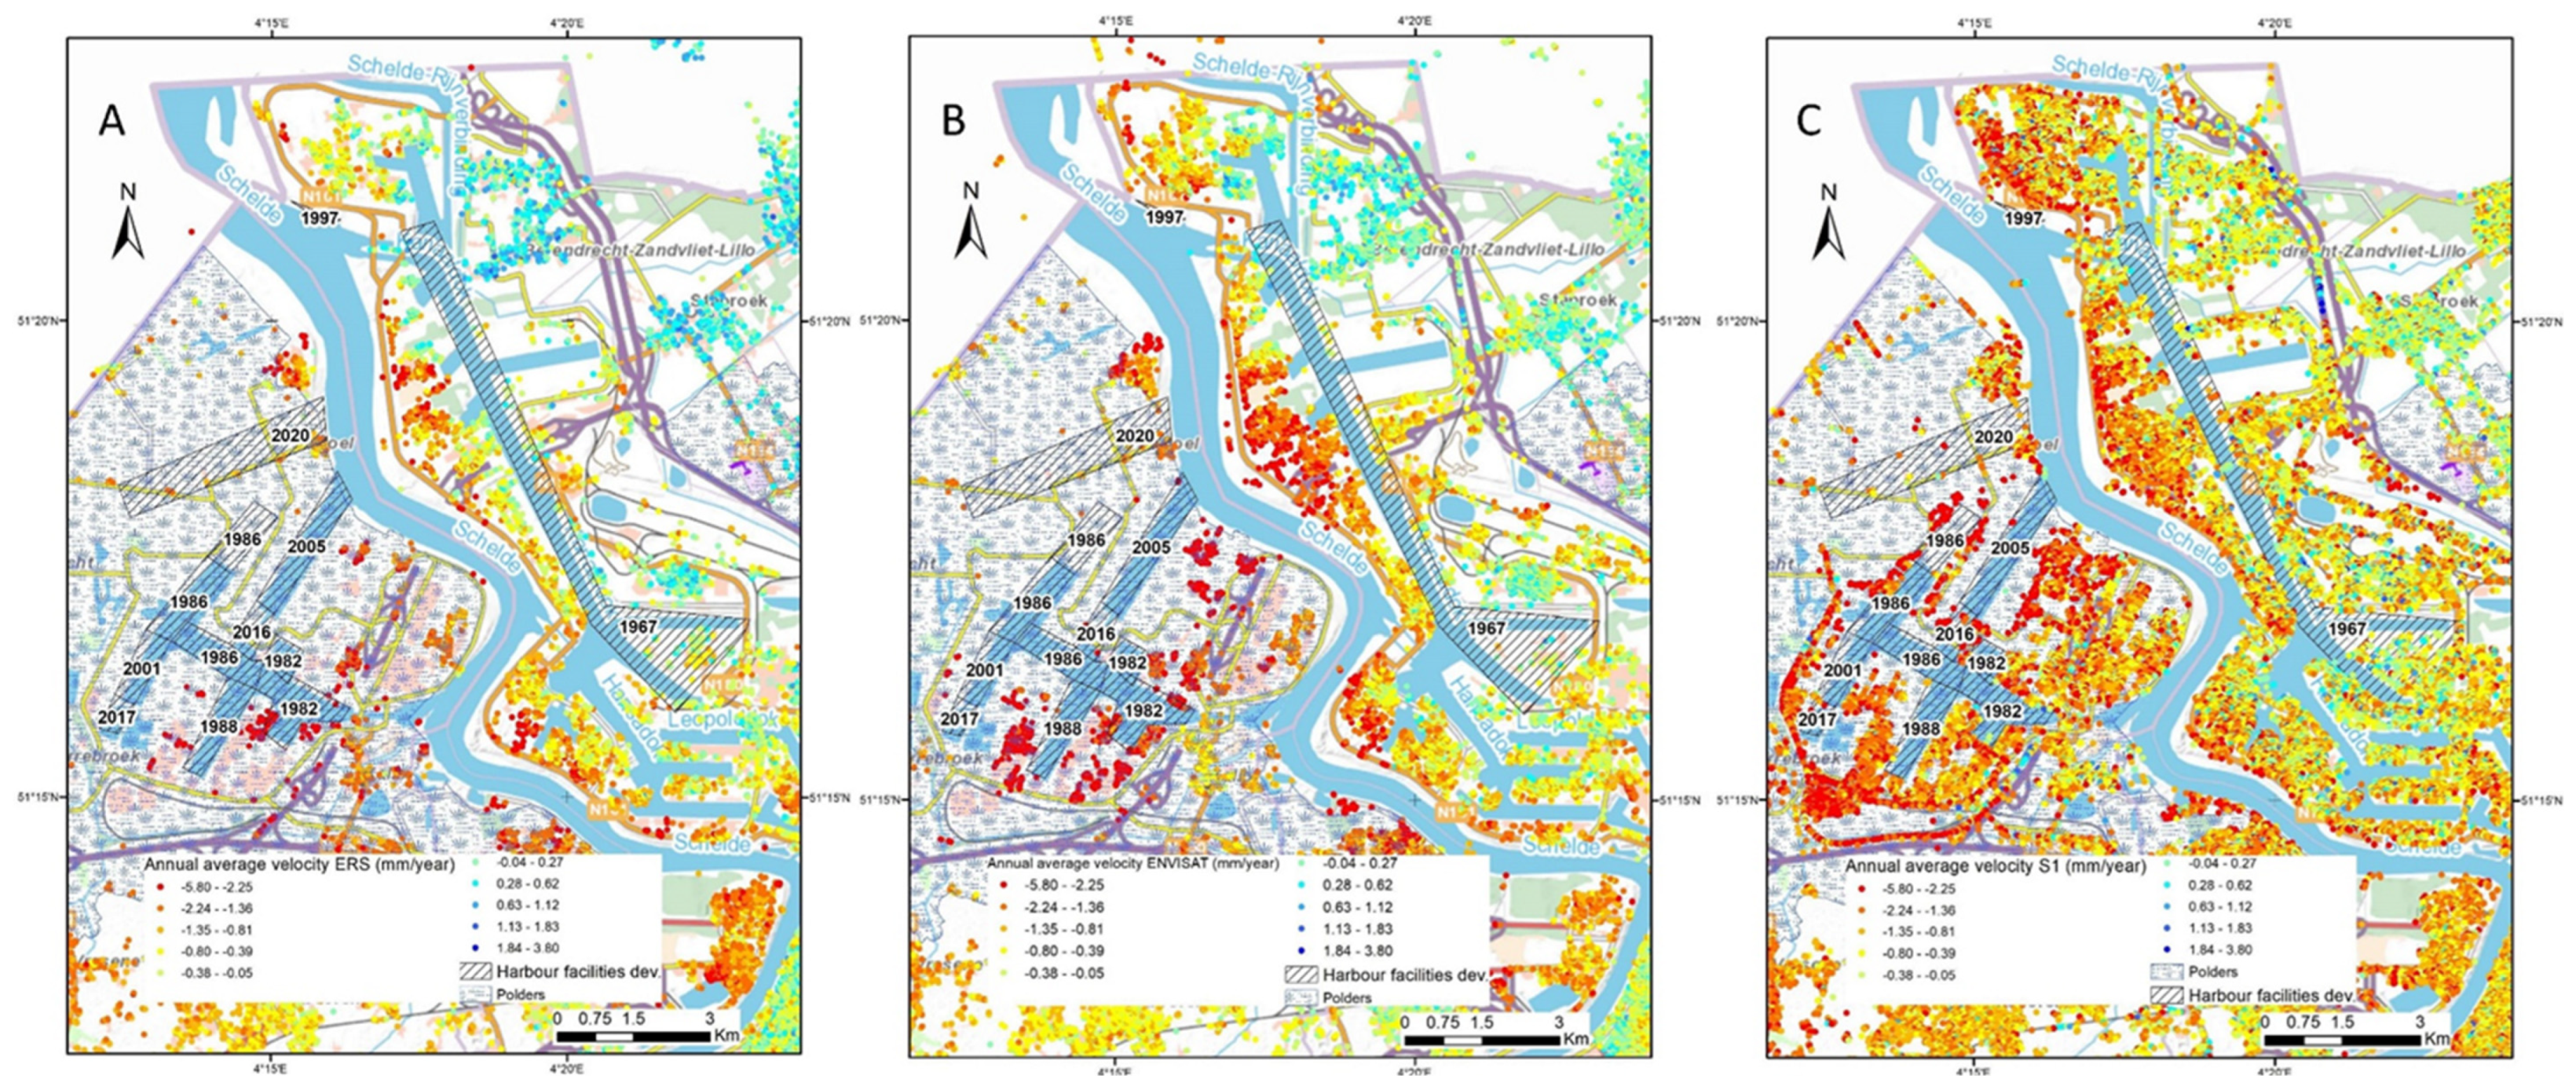
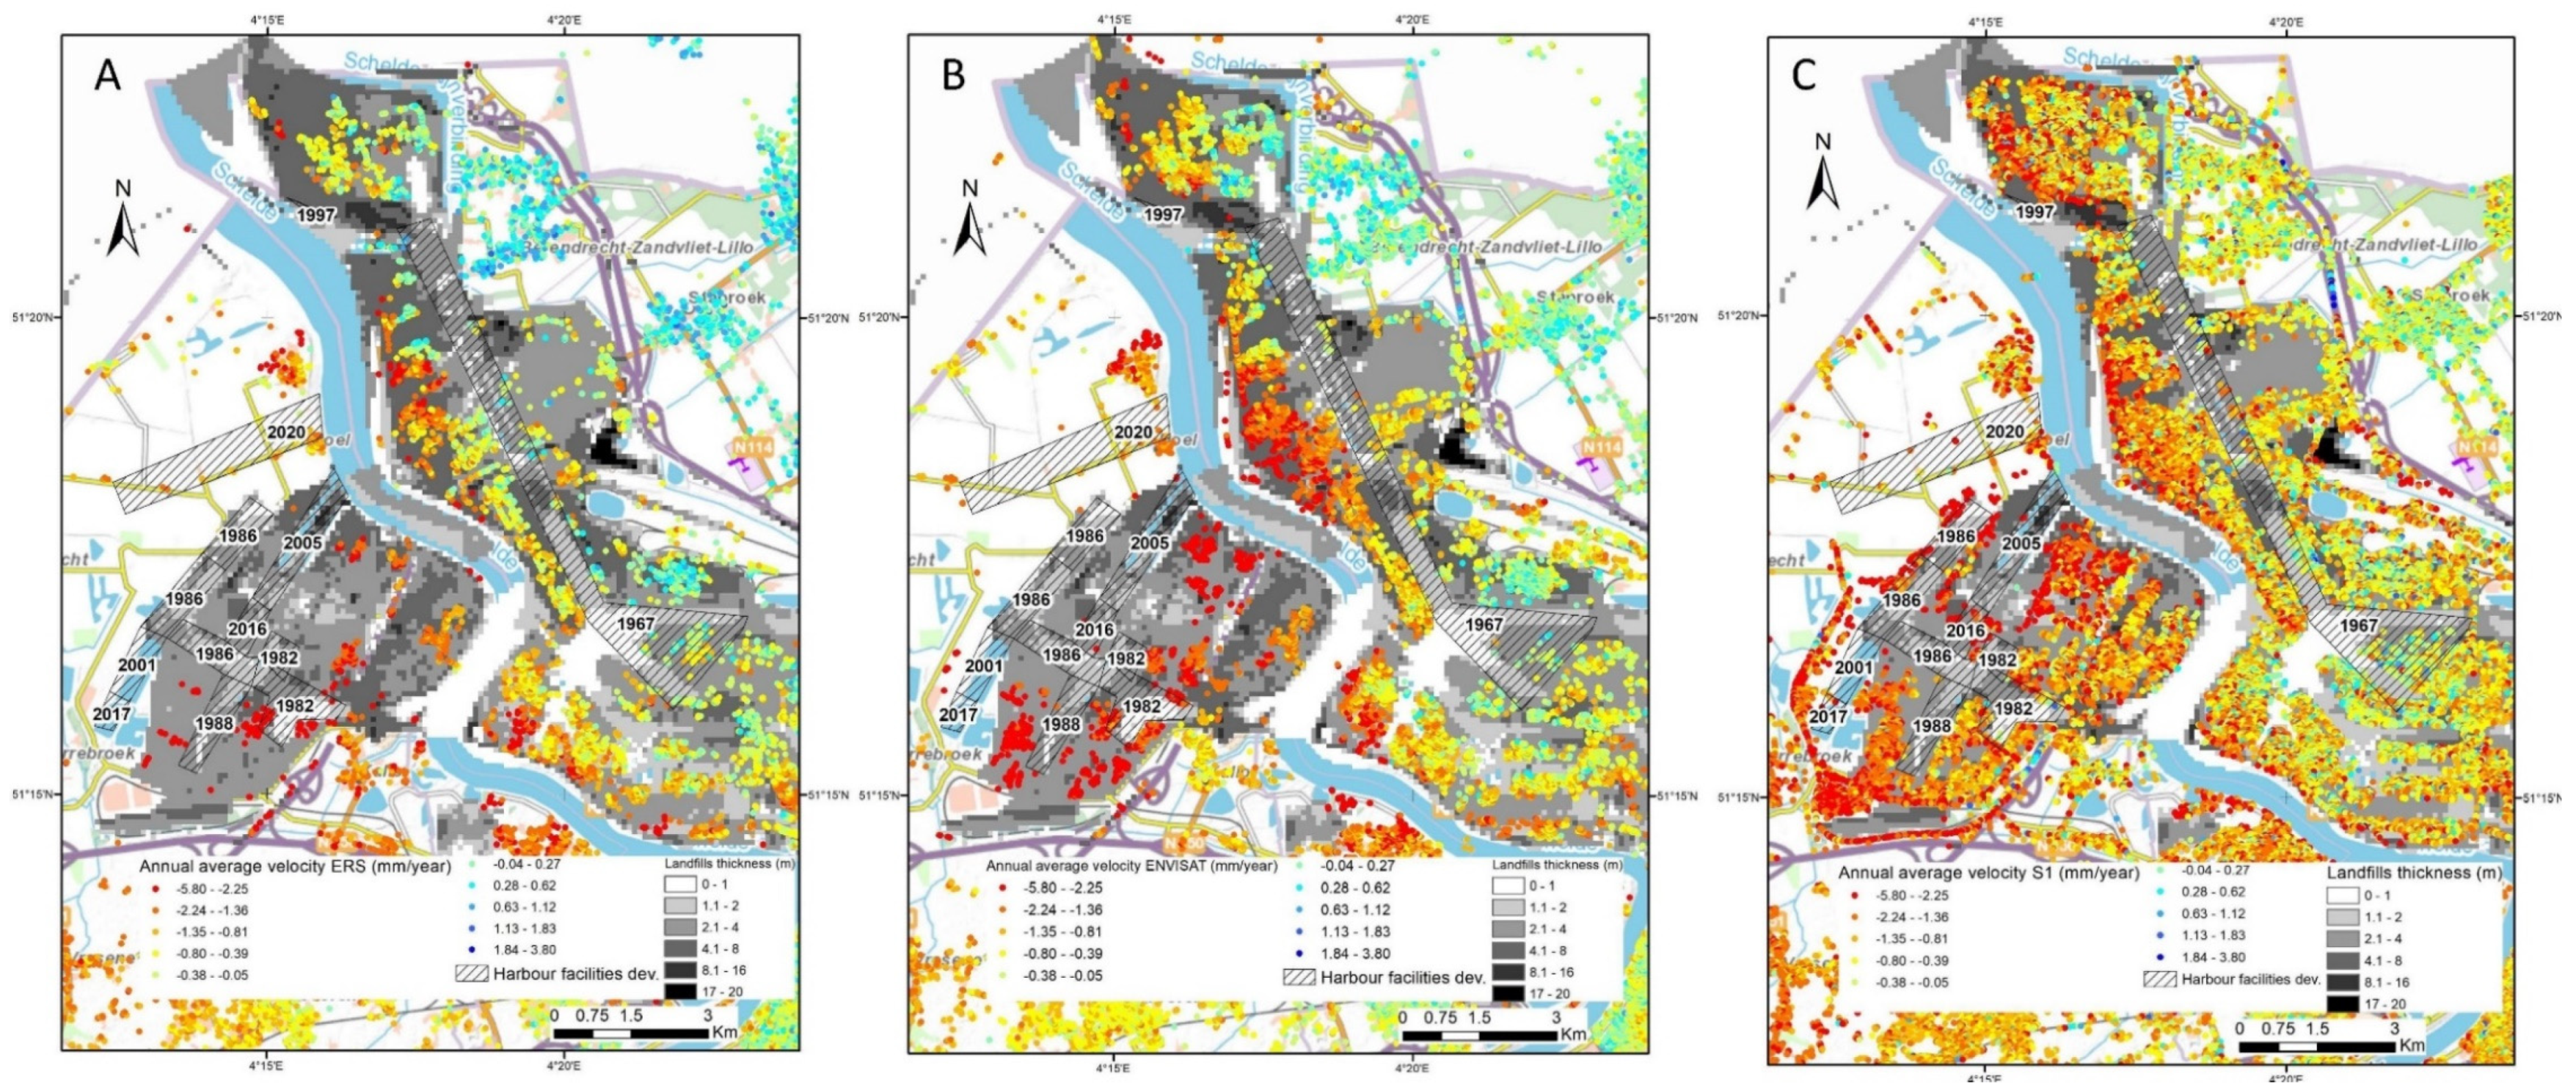
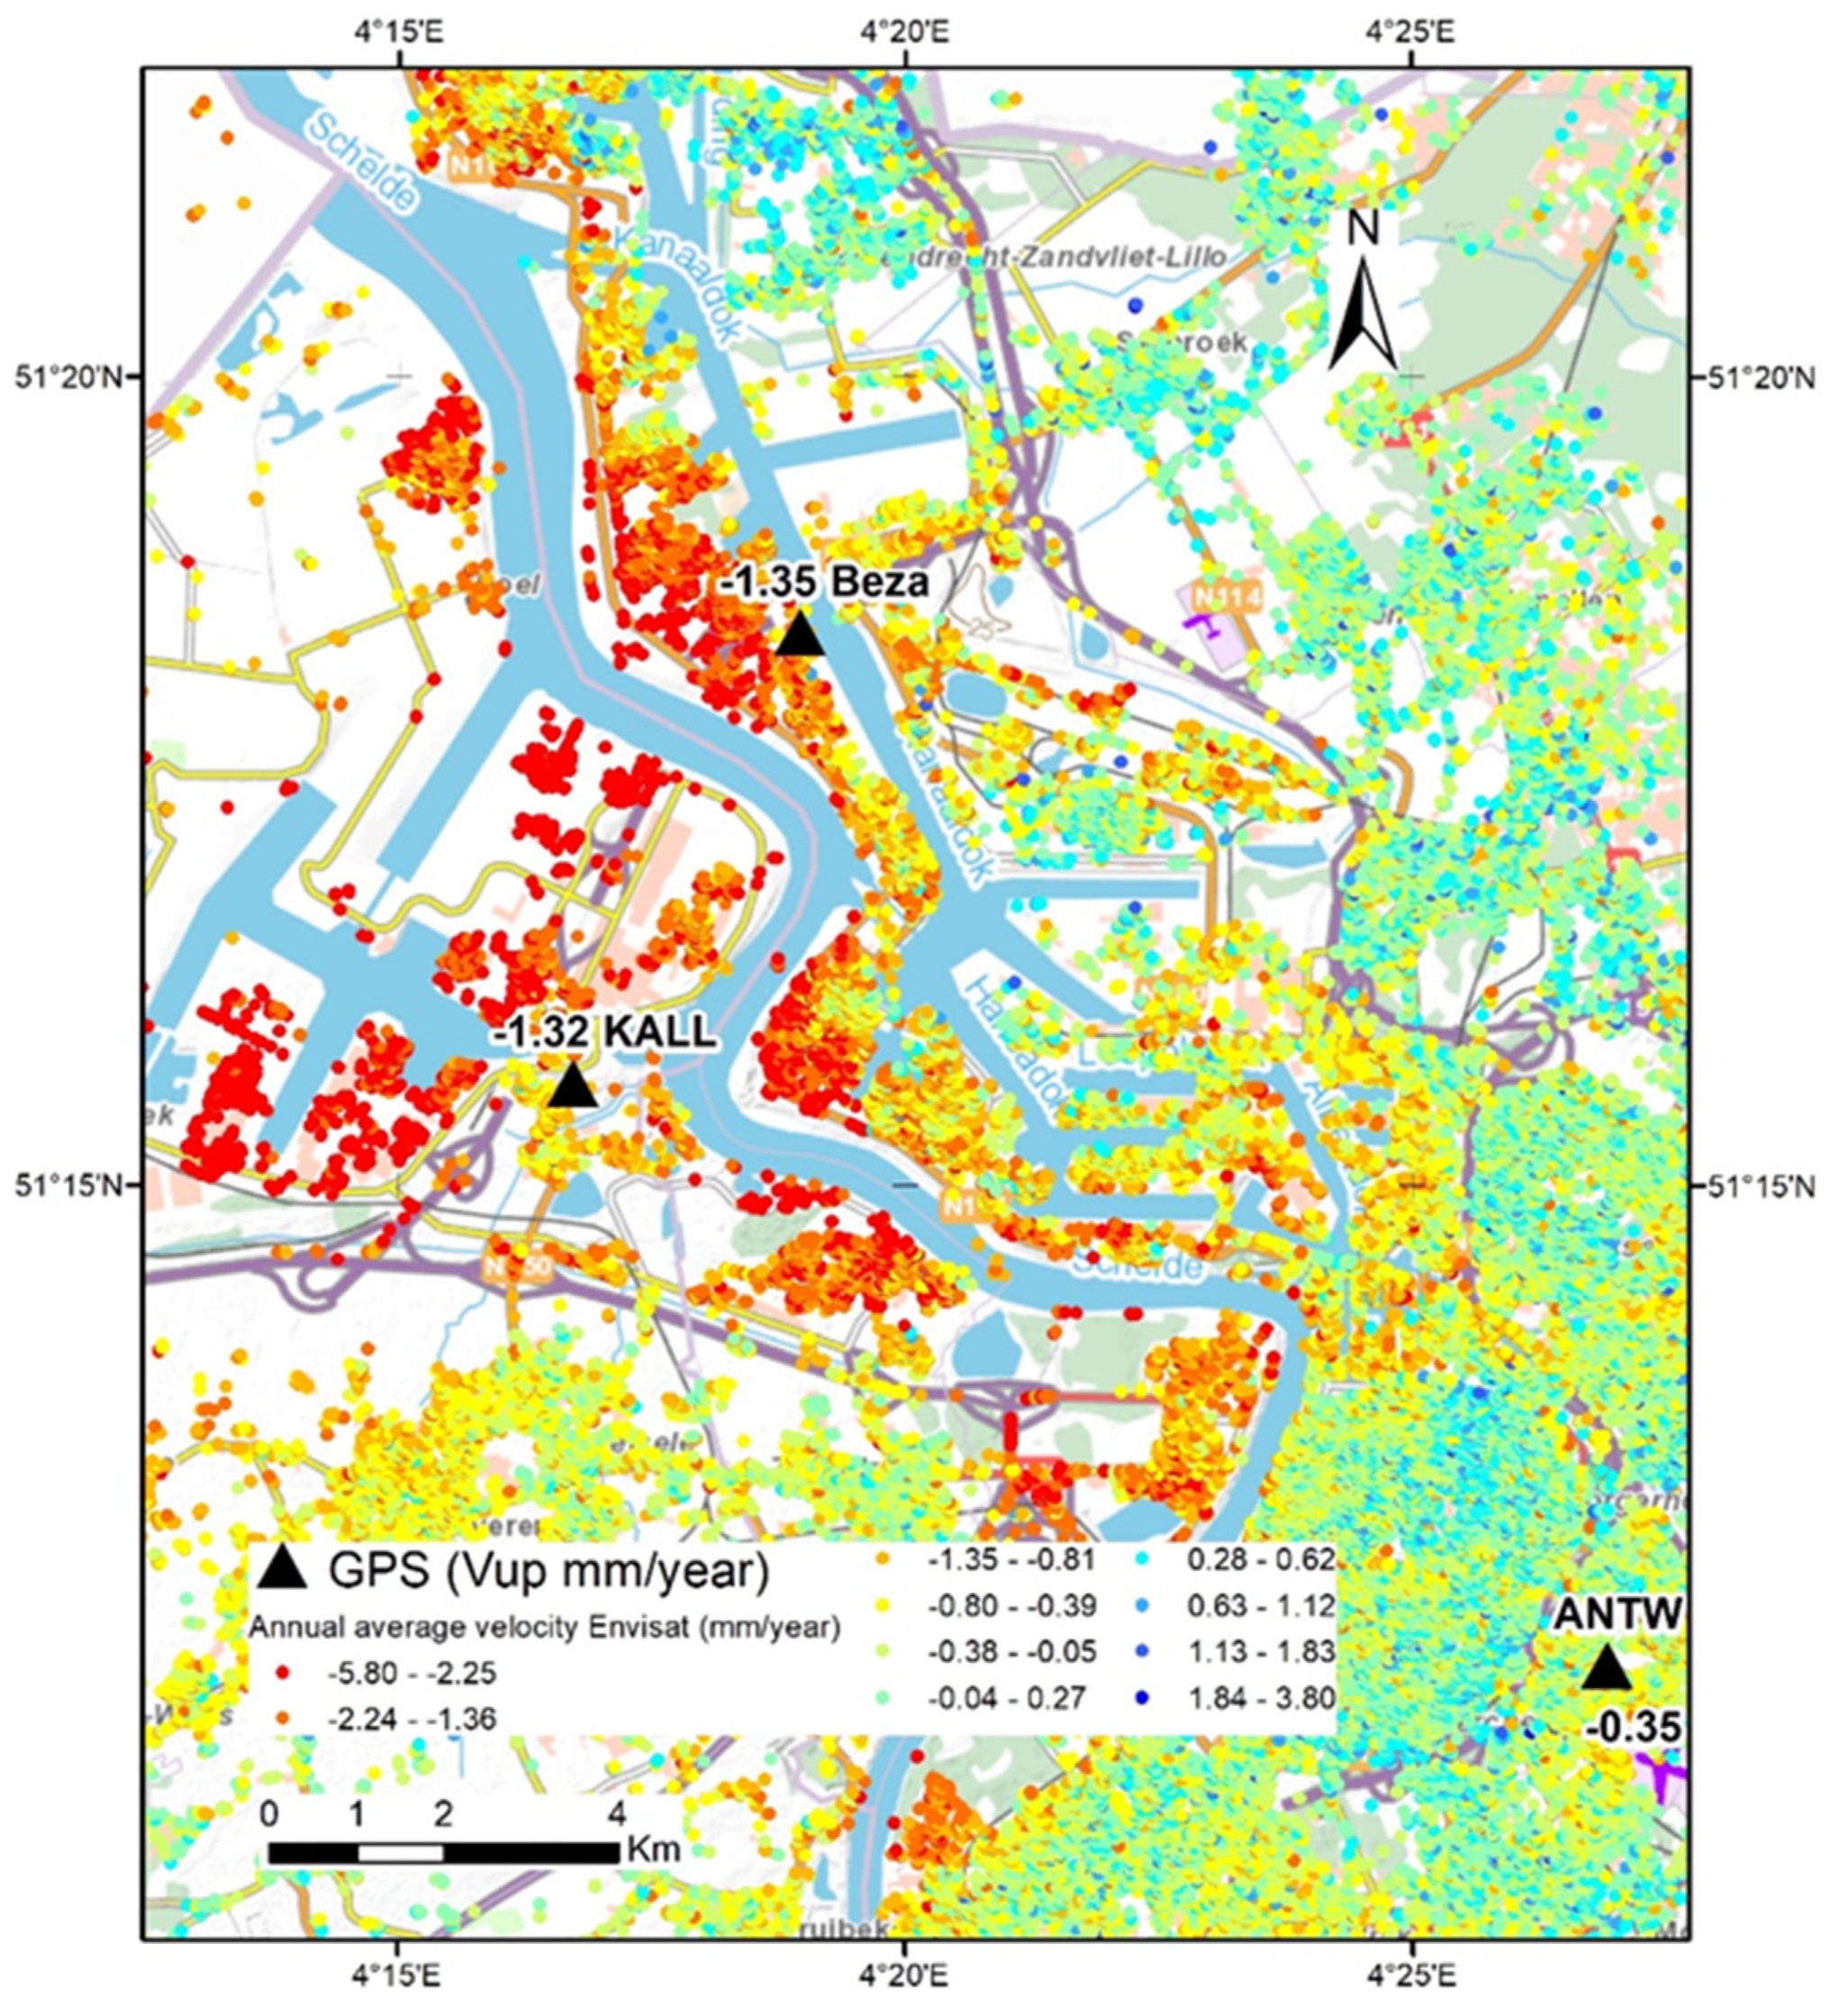
5.1. Harbour of Antwerp
5.2. City Centre of Antwerp
6. Conclusions
Author Contributions
Funding
Institutional Review Board Statement
Informed Consent Statement
Data Availability Statement
Acknowledgments
Conflicts of Interest
References
- Hu, R.L.; Yue, Z.Q.; Wang, L.C.; Wang, S.J. Review on Current Status and Challenging Issues of Land Subsidence in China. Eng. Geol. 2004, 76, 65–77. [Google Scholar] [CrossRef]
- Syvitski, J.P.M.; Kettner, A.J.; Overeem, I.; Hutton, E.W.H.; Hannon, M.T.; Brakenridge, G.R.; Day, J.; Vörösmarty, C.; Saito, Y.; Giosan, L.; et al. Sinking Deltas Due to Human Activities. Nat. Geosci. 2009, 2, 681–686. [Google Scholar] [CrossRef]
- Kulp, S.A.; Strauss, B.H. New Elevation Data Triple Estimates of Global Vulnerability to Sea-Level Rise and Coastal Flooding. Nat. Commun. 2019, 10, 4844. [Google Scholar] [CrossRef] [PubMed]
- Törnqvist, T.E.; Wallace, D.J.; Storms, J.E.; Wallinga, J.; Van Dam, R.L.; Blaauw, M.; Derksen, M.S.; Klerks, C.J.; Meijneken, C.; Snijders, E.M. Mississippi Delta Subsidence Primarily Caused by Compaction of Holocene Strata. Nat. Geosci. 2008, 1, 173–176. [Google Scholar] [CrossRef]
- Mazzotti, S.; Lambert, A.; Van der Kooij, M.; Mainville, A. Impact of Anthropogenic Subsidence on Relative Sea-Level Rise in the Fraser River Delta. Geology 2009, 37, 771–774. [Google Scholar] [CrossRef]
- Teatini, P.; Tosi, L.; Strozzi, T. Quantitative Evidence That Compaction of Holocene Sediments Drives the Present Land Subsidence of the Po Delta, Italy. J. Geophys. Res. 2011, 116, B08407. [Google Scholar] [CrossRef]
- Wang, H.; Wright, T.J.; Yu, Y.; Lin, H.; Jiang, L.; Li, C.; Qiu, G. InSAR Reveals Coastal Subsidence in the Pearl River Delta, China: Coastal Subsidence in the PRD. Geophys. J. Int. 2012, 191, 1119–1128. [Google Scholar] [CrossRef]
- Saleh, M.; Becker, M. New Estimation of Nile Delta Subsidence Rates from InSAR and GPS Analysis. Environ. Earth Sci. 2019, 78, 6. [Google Scholar] [CrossRef]
- Fiaschi, S.; Fabris, M.; Floris, M.; Achilli, V. Estimation of Land Subsidence in Deltaic Areas through Differential SAR Interferometry: The Po River Delta Case Study (Northeast Italy). Int. J. Remote Sens. 2018, 39, 8724–8745. [Google Scholar] [CrossRef]
- Higgins, S. River Delta Subsidence Measured with Interferometric Synthetic Aperture Radar (InSAR); ProQuest LLC.: Ann Arbor, MI, USA, 2014. [Google Scholar]
- Da Lio, C.; Teatini, P.; Strozzi, T.; Tosi, L. Understanding Land Subsidence in Salt Marshes of the Venice Lagoon from SAR Interferometry and Ground-Based Investigations. Remote Sens. Environ. 2018, 205, 56–70. [Google Scholar] [CrossRef]
- Di Paola, G.; Alberico, I.; Aucelli, P.P.C.; Matano, F.; Rizzo, A.; Vilardo, G. Coastal Subsidence Detected by Synthetic Aperture Radar Interferometry and Its Effects Coupled with Future Sea-Level Rise: The Case of the Sele Plain (Southern Italy). J. Flood Risk Manag. 2018, 11, 191–206. [Google Scholar] [CrossRef]
- Meire, P.; Ysebaert, T.; Damme, S.V.; den Bergh, E.V.; Maris, T.; Struyf, E. The Scheldt Estuary: A Description of a Changing Ecosystem. Hydrobiologia 2005, 540, 1–11. [Google Scholar] [CrossRef]
- Van Damme, S.; Struyf, E.; Maris, T.; Ysebaert, T.; Dehairs, F.; Tackx, M.; Heip, C.; Meire, P. Spatial and Temporal Patterns of Water Quality along the Estuarine Salinity Gradient of the Scheldt Estuary (Belgium and The Netherlands): Results of an Integrated Monitoring Approach. Hydrobiologia 2005, 540, 29–45. [Google Scholar] [CrossRef]
- Jongepier, I.; Soens, T.; Thoen, E.; Van Eetvelde, V.; Crombé, P.; Bats, M. The Brown Gold: A Reappraisal of Medieval Peat Marshes in Northern Flanders (Belgium). Water Hist. 2011, 3, 73–93. [Google Scholar] [CrossRef]
- Jacobs, P.; Polfliet, P.; De Ceukelaire, M.; Moerkerke, G. Toelichtingen Bij de Tertiairgeologische Kaart van België, Vlaams Gewest, Kaartblad 15 Antwerpen Lier 1/50000; Belgische Geologische Dienst en het Ministerie van de Vlaamse Gemeenschap, Afdeling natuurlijke Rijkdommen en Energie: Brussels, Belgium, 2010. [Google Scholar]
- Kiden, P. The Lateglacial and Holocene Evolution of the Middle and Lower River Scheldt, Belgium. Temp. Palaeohydrol. 2001, 283–299. [Google Scholar]
- Bogemans, F.; Meylemans, E.; Jacops, J.; Perdaen, Y.; Storme, A.; Verdurmen, I.; Deforce, K. The Evolution of the Sedimentary Environment in the Lower River Scheldt Valley (Belgium) during the Last 13,000 a BP. Geol. Belg. 2012. [Google Scholar]
- Meylemans, E.; Bogemans, F.; Storme, A.; Perdaen, Y.; Verdurmen, I.; Deforce, K. Lateglacial and Holocene Fluvial Dynamics in the Lower Scheldt Basin (N-Belgium) and Their Impact on the Presence, Detection and Preservation Potential of the Archaeological Record. Quat. Int. 2013, 308, 148–161. [Google Scholar] [CrossRef]
- Kiden, P.; Baeteman, C. Holocene Water Level Movements in the Lower Scheldt Perimarine Area. Prof. Pap. Geol. Dienst Belg. 1989, 241, 1–19. [Google Scholar]
- Laga, P.; Louwye, S.; Geets, S. Paleogene and Neogene Lithostratigraphic Units (Belgium). Geol. Belg. 2002, 4, 135–152. [Google Scholar] [CrossRef]
- Matthijs, J.; Lanckacker, T.; De Koninck, R.; Deckers, J.; Lagrou, D.; Broothaers, M. Geologisch 3D Lagenmodel van Vlaanderen En Het Brussels Hoofdstedelijk Gewest–Versie 2, G3Dv2; Vlaam. Overheiddepartement Leefmilieunatuur En Energ. Afd. Land En Bodembeschermingondergrondnatuurlijke Rijkdommen: Brussel, Belgium, 2013. [Google Scholar]
- Jacobs, P.; De Ceukelaire, M. The New Geological Map of Flanders; AGRIS: Rome, Italy, 2000. [Google Scholar]
- Bultynck, P.; Dejonghe, L. Lithostratigraphic Scale of Belgium. Geol. Belg. 2001, 4. [Google Scholar]
- Hooper, A. A Multi-Temporal InSAR Method Incorporating Both Persistent Scatterer and Small Baseline Approaches. Geophys. Res. Lett. 2008, 35. [Google Scholar] [CrossRef]
- Kampes, B.; Usai, S. Doris: The Delft Object-Oriented Radar Interferometric Software. In Proceedings of the Proc. 2nd Int. Symp. Operationalization of Remote Sensing; Citeseer: Princeton, NJ, USA, 1999; pp. 16–20. [Google Scholar]
- Perissin, D.; Wang, Z.; Wang, T. The SARPROZ InSAR Tool for Urban Subsidence/Manmade Structure Stability Monitoring in China. In Proceedings of the 34th International Symposium on Remote Sensing of Environment, Sydney, Australia, 10–15 April 2011. [Google Scholar]
- Rosen, P.; Hensley, S.; Peltzer, G.; Rogez, F.; Simons, M.; Crampe, F.; Lohmann, R. A Repeat Orbit Interferometry Package. 2000. Available online: https://trs.jpl.nasa.gov/bitstream/handle/2014/14251/00-0663.pdf?sequence=1 (accessed on 10 February 2021).
- Farr, T.G.; Rosen, P.A.; Caro, E.; Crippen, R.; Duren, R.; Hensley, S.; Kobrick, M.; Paller, M.; Rodriguez, E.; Roth, L. The Shuttle Radar Topography Mission. Rev. Geophys. 2007, 45. [Google Scholar] [CrossRef]
- Chaussard, E.; Wdowinski, S.; Cabral-Cano, E.; Amelung, F. Land Subsidence in Central Mexico Detected by ALOS InSAR Time-Series. Remote Sens. Environ. 2014, 140, 94–106. [Google Scholar] [CrossRef]
- Declercq, P.-Y.; Gerard, P.; Pirard, E.; Perissin, D.; Walstra, J.; Devleeschouwer, X. Subsidence Related to Groundwater Pumping for Breweries in Merchtem Area (Belgium), Highlighted by Persistent Scaterrer Interferometry. Int. J. Appl. Earth Obs. Geoinf. 2017, 63, 178–185. [Google Scholar] [CrossRef]
- Smitz, H. De Ontwikkeling van de Haven van Antwerpen de Voorbije 75 Jaar En de Relatie Tot de Scheldepolders: Deel 2. In Waterbouwkundig Laboratorium 1933–2008; JPI Oceans AISBL: Brussels, Belgium, 2011; pp. 1–150. [Google Scholar]
- Bogemans, F. Technisch Verslag Bij de Opmaak van de Quartairgeologische Kaart van Vlaanderen; Vlaam. Overheiddienst Nat. Rijkdommen: Brussel, Belgium, 2005. [Google Scholar]
- Campeny, L.; Sevrin, L.; Valentim, P. Les Quais d’Anvers Réaménagement Des Berges de l’Escaut; Université de Liège: Liège, Belgium, 2013. [Google Scholar]
- Adams, R.; Vermeire, S.; De Moor, G.; Jacobs, P.; Louwye, S.; Polfliet, T. Toelichting Bij de Quartairgeologische Kaart. Kaartblad 15 Antwerp. 2002. [Google Scholar]
- Home|National Commission for Stratigraphy Belgium. Available online: https://ncs.naturalsciences.be/home (accessed on 1 June 2020).
- Van Burm, P.; Maertens, J.; E De Beer, E. Grondmechanische Kaart 15.3.1. Antwerpen Petroleumhaven; Rijksinstituut Voor Grondmechanica: Gent, Belgium, 1982. [Google Scholar]


| Formation | Period | Epoch | Description/Lithology |
|---|---|---|---|
| Vlaanderen | Quaternary | Holocene | Coarse tidal channel sand, fine wadden sand and tidal flat clay with peat horizons |
| Arenberg | Quaternary | Holocene | Fine-grained alluvial deposits with peat horizons |
| Eeklo | Quaternary | Upper Pleistocene | Alluvial and fluvio-periglacial sands with loamy layers and gravels in the infill of the Flemish Valley and the Coastal Plain |
| Gent | Quaternary | Upper Pleistocene | Aeolian fine sand |
| Ravels | Quaternary | Lower Pleistocene | Fine sand with peaty clay layers deposited in a fluviatile environment |
| Weelde | Quaternary | Lower Pleistocene | Alternation of clayey and sandy deposits |
| Formation | Age | Description | Thickness (m) |
|---|---|---|---|
| Merksplas | Pliocene | Grey medium to coarse sand, with glauconite and wood fragments. Containing shell fragments in the lower part and occasionally gravels. | On average, 5 |
| Lillo | Pliocene | Grey, grey brown and light grey brown shelly and, clayey in the lower part and with several shell layers; in the upper part gradual decrease in the clay content. | 2.5 to 10 |
| Kattendijk | early Pliocene | Dark grey to green grey, fine to medium fine, glauconitic sand, slightly clayey. | 5 to 10 |
| Diest | Late Miocene | Grey green to brownish, mostly coarse, locally clayey, glauconitic sand often with sandstone layers; mainly without fossils. | 10 to 25 |
| Berchem | Miocene | Green to blackish, fine to medium sand, often slightly clayey, high glauconitic content; rich in shells. | 15 to 25 |
| Boom | Oligocene | Grey silty clay or clayey silt, with pyrite and glauconite in the siltiest horizons. | Up to70 |
| Zelzate | late Eocene to early Oligocene | Dark grey, moderately fine, silty sand, glauconitic and micaceous, with intercalations of thick lenses of grey clay. Covered by dark green, sandy clay. | 0 to 27 |
| Maldegem | Eocene | Succession of clays and sands with a gradual increase in glauconitic content. | On average 50 |
| Satellite | Track | Pass | Number of Scenes | Acquisition Period | Master | Processing Software |
|---|---|---|---|---|---|---|
| ERS 1/2 | 423 | Descending | 67 | 1992–2001 | 18 July 1998 | ROI_PAC, Doris, StaMPS |
| ENVISAT | 423 | Descending | 73 | 2003–2010 | 15 August 2007 | ROI_PAC, Doris, StaMPS |
| S1 | Path 88 track 163 Swath 1 | Ascending | 69 | 2016–2019 | 27 July 2017 | SARPROZ |
| Location | Avg LOS Velocity ERS (1992–2001) (mm/year) | PS Count ERS (1992–2001) | Avg LOS Velocity ENVISAT (2003–2010) (mm/year) | PS Count ENVISAT (2003–2010) | Avg LOS Velocity S1 (2016–2019) (mm/year) | PS Count S1 (2016–2019) |
|---|---|---|---|---|---|---|
| Antwerp centre | 0.002 | 4518 | −0.06 | 3420 | −0.6 | 1699 |
| Antwerp harbour | −0.83 | 535 | −2.71 | 718 | −1.62 | 1265 |
| Depth Interval (from Surface) | Formation or Type | Period | Epoch | Lithology |
|---|---|---|---|---|
| 0–4.5 m | “Landfills” | Quaternary | NA | Sand, Silt, Clay, Peat |
| 4.5–12.25 m | “Landfills”/+Vlaanderen and Arenberg Formations | Quaternary | NA/Holocene | |
| 12.25–21 m | Lillo Formation | Neogene (Tertiary) | Pliocene | Clayey and shelly silty sand |
| 21–25 m | Kattendijk Formation | Neogene (Tertiary) | early Pliocene | Fine to medium glauconitic sand |
| 25–38.95 m | Berchem Formation | Neogene (Tertiary) | Miocene | Medium to coarse (Antwerp members) sands, slightly clayey and enriched in glauconite and shells |
| 38.95–42 m | Boom Formation | Paleogene (Tertiary) | Oligocene | Grey silty clay |
| Depth Interval (from Surface) | Formation or Type | Period | Epoch | Lithology |
|---|---|---|---|---|
| 0–0.5 m | Disturbed soil | Quaternary | Reworked materials | |
| 0–2.5 m | Gent Formation | Quaternary | Pleistocene | Reworked materials (bricks...), aeolian sand and silt |
| 2.5–10 m | Berchem Formation | Neogene (Tertiary) | Miocene | Fine to medium fine sands, slightly clayey and enriched in glauconite and shells |
Publisher’s Note: MDPI stays neutral with regard to jurisdictional claims in published maps and institutional affiliations. |
© 2021 by the authors. Licensee MDPI, Basel, Switzerland. This article is an open access article distributed under the terms and conditions of the Creative Commons Attribution (CC BY) license (http://creativecommons.org/licenses/by/4.0/).
Share and Cite
Declercq, P.-Y.; Gérard, P.; Pirard, E.; Walstra, J.; Devleeschouwer, X. Long-Term Subsidence Monitoring of the Alluvial Plain of the Scheldt River in Antwerp (Belgium) Using Radar Interferometry. Remote Sens. 2021, 13, 1160. https://doi.org/10.3390/rs13061160
Declercq P-Y, Gérard P, Pirard E, Walstra J, Devleeschouwer X. Long-Term Subsidence Monitoring of the Alluvial Plain of the Scheldt River in Antwerp (Belgium) Using Radar Interferometry. Remote Sensing. 2021; 13(6):1160. https://doi.org/10.3390/rs13061160
Chicago/Turabian StyleDeclercq, Pierre-Yves, Pierre Gérard, Eric Pirard, Jan Walstra, and Xavier Devleeschouwer. 2021. "Long-Term Subsidence Monitoring of the Alluvial Plain of the Scheldt River in Antwerp (Belgium) Using Radar Interferometry" Remote Sensing 13, no. 6: 1160. https://doi.org/10.3390/rs13061160
APA StyleDeclercq, P.-Y., Gérard, P., Pirard, E., Walstra, J., & Devleeschouwer, X. (2021). Long-Term Subsidence Monitoring of the Alluvial Plain of the Scheldt River in Antwerp (Belgium) Using Radar Interferometry. Remote Sensing, 13(6), 1160. https://doi.org/10.3390/rs13061160