Abstract
Edge applications evolved into a variety of scenarios that include the acquisition and compression of immense amounts of images acquired in space remote environments such as satellites and drones, where characteristics such as power have to be properly balanced with constrained memory and parallel computational resources. The CCSDS-123 is a standard for lossless compression of multispectral and hyperspectral images used in on-board satellites and military drones. This work explores the performance and power of 3 families of low-power heterogeneous Nvidia GPU Jetson architectures, namely the 128-core Nano, the 256-core TX2 and the 512-core Xavier AGX by proposing a parallel solution to the CCSDS-123 compressor on embedded systems, reducing development effort, compared to the production of dedicated circuits, while maintaining low power. This solution parallelizes the predictor on the low-power GPU while the entropy encoders exploit the heterogeneous multiple CPU cores and the GPU concurrently. We report more than GSamples/s for the predictor and up to Gb/s for the complete system, requiring less than 11 W and providing an efficiency of 611 Mb/s/W.
1. Introduction
Many remote sensing systems that generate multispectral and hyperspectral images (MHIs) incorporate the need of compression algorithms such as the Consultative Committee for Space Data Systems (CCSDS)-123 [1]. These are the cases of satellites and military drones, which impose severe power restrictions, creating the need of low-power systems and architectures capable of processing onboard MHI compression at acceptable cost [2]. For instance, remote sensing systems, such as unmanned aerial vehicles (UAVs), can benefit from having the same parallel system for acquiring [3] and compressing data, particularly, in scenarios requiring large amounts of sensing data in short periods (natural disasters, earthquakes, subsidence, etc.) [4,5].
The CCSDS-123 MHI compression standard is composed of two main parts: a predictor and an entropy encoder. The predictor uses an adaptive 3D model that calculates the difference between observed and predicted values, outputting mapped prediction residuals (MPRs) () with low entropy [1]. The predicted values are calculated by their neighboring samples and by P neighboring bands. Those MPRs can be encoded by two types of entropy coders, producing variable length codewords: the sample-adaptive entropy coder, encoding MPRs independently for each spectral band, and the block-adaptive entropy encoder [1] that encodes blocks of 8, 16, 32 or 64 residuals. The latter applies four encoding algorithms to each block and selects the method which yields a better compression ratio.
This paper efficiently exploits three low-power parallel graphics processing unit (GPU) architectures [6,7,8] to accelerate the CCSDS-123 standard. Unlike previous GPU implementations [9,10,11], this work uses a heterogeneous (central processing unit (CPU) + GPU) system for the encoder, capable of producing very high performance while requiring low-power. The best performing solution presents the highest throughput performance in the literature [9,10,11,12,13,14,15,16,17,18,19,20] and the best efficiency among CPU and GPU implementations [9,10,11,20] and surpasses one field-programmable gate array (FPGA) implementation [14]. The solutions compare parallel versus serial execution times, providing distinct performances as a function of number of cores and bandwidth available. Reports show they can reach up to Gb/s for the best case scenario, which represents an increase in performance of 150 × compared to the sequential single-core Nano version. In addition, the power analysis is performed, by constantly monitoring the power required by each platform over time. Compared against single-CPU devices or high-end desktop GPUs, the energy efficiency of the proposed solutions improves significantly, reaching 611 Mb/s/W against the single-CPU sequential versions of the algorithm.
2. Parallel 3D Predictor
Algorithms can be parallelized following a single instruction, multiple data (SIMD) approach. However, data dependencies can increase the complexity of the implementation and hinder the speedup potential. Following an SIMD philosophy, the proposed approach uses a GPU architecture to parallelize the predictor, achieving sample-level parallelism. However, four blocks (scaled predicted sample, scaled predicted error, weights vector and inner product) present a circular data dependency as shown in Figure 1. The proposed strategy is to isolate this dependency in one kernel (weights kernel) and process the remaining blocks separately. The weights vector block uses previous values within the same band to update the vector and for that reason, this block can only achieve band-level parallelism. Since the weights vector block has a granularity constraint, the blocks in the same kernel are executed with band-level parallelism, instead of achieving sample-level parallelism, thus reducing throughput for this kernel. The detailed mathematical description of the predictor was omitted from this manuscript due to dimension constraints, but can be found in chapter 4 of [1].
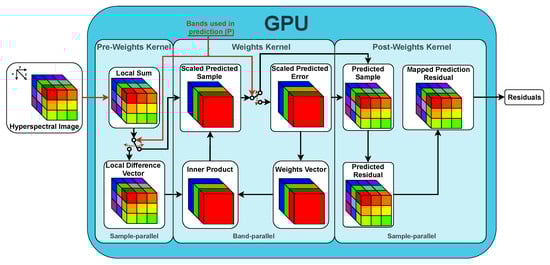
Figure 1.
Proposed architecture for Consultative Committee for Space Data 19 Systems (CCSDS)-123 parallel 3D predictor. The switch determines the predictor’s mode of operation. In the current position, the predictor executes intra-band prediction mode (), while, for inter-prediction (), the two switches move to the other position, including several bands in the predictor. The weights kernel achieves band-level parallelism while the remaining kernels execute with sample-level parallelism.
As described in Figure 1, if the compressor executes on reduced mode, no adjacent bands are used in prediction () and the predictor’s diagram is simplified, ignoring the local difference vector, scaled predicted error, weights vector and inner product blocks [1]. In turn, the constraint from the weights vector block that provokes band-level parallelism to be eliminated and the Weights Kernel can achieve sample-level parallelism.
Since inter-band prediction does not increase significantly the compression ratio for most images [1,21] and using a high number of bands in prediction decreases throughput performance [10,22], the following results use . The GPU implementations described in the paper use shared memory for faster memory access times, vectorized memory accesses through memory transactions that exploit the memory bus width and streams allowing to efficiently overlap kernel execution with data transfers.
3. Parallel Entropy Encoders
The CCSDS-123 contemplates two different entropy encoders that can encode the MPRs produced by the predictor [1]. The encoding process is essentially serial, meaning that an SIMD approach on a many-core architecture, such as in a GPU, would not benefit parallelization since there is a high level of data dependencies. However, some parallelization can be extracted to a certain degree. The proposed solution comprises of assigning a determined amount of MPRs to be processed in the available CPU cores to generate smaller compressed bitstreams. Each core outputs a variable-length bitstream, and since direct single-bit read/write operations are not possible on GPUs and CPUs, a final step is required for concatenating the partial bitstreams into a single one, through the use of mask and shift operations.
3.1. Sample Adaptive Entropy Encoder
The predictor outputs MPRs for every sample, which are encoded individually by the sample adaptive entropy encoder. The proposed solution assigns several MPRs bands to be encoded in each available CPU core, generating multiple bitstreams as illustrated on the left side of Figure 2. After the bitstream generation finishes in all cores, the final step is to combine all generated bitstreams into a single one, using one of the CPU cores. For similar CPU cores, the load is distributed equally between the available cores. For systems with different CPU combinations, the load distribution must be manually tuned in order to equalize execution times between cores. Further description of the sample adaptive entropy encoder can be found in chapter 5, in particular of [1].
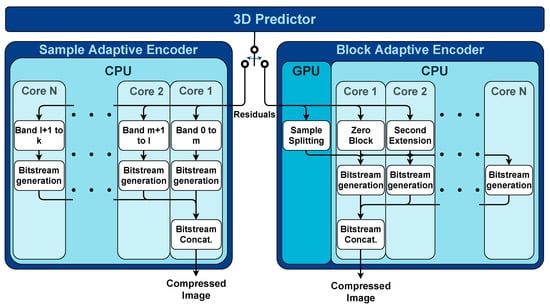
Figure 2.
Proposed parallel sample (left) and block (right) adaptive entropy encoders. On the left side, a determined number of mapped prediction residual (MPR) bands is assigned to each core producing bitstreams. The final step consists of concatenating the bitstreams into one. The right side encodes blocks of MPRs and includes a pre-processing stage of three methods, applying each one to every block to choose the best-compressed one. These methods run concurrently on the GPU and CPU and result in a faster encoding process.
3.2. Block Adaptive Entropy Encoder
As presented on the right side of Figure 2, the CCSDS-123 also includes a block adaptive entropy encoder, which can encode blocks of 8, 16, 32 or 64 MPRs. This solution differs from the sample adaptive entropy encoder by grouping blocks of MPRs and applying a pre-processing stage containing three methods for compressing MPRs, resulting in a faster encoding process by including a pre-processing stage [21]. These methods are applied to every block of MPRs.
For each block, the best-compressed solution is chosen to be incorporated into the bitstream. The zero block counts the number of consecutive all-zero blocks and the second extension method encodes pairs of MPRs in the same block, thus reducing the number of MPRs by half. These methods are mainly sequential and the proposed solution executes each one of them on two arbitrary CPU cores. The sample splitting method selects the k least-significant bits from the MPR and encodes them as its binary representation (k iterates from 0 to 13). This method can be better exposed to parallelization, and thus executed in the GPU, since there are 14 independent compression possibilities and it is the heaviest method from empirical evidence.
After the compression methods are successfully applied to all blocks, the bitstream generation stage chooses the pre-processed blocks from the previous stage that produce the best compression ratio. The work performed on this stage is distributed among all available CPU cores, building parts of the final bitstream. When the bitstream generation finishes in all cores, the last step concatenates the generated bitstreams using one CPU core. Further details on this encoder’s description can be found in chapter 5, more specifically in of [1].
4. Experimental Results
The experimental results were conducted on three low-power embedded systems with different specifications, indicated in Table 1, to assess the proposed designs.

Table 1.
Summary of Nvidia’s Jetson platform specifications.
The serial version uses a code provided by the European space agency (ESA) [23] running on a single core of the Jetson Nano through taskset –cpu-list command. All the speedups mentioned in this paper are calculated in relation to the single-core serial version. The presented values denote the mean value of 20 executed runs. The code was developed in C and CUDA, enabling the production of multithreaded processes using the library Pthreads. Moreover, clock_getime() from the time.h C library was used to measure execution times. The predictor runs on reduced mode and column-oriented local sums with , , , , and default weight initialization. The entropy encoders use and encoding on band sequential (BSQ) order. The sample adaptive encoder uses , , and , while the block adaptive uses and , as stated in [1,24]. The images used in the experiments have a dynamic range (D) of 16 bits per sample and their dimension are described in Table 2. The parallel implementation can be found in [25].
Table 2.
Dimensions of the images used in this paper.
The results obtained in [20,21] were upgraded by better exploiting the kernels configuration on the predictor and encoders, the load balance between the Denver 2 and ARM CPUs was improved and the sample splitting GPU was enhanced. Due to these platforms sharing RAM between CPU and GPU.
4.1. Predictor Performance
The parallel predictor solution loads the entire image into the GPU’s global memory. Afterwards, the columns are stored in shared memory while GPU registers save the remaining variables to ensure that the faster GPU memory types are used. In order to exploit the memory bus width, vectorized accesses are employed by packing bands together in 64, 128 and 256 bits, reducing the number of memory transactions.
The Nvidia’s occupancy calculator tool was used to maximize kernel occupancy for the predictor, with each block executing 2 columns (1024 threads/block for AVIRIS, 1020 threads/block for CRISM, 812 threads/block for CASI).
An approach using streams was tried, which overlaps data transfers with kernel execution. Streams are launched which execute groups of 1, 2, 3, 4, 7, 9, 14, 17, 28 or 34 bands according to the number of bands of the image. However, launching too many streams can introduce overheads for small data transfers, reducing streaming efficacy. For TX2 and Xavier, solutions without streaming and using pinned memory achieve better performance relative to solution with streams. However, due to the low clock frequency and lack of memory of Nano GPU, which has increased transfer times, streaming improves performance. The solution uses 2 streams for the CASI image, 4 streams for the AVIRIS images and 8 streams for the CRISM images.
The obtained speedup, shown in Figure 3 for the Nano, is around 33 times. The speedup increases by 6 times on the TX2 compared to the parallel version of Nano. This can be explained by the increased memory bus width, from 64 to 128 bits and increased GPU clock frequency. The speedup is further incremented in the Xavier, which has double the CUDA cores.
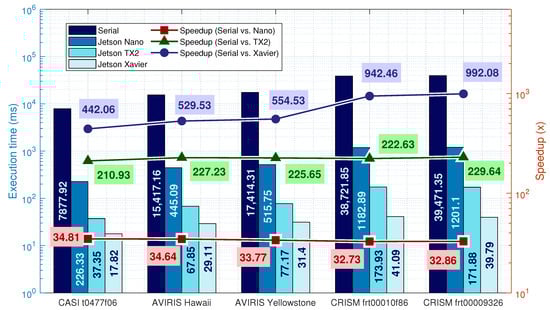
Figure 3.
CCSDS-123 parallel predictor implemented on the GPU for . The bars represent execution time while the lines represent speedup relative to serial execution time running in a single-core on the Nano system (For the CRISM images, the Nano executes half of the bands for the predictor and both encoders due to memory restrictions. The presented values are multiplied by two to simulate the full image workload).
From the analysis of Xavier’s speedup, it can be concluded that the speedup scales it with the size of the image if there is available memory. This effect is not observed on the Nano since its memory is very limited. On TX2, it is possible to observe a small increase from the CASI to the AVIRIS, however, in the CRISM images, the system uses more than 90% of available RAM which yields poor performance.
4.2. Sample Adaptive Entropy Encoder Performance
For the sample adaptive entropy encoder, the results are illustrated in Figure 4. The proposed solution uses multiple cores to encode several MPRs bands and concatenate the generated bitstreams in one core, as depicted in Figure 2. The general rule is to divide the number of MPR bands equally between the available cores. Table 3 contains the used division of bands. However, TX2 presents two different CPUs. In this case, the number of bands assigned to each core is tuned to reduce the execution time difference between the cores, guaranteeing a variation less than 10%.
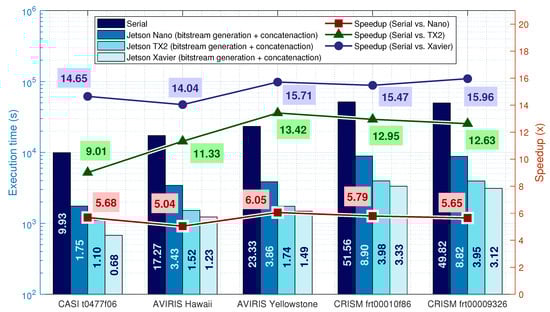
Figure 4.
CCSDS-123 parallel sample adaptive entropy encoder execution times and speedups in multiple cores CPUs. The bars represent execution time of the worst-performing core of the bitstream generation and the bitstream concatenation time (please see Figure 2), while the lines represent speedup relative to serial execution time running in a single-core on the Nano system (For the CRISM images, the Nano executes half of the bands for the predictor and both encoders due to memory restrictions. The presented values are multiplied by two to simulate the full image workload).
Table 3.
Number of bands executed in each core during the bitstream generation on the parallel sample adaptive entropy encoder. CRISM images have an odd number of bands, thus one core executes the last band.
Using all 8 Xavier cores to generate the bitstreams resulted in slower execution. Poor results were also reported in [26]. It was found that a 4-core configuration, with one active core per cluster, resulted in a better performance compared to the TX2.
In this implementation, the stream concatenation stage represents less than 3% of the total execution time and is not presented in Figure 4. The speedups for the Nano are between and 6 times. Optimizations on the encoder were made by fixing the parameters and improving the bit writing functions, discarding the unnecessary variable-length memory writes when possible. This, allied with the exploitation of cache L2 for requesting data blocks that serve multiple cores, allows for speedups above the number of cores. The TX2 speedups more than doubled due to the increased number of cores and clock frequency. For the Xavier, the solution with one active core per cluster is enough to become a better solution than the TX2 due to Xavier’s CPU architecture having an increased clock frequency, 10-wide superscalar architecture and smaller process node design, covering the performance increase from the 6-core solution of the TX2.
4.3. Block Adaptive Entropy Encoder Performance
The parallel block adaptive entropy encoder is hardest to analyze due to having a high number of components with data dependencies. Figure 5 depicts the various platforms’ total execution times, while Table 4 details the measured times for each component. This implementation contains data dependencies where the bitstream generation starts after all blocks from the 3 methods finish and the bitstream concatenation starts after all cores from the bitstream generation finish. The MPR blocks are equally distributed among the available cores in the bitstream generation, however, for the TX2, the loads are balanced in order to obtain similar execution times, with the ARM CPU executing 43.6% of all MPR blocks and the Denver 2 CPU executing the 56.4% remaining blocks.
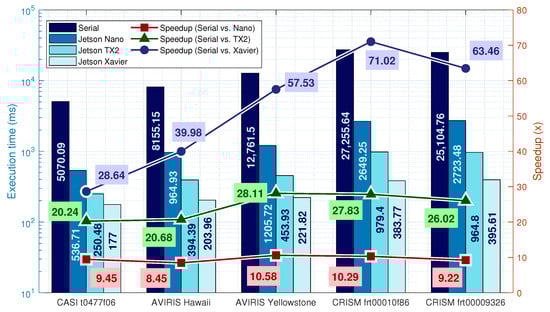
Figure 5.
Parallel block adaptive entropy encoder speedups and total execution times. The bars represent the total execution time of the longest of the 3 methods, the worst-performing core of the bitstream generation and the bitstream concatenation time (see Figure 2). The lines represent speedup relative to serial execution time running in a single-core on the Nano platform (For the CRISM images, the Nano executes half of the bands for the predictor and both encoders due to memory restrictions. The presented values are multiplied by two to simulate the full image workload).
Table 4.
Detailed execution times for the parallel block adaptive entropy encoder in milliseconds.
From inspection of Table 4, it is observed that the methods execution take approximately 45% of the total execution time, while the bitstream generation takes about 50% and the bitstream concatenation takes 5% on the Nano and TX2. For Xavier, CPU characteristics change values to between 45% and 55% for the methods, 35% and 45% to bitstream generation and 10% for the bitstream concatenation. It is observed from Table 4 that from the 3 methods, Sample Splitting is longest to execute, however, on the TX2 and Xavier and for the CRISM images, this method is faster than the Second extension, suggesting that the GPU Sample Splitting scales well for large images in GPUs with enough resources, since the potential for parallelization is higher on GPUs than in CPUs.
On the Xavier platform, a speedup of 71 times was obtained for the larger images. This suggests that the speedup scales for larger images and architectures with more CPU cores and powerful GPUs. The increase in speedup is not so evident for the remaining platforms due to the CRISM image occupying most of the available memory.
4.4. Power Analysis
The TX2 and Xavier come with power monitors, enabling power measurement across the whole system. The manufacturer recommends measuring power every second since higher measurement frequencies will consume CPU resources and biasing the measured result. Since some execution times are below one second, multiple runs were executed to pick power measurements while the predictor/encoder were executing. However, the Nano does not have power monitors and instead, an external power meter was used.
Table 5 presents the tested images’ performance using the parallel predictor and the parallel block adaptive entropy encoder. The sample adaptive entropy encoder is not presented in this table due to space restrictions of the manuscript. These tests were executed in Max-N power mode, producing the best performance possible, while Table 6 presents results for the lowest power modes, 5 W for Nano, for TX2 and 10 W for Xavier.
Table 5.
Overall performance for the tested images using the parallel predictor and block adaptive entropy encoder in the maximum power modes.
Table 6.
Overall performance for the tested images using the parallel predictor and block adaptive entropy encoder in low power modes.
Although drawing more power, the Xavier achieved the best efficiency of Mb/s/W and crossing the barrier of Gb/s, through better implementation and semiconductor technology, such as the adoption of small process node designs (12 nm). From the best of our knowledge, the work proposed in this paper surpasses the literature in terms of energy-efficiency and throughput compared to CPUs and GPUs.
Ultra-Low-Power Modes
For low power modes, throughput performance and efficiency decreased due to the lowered power budget and reduced number of available CPU cores, from 4 to 2 in the Nano, 6 to 4 in the TX2 and 8 to 2 cores on the Xavier. Low power modes did not show any significant advantage due the decreased number of the available CPU cores. Throughput performance decreased approximately 2 times for Nano and TX2, while power decreased times, as shown in Figure 6. Xavier’s throughput performance decreased while power decreased times. To conclude, low power modes can have benefits in power-restrained systems but do not increase efficiency, with overall efficiency decreasing times across all platforms.
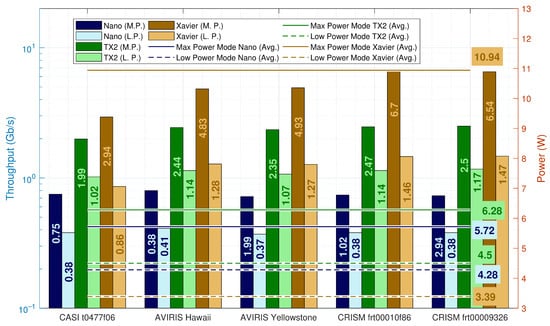
Figure 6.
Throughput performance for maximum power and low power modes across all platforms. The left axis represents throughput (bars) and the right one represents the average power (continuous and dashed lines) for the maximum and low power modes.
5. Related Work
The surveyed literature presents implementations of parallel CCSDS-123 algorithms on FPGAs, GPUs and CPU [10,11,12,13,14,15,16,17,18,19]. Table 7 presents a summary of the best performing solutions. In [13,14], the authors proposed designs on space-grade FPGAs (Virtex 5QV) tolerant against space radiation, providing flexible and high-performance solutions on low-power platforms. By identifying the parameters that affect performance, the authors in [14] propose a low complexity architecture with little hardware occupancy, executing segmented parts of the MHI. This work is also used in [19], proposing a parallel design using a dynamic and partial reconfiguration scheme to deploy multiple accelerators running HyLoC [14], encoding different segments of the image. However, the older memory-constrained FPGAs cannot execute the algorithm efficiently due to the lack of resources [13]. In [18], the authors proposed an FPGA with segment-level parallelism on the X, Y and Z axis in order to improve robustness against data corruption, achieving place and route results.
Table 7.
Surveyed CCSDS-123 parallel implementations on field-programmable gate arrays (FPGAs), GPUs and CPUs. * Higher is better.
Further improvements were introduced by Orlandić et al. by proposing an FPGA design using several parallel pipelines with optimized data routing between them for sharing intermediate variables [15]. Santos et al. provided two intellectual property (IP) cores for the CCSDS-121 and CCSDS-123, allowing those to be integrated into the onboard satellite’s embedded system [16]. The research group further improved the implementation [17] by including several features: the use of external memory with burst transfers to store intermediate values, excluding optional features from design to improve throughput, adding an optional unit-delay predictor and using a custom weight initialization.
On GPUs, by analyzing all parameters, Davidson et al. [10] showed that prediction mode, prediction neighborhood (column-oriented or neighbor-oriented) and the number of bands used in prediction (P) had the most impact on the algorithm’s compression ability.
The authors in [11] proposed two implementations using CUDA and OpenMP programming languages to explore spectral and spatial parallelism of the CCSDS-123, obtaining superior performance for the version using CUDA. The paper details how data reuse and the high-speed GPU memory can be manipulated to exploit parallel architectures. Moreover, in [9], the authors used a low-power Nvidia Jetson TX1 embedded system to test GPU architecture’s resilience against space radiation. The highest energy-efficiency previously found in the literature amongst GPUs and CPUs reports Mb/s/W requiring 4.7 W [20].
6. Conclusions
The use of heterogeneous parallel solutions on low-power embedded systems can significantly increase the performance of single-threaded applications. The proposed parallel CCSDS-123 standard achieved a throughput performance over Gb/s and decreased execution time by 150 times compared to the Nano’s serial version. To date, and to the best of our knowledge, the achieved results surpass the previous reports found in the literature for CPUs and GPUs. Compared to FPGAs, if power constraints are relaxed, GPUs are more competitive due to having higher flexibility and lower development effort.
The proposed system can be employed in remote sensing systems to reduce image compression latency, bandwidth and transmission time and provide flexibility to process different tasks, such as multi-temporal synthetic-aperture radar (SAR) satellite imaging [3]. High-throughput systems can have a meaningful impact on natural disaster scenarios where remote sensing data are required in short periods [5].
Author Contributions
All authors participated in the conceptualization and methodology towards the development of this research work. O.F. was responsible for developing and validating all software. V.S. and G.F. contributed to the formal analysis of the problem and supervised the investigation performed by O.F. O.F. also wrote the original draft, revised and edited by V.S. and G.F. Both supervisors were responsible for acquiring funding that conducted to the presented research work. All authors have read and agreed to the published version of the manuscript.
Funding
This research was funded by Instituto de Telecomunicações and Fundação para a Ciência e a Tecnologia under grants UIDB/50008/2020, 2020.07124.BD and PTDC/EEI-HAC/30485/2017.
Institutional Review Board Statement
Not applicable.
Informed Consent Statement
Not applicable.
Data Availability Statement
Publicly available code can be found here: https://github.com/oscarferraz/CCSDS-123 (accessed on 13 February 2021).
Conflicts of Interest
The authors declare no conflict of interest. The funders had no role in the design of the study; in the collection, analyses or interpretation of data; in the writing of the manuscript, or in the decision to publish the results.
References
- Consultative Committee for Space Data Systems. CCSDS 123.0-B-2 Low-Complexity Lossless and Near-Lossless Multispectral & Hyperspectral Image Compression. 2019. Available online: https://public.ccsds.org/Pubs/123x0b1ec1s.pdf (accessed on 11 March 2021).
- Adão, T.; Hruška, J.; Pádua, L.; Bessa, J.; Peres, E.; Morais, R.; Sousa, J.J. Hyperspectral imaging: A review on UAV-based sensors, data processing and applications for agriculture and forestry. Remote Sens. 2017, 9, 1110. [Google Scholar] [CrossRef]
- Yu, Y.; Balz, T.; Luo, H.; Liao, M.; Zhang, L. GPU accelerated interferometric SAR processing for Sentinel-1 TOPS data. Comput. Geosci. 2019, 129, 12–25. [Google Scholar] [CrossRef]
- Erdelj, M.; Natalizio, E. UAV-assisted disaster management: Applications and open issues. In Proceedings of the 2016 International Conference on Computing, Networking and Communications (ICNC), Kauai, HI, USA, 15–18 February 2016; pp. 1–5. [Google Scholar] [CrossRef]
- Ciampoli, L.B.; Gagliardi, V.; Clementini, C.; Latini, D.; Del Frate, F.; Benedetto, A. Transport infrastructure monitoring by InSAR and GPR data fusion. Surv. Geophys. 2019, 1–24. [Google Scholar] [CrossRef]
- Sheshadri, S.H.; Franklin, D. Introducing the Ultimate Starter AI Computer, the NVIDIA Jetson Nano 2GB Developer Kit. Available online: https://developer.nvidia.com/blog/ultimate-starter-ai-computer-jetson-nano-2gb-developer-kit/ (accessed on 11 March 2021).
- Franklin, D. NVIDIA Developer Blog: NVIDIA Jetson TX2 Delivers Twice the Intelligence to the Edge. Available online: https://devblogs.nvidia.com/jetson-tx2-delivers-twice-intelligence-edge/ (accessed on 11 March 2021).
- Franklin, D. NVIDIA Jetson AGX Xavier Delivers 32 TeraOps for New Era of AI in Robotics. Available online: https://developer.nvidia.com/blog/nvidia-jetson-agx-xavier-32-teraops-ai-robotics/ (accessed on 11 March 2021).
- Davidson, R.L.; Bridges, C.P. Error Resilient GPU Accelerated Image Processing for Space Applications. IEEE Trans. Parallel Distrib. Syst. 2018, 29, 1990–2003. [Google Scholar] [CrossRef]
- Davidson, R.L.; Bridges, C.P. GPU accelerated multispectral EO imagery optimised CCSDS-123 lossless compression implementation. In Proceedings of the 2017 IEEE Conference on Aerospace (AeroConf), Big Sky, MT, USA, 4–11 March 2017; pp. 1–12. [Google Scholar] [CrossRef]
- Hopson, B.; Benkrid, K.; Keymeulen, D.; Aranki, N. Real-time CCSDS lossless adaptive hyperspectral image compression on parallel GPGPU & multicore processor systems. In Proceedings of the 2012 NASA/ESA Conference on Adaptive Hardware and Systems, Erlangen, Germany, 25–28 June 2012; pp. 107–114. [Google Scholar] [CrossRef]
- Keymeulen, D.; Aranki, N.; Bakhshi, A.; Luong, H.; Sarture, C.; Dolman, D. Airborne demonstration of FPGA implementation of Fast Lossless hyperspectral data compression system. In Proceedings of the 2014 NASA/ESA Conference on Adaptive Hardware and Systems, Leicester, UK, 14–18 July 2014; pp. 278–284. [Google Scholar] [CrossRef]
- Báscones, D.; González, C.; Mozos, D. Parallel Implementation of the CCSDS 1.2.3 Standard for Hyperspectral Lossless Compression. J. Remote Sens. 2017, 7, 973. [Google Scholar] [CrossRef]
- Santos, L.; Berrojo, L.; Moreno, J.; López, J.F.; Sarmiento, R. Multispectral and Hyperspectral Lossless Compressor for Space Applications (HyLoC): A Low-Complexity FPGA Implementation of the CCSDS 123 Standard. IEEE J. Sel. Top. Appl. Earth Obs. Remote Sens. 2016, 9, 757–770. [Google Scholar] [CrossRef]
- Orlandić, M.; Fjeldtvedt, J.; Johansen, T.A. A parallel FPGA implementation of the CCSDS-123 compression algorithm. Remote Sens. 2019, 11, 673. [Google Scholar] [CrossRef]
- Santos, L.; Gómez, A.; Sarmiento, R. Implementation of CCSDS Standards for Lossless Multispectral and Hyperspectral Satellite Image Compression. IEEE Trans. Aerosp. Electron. Syst. 2020, 56, 1120–1138. [Google Scholar] [CrossRef]
- Barrios, Y.; Sánchez, A.J.; Santos, L.; Sarmiento, R. SHyLoC 2.0: A Versatile Hardware Solution for On-Board Data and Hyperspectral Image Compression on Future Space Missions. IEEE Access 2020, 8, 54269–54287. [Google Scholar] [CrossRef]
- Tsigkanos, A.; Kranitis, N.; Theodoropoulos, D.; Paschalis, A. High-Performance COTS FPGA SoC for Parallel Hyperspectral Image Compression with CCSDS-123.0-B-1. IEEE Trans. Very Large Scale Integr. (VLSI) Syst. 2020, 28, 2397–2409. [Google Scholar] [CrossRef]
- Rodríguez, A.; Santos, L.; Sarmiento, R.; De La Torre, E. Scalable Hardware-Based On-Board Processing for Run-Time Adaptive Lossless Hyperspectral Compression. IEEE Access 2019, 7, 10644–10652. [Google Scholar] [CrossRef]
- Ferraz, O.; Falcao, G.; Silva, V. Gbit/s Throughput Under 6.3-W Lossless Hyperspectral Image Compression on Parallel Embedded Devices. IEEE Embed. Syst. Lett. 2021, 13, 13–16. [Google Scholar] [CrossRef]
- Ferraz, O.; Silva, V.; Falcao, G. 1.5 GBIT/S 4.9 W Hyperspectral Image Encoders on a Low-Power Parallel Heterogeneous Processing Platform. In Proceedings of the ICASSP 2020—2020 IEEE International Conference on Acoustics, Speech and Signal Processing (ICASSP), Barcelona, Spain, 4–8 May 2020; pp. 1693–1697. [Google Scholar] [CrossRef]
- Ferraz, O.A. Combining Low-Power with Parallel Processing for Multispectral and Hyperspectral Image Compression. Master’s Thesis, Universidade de Coimbra, Coimbra, Portugal, 2019. [Google Scholar]
- ESA. European Space Agency Public License—v2.0. Available online: https://amstel.estec.esa.int/tecedm/misc/ESA_OSS_license.html (accessed on 11 March 2021).
- Blanes, I.; Kiely, A.; Hernández-Cabronero, M.; Serra-Sagristà, J. Performance impact of parameter tuning on the CCSDS-123.0-B-2 low-complexity lossless and near-lossless multispectral and hyperspectral image compression standard. Remote Sens. 2019, 11, 1390. [Google Scholar] [CrossRef]
- Ferraz, O. CCSDS. Available online: https://github.com/oscarferraz/CCSDS-123 (accessed on 11 March 2021).
- Ullah, S.; Kim, D. Benchmarking Jetson Platform for 3D Point-Cloud and Hyper-Spectral Image Classification. In Proceedings of the 2020 IEEE International Conference on Big Data and Smart Computing (BigComp), Busan, Korea, 19–22 February 2020; pp. 477–482. [Google Scholar] [CrossRef]


Publisher’s Note: MDPI stays neutral with regard to jurisdictional claims in published maps and institutional affiliations. |
© 2021 by the authors. Licensee MDPI, Basel, Switzerland. This article is an open access article distributed under the terms and conditions of the Creative Commons Attribution (CC BY) license (http://creativecommons.org/licenses/by/4.0/).