Article

Assimilation of Multi-Source Precipitation Data over Southeast China Using a Nonparametric Framework

1
State Key Laboratory of Internet of Things for Smart City and Department of Civil and Environmental Engineering, University of Macau, Macao 999078, China
2
Center for Ocean Research in Hong Kong and Macau (CORE), Hong Kong 999077, China
3
Key Laboratory of Beibu Gulf Environment Change and Resources Use, Ministry of Education, Nanning Normal University, Nanning 530001, China
4
Key Laboratory of Water Cycle and Related Land Surface Processes, Institute of Geographical Sciences and Natural Resources Research, Chinese Academy of Sciences, Beijing 100101, China
5
University of Chinese Academy of Sciences, Beijing 100049, China
*
Author to whom correspondence should be addressed.
Remote Sens. 2021, 13(6), 1057; https://doi.org/10.3390/rs13061057
Submission received: 10 January 2021 / Revised: 24 February 2021 / Accepted: 2 March 2021 / Published: 11 March 2021
(This article belongs to the Special Issue Remote Sensing in Hydrology and Water Resources Management)

Abstract

:
The accuracy of the rain distribution could be enhanced by assimilating the remotely sensed and gauge-based precipitation data. In this study, a new nonparametric general regression (NGR) framework was proposed to assimilate satellite- and gauge-based rainfall data over southeast China (SEC). The assimilated rainfall data in Meiyu and Typhoon seasons, in different months, as well as during rainfall events with various rainfall intensities were evaluated to assess the performance of this proposed framework. In rainy season (Meiyu and Typhoon seasons), the proposed method obtained the estimates with smaller total absolute deviations than those of the other satellite products (i.e., 3B42RT and 3B42V7). In general, the NGR framework outperformed the original satellites generally on root-mean-square error (RMSE) and mean absolute error (MAE), especially on Nash-Sutcliffe coefficient of efficiency (NSE). At monthly scale, the performance of assimilated data by NGR was better than those of satellite-based products in most months, by exhibiting larger correlation coefficients (CC) in 6 months, smaller RMSE and MAE in at least 9 months and larger NSE in 9 months, respectively. Moreover, the estimates from NGR have been proven to perform better than the two satellite-based products with respect to the simulation of the gauge observations under different rainfall scenarios (i.e., light rain, moderate rain and heavy rain).

1. Introduction

As a key component within the water and energy cycle system, precipitation plays a crucial role in the fields of hydrology, meteorology and water resources management [1,2,3,4,5,6,7]. Accurate precipitation is an essential model input to predict the hydrological responses of the selected watershed and the potential rain-induced hazards [8,9,10,11]. Therefore, attention is drawn to estimating the precipitation distribution using different methods. The ground rain gauge is a common approach for measuring precipitation at specific locations during a prescribed period, which is of high credibility after calibration. In many cases, however, the sparsely distributed rain gauges could not provide sufficient precipitation data which can represent its spatial variability in detail [1,12]. Alternatively, remote sensing techniques can supply precipitation data on a global scale [13], which is exempt from the topographic restriction.
During the past two decades, on the merits of satellite sensors and signal-processing algorithms, rainfall products are emerging, such as the Precipitation Estimation from Remotely Sensed Information Using Artificial Neural Networks (PERSIANN) (as listed in Table 1) [14], the precipitation dataset based on the Climate Prediction Center (CPC) Morphing (CMORPH) technique [15] derived using the motion vectors and morphed method, the Integrated Multi-satellite Retrievals for Global Precipitation Measurement (IMERG) dataset [16] and the Tropical Rainfall Measuring Mission (TRMM) Multi-satellite Precipitation Analysis (TMPA) [17]. Particularly, the TRMM satellite started to serve on 27 November 1997 and was decommissioned in 2015, nevertheless the corresponding blended rainfall data is still provided to the public until the transition (from TRMM to IMERG) is completed. The TMPA precipitation dataset including post-real time product (3B42V7) and near-real-time product (3B42RT) has been widely used over China [18,19,20,21].
The satellite-based rainfall products with fine spatio-temporal resolution is desirable, but the uncertainty and error originated from indirect measurements of precipitations inferred from micro-wave and infrared radar measurements are non-negligible [22]. Moreover, according to the evaluation of the satellite-based precipitation products over China [20,23,24], the performance of these products varies with different spatial and temporal scales. For instance, 3B42RT and PERSIANN significantly overestimate rainfall amounts across the Tibetan Plateau [25], but 3B42RT can detect the most flood warning events compared to IMERG [23]. Guo et al. [20] reported that 3B42V7 performed relatively better in northwestern China, but overestimated rain rates in southern China. Therefore, to obtain more accurate estimates which incorporate the merits of satellite-based and ground-based rainfall, multi-source precipitation datasets need to be assimilated. The satellite-based rainfall, ground-based gauge/radar rainfall data and some reanalysis precipitation datasets are typically selected as one of the assimilated sources [22,26,27]. Moreover, meteorological and land surface data, such as temperature, elevation and soil moisture, could also be adopted to estimate precipitation [22,28,29]. Introducing the meteorological and land surface data, however, might cause uncertainties due to the relatively low correlation between precipitation and the corresponding factors at a daily scale [30]. Moreover, the meteorological factors may involve lag effects or/and spatial variance, which should be investigated and discussed ahead. In addition, the accuracy of the precipitation products as part of the source datasets could be evaluated specifically with comparison to the gauge data under a certain assimilation framework. Therefore, two groups of TMPA dataset, namely the real-time product of 3B42RT and the post-real-time product of 3B42V7, were employed as source data in this study.
In general, the methodologies for assimilating multi-source precipitation datasets can be categorized into two major types, i.e., parametric and nonparametric methods [31,32]. In terms of parametric algorithms, a functional form with finite number of parameters must be specified by users, and the unknown parameters can be determined by evaluating the attributes of input–output data [33]. Nonparametric methods, alternatively, can reduce the complexity of determining the unknown parameters, which can construct the input–output relationship without prior knowledge of specifying functional form [34]. Moreover, nonparametric methods can be exempt from limitation of data types, such as spatial non-stationary rainfall data [24], and modeling of the relationships among independent and dependent variables. That is, nonparametric methods employ relatively weaker assumptions of data than traditional parametric approaches and model the nonadditive effects without explicit functional form.
In light of its advantages, some nonparametric algorithms have been developed recently and applied to assimilate the rainfall data. Bhuiyan et al. [35] combined multiple precipitation datasets using quantile regression forests (QRF) and evaluated the results from the perspective of stream simulations on the Iberian Peninsula. Ma et al. [36] derived the merged rainfall data over the Tibet Plateau by adopting the dynamic Bayesian model averaging scheme, and also evaluated the assimilated precipitation data in four seasons and at different elevations over Tibet. The artificial neural networks (ANNs) have also been used to assimilate multi-source precipitation data including satellite-based, gauge-based and radar datasets in different regions [37,38,39]. There are also other nonparametric methods, such as the general regression neural network (GRNN) [40] and Bayesian nonparametric general regression [41]. The performance of these nonparametric models in assimilating the rainfall data has not been tested. Nevertheless, studies to evaluate the application scenarios, such as the rainfall events with different intensities on different time scales, are still insufficient. The applicability of a certain fusion algorithm needs to be assessed for rainfall in Meiyu and Typhoon seasons, in different months, as well as rainfall events with various rainfall intensities.
In this study, a framework based on a nonparametric general regression (NGR) is proposed for assimilating gauge- and satellite-based precipitation data, and then it is applied to southeast China (SEC). Besides, this study yields more insights into evaluations of assimilated data on multiple scales. The study area and precipitation data resources are introduced first. Then, the proposed framework is depicted. Thereafter, the performance of the nonparametric framework is analyzed and the comparisons of assimilated results using NGR and multiple linear regression (MLR), as well as PERSIANN products, are conducted. In the end, some major conclusions are drawn.

2. Materials and Methods
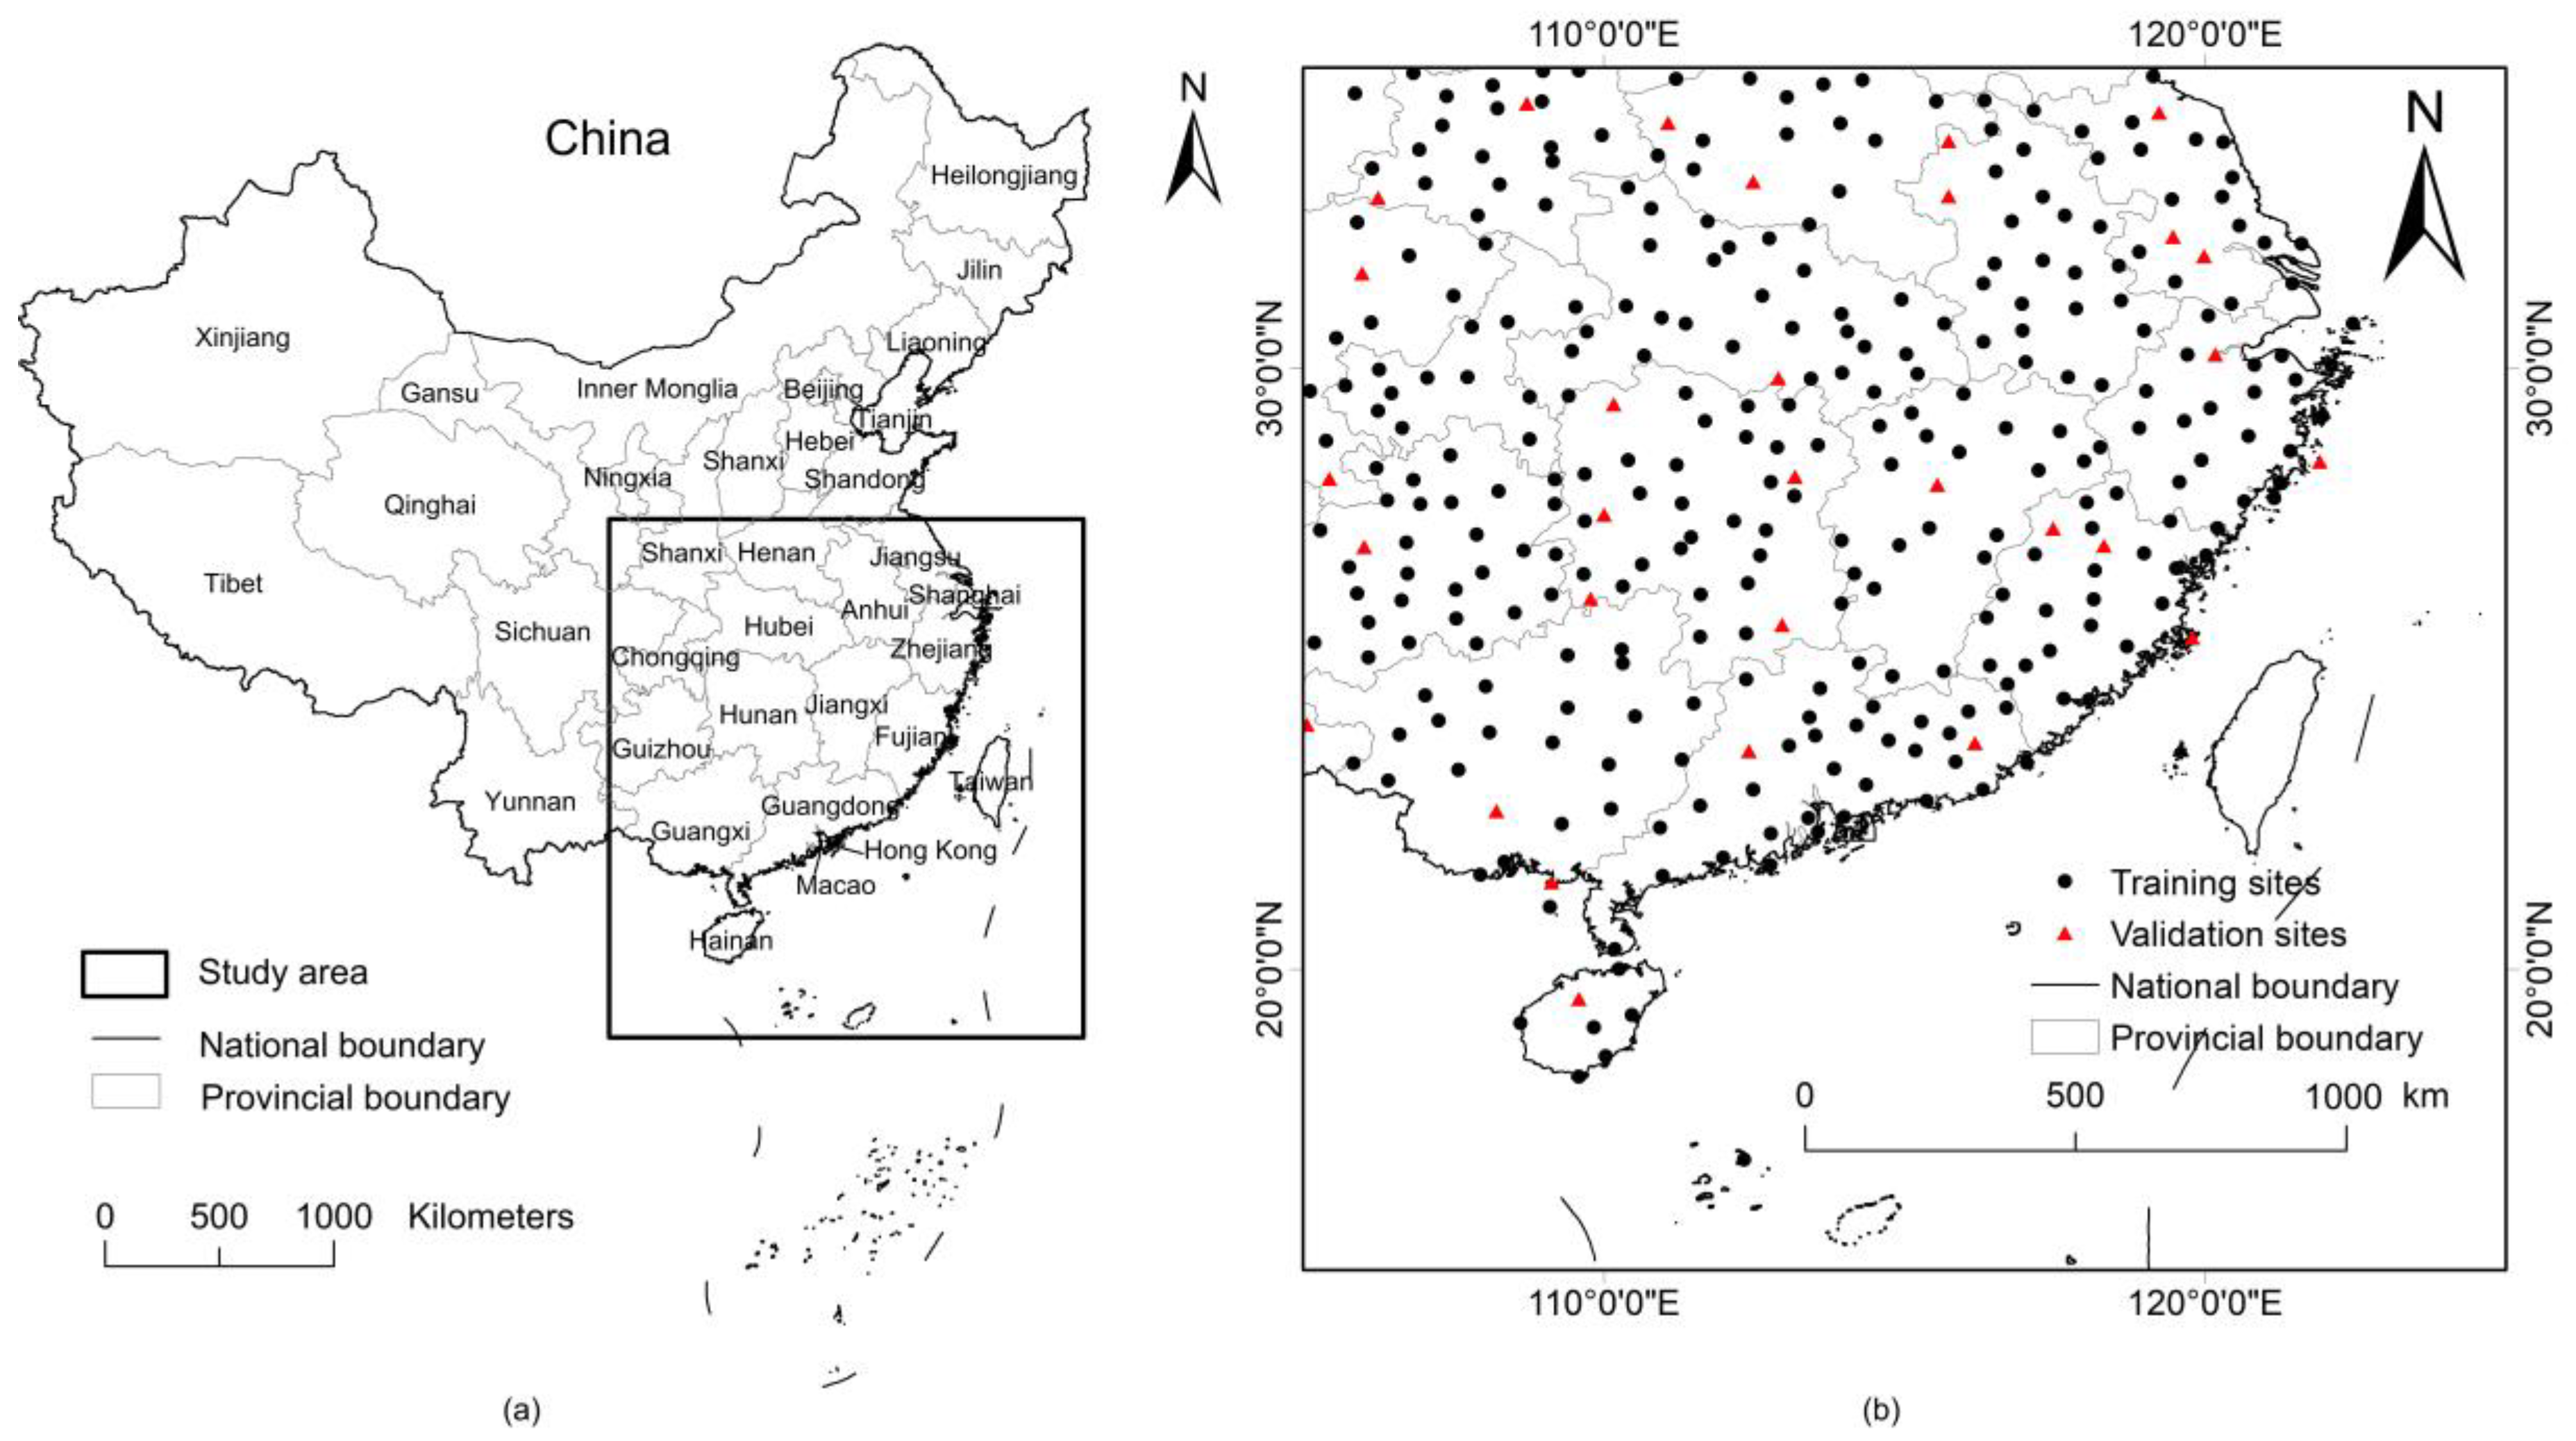
2.1. Study Area

The southeast China (SEC) was selected as the study area, ranging from (15° N, 105° E) to (35° N, 125° E). Figure 1 shows the location of the study area, and the distribution of rain gauges. In this area, East Asian monsoon dominates. Influenced by the summer monsoon, the majority of rainfall occurs in summer, which accounts for 60–85% of the annual total precipitation in SEC [42]. The precipitation is characterized by the trend of increasing from northeast to southeast, which shares a similar pattern with that of temperature over this region [43]. It is in general warm and humid in summer, while mild in winter [44]. The complex topography and climate features of SEC result in prominent spatiotemporal variability of precipitation [45]. Due to the increasing extreme precipitation events, SEC is becoming more and more prone to floods, landslides and other natural disasters [46].

2.2. Data Sources

Under the influence of the super El Nino, 20 severe rainstorms occurred in 2016 over SEC [47]. As a result, deadly floods and landslides were triggered, leading to serious damages [48]. Furthermore, 88% of severe rainstorms occurred from June to September. Therefore, the daily rainfall data at 330 rain stations (as shown in Figure 1) across SEC, covering a period from 01 January to 31 December in 2016, were adopted in this study. The gauge dataset was provided by China Meteorological Data Service Center (CMDC), which has been examined by extreme values check, internal consistency check and spatial consistency check [36].
The latest Version-7 TRMM TMPA near-real-time (3B42RT) and post-real-time (3B42V7) products were adopted in this study. The National Aeronautics and Space Administration (NASA) Goddard Space Flight Center (GSFC) developed 3B42V7 and 3B42RT datasets with the spatial resolution of 0.25° × 0.25° and the temporal resolution of 3 h, respectively [49]. In order to match the temporal resolution between gauge and satellite-based data, the 3-hourly satellite-based products were adjusted to daily accumulated datasets in Beijing time. To keep consistent with the format of gauge data, the rainfall value at the corresponding location was derived from the satellite product (in grid format) using the inverse distance weighting (IDW) method [50]. The information of rainfall data employed in this study is listed in Table 1.

2.3. Methods

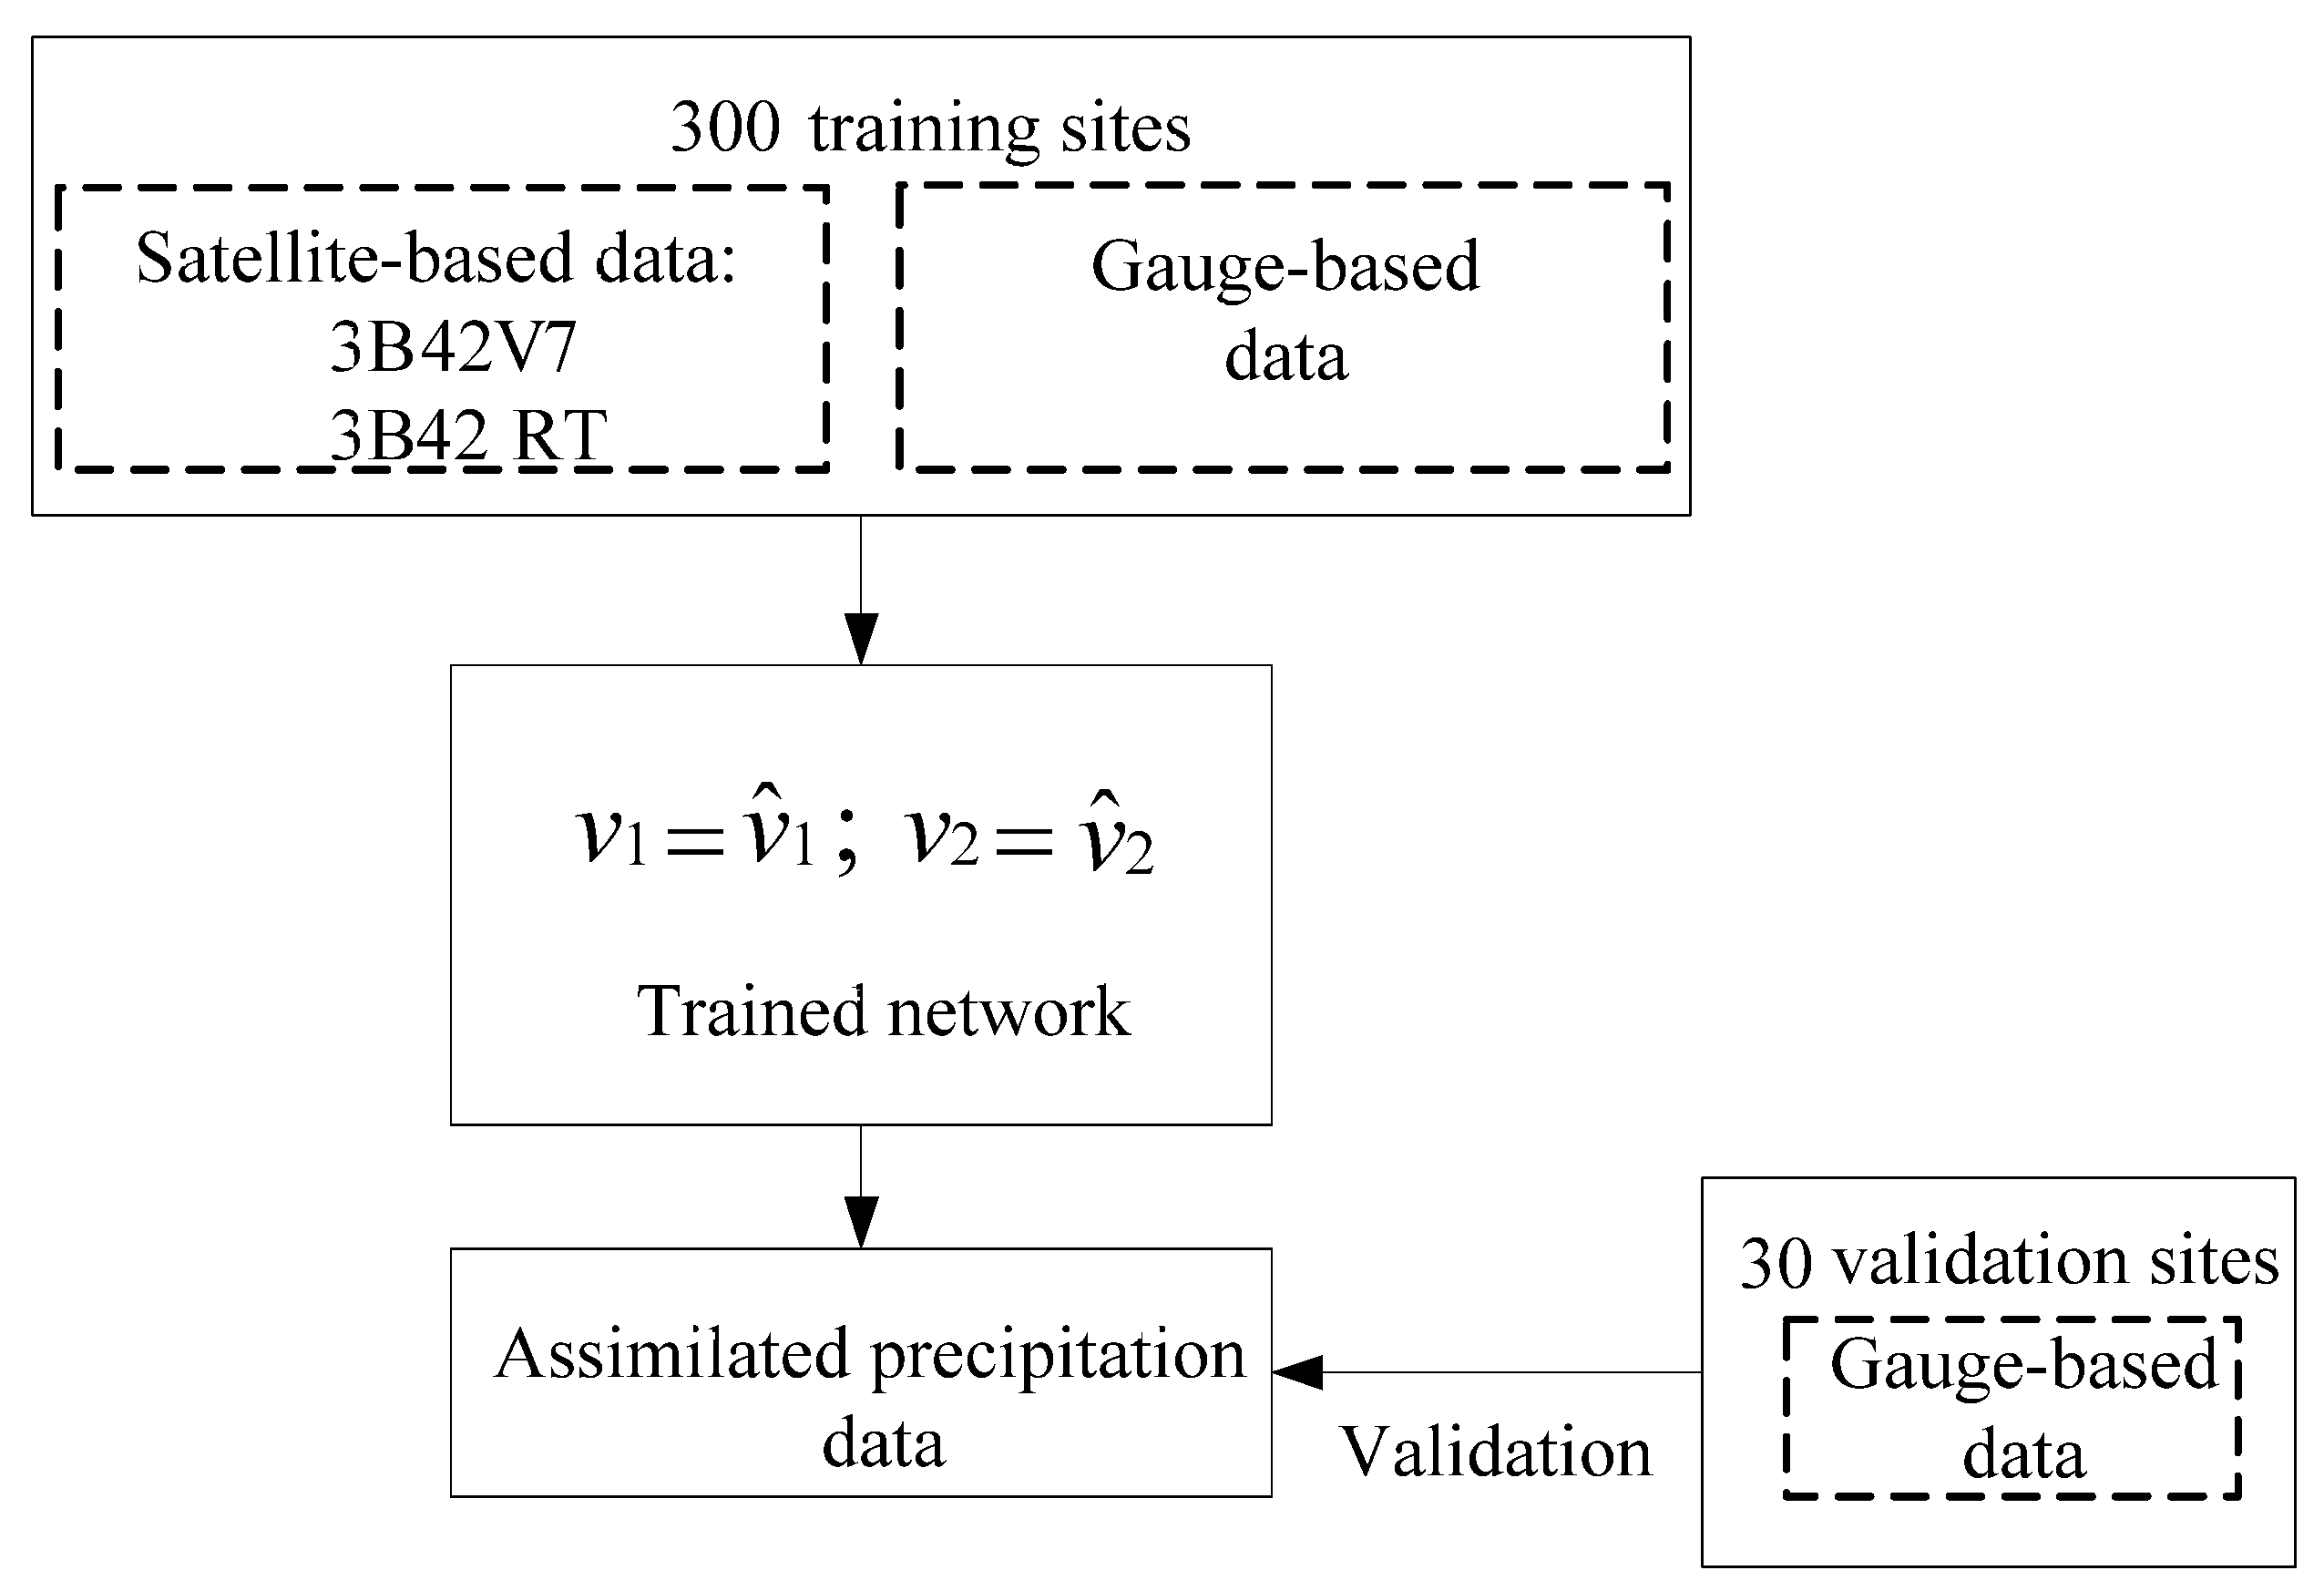
2.3.1. The Framework Based on Nonparametric General Regression

In this study, a new framework based on nonparametric general regression is proposed. This method is composed of the general regression network and the parameter identifying model. The nonparametric general regression network is designed as follows. Let T = [ T 1 , T 2 , , T N ] 2 × N be the satellite-derived datasets, namely 3B42V7 and 3B42RT datasets, and G = [ G 1 , G 2 , , G N ] N denotes the gauge-based data in this study. N is the number of samples, i.e., N = N d a y s * N s t a t i o n s , where N d a y s and N s t a t i o n s are the number of days and stations, respectively. There is the following relationship between T and G :
G = F ( T ) ,
Then, use θ to represent the unknown parameter vector in the nonparametric general regression network. The conditional probability density function (PDF) of G based on T and θ can be expressed by Equation (2), which is also called the likelihood in a frequentist framework.
p ( G | θ , T ) = p ( G 1 , G 2 , , G N | θ , T ) = m = 1 N p ( G m | G 1 , , G m 1 , θ , T ) ,
The conditional PDFs in the right hand of Equation (2) can be given by:
p ( G m | G 1 , , G m 1 , θ , T ) = ( 2 π σ 2 , m 2 ) 1 / 2 exp { [ G m G ^ m | m 1 ( T m ) ] 2 2 σ 2 , m 2 } ,
where G ^ m | m 1 ( T m ) is
G ^ m | m 1 ( T m ) = n = 1 m 1 G n exp [ ( T m T n ) 2 / ( 2 σ 1 , m 2 ) ] n = 1 m 1 exp [ ( T m T n ) 2 / ( 2 σ 1 , m 2 ) ] ,
where σ 1 , m 2 and σ 2 , m 2 are the smooth parameters and the prediction-error variances respectively, m = 1 , 2 , , N . G ^ m | m 1 ( T m ) is one estimate of G . σ 1 , m 2 and σ 2 , m 2 are computed using the following forms:
σ 1 , m 2 = v 1 m 1 n = 1 m 1 ( T m T n ) 2 ,
σ 2 , m 2 = v 2 n = 1 m 1 e x p [ 2 ( T m T n ) 2 ] ,
where v 1 and v 2 are two unknowns: θ = [ v 1 , v 2 ] T .
Based on the general regression network, there are now two unknown parameters to be determined. Note that we can rewrite the likelihood in Equation (2) in terms of the unknown parameters as:
p ( G | v 1 , v 2 , T ) ( v 2 ) ( N 2 ) exp [ 1 2 v 2 m = 1 N Ω m ( G m G ^ m | m 1 , v 1 ( T m ) ) 2 ] ,
where Ω m can be given by:
Ω m = n = 1 m 1 exp [ 2 ( T m T n ) 2 ] ,
Particularly, if v 1 is given, v ^ 2 ( v ^ 2 is the estimation of v 2 ) can be expressed by Equation (9) by solving p ( G | v 1 , v 2 , T ) v 2 = 0 , which means that only one parameter needs to be calculated.
v ^ 2 ( v 1 ) = 1 N m = 1 N Ω m ( G m G ^ m | m 1 , v 1 ( T m ) ) 2 ,
v ^ 1 (estimation of v 1 ) can be obtained by maximizing the function of v 1 : f ( v 1 ) = p ( G | v 1 , v ^ 2 ( v 1 ) , T ) , which is usually realized by standard optimization algorithms, such as genetic algorithm (GA) herein. Thereafter, v ^ 1 , v ^ 2 and G ^ can be obtained.

2.3.2. Data Processing for the Framework Validation

To comprehensively assess the NGR framework, k-fold cross-validation was performed. In this study, k was set to 11. In the 11-fold cross-validation, the data derived from the 330 stations is divided into 11 mutually exclusive subsets, one of which is employed as a validation dataset, while the other 10 are used as the training datasets. This process needs to be repeated 11 times. When k equals to 1, k-fold cross-validation is a special case, which is also termed as hold-out validation. The hold-out validation method is mainly conducted in this study as suggested by previous studies [28,36,51]. The data is divided into two non-overlapping sets. One is referred to as training dataset, which is adopted to train the framework, and the other is referred to as validation dataset, which is used to compare with the assimilated rainfall to assess the performance of NGR. The flowchart of training and validating the framework for assimilating multi-source rainfall datasets based on hold-out validation is shown in Figure 2. Under the framework, the 330 sites over SEC were assigned into training and validation sites from which the training and validation data were extracted, respectively. With reference to previous studies, the ratio of the training data to the validation data was set to be 10:1 [36,38,52]. That is, 30 out of 330 sites were selected randomly as validation sites, and the remaining 300 sites were set as training sites (in Figure 1b and Figure 2). Note that the satellite-based data was derived from the original gridded satellite-based data using the inverse distance weighting (IDW) method. In the training process, the proposed nonparametric framework was trained using the satellite-based training data extracted at 300 training sites as inputs and the gauge-based training data recorded at 300 training sites. After that, the gauge-based validation data recorded by 30 validation sites was adopted to validate the performance of the NGR framework.

2.3.3. Statistical Metrics for Evaluating the Performance of the NGR Framework

In order to compare the outputs (assimilated rainfall data) of the trained NGR framework from different perspectives, four statistical metrics, i.e., Pearson correlation coefficient (CC), root mean square error (RMSE), mean absolute error (MAE) and Nash-Sutcliffe coefficient of efficiency (NSE), were adopted in this study. CC denotes the linear agreement between the assimilated data and the validation gauge observations. RMSE and MAE are the measures of errors between the estimated and the gauge data. NSE, whose best value is 1, is used to assess the fit of two data pairs. The mentioned statistical indices are calculated by the following formulas:
CC = i = 1 k ( y ^ i y ^ ¯ ) i = 1 k ( y i y ¯ ) i = 1 k ( y ^ i y ^ ¯ ) 2 i = 1 k ( y i y ¯ ) 2 ,
RMSE = 1 k i = 1 k ( y ^ i y i ) 2 ,
MAE = i = 1 k | y ^ i y i | k ,
NSE = 1 i = 1 k ( y ^ i y i ) 2 i = 1 k ( y i y ¯ i ) 2 ,
where k is the number of samples, y i is the ith data of the validation rainfall dataset y , y ^ i is the assimilated rainfall data, and y ^ ¯ and y ¯ are the mean values of the assimilated and gauge-based validation data, respectively.
In addition, the Kling-Gupta efficiency (KGE) [53], as a statistical metric combining with correlation coefficient, standard deviation and simulation mean, is increasingly employed to evaluate models. It can be expressed as:
KGE = 1 ( CC 1 ) 2 + ( σ e s t i m a t e s σ o b s e r v a t i o n s 1 ) 2 + ( μ e s t i m a t e s μ o b s e r v a t i o n s 1 ) 2 ,
where σ e s t i m a t e s and μ e s t i m a t e s are the standard deviation and mean of estimates respectively, and σ o b s e r v a t i o n s and μ o b s e r v a t i o n s stand for the standard deviation and mean of gauge-based observations. According to these studies [54,55,56], although KGE = 1 indicates perfect agreement between the estimates and observations, various KGE values should be set as the index of good agreement in order to ensure more accurate evaluation of different models. Therefore, negative KGE values are considered as bad agreement between estimates and observations in this study.

2.3.4. Multiple Linear Regression Method

The MLR method [57] is usually adopted to model the linear relationship between dependent and independent variables, which is described by the following general form:
Y = a 0 + a 1 × X 1 + + a M × X M + ε ,
where Y is the dependent variable, X 1 , X 2 , , X M are the independent variables, a 0 , a 1 , a 2 , , a M are the coefficients for independent variables, M is the number of independent variables and ε is the model’s error term. In this study, the independent variables and dependent variables denote two satellite-based datasets and assimilated rainfall data, respectively. According to the form of MLR, it is obvious that the mapping relationship between independent and dependent variables has been set to be linear in advance, whereas it is unnecessary to prescribe the mapping function when using NGR. Based on the mentioned characteristics of MLR and NGR, comparison was performed to evaluate the blended results calculated from the two schemes.

3. Results

The mean values of daily statistical metric of rainfall estimates originated from the eleven-fold cross-validation are listed in Table 2. The proposed scheme in general performed better on RMSE, MAE and NSE, while a little worse on CC. Although all the KGE values are positive, 3B42V7 obtained the largest KGE.
To evaluate the applicability of the framework, the rainfall in Meiyu (June and July) and Typhoon (July, August and September) seasons, in different months and rainfall events with different rainfall intensities, were included. According to the China Meteorological Association (http://www.cma.gov.cn, accessed on 11 January 2020), the severity of rain events in China can be categorized in terms of the 24 h accumulated rainfall, which are light rain (0.1–10 mm/day), moderate rain (10–25 mm/day), heavy rain (25–50 mm/day), rainstorm (50–100 mm/day), heavy rainstorm (100–250 mm/day) and severe rainstorm (>250 mm/day). In this study, the rainfall events with rainfall intensity > 50 mm/day were considered as a rainstorm. Since there were quite a few heavy and severe rainstorms in SEC during 2016, only four rainfall intensities (i.e., light rain, moderate rain, heavy rain and rainstorm) were discussed in this study. Note that in order to show the performance of rainfall estimates spatially, the assimilated rainfall data at the 30 validation sites (Figure 1b) from the hold-out validation was evaluated at different scales in the following sections.

3.1. Assimilated Precipitation Data at Meiyu Seasons

Figure 3 shows the bias from 3B42V7, 3B42RT and NGR at 30 selected validation sites (Figure 1b) during Meiyu season, which was the absolute deviation between the mean daily estimates and gauge-based observations at each validation site. A bounding circle in Figure 3 indicates that the estimates yield the smallest absolute deviation at this validation site compared to those from the other two products at the same location. Table 3 summarizes the numbers of stations corresponding to the best performance of estimates on CC, RMSE, MAE and smallest absolute deviation in Meiyu and Typhoon seasons. The absolute deviation from NGR exhibited the smallest value at 18 validation sites, followed by 3B42V7 (11 validation sites) and 3B42RT (1 validation site), respectively. Specifically, the large deviations from 3B42RT data (in Figure 3b) corresponded to the sites in the south of Guangxi, Hunan province, and coastal areas, where smaller errors were obtained by 3B42V7 and NGR. Regarding to the spatial distribution of errors, NGR and 3B42V7 tended to exhibit lager bias in inland areas, while the major errors from 3B42RT were discovered across the middle and south of the study area. From the perspective of error values, 3B42RT yielded the largest bias with value of 8.40 mm at the site located at the south of Guangxi province, while 3B42V7 and NGR obtained relatively smaller bias values of 4.61 and 5.21 mm, respectively. The minimum bias with value of 0.05 mm was from NGR, followed by 0.07 mm from 3B42V7 and 0.41 mm from 3B42RT. The mean value of the total absolute deviation at the 30 validation sites from 3B42RT was the largest with value of 2.97 mm, followed by 3B42V7 with value of 1.30 mm and NGR with value of 1.17 mm.
Figure 4 presents the distribution of the statistical metrics between estimates (assimilated NGR data and satellite products) and gauge observations at each validation site in Meiyu season. In general, the spatial variations of CCs from the three products are of high spatial consistency, especially those between 3B42V7 and NGR. Moreover, NGR exhibited the largest CC values at 40% of validation sites, but 3B42V7 and 3B42RT data corresponding to 36% and 24% of validation sites were highly correlated with gauge observations (Table 3). As for RMSE, the indicator from 3B42RT corresponding to the majority of validation sites was larger than those from NGR and 3B42V7. Meanwhile, there were 19 out of 30 stations having smaller RMSEs from estimated datasets compared to satellite products. The largest MAE was originated from 3B42RT and located south of Sichuan province, where the MAE values from 3B42V7 and NGR were relatively smaller. MAE from NGR at 16 validation sites were smaller than those from 3B42V7 (14 validation sites) and 3B42RT (none of the validation sites), as shown in Table 3. According to the definition of NSE, the closer the value is to 1, the better fit between the two models. Therefore, as for NSE values, the estimated rainfall data at 12 sites from 3B42RT, 9 sites from 3B42V7 and 2 sites from NGR did not match the gauge observations well (i.e., NSE was smaller than 0). The proposed nonparametric framework yielded the largest NSE values at the majority of validation sites, which were mainly located at in inland areas of the study area.
Figure 5 shows the box plots for statistical metrics of daily precipitation at the 30 validation sites. In terms of CC, the performance of three datasets was in general in the same level, whereas the median value from 3B42V7 was the largest. Besides, the values of CC at the 25th and 75th percentile corresponding to NGR were both higher than those from the other two products. NGR yielded the lowest median values for RMSE and MAE (in Figure 5b,c). As for NSE in Figure 5d, the outliers based on the assimilated NGR dataset were closer to the median line. In contrast to satellite-based products, NGR yielded larger NSE values at the 25th and 75th percentile, as well as a smaller range between these two quartiles, indicating that the assimilated rainfall data using NGR agreed better with gauge data overall.

3.2. Assimilated Precipitation Data at Typhoon Seasons

The blended precipitation in Typhoon season, as another rainy period in SEC, was also evaluated. Figure 6 shows the spatial distributions of absolute deviation of the mean merged precipitation products against mean gauge data at each validation site in the Typhoon season of 2016. Neither satellite-based datasets can accurately estimate the rainfall amounts on the seashores of Guangxi, Jiangxi, Fujian and Zhejiang provinces, as shown in Figure 6a,b. Moreover, the largest errors from 3B42RT were marked at the sites in Sichuan and Guangxi provinces, where the estimates (Figure 6c) attained comparatively smaller errors. The total errors from NGR were substantially smaller than those generated by 3B42RT and 3B42V7 in the Typhoon season. From Table 3, estimates based on the NGR framework obtained the smallest absolute deviations at 18 sites, while the 3B42V7 and 3BN42RT yielded the smallest errors at 8 sites and 4 sites, respectively. NGR tended to obtain the estimates with the smallest deviations along coastal lines. In general, the proposed approach was capable of effectively diminishing more absolute errors compared to the two satellite-based products in the Typhoon season of 2016 across SEC.
Figure 7 demonstrates the spatial patterns of daily metrics at each validation site in the Typhoon season over SEC. There were no significant spatial variances among NGR-, 3B42V7- and 3B42RT-Gauge CCs, but obvious spatial variances for RMSE, MAE and NSE. Specifically, the assimilated rainfall and satellite products exhibited highly different RMSE across SEC, with the range between 0 and 23 mm. The larger RMSE from 3B42V7 and 3B42RT was found in Hainan province, while a lower value was observed from NGR in this area. Moreover, 3B42RT tended to obtain larger RMSE values than the other two products over SEC. In terms of MAE, all the maximum values of MAE from the three approaches appeared in the south of the study area, where NGR exhibited the best performance, followed by 3B42V7 and 3B42RT. There were more stations with smaller RMSE (20 out of 30 sites) and MAE (17 out of 30 sites) yielded by NGR than those from 3B42V7 and 3B42RT. For NSE (in Figure 7), there were more NSE values from satellite-based datasets far smaller than 1. In other words, the estimates from the nonparametric framework at each validation site matched the gauge precipitation better than those by 3B42V7 and 3B42RT in the Typhoon season.
Figure 8 depicts the box plots of metrics of the indices in the Typhoon season. The maximum CC value was obtained by NGR while the minimum was attained by 3B42RT, whereas the median lines from the three products were almost at the same level. Although 3B42V7 exhibited the smallest range between upper quartile and lower quartile in terms of RMSE (in Figure 8b) and MAE (in Figure 8c), the median values from NGR were the smallest. Figure 8d shows that the 25th/75th percentile and the upper/lower end of outliers from NGR were much closer to 1 compared to the corresponding values from satellite-based data, indicating that the estimates obtained by the proposed scheme better captured the gauge observations at each validation site in the Typhoon season.

3.3. Assimilated Daily Precipitation at Monthly Scale

Due to the climatic features in SEC, precipitation amounts vary significantly at different time scales. Therefore, in order to capture the accurate temporal patterns of rainfall, the accuracy of precipitation at monthly scale needs to be evaluated. Figure 9 demonstrates the statistical metrics of blended and original satellite-based daily rainfall data from 30 validation sites in 12 months over SEC. All three datasets had similar trends of RMSE and MAE, which decreased from January to February, increased from February to June and then decreased from July to December. CCs dominated by values larger than 0.5 and varied slightly in each month, whereas RMSEs, MAEs and NSE changed significantly from month to month. According to the three datasets, 3B42RT performed worst, as indicated by the smallest CCs and NSE, largest RMSEs and MAEs in almost all of months except for October. Moreover, compared to satellite-based data, the NGR-based rainfall data exhibited larger CC values in 6 months, smaller RMSE in 9 months and smaller MAE in 10 months, as well as larger NSE in 9 months. CCs from 3B42V7 in February, March, May, July and November were higher than those from NGR, whereas NGR performed better on RMSE, MAE and NSE in two of the five months. Overall, compared to these two satellite-based schemes, the estimates based on the proposed NGR framework exhibited the best performance with respect to the four statistical metrics in April, June, August and September of 2016 over SEC.

3.4. Assimilated Rainfall with Different Intensities

The metrics from 3B42V7, 3B42RT and NGR precipitation datasets with different rainfall intensities during 2016 are listed in Table 4. All the CCs were relatively small and mainly ranged from 0.124 to 0.295, except for those corresponding to rainstorm events, whereas the CC from NGR was the largest in each category. In terms of errors, both RMSE and MAE increased with the rainfall intensities, indicating that as the rainfall amounts increased, the inaccuracy of estimated rainfall datasets was enlarged, even though, when the rainfall intensity is light rain, moderate rain, as well as heavy rain, NGR yielded estimates with smaller RMSE and MAE than the other two satellite products. As for NSE, all the values were negative, but compared to those from 3B42V7 and 3B42RT, the NSE values from NGR were the largest with rainfall intensities of light rain, moderate rain and heavy rain, indicating that the estimated data can simulate the gauge observations better when rainfall intensity was less than 50 mm/day. The metrics, especially RMSE and MAE from rainstorm events, were quite large, and the root relative mean squared errors (RRMSE) from 3B42V7, 3B42RT and NGR rainfall datasets were more than 50%. According to Chen and Li [58], the monthly satellite-based datasets were unreliable if the RRMSE was more than 50%. Thus, all three products cannot precisely estimate the large precipitation amounts, especially under the circumstances that the rainfall is more than 50 mm.

4. Discussion

4.1. Comparison with the Blended Rainfall Data Obtained by MLR and ANN

The assimilated precipitation data from the multiple linear regression (MLR) method and PERSIANN product was adopted for comparison to the proposed approach. Table 5 summarizes the daily statistical metrics in the rainy season (from June to September) of assimilated precipitation computed by the NGR, MLR and ANN approaches at 30 validation sites of SEC in 2016. For the daily statistical metrics in the rainy season, compared with those of satellite-based and MLR methods, as well as PERSIANN rainfall data, the performance of NGR was better in terms of CC, RMSE and NSE, with values of 0.715, 11.54 and 0.51 mm respectively, and marginally larger MAE (4.83 versus 4.76 mm from the MLR method). MLR estimates are better than the PERSIANN products, as indicated by the indicators in Table 5. The daily KGE of rainfall estimates from four methods against gauge-based observations in the rainy season are shown in Figure 10. Positive KGE values can be observed from MLR and NGR, indicating that MLR and NGR rainfall data in the rainy season can simulate the gauge-based rainfall well. Furthermore, KGE values from NGR at 18 validation sites were larger than those from MLR at the same sites, which means that NGR can achieve better results at these stations compared to MLR. However, negative KGE values (one from 3B42V7 and three from 3B43RT) and fluctuant variation of KGE of the two satellite products were observed, indicating worse consistency compared to the estimates from the proposed NGR framework. Figure 11 shows the spatial distribution of absolute deviations of mean daily rainfall estimates from MLR and NGR against gauge-based observations. Obviously, in comparison to NGR, MLR tended to underestimate or overestimate the mean rainfall amount in the rainy season at some validation sites, especially at Sichuan and Hainan provinces. In addition, the mean value (0.91 mm) of the total absolute deviation from MLR was larger than that (0.80 mm) of NGR, indicating that NGR can reduce errors more effectively than the MLR method in the rainy season.

4.2. Uncertainties, Strengths and Weaknesses

Uncertainty, as a factor that disturbs the accuracy of evaluation, should be considered. The uncertainty may be from several aspects. In this study, gauge data was used as a reference to verify the assimilated rainfall data. Nevertheless, gauge precipitation data also suffers from errors. Ye et al. [59] reported that the annual rainfall amount recorded by gauges over China was increased by 8 to 740 mm after bias corrections by considering wind-induced under-catch, wetting loss and light rain. Hence, these error-induced factors should be considered and eliminated as much as possible. Moreover, the scale discrepancy also introduces uncertainty. In order to transform the gridded satellite rainfall data into point-based data, the IDW method was employed during the training and validation process, which is likely to induce errors.
The modeling errors between the estimates and gauge-based rainfall data are assumed to follow a Gaussian distribution, which is suggested by the previous study [21]. For each data point, the obtained σ 2 , m 2 in Equation (3) represents the variance of the modeling error. Then, the confidence interval (CI) of the estimated value of a data point can be directly acquired with the assumption of Gaussian residuals. Figure 12 shows the percentages of gauge-based data falling in different confidence intervals of estimates based on the nonparametric framework under light rain, moderate rain, heavy rain and rainstorm scenarios. The proposed model can provide accurate quantifications of the uncertainties for the large confidence intervals (CI) under the light, moderate and heavy rain scenarios. Specifically, the percentage corresponding to 95% CI is the largest one (in Figure 12a) among the three, indicating that most of the gauge-based rainfall data falls within 95% CI during light rain scenarios. That is, estimates from NGR during light rain are the most accurate, followed by the ones during moderate rain, heavy rain and rainstorms.
Although uncertainties were inevitable, the estimated NGR rainfall data were substantially improved upon almost all of the statistical indicators, except for the similar daily CCs in Meiyu and Typhoon seasons (in Figure 5 and Figure 8). According to the aforementioned comparisons, the 3B42V7 data, in general, performed better than 3B42RT data at 30 validation sites across SEC in 2016. Figure 13 plots daily assimilated and satellite-based rainfall data in Meiyu and Typhoon seasons at 30 validation sites. The CCs between the estimates and the satellite-based data were calculated and marked in the sub-figures. The CC between NGR and 3B42V7 daily rainfall data was larger than that between NGR and 3B42RT daily rainfall data, indicating that the 3B42V7 dataset, as one of the data sources, contributed more to the NGR rainfall data than those from 3B42RT. In addition, because of the relatively worse performance of 3B42RT on statistical indexes, less information from the 3B42RT dataset and more details from the 3B42V7 dataset were retained by NGR during the process of framework construction. Thus, although similar CC values were observed between the NGR and 3B42V7 rainfall data in Meiyu and Typhoon seasons, the NGR framework is capable of automatically selecting the original satellite-based dataset with better performance. Moreover, this proposed NGR framework can not only be used in SEC, but also in other places where the derived satellite-based rainfall data is available. Nevertheless, the performance of this proposed framework applied in other regions, especially the data-gap areas, still needs to be evaluated.
The proposed framework also has its limitations. As listed in Table 4, the statistical indictors of RMSE and MAE became more and more fluctuant as the rainfall intensity increased, especially for rainstorm events. NGR cannot precisely estimate the large precipitation amounts based solely on two satellite-based rainfall data as merged sources, as indicated by Figure 12. The uncertainty of assimilated precipitation data using NGR originated from the satellite-based datasets, i.e., 3B42V7 and 3B42RT, whose RRMSEs were both more than 50% during rainstorm events. Thus, to improve the performance of merged data during rainstorm events, higher quality of remote sensing rainfall data needs to be utilized as the blended sources.

5. Conclusions

In this study, a new framework was proposed to assimilate multi-source precipitation datasets in regions of SEC based on nonparametric general regression. The daily training datasets, including 3B42V7, 3B42RT and gauge-based data, corresponding to 300 training sites in 2016, were adopted to train the NGR framework. The gauge-based data at 30 validation sites was used to assess the trained framework. To evaluate the applicability of the framework, the rainfall in Meiyu and Typhoon seasons, in different months and rainfall events with different rainfall intensities, were included. Based on the study, the major findings were summarized as follows:
(1)
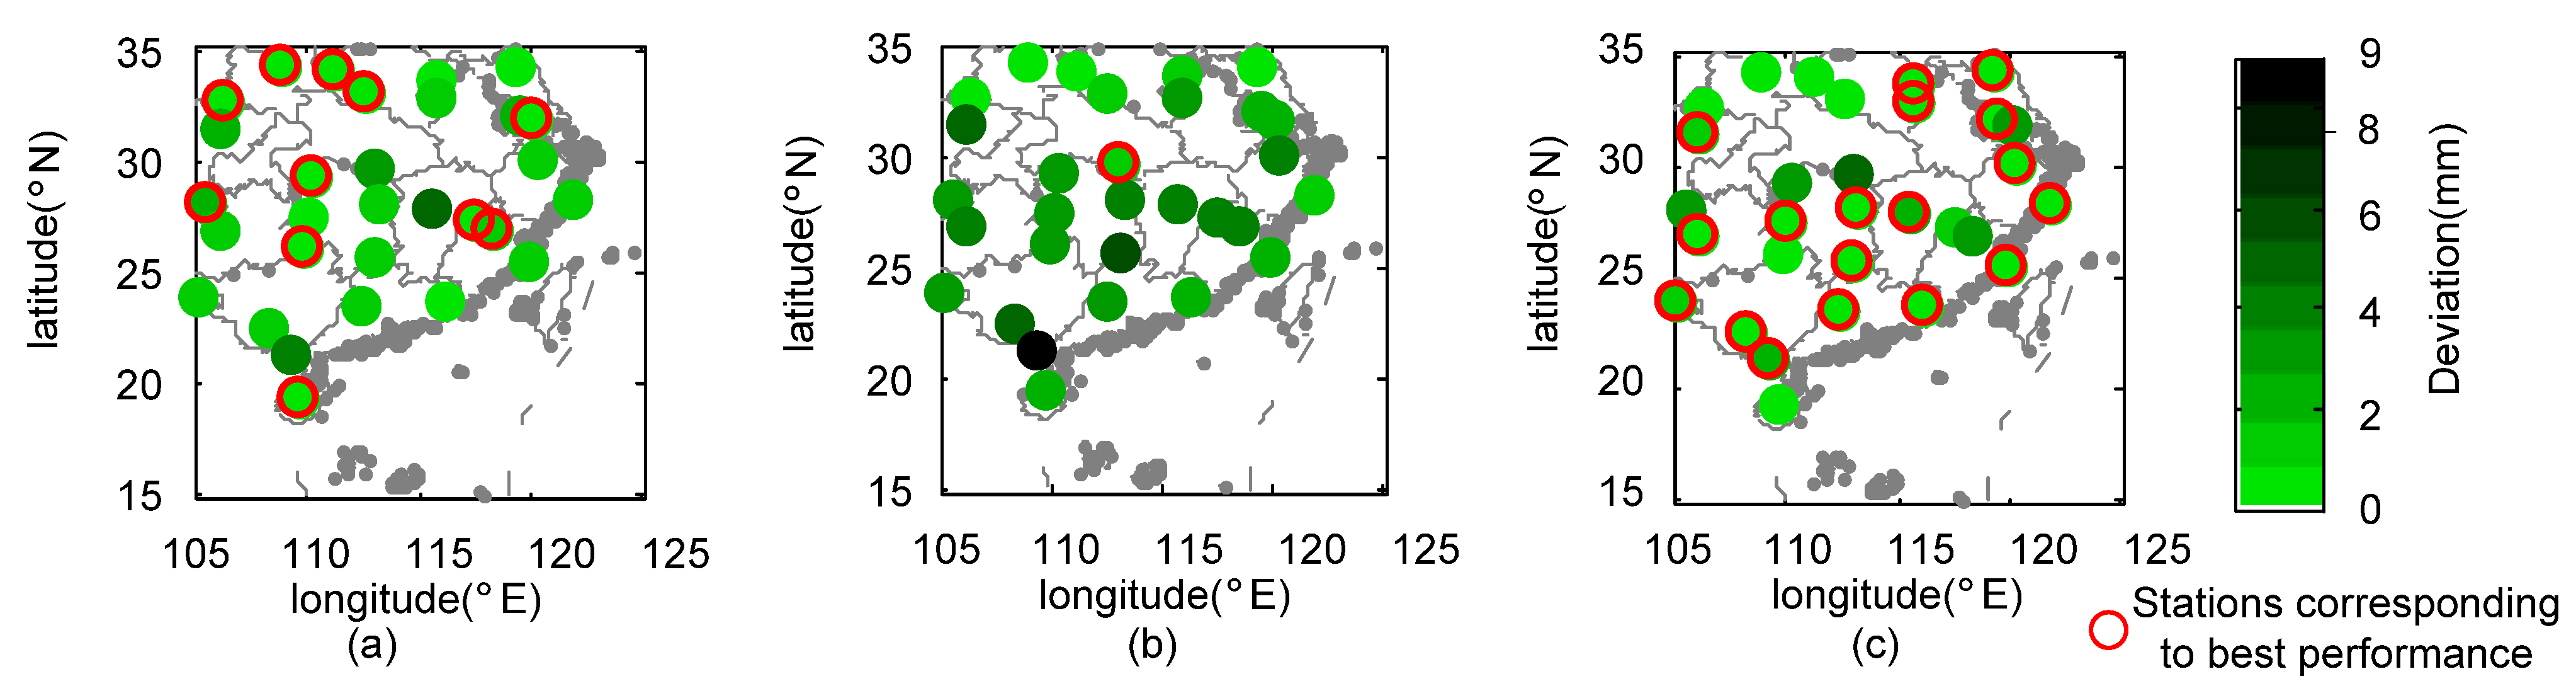
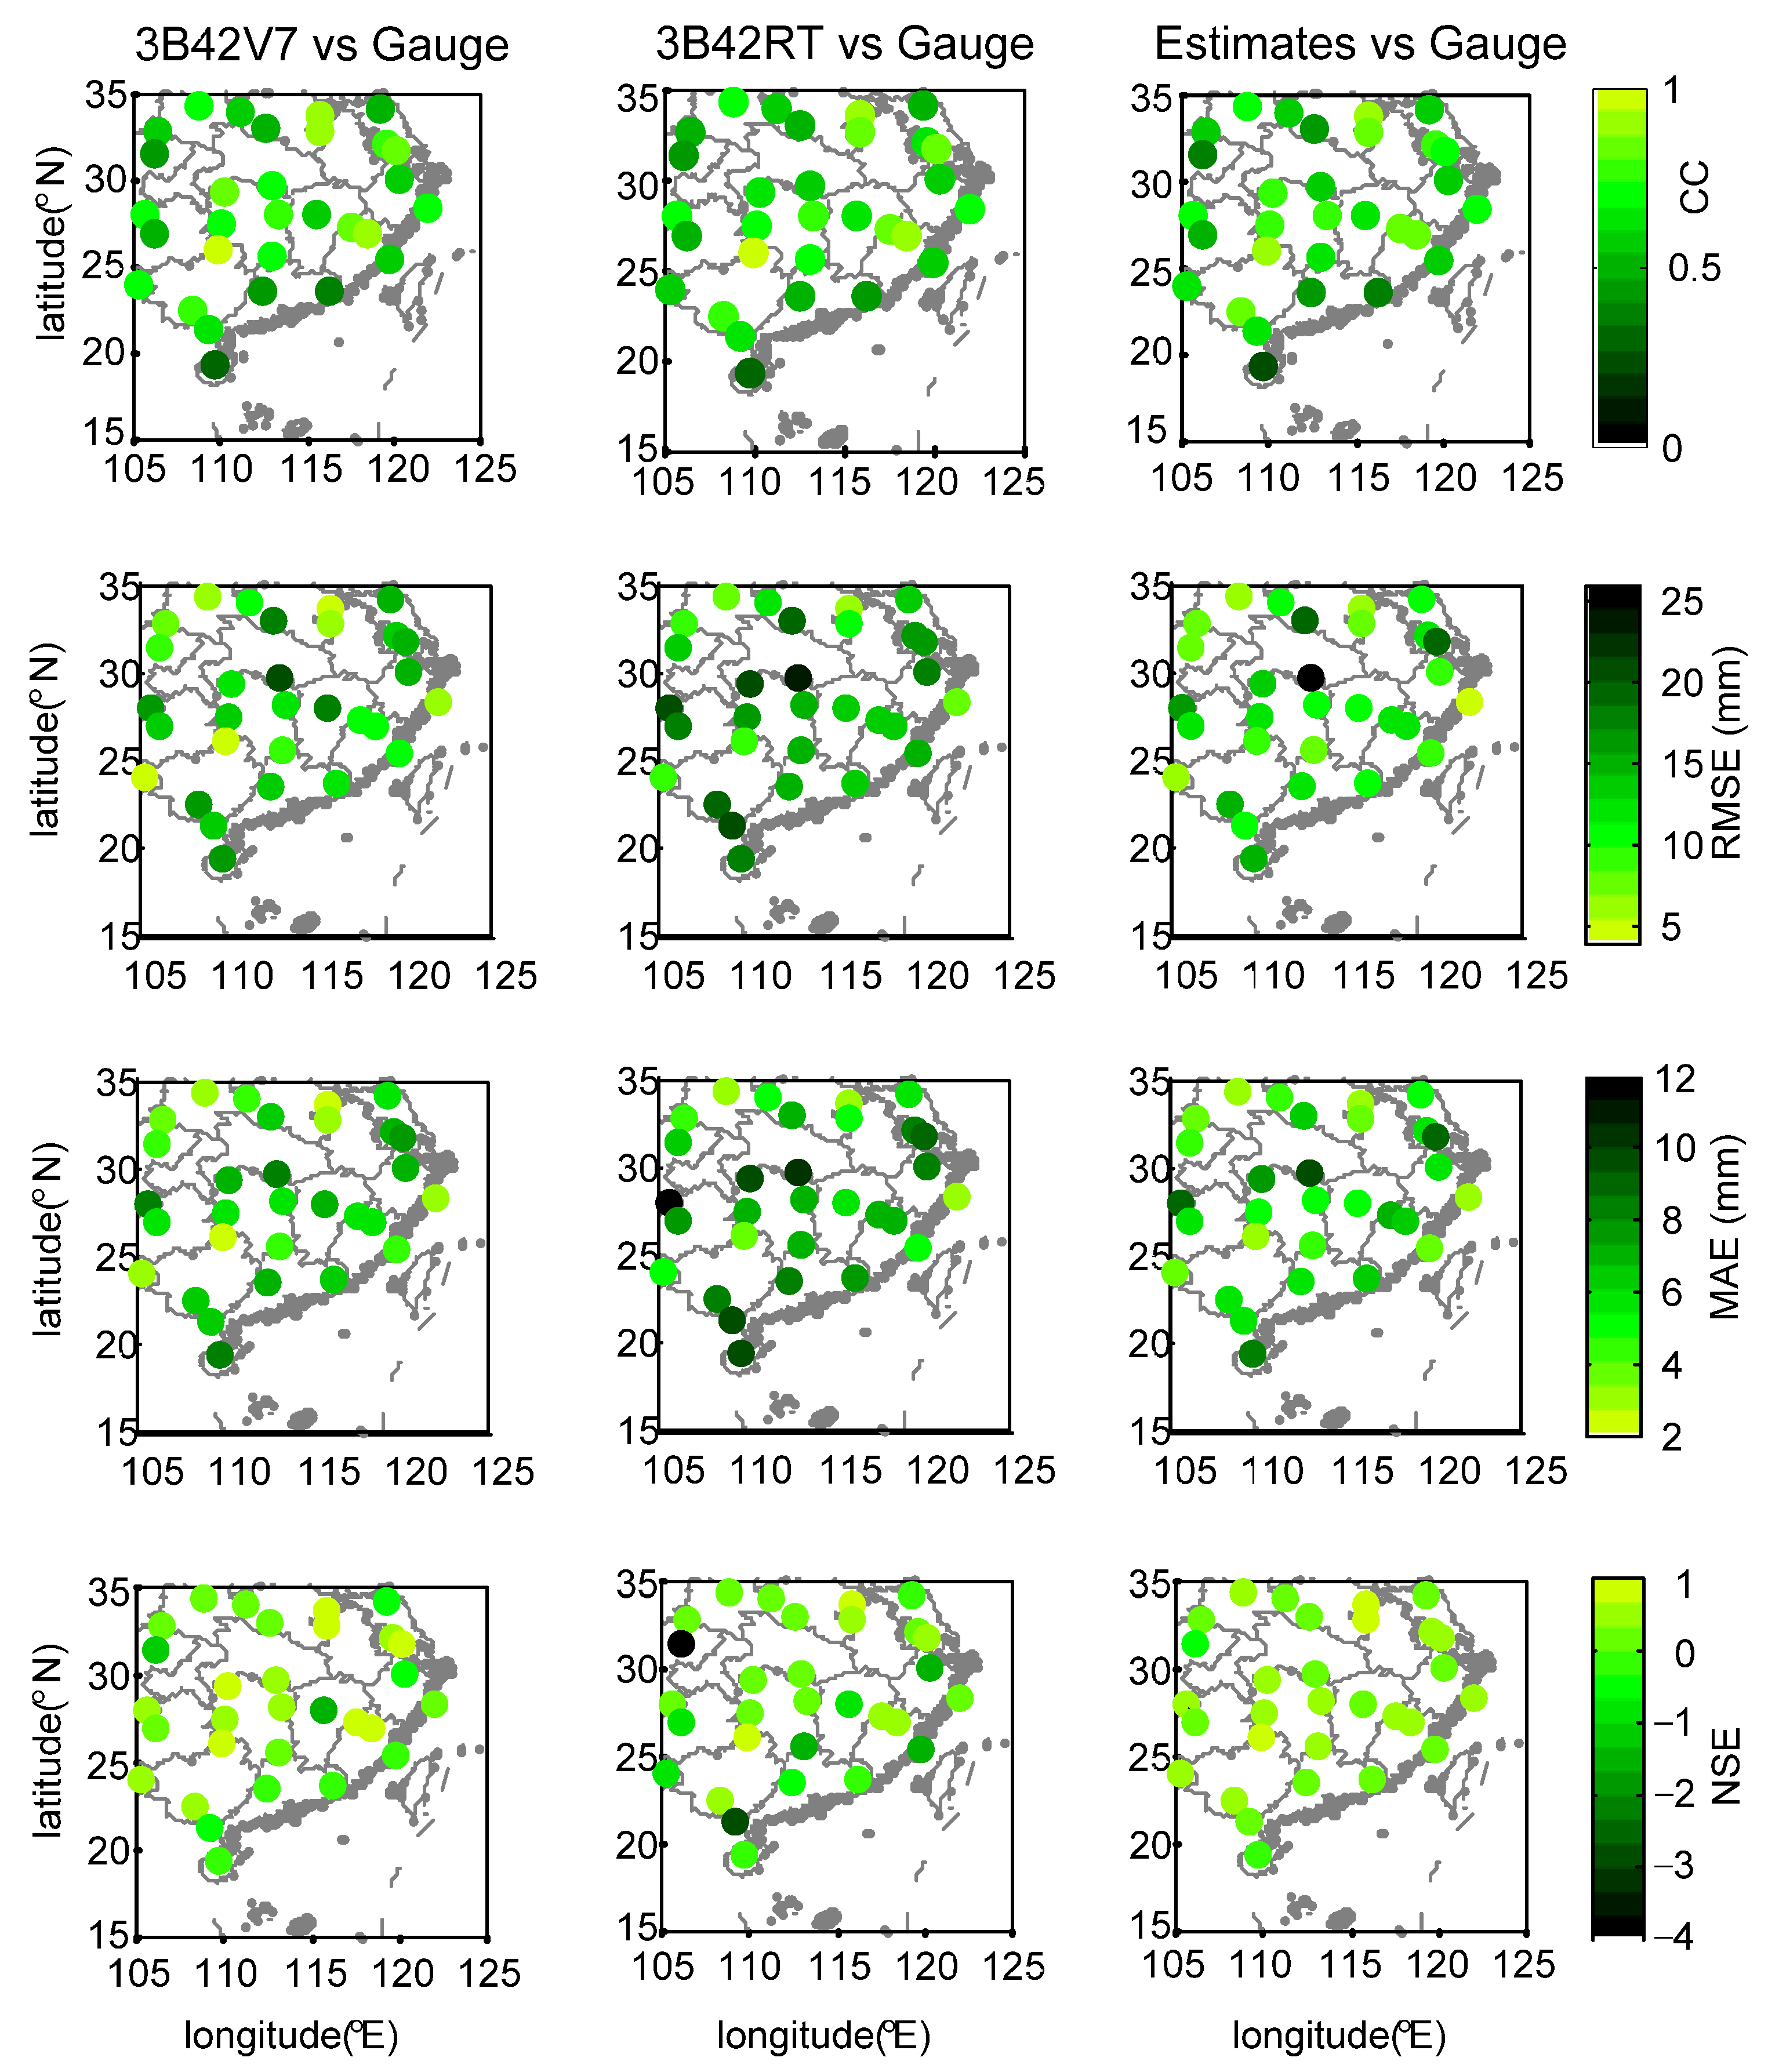
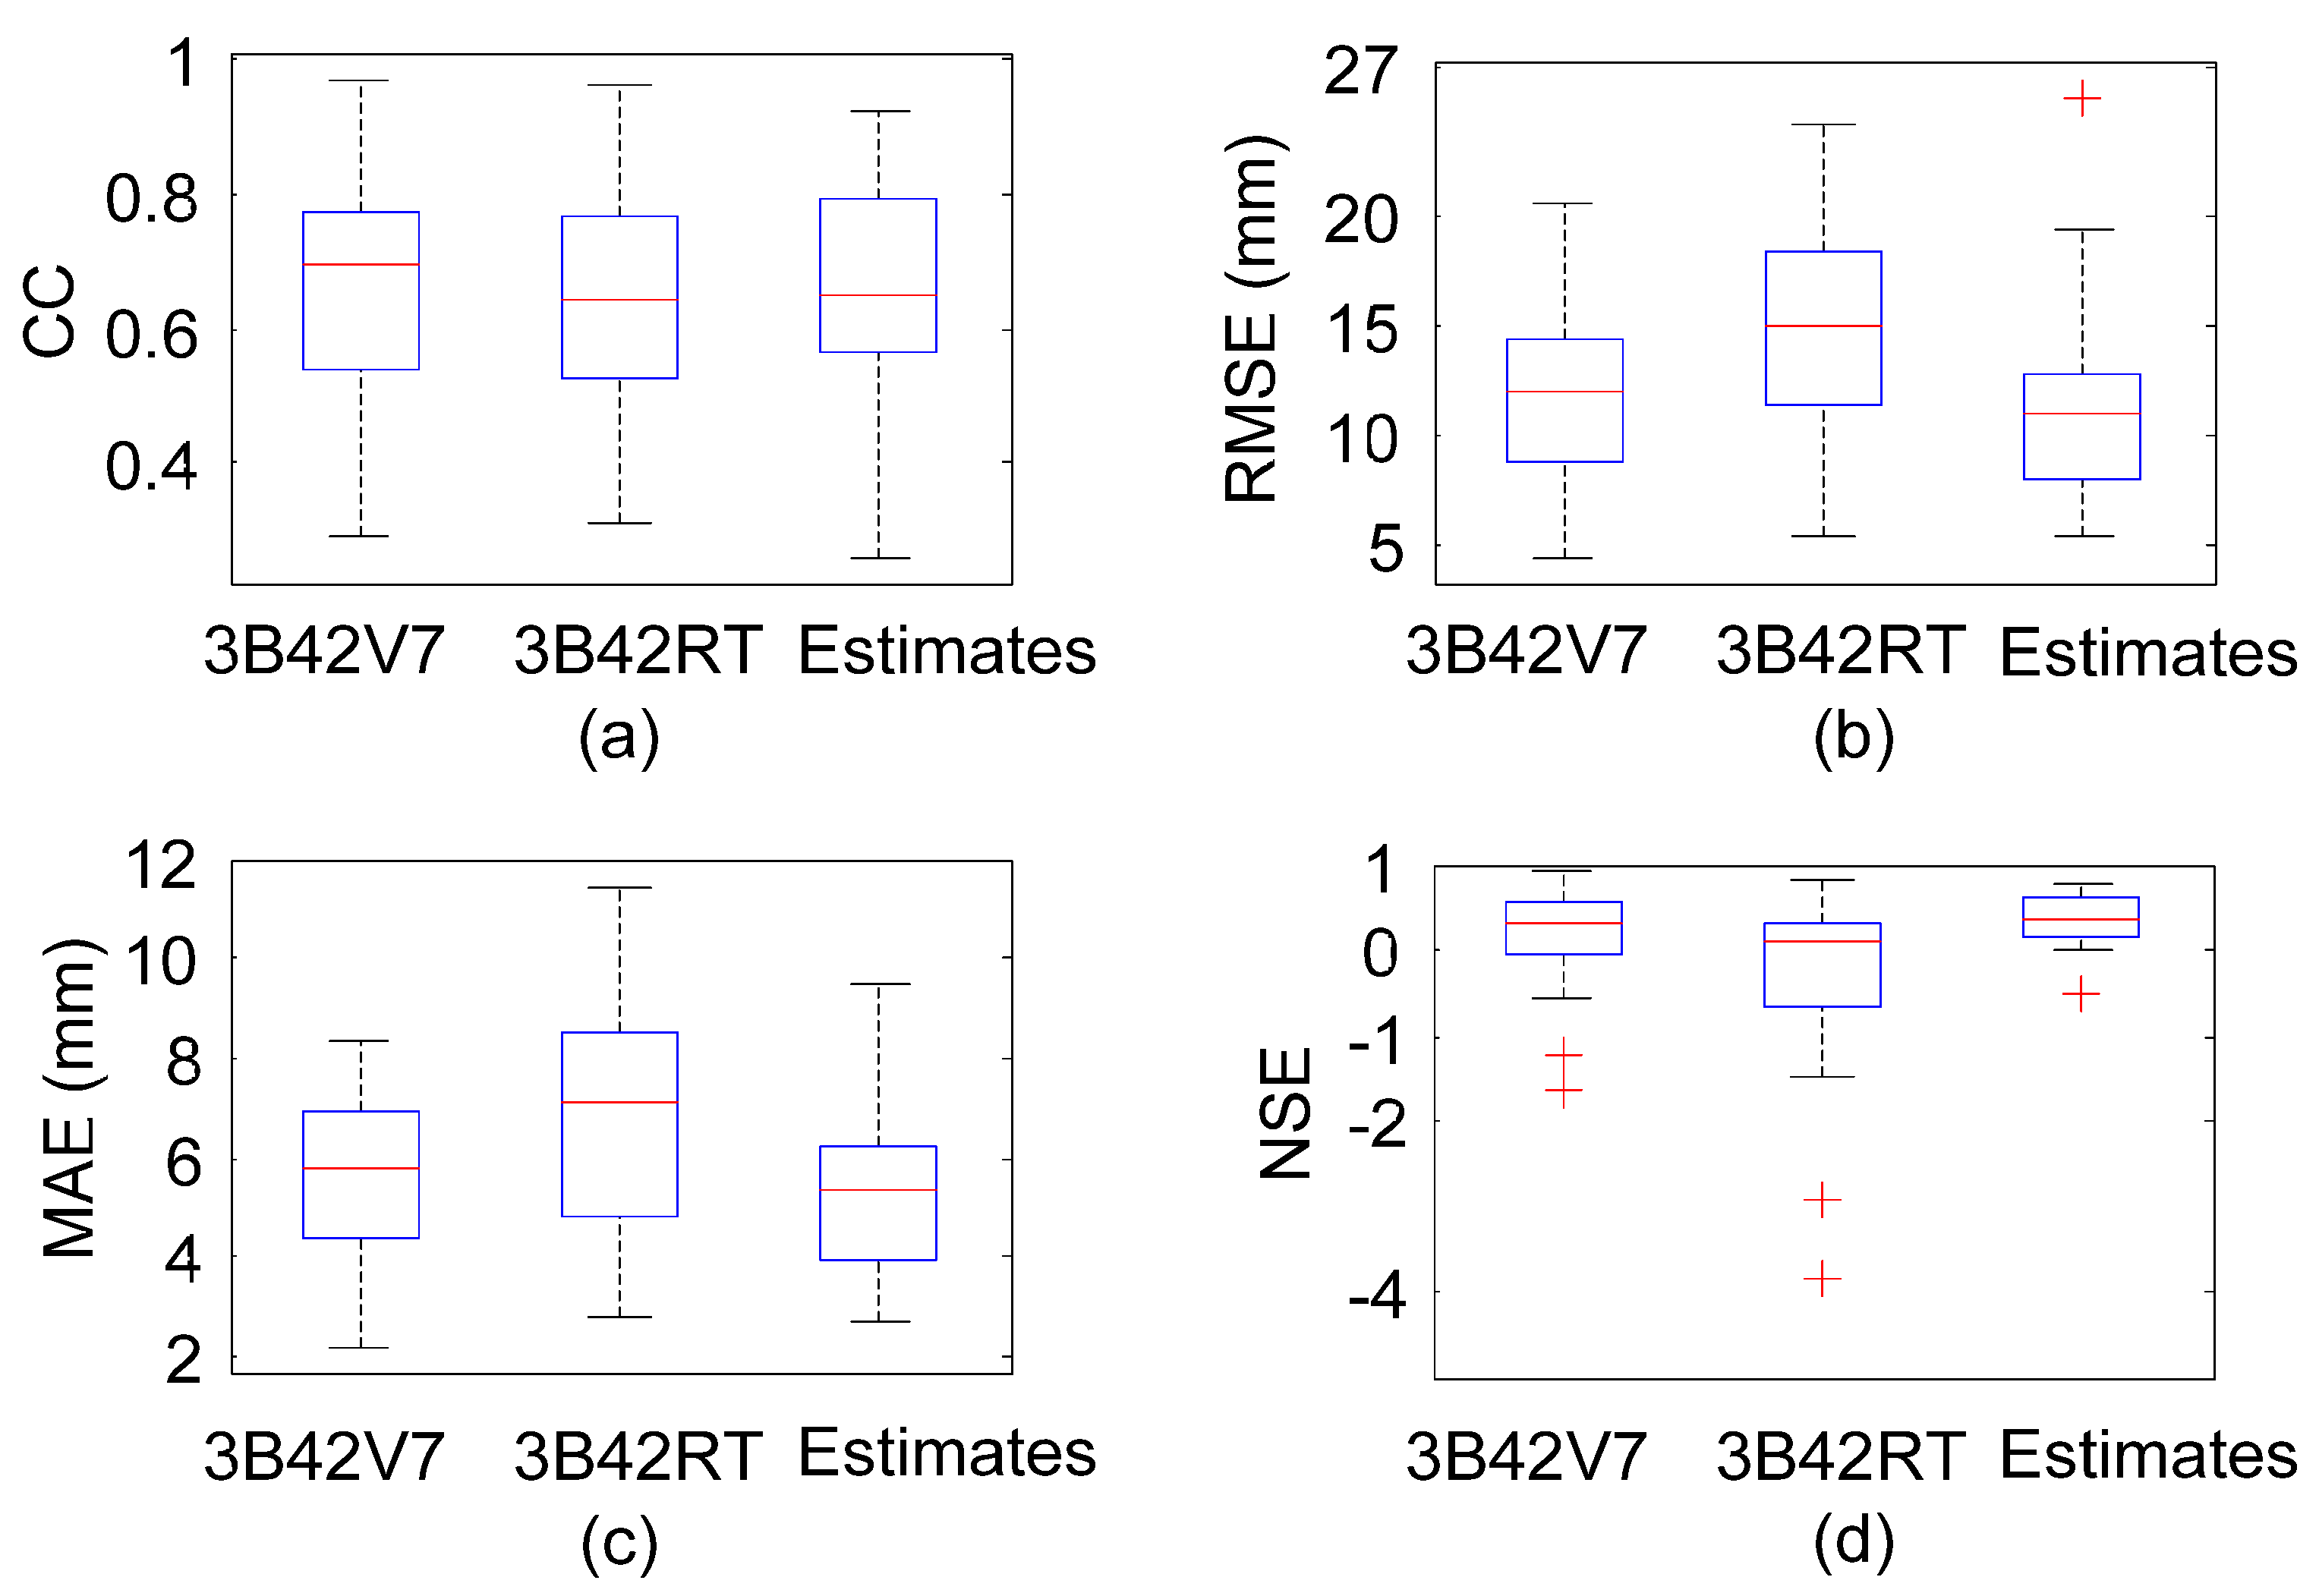
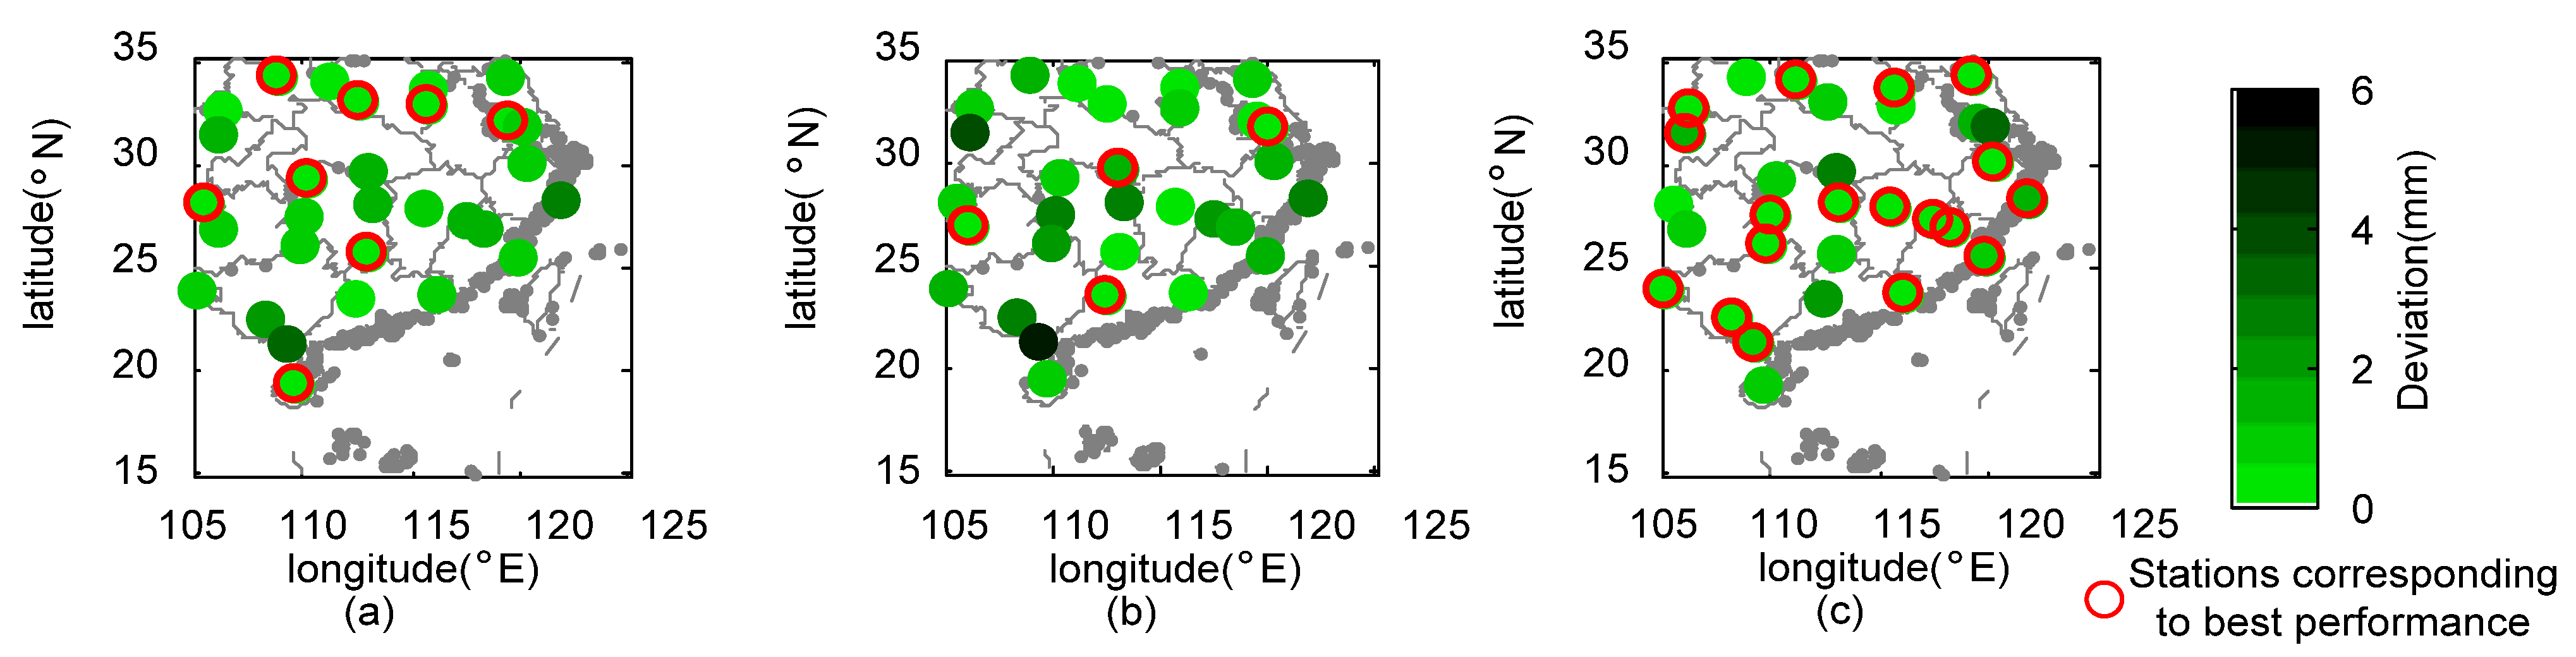
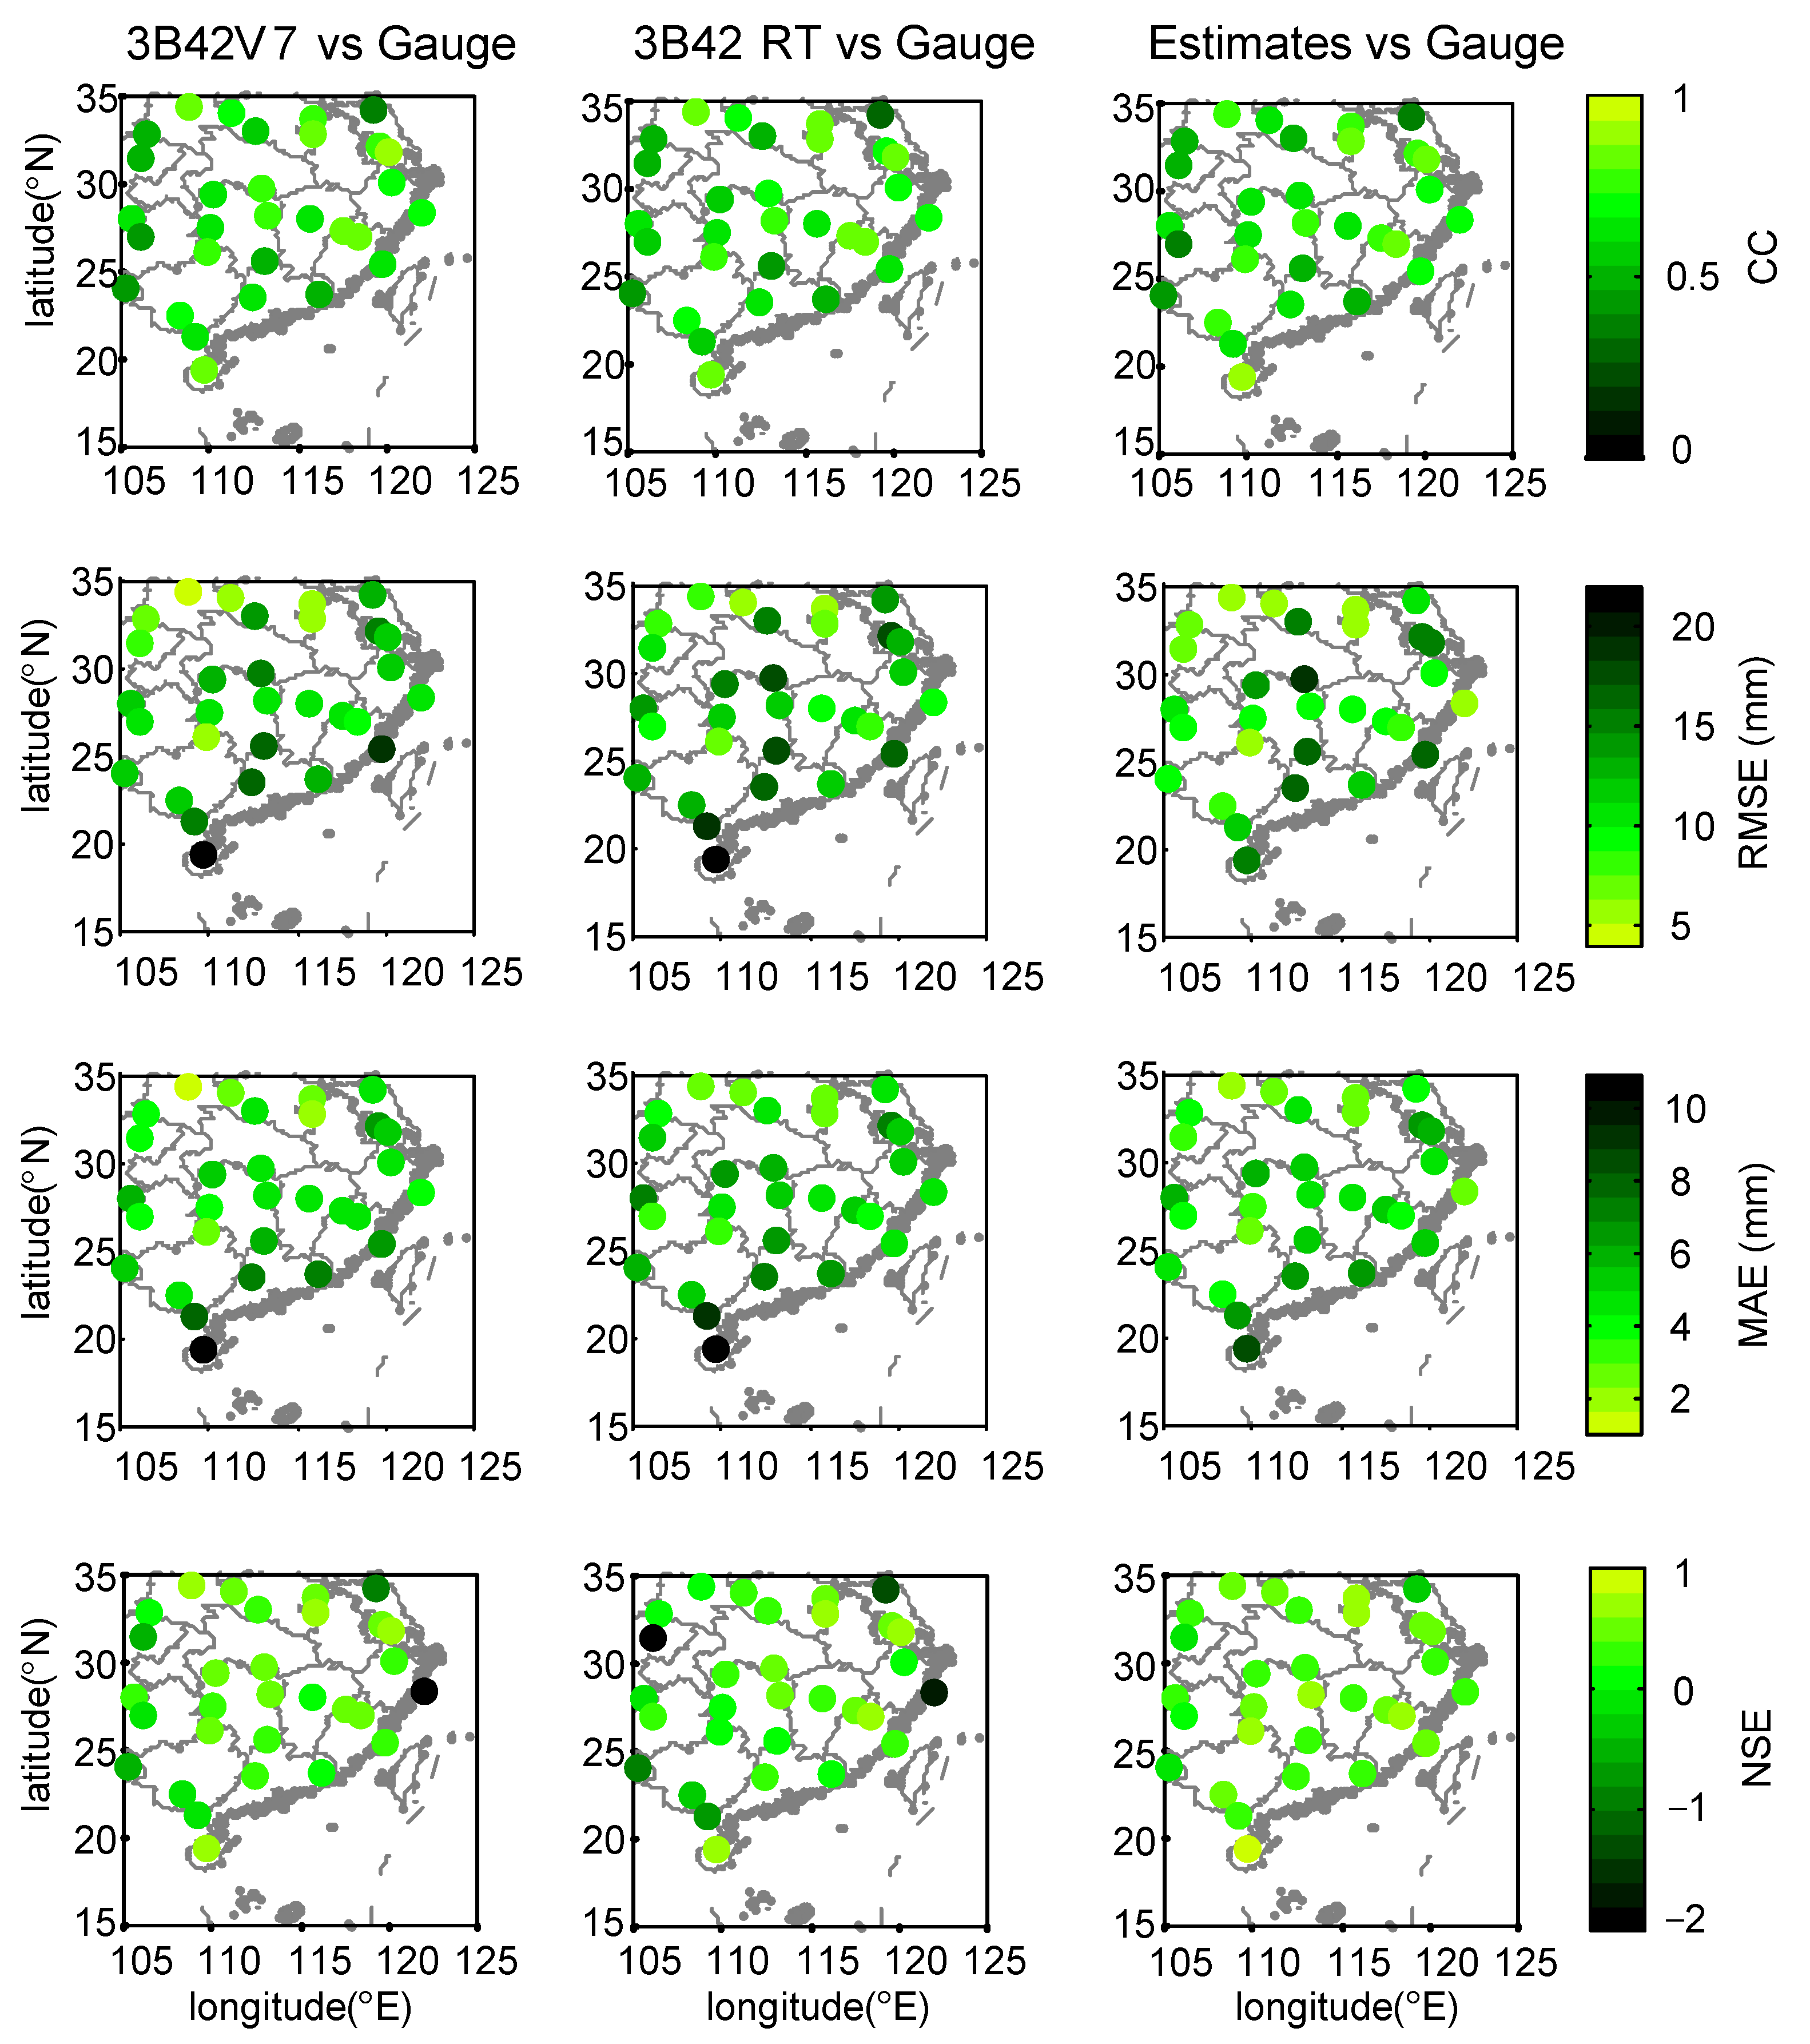
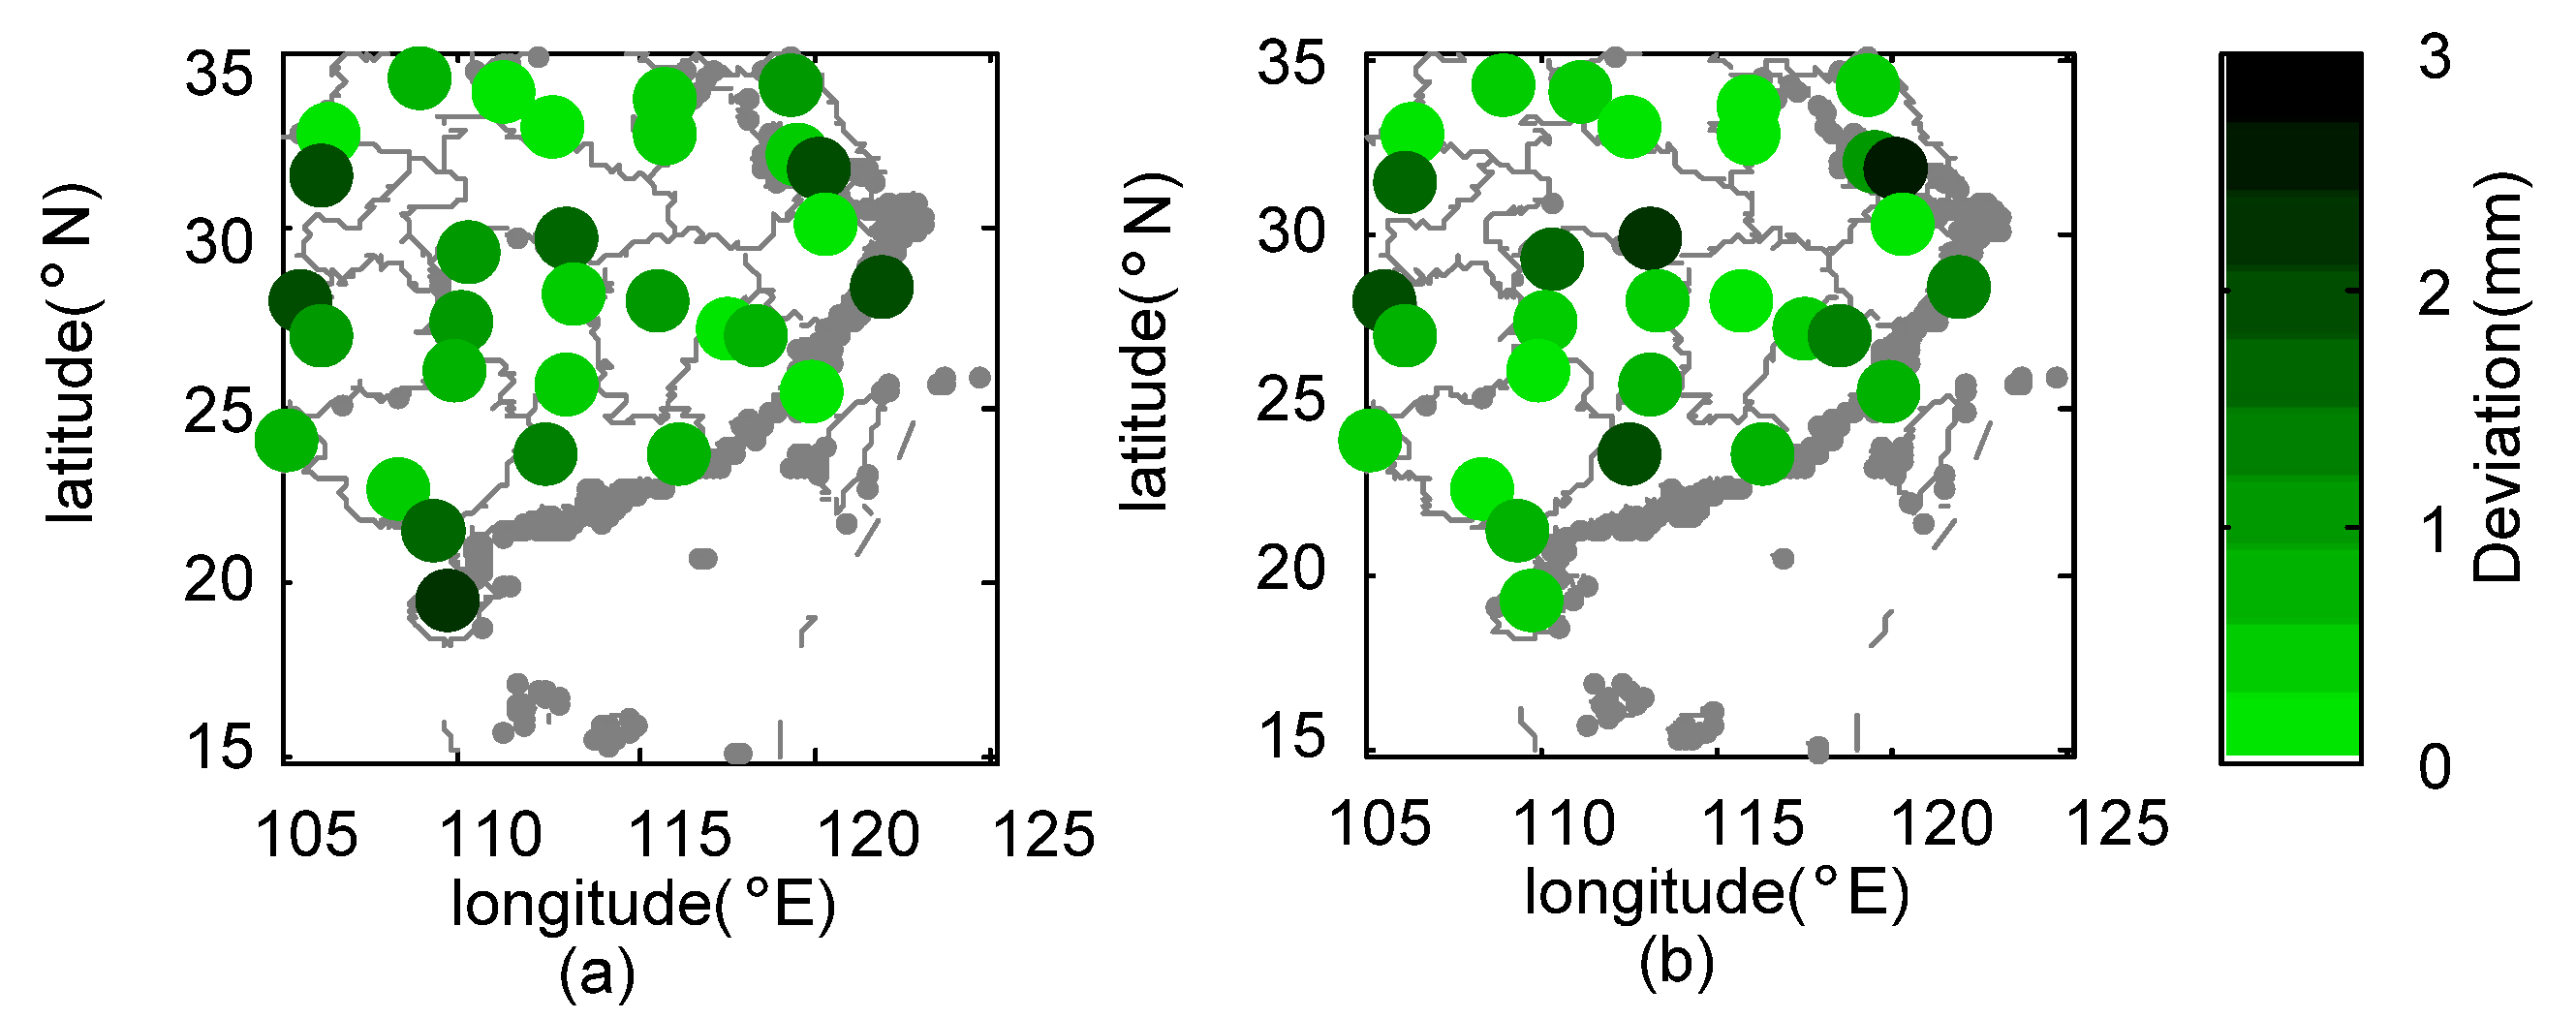
During Meiyu season, the proposed framework in general outperformed 3B42V7 and 3B42RT on the mean value of the total absolute deviation, with a value of 1.17 mm. NGR exhibited the largest CC values at 40% of validation sites and the minimum RMSE at 19 out of 30 validation sites. For NSE, the estimates from NGR can match the gauge observations much better at 28 validation sites.
(2)
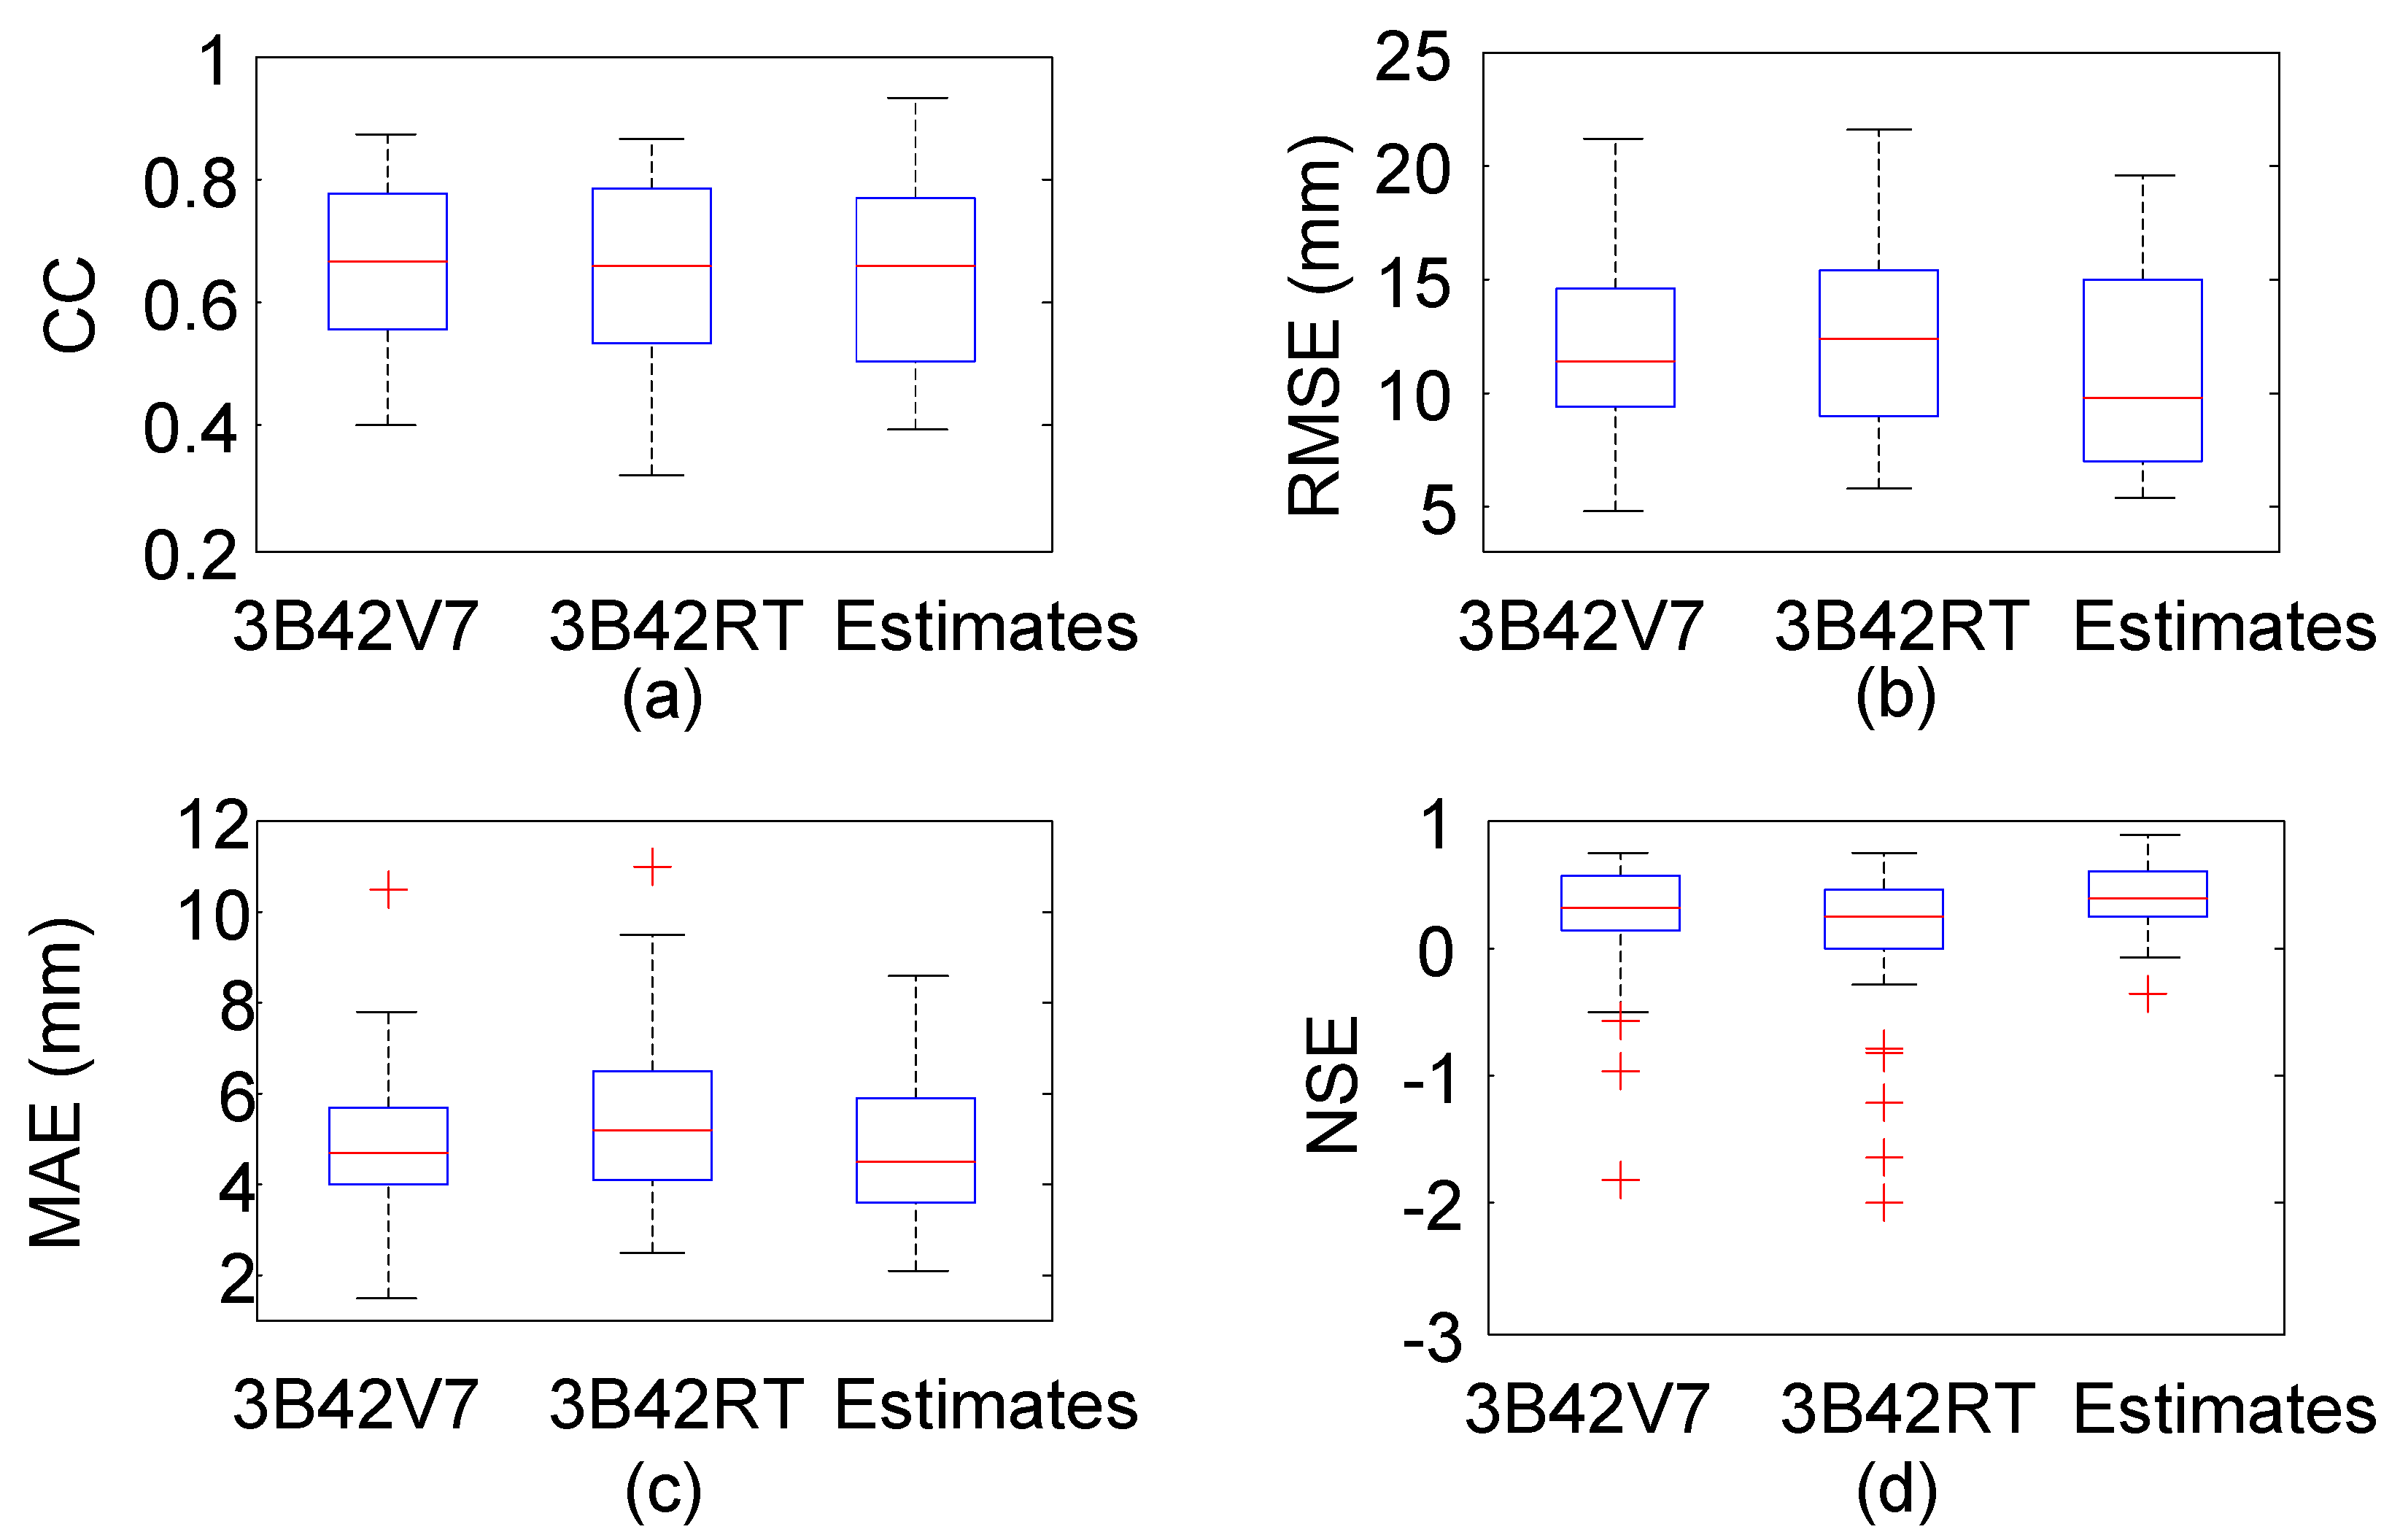
During Typhoon season, the total absolute deviation from NGR was smaller than those from satellite-based schemes. Except for similar CC over SEC, NGR exhibited smaller RMSE and MAE, as well as larger NSE at most of the validation sites.
(3)
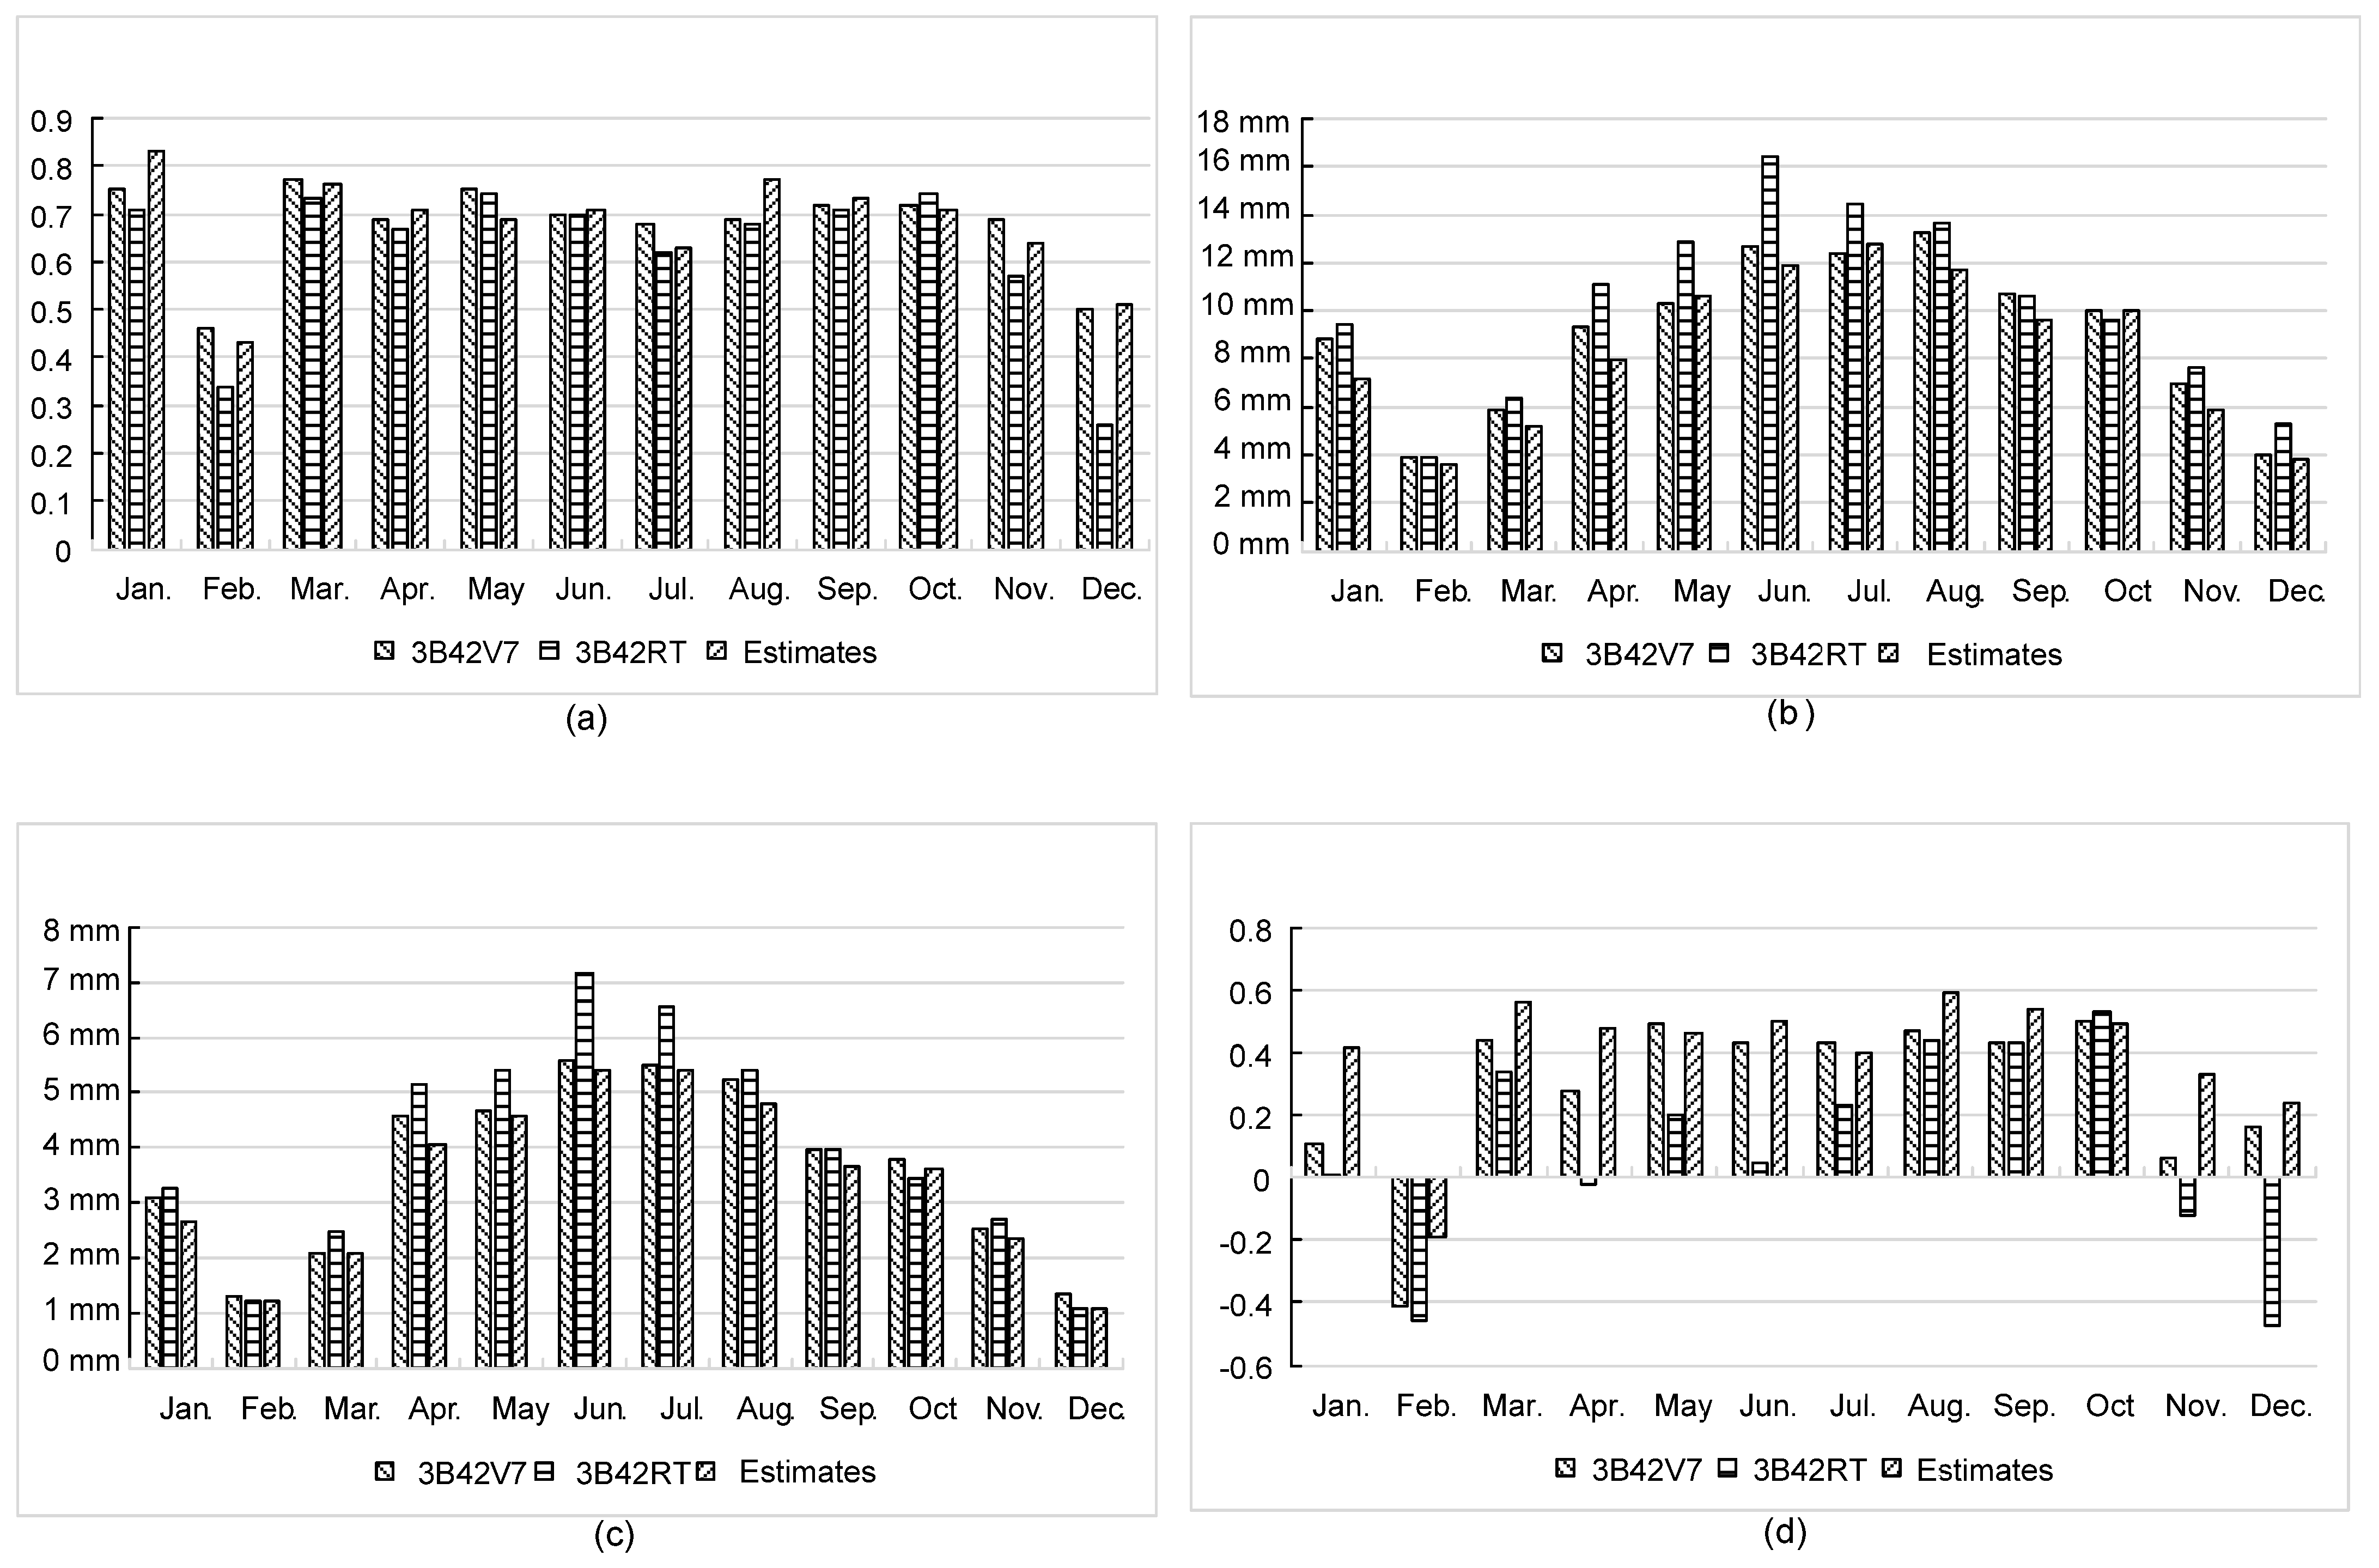
At a monthly scale, NGR performed better on CC in 6 months, RMSE in 9 months and MAE in 10 months, as well as NSE in 9 months. Compared with 3B42V7 and 3B42RT, NGR yielded estimates with larger CC, smaller RMSE and MAE, as well as larger NSE, when the rainfall intensity was less than 50 mm/day.
(4)
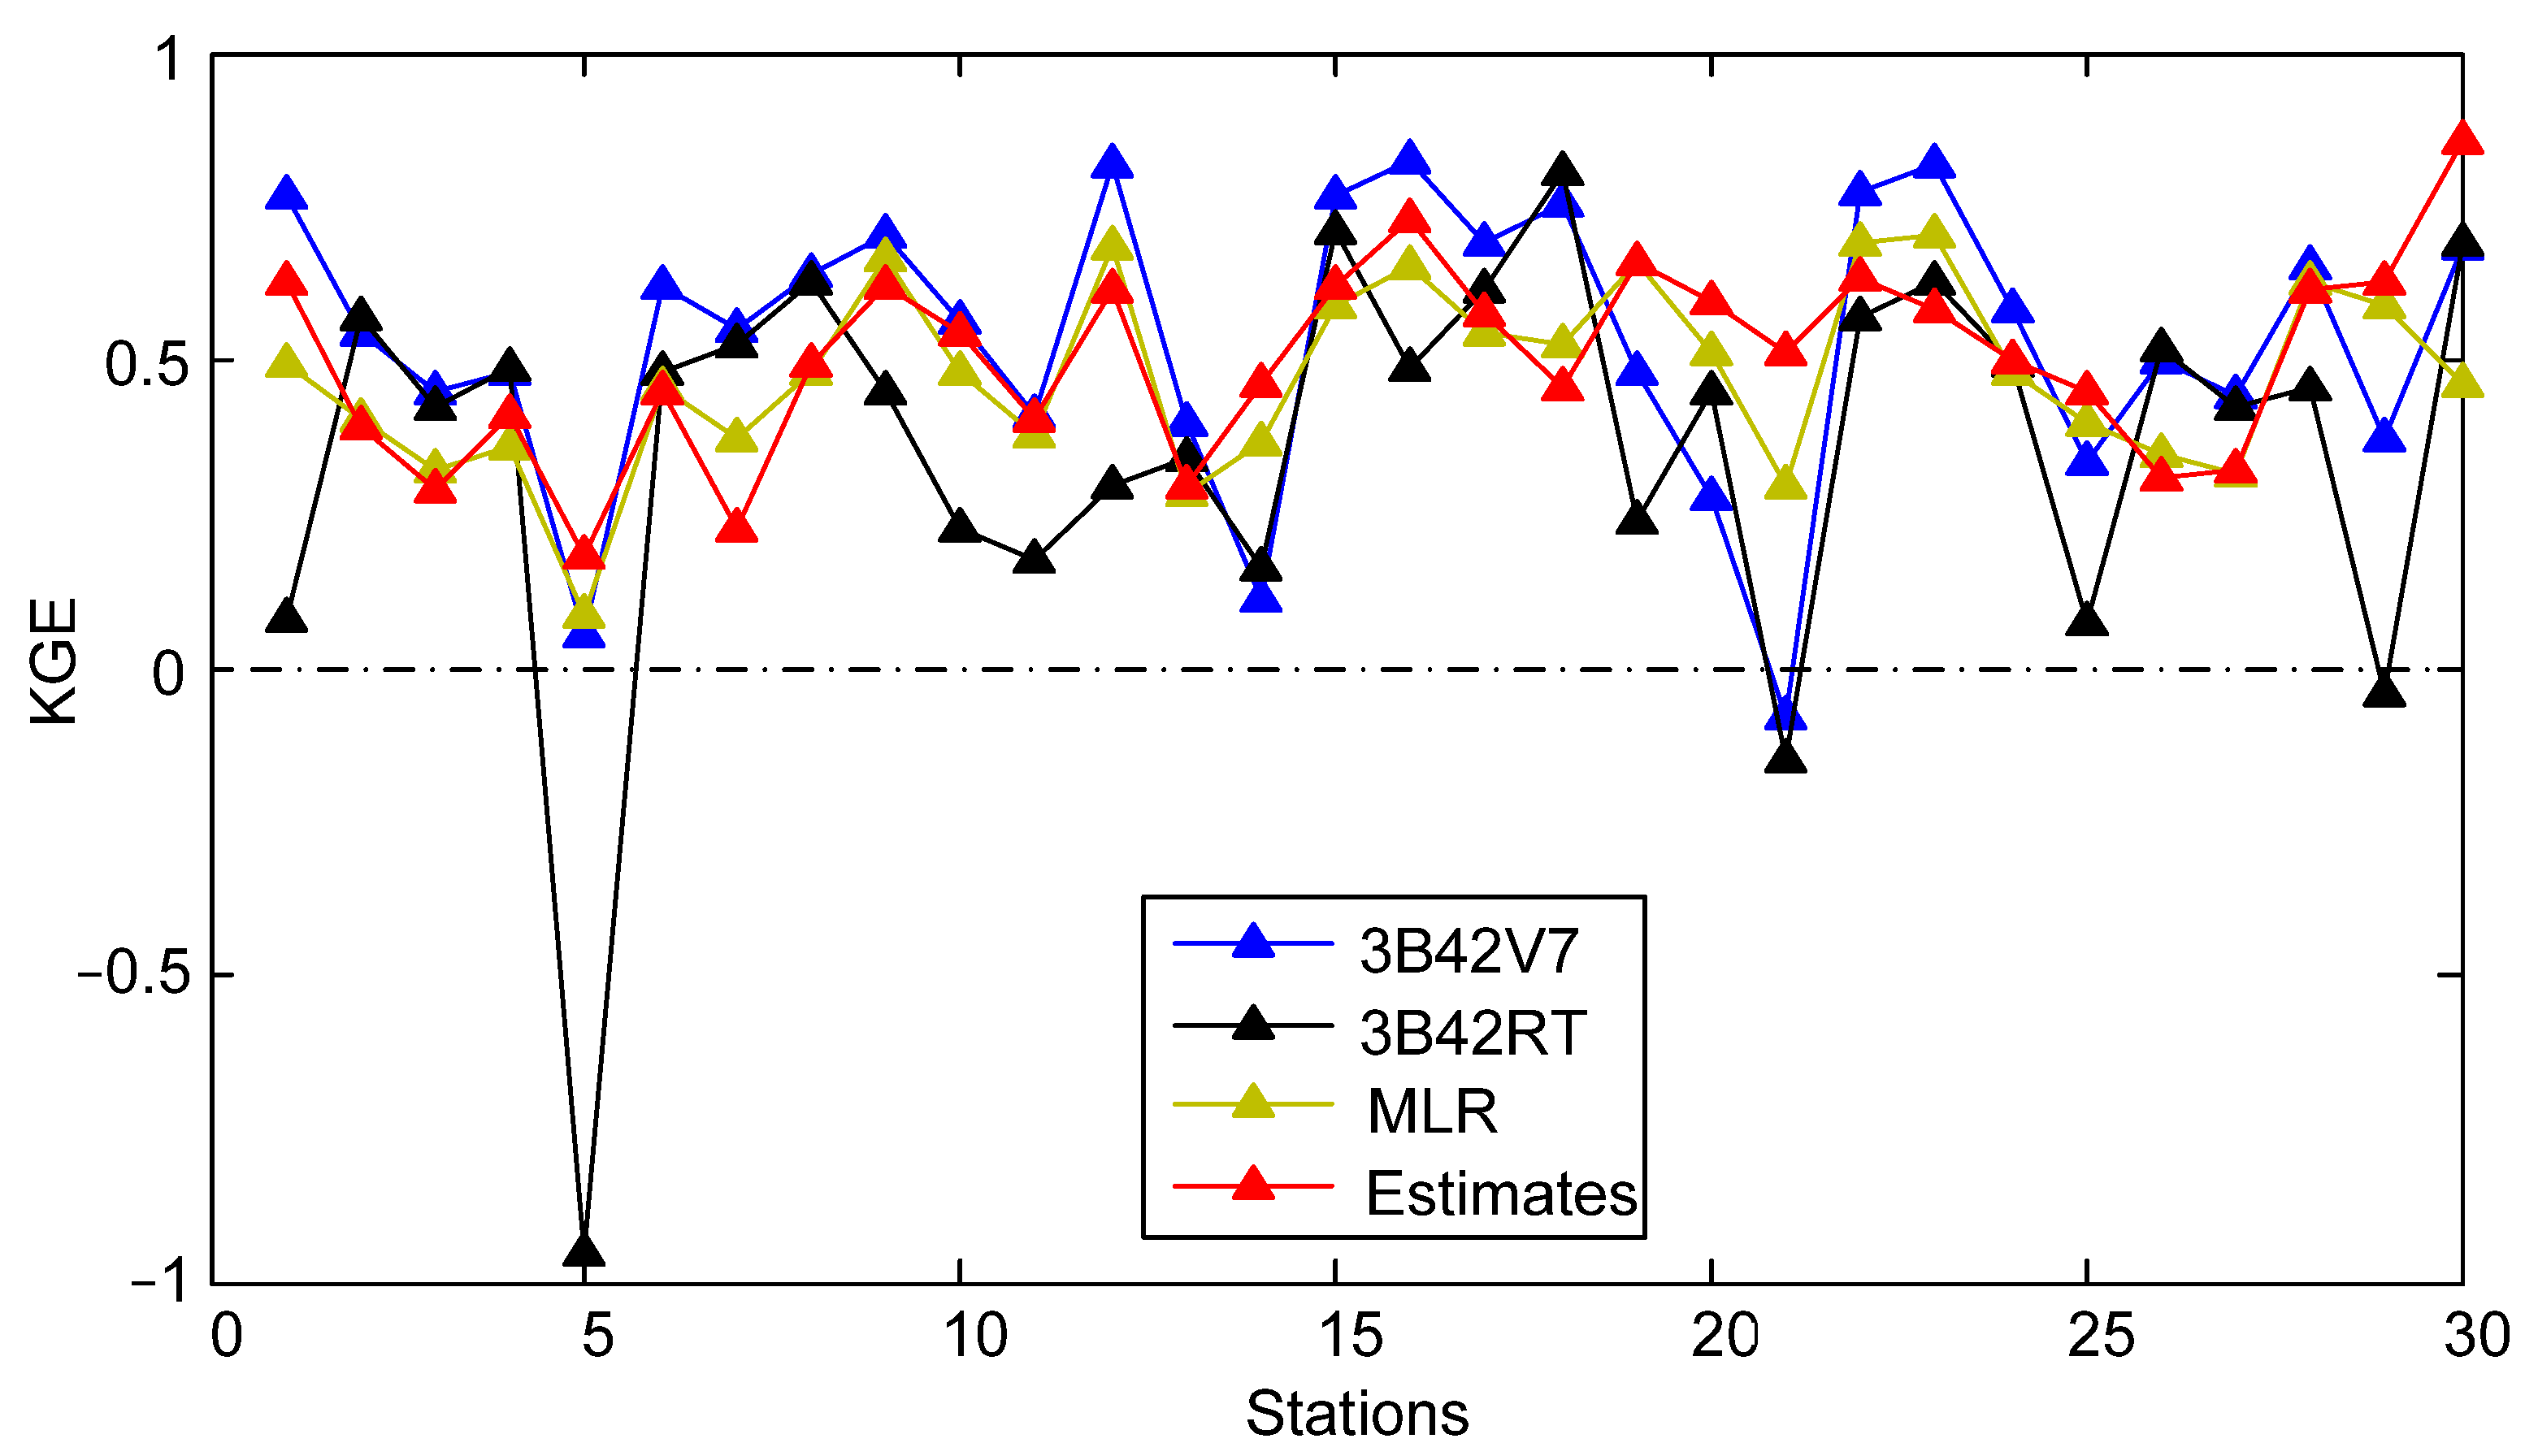
The 3B42V7 data, in general, performed better than 3B42RT data at 30 validation sites across SEC in 2016, which contributed more to the assimilated rainfall data than those from 3B42RT. The NGR framework is capable of automatically selecting the original satellite-based dataset with better performance.

Author Contributions

Conceptualization, L.G.; methodology, Y.Z.; formal analysis, H.S. and N.Q.; data curation, Q.T. and Y.Z.; writing—original draft preparation, Y.Z.; writing—review and editing, L.G., H.S., Q.T., and N.Q.; supervision, L.G.; project administration, L.G. All authors have read and agreed to the published version of the manuscript.

Funding

This paper is financially supported by the Science and Technology Development Fund, Macau SAR (File no.: SKL-IOTSC-2021-2023, 0030/2020/A1, and 0021/2020/ASC), UM Research Grant (File no.: SRG2019-00193-IOTSC, SRG2020-00020-IOTSC, and MYRG2020-00072-IOTSC), Guangdong–Hong Kong-Macau Joint Laboratory Program (Project No.: 2020B1212030009), National Natural Science Foundation of China (41730645), and CORE (EF017/IOTSC-GL/2020/HKUST). CORE is a joint research center for ocean research between QNLM and HKUST.

Institutional Review Board Statement

Not applicable.

Informed Consent Statement

Not applicable.

Data Availability Statement

The data in this study are subject to third party restrictions. The data that support the findings of this study are available from the National Climate Centre in Beijing, China. Restrictions apply to the availability of these data, which were used under license for this study. Data are available at https://data.cma.cn/en, accessed on 11 January 2020, with the permission of the National Climate Centre in Beijing, China.

Acknowledgments

The authors would like to thank the National Climate Centre in Beijing, China, for providing climate data described in this paper.

Conflicts of Interest

The authors declare no conflict of interest.

References

  1. Wu, Y.; Chen, J. Analyzing the Water Budget and Hydrological Characteristics and Responses to Land Use in a Monsoonal Climate River Basin in South China. Environ. Manag. 2013, 51, 1174–1186. [Google Scholar] [CrossRef] [PubMed]
  2. Ma, Y.; Tang, G.; Long, D.; Yong, B.; Zhong, L.; Wan, W.; Hong, Y. Similarity and Error Intercomparison of the GPM and Its Predecessor-TRMM Multisatellite Precipitation Analysis Using the Best Available Hourly Gauge Network over the Tibetan Plateau. Remote. Sens. 2016, 8, 569. [Google Scholar] [CrossRef] [Green Version]
  3. Gao, L.; Zhang, L.; Lu, M. Characterizing the spatial variations and correlations of large rainstorms for landslide study. Hydrol. Earth Syst. Sci. 2017, 21, 4573–4589. [Google Scholar] [CrossRef] [Green Version]
  4. Gao, L.; Zhang, L.M.; Cheung, R.W.M. Relationships between natural terrain landslide magnitudes and triggering rainfall based on a large landslide inventory in Hong Kong. Landslides 2018, 15, 727–740. [Google Scholar] [CrossRef]
  5. Gao, L.; Zhang, L.; Li, X.; Zhou, S. Evaluating Metropolitan Flood Coping Capabilities under Heavy Storms. J. Hydrol. Eng. 2019, 24, 05019011. [Google Scholar] [CrossRef]
  6. Luo, P.; Sun, Y.; Wang, S.; Wang, S.; Lyu, J.; Zhou, M.; Nakagami, K.; Takara, K.; Nover, D. Historical assessment and future sustainability challenges of Egyptian water resources management. J. Clean. Prod. 2020, 263, 121154. [Google Scholar] [CrossRef]
  7. Zhu, Y.; Luo, P.; Zhang, S.; Sun, B. Spatiotemporal Analysis of Hydrological Variations and Their Impacts on Vegetation in Semiarid Areas from Multiple Satellite Data. Remote. Sens. 2020, 12, 4177. [Google Scholar] [CrossRef]
  8. Su, F.; Hong, Y.; Lettenmaier, D.P. Evaluation of TRMM Multisatellite Precipitation Analysis (TMPA) and Its Utility in Hydrologic Prediction in the La Plata Basin. J. Hydrometeorol. 2008, 9, 622–640. [Google Scholar] [CrossRef] [Green Version]
  9. Lee, T.; Ouarda, T.B.M.J. Long-term prediction of precipitation and hydrologic extremes with nonstationary oscillation processes. J. Geophys. Res. Athmos. 2010, 115, D13. [Google Scholar] [CrossRef]
  10. Yong, B.; Hong, Y.; Ren, L.-L.; Gourley, J.J.; Huffman, G.J.; Chen, X.; Wang, W.; Khan, S.I. Assessment of evolving TRMM-based multisatellite real-time precipitation estimation methods and their impacts on hydrologic prediction in a high latitude basin. J. Geophys. Res. Atmos. 2012, 117, D9. [Google Scholar] [CrossRef] [Green Version]
  11. Mu, D.; Luo, P.; Lyu, J.; Zhou, M.; Huo, A.; Duan, W.; Nover, D.; He, B.; Zhao, X. Impact of temporal rainfall patterns on flash floods in Hue City, Vietnam. J. Flood Risk Manag. 2020, e12668. [Google Scholar] [CrossRef]
  12. Zhu, H.; Li, Y.; Huang, Y.; Li, Y.; Hou, C.; Shi, X. Evaluation and hydrological application of satellite-based precipitation datasets in driving hydrological models over the Huifa river basin in Northeast China. Atmos. Res. 2018, 207, 28–41. [Google Scholar] [CrossRef]
  13. Trinh-Tuan, L.; Matsumoto, J.; Ngo-Duc, T.; Nodzu, M.I.; Inoue, T. Evaluation of satellite precipitation products over Central Vietnam. Prog. Earth Planet. Sci. 2019, 6, 54. [Google Scholar] [CrossRef] [Green Version]
  14. Ashouri, H.; Hsu, K.-L.; Sorooshian, S.; Braithwaite, D.K.; Knapp, K.R.; Cecil, L.D.; Nelson, B.R.; Prat, O.P. PERSIANN-CDR: Daily Precipitation Climate Data Record from Multisatellite Observations for Hydrological and Climate Studies. Bull. Am. Meteorol. Soc. 2015, 96, 69–83. [Google Scholar] [CrossRef] [Green Version]
  15. Joyce, R.J.; Janowiak, J.E.; Arkin, P.A.; Xie, P. CMORPH: A method that produces global precipitation estimates from passive microwave and infrared data at high spatial and temporal resolution. J. Hydrometeorol. 2004, 5, 487–503. [Google Scholar] [CrossRef]
  16. Hou, A.Y.; Kakar, R.K.; Neeck, S.; Azarbarzin, A.A.; Kummerow, C.D.; Kojima, M.; Oki, R.; Nakamura, K.; Iguchi, T. The Global Precipitation Measurement Mission. Bull. Am. Meteorol. Soc. 2014, 95, 701–722. [Google Scholar] [CrossRef]
  17. Huffman, G.J.; Adler, R.F.; Bolvin, D.T.; Nelkin, E.J. The TRMM Multi-Satellite Precipitation Analysis (TMPA) in Satellite Rainfall Applications for Surface Hydrology; Springer: Dordrecht, The Netherlands, 2010; pp. 3–22. ISBN 978-90-481-2914-0. [Google Scholar]
  18. Wu, L.; Xu, Y.; Wang, S. Comparison of TMPA-3B42RT Legacy Product and the Equivalent IMERG Products over Mainland China. Remote Sens. 2018, 10, 1778. [Google Scholar] [CrossRef] [Green Version]
  19. Cao, Y.; Zhang, W.; Wang, W. Evaluation of TRMM 3B43 data over the Yangtze River Delta of China. Sci. Rep. 2018, 8, 1–12. [Google Scholar] [CrossRef] [Green Version]
  20. Guo, H.; Chen, S.; Bao, A.; Behrangi, A.; Hong, Y.; Ndayisaba, F.; Hu, J.; Stepanian, P.M. Early assessment of Integrated Multi-satellite Retrievals for Global Precipitation Measurement over China. Atmos. Res. 2016, 176, 121–133. [Google Scholar] [CrossRef]
  21. Wang, Y.; Chen, J.; Yang, D. Bayesian Assimilation of Multiscale Precipitation Data and Sparse Ground Gauge Observations in Mountainous Areas. J. Hydrometeorol. 2019, 20, 1473–1494. [Google Scholar] [CrossRef]
  22. Bhuiyan, M.A.E.; Yang, F.; Biswas, N.K.; Rahat, S.H.; Neelam, T.J. Machine Learning-Based Error Modeling to Improve GPM IMERG Precipitation Product over the Brahmaputra River Basin. Forecast 2020, 2, 14. [Google Scholar] [CrossRef]
  23. Tang, G.; Zeng, Z.; Ma, M.; Liu, R.; Wen, Y.; Hong, Y. Can Near-Real-Time Satellite Precipitation Products Capture Rainstorms and Guide Flood Warning for the 2016 Summer in South China? IEEE Geosci. Remote Sens. Lett. 2017, 14, 1208–1212. [Google Scholar] [CrossRef]
  24. Chao, L.; Zhang, K.; Li, Z.; Zhu, Y.; Wang, J.; Yu, Z. Geographically weighted regression based methods for merging satellite and gauge precipitation. J. Hydrol. 2018, 558, 275–289. [Google Scholar] [CrossRef]
  25. Tong, K.; Su, F.; Yang, D.; Hao, Z. Evaluation of satellite precipitation retrievals and their potential utilities in hydrologic modeling over the Tibetan Plateau. J. Hydrol. 2014, 519, 423–437. [Google Scholar] [CrossRef]
  26. Zhang, L.; Li, X.; Zheng, D.; Zhang, K.; Ma, Q.; Zhao, Y.; Ge, Y. Merging multiple satellite-based precipitation products and gauge observations using a novel double machine learning approach. J. Hydrol. 2021, 594, 125969. [Google Scholar] [CrossRef]
  27. Ma, Y.; Sun, X.; Chen, H.; Hong, Y.; Zhang, Y. A two-stage blending approach for merging multiple satellite precipitation estimates and rain gauge observations: An experiment in the northeastern Tibetan Plateau. Hydrol. Earth Syst. Sci. 2021, 25, 359–374. [Google Scholar] [CrossRef]
  28. Bhuiyan, M.A.E.; Nikolopoulos, E.I.; Anagnostou, E.N. Machine Learning—Based Blending of Satellite and Reanalysis Precipitation Datasets: A Multiregional Tropical Complex Terrain Evaluation. J. Hydrometeorol. 2019, 20, 2147–2161. [Google Scholar] [CrossRef]
  29. Yin, J.; Guo, S.; Gu, L.; Zeng, Z.; Liu, D.; Chen, J.; Shen, Y.; Xu, C.-Y. Blending multi-satellite, atmospheric reanalysis and gauge precipitation products to facilitate hydrological modelling. J. Hydrol. 2021, 593, 125878. [Google Scholar] [CrossRef]
  30. Chen, S.; Xiong, L.; Ma, Q.; Kim, J.-S.; Chen, J.; Xu, C.-Y. Improving daily spatial precipitation estimates by merging gauge observation with multiple satellite-based precipitation products based on the geographically weighted ridge regression method. J. Hydrol. 2020, 589, 125156. [Google Scholar] [CrossRef]
  31. Metered, H.; Bonello, P.; Oyadiji, S. Nonparametric Identification Modeling of Magnetorheological Damper Using Chebyshev Polynomials Fits. SAE Int. J. Passeng. Cars Mech. Syst. 2009, 2, 1125–1135. [Google Scholar] [CrossRef]
  32. Kuok, S.C.; Yuen, K.V. Broad learning for nonparametric spatial modeling with application to seismic attenuation. Comput. Aided Civ. Infrastruct. Eng. 2020, 35, 203–218. [Google Scholar] [CrossRef]
  33. Fan, J.; Huang, L.-S. Goodness-of-Fit Tests for Parametric Regression Models. J. Am. Stat. Assoc. 2001, 96, 640–652. [Google Scholar] [CrossRef]
  34. Hill, J.L. Bayesian Nonparametric Modeling for Causal Inference. J. Comput. Graph. Stat. 2011, 20, 217–240. [Google Scholar] [CrossRef]
  35. Bhuiyan, M.A.E.; Nikolopoulos, E.I.; Anagnostou, E.N.; Quintana-Seguí, P.; Barella-Ortiz, A. A nonparametric statistical technique for combining global precipitation datasets: Development and hydrological evaluation over the Iberian Peninsula. Hydrol. Earth Syst. Sci. 2018, 22, 1371–1389. [Google Scholar] [CrossRef] [Green Version]
  36. Ma, Y.; Hong, Y.; Chen, Y.; Yang, Y.; Tang, G.; Yao, Y.; Long, D.; Li, C.; Han, Z.; Liu, R. Performance of Optimally Merged Multisatellite Precipitation Products Using the Dynamic Bayesian Model Averaging Scheme Over the Tibetan Plateau. J. Geophys. Res. Atmos. 2018, 123, 814–834. [Google Scholar] [CrossRef]
  37. Matsoukas, C.; Islam, S.; Kothari, R. Fusion of radar and rain gage measurements for an accurate estimation of rainfall. J. Geophys. Res. Atmos. 1999, 104, 31437–31450. [Google Scholar] [CrossRef]
  38. Xu, G.; Wang, Z.; Xia, T. Mapping Areal Precipitation with Fusion Data by ANN Machine Learning in Sparse Gauged Region. Appl. Sci. 2019, 9, 2294. [Google Scholar] [CrossRef] [Green Version]
  39. Wehbe, Y.; Temimi, M.; Adler, R.F. Enhancing Precipitation Estimates Through the Fusion of Weather Radar, Satellite Retrievals, and Surface Parameters. Remote. Sens. 2020, 12, 1342. [Google Scholar] [CrossRef] [Green Version]
  40. Specht, D.F. A general regression neural network. IEEE Trans. Neural Netw. 1991, 2, 568–576. [Google Scholar] [CrossRef] [PubMed] [Green Version]
  41. Yuen, K.-V.; Ortiz, G.A. Bayesian Nonparametric General Regression. Int. J. Uncertain. Quantif. 2016, 6, 195–213. [Google Scholar] [CrossRef]
  42. Chen, W.; Jiang, Z.; Li, L.; Yiou, P. Simulation of regional climate change under the IPCC A2 scenario in southeast China. Clim. Dyn. 2011, 36, 491–507. [Google Scholar] [CrossRef]
  43. Gao, X.; Shi, Y.; Song, R.; Giorgi, F.; Wang, Y.; Zhang, D. Reduction of future monsoon precipitation over China: Comparison between a high resolution RCM simulation and the driving GCM. Meteorol. Atmos. Phys. 2008, 100, 73–86. [Google Scholar] [CrossRef]
  44. Zheng, J.; Han, W.; Jiang, B.; Ma, W.; Zhang, Y. Infectious Diseases and Tropical Cyclones in Southeast China. Int. J. Environ. Res. Public Health 2017, 14, 494. [Google Scholar] [CrossRef] [Green Version]
  45. Wu, Y.; Chen, J. Investigating the effects of point source and nonpoint source pollution on the water quality of the East River (Dongjiang) in South China. Ecol. Indic. 2013, 32, 294–304. [Google Scholar] [CrossRef]
  46. Yang, L.; Scheffran, J.; Qin, H.; You, Q. Climate-related flood risks and urban responses in the Pearl River Delta, China. Reg. Environ. Chang. 2015, 15, 379–391. [Google Scholar] [CrossRef]
  47. Zhao, X.; Niu, R. Similarities and differences of summer persistent heavy rainfall and atmospheric circulation characteristics in the middle and lower reaches of the Yangtze River between 2016 and 1998. Torrential Rain Disasters 2019, 38, 615–623. [Google Scholar] [CrossRef]
  48. Luo, P.; Mu, D.; Xue, H.; Ngo-Duc, T.; Dang-Dinh, K.; Takara, K.; Nover, D.; Schladow, G. Flood inundation assessment for the Hanoi Central Area, Vietnam under historical and extreme rainfall conditions. Sci. Rep. 2018, 8, 1–11. [Google Scholar] [CrossRef]
  49. Huffman, G.J.; Bolvin, D.T.; Nelkin, E.J.; Wolff, D.B.; Adler, R.F.; Gu, G.; Hong, Y.; Bowman, K.P.; Stocker, E.F. The TRMM Multisatellite Precipitation Analysis (TMPA): Quasi-Global, Multiyear, Combined-Sensor Precipitation Estimates at Fine Scales. J. Hydrometeorol. 2007, 8, 38–55. [Google Scholar] [CrossRef]
  50. Fotheringham Stewart, A.; Brunsdon, C.; Charlton, M. GWR and Spatial Autocorrelation in Geographically Weighted Regression: The Analysis of Spatially Varying Relationships; John Wiley: New York, NY, USA, 2002; pp. 103–124. ISBN 0-471-49616-2. [Google Scholar]
  51. Giarno, G.; Hadi, M.P.; Suprayogi, S.; Murti, S.H. Suitable Proportion Sample of Holdout Validation for Spatial Rainfall Interpolation in Surrounding the Makassar Strait. Forum Geogr. 2020, 33, 219–232. [Google Scholar] [CrossRef]
  52. Raftery, A.E.; Gneiting, T.; Balabdaoui, F.; Polakowski, M. Using Bayesian Model Averaging to Calibrate Forecast Ensembles. Mon. Weather Rev. 2005, 133, 1155–1174. [Google Scholar] [CrossRef] [Green Version]
  53. Gupta, H.V.; Kling, H.; Yilmaz, K.K.; Martinez, G.F. Decomposition of the mean squared error and NSE performance criteria: Implications for improving hydrological modelling. J. Hydrol. 2009, 377, 80–91. [Google Scholar] [CrossRef] [Green Version]
  54. Knoben, W.J.M.; Freer, J.E.; Woods, R.A. Technical note: Inherent benchmark or not? Comparing Nash-Sutcliffe and Kling-Gupta efficiency scores. Hydrol. Earth Syst. Sci. 2019, 23, 4323–4331. [Google Scholar] [CrossRef] [Green Version]
  55. Castaneda-Gonzalez, M.; Poulin, A.; Romero-Lopez, R.; Arsenault, R.; Brissette, F.; Chaumont, D.; Paquin, D. Impacts of Regional Climate Model Spatial Resolution on Summer Flood Simulation. EPiC Ser. Eng. 2018, 3, 372–380. [Google Scholar] [CrossRef] [Green Version]
  56. Andersson, J.C.; Arheimer, B.; Traoré, F.; Gustafsson, D.; Ali, A. Process refinements improve a hydrological model concept applied to the Niger River basin. Hydrol. Process. 2017, 31, 4540–4554. [Google Scholar] [CrossRef] [Green Version]
  57. Weisberg, S. Simple Linear Regression in Applied Linear Regression; John Wiley & Sons: Hoboken, NJ, USA, 2005; pp. 19–33. ISBN 0-471-66379-4. [Google Scholar]
  58. Chen, F.; Li, X. Evaluation of IMERG and TRMM 3B43 Monthly Precipitation Products over Mainland China. Remote Sens. 2016, 8, 472. [Google Scholar] [CrossRef] [Green Version]
  59. Ye, B.; Yang, D.; Ding, Y.; Han, T.; Koike, T. A Bias-Corrected Precipitation Climatology for China. J. Hydrometeorol. 2004, 5, 1147–1160. [Google Scholar] [CrossRef]
Figure 1. (a) The location of study area, and (b) rain gauge stations.
Remotesensing 13 01057 g001
Figure 2. The flowchart of the framework based on NGR for assimilating multiple-source rainfall data based on hold-out cross-validation.
Remotesensing 13 01057 g002
Figure 3. Absolute deviation of mean daily rainfall estimates against gauge observations at each validation site in Meiyu season from (a) 3B42V7, (b) 3B42RT and (c) NGR in 2016.
Remotesensing 13 01057 g003
Figure 4. Spatial distribution of statistical metrics of daily precipitation at each validation site during Meiyu season in 2016.
Remotesensing 13 01057 g004
Figure 5. Box plots depicting statistical metrics including (a) CC, (b) RMSE, (c) MAE and (d) NSE for daily precipitation at each validation site during Meiyu season in 2016. The line in the box stands for the median value.
Remotesensing 13 01057 g005
Figure 6. Absolute deviation of mean daily rainfall estimates against gauge observations at each validation site in Typhoon season from (a) 3B42V7, (b) 3B42RT and (c) NGR in 2016.
Remotesensing 13 01057 g006
Figure 7. Spatial distribution of statistical metrics for precipitation at daily scale from 3B42V7 data, 3B42RT data and estimated rainfall data at 30 validation sites during the Typhoon season in 2016 over SEC.
Remotesensing 13 01057 g007
Figure 8. Box plots depicting the difference of statistical metrics including (a) CC, (b) RMSE, (c) MAE and (d) NSE for daily assimilated and satellite-based rainfall datasets at each validation site in the Typhoon season in 2016. The line in the box stands for the median value. NGR performed the best on the median values of RMSE, MAE and NSE.
Remotesensing 13 01057 g008
Figure 9. Bar graphs of daily metrics of (a) CC, (b) RMSE, (c) MAE and (d) NSE from the estimated and satellite-based precipitation datasets at validation sites in different months of 2016.
Remotesensing 13 01057 g009
Figure 10. Daily KGE of rainfall estimates against gauge-based rainfall in the rainy season at each validation site in 2016.
Remotesensing 13 01057 g010
Figure 11. Deviation of mean daily rainfall amounts in the rainy season from (a) MLR data and (b) NGR data against gauge observations at each validation site in 2016.
Remotesensing 13 01057 g011
Figure 12. The percentages of gauge-based data falling in different confidence intervals of estimates during (a) light rain, (b) moderate rain, (c) heavy rain and (d) rainstorm events.
Remotesensing 13 01057 g012
Figure 13. Scatterplots of daily precipitation from (a) the estimates versus 3B42V7, (b) the estimates versus 3B42RT in Meiyu season, (c) the estimates versus 3B42V7 and (d) the estimates versus 3B42RT in Typhoon season at 30 validation sites in 2016.
Remotesensing 13 01057 g013
Table 1. The information of rainfall datasets employed in this study.
ProductsSpatial/Temporal ResolutionTime Period AvailableCoverageSource of Data
3B42V70.25°/3 hJanuary 1998 to January 202050° S to 50° NGoddard Space Flight Center (GSFC)
3B42RT0.25°/3 hFebruary 2000 to January 202060° S to 60° NGSFC
PERSIANN0.25°/3 hMarch 2000 to present60° S to 60° NCenter for Hydrometeorology and Remote Sensing (CHRS)
Rain gauge observationPoint/Daily1951 to presentChinaChina Meteorological Data Service Center (CMDC)
Table 2. The mean values of daily statistical metric of rainfall estimates originated from the eleven-fold cross-validation.
ProductsCCRMSE (mm)MAE (mm)NSEKGE
Estimates0.689.763.610.450.58
3B42V70.709.983.780.430.70
3B42RT0.6711.384.190.250.63
Note: The numbers in bold indicate the optimum values for the indices.
Table 3. The number of validation stations corresponding to the best performance in Meiyu and Typhoon seasons.
Statistical MetricsProductsNumber of Stations (Meiyu)Number of Stations (Typhoon)
3B42V71112
CC3B42RT76
Estimates1212
3B42V7118
RMSE3B42RT02
Estimates1920
3B42V71410
MAE3B42RT03
Estimates1617
3B42V7118
NSE3B42RT02
Estimates1920
3B42V7118
Deviation3B42RT14
Estimates1818
Note: The numbers in bold indicate the maximum number of stations.
Table 4. Statistical metrics for daily precipitation with various rainfall intensities at 30 validation sites in 2016.
Classification of Rainfall IntensitiesProductsCCRMSE (mm)MAE (mm)NSE
Light rain3B42V70.2848.754.61−9.86
3B42RT0.2639.995.01−13.16
Estimates0.2956.774.01−5.45
Moderate rain3B42V70.16117.0113.00−14.41
3B42RT0.12420.2714.45−20.90
Estimates0.16312.6310.28−7.49
Heavy rain3B42V70.14824.0919.79−11.95
3B42RT0.15027.4222.23–15.79
Estimates0.15221.4718.77−9.29
Rainstorm3B42V70.54144.8834.89−0.33
3B42RT0.50147.0537.38−0.46
Estimates0.60053.1143.88−0.86
Note: The numbers in bold indicate the optimum values for the indices.
Table 5. Daily metrics of assimilated precipitation obtained by the proposed framework, MLR and ANN at validation sites in rainy season over SEC.
ProductsCCRMSE (mm)MAE (mm)NSE
Estimates0.71511.544.830.51
MLR0.70111.794.760.49
3B42V70.70012.315.080.44
3B42RT0.67313.945.780.29
PERSIANN0.57113.735.490.31
Note: The bold text stands for the optimum values for the indices.
Publisher’s Note: MDPI stays neutral with regard to jurisdictional claims in published maps and institutional affiliations.

