Abstract
The sustainability of vulnerable eco-environment over the Silk Road Economic Belt is under threat of climate change, and the identification of vegetation constraints by sub-optimum climatic conditions is critically essential to maintain existing dryland ecosystems. To better understand how the vegetation varies at monthly scale and its effect by climate conditions in different desert areas, this study first investigated the seasonal variation of the normalized difference vegetation index (NDVI). Then, we analyzed the time effects of diverse climatic factors (air temperature, solar radiation, precipitation) on NDVI and estimated the limitation of NDVI by these climatic factors in different desert areas. The result showed that the mean monthly NDVI during 1982–2015 showed a unimodal variation in most desert areas, with high values in late spring and summer over cold arid areas, in early spring or early autumn over hot arid areas, and in summer over polar areas, respectively. Solar radiation and precipitation in cold arid areas presented 1–2 month lag or accumulation effect on NDVI, while precipitation in most hot arid areas showed no remarkable time-lag but 3 month accumulation effect, and all three climate factors in polar areas exhibited 1–3 month accumulation effect. The explanatory power of climatic conditions for vegetation dynamics considering time effects increased by 3.4, 10.8, and 5.9% for the cold arid areas, hot arid areas, and polar areas (i.e., relative increase of 4.1, 25.4, and 8.2%), respectively. The main climatic constraints to vegetation dynamics were the water condition in hot arid areas (>78%) and the temperature condition in polar areas (>67%), while cold arid areas were simultaneously limited by the water and temperature conditions (>76% in total). These results provide a detailed understanding of vegetation variation and ecological projection, which are very important to implement adaption measures for dryland ecosystems over the Silk Road Economic Belt.
1. Introduction
Vegetation growth is frequently constrained by sub-optimum climatic conditions, such as inadequate precipitation, low temperatures, and high cloudiness. Precipitation represents the maximum amount of accessible water to natural vegetation, especially in the arid and semi-arid regions [1]. Temperature partly determines the photosynthetic rates of vegetation, and plants that grow in cold climates usually have lower productivity than these in the warmer environments [2]. Cloudiness will affect solar radiation and further influence the vegetation growth, because the photosynthesis only occurs in environments with sufficient light [3]. At the global scale, previous studies revealed that water availability, temperature, and radiation limited vegetation growth over 40–52%, 31–33%, and 5–27% of the land areas, respectively [4,5]. For different areas, the grassland regions of Asia and North America demonstrate strong sensitivity to water availability, while alpine regions are most sensitive to temperature, and tundra areas present obvious responses to both temperature and cloud cover [6]. Moreover, these climatic factors tend to be colimiting with temporal heterogeneity. For example, dry summers and cold winters limit vegetation growth in western North America [7], whereas tropical areas are never restricted by low temperature but may have nearly everlasting cloud cover that limits solar radiation [8]. In general, the vegetation growth is usually constrained by the inappropriate climatic conditions worldwide, especially in the ecologically vulnerable areas, and these constraints may vary obviously during different seasons.
Proposed by the Chinese government in 2013, the Silk Road Economic Belt aims to help Eurasian countries develop fast while accelerating rapid development in China [9]. It links China with Europe, West Asia, Central Asia, South Asia, Southeast Asia, and North Africa [10] and contains many deserts over the world, such as Taklimakan desert, Arabian desert, Kazakh semi-desert, etc. Much of the Silk Road Economic Belt is located in arid and semi-arid regions, where the eco-environment is highly vulnerable to climate change and human activities [11]. Vegetation plays a key role in the conservation of vulnerable eco-environments, and its variations are usually taken as indicators of environmental changes [12,13]. Over the Silk Road Economic Belt, the climate change dominated the overall variations of vegetation, especially at short timescales [14], and it presented a general warming and drying trend between 1982 and 2015 [15]. The rising temperature will exacerbate the water stress by stimulating glacial melting and increasing evapotranspiration in Central Asia [16,17], while West Asia may experience more drought events [18]. Precipitation in Central Asia showed multi-decadal changes over the last century, with a fluctuation after the 1980s [19,20]. Moreover, different desert areas in this region are confronted with diverse climate change patterns and vegetation response [15,21]. Generally, the Silk Road Economic Belt is ecologically vulnerable, and the sustainability of existing vegetation is under threat of the sub-optimum climatic conditions [22].
The responses of vegetation growth to climate are usually asymmetric with time effects, and the interactions between them can vary remarkably with the spatial heterogeneity. Specifically, the time effects included both the time-lag effect and the time-accumulation effect, in which the former represents that vegetation growth is markedly affected by the climatic conditions of certain previous period [23], while the latter represents that vegetation growth is obviously influenced by the cumulative climatic conditions over the previous periods [24]. At the global scale, the time-lag or time-accumulation effect of climate on vegetation dynamics varied across climatic factors and vegetation types [23]. Comparing with that of temperature, both solar radiation and precipitation show more distinct time-accumulation effects on vegetation worldwide [25]. Moreover, terrestrial vegetation growth displayed reverse correlations with the maximum and minimum temperature over most regions of the world, respectively [26]. At the regional scale, grassland and shrubland ecosystems on the northern Colorado Plateau presented strong relationships with climate conditions at short lags (3–6 months) and long lags (6–12 months), respectively [27]; whereas the response lag of grassland and forest to drought in Nebraska was obviously shorter (i.e., ~35 and ~48 days, respectively) [28]. Even in the same region, the time effects of climate conditions on vegetation dynamics were also diverse. Kong et al. found that the mean time-lag of NDVI response to precipitation and temperature varied between 7.9–17.7 days and 6.2–25.3 days on the Chinese Loess Plateau, respectively [29]; whereas Zhao et al. found that the time-lag effect of drought on grass took place within 2–3 months, and the time cumulative effect occurred over longer time scales (5–10 months) [30]. In addition, spring/autumn NDVI exhibited more than 1 month lag with temperature/precipitation, but summer NDVI showed 1 month lag with precipitation but no lag with temperature on the Loess Plateau [31]. In summary, the response of vegetation growth to climate conditions was spatiotemporal heterogenous, and the time effects of vegetation–climate interactions in the large desert areas were still poorly understood.
Overall, monitoring vegetation variation and exploring their relationship with climate over the Silk Road Economic Belt will be important to ensure effective eco-environmental conservation and sustainable socioeconomic development. Nevertheless, the climatic constraint on vegetation dynamics in this dryland areas has not been intensively studied. Two fundamental questions remain: (i) How do the vegetation vary with climate conditions considering the time effects? (ii) To what extent do diverse climatic factors limit vegetation growth in different desert areas? Therefore, the objective of our study was to investigate the spatiotemporal characteristics of vegetation dynamics and quantify its effect by climatic conditions over the Silk Road Economic Belt. The results will enhance our understanding about the variation of eco-environment and its interaction with climate change over Silk Road Economic Belt, which are critically essential to these vulnerable dryland ecosystems.
2. Materials and Methods
2.1. Study Region
There are a lot of desert areas (the area associated with desert ecosystem) in the Silk Road Economic Belt, which are mainly distributed in the northwest China, Central Asia, Arabia, and North Africa. The distribution of these desert areas and the corresponding climate were derived from the global ecoregions and the world climate map, respectively. The global ecoregions were first produced by the World Wildlife Fund (https://www.worldwildlife.org/biomes, accessed on 24 February 2021) and further visualized by the National Earth System Science Data Centre of China (http://www.geodata.cn/data/datadetails.html?dataguid=208109344688128&docId=24616, in Chinese, accessed on 24 February 2021). In these global ecoregions, there are six desert ecosystems over the Silk Road Economic Belt: desert, semi-desert, desert semi-desert, desert shrub, desert steppe, and desert tundra. The world climate map was generated according to the Köppen–Geiger climate classification (http://koeppen-geiger.vu-wien.ac.at/shifts.htm, accessed on 24 February 2021), and the main climate types in the desert areas of Silk Road Economic Belt included hot arid, cold arid, and polar. Combining the global ecoregions and the world climate map, the whole study region was divided into eight subregions, including hot arid desert (HAdese), hot arid desert semi-desert (HAdesm), hot arid desert shrub (HAdesh), cold arid desert (CAdese), cold arid semi-desert (CAsmde), cold arid desert steppe (CAdest), polar desert steppe (POdest), and polar desert tundra (POdetu) (Figure 1). More information about the study region can be found in Table 1.
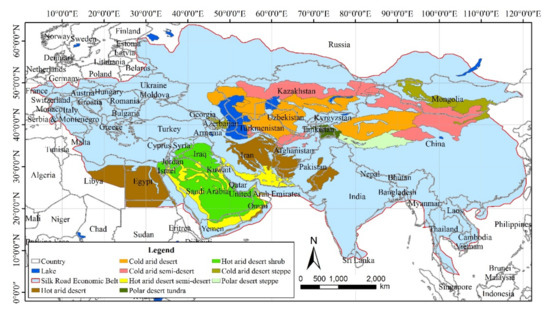
Figure 1.
Location of different desert areas over the Silk Road Economic Belt.

Table 1.
General characteristics of different desert areas over the Silk Road Economic Belt. MAT and MAP are mean annual air temperature and precipitation between 1982 and 2015, respectively.
2.2. Datasets
The vegetation dynamics from 1982 to 2015 was evaluated using the normalized difference vegetation index (NDVI), which was obtained from the Global Inventory Modeling and Mapping Studies group (GIMMS NDVI3g v1, https://ecocast.arc.nasa.gov/data/pub/gimms/, accessed on 24 February 2021). It was calculated from the Advanced Very High Resolution Radiometer (AVHRR) and has been comprehensively corrected, including radiometric calibration, atmospheric correction, cloud screening, solar zenith angle correction, and quality assessment [32]. The temporal and spatial resolution of this datasets were biweekly and 1/12 degree (8 km), respectively, and it has been widely used to analyze vegetation dynamics across lots of bioclimatic regions [33,34]. In order to match the resolution of climate data, the raw NDVI data were resampled to monthly temporal resolution and 0.25° spatial resolution. For temporal resampling, the raw data of two images in each month were averaged to get the monthly dataset. For spatial resampling, the raw data of nine grids with three rows and three columns were averaged to resample the 1/12 degree to 0.25°.
The monthly gridded air temperature (TEM), precipitation (PRE), surface solar radiation (SR), and total cloud cover (TCC) from 1982 to 2015 with a spatial resolution of 0.25° were got from the European Centre for Medium-Range Weather Forecasts (ERA5, https://cds.climate.copernicus.eu/cdsapp#!/search?type=dataset, accessed on 24 February 2021). Compared with ERA-Interim, the biases in ERA5 have been greatly reduced and are small in both the precipitation and the radiation [35]. The monthly gridded potential evapotranspiration (PET) between 1982 and 2015 with a spatial resolution of 0.25° was got from the Global Land Evaporation Amsterdam Model (GLEAM v3.3a, https://www.gleam.eu/, accessed on 24 February 2021). It was calculated by the Priestley and Taylor equation based on the latest observations of net radiation and air temperature and has been validated against measurements from 91 eddy covariance towers across a broad range of ecosystems [36,37].
2.3. Data Analysis
Missing values in all gridded data were interpolated by the surrounding pixels. Then, mean monthly values and the corresponding standard deviations of NDVI and climatic factors (air temperature, total cloud cover, surface solar radiation, precipitation, and potential evapotranspiration) were calculated based on the raw monthly data. Differences in all of them between different months were analyzed with a one-way analysis of variance.
To investigate the time-lag and time-accumulation effects of different climatic factors on vegetation dynamics, a simple linear regression model for each climatic factor was used (Equations (1)–(3)) [25]. Previous studies demonstrated that the time effects at monthly scale are mostly shorter than a quarter [23,26,38,39]; therefore, our study considered time-lag and time-accumulation effects with a maximum of three months.
where TEM is air temperature, SR is surface solar radiation, PRE is precipitation, t is the month series from January 1982 to December 2015, k and b are regression coefficients, i and n range from 0 to 3 (i.e., 0 represents no time effects, and 1–3 represents a 1 month to 3 months lag or accumulation for i and n, respectively). With different combinations of i and n, the time-lag and time-accumulation effects can be fully considered [25]. Though this study analyzed time effects of climatic factors within a quarter, the sum of i and n may reach six months when 3 month lag and 3 month accumulation are considered simultaneously. For each climatic factor, the lag month (i) and cumulation month (n) that have the highest coefficient of determination (R2) are taken as the best time-lag and time-accumulation effect for the vegetation response to this climatic factor.
To quantify the overall contribution of climate conditions on vegetation dynamics, a multiple linear regression model between NDVI and three climatic factors was developed (Equation (4)) [23,25]:
where TEM is air temperature, SR is surface solar radiation, PRE is precipitation, k1, k2, and k3 are standardized regression coefficients. Moreover, the climatic factors in this multiple linear regression are the adjusted time series with the best time effects identified.
In order to assess the climate constraints (temperature, cloudiness, and water) to vegetation growth, the simple linear function was used to scale the effect of each climatic factor between 0 and 1 depending on the threshold values at which vegetation growth occurs without restriction or ceased completely, respectively [5]. Mean monthly air temperatures between −5 and 5 °C were scaled linearly between 1 and 0, while lower than −5 °C or higher than 5 °C implies that vegetation cannot grow completely due to the low temperature limitation or can grow without any temperature limitation, respectively [4]. Limitation by solar radiation is set using monthly mean cloudiness data, and 1% increase in monthly mean cloudiness above the threshold (10%) was assumed to reduce 0.5% vegetation growth [5]. The ratio of precipitation to potential evapotranspiration (P/PET) was used to reveal water-limiting degree for vegetation growth, and mean monthly ratio between 0 and 0.75 are linearly scaled from 1 to 0, in which P/PET higher than 0.75 is assumed to have no water limitation for vegetation [5]. Finally, the three limiting factors are assigned to red (temperature), green (cloudiness), and blue (water) of a primary color display, respectively. The resulting figure presents colors ranging from black (no limits, i.e., all of the limitations by temperature, cloudiness and water were equal to 0) to white (all with maximum limit, i.e., all of the limitations by temperature, cloudiness, and water were equal to 1), in which primary colors represent the maximum limits of each climate factors, and their combining produce magenta (temperature and water), yellow (temperature and cloudiness), and cyan (water and cloudiness).
3. Results
3.1. Seasonal Variation of NDVI and Climatic Factors
The mean monthly NDVI during 1982–2015 showed a unimodal variation in most desert areas, with peak values appearing in different months (Figure 2). It was significantly higher between May and September in cold arid areas (desert steppe, desert, and semi-desert) than the corresponding values in other months (p < 0.05), and the maximum monthly NDVI was all higher than 0.17. In contrast, it was the highest in March in both the hot arid desert semi-desert area and the hot arid desert shrub area, and in September in the hot arid desert area. The maximum monthly NDVI in hot arid areas (desert semi-desert, desert shrub, and desert) was between 0.10 and 0.12. In the polar areas (desert steppe and desert tundra), the maximum monthly NDVI were 0.10 and 0.14 in the former and the latter, respectively. In the whole study region, most of the minimum NDVI appeared in winter and early spring (from December to April); nevertheless, it is interesting that both the hot arid desert semi-desert area and the hot arid desert shrub area had the lowest NDVI in August. In addition, the minimum monthly NDVI was between 0.08 and 0.10 in both cold arid areas and hot arid areas, and less than 0.06 in polar areas. Therefore, the mean monthly NDVI presented diverse seasonal variation patterns in different desert areas, indicating the complex response of vegetation dynamics to environmental conditions.
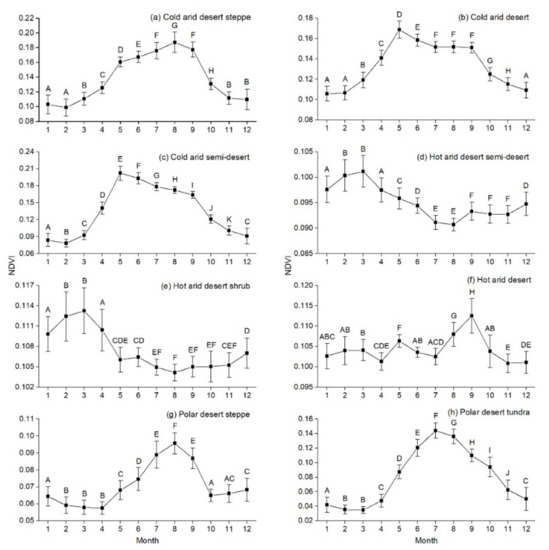
Figure 2.
Variation of mean monthly normalized difference vegetation index (NDVI) in different desert areas over the Silk Road Economic Belt between 1982 and 2015. Different uppercase letters indicate significant differences between different months at p < 0.05. (a–h) indicate different desert areas, respectively.
The mean monthly air temperature had the same variation patterns in all desert areas (Figure 3). During 1982–2015, the highest air temperature was concentrated in July, while it also often appeared in August in the hot arid desert shrub area, the polar desert steppe area, and the polar desert tundra area. In turn, the minimum air temperature was mainly distributed in January, following by December and February, respectively. However, the range of mean monthly air temperature was obviously different in varied desert areas, i.e., −15.8 to 27.7 °C in cold arid areas, 11.0 to 34.8 °C in hot arid areas, and −19.5 to 7.0 °C in polar areas, respectively, indicating the huge heterogenicity of heat conditions between different desert areas.
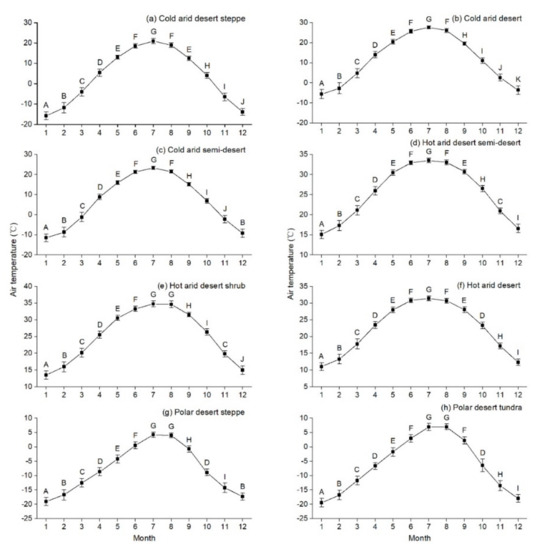
Figure 3.
Variation of mean monthly air temperature in different desert areas over the Silk Road Economic Belt between 1982 and 2015. Different uppercase letters indicate significant differences between different months at p < 0.05. (a–h) indicate different desert areas, respectively.
Total cloud cover showed diverse variation in different desert areas, and its standard deviation was very large in all months (Figure 4). In the cold arid desert steppe area, it increased continuously from January to June, decreased obviously from June to October, and had no distinct variation from October to December. Quite the opposite, it decreased firstly and then increased in the cold arid desert area, the cold arid semi-desert area, and the polar desert tundra area. Hot arid areas had the similar patterns, i.e., with high values between January and April, decreased in May and June, with low values between July and September, and increased constantly from October to December. In the polar desert steppe area, it was relatively high and stable in spring and summer, decreased gradually in autumn, and increased in winter. Moreover, mean monthly total cloud cover was the highest in polar areas (0.38–0.77), followed by cold arid areas (0.24–0.59) and hot arid areas (0.06–0.27).
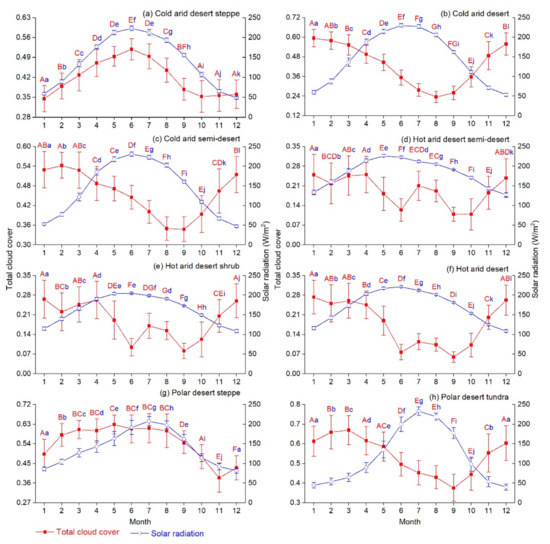
Figure 4.
Variation of mean monthly total cloud cover and solar radiation in different desert areas over the Silk Road Economic Belt between 1982 and 2015. Different red uppercase letters indicate significant differences in total cloud cover between different months at p < 0.05, and different blue lowercase letters indicate significant differences in solar radiation between different months at p < 0.05. (a–h) indicate different desert areas, respectively.
Due to coeffects of the earth revolution, the cloud reflection and absorption, and the ground reflection, the surface solar radiation presented similar variation patterns with varied range in different desert areas (Figure 4). The maximum solar radiation mainly appeared in June over most cold arid areas and hot arid areas, except the hot arid desert semi-desert area. In polar areas, the highest solar radiation was concentrated on July. Though the maximum monthly solar radiation was close to each other in all desert areas, the minimum values were remarkably varied, i.e., approximately 50 W/m2 in cold arid areas and the polar desert tundra area, 85 W/m2 in the polar desert steppe area, and more than 110 W/m2 in hot arid areas, respectively. Moreover, the comparison between air temperature and surface solar radiation revealed that the variation of the former was about 1 month lag behind the latter.
The comparation between mean monthly precipitation and potential evapotranspiration indicated the seasonal variation of water budget in different desert areas (Figure 5). In cold arid areas, the mean monthly precipitation was greater than the corresponding potential evapotranspiration during November and February, and the reverse between April and September. In hot arid areas, the former was all lower than the latter, and water surplus (i.e., precipitation > potential evapotranspiration) only appeared from November to March in several years. In the polar desert steppe area, the former was slightly higher than the latter in all months, but water deficit (i.e., precipitation < potential evapotranspiration) could happen from March to November in approximately 20% years. In the polar desert tundra area, the former corresponded closely to the latter in July and August and was greater than the latter in other months. At the annual scale, the total precipitation was evidently lower than the corresponding potential evapotranspiration in both cold arid areas and hot arid areas (with 150–259 mm and 320–415 mm water deficit every year for the former and the latter, respectively), while it was reverse in polar areas (with 106–299 mm water surplus every year), indicating water constraint in most desert areas.
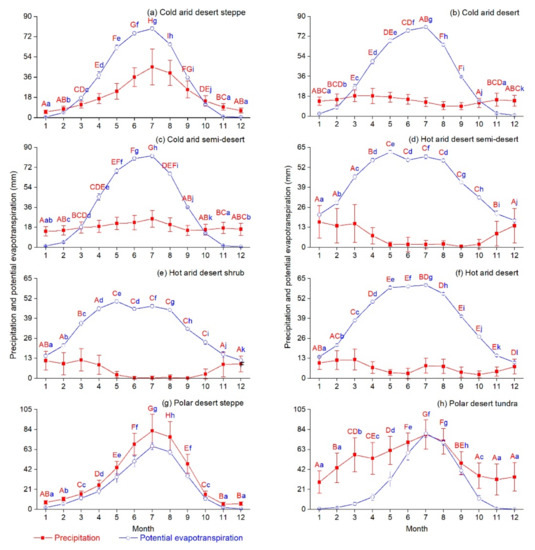
Figure 5.
Variation of mean monthly precipitation and potential evapotranspiration in different desert areas over the Silk Road Economic Belt between 1982 and 2015. Different red uppercase letters indicate significant differences in precipitation between different months at p < 0.05, and different blue lowercase letters indicate significant differences in potential evapotranspiration between different months at p < 0.05. (a–h) indicate different desert areas, respectively.
3.2. Time Effects of Climatic Factors on NDVI
According to the coefficient of determination in most desert areas, the scenario considering time-lag and time-accumulation effects was better than that without considering time effects (Figure 6 and Figure 7). In cold arid areas, air temperature exhibited no obvious time-lag or time-accumulation effect on NDVI, and solar radiation presented 1–2 month accumulation effect. Moreover, the correlation between NDVI and precipitation was relatively low in cold arid areas, with 1–2 month accumulation effect in the cold arid desert steppe area and the cold arid semi-desert area, and 2 month lag and 3 month accumulation effect in the cold arid desert area, respectively. In the hot arid desert semi-desert area and the hot arid desert shrub area, the NDVI showed negative correlation with both the air temperature and the solar radiation, indicating that high temperature and strong radiation may increase evapotranspiration and, thus, drought, further inhibiting vegetation growth. Precipitation showed no remarkable time-lag, but a 3 month accumulation effect on NDVI in these two desert areas. It is noteworthy that NDVI had very low correlation with all three climatic factors in the hot arid desert area, implying complex interactions between vegetation dynamics and environmental conditions here. In polar areas, both air temperature and solar radiation exhibited a 1–2 month accumulation effect on NDVI, while precipitation emerged 1 month lag and 3 month accumulation effect in the polar desert steppe area and the polar desert tundra area, respectively. In summary, the climatic conditions have obvious time effects on vegetation dynamics over the Silk Road Economic Belt, and the time-accumulation effect was more remarkable than the time-lag effect.
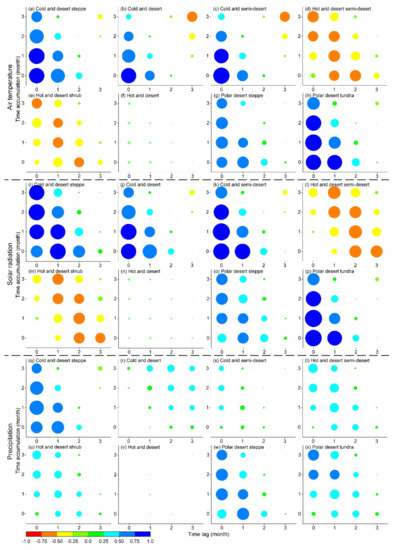
Figure 6.
Coefficient of determination in simple linear regression models between the NDVI and each climatic factor considering the time-lag and time-accumulation effect in different desert areas. (a–x) indicate different desert areas with the time effects of air temperature, solar radiation, and precipitation, respectively.
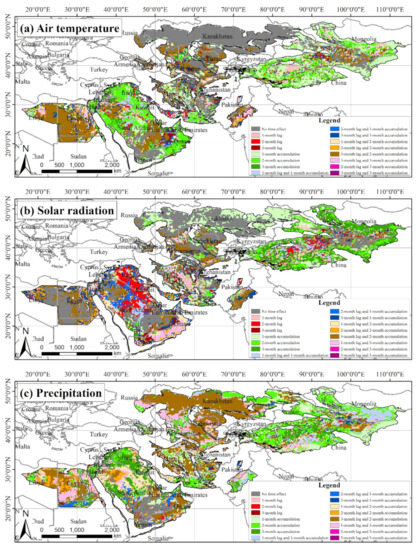
Figure 7.
Spatial distribution of time-lag and time-accumulation effect of each climatic factor identified by the maximum coefficient of determination in simple linear regression models. (a–c) indicate the time effects of air temperature, solar radiation, and precipitation, respectively.
The multiple linear regression model between NDVI and all three climatic factors (temperature, solar radiation, and precipitation) showed that, compared to the scenario without considering time effects, considering time effects could increase the explanatory power of vegetation dynamics in all desert areas (Table 2). On average, climatic factors explained 86.8, 53.3, and 77.6% of the NDVI variation for the cold arid areas, hot arid areas, and polar areas, respectively, considering both time-lag and time-accumulation effects. Nevertheless, when no time effects were considered, 83.4, 42.5, and 71.7% of the variation was explained, respectively. Thus, the explanatory power with time effects increased by 3.4, 10.8, and 5.9% for the cold arid areas, hot arid areas, and polar areas (i.e., relative increase 4.1, 25.4, and 8.2%), respectively. In addition, more than 70% of the NDVI variation could be explained by the climatic factors when both time-lag and time-accumulation effects were considered in most desert areas. However, for the hot arid desert area, only 25.1% of its variation could be explained.
Table 2.
Multiple linear regression models between the NDVI and all climatic factors in different desert areas without considering and considering the time effect. TEMi,j, SRi,j, and PREi,j are air temperature, surface solar radiation, and precipitation with i month lag and j month accumulation effect, respectively. ** indicate statistical significance at p < 0.05.
3.3. Constraint of NDVI by Climatic Factors
At the annual scale, NDVI in cold arid areas was primarily limited by the water condition (precipitation, >50.2%), following by the temperature condition (air temperature, 23.0–40.1%), and the constraints of cloudiness factor (total cloud cover) was the lowest (<17.9%, Figure 8). In hot arid areas, the water condition was the main limited factor on vegetation dynamics (78.8–81.4%), while the influences of both the cloudiness and the temperature were very little (<5.4 and <0.8%, respectively). In polar areas, NDVI was principally controlled by the temperature condition (>67.5%), while the water condition was the secondary limiting factor in the polar desert tundra area (31.9%), and the cloudiness presented almost the same limitation in the polar desert steppe area and the polar desert tundra area (~22.2%).
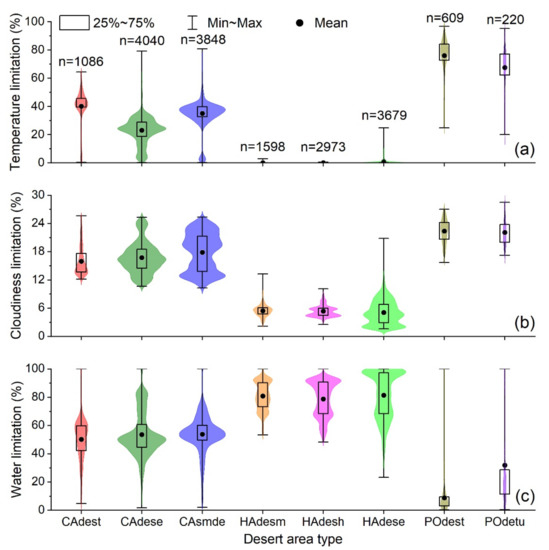
Figure 8.
The relative importance of climatic limitation on vegetation dynamics in different desert areas over the Silk Road Economic Belt between 1982 and 2015. CAdest—cold arid desert steppe, CAdese—cold arid desert, CAsmde—cold arid semi-desert, HAdesm—hot arid desert semi-desert, HAdesh—hot arid desert shrub, HAdese—hot arid desert, POdest—polar desert steppe, POdetu—polar desert tundra. n—the number of all pixels in different desert areas. (a–c) indicate the limitation of vegetation dynamics by temperature, cloudiness, and water, respectively.
For different seasons, vegetation dynamics in spring were primarily limited by the water, temperature, and cloudiness factors over 89.6, 9.4, and 1.0% of the study region, respectively. Both the northern Qinghai-Tibet plateau and Tajikistan were dominantly restricted by the temperature conditions, while most other areas were constrained by the water conditions (Figure 9 and Figure 10). In summer, the limitation area mainly by the water, temperature, and cloudiness factors accounted for 93.9, 2.1, and 4.0% of the study region, respectively. The restraint degree of the temperature conditions decreased, but the corresponding value of the cloudiness increased in the northern Qinghai-Tibet plateau; while the water constraint increased in the high-latitude areas. In autumn, the percentages of limitation area by different climatic factors were similar as those in spring, but the temperature limitation in the high latitude areas was stronger than that in spring. In winter, the area dominantly constrained by the water, temperature, and cloudiness factors was 41.9, 51.8, and 6.3%, respectively. The areas con-constrained by the water and temperature conditions spread rapidly, including Mongolia, north of China, Kazakhstan, etc. In general, the hot arid areas were always limited by the water condition in different seasons, the polar areas were always constrained by the temperature condition, and the cold arid areas were simultaneously restricted by the water and temperature conditions with different limitation degree in varied seasons.
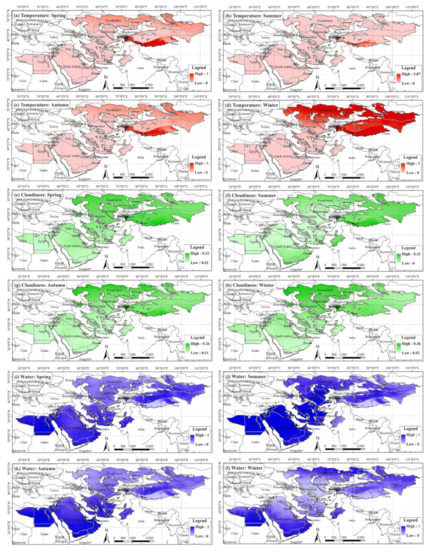
Figure 9.
Distribution of single climatic constraint on vegetation dynamics in different seasons over the Silk Road Economic Belt between 1982 and 2015. (a–l) indicate the single constraint of temperature, cloudiness, and water on vegetation dynamics in spring, summer, autumn, and winter, respectively.
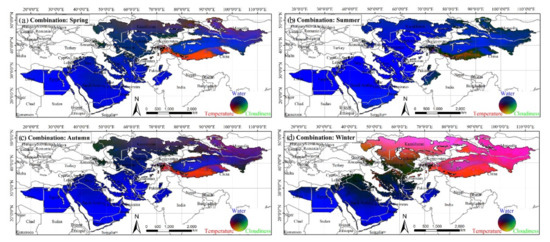
Figure 10.
Distribution of combined climatic constraint on vegetation dynamics in different seasons over the Silk Road Economic Belt between 1982 and 2015. Red, green, and blue represent the maximum limits of temperature, cloudiness, and water, respectively, and their combining produce magenta (temperature and water), yellow (temperature and cloudiness), and cyan (water and cloudiness). (a–d) indicate the combined constraint of temperature, cloudiness, and water on vegetation dynamics in spring, summer, autumn, and winter, respectively.
4. Discussion
4.1. Heterogeneous Vegetation Dynamics in Desert Areas
Our study indicated heterogeneous seasonal dynamics of vegetation in different desert areas over the Silk Road Economic Belt, i.e., with high NDVI in early spring or early autumn over hot arid areas, in late spring and summer over cold arid areas, and in summer over polar areas, respectively (Figure 2). This result was generally consistent with previous studies, which demonstrated that the vegetation seasonality (e.g., from dormancy to peak growth and back) does not always align with climate cycle within the calendar year (e.g., from January to December). For hot arid areas, shrubs in western Saudi Arabia reached their maximum vegetative activity at the beginning of the rainy season (April), while perennial herbs attained their maximum a few weeks after the peak rainfall [40]. Both the spectral ground measurements and the satellite observations further revealed that the highest NDVI of perennials, annuals, and biogenic crusts mainly appeared in March in the Negev Desert of Israel, due to the beginning of rainy season [41]. For cold arid areas, the peak timing of NDVI concentrated around May in south Kazakhstan, and from July to August in Mongolia and north China [42,43]. For polar areas, the maximum leaf area index was mostly appeared in August throughout the entire Qinghai-Tibetan Plateau [44]. However, it should be noted that most of the monthly mean NDVI was less than 0.2 in our study region, which was often removed in the global scale researches [25,26], and will increase the uncertainty of identified vegetation dynamics. In addition, diverse remote sensing datasets may get different vegetation growth characteristics [32,33]. Thus, further field investigation is needed in order to better understand vegetation dynamics over these areas.
4.2. Asymmetric Vegetation Response to Climate Conditions
The asymmetric response of vegetation dynamics to environmental conditions always varied obviously among different climatic factors, vegetation types, geographic locations, and so on [23,27,28]. We found that most climate factors showed obvious time effects on NDVI in desert areas over the Silk Road Economic Belt, and the time-accumulation effect was generally more remarkable than the time-lag effect (Figure 6). Previous studies revealed that vegetation growth has a 1–3 months lag response to precipitation [45,46], and the winter precipitation could be an important water source for plant growing in the following warm season [47]. The average lagged times of the maximum and minimum temperature on vegetation dynamics all over the world were 1.68 ± 1.05 months and 1.45 ± 0.96 months, respectively [26]. In addition, our study showed that both the air temperature and the solar radiation exhibited a negative correlation with NDVI in the hot arid desert semi-desert area and the hot arid desert shrub area, because the increasing temperature will accelerate water loss, exacerbate drought, and further inhibit vegetation growth [14,26]. It is essential to note that although lots of previous studies limited the time effects of climate conditions on vegetation growth within 3 months, Wen et al. showed that vegetation may respond to climate warming with near 12 month delays [48]; therefore, more detailed research considering longer time effects may be essential. Moreover, we also revealed that the explanatory power of vegetation dynamics in different desert areas relatively will increase by 4.1–25.4%, considering both time-lag and time-accumulation effects (Table 2). This was consistent with Wu et al. and Ding et al., with 11% in the former and 15–19% in the latter [23,25].
4.3. Remarkable Climatic Constraints to Vegetation Growth
Our study showed that the main climatic constraints to vegetation growth were the water condition in hot arid areas (>78%) and the temperature condition in polar areas (>67%), respectively; while cold arid areas were simultaneously limited by the water and temperature conditions (>76% in total, Figure 8). Lots of previous studies demonstrated that water is the main limiting factor for dryland ecosystems, because drought will influence the stomatal conductance, transpiration, photosynthesis, and so on [49,50]; especially, summer droughts may play a key role in determining annual net primary productivity (NPP) variation due to the highest proportion of summer NPP (70%) [43]. From the aspect of constrained area, we found that the vegetation dynamics in more than 93% of the study region was primarily limited by the water and temperature conditions in different seasons (Figure 10). This was generally consistent with the results at global scale, i.e., more than 99% of global shrubland and desert was limited by the water availability and temperature [4], and the grassland in Asia is most sensitive to water availability, while alpine regions present strong sensitivity to temperature [6]. Moreover, though total cloud cover was higher in some months, especially in the polar areas, its constraint on vegetation dynamics was evidently lower than the water and temperature. It is noteworthy that this study only concerned the constraints of climate factors on vegetation growth; whereas lots of other environmental factors, such as nutrient availability [51], salinity [52], or biological constraints [53], can also limit plant growing. Therefore, the integration research on the vegetation response to fragile environments is essential over the Silk Road Economic Belt.
5. Conclusions
This research aims to investigate the seasonal pattern of vegetation dynamics and its constraints by climatic conditions in different desert areas over the Silk Road Economic Belt. The mean monthly NDVI during 1982–2015 showed a unimodal variation in most desert areas, with high values in early spring or early autumn over hot arid areas, in late spring and summer over cold arid areas, and in summer over polar areas, respectively. Solar radiation and precipitation in cold arid areas presented obvious time-lag or time-accumulation effects on NDVI, while precipitation in most hot arid areas showed no remarkable time-lag but 3 month accumulation effect, and all three climate factors in polar areas exhibited 1–3 month accumulation effect. The considering of time effects will increase the explanatory power of climatic conditions for vegetation dynamics by 3.4–10.8%. The water and temperature conditions primarily limited vegetation growth over 41.9–93.9% and 2.1–51.8% of the whole study region in different seasons, respectively. The main climatic constraints to vegetation at the annual scale were the water condition in hot arid areas and the temperature condition in polar areas, while cold arid areas were simultaneously limited by the water and temperature conditions. These results provide a detailed understanding of not only which desert areas are sensitive to climate conditions, but also which factor is the primary limitation on vegetation growth and how to relieve these constraints. All of these are extremely important for the eco-environmental conservation and socioeconomic development over the Silk Road Economic Belt. However, the response of vegetation dynamics to sub-optimum environments are always varied remarkably at different temporal and spatial scales; therefore, more studies about the inherent mechanism based on field investigations and laboratory experiments are essential. In addition, how to adapt to the changing climate and enhancing human activities over the Silk Road Economic Belt is another key question for future research.
Author Contributions
Conceptualization, Y.-J.M. and X.-Y.L.; methodology, Y.-J.M.; software, F.-Z.S.; validation, Y.-J.M.; formal analysis, Y.-J.M.; investigation, Y.-J.M.; resources, F.-Z.S.; data curation, F.-Z.S.; writing—original draft preparation, Y.-J.M.; writing—review and editing, X.H. and X.-Y.L.; visualization, Y.-J.M.; supervision, X.-Y.L.; project administration, X.H.; funding acquisition, Y.-J.M., X.-Y.L. and X.H. All authors have read and agreed to the published version of the manuscript.
Funding
This research was funded by the National Natural Science Foundation of China (grant number: 41771026, 41730854), and the National Key Research and Development Program of China (grant number: 2016YFE0203400-01).
Institutional Review Board Statement
Not applicable.
Informed Consent Statement
Not applicable.
Data Availability Statement
Primary data used in this paper are available from the authors upon request (mayujun3@mail.sysu.edu.cn).
Conflicts of Interest
The authors declare no conflict of interest.
References
- Wu, D.D.; Xie, X.H.; Tong, J.X.; Meng, S.S.; Wang, Y.B. Sensitivity of vegetation growth to precipitation in a typical afforestation area in the Loess Plateau: Plant-Water Coupled Modelling. Ecol. Model. 2020, 430, 109128. [Google Scholar] [CrossRef]
- Marchin, R.M.; McHugh, I.; Simpson, R.R.; Ingram, L.J.; Balas, D.S.; Evans, B.J.; Adams, M.A. Productivity of an Australian mountain grassland is limited by temperature and dryness despite long growing seasons. Agric. For. Meteorol. 2018, 256, 116–124. [Google Scholar] [CrossRef]
- Han, J.Y.; Zhang, L.M.; Li, S.G.; Wen, X.F.; Li, Q.K.; Wang, H.M. Effects of sky conditions on net ecosystem productivity of a subtropical coniferous plantation vary from half-hourly to daily timescales. Sci. Total Environ. 2019, 651, 3002–3014. [Google Scholar] [CrossRef]
- Churkina, G.; Running, S.W. Contrasting climatic controls on the estimated productivity of global terrestrial biomes. Ecosystems 1998, 1, 206–215. [Google Scholar] [CrossRef]
- Nemani, R.R.; Keeling, C.D.; Hashimoto, H.; Jolly, W.M.; Piper, S.C.; Tucker, C.J.; Myneni, R.B.; Running, S.W. Climate-driven increases in global terrestrial net primary production from 1982 to 1999. Science 2003, 300, 1560–1563. [Google Scholar] [CrossRef] [PubMed]
- Seddon, A.W.R.; Macias-Fauria, M.; Long, P.R.; Benz, D.; Willis, K.J. Sensitivity of global terrestrial ecosystems to climate variability. Nature 2016, 531, 229–232. [Google Scholar] [CrossRef]
- Harsch, M.A.; HilleRisLambers, J. Climate warming and seasonal precipitation change interact to limit species distribution shifts across western North America. PLoS ONE 2016, 11, e0159184. [Google Scholar] [CrossRef]
- Potter, C.; Klooster, S.; de Carvalho, C.R.; Genovese, V.B.; Torregrosa, A.; Dungan, J.; Bobo, M.; Coughlan, J. Modeling seasonal and interannual variability in ecosystem carbon cycling for the Brazilian Amazon region. J. Geophys. Res. 2001, 106, 10423–10446. [Google Scholar] [CrossRef]
- Li, P.Y.; Qian, H.; Howard, K.W.F.; Wu, J.H. Building a new and sustainable “Silk Road economic belt”. Environ. Earth Sci. 2015, 74, 7267–7270. [Google Scholar] [CrossRef]
- Shi, K.F.; Yu, B.L.; Huang, C.; Wu, J.P.; Sun, X.F. Exploring spatiotemporal patterns of electric power consumption in countries along the Belt and Road. Energy 2018, 150, 847–859. [Google Scholar] [CrossRef]
- Siegfried, T.; Bernauer, T.; Guiennet, R.; Sellars, S.; Robertson, A.W.; Mankin, J.; Bauer-Gottwein, P.; Yakovlev, A. Will climate change exacerbate water stress in Central Asia? Clim. Chang. 2012, 112, 881–899. [Google Scholar] [CrossRef]
- Hou, W.; Gao, J.; Wu, S.; Dai, E. Interannual variations in growing-season NDVI and its correlation with climate variables in the southwestern karst region of China. Remote Sens. 2015, 7, 11105–11124. [Google Scholar] [CrossRef]
- Wen, Z.F.; Wu, S.J.; Chen, J.L.; Lü, M.Q. NDVI indicated long-term interannual changes in vegetation activities and their responses to climatic and anthropogenic factors in the Three Gorges Reservoir Region, China. Sci. Total Environ. 2017, 574, 947–959. [Google Scholar] [CrossRef]
- Qi, X.Z.; Jia, J.H.; Liu, H.Y.; Lin, Z.S. Relative importance of climate change and human activities for vegetation changes on China’s silk road economic belt over multiple timescales. Catena 2019, 180, 224–237. [Google Scholar] [CrossRef]
- Ma, Y.J.; Shi, F.Z.; Hu, X.; Li, X.Y. Threshold vegetation greenness under water balance in different desert areas over the Silk Road Economic Belt. Remote Sens. 2020, 12, 2452. [Google Scholar] [CrossRef]
- Lioubimtseva, E.; Henebry, G.M. Climate and environmental change in arid Central Asia: Impacts, vulnerability, and adaptations. J. Arid Environ. 2009, 73, 963–977. [Google Scholar] [CrossRef]
- Sorg, A.; Bolch, T.; Stoffel, M.; Solomina, O.; Beniston, M. Climate change impacts on glaciers and runoff in Tien Shan (Central Asia). Nat. Clim. Chang. 2012, 2, 725–731. [Google Scholar] [CrossRef]
- Han, T.T.; Chen, H.P.; Hao, X.; Wang, H.J. Projected changes in temperature and precipitation extremes over the Silk Road Economic Belt regions by the Coupled Model Intercomparison Project Phase 5 multi-model ensembles. Int. J. Climatol. 2018, 38, 4077–4091. [Google Scholar] [CrossRef]
- Hu, Z.Y.; Zhou, Q.M.; Chen, X.; Qian, C.; Wang, S.S.; Li, J.F. Variations and changes of annual precipitation in Central Asia over the last century. Int. J. Climatol. 2017, 37, 157–170. [Google Scholar] [CrossRef]
- Haag, I.; Jones, P.D.; Samimi, C. Central Asia’s changing climate: How temperature and precipitation have changed across time, space, and altitude. Climate 2019, 7, 123. [Google Scholar] [CrossRef]
- Xin, J.Y.; Gong, C.S.; Wang, S.G.; Wang, Y.S. Aerosol direct radiative forcing in desert and semi-desert regions of northwestern China. Atmos. Res. 2016, 171, 56–65. [Google Scholar] [CrossRef]
- De Beurs, K.M.; Henebry, G.M.; Owsley, B.C.; Sokolik, I. Using multiple remote sensing perspectives to identify and attribute land surface dynamics in Central Asia 2001–2013. Remote Sens. Environ. 2015, 170, 48–61. [Google Scholar] [CrossRef]
- Wu, D.H.; Zhao, X.; Liang, S.L.; Zhou, T.; Huang, K.C.; Tang, B.J.; Zhao, W.Q. Time-lag effects of global vegetation responses to climate change. Glob. Chang. Biol. 2015, 21, 3520–3531. [Google Scholar] [CrossRef] [PubMed]
- Vicente-Serrano, S.M.; Gouveia, C.; Camarero, J.J.; Beguería, S.; Trigo, R.; López-Moreno, J.I.; Azorín-Molina, C.; Pasho, E.; Lorenzo-Lacruz, J.; Revuelto, J.; et al. Response of vegetation to drought time-scales across global land biomes. Proc. Natl. Acad. Sci. USA 2013, 110, 52–57. [Google Scholar] [CrossRef] [PubMed]
- Ding, Y.X.; Li, Z.; Peng, S.Z. Global analysis of time-lag and -accumulation effects of climate on vegetation growth. Int. J. Appl. Earth Obs. 2020, 92, 102179. [Google Scholar] [CrossRef]
- Wen, Y.Y.; Liu, X.P.; Yang, J.; Lin, K.; Du, G.M. NDVI indicated inter-seasonal non-uniform time-lag responses of terrestrial vegetation growth to daily maximum and minimum temperature. Glob. Planet. Chang. 2019, 177, 27–38. [Google Scholar] [CrossRef]
- Bunting, E.L.; Munson, S.M.; Villarreal, M.L. Climate legacy and lag effects on dryland plant communities in the southwestern U.S. Ecol. Indic. 2017, 74, 216–229. [Google Scholar] [CrossRef]
- Hua, L.; Wang, H.D.; Sui, H.G.; Wardlow, B.; Hayes, M.J.; Wang, J.X. Mapping the spatial-temporal dynamics of vegetation response lag to drought in a semi-arid region. Remote Sens. 2019, 11, 1873. [Google Scholar] [CrossRef]
- Kong, D.X.; Miao, C.Y.; Wu, J.W.; Zheng, H.Y.; Wu, S.L. Time lag of vegetation growth on the Loess Plateau in response to climate factors: Estimation, distribution, and influence. Sci. Total Environ. 2020, 744, 140726. [Google Scholar] [CrossRef] [PubMed]
- Zhao, A.Z.; Yu, Q.Y.; Feng, L.L.; Zhang, A.B.; Pei, T. Evaluating the cumulative and time-lag effects of drought on grassland vegetation: A case study in the Chinese Loess Plateau. J. Environ. Manag. 2020, 261, 110214. [Google Scholar] [CrossRef]
- Zhao, J.; Huang, S.Z.; Huang, Q.; Wang, H.; Leng, G.Y.; Fang, W. Time-lagged response of vegetation dynamics to climatic and teleconnection factors. Catena 2020, 189, 104474. [Google Scholar] [CrossRef]
- Tucker, C.J.; Pinzon, J.E.; Brown, M.E.; Slayback, D.A.; Pak, E.W.; Mahoney, R.; Vermote, E.F.; El Saleous, N. An extended AVHRR 8-km NDVI dataset compatible with MODIS and SPOT vegetation NDVI data. Int. J. Remote Sens. 2005, 26, 4485–4498. [Google Scholar] [CrossRef]
- Alcaraz-Segura, D.; Chuvieco, E.; Epstein, H.E.; Kasischke, E.S.; Trishchenko, A. Debating the greening vs. browning of the North American boreal forest: Differences between satellite datasets. Glob. Chang. Biol. 2010, 16, 760–770. [Google Scholar] [CrossRef]
- Guay, K.C.; Beck, P.S.A.; Berner, L.T.; Goetz, S.J.; Baccini, A.; Buermann, W. Vegetation productivity patterns at high northern latitudes: A multi-sensor satellite data assessment. Glob. Chang. Biol. 2014, 20, 3147–3158. [Google Scholar] [CrossRef]
- Betts, A.K.; Chan, D.Z.; Desjardins, R.L. Near-surface biases in ERA5 over the Canadian prairies. Front. Environ. Sci. 2019, 7, 129. [Google Scholar] [CrossRef]
- Miralles, D.G.; Holmes, T.R.H.; de Jeu, R.A.M.; Gash, J.H.; Meesters, A.G.C.A.; Dolman, A.J. Global land-surface evaporation estimated from satellite-based observations. Hydrol. Earth Syst. Sci. 2011, 15, 453–469. [Google Scholar] [CrossRef]
- Martens, B.; Miralles, D.G.; Lievens, H.; van der Schalie, R.; de Jeu, R.A.M.; Fernández-Prieto, D.; Beck, H.E.; Dorigo, W.A.; Verhoest, N.E.C. GLEAM v3: Satellite-based land evaporation and root-zone soil moisture. Geosci. Model Dev. 2017, 10, 1903–1925. [Google Scholar] [CrossRef]
- Rundquist, B.C.; Harrington, J.A. The effects of climatic factors on vegetation dynamics of tallgrass and shortgrass cover. GeoCarto Int. 2000, 15, 33–38. [Google Scholar] [CrossRef]
- Anderson, L.O.; Malhi, Y.; Aragão, L.E.O.C.; Ladle, R.; Arai, E.; Barbier, N.; Phillips, O. Remote sensing detection of droughts in Amazonian forest canopies. New Phytol. 2010, 187, 733–750. [Google Scholar] [CrossRef] [PubMed]
- El-Ghani, M.M.A. Phenology of ten common plant species in western Saudi Arabia. J. Arid Environ. 1997, 35, 673–683. [Google Scholar] [CrossRef]
- Schmidt, H.; Karnieli, A. Remote sensing of the seasonal variability of vegetation in a semi-arid environment. J. Arid Environ. 2000, 45, 43–59. [Google Scholar] [CrossRef]
- Ye, W.T.; van Dijk, A.I.J.M.; Huete, A.; Yebra, M. Global trends in vegetation seasonality in the GIMMS NDVI3g and their robustness. Int. J. Appl. Earth Obs. 2021, 94, 102238. [Google Scholar] [CrossRef]
- Bao, G.; Chen, J.Q.; Chopping, M.; Bao, Y.H.; Bayarsaikhan, S.; Dorjsuren, A.; Tuya, A.; Jirigala, B.; Qin, Z.H. Dynamics of net primary productivity on the Mongolian Plateau: Joint regulations of phenology and drought. Int. J. Appl. Earth Obs. 2019, 81, 85–97. [Google Scholar] [CrossRef]
- Che, M.L.; Chen, B.Z.; Innes, J.L.; Wang, G.Y.; Dou, X.M.; Zhou, T.M.; Zhang, H.F.; Yan, J.W.; Xu, G.; Zhao, H.W. Spatial and temporal variations in the end date of the vegetation growing season throughout the Qinghai-Tibetan Plateau from 1982 to 2011. Agric. For. Meteorol. 2014, 189, 81–90. [Google Scholar] [CrossRef]
- Gessner, U.; Naeimi, V.; Klein, I.; Kuenzer, C.; Klein, D.; Dech, S. The relationship between precipitation anomalies and satellite-derived vegetation activity in Central Asia. Glob. Planet. Chang. 2013, 110, 74–87. [Google Scholar] [CrossRef]
- Chen, Z.F.; Wang, W.G.; Fu, J.Y. Vegetation response to precipitation anomalies under different climatic and biogeographical conditions in China. Sci. Rep. 2020, 10, 830. [Google Scholar] [CrossRef]
- Nagler, P.L.; Glenn, E.P.; Kim, H.; Emmerich, W.; Scott, R.L.; Huxman, T.E.; Huete, A.R. Relationship between evapotranspiration and precipitation pulses in a semiarid rangeland estimated by moisture flux towers and MODIS vegetation indices. J. Arid Environ. 2007, 70, 443–462. [Google Scholar] [CrossRef]
- Wen, Y.Y.; Liu, X.P.; Pei, F.S.; Li, X.; Du, G.M. Non-uniform time-lag effects of terrestrial vegetation responses to asymmetric warming. Agric. For. Meteorol. 2018, 252, 130–143. [Google Scholar] [CrossRef]
- Naithani, K.J.; Ewers, B.E.; Pendall, E. Sap flux-scaled transpiration and stomatal conductance response to soil and atmospheric drought in a semi-arid sagebrush ecosystem. J. Hydrol. 2012, 464, 176–185. [Google Scholar] [CrossRef]
- Li, Z.; Chen, Y.N.; Zhang, Q.F.; Li, Y. Spatial patterns of vegetation carbon sinks and sources under water constraint in Central Asia. J. Hydrol. 2020, 590, 125355. [Google Scholar] [CrossRef]
- Cui, Y.X.; Fang, L.C.; Guo, X.B.; Han, F.; Ju, W.L.; Ye, L.P.; Wang, X.; Tan, W.F.; Zhang, X.C. Natural grassland as the optimal pattern of vegetation restoration in arid and semi-arid regions: Evidence from nutrient limitation of soil microbes. Sci. Total Environ. 2019, 648, 388–397. [Google Scholar] [CrossRef] [PubMed]
- Baeza, K.; Lopez-Hoffman, L.; Glenn, E.P.; Flessa, K.; Garcia-Hernandez, J. Salinity limits of vegetation in Cienega de Santa Clara, an oligotrophic marsh in the delta of the Colorado River, Mexico: Implications for an increase in salinity. Ecol. Eng. 2013, 59, 157–166. [Google Scholar] [CrossRef]
- Marasco, A.; Iuorio, A.; Cartenì, F.; Bonanomi, G.; Giannino, F.; Mazzoleni, S. Water limitation and negative plant-soil feedback explain vegetation patterns along rainfall gradient. Procedia Environ. Sci. 2013, 19, 139–147. [Google Scholar] [CrossRef][Green Version]


Publisher’s Note: MDPI stays neutral with regard to jurisdictional claims in published maps and institutional affiliations. |
© 2021 by the authors. Licensee MDPI, Basel, Switzerland. This article is an open access article distributed under the terms and conditions of the Creative Commons Attribution (CC BY) license (http://creativecommons.org/licenses/by/4.0/).