Abstract
Accurate quantification of the spatial variation of canopy size is crucial for vineyard management in the context of Precision Viticulture. Biophysical parameters associated with canopy size, such as Leaf Area Index (LAI), can be estimated from Vegetation Indices (VI) such as the Normalized Difference Vegetation Index (NDVI), but in Vertical-Shoot-Positioned (VSP) vineyards, common satellite, or aerial imagery with moderate-resolution capture information at nadir of pixels whose values are a mix of canopy, sunlit soil, and shaded soil fractions and their respective spectral signatures. VI values for each fraction are considerably different. On a VSP vineyard, the illumination direction for each specific row orientation depends on the relative position of sun and earth. Respective proportions of shaded and sunlit soil fractions change as a function of solar elevation and azimuth, but canopy fraction is independent of these variations. The focus of this study is the interaction of illumination direction with canopy orientation, and the corresponding effect on integrated NDVI. The results confirm that factors that intervene in determining the direction of illumination on a VSP will alter the integrated NDVI value. Shading induced considerable changes in the NDVI proportions affecting the final integrated NDVI value. However, the effect of shading decreases as the row orientation approaches the solar path. Therefore, models of biophysical parameters using moderate-resolution imagery should consider corrections for variations caused by factors affecting the angle of illumination to provide more general solutions that may enable canopy data to be obtained from mixed, integrated vine NDVI.
1. Introduction
Precision viticulture (PV) is commonly applied to optimize vineyard performance in terms of grape yield and quality. In this context, quantitative knowledge of canopy size is essential for efficient vineyard management, and PV applications seeking to estimate it commonly use canopy vigour maps, i.e., as expressed by Leaf Area (LA) per unit (such as plant or meter of cordon), Leaf Area Index (LAI) or by other canopy parameters (vegetation fraction and biomass) as a proxy. Mapping spatial variability of such vineyard characteristics efficiently therefore requires Remote Sensing (RS) data from satellite, aircraft, or drone platforms. In the particular case of Vertical Shoot Positioned (VSP) canopies, today the most widespread trellis system in modern vineyards in Argentina (https://www.argentina.gob.ar (accessed on 14 June 2020), a large proportion of soil (bare or with cover crops) is exposed from the inter-row space to nadir-viewing RS. At recommended spatial resolutions, similar to plant or row spacing [1,2], the surface reflectance is subject to variations induced by the canopy structure and its illumination. Thus, at those resolutions, the integrated spectral signature of a VSP will not only depend on the canopy size, but also on the row and vine spacing, soil reflectance, and the proportion of shaded soil (Figure 1). Shading has been shown to alter soil vegetation indices significantly [3], so these will, in turn, be affected by row orientation as well as solar inclination and azimuth at the time of acquisition.
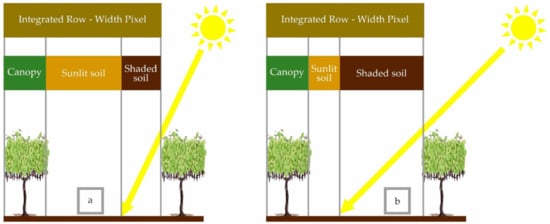
Figure 1.
Schematic illustration of the contribution of different reflectance fractions in a vertical-shoot-positioned (VSP) to the integrated value of a row-width pixel for a given solar elevation. Diagram (a) shows the situation with high solar elevation; diagram (b) illustrates how at lower solar elevation the reflectance fractions, and hence their integrated value, change.
Although studies have shown that RS-derived vegetation indices such as the Normalized Difference Vegetation Index (NDVI) obtained from satellite imagery correlate well with LAI at specific locations [4], and that variability patterns of LAI and NDVI are similar [5], several factors affect this relationship [6,7]. Radiometrically-calibrated high-resolution imagery, capable of discriminating canopy extent from the ground, would be required to avoid soil or soil cover-induced effects when isolated canopy data are required [2]. Recent studies using imagery with ground resolutions better than 0.1 m have established reliable and accurate techniques with which to isolate pure canopy from reflectance of other fractions visible to nadir-viewing sensors [8]. Moreover, methods to compensate shaded canopy and inter-row shading have been tested successfully, although the effect of shading has proved to be disparate depending on the indices employed [9], leading to some differences in the otherwise excellent compensation obtained. However, despite the recent proliferation of affordable drones equipped with very high-resolution multispectral cameras and the reliable procedures developed to isolate canopy values, at large scales such a service is often either expensive, difficult to secure (i.e., due to legislative restrictions or lack of service providers) or the data obtained are unsuitable for quantitative applications.
Wide-angle camera imagery is frequently susceptible to surface reflectance anisotropy and radiometric alteration [10], and this may affect spectral values when colour balancing is applied during mosaicking, as overlapping image reflectance pixel values are averaged to erase illumination artefacts. When reflecting surfaces are not Lambertian, this correction will alter radiometric values significantly over varying reflection angles. In this sense, the use of aircraft-based systems yielding ground resolutions of 0.1 to 0.3 m at common flight altitudes, such as GTech (Outline Global Pty Ltd., Perth, Australia), Ultracam (Vexcel Imaging GmbH, Graz, Austria), as well as others with narrow fields of view, reduces this limitation but is usually too expensive to be affordable for many vineyard-scale companies. Inexpensive alternatives, ranging from 10 m resolution satellite data (e.g., the European Space Agency’s Sentinel 2 platforms) or aircraft-borne sub-metre resolution systems (e.g., Aeroptic JD3000 by Aeroptic Inc., North Andover, MA, USA) used in agriculture currently, offer multispectral resolutions which are insufficiently detailed for adequate canopy isolation. Separation of the canopy from other features improves with increasing resolution, and a rule of thumb in RS indicates that adequate mapping requires pixel sizes of at least around half the size of the feature of interest. Current UAV and high-resolution aerial imagery commonly yield resolutions of around 0.05 m to 0.10 m, i.e., roughly half the minimum typical size of a fully-grown leaf, which in practical terms is deemed adequate for fraction segregation [8,9]. To change the resolution with fixed focal length systems, an aircraft can only modify its flying height over the target, which in turn affects the number of flight lines required to cover a target, and thus determines acquisition cost. Moreover, even at minimum speeds, light aircraft will move some 3 to 4 cm during exposure, so if the height is reduced to obtain the nominal resolutions of the magnitude indicated, the real resolutions collected are considerably poorer. This effect may be reduced in imagery obtained from slower flying UAVs, and coarser-resolution captures where the drift described affects a smaller proportion of each pixel.
An alternative to such high-resolution imagery with which to obtain pure canopy data is to isolate this fraction’s response from pixels with resolutions that include reflectance from all the fractions, such as those obtained from the inexpensive airborne and satellite imagery mentioned, with ground resolutions around row width or greater (subsequently referred to as “moderate” resolution), that may be less susceptible to the shortcomings expressed above, in particular the effects of anisotropic reflection. Nonetheless, for aerial acquisitions, the possible impact of this characteristic should be tested in order to determine if any model obtained must consider the Bi-Directional Reflectance Factor (BDRF).
With this approach, or until the cited shortcomings associated with very high-resolution acquisitions are overcome or minimized, canopy size estimations in VSPs with no cover crops might be obtained from Vegetation Indices (VI) where the signal collected at each moderate resolution pixel is composed of varying fractions of canopy, sunlit soil, and shaded soil. Each of these fractions consists of two elements: the fractional cover or proportion and its corresponding VI. Although canopy size and its related biophysical characteristics are known to exhibit non-linear relationships with many vegetation indices, in those cases this relationship becomes linear at LAI values commonly found in vineyards and other crop canopies [7,11]. In addition, the non-linear relationship mentioned derives from light extinction as it is transmitted through leaf layers [12], and as both shaded and sunlit soil are opaque surfaces, in principle the fraction elements may be linearly added with the following expression:
where the VI represents the value of the vegetation index for each fraction in each pixel, p is the proportion that each fraction contributes to moderate resolution pixel i, j, and sub-indices indicate each type of fraction (c-canopy, sun-sunlit soil, and sh-shaded soil) (Figure 1). It must be noted that although the direction of illumination will affect the relative proportion of each of the cited fractions, the canopy itself may also modify its spectral signature as a consequence of within-canopy shading. In this study, the canopy fraction is treated as a single variable and its spectral signature variation studied as a function of the direction of illumination.
In principle, canopy size is best described by the canopy fraction pcVIc. Thus, elements pc and VIc are the terms of interest with which to estimate LA and LAI [2,7,8]. Because of its widespread use in vineyard LAI determinations [1,4,6], the Normalized Difference Vegetation Index (NDVI) is used as the VI with which to compare results of an unmixing technique, even when other indices may eventually prove to be more appropriate for vineyard LAI determination [7]. The NDVI value of a moderate resolution pixel obtained from satellite or aerial imagery may be described as NDVIint, i.e., the integrated NDVI obtained from a summation of the fractions and their corresponding NDVI values.
Considering NDVIsun may be obtained from imagery acquired during winter, in the absence of canopy or winter cover crops, to isolate the canopy fraction all the other fraction proportions and NDVIsh would need to be determined in such a way that the effect of incident light is compensated or corrected and the following expression, obtained from Equation (1), can be applied:
As illustrated in Figure 1, the direction of incident light on a VSP can be expected to affect all these fraction elements, except for pc and, possibly, NDVIc. The angle of illumination will depend on solar elevation, azimuth, and row orientation. In addition, row spacing, and canopy height will affect the shading fraction. This study aims to explore the effect of the direction of illumination on the fractions contributing to integrated vine NDVI pixels with row-width or greater ground resolutions, in order to establish whether isolation of pure canopy response may be achieved over vineyards trained on VSP systems.
2. Materials and Methods
2.1. Study Sites
Field measurements were performed on two Malbec blocks belonging to the Grupo Peñaflor located in Coquimbito, Mendoza, Argentina (S 32° 58′ 44″, W 068° 45′ 03″). The blocks were planted with different row orientations (RowOrs—direction of planting clockwise from True North) of 13° (Block1) and 324° (Block9), but with the same row spacing (2.10 m) and trellis system (VSP).
2.2. Multispectral Images
To select the sample areas a mean NDVI georeferenced image (with 1 m resolution) was created by averaging data obtained from aerial surveys conducted close to veraison between the 12th and 15th of January from the three previous seasons. The NDVI values were stratified into classes, and sampling sites spanning the full range of NDVI were located on the field, where 9 plants were selected and marked in each block. A Tetracam ADC (Tetracam Inc., Chatsworth, CA, USA) with 4 individual cameras fitted with spectral bandwidth filters in the green (G: 535–577 nm), red (R: 639–674 nm), red edge (RE: 716–727 nm), and near-infrared (NIR: 755–900 nm) portions of the spectrum were used to capture nadir-viewing images over the canopy, and the R and NIR data were processed to obtain NDVI values at each site. The multispectral camera was mounted on a boom designed to be fitted to a quadricycle in order to be moved successively to each sampling site, where the camera was positioned approximately 2 m over the canopy in a way that the field of view (FOV) spanned the row width (Figure 2). The resulting images yielded a pixel size averaging 3.5 mm.
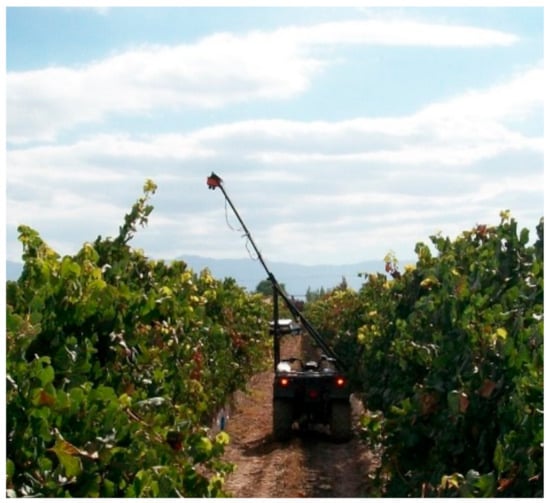
Figure 2.
Image collection arrangement. The Tetracam system mounted on a boom and placed in a nadir viewing position over the canopy at each sampling site.
The multispectral images were acquired on March 2 and 3, (approximately five weeks before harvest). In Block1 (RowOr 13°), images were captured starting around noon and ending after 5 p.m., and in Block9 (RowOr 324°), beginning three hours before solar noon and ending at 14:45 p.m., i.e., in both cases within the time range for common aerial and satellite surveys. One nadir-viewing image was taken at each site and then the camera was moved to the next site. This procedure was repeated until each site was visited up to four times.
The exact time of each acquisition was recorded and with this value, solar azimuth, and elevation (SELV) were obtained for the vineyard’s coordinates using the NOAA Solar Position Calculator (http://www.esrl.noaa.gov/gmd/grad/solcalc/azel.html (accessed on 23 April 2020). Solar azimuth values and row orientation were converted to an East origin, increasing anticlockwise, so values increase in the same direction as the solar path. A variable termed “relative azimuth” (RELAZ), which combines solar azimuth and row direction to determine the angle of horizontal solar incidence with respect to row orientation, was calculated and used. This variable is completely correlated with SELV on a given date and location, but changes differently to SELV along the season, and therefore its influence should be studied and treated independently. Before each capture, poles were placed within the FOV and aligned with the direction of solar illumination, in order to determine the NDVI values of shaded soil cast by a specific section of the canopy. In addition, the poles bore marks that allowed pixel size to be calculated. The digital number values for each image were converted to surface reflectance using regression functions established for a fixed exposure time that ensures no brightness saturation within the full range of solar elevations, using panels of known and Lambertian reflectance [7]. For each capture, an NDVI image was generated from the R and NIR reflectance values. Possible changes in canopy water status and leaf orientation were minimised by recording the data one day after drip irrigation [13].
2.3. Data Analysis
2.3.1. Bi-Directional Reflectance Factor (BDRF)
Because vegetation has been shown to exhibit strong directional reflection at wavelengths over 0.7 µm [14], a means to determine if the BDRF needs to be considered was devised. NIR images spanning the full range of time of capture were segmented with a k-means unsupervised classification into 10 classes, and the highest reflectance class, corresponding to canopy features with direct illumination, was plotted against time of capture.
2.3.2. Linear Mixing Test
To test if the fractions may be linearly combined to model an integrated spectral signature or, conversely, to linearly extract canopy values by unmixing, a high-resolution NDVI aerial image with 0.07 m resolution, acquired over a vineyard in Mendoza’s Valle de Uco close to veraison in 2020, was converted to 10 m resolution using QGIS, by averaging the pixel values in a 10 m grid obtained by vectorizing a Sentinel 2 Level 2 (atmospherically corrected) image of the same date (21 January 2020). The NDVI from the Sentinel image was calculated, and the resulting pixel values were plotted against the corresponding values of the degraded-resolution aerial image.
2.3.3. Determination of Fractions (Canopy, Shadow, and Sunlit Soil)
To avoid errors due to within-canopy shading that might derive from automatic feature classifications, a manual approach was implemented to determine the areas and fractions of the canopy, shadow, and sunlit soil corresponding to one row inside the FOV. Polygons were carefully hand-drawn on each image for each fraction using QGIS (QGIS Development Team, 2009. QGIS Geographic Information System. Open-Source Geospatial Foundation). Then, the average NDVI was calculated for the sunlit soil, a portion of the canopy within the image and whose shadow was entirely visible, and the shadow cast by that portion.
2.3.4. Statistical Analysis
Exploratory analysis and regressions using illumination variables and fraction element spectral signature and proportion values were performed using Infostat (Infostat version 2016. Grupo InfoStat, FCA, Universidad Nacional de Córdoba, Argentina). Summary statistics and Pearson correlation between all variables were calculated. Because SELV and RELAZ are fully correlated on a given date, as in this study, the effect of RowOr was studied with analysis of variance (ANOVA). NDVIint and NDVIc with respect of RELAZ alone, independent of SELV, were compared in Blocks 1 and 9 over a range of similar solar elevation values. The expected causal link between variables was hypothesized and studied using path analysis. This technique provides path coefficients, which are the standardized coefficients of the multiple regression of a model proposed to explain a given variable as a linear function of others [15].
3. Results
3.1. The Bi-Directional Reflectance Factor (BDRF)
Because anisotropic reflectance of any fraction could modify the weighted average of fraction spectral signature with changes in illumination angle, it is a likely candidate to affect results expected from linear mixing. However, when NIR brightness values for unshaded canopy features were measured throughout the full range of collection time, values spanned a limited range of 25 brightness units (from a total possible range of 256), with a coefficient of variation of only 3.2% and no discernible trend along the day (data not shown). Within the scope of this study, this implies canopy BDRF may be discarded as a source of variation in NDVIint.
3.2. Linear Mixing of Elements
When aerial NDVI imagery with a 0.07 m resolution was aggregated to provide 10 m pixels and these were plotted against Sentinel-2 values with the same resolution and acquired on the same day, the ensuing scatterplot clearly shows a linear relationship (Figure 3), lending support to the assumption of linearity expressed in Equation (1).
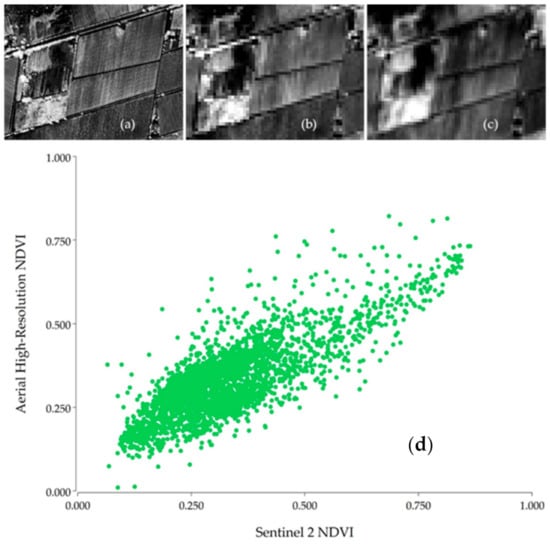
Figure 3.
(a) Aerial 0.07 m resolution Normalized Difference Vegetation Index (NDVI) image of a vineyard in the Valle de Uco, Mendoza, taken the on January 22nd, 2020. (b) Aerial image with 0.07 m pixels aggregated to 10 m resolution. (c) Sentinel 2 Level 2 NDVI 10 m resolution image of the same date. (d) Scatterplot of Sentinel 2 vs. aggregated aerial NDVI.
3.3. Overall Effects of the Illumination Angle
On clear and sunny days, as the solar path proceeds, the direction of illumination on the VSP changes. Fractions (canopy, shaded soil, and sunlit soil) exhibit significant differences between their individual spectral signatures. Their weighted average will vary substantially with changes in shading induced by different illumination angles during the day. In the example presented in Figure 4, fractions of canopy, shaded soil, and sunlit soil have a portion of 0.32, 0.44, and 0.24, and their average NDVI values are 0.798, 0.321, and 0.197, respectively.

Figure 4.
A sequence of NIR images of the same site captured along the day. (a) 14:26 PM (39 min after solar noon), (b) 16:07 PM, and (c) 17:07 PM. Solar Elevation was 62.7°; 48.3°; and 36.8°, respectively. (d) Near-infrared (NIR) nadir-viewing image of a VSP row, (e) NDVI of the same site and (f) Fractions of canopy (green), shaded soil (black), and sunlit soil (yellow). The frame was taken at 16:03 in Block 01 (Row Orientation of 13° East of True North), with the sun elevation at 49° and a relative azimuth of 70.8°.
Descriptive statistics of all factor elements studied are shown in Table 1. CV values of NDVIc are considerably smaller than those of all other elements, so within-canopy shading does not cause changes in the overall canopy spectral signature of the same magnitude as the changes in the direction of illumination. As expected, NDVIsh values and the range of its fraction suggest the contribution of shaded soil to NDVIint is substantial. The effects described before are similar for both row orientations. However, the vines at Block9 (RowOr 324°) presented a more consistent vigour, clearly evidenced in the NDVI values (maximum of 0.65).

Table 1.
Summary statistics of the fraction elements (variables) in expression (1) and driving factors sun elevation and relative azimuth.
Pearson correlation coefficients between all fraction elements and illumination variables are detailed in Table 2. The correlation coefficients of SELV and RELAZ with all elements show they wield opposite effects in all cases, and exhibit a high association with several elements, except pc and NDVIsun, as expected. Canopy size, and therefore pc, are independent of illumination angle at any given site. NDVIsun should only vary with the angle of incident light if the soil reflectance is not Lambertian, in which case a high correlation with SELV should be expected. Strikingly, NDVIsh shows an insignificant correlation with SELV and RELAZ. Inspection of p-values obtained from correlations shows that despite the significance of the coefficients relating NDVIint with psun and psh, both of which are very strongly affected by SELV and RELAZ, these correlation coefficients are lower than those relating NDVIint with the other elements. These two fractions are complementary and their influence on NDVIint is opposite and may therefore be reduced by either direct or indirect influence from the other elements.
Table 2.
Pearson correlation coefficients between all variables, including factors affecting the illumination direction.
Results of the ANOVA performed to assess the influence of RowOr on NDVIint and NDVIc independently of SELV are detailed in Table 3, clearly indicating a significant effect of the row orientation.
Table 3.
ANOVA of NDVIc and NDVIint data collected within the same range of SELV values in two blocks with different row orientation.
3.4. Effect of Illumination on Fraction Elements
Considering the direction of illumination clearly affects NDVIint fractions, attempts to model a procedure with which to extract pure canopy values requires identifying the effects of SELV and RELAZ on all the fraction elements they affect, and determine the relative contributions of each of these to NDVIint. Application of Path Analysis allowed quantification of the direct influence of each variable on others judged to be causally linked. For example, NDVIsh could be expected to be determined to some extent by SELV, RELAZ, NDVIc, NDVIsun, and pc. The p-value for the correlation with SELV is 0.69, and the coefficient is 0.06. However, when the correlation is broken down into direct and indirect effects, the contributions of SELV to NDVIsh are direct −0.64; via RELAZ 0.33; via NDVIc 0.24, via NDVIsun 0.14; and via pc 0.002. This breakdown shows that the direct effect of SELV on NDVIsh is both important and negative, that is, an increase in SELV leads to a lower NDVIsh. Nevertheless, an increase in SELV also implies a strong and opposite effect from RELAZ that induces an indirect compensation on the NDVIsh value. For this reason, the effect of illumination angles on fraction elements, and of these on NDVIint, would require regression functions that should only include parameters that have direct causal links and avoid combining those that exhibit indirect effects that may lead to compensations. In addition, results shown in Table 3 usher the need to study the effects of illumination and relationship among variables in Blocks 01 and 09 separately. The DPCs among variables judged to have causal links are shown in Table 4, where DPCs for each dependant variable have been selected excluding other variables whose indirect contributions generate compensations that drive the Pearson Correlation coefficients to p-values greater than 0.1.
Table 4.
Direct path coefficients (β weights) obtained from path analysis of variables included in the components of expression 1. Coefficients of variables assumed to have no causal links are left blank.
Results listed in Table 4 clearly show that the influence of the direction of illumination is considerably more important in Block1 than in Block9: DPCs for SELV and RELAZ on all the fraction elements, apart from pc, which might be expected to be independent of illumination, are substantially greater. Overall, the DPCs for Block9 fraction elements show weaker associations with most of the variables that influence them.
3.5. Relative Influence of Fraction Elements in Canopy Estimations
Regression functions were built to calculate the fraction elements needed to solve the Expression 2. Those exhibiting the highest coefficients of determination (R2) and with parameter regression coefficient p-values of less than 0.1 are shown in Table 5. Accuracy in element estimations varies substantially with RowOr, RELAZ replaces SELV as the main driving factor as RowOr approaches the direction of the solar path, and, despite overall high coefficients of determination, some estimations are appreciably inaccurate, notably NDVIc in Block 01, and both NDVIc and psun in Block 09.
Table 5.
Regression parameter coefficients and their respective p-values, coefficient of determination (R2), and Root Mean Square Error (RMSE) for psh, psun, NDVIc, and NDVIsh as functions of variables exhibiting lowest p-values and highest coefficients of determination.
When using the regression-based canopy fraction estimations, the correlations obtained against the measured values of pcNDVIc are 0.26 and 0.42 for Blocks 01 and Block 09, respectively. By comparison, estimation of pc alone yields correlations of 0.17 and 0.42, which highlights the matter that this parameter weighs heavily in the final pcNDVIc value, in full agreement with the findings of Hall et al. [6].
4. Discussion
Influence of soil background interference with vegetation cover estimations, based on vegetation indices obtained from moderate resolution imagery such as Landsat or SPOT, has prompted a long-standing and persistent effort to counteract its effects. For example, the development of several of the so called “soil adjusted indices” has pursued this goal, generally addressing both the effect of cover and the results of soil reflectance changing with moisture, texture, or surface roughness [16,17]. In this pursuit, the effect of shading was sometimes recognised but usually dismissed or intentionally eluded [18,19]. The appearance of high-resolution aerial imagery opened the possibility of fraction segmentation, where the canopy was isolated and other fractions discarded [20]. Recent research has focused on selecting good techniques for segmentation [8], and, more recently, on compensating shading instead of eliminating it [9]. However, these procedures are all dependent on the availability of high-resolution imagery, which viticulturists seldom have frequent access to throughout a season. In contrast, judging by the number of web-based platforms offering such products, there is growing interest to monitor vine evolution with high-revisit satellite imagery, but their resolutions make canopy segmentation impossible. With these, shading-induced variability must be addressed by unmixing.
It is indisputable that the direction of illumination significantly affects the integrated spectral signature of a vineyard trained on VSP, since the values of NDVIsh are considerably different from those of NDVIc and NDVIsun, and the shaded soil fraction varies substantially according to both SELV and RELAZ. As the results show, these factors exert independent effects on NDVIint, although, within the conditions of this study, where data were collected at one site over a period of only two days, their complete correlation does not allow their separate contributions to be fully settled. Nonetheless, ANOVA results show RELAZ will drive NDVIint independently of SELV, thus confirming that RowOr plays a significant role in the integrated VSP spectral signal.
As the orientation approaches that of the solar path, the overall effect of shading variability decreases, the main driving factor (SELV or RELAZ) changes, and the precision with which they may be used to predict the shaded and sunlit fractions decreases. The differences found may be attributed to canopy geometry as well as structure. A VSP with N-S orientation will determine a greater variation in shading than one with an E-W orientation, which would lead to higher precisions in predicting the effect of shading from data obtained in field studies. In addition, although the common view holds that a VSP acts as a regular hedge or screen, the results obtained here challenge this view.
The effect of BDRF was discarded after testing for its presence with the full data set obtained, and the assumption of linearity required for unmixing was confirmed with the simple test illustrated in Figure 3.
The determination of canopy values by unmixing requires either prior knowledge of some of the element values and the factors that may affect them (e.g., canopy height, row spacing), and some form of correction of those elements affected by SELV and RELAZ that will take them to a reference illumination condition. Considerations for each element include:
(i) pc: As previously stated, this element contributes to the greatest share of canopy response variability. Unexpectedly, and despite the accuracy of psh and psun values derived from SELV and RELAZ, the values for pc obtained from subtracting these values from a unit area show very low correlation with the measured pc. Visual inspection of the imagery collected suggests the plausible cause to be the consequence of actual canopy structure and the limited range of the image FOV, which appears as insufficient to adequately capture shading produced by shoots extending sideways or vertically from the main VSP hedgerow. Figure 4 illustrates that conceiving a VSP as a regular screen is misleading: if it were, in nadir views the shadow contour should be roughly similar to the canopy outline. However, shoots growing at different angles project shadows strongly affected by parallax, and, also, many of these shadows fall outside the image FOV. In addition, it is likely that this shading condition varies along the growth season, as VSPs are usually subjected to tipping to a uniform height before veraison but some shoot elongation, particularly from lateral growth, inevitably continues after that.
Another approach that can be used to obtain pc consists of assuming that when solar azimuth is the same as RowOr, illumination is aligned with the canopy direction and psh is equal to 0, so pc + psun = 1. Then considering NDVIsun can be obtained from winter imagery when the canopy is bare, Expression 1 can be rearranged to allow estimation of pc as follows: pc = (NDVIint − NDVIsun)/(NDVIc − NDVIsun). However, this method would require the terms NDVIint and NDVIc to be obtained at the time solar azimuth is the same as RowOr. Satellites cannot be tasked to accommodate this, and aerial imagery would only be useful should all blocks in the vineyard have the same RowOr and the resulting time of capture ensure absence of hotspots.
pc dominates the canopy fraction’s contribution to NDVIint and is, therefore, the term of most importance to obtain an estimation of canopy size. In minimally-pruned vines, canopy size has been shown to depend more on the planimetric ground cover (pc) than the LAI [6]. Logarithmic regressions of vine VSP LAI against VIs show that sensitivity drops drastically with LAI values above 1 [7], which may explain this finding. In VSPs, where canopies are constrained by wires or Grenbiule hail-protection netting, the relative importance of ground cover is likely to be less, and influence of NDVIc correspondingly more, but results here point to the overwhelming influence of pc on the final value of the canopy fraction. If the inaccuracies stemming from the estimations of shading previously cited can be overcome as suggested, it seems likely that a useful estimation of pc may be obtained using pc = 1 − psh − psun.
(ii) psun and psh: Considering pc is independent of the direction of illumination, these two elements are complementary, so for any given vineyard arrangement one may be calculated from the other. The CV of the fraction proportions, as well as their relative contribution to the prediction of the canopy fraction as evidenced by their regression parameter coefficients, show their weight to be prevalent over fraction spectral signature. Both psh and psun have been shown to be strongly affected by the angle of light incidence, so their effect may be expected to generate greater differences in NDVIint than the variation of their respective fraction NDVIs. However, the range of variation of psh in Block1 is approximately twice that in Block9. This difference may be attributed to the RowOrs. Block 1 is aligned close to the N-S direction so roughly orthogonal to the solar path. In contrast, Block9 is aligned in NW-SE direction, so changes in Solar Azimuth, and even SELV, will have considerably less effect on psh variation. In addition, as can be clearly observed in Figure 4, shoots extending to the sides of the VSP, outside the trellis constraints, will cast shadows even at solar noon. Moreover, these may lie outside the FOV of the image captured and cause psh to be only loosely associated with pc at this study’s scale and sample size. An improvement to test their association requires a much larger FOV and an important extension of the area imaged, as might be obtained from gathering the data from a full block, high-resolution mosaic.
(iii) NDVIc: NDVIc has been shown to be an adequate estimator of LAI [7]. However, the lack of sensitivity of NDVIc to changes in LAI for many crop canopies, including vines, is a well-established fact [7], so the results obtained here may differ in sparsely leaved vines, or early in the growing season, as under such conditions the direct influence of NDVIc on NDVIsh and even psh may become significant. Moreover, very sparsely leaved canopies may not exhibit a linear LAI-NDVI relationship, thus violating the assumption of linearity underlying in Equation (1). For the conditions in this study, however, results obtained highlight the possibility of obtaining good estimates for NDVIc directly from NDVIint and illumination angles for specific vineyard conditions, which enables the development and use of similar functions for management of individual blocks or vineyards.
(iv) NDVIsun: For VSPs with no cover crops, NDVIsun can be obtained from winter imagery, in the absence of vine canopy. In arid regions such as Mendoza, where this study was conducted, VSPs are universally drip-irrigated along the planted row, so variations arising from differences in soil moisture may be discarded. In addition, both correlation coefficients (Table 3) and DPCs (Table 5) show no effect of illumination angles on NDVIsun, indicating that changes in the time of year for its determination will not lead to differences in its value.
(v) NDVIsh: The DPC value of NDVIsh on NDVIint is much higher than that of the NDVI of the other fractions. Considering shading raises the NDVI value of the soil fraction by around 50%, as can be seen in Table 1, the combination of this variation with changes in psh induced by different illumination angles can be seen to be the most important cause of variation in integrated NDVI response, above those of canopy or sunlit soil. Both psh and NDVIsh show the highest CV amongst all variables, including SELV and RELAZ, which suggests they are affected by additional factors, aside from direction of illumination, perhaps associated with canopy structure irregularities (porosity). However, this may affect psh primarily, as results also show there appears to be no discernible influence of the illumination angles on NDVIsh. The results confirm that the final value of NDVIsh is driven primarily by the soil spectral signature, at least for the canopy densities found in the studied VSPs, leaving psh as the main cause of NDVIint variations induced by changes in the direction of illumination.
5. Conclusions
The results of this study confirm that in VSP trellised vineyards, NDVI values of each fraction are sufficiently different to account for important changes in the integrated NDVI when the angle of incident light varies, and their corresponding proportions change. In particular, shading has an important effect in the integrated NDVI and is dependent on both solar elevation and the horizontal angle of incidence concerning row orientation (relative azimuth). The effect of shading decreases as the row orientation approaches the direction of the solar path. This carries important implications regarding the possibility of establishing an optimal time of day for collection of data over vineyards with blocks planted with different orientations and determines the need to correct individual block data by SELV and RELAZ, in those cases. As was expected canopy NDVI was stable showing small changes (less than 5%) with the direction of illumination. These small variations appear to be a consequence of within-canopy shading.
The elements that contribute to the integrated NDVI value may be adequately estimated and corrected for changes in illumination in order to allow estimation of the canopy fraction by unmixing moderate resolution pixels. However, further studies are needed to better segregate individual variable effects. In practical terms, the findings of this study highlight the need for corrections of variations caused by the angle of illumination, therefore, to provide general solutions in VSP vineyards, the applications of moderate resolution imagery should consider these corrections, otherwise, the models just give empirical solutions with a strong influence of the specific conditions of the vineyard analysed.
Author Contributions
Conceptualization, P.C.T. and C.P.-E.; Data curation, P.C.T.; Formal analysis, P.C.T.; Funding acquisition, P.C.T.; Investigation, P.C.T. and C.P.-E.; Methodology, P.C.T.; Project administration, P.C.T.; Supervision, C.P.-E.; Visualization, P.C.T. and C.P.-E.; Writing—original draft, P.C.T.; Writing—review and editing, C.P.-E. All authors have read and agreed to the published version of the manuscript.
Funding
This research received no external funding.
Institutional Review Board Statement
Not applicable.
Informed Consent Statement
Not applicable.
Acknowledgments
My gratitude to Marcelo Belmonte and the Grupo Peñaflor for the permission to work at 1883 and use the premises and equipment from the company laboratories, and Guillermo Yaciofano for making the quadricycle available. Special thanks to Sean Towers from AgriSat SA for his tireless contribution in the fieldwork, and Piero Babusci for his kind help with the figures.
Conflicts of Interest
The authors declare no conflict of interest.
Abbreviations
This section presents a summary of the most relevant not common abbreviations used in this study:
| VSP | Vertical-Shoot-Positioned (a term used in viticulture to define a vertical trellis system) |
| NDVIint | Integrated Normalized Difference Vegetation Index for the pixel i,j. |
| NDVIc | Normalized Difference Vegetation Index of the canopy. |
| NDVIsun | Normalized Difference Vegetation Index of the sunlit soil surface. |
| NDVIsh | Normalized Difference Vegetation Index of the shaded soil surface. |
| pc | The proportion of canopy that contributes to pixel i,j, |
| psun | The proportion of sunlit soil surface that contributes to pixel i,j, |
| psh | The proportion of shaded soil surface that contributes to pixel i,j, |
| SELV | Solar elevation. |
| RELAZ | relative azimuth. |
References
- Lobitz, B.; Johnson, L.; Armstrong, R.; Hlavka, C.; Bell, C. Grapevine Remote Sensing Analysis of Phylloxera Early Stress (GRAPES): Remote Sensing Analysis Summary; NASA Technical Memorandum No. 112218; NASA: Ames Research Center, CA, USA, 1997.
- Hall, A.; Lamb, D.W.; Holzapfel, B.; Louis, J. Optical remote sensing applications in viticulture—A Review. Aust. J. Grape Wine Res. 2002, 8, 36–47. [Google Scholar] [CrossRef]
- Johnson, L.F.; Scholash, T. Remote Sensing of Shaded Area in Vineyards. Hort. Technol. 2005, 15, 859–863. [Google Scholar] [CrossRef]
- Johnson, L.F. Temporal stability of an NDVI-LAI relationship in a Napa Valley vineyard. Aust. J Grape Wine Res. 2003, 9, 96–101. [Google Scholar] [CrossRef]
- Vila, H.; Perez Peña, J.; García, M.; Vallone, R.; Mastrantonio, L.; Olmedo, G.; Rodriguez Plaza, L.; Salcedo, C. Estimación de biomasa en viñedos mediante imágenes satelitales y aéreas en Mendoza, Argentina. In Teledetección—Hacia un Mejor Entendimiento de la Dinámica Global y Regional; Editorial Martin: Mar del Plata, Argentina, 2007; pp. 51–58. ISBN 9789875431263. [Google Scholar]
- Hall, A.; Louis, J.P.; Lamb, D.W. Low-resolution remotely sensed images of winegrape vineyards map spatial variability in planimetric canopy area instead of leaf area index. Aust. J. Grape Wine Res. 2008, 14, 9–17. [Google Scholar] [CrossRef]
- Towers, P.C.; Strever, A.; Poblete-Echeverría, C. Comparison of vegetation indices for leaf area index determination in vertical shoot positioned vine canopies with and without Grenbiule hail-protection netting. Remote Sens. 2019, 11, 1073. [Google Scholar] [CrossRef]
- Poblete-Echeverría, C.; Olmedo, G.F.; Ingram, B.; Bardeen, M. Detection and Segmentation of Vine Canopy in Ultra-High Spatial Resolution RGB Imagery Obtained from Unmanned Aerial Vehicle (UAV): A Case Study in a Commercial Vineyard. Remote Sens. 2017, 9, 268. [Google Scholar] [CrossRef]
- Aboutalebi, M.; Alfonso, F.; Torres-Rua, A.F.; McKee, M.; Kustas, W.; Nieto, H.; Coopmans, C. Behavior of vegetation/soil indices in shaded and sunlit pixels and evaluation of different shadow compensation methods using UAV high-resolution imagery over vineyards. Proc. SPIE Int. Soc. Opt. Eng. 2018, 30, 10664. [Google Scholar]
- Deering, D.W.; Middleton, E.M.; Irons, J.R.; Blad, B.L.; Walter-Shea, E.A.; Hays, C.L.; Walthal, C.; Eck, T.F.; Ahmad, S.P.; Banerjee, B.P. Prairie grassland bidirectional reflectances measured by different instruments at the FIFE site. J. Geophys. Res. 1992, 97, 18887–18903. [Google Scholar] [CrossRef]
- Gitelson, A.A.; Viña, A.; Arkebauer, T.J.; Rundquist, D.C.; Keydan, G.P.; Leavitt, B. Remote estimation of leaf area index and green leaf biomass in maize canopies. Geophys. Res. Lett. 2003, 30, 1248. [Google Scholar] [CrossRef]
- Milthorpe, F.L.; Moorby, J. An Introduction to Crop Physiology; Cambridge University Press: London, UK, 1974; ISBN 0521202604. [Google Scholar]
- Smart, R.E. Aspects of water relations of the grapevine (Vitis vinifera). Am. J. Enol. Vitic. 1974, 25, 84–91. [Google Scholar]
- Pinty, B.; Verstraete, M.M.; Dickinson, R.E. A Physical Model of the Bidirectional Reflectance of Vegetation Canopies 2. Inversion and Validation. J. Geogr. Res. 1990, 95, 11767–11775. [Google Scholar] [CrossRef]
- Balzarini, M.G.; Gonzalez, L.; Tablada, M.; Casanoves, F.; Di Rienzo, J.A.; Robledo, C.W. Infostat, Manual del Usuario; Editorial Brujas: Córdoba, Argentina, 2008. [Google Scholar]
- Richardson, A.J.; Wiegand, C.L. Distinguishing vegetation from soil background information. Photogramm. Eng. Remote Sens. 1977, 43, 1541–1552. [Google Scholar]
- Jasinski, M.F.; Eagleson, P.S. The structure of red-infrared scattergrams of semivegetated landscapes. IEEE Trans. Geosci. Remote Sens. 1989, 27, 441–451. [Google Scholar] [CrossRef]
- Qi, J.; Chehbouni, A.; Huete, A.R.; Kerr, Y.H.; Sorooshian, S. A Modified Soil Adjusted Vegetation Index. Remote Sens. Environ. 1994, 48, 119–126. [Google Scholar] [CrossRef]
- Todd, S.W.; Hffer, R.M. Responses of Spectral Indices to Variations in Vegetation Cover and Soil Background. Photogramm. Eng. Remote Sens. 1998, 64, 915–921. [Google Scholar]
- Hall, A.; Louis, J.; Lamb, D. Characterising and mapping vineyard canopy using high-spatial-resolution aerial multispectral images. Comput. Geosci. 2003, 29, 813–822. [Google Scholar] [CrossRef]


Publisher’s Note: MDPI stays neutral with regard to jurisdictional claims in published maps and institutional affiliations. |
© 2021 by the authors. Licensee MDPI, Basel, Switzerland. This article is an open access article distributed under the terms and conditions of the Creative Commons Attribution (CC BY) license (http://creativecommons.org/licenses/by/4.0/).