Abstract
Lunar volcanic domes are essential windows into the local magmatic activities on the Moon. Classification of domes is a useful way to figure out the relationship between dome appearances and formation processes. Previous studies of dome classification were manually or semi-automatically carried out either qualitatively or quantitively. We applied an unsupervised machine-learning method to domes that are annularly or radially distributed around Gardner, a unique central-vent volcano located in the northern part of the Mare Tranquillitatis. High-resolution lunar imaging and spectral data were used to extract morphometric and spectral properties of domes in both the Gardner volcano and its surrounding region in the Mare Tranquillitatis. An integrated robust Fuzzy C-Means clustering algorithm was performed on 120 combinations of five morphometric (diameter, area, height, surface volume, and slope) and two elemental features (FeO and TiO2 contents) to find the optimum combination. Rheological features of domes and their dike formation parameters were calculated for dome-forming lava explanations. Results show that diameter, area, surface volume, and slope are the selected optimum features for dome clustering. 54 studied domes can be grouped into four dome clusters (DC1 to DC4). DC1 domes are relatively small, steep, and close to the Gardner volcano, with forming lavas of high viscosities and low effusion rates, representing the latest Eratosthenian dome formation stage of the Gardner volcano. Domes of DC2 to DC4 are relatively large, smooth, and widely distributed, with forming lavas of low viscosities and high effusion rates, representing magmatic activities varying from Imbrian to Eratosthenian in the northern Mare Tranquillitatis. The integrated algorithm provides a new and independent way to figure out the representative properties of lunar domes and helps us further clarify the relationship between dome clusters and local magma activities of the Moon.
1. Introduction
Lunar domes are low volcanic edifices that are similar to small and low shield volcanoes on the Earth and Mars. Domes are commonly interpreted as having been formed by the eruption of magma from a central vent or by the subsurface intrusion of a pressurized magmatic body, and they can be indicative of the local magmatic activities [1,2,3,4,5]. Lunar mare domes have been extensively mapped on the Moon, and most of the lunar domes are concentrated in the lunar mare regions, including Mare Tranquillitatis (e.g., Cauchy and Vitruvius region), Mare Insularum (Hortensius/Milichius/T. Mayer region), and also on volcanic complexes such as Marius hills and Rümker hills in Oceanus Procellarum (e.g., [1,2,3,6,7,8,9,10,11]). Morphometric, spectral, and rheological studies of lunar domes have been carried out with lunar remote-sensing datasets (e.g., [1,2,3,6,9,10,11]). Morphological and rheological knowledge of domes, such as diameters and slopes of domes, and viscosities of forming lavas are useful properties for getting insight into fundamental relationships between dome appearances and the rheological properties of dome-forming lavas [2,7,8,12,13,14]. As the duration of lava effusion as well as the viscosity of lava flows shape the appearances of domes, different subsets of domes with different morphological properties may reflect various supply processes and physical properties of lavas. Classification of domes provides a useful way to figure out the possible relationship between dome appearance and formation process, since both the morphometric and rheological properties of domes can be diverse (e.g., [2,6]).
Head and Gifford [6] divided more than two hundred lunar domes into seven classes based on morphological properties (primarily diameter) and geological settings of domes. Their classes 1, 2, and 3 refer to volcanic features resembling terrestrial shield volcanoes. Class 1 domes have circular to elliptic outlines, with diameters ranging from 5.5 to 15 km, slopes less than 5° and possessing summit craters without raised rims. Class 2 domes have more irregular outlines than class 1 domes and possessing pancake-like cross-sectional shape. Class 3 domes are similar to those of classes 1 and 2 but with a lower topographic relief. Classes 4–7 are based on the morphologic setting of the domes. Class 4 denotes domes associated with mare ridges and arches, while class 5 describes domes originating from lava mantling of pre-existing highland topography. Class 6 includes domes with higher albedo than mare material and comparably steep slopes, and class 7 describes complex mare domes with irregular outline and topography. They showed that the domes interpreted to be small shields (classes 1–3) occurred predominantly in groupings in the nearside equatorial region (Cauchy, Hortensius, and Marius Hills) and were related to relatively low lava effusion rates favorable to shield building eruptions.
Wöhler et al. [2] devised a classification scheme that is complementary to the scheme introduced by Head and Gifford [6] in that it subdivides lunar mare domes, especially those belonging to their classes 1–3, according to the spectral and morphometric properties in a quantitative way. Wöhler et al. [2] applied a principal component analysis (PCA) of three spectral features (R750, R415/R750, and R950/R750) and five morphometric features (flank slope, diameter, height, edifice volume, and form factor) of lunar mare domes. The classification scheme as outlined by Wöhler et al. [2] comprises four classes A–D. Class A domes display small to moderated diameters (5–13 km) and low flank slope (below 1.0°), possessing relatively high TiO2 (represented by R415/R750) content. Class B domes have moderate TiO2 content and are further divided into subclass B1 (flank slopes > 2°, 6–15 km in diameter) and B2 (flank slopes < 2°, 8–15 km in diameter). Domes formed from lavas of low to moderate TiO2 content, having large diameters (13–20 km) and high volumes (7–50 km3) are assigned to subclass C1, while domes of moderate to high TiO2 content, with smaller diameters (8–17 km) and volumes of less than 17 km3 are assigned to subclass C2. Class D includes large and complex edifices near Arago with high TiO2 content, with slopes between 1.3 and 1.5°, which is consistent with the class 7 of Head and Gifford [6].
Wöhler et al. [3] examined mare domes in terms of the scheme by Head and Gifford [6] and Wöhler et al. [2]. They add a class E, representing domes with moderate TiO2 content and diameters less than 6 km, and then subdivided class E into class E1 (slopes of 2.0–4.0°) and E2 with slopes less than 2.0°. For completeness, they add a further class G with slopes higher than 6.0°, representing domes corresponding to class 6 of the Head and Gifford [6] scheme. They estimate the rheological conditions during the lava effusion process and divide the domes into three rheological groups R1–R3. The first rheological group, R1, is typically characterized by lava viscosities between about 104 and 106 Pa s and contains domes with elongated vents in the Milichius/T. Mayer region and two similar domes in northern Mare Tranquillitatis. The second rheological group R2 is made up of the very shallow domes in northern Mare Tranquillitatis with their low lava viscosities between 102 and 104 Pa s. The third rheological group R3 consists of the comparably steep-sided domes near Hortensius and in the T. Mayer region with lava viscosities between 106 and 108 Pa s. A comparison with the mare dome classification results show that domes of R1 belong to classes B2, C, and E2, those of group R2 are situated between classes A and E2, and the rheological group R3 comprises domes of classes B1 and E1, which suggest that domes with steeper slopes tend to be more viscous than those with relatively gentle slopes.
Previous studies of lunar dome classification provide us a comprehensive understanding of dome appearances and their rheological characteristics, but these studies have been carried out manually or semi-automatically (as a review, see [1]). Head and Gifford [6] classified lunar domes mainly focusing on qualitative descriptions of the dome shape and its geological setting rather than morphometric quantities. Wöhler et al. [2] applied PCA to quantitatively classify lunar domes considering both their morphometric and spectral properties, but their subclasses are manually identified according to the transformed dome features coordinates. Questions for dome classification remain, e.g., what is/are the dominant features for dome clustering? How can dome clustering help us improve our understanding of local magmatic activities? Whether domes that are spatially adjacent or relevant could reflect regional magma activities of the Moon?
Located on the northern edge of Mare Tranquillitatis (Figure 1), the Gardner volcano is a unique edifice with several domes either annularly or radially distributed around it (e.g., [15]). Huang et al. [15] confirmed 17 volcanic domes with diameters ranging from 2.2 to 16.2 km and heights varying from 60 to 245 m. Most of these domes are shallow domes with summit pits or fissures, and the average flank slopes are varying from 0.8° to 5.7°. Following previous classification schemes, these domes are belonged to classes 1–3 of Head and Gifford [6] and classes A–C of Wöhler et al. [2]. Geological mapping suggests Eratosthenian to Imbrian unit (Eld) of these domes, which is consistent with the absolute model ages (3.90 to 2.96 Ga) of the Gardner volcano. Comprehensive geological studies suggest that the Gardner volcano has possibly experienced four stages of volcanic activities [15]. Domes study in this region can help us further understand the local magmatic activities.
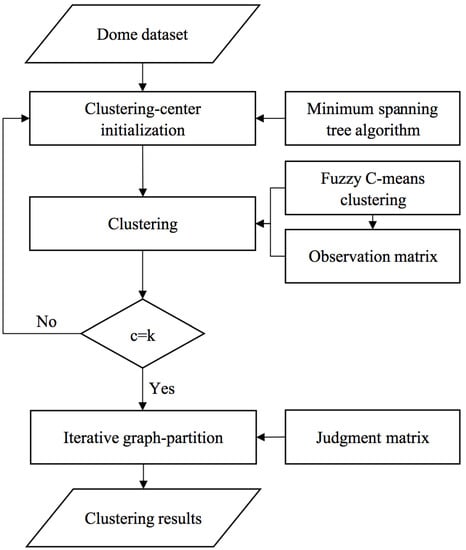
Figure 1.
Flowchart of the clustering algorithm applied in this study.
In this study, we used an unsupervised machine-learning method to classify domes in the Gardner volcano and its northern Mare Tranquillitatis region and tried to figure out the key parameters for lunar dome clustering and its relationship with local magma activities. As one type of unsupervised machine learning technique, clustering is an efficient method to identify potential patterns within data and partition it into several subsets or groups, fulfilling homogeneity and heterogeneity [16,17]. High-resolution lunar imaging and spectral data were used to extract morphometric and elemental properties of domes in both the Gardner volcano and its surrounding region in the Mare Tranquillitatis. An integrated robust Fuzzy C-Means clustering algorithm was performed on all the combinations of seven morphometric and spectral features to find out the optimum combination. Rheological features of domes and their dike formation parameters are derived from the model of Wilson and Head [18] for further dome-forming lava explanations.
2. Data and Methodology
2.1. Data
Previous studies used data mainly from telescopic images [2,3,6] to measure the morphometric properties (diameter, height, and volume) and Clementine UVVIS multispectral data [2,3] to reveal the spectral properties of domes. Recent lunar missions have provided high-resolution lunar global images, digital terrain models (DEMs), and spectral datasets.
We used panchromatic images from Kaguya Terrain Camera (TC: ∼10 m/pixel; [19]) and associated digital terrain models (DTMs) to characterize the morphometric properties of domes for the reasons of both high-resolution and sufficient coverage of the studied region. TC images and DTMs of SELENE are downloaded from SELENE’s data archive (http://l2db.selene.darts.isas.jaxa.jp/, accessed on 1 March 2019). The spatial resolution of the dataset is well suited for morphologic measurements of small dome features.
Elemental contents (FeO and TiO2) of domes are derived using Clementine UVVIS multispectral data (~115 m/pixel) by using the algorithms proposed by Lucey et al. [20]. The Clementine UVVIS data have sufficient coverage and resolution for domes larger than 1 km in this study. Furthermore, the same spectral database with the previous study [2] can help us to avoid uncertainties due to data inconsistency in the clustering results explanation.
2.2. Dome Feature Extraction
An appropriate morphometric feature extraction method is important for both rheological and clustering analyses of domes. In this paper, dome features are extracted by taking into account multiscale data. Panchromatic images, DTMs, and the associated shaded relief are projected into a simple cylindrical projection in the Geographic Information System (GIS). We check and label all the domes in GIS and compare them with previous locations [4,15,21]. To obtain the detailed structure of each dome, we cut the whole image into sub-images that merely contain one or several connected domes and then delineate the vector outline of each dome according to the contouring and 3D-rendering images.
2.2.1. Morphometric Features
Five morphometric features of each dome are identified using the 3D topographic models: including area (), diameter (), height (), maximum surface volume (), and average flank slope (Slope).
The dome area A can be determined by counting the pixels bounded by the outline. If we assumed that a dome is quasi-circular and lies on the same plane, we can calculate the average diameter of D a dome by:
The height of a dome is defined as the difference between the summit of the dome and its lowest point in the dome outline, and the Slope of a dome can be defined as the inverse tangent of the ratio of and by:
The maximum surface volume of a dome is defined by the volume between its DEM surface and a horizontal reference plane embodying the lowest point of the dome outline.
2.2.2. Element Contents
Iron and titanium abundances (FeO and TiO2) are important for the determination of rock types and are useful in distinguishing different geological units. The FeO content can be used to discriminate lunar mare materials from highland rocks [22,23]. The TiO2 content has been used as a reference in the classification of mare basalts [24,25,26,27]. There are indeed several classification schemes, which have been summarized by [28], e.g., Neal and Taylor [29] classified mare basalts into Very low-Ti (<1.0 wt %), Low-Ti (1.0–6.0 wt %), and High-Ti (>6.0 wt %) based on analyses of Apollo samples; Giguere et al. [24] proposed a classification based on remote-sensing data: Very low-Ti (<1.0 wt %), Low-Ti (1.0–4.5 wt %), Intermediate-Ti (4.5–7.5 wt %), High-Ti (7.5–10.0 wt %), and Very high-Ti (>10.0 wt %). According to Lucey et al. [20], the iron and titanium abundances of the lunar surface can be estimated from Clementine UVVIS multispectral data by:
and
where , , stand for surface reflectance at 415, 750, 950 nm, respectively. We use these equations to estimate the average FeO and TiO2 contents of each dome within its bounded area.
2.2.3. Rheological Properties
The morphological development of a dome is determined by its properties of the dome-forming lava, including lava viscosity , effusion rate , and the duration of the effusion rate . The rheological model proposed by Wilson and Head [18] and adapted by Wöhler et al. [2] is applied here to infer the rheological properties of lavas that formed the domes in the Gardner region. The model is based on the assumption that a dome is formed by lava effused from a central vent on a flat plane. The cooling magma is treated as a Bingham plastic characterized by the yield strength and plastic viscosity . The plastic viscosities of lava flows (expressed in Pa s) that were forming the domes can be estimated by:
where stands for the yield strength (expressed in Pa) that is given by:
where is the lava density, which is set to be 2000 kg m−3 [2], the acceleration due to gravity is equal to 1.63 m s−3. Assuming a higher density will increase the viscosity by a constant factor. For a high magma density of 2800 kg m−3, this factor amounts to 2.2, compared to the values obtained with a density of 2000 kg m−3, which is not too significant when regarding the broad range of viscosities inferred for the lunar mare and highland domes [2]. It is worth noting that with the assumption that the motion of the lava flow front is simply limited by cooling, the lava effusion rate E from a vent can be expressed as:
where is the thermal diffusivity of the lava, and the duration of lava effusion is given by:
where is the surface volume in km3.
2.3. Clustering Algorithm
As one type of unsupervised machine learning technique, clustering is an efficient method to identify potential patterns within data and partition it into several subsets or groups (clusters), fulfilling homogeneity and heterogeneity [16,17]. Hierarchical and partitional clustering are the two most widely used clustering algorithms [17]. Hierarchical methods are susceptible to outliers in the data and choices of combinations/divisions of clusters. Grosse and Kervyn [30] made hierarchical cluster analysis on terrestrial volcanoes and obtained 12 groups but had to omit about 1/3 of domes due to the two reasons mentioned above. The precision of partitional clustering is mainly influenced by the selection of the cluster number (referring to subsets that a dataset can be divided) and the defined similarity measure between data points and clusters [31,32,33], which makes this method hard to be applied to any structurally unclear dataset. Mok et al. [17] proposed a robust adaptive clustering (RAC) algorithm that can be integrated with a Fuzzy C-Means (FCM) algorithm [34] to automatically determine the cluster number and acquire reliable clustering results simultaneously. In this study, we applied this RAC-FCM algorithm to our dataset and use the minimum spanning tree algorithm [32] to generate the initial cluster center to avoid inconsistent results among different experiments caused by local minima.
We give the definitions of variables used by the integrated RAC-FCM algorithm. If is the dataset of m domes, each sample, , stands for a p-dimensional data point. If is the cluster number, .
To obtain clustering results, we take the following five steps (Figure 1).
The first step is to initialize cluster centers. Find a minimum spanning tree where the summary of weights of all edges is the smallest and then select c nodes to be the initial clustering centers [32].
The second step is to run the FCM algorithm. FCM algorithm partitions into clusters by minimizing the object function :
where controls the fuzziness of membership (degree reflects each data point belonging to more than one cluster during the iteration) and we set in this paper according to former researchers [35]. Clustering centers , , are initialized in the first step. is the membership matrix, only if:
may minimize [32]. Update and until the difference between consecutive is less than 10−5.
The third step is to build the observation matrix. If is the row number of the largest membership value in each column of the final , we get the observation matrix [17],
The fourth step is to repeat the previous steps until .
The last step is to determine the cluster number and output the cluster results. In the case of the judgment matrix ,
an iterative graph-partitioning process defined as the Formula (14) goes on, leading to the changes of sub-graphs with updating. As the number of sub-graphs of is the cluster number of each iteration, the most frequently occurring value is the final cluster number of the dataset, and the corresponding sub-graphs are indeed the clustered results [17]:
In this study, we take all the combinations of 5 morphometric and 2 spectral features into consideration and have evaluated 120 groups of feature combinations in total to obtain the optimum combination of features. On the premise that domes observed in this research are divisible, we discard the feature groups making the cluster number smaller than 2. To verify the clustering results, both the correlations of features and the significance levels of their coefficients are calculated in MATLAB R2018a [36].
3. Results
3.1. Morphometric, Spectral and Rheological Properties of Domes
Based on the previous database of Wöhler et al. [2,3] and Huang et al. [15], we finally labeled and studied 54 domes in both the Gardner volcano and its surrounding region in the northern Mare Tranquillitatis (Figure 2). 39 domes are closely related to and either annularly or radially distributed around the Gardner volcano. As a validation, 20 domes (Figure 2, brown triangles) in the northern Mare Tranquillitatis identified by Wöhler et al. [2] were re-analyzed carefully in this study. We find 17 domes (Figure 2, purple stars) spatially consistently with theirs, with the standard deviations of longitude and latitude differences as 0.08° and 0.11°, respectively. Three domes located near the Rima Cauchy are not observed in this study. The validated 17 domes are generally taller and smaller than previous results, with standard deviations of height and diameter differences as 37.86 m and 2.74 km (Table A1), respectively.
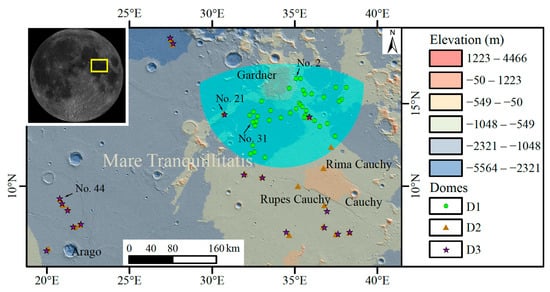
Figure 2.
Locations of domes analyzed in this study. Domes labeled as D1 (green spots), D2 (brown triangles), and D3 (purple stars) represent domes that are spatially and structurally related to the Gardner volcano (cyan shaded area, maximum range without overlap with other tectonic structures, such as Rima Cauchy and Rupes Cauchy), domes identified by Wöhler et al. [2] and re-identified in this study, respectively. Domes no. 2, 21, 31, and 44 are representative domes shown in Figure 3. The background is a topographic map derived from TC DTM (digital terrain models derived from Kaguya terrain camera )data (simple cylindrical projection).
We extracted five types of morphometric features for all the 54 domes, with values ranging from 2.90 to 405.44 km2 for A, 1.92 to 22.72 km for D, 54 to 498 m for H, 0.75° to 6.47° for Slope and 0.07 to 85.19 km3 for SV (Table 1). Figure 3 shows the elevation maps of four typical volcanic domes in this study. Dome no. 2 is a representative dome at the eastern edge of the Gardner volcano (Figure 2 and Figure 3a) with a diameter of 3.61 km and a slope of 5.91°. Dome no. 21 (10.89 km in diameter, dome C8 in Wöhler et al. [2]) and no. 31 (5.15 km in diameter) are located to the southwest of the Gardner volcano (Figure 2 and Figure 3b,c), with slopes of 3.99° and 2.36°, respectively. Dome no. 44 (Arago 5, dome A6 in Wöhler et al. [2]) is an elongated dome in the west area of Mare Tranquillitatis, away from the Gardner volcano (Figure 2 and Figure 3d). The diameter and slope of dome no. 44 are 6.66 km and 1.86°, respectively. The flank slopes of domes have a trend of decreasing with distance from the Gardner volcano. There is a summit pit crater developed on dome no. 31, but no crater pits or fissures on the other three domes (Figure 3). Among 54 domes, we only find 19 domes possessing volcanic summit pits or fissures (Table 1).

Table 1.
Morphological parameters, iron and titanium contents, rheological properties of domes and their dome clusters a.
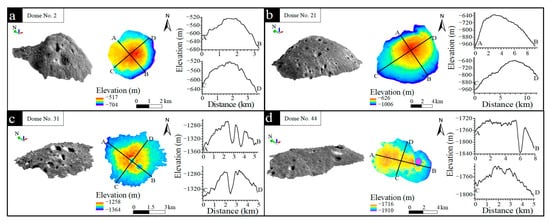
Figure 3.
3D-rendering images, elevation maps and profiles of representative domes. (a) Dome no. 2 (35.09° E, 16.51° N) is a typical dome at the eastern edge of the Gardner volcano. (b) Domes no. 21 (30.75° E, 14.34° N) and (c) no. 31 (32.47° E, 13.88° N) are representative domes to the southwest of the Gardner volcano. (d) Dome no. 44 (20.77° E, 9.26° N) is a typical dome in the Mare Tranquillitatis, away from the Gardner volcano. Representative elevation profiles along AB and CD are selected for every single dome.
Iron and titanium contents are also obtained based on Equations (3) and (4) (Table 1). The average FeO contents of 54 domes vary from 16.12 to 19.66 wt %, and their average TiO2 contents range from 3.93 to 15.73 wt %, respectively. Results show that the study area is covered by low-Ti to high-Ti mare basalts based on analyses of both Apollo samples [29] and remote-sensing data [28].
Rheological properties are calculated from the morphological features by using Equations (5)–(8). Results show that the estimated plastic viscosities can vary from 6.67 × 10³ to 3.32 × 10⁷ Pa s, the effusion rates range from 6.70 to 303.15 m3 s−1, and the duration can last from 82 to more than 5000 days (Table 1).
3.2. Clusters of Domes
We applied the integrated RAC-FCM algorithm into the dataset of domes represented by five morphometric and two elemental features. All the 120 groups of the seven features are evaluated to obtain the optimum combination. The feature groups leading to the cluster number being equal to 1, which are indicative of data indivisibility, are dismissed. Table 2 shows 36 feature groups with the cluster number not smaller than 2. Because the largest dome near crater Arago, dome no. 49 (22.72 km in diameter, Table 1) was distinctively separated from other domes (Table 2); we take clusters that contain individual dome no. 49 as candidate groups. Taking a balance between sufficient clusters and dome numbers into consideration, a group consistent with features A, D, SV, and Slope were selected out as the optimum combination. There are four clusters produced by this feature group, with dome numbers of 1, 11, 13, and 29, respectively (Table 2).
Table 2.
Clustering statistics of different feature groups with the cluster number c ≥ 2.
Area, diameter, surface volume, and Slope are four representative features for dome clustering (Feature group of 1, 2, 3, 5 in Table 2). We plot the distribution map of clustered domes and label the dome cluster (DC) numbers from 1 to 4 by considering the relative distances from the Gardner volcano (Figure 4). DC1 and DC2 are annularly and radially distributed around the Gardner plateau, and three domes of DC1 are either superposed on or surrounding the Gardner volcano. DC3 is widely distributed, and DC4 is a unique super-volcano near the Arago crater in the east of Mare Tranquillitatis. To figure out the distribution of different clusters, we plot a two-dimensional variations space of the four selected features. As shown in Figure 5, dome no. 49 in DC4 (Figure 5a, magenta pot) has the largest diameter (22.72 km) and surface volume (85.19 km3), which is distinguished differently from domes of the other three clusters. DC3 (Figure 5a, cyan plus) can be easily separated from the other three clusters by the features of diameter and area. DC3 possesses a diameter range of 9.46–16.28 km, while those values of DC1 and DC2 are smaller than 8.74 km (Figure 5a, Table 3). The area of DC3 has a range of 70.34 to 208.14 km2, which is larger than the area of both DC1 and DC2. DC1 and DC2 can be distinguished from each other by taking the feature of Slope (Figure 5d–f) into consideration. The average flank slopes of domes in DC1 range from 4.23° to 6.47°, while those values of domes in DC2 and DC3 are smaller than 3.99° (Table 3).
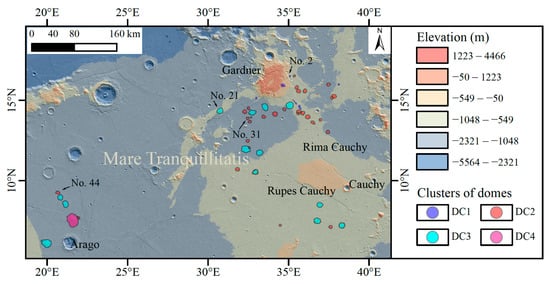
Figure 4.
Distributions of the clustered domes. DC1 to DC4 represent the four obtained clusters. The shapes of domes in the figure correspond to their real shapes. The background is a topographic map derived from TC DTM (simple cylindrical projection).
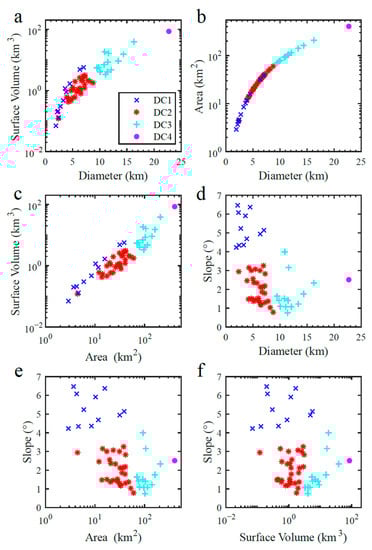
Figure 5.
Graphs showing the variation of (a) surface volume vs. diameter, (b) area vs. diameter, (c) surface volume vs. area, (d) average flank slope (Slope) vs. diameter, (e) average flank slope vs. area, and (f) average flank slope vs. surface volume of 54 domes in both the Gardner volcano and the northern mare Tranquillitatis. These domes were grouped into four clusters using an integrated RAC-FCM algorithm, namely dome cluster 1 (DC1, blue), dome cluster 2 (DC2, red), dome cluster 3 (DC3, cyan), and dome cluster 4 (DC4, magenta), respectively. Diameter, area, surface volume, and slope are the selected features for clustering.
Table 3.
Statistical range of the 14 parameters and ages for the four clusters.
We found that height, FeO and TiO2 are not representative features for optimum combination in this study. The feature height is 71–316 m for DC1, 54–197 m for DC2, 75–380 m for DC3, and 498 m for DC4, respectively (Table 3). Heights overlap between the three dome clusters (except DC4) and vary linearly with four optimum combined morphometric features (Figure A1). FeO and TiO2 contents of domes are linearly related but randomly varied with other features (Figure A2). If the FeO and TiO2 contents, especially the latter one, are expected to vary with different volcanic stages, there should be a trend of clusters (from DC1 to DC4) if they are representing different stages of magmatic activities. However, a recent study of TiO2 abundances of the Moon suggests that this assumption is only suitable for young mare regions with surface model age less than 2.6 Ga [27]. Early mare eruptions (>2.6 Ga) with large TiO2 variations suggest multiple melt sources with a wide range of TiO2 concentrations (0 to 10 wt %) in the study region [27]. Furthermore, domes in this study are all belong to groups of median to high-TiO2 content. It is possible that TiO2 content is not a distinguishable property in the study region.
3.3. Verification of Clustering Results
Feature selection is aimed at improving feature usefulness as constituents of data sets for clustering [16] and can be defined as the process of identifying relevant features and discarding irrelevant ones [38], namely finding the optimal feature subset. In this study, we have taken all the 120 feature combinations into consideration to select the optimal feature subset. To verify the clustering results, correlation coefficients of features are calculated based on the premise that there is no relationship between the observed features at a significance level of 0.05 [36].
Within a 95% confidence interval, features of D, A, H, and SV are positively correlated with each other (coefficients > 0.5), but feature Slope is slightly negative or not correlated with other four-morphometric features (Table A2 and Table A3). Features FeO and TiO2 contents have a high-correlation of 0.94 with each other, but they have no correlation with the five morphometric-features (Table A2 and Table A3).
Although three features (A, D, and SV) in our optimum combination are significantly correlated, we have tested and found that any single feature of them combined with the feature Slope cannot achieve the same optimized clustering results. The combination of highly correlated features can still offer useful information for clustering [39]. Feature H is a redundant feature in our clustering since the cluster number is equal to 1 (invalidated) if we add this feature into the optimum combination for clustering.
It is worth noting that there are 36 feature groups (including various combinations of seven features) that can satisfy the unsupervised clustering condition with cluster number (Table 2). Height, FeO and TiO2 contents are also useful features for clustering if we consider the unique condition of divisibility of the database (). Feature groups including one or more of these three features (groups contain 4, 6, or 7 in Table 2) can obtain two or three dome clusters. Wöhler et al. [2] have divided domes in the northern Mare Tranquillitatis (Cauchy and Arago area) into classes A, C2, and D based on the TiO2 contents (R415/R750 ratios) and morphological appearances of domes. Their dome class A includes domes of C1, C4, A1, A4, A5, and A6, which correspond to domes of no. 53, no. 47, no. 48, no. 46, no. 45, and no. 44 in this study (Table A1), and class C2 contains domes of C2, C3, C5, C6, C7 and C8 (domes of no. 52, no. 50, no.43, no. 42, no.25 and no. 21 in this study, Table A1). Domes A2 (no. 49, Arago ) and A3 (no. 54, Arago ) make up class D due to their large diameters and volumes [2]. Based on their classification scheme [2], we find the feature group (1, 2, 6 in Table 2) of diameter, area, and TiO2 content could obtain the most similar results with three dome clusters. However, domes are mixed among three clusters in this study, which are not strictly following the dome numbers assigned by classes A, C2, and D in Wöhler et al. [2]. The reason is probably due to the overlap definitions of spectral and morphometric properties in Wöhler et al. [2]. In their classification schemes, TiO2 contents are defined as high for both class A and D (moderate to high for class C2), and the diameters are 5–13 km for class A and 8–17 km for class C2, respectively. Furthermore, recent mare TiO2 abundances together with surface model ages suggest that TiO2 is not a good indicator for distinguishing different magmatic stages for early mare volcanism (>2.6 Ga) in Mare Tranquillitatis [27]. The TiO2 contents have a wide variation (0 to 10 wt %) but show no trend with surface mare ages in the Mare Tranquillitatis.
Feature groups that include height could also obtain two or three dome clusters (e.g., group (4, 6), group (1, 3, 4), group (2, 3, 4, 5/7) in Table 2). The feature height is highly correlated with three morphometric features, possessing a correlation coefficient of 0.78 with D, 0.92 with A and 0.77 with SV (Table A2), respectively. Though H is not a representative feature in our selected optimum combination group (A, D, SV and Slope), it was highly represented by the other three morphometric features of A, D and SV.
We selected the optimum combination by taking a balance between sufficient clusters and dome numbers into consideration and finally chose the optimum feature group of A, D, SV, and Slope with four dome clusters (DC1 to DC4). Domes C2, C3, C5 and C8 of class C2 and domes C4, A4 and A5 of class A are assigned to DC3, while domes C6 and C7 of class C2 and domes C1, A1, and A6 of class A are assigned to DC2 (Table 1). Domes A2 and A3 of class D are assigned to DC4 and DC3 (Table 1), respectively.
3.4. Morphological and Rheological Properties of Selected Clusters
To figure out the aggregation degree of four clusters, we have made statistics of key morphological and rheological parameters for four clusters. As shown in Figure 5 and Figure 6 and Table 3, the average diameters of domes in each of the four clusters are less than 30 km, and they follow an increasing trend from DC1 to DC4, with their median diameters of 3.28, 6.30, 11.40, and 22.72 km, respectively. Both the areas and surface volumes are increasing from DC1 to DC4 with median values varying from 8.46, 31.19, 102.04 to 405.44 km2 for A and 0.47, 1.16, 6.92 to 85.19 km3 for SV, respectively. On the contrary, the Slope shows a decreasing trend from DC1 to DC3, and the median slopes of domes in the three clusters are 5.14°, 1.86° and 1.41°, respectively (Figure 6d). Both the surface volume (Figure 6c) and estimated plastic viscosity (Figure 6e) are highly concentrated, with most values less than 5 km3 and 106 Pa s, respectively. The estimated effusion rate increases from DC1 to DC4 (Figure 6f), and the median values are 12.23, 64.37, 163.82, and 181.40 m3 s−1, respectively.
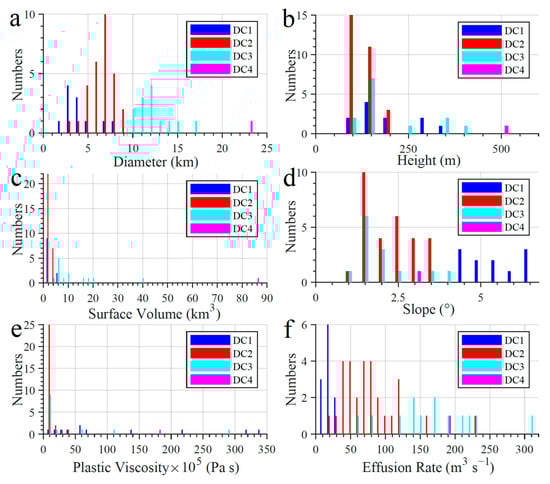
Figure 6.
Histograms of (a) diameter, (b) height, (c) surface volume, (d) average flank slope, (e) plastic viscosity, and (f) lava effusion rate for each dome in DC1 to DC4.
The morphological development of a dome is determined by properties of the dome-forming lava, such as its viscosity, effusion rate, and the duration of the effusion process [1]. As shown in Figure 7d–f, both the viscosities and durations are positively correlated with slopes; the opposite is true for slopes vs. effusion rates. It is worth noting that the estimated plastic viscosities of DC1 (median 5.27 × 10⁶ Pa s) are generally higher than values of DC2 and DC3 with a median viscosity of ~2 × 10⁵ Pa s (Figure 7a). According to the rheological group schemes of Wöhler et al. [3], domes of DC1 that are spatial-close to the Gardner volcano, with estimated viscosities varying between 106 and 108 Pa s belong to the third rheological group R3, which represents steep-sided domes similar to domes near Hortensius and in the T. Mayer region. The first rheological group, R1, is typically characterized by lava viscosities range of 104–106 Pa s and the second rheological group R2 represents lava viscosities among 102–104 Pa s, which is made up of the very shallow domes in the northern Mare Tranquillitatis [3]. Domes of DC2 and DC3 with viscosities varying between 104 to 107 Pa s are more consistent with domes in the first rheological group R1. However, the lava viscosity is a function of dome height, and the estimated viscosities of domes in this study are higher than previous results due to obvious height differences (Table A1).
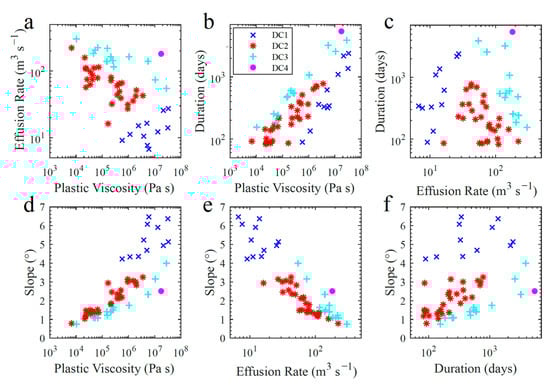
Figure 7.
Graphs showing the variation of (a) effusion rate vs. plastic viscosity, (b) duration vs. plastic viscosity, (c) duration vs. effusion rate, (d) average flank slope vs. plastic viscosity, (e) average flank slope vs. effusion rate, and (f) average flank slope vs. duration of 54 domes in both the Gardner volcano and the northern Mare Tranquillitatis, colored with respect to the assigned dome cluster (DC1 to DC4).
4. Discussion
4.1. Advantages of Using an Integrated Clustering Method for Classification
The integrated RAC-FCM algorithm is an unsupervised machine-learning method that can provide a quantitative study of domes. Previous classification schemes (e.g., [6]) on lunar domes are mainly focused on a qualitative description of the dome shape and its geologic setting rather than morphometric quantities. A recent study has tried to use a principal component analysis (PCA) to subdivide lunar mare domes according to their spectral and morphometric properties in a quantitative way (e.g., [2]), but their subclasses are manually identified according to the transformed dome feature coordinates. RAC-FCM in this study provides an independent way to select the representative features (properties) of domes and helps us to understand the relationship between different features of domes. Our results show that D and Slope are two dominant features for lunar domes classification, which is consistent with previous lunar domes analyses (e.g., [1,2,6]). However, in this study, features such as A and SV of domes are also found to be necessary for the optimum combination selection.
4.2. Multi-Stage Volcanic Activities Revealed by the Clustered Domes
Different measured morphometric, spectral and estimated rheological properties of DC1 to DC4 indicate diversities in regional dome-forming lavas in the Gardner area. Among four dome clusters, domes in DC1 are located relatively close to the Gardner volcano, have the smallest diameters (<7 km, median 3.28 km) and highest flank slopes (>4°). Lavas that formed domes in DC1 are estimated to have relatively high plastic viscosities (106–107 Pa s) but the lowest effusion rates (<27 m3 s−1). In contrast, domes in DC2 to DC4 are relatively large in diameter (median values of 6.30, 11.40, and 22.72 km, respectively) and have lower slopes (<4°).
To better account for the observed dome morphologies, we computed the values of the magma rising speed, dike width and dike length that fed each dome, assuming that the domes were formed by lava eruption from a single feeder dike [3]. The estimated rising speeds of lavas that formed domes in DC1 range from 10−8 to 10−5 m s−1 (median 10−6 m s−1), and the estimated dike widths range from 34 to 177 m (median 99 m). Only one dome with viscosity <106 Pa s in DC1 fits the dike length calculation law, yielding a value of 131 km. If we assume that the length of a dike approximately equals its vertical extension, the basaltic magmas that formed the domes of DC1 originated from magmas located deeply in the mantle (>100 km). The average crustal thickness of Gardner volcano is ~21 km, estimated from Model 1 of Wieczorek et al. [40] using high-resolution GRAIL gravity. The estimated rising speeds of magmas that formed domes in DC2 and DC3 are 10−7 to 10−3 m s−1 (median 10−4 m s−1), which are much higher than those values of DC1. The median dike widths and dike lengths are 25 m and 78 km for DC2, 43 m and 70 km for DC3, which are much smaller than those values of DC1, respectively. The unique dome in DC4 has a viscosity large than 106 Pa s (not suitable for dike length calculation), yielding a dike width of 137 m. Comparing with domes of DC2 and DC4, magmas that formed domes of DC1 are estimated to have had the lowest rising speeds but the largest dike widths and dike lengths.
The magma temperature and composition govern its viscosity and, in turn, the steepness of the domes. In general, steeper lunar domes were probably formed by more viscous lavas of lower temperatures and higher crystalline contents than lunar domes with low flank slopes (e.g., [1,13]). DC1 domes are smaller and steeper than domes of DC2 and DC4, and considering their rheological characteristics, we could suggest that lavas forming domes in DC1 originated from the deep mantle (>100 km in-depth), transporting slowly through wide dikes, with temperature decreasing along long dikes, lava viscosities increased, but effusion rate decreased. Domes of DC2 to DC4 are much larger and smoother than domes of DC1. Lavas forming domes of DC2 and DC3 were stored at relatively shallower mantle or crust-mantle interfaces, rising quickly through narrow dikes with high effusive rates, forming smooth domes with large effusion areas. Though the magma viscosities are possibly governed by compositional differences, there is no apparent relation between plastic viscosities and TiO2 and FeO contents (Figure A2).
Comparing with previous studies of surface model ages, DC1 to DC4 may represent multiple magma activities related to either the Gardner volcano or Mare Tranquillitatis. Dome no. 5 of DC1 is a representative dome with a central-pit crater, representing the latest dome formation stage of the Gardner volcano, yielding a surface age of ~2.96 Ga (Eratosthenian; [15]). Wilhelms [41] mapped dome features around the Gardner volcano (including domes of DC1 to DC4) as Eratosthenian mare dome materials in an area of Imbrian age basalts with surface model age around 3.6 Ga (Imbrian; [15,37]). Recently, Schnuriger et al. [11] mapped domes near Arago, yielding their surface model ages of ~3.75 Ga to ~2.79 Ga for domes of DC2 to DC4, though the age ranges were constrained to vary from 3.75 to 3.57 Ga by [37]. It is worth noting that domes of DC1 are strongly different from domes of DC2 to DC4 in morphometric, spectral, and the estimated rheological properties. DC1 domes are small, steep, and close to the Gardner volcano, with forming lavas of high viscosities and low effusion rates, representing the youngest Eratosthenian magmatic activities in the Gardner volcano. DC2 to DC4 domes are relatively large, smooth, and widely distributed, with forming lavas of relatively low viscosities and high effusion rates, representing magmatic activities varying from Imbrian to Eratosthenian in the northern Mare Tranquillitatis. Multistage magma eruptions with different surface ages of the Gardner volcano [15] are related to domes annularly and radially around it. Fractures and grabens like the Rima Cauchy and the Rupes Cauchy to the southeast of the Gardner volcano can be surface expressions of feeder dikes that are likely to be lava sources [3] of the domes around them.
The distribution patterns of DC1 to DC4 suggest that domes formation may have been controlled by tectonic structures, such as impact-induced faults/dikes formed by the Imbrium basin [3]. A conduit accompanied by a dike swarm above an intrusive body can form these concentric or radial faults (e.g., [42]), lava domes, and shields. Young domes of DC1 and DC2 are more likely controlled by the faults that have been formed by the Gardner volcano, representing its latest volcanic activities. Domes of DC3 and DC4 are more likely controlled by faults/dikes formed by previous large impact basins (e.g., Imbrium basin, [3]). The huge underlying feeder dike identified by gravity gradients [43] bordering the PKT would be conducive to the magma ascent of either the Gardner volcano [15] or the Mare Tranquillitatis. The shield-building eruptions of domes could come directly from the mantle, driven by basin or crater loading-induced stress in dikes [44], or from shallow magma bodies created by intrusion-trapping loading stresses (e.g., [45]).
It is worth noting that TiO2 in mare basalts provides an indication of TiO2 enrichment in underlying mantle source regions. Coupled with surface age data for various mare units can help us to understand the thermal evolution of the mantle [27]. Early mare eruptions (>2.6 Ga) with large TiO2 variations suggest multiple melt sources with a wide range of TiO2 concentrations (0 to 10 wt %) in the Mare Tranquillitatis. However, TiO2 contents obtained from different instruments show obvious offsets in the studied region (up to 6.9 wt % between TiO2 contents obtained from Clementine and Wide-Angle Camera UVVIS reflectance [27]).
5. Summary and Conclusions
To figure out the dominant features of lunar dome clustering and their relationship with local magmatic activities on the Moon, we have applied an integrated RAC-FCM algorithm (an unsupervised machine-learning method) to domes in both the Gardner volcano and its adjacent northern Mare Tranquillitatis. Based on high-resolution lunar images and spectral data, we have carefully identified 54 domes in the study region and extracted five morphometric (D, A, H, SV, and Slope) and two spectral (FeO and TiO2 content) features for each dome. Rheological features of domes, including lava viscosity, effusion rate, and duration time, and the dike formation parameters, were calculated for dome-forming lava explanations.
Our study shows that D, A, SV, and Slope are four optimum morphologic features for lunar domes clustering. Based on these four features, the 54 studied domes can be grouped into four dome clusters (DC1 to DC4). DC1 domes are relatively small, steep, and close to the Gardner volcano, with forming lavas estimated to be of high viscosities and low effusion rates, representing the latest Eratosthenian dome formation stage of the Gardner volcano. Domes of DC2 to DC4 are relatively large, smooth, and widely distributed, with forming lavas estimated to be of low viscosities and high effusion rates, representing magmatic activities varying from Imbrian to Eratosthenian in the northern Mare Tranquillitatis. Different morphometric properties of dome clusters combined with varied surface ages suggest multistage magmatic activities of both the Gardner volcano and its adjacent northern Mare Tranquillitatis. RAC-FCM in this study provides an independent way to select the representative features of dome clustering and improves our understanding of the relationship between domes and their local magma activities.
Height, FeO and TiO2 contents are also useful features for clustering if we consider the unique condition of data divisibility, and the clustering results are certainly consistent with previous studies using both spectral and morphometric properties [2]. The optimum combination (D, A, SV, and Slope) is selected by further considering a balance between sufficient clusters and dome numbers. Though H is not selected in this combination, its information is highly represented by other morphometric features (D, A and SV). FeO and TiO2 contents are not necessary for optimum dome classification in the study region, which is probably due to the large TiO2 variations (multiple melt sources with a wide range of TiO2 concentrations) for early mare eruptions (>2.6 Ga) in the Mare Tranquillitatis [27]. Future work will include an extension of our analysis to a larger number of mare domes in more volcanic complex regions with high-resolution remote-sensing datasets. Such analyses may help to gain more detailed insight into the global and regional magmatic activities.
Author Contributions
Conceptualization, Q.H. and J.Z.; methodology, Q.H. and Y.C.; software, Y.C.; validation, Q.H., Y.C. and J.Z.; writing—original draft preparation, Y.C.; writing—review and editing, Q.H., J.Z. and X.H.; visualization, Y.C.; supervision, Q.H. and X.H. All authors have read and agreed to the published version of the manuscript.
Funding
This research was funded by the National Natural Science Foundation of China (42030108, 42030205, 11403020, 41874010).
Institutional Review Board Statement
Not applicable.
Informed Consent Statement
Not applicable.
Data Availability Statement
Publicly available datasets were analyzed in this study. These data can be found here: http://l2db.selene.darts.isas.jaxa.jp/, https://pds-geosciences.wustl.edu/, accessed on 27 September 2019.
Acknowledgments
The authors would like to thank the two anonymous reviewers for constructive reviews and comments that helped improve the manuscript. We thank the SELENE (KAGUYA) TC team and the SELENE Data Archive for providing the SELENE (KAGUYA) data. SELENE is a Japanese mission developed and operated by JAXA.
Conflicts of Interest
The authors declare no conflict of interest.
Appendix A

Figure A1.
Graphs showing the variation of (a) height vs. diameter, (b) height vs. area, (c) height vs. surface volume, and (d) height vs. average flank Sof 54 domes in both the Gardner volcano and mare Tranquillitatis.
Figure A1.
Graphs showing the variation of (a) height vs. diameter, (b) height vs. area, (c) height vs. surface volume, and (d) height vs. average flank Sof 54 domes in both the Gardner volcano and mare Tranquillitatis.


Figure A2.
Graphs showing the variation of (a) FeO vs. TiO2, (b) diameter vs. TiO2, (c) area vs. TiO2, (d) surface volume vs. TiO2, (e) average flank slope vs. TiO2, (f) plastic viscosity vs. TiO2, (g) effusion rate vs. TiO2, and (h) duration vs. TiO2 of 54 domes in both the Gardner volcano and mare Tranquillitatis.

Table A1.
Morphometrical comparison of domes with corresponding locations.
Table A1.
Morphometrical comparison of domes with corresponding locations.
| Domes Identified in This Paper | Domes from Wöhler et al. [2] | Differences | |||||||||||
|---|---|---|---|---|---|---|---|---|---|---|---|---|---|
| No. | Lon. (°) | Lat. (°) | D (km) | H (m) | No.* | Lon. (°) | Lat. (°) | D (km) | H (m) | Lon. (°) | Lat. (°) | D (km) | H (m) |
| 21 | 30.75 | 14.34 | 10.89 | 380 | C8 | 30.72 | 14.40 | 12.50 | 270 | 0.03 | −0.06 | −1.61 | 110 |
| 25 | 35.89 | 14.21 | 7.20 | 137 | C7 | 35.86 | 14.18 | 8.50 | 110 | 0.03 | 0.03 | −1.30 | 27 |
| 40 | 27.46 | 18.98 | 2.75 | 126 | SC2 | 27.50 | 18.90 | 1.70 | 60 | −0.04 | 0.08 | 1.05 | 66 |
| 41 | 27.63 | 18.65 | 2.17 | 123 | SC1 | 27.60 | 18.60 | 2.30 | 72 | 0.03 | 0.05 | −0.13 | 51 |
| 42 | 31.92 | 10.71 | 7.21 | 82 | C6 | 31.97 | 10.76 | 7.70 | 50 | −0.05 | −0.05 | −0.49 | 32 |
| 43 | 33.04 | 10.54 | 9.46 | 135 | C5 | 33.02 | 10.56 | 11.10 | 100 | 0.02 | −0.02 | −1.64 | 35 |
| 44 | 20.77 | 9.26 | 6.66 | 108 | A6 | 20.79 | 9.22 | 9.50 | 50 | −0.02 | 0.04 | −2.84 | 58 |
| 45 | 20.92 | 8.96 | 9.81 | 121 | A5 | 20.96 | 8.88 | 8.40 | 45 | −0.04 | 0.08 | 1.41 | 76 |
| 46 | 21.25 | 8.55 | 11.49 | 141 | A4 | 21.27 | 8.65 | 11.10 | 65 | −0.02 | −0.10 | 0.39 | 76 |
| 47 | 36.95 | 8.50 | 10.05 | 96 | C4 | 36.78 | 8.85 | 13.30 | 50 | 0.17 | −0.35 | −3.25 | 46 |
| 48 | 22.05 | 7.71 | 4.69 | 123 | A1 | 21.96 | 7.66 | 5.60 | 45 | 0.09 | 0.05 | −0.91 | 78 |
| 49 | 21.60 | 7.55 | 22.72 | 498 | A2 | 21.70 | 7.56 | 25.40 | 330 | −0.10 | −0.01 | −2.68 | 168 |
| 50 | 36.78 | 7.51 | 11.61 | 320 | C3 | 36.73 | 7.58 | 17.00 | 190 | 0.05 | −0.07 | −5.39 | 130 |
| 51 | 34.48 | 7.24 | 4.19 | 54 | C9 | 34.66 | 7.06 | 13.30 | 15 | −0.18 | 0.18 | −9.11 | 39 |
| 52 | 38.32 | 7.23 | 10.81 | 142 | C2 | 38.32 | 7.23 | 12.20 | 125 | 0.00 | 0.00 | −1.39 | 17 |
| 53 | 37.62 | 7.13 | 6.00 | 80 | C1 | 37.48 | 7.11 | 8.10 | 25 | 0.14 | 0.02 | −2.10 | 55 |
| 54 | 19.97 | 6.13 | 16.28 | 332 | A3 | 20.07 | 6.24 | 23.60 | 270 | −0.10 | −0.11 | −7.32 | 62 |
No.* stands for dome numbers in Wöhler et al. [2]. Lon., Lat., D, H are representative of longitude, latitude, diameter, and height of domes.
Table A2.
Feature correlation coefficients of all the 54 domes.
Table A2.
Feature correlation coefficients of all the 54 domes.
| D (km) | A (km2) | H (m) | SV (km3) | Slope (°) | FeO (wt %) | TiO2 (wt %) | |
|---|---|---|---|---|---|---|---|
| D (km) | 1.00 | 0.95 | 0.78 | 0.58 | −0.45 | 0.13 | 0.22 |
| A (km2) | 0.95 | 1.00 | 0.92 | 0.65 | −0.28 | 0.14 | 0.24 |
| H (m) | 0.78 | 0.92 | 1.00 | 0.77 | −0.04 | 0.09 | 0.22 |
| SV (km3) | 0.58 | 0.65 | 0.77 | 1.00 | 0.38 | −0.13 | 0.03 |
| Slope (°) | −0.45 | −0.28 | −0.04 | 0.38 | 1.00 | −0.21 | −0.14 |
| FeO (wt %) | 0.13 | 0.14 | 0.09 | −0.13 | −0.21 | 1.00 | 0.94 |
| TiO2 (wt %) | 0.22 | 0.24 | 0.22 | 0.03 | −0.14 | 0.94 | 1.00 |
Table A3.
The significance level of the feature correlation coefficients of all the 54 domes.
Table A3.
The significance level of the feature correlation coefficients of all the 54 domes.
| D (km) | A (km2) | H (m) | SV (km3) | Slope (°) | FeO (wt %) | TiO2 (wt %) | |
|---|---|---|---|---|---|---|---|
| D (km) | 1.00 | 0.00 | 0.00 | 0.00 | 0.00 | 0.34 | 0.11 |
| A (km2) | 0.00 | 1.00 | 0.00 | 0.00 | 0.04 | 0.30 | 0.08 |
| H (m) | 0.00 | 0.00 | 1.00 | 0.00 | 0.76 | 0.50 | 0.11 |
| SV (km3) | 0.00 | 0.00 | 0.00 | 1.00 | 0.00 | 0.34 | 0.82 |
| Slope (°) | 0.00 | 0.04 | 0.76 | 0.00 | 1.00 | 0.12 | 0.33 |
| FeO (wt %) | 0.34 | 0.30 | 0.50 | 0.34 | 0.12 | 1.00 | 0.00 |
| TiO2 (wt %) | 0.11 | 0.08 | 0.11 | 0.82 | 0.33 | 0.00 | 1.00 |
References
- Lena, R.; Wöhler, C.; Phillips, J.; Chiocchetta, M.T. Lunar Domes: Properties and Formation Processes; Springer: Mailand, Italy, 2013. [Google Scholar]
- Wöhler, C.; Lena, R.; Lazzarotti, P.; Phillips, J.; Wirths, M.; Pujic, Z.; Geologic Lunar Research (GLR) Group. A combined spectrophotometric and morphometric study of the lunar mare dome fields near Cauchy, Arago, Hortensius, and Milichius. Icarus 2006, 183, 237–264. [Google Scholar] [CrossRef]
- Wöhler, C.; Lena, R.; Phillips, J. Formation of lunar mare domes along crustal fractures: Rheologic conditions, dimensions of feeder dikes, and the role of magma evolution. Icarus 2007, 189, 279–307. [Google Scholar] [CrossRef]
- Wöhler, C.; Lena, R. Lunar intrusive domes: Morphometric analysis and laccolith modelling. Icarus 2009, 204, 381–398. [Google Scholar] [CrossRef]
- Wilson, L.; Head, J.W. Generation, ascent and eruption of magma on the Moon: New insights into source depths, magma supply, intrusions and effusive/explosive eruptions (Part 1: Theory). Icarus 2017, 283, 146–175. [Google Scholar] [CrossRef]
- Head, J.W.; Gifford, A. Lunar mare domes: Classification and modes of origin. Moon Planets 1980, 22, 235. [Google Scholar] [CrossRef]
- Lena, R.; Wöhler, C.; Phillips, J.; Wirths, M.; Bregante, M.T. Lunar domes in the Doppelmayer region: Spectrophotometry, morphometry, rheology, and eruption conditions. Planet. Space Sci. 2007, 55, 1201–1217. [Google Scholar] [CrossRef]
- Lena, R.; Wöhler, C.; Bregante, M.T.; Lazzarotti, P.; Lammel, S. Lunar domes in Mare Undarum: Spectral and morphometric properties, eruption conditions, and mode of emplacement. Planet. Space Sci. 2008, 56, 553. [Google Scholar] [CrossRef]
- Zhao, J.N.; Xiao, L.; Qiao, L.; Glotch, T.D.; Huang, Q. The Mons Rumker volcanic complex of the Moon: A candidate landing site for the Chang’E-5 mission. J. Geophys. Res. Planets 2017, 122, 1419–1442. [Google Scholar] [CrossRef]
- Arya, A.S.; Rajasekhar, R.P.; Sur, K.; Krishna, B.G.; Suresh, K.; Srinivasan, T.P.; Iyer, K.V.; Chauhan, P.; Ajai; Kumar, A.S.K.; et al. Morphometric and rheological study of lunar domes of Marius Hills volcanic complex region using Chandrayaan-1 and recent datasets. J. Earth Syst. Sci. 2018, 127, 70. [Google Scholar] [CrossRef]
- Schnuriger, N.; Flahaut, J.; Martinot, M.; Chevrel, S.D. Long-lived volcanism expressed through mare infilling, domes and IMPs in the Arago region of the Moon. Planet. Space Sci. 2020, 185. [Google Scholar] [CrossRef]
- Whitford-Stark, J.L.; Head, J.W. The Procellarum volcanic complexes: Contrasting styles of volcanism. In Proceedings of the Lunar Planetary Science Conference, Houston, TX, USA, 1 January 1977; p. 2705. [Google Scholar]
- Weitz, C.M.; Head, J.W. Spectral properties of the Marius Hills volcanic complex and implications for the formation of lunar domes and cones. J. Geophys. Res. Planets 1999, 104, 18933–18956. [Google Scholar] [CrossRef]
- Baratoux, D.; Pinet, P.; Toplis, M.J.; Mangold, N.; Greeley, R.; Baptista, A.R.J.J.o.V.; Research, G. Shape, rheology and emplacement times of small martian shield volcanoes. J. Volcanol. Geotherm. Res. 2009, 185, 47–68. [Google Scholar] [CrossRef]
- Huang, Q.; Zhao, J.; Wang, X.; Wang, T.; Zhang, F.; Qiao, L.; Chen, Y.; Qiu, D.; Yang, Y.; Xiao, L. A large long-lived central-vent volcano in the Gardner region: Implications for the volcanic history of the nearside of the Moon. Earth Planet. Sci. Lett. 2020, 542, 116301. [Google Scholar] [CrossRef]
- Bezdek, J.C. Pattern Recognition with Fuzzy Objective Function Algorithms; Springer: Boston, MA, USA, 1981. [Google Scholar]
- Mok, P.Y.; Huang, H.Q.; Kwok, Y.L.; Au, J.S. A robust adaptive clustering analysis method for automatic identification of clusters. Pattern Recognit. 2012, 45, 3017–3033. [Google Scholar] [CrossRef]
- Wilson, L.; Head, J.W. Lunar Gruithuisen and Mairan domes: Rheology and mode of emplacement. J. Geophys. Res. Planets 2003, 108, 5012. [Google Scholar] [CrossRef]
- Haruyama, J.; Ohtake, M.; Matsunaga, T.; Morota, T.; Honda, C.; Yokota, Y.; Abe, M.; Ogawa, Y.; Miyamoto, H.; Iwasaki, A.; et al. Long-Lived Volcanism on the Lunar Farside Revealed by SELENE Terrain Camera. Science 2009, 323, 905–908. [Google Scholar] [CrossRef] [PubMed]
- Lucey, P.G.; Blewett, D.T.; Jolliff, B. Lunar iron and titanium abundance algorithms based on final processing of Clementine UVVIS data. J. Geophys. Res. Planets 2000, 105, 20297–20305. [Google Scholar] [CrossRef]
- Tye, A.R.; Head, J.W. Mare Tranquillitatis: Distribution of Mare Domes, Relation to Broad Mare Rise, and Evidence of a Previously Unrecognized Basin from LOLA Altimetric Data. In Proceedings of the Lunar and Planetary Science Conference XLIV, Houston, TX, USA, 1 March 2013. [Google Scholar]
- Lucey, P.G.; Taylor, G.J.; Malaret, E. Abundance and Distribution of Iron on the Moon. Science 1995, 268, 1150. [Google Scholar] [CrossRef]
- Lawrence, D.J.; Feldman, W.C.; Elphic, R.C.; Little, R.C.; Prettyman, T.H.; Maurice, S.; Lucey, P.G.; Binder, A.B. Iron abundances on the lunar surface as measured by the Lunar Prospector gamma-ray and neutron spectrometers. J. Geophys. Res. Planets 2002, 107, 13-11–13-26. [Google Scholar] [CrossRef]
- Jerde, E.A.; Snyder, G.A.; Taylor, L.A.; Liu, Y.G.; Schmitt, R.A. The origin and evolution of lunar high-Ti basalts: Periodic melting of a single source at Mare Tranquillitatis. Geochim. Et Cosmochim. Acta 1994, 58, 515–527. [Google Scholar] [CrossRef]
- Kodama, S.; Yamaguchi, Y. Lunar mare volcanism in the eastern nearside region derived from Clementine UV/VIS data. Meteorit. Planet. Sci. 2003, 38, 1461–1484. [Google Scholar] [CrossRef]
- Rajmon, D.; Spudis, P. Distribution and stratigraphy of basaltic units in Maria Tranquillitatis and Fecunditatis: A Clementine perspective. Meteorit. Planet. Sci. 2004, 39, 1699–1720. [Google Scholar] [CrossRef]
- Sato, H.; Robinson, M.S.; Lawrence, S.J.; Denevi, B.W.; Hapke, B.; Jolliff, B.L.; Hiesinger, H. Lunar mare TiO2 abundances estimated from UV/Vis reflectance. Icarus 2017, 296, 216–238. [Google Scholar] [CrossRef]
- Giguere, T.A.; Taylor, G.J.; Hawke, B.R.; Lucey, P.G. The titanium contents of lunar mare basalts. Meteorit. Planet. Sci. 2000, 35, 193–200. [Google Scholar] [CrossRef]
- Neal, C.R.; Taylor, L.A. Petrogenesis of mare basalts: A record of lunar volcanism. Geochim. Et Cosmochim. Acta 1992, 56, 2177–2211. [Google Scholar] [CrossRef]
- Grosse, P.; Kervyn, M. Morphometry of terrestrial shield volcanoes. Geomorphology 2018, 304, 1–14. [Google Scholar] [CrossRef]
- Halkidi, M.; Batistakis, Y.; Vazirgiannis, M. On clustering validation techniques. J. Intell. Inf. Syst. 2001, 17, 107–145. [Google Scholar] [CrossRef]
- Wang, Y.N.; Li, C.S.; Zuo, Y. A Selection Model for Optimal Fuzzy Clustering Algorithm and Number of Clusters Based on Competitive Comprehensive Fuzzy Evaluation. IEEE Trans. Fuzzy Syst. 2009, 17, 568–577. [Google Scholar] [CrossRef]
- Yang, M.S.; Nataliani, Y. Robust-learning fuzzy c-means clustering algorithm with unknown number of clusters. Pattern Recognit. 2017, 71, 45–59. [Google Scholar] [CrossRef]
- Bezdek, J.C.; Ehrlich, R.; Full, W. FCM: The fuzzy c-means clustering algorithm. Comput. Geosci. 1984, 10, 191–203. [Google Scholar] [CrossRef]
- Pakhira, M.K.; Bandyopadhyay, S.; Maulik, U. A study of some fuzzy cluster validity indices, genetic clustering and application to pixel classification. Fuzzy Sets Syst. 2005, 155, 191–214. [Google Scholar] [CrossRef]
- Press, W.H.; Teukolsky, S.A.; Vetterling, W.T.; Flannery, B.P. Numerical Recipes in C, 2nd ed.; Cambridge University Press: Cambridge, UK; New York, NY, USA, 1992. [Google Scholar]
- Hiesinger, H.; Jaumann, R.; Neukum, G.; Head, J.W. Ages of mare basalts on the lunar nearside. J. Geophys. Res. Planets 2000, 105, 29239–29275. [Google Scholar] [CrossRef]
- Urbanowicz, R.J.; Meeker, M.; La Cava, W.; Olson, R.S.; Moore, J.H. Relief-based feature selection: Introduction and review. J. Biomed. Inform. 2018, 85, 189–203. [Google Scholar] [CrossRef] [PubMed]
- Guyon, I.; Elisseeff, A. An introduction to variable and feature selection. J. Mach. Learn. Res. 2003, 3, 1157–1182. [Google Scholar] [CrossRef]
- Wieczorek, M.A.; Neumann, G.A.; Nimmo, F.; Kiefer, W.S.; Taylor, G.J.; Melosh, H.J.; Phillips, R.J.; Solomon, S.C.; Andrews-Hanna, J.C.; Asmar, S.W.; et al. The Crust of the Moon as Seen by GRAIL. Science 2013, 339, 671–675. [Google Scholar] [CrossRef]
- Wilhelms, D.E. Geologic Map of the Taruntius Quadrangle of the Moon; Technical Report; U.S. Geol. Survey Map I-722: Washington, DC, USA, 1972.
- Ernst, R.; Grosfils, E.; Mège, D. Giant Dike Swarms: Earth, Venus, and Mars. Annu. Rev. Earth Planet. Sci. 2001, 29, 489–534. [Google Scholar] [CrossRef]
- Andrews-Hanna, J.C.; Besserer, J.; Head Iii, J.W.; Howett, C.J.A.; Kiefer, W.S.; Lucey, P.J.; McGovern, P.J.; Melosh, H.J.; Neumann, G.A.; Phillips, R.J.; et al. Structure and evolution of the lunar Procellarum region as revealed by GRAIL gravity data. Nature 2014, 514, 68–71. [Google Scholar] [CrossRef] [PubMed]
- Michaut, C.; Pinel, V. Magma Ascent and Eruption Triggered by Cratering on the Moon. Geophys. Res. Lett. 2018, 45, 6408–6416. [Google Scholar] [CrossRef]
- Galgana, G.A.; McGovern, P.J.; Grosfils, E.B. Evolution of large Venusian volcanoes: Insights from coupled models of lithospheric flexure and magma reservoir pressurization. J. Geophys. Res. Planets 2011, 116. [Google Scholar] [CrossRef]


Publisher’s Note: MDPI stays neutral with regard to jurisdictional claims in published maps and institutional affiliations. |
© 2021 by the authors. Licensee MDPI, Basel, Switzerland. This article is an open access article distributed under the terms and conditions of the Creative Commons Attribution (CC BY) license (http://creativecommons.org/licenses/by/4.0/).