
Contribution to the Research of the Effects of Etna Volcano Activity on the Features of the Ionospheric Total Electron Content Behaviour


Abstract
1. Introduction
2. Background
2.1. TEC Features and the Ionospheric Response to Solar Activity
2.2. Specific Parameters of the Volcanic Activity
3. Research Methodology
3.1. Mitigation of Short-Term Solar Activity and Other Non-Local Factors’ Impact on TEC Behaviour
3.2. Determination of Specific Parameters of the Volacno Activity and Ionospheric TEC Features’ Behaviour Relation
4. Structural-Analytical Presentation of the Research Results
5. Brief Overview of the Results’ Specifics
6. Conclusions
Author Contributions
Funding
Acknowledgments
Conflicts of Interest
Abbreviations
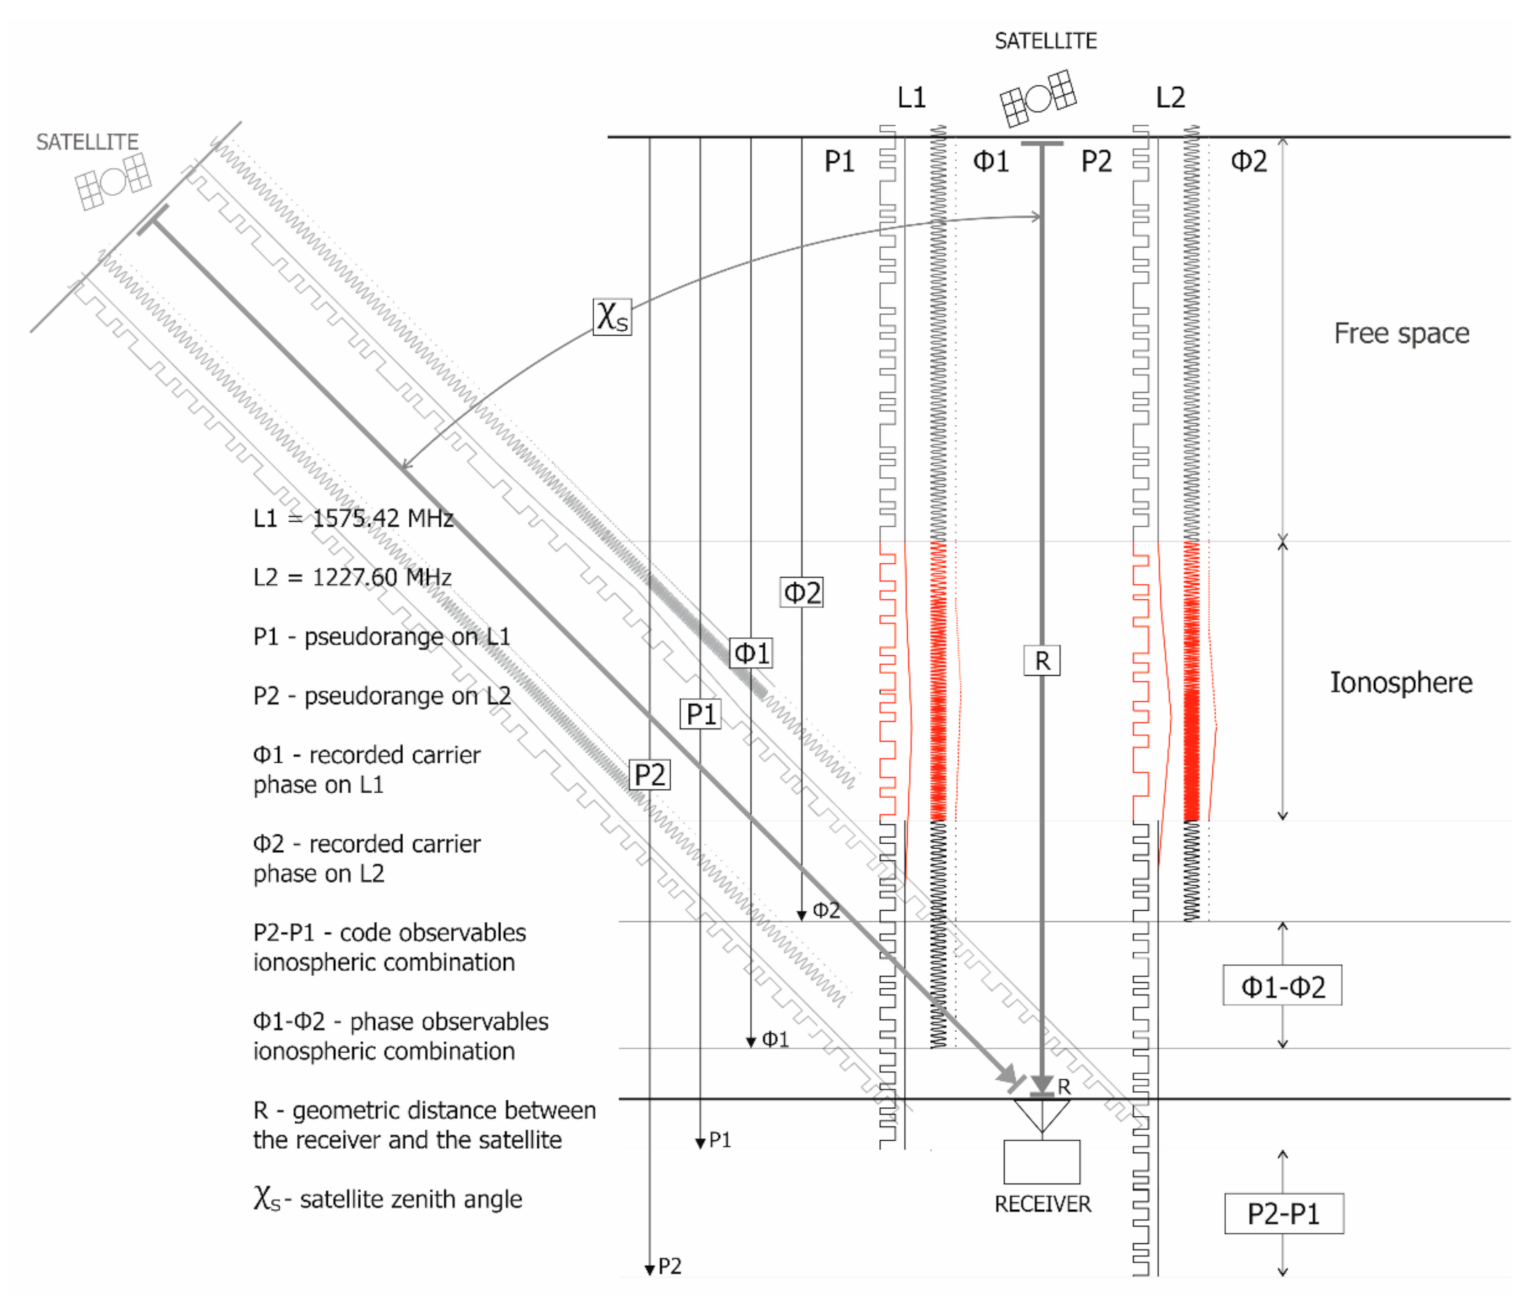
| TEC | Total Electron Content |
| TECu | TEC unit |
| STEC | Slant TEC |
| sfu | Solar radio flux |
| GNSS | Global Navigation Satellite System |
| LAIC | Lithosphere–Atmosphere–Ionosphere Coupling |
| GEC | Global Electrical Circuit |
| VEI4+ | Volcanic Explosivity Index 4+ |
| MIROVA | Middle InfraRed Observation of Volcanic Activity |
| rDCB | Receiver Differential Code Bias |
| TGD | Total Group Delay |
| VRP | Volcanic Radiative Power |
| VAI | Volcanic Activity Increase |
| GIM | Global Ionospheric Maps |
| IGS | International GNSS Service |
| NAD | Non-Active Days |
| FFT | Fast Fourier Transform |
References
- Pulinets, S.; Ouzounov, D. The Possibility of Earthquake Forecasting; IOP Publishing: Bristol, UK, 2018. [Google Scholar]
- Parkinson, B.W.; Spilker, J.J., Jr.; Axelrad, P.; Enge, P. Global Positioning System: Theory and Applications; American Institute of Aeronautics and Astronautics: Washington, DC, USA, 1996; Volume 2. [Google Scholar]
- Klobuchar, J.A. Ionospheric Effects on GPS. In Global Positioning System: Theory and Applications; Parkinson, B.W., Spilker, J.J., Eds.; American Institute of Aeronautics & Astronautics: Reston, VA, USA, 1996; Volume 1, pp. 485–515. [Google Scholar]
- Pulinets, S.; Boyarchuk, K. Ionospheric Precursors of Earthquakes; Springer: Berlin, Germany, 2005. [Google Scholar]
- Pulinets, S.; Ouzounov, D. Lithosphere–Atmosphere–Ionosphere Coupling (LAIC) model—An unified concept for earthquake precursors validation. J. Asian Earth Sci. 2010, 41, 371–382. [Google Scholar] [CrossRef]
- James, M.R.; Wilson, L.; Lane, S.; Gilbert, J.S.; Mather, T.A.; Harrison, R.G.; Martin, R.S. Electrical Charging of Volcanic Plumes. Space Sci. Rev. 2008, 137, 399–418. [Google Scholar] [CrossRef]
- Mather, T.A.; Harrison, R.G. Electrification of volcanic plumes. Surv. Geophys. 2006, 27, 387–432. [Google Scholar] [CrossRef]
- Kamsali, N.; Prasad, B.S.N.; Datta, J. The Electrical Conductivity as an Index of Air Pollution in the Atmosphere. In Advanced Air Pollution; Nejadkoorki, F., Ed.; Tech Open: Shangai, China, 2011; pp. 365–390. [Google Scholar]
- Williams, E.R. The global electrical circuit: A review. Atmos. Res. 2009, 91, 140–152. [Google Scholar] [CrossRef]
- Bering, E.A.; Few, A.A.; Benbrook, J.R. The Global Electric Circuit. Phys. Today 1998, 51, 24–30. [Google Scholar] [CrossRef]
- Roble, R.G.; Tzur, I. The Global Atmospheric Electrical Circuit. In Study in Geophysics: The Earth’s Electrical Enviroment; National Academy Press: Washington, DC, USA, 1986; pp. 206–231. [Google Scholar]
- Roble, R.G. On Modeling Component Processes in the Earth’s Global Electric Circuit. J. Atmos. Sol.-Terr. Phys. 1991, 53, 831–847. [Google Scholar] [CrossRef]
- Richmond, A.D. Modeling the ionosphere wind dynamo: A review. Pure Appl. Geophys. 1989, 131, 413–435. [Google Scholar] [CrossRef]
- Akasofu, S.I. The solar wind-magnetosphere dynamo and the magnetospheric substorm. Planet. Space Sci. 1975, 23, 817–823. [Google Scholar] [CrossRef]
- Harrison, R.G.; Aplin, K.L.; Rycroft, M.J. Atmospheric Electricity Coupling Between Earthquake Regions and the Ionosphere. J. Atmos. Sol.-Terr. Phys. 2010, 72, 376–381. [Google Scholar] [CrossRef]
- Tramutoli, V.; Marchese, F.; Falconieri, A.; Filizzola, C.; Genzano, N.; Hattori, K.; Lisi, M.; Liu, J.Y.; Ouzounov, D.; Parrot, M.; et al. Tropospheric and Ionospheric Anomalies Induced by Volcanic and Saharan Dust Events as Part of Geosphere Interaction Phenomena. Geosciences 2019, 9, 177. [Google Scholar] [CrossRef]
- Li, W.; Guo, J.; Yue, J.; Shen, Y.; Yang, Y. Total electron content anomalies associated with global VEI4+ volcanic eruptions during 2002–2015. J. Volcanol. Geotherm. Res. 2016, 325, 98–109. [Google Scholar] [CrossRef]
- Shults, K.; Astafyeva, E.; Adourian, S. Ionospheric detection and localization of volcano eruptions on the example of the April 2015 Calbuco events. J. Geophys. Res. Space Phys. 2016, 121, 10303–10315. [Google Scholar] [CrossRef]
- Zlotnicki, J.; Li, F.; Parrot, M. Signals recorded by DEMETER satellite over active volcanoes during the period 2004 August–2007 December. Geophys. J. Int. 2010, 183, 1332–1347. [Google Scholar] [CrossRef]
- Zlotnicki, J.; Li, F.; Parrot, M. Ionospheric Disturbances Recorded by DEMETER Satellite over Active Volcanoes: From August 2004 to December 2010. Int. J. Geophys. 2013, 2013, 1–18. [Google Scholar] [CrossRef]
- Jukić, O.; Sikirica, N.; Rumora, I.; Filić, M. Seven days in Chile: Impact of the 2011 Puyehue-Cordon Caulle volcanic eruption on GPS ionospheric delay. In Proceedings of the International Symposium on Global Navigation Satellite System 2018 (ISGNSS 2018), Bali, Indonesia, 21–23 November 2018; Wijaya, D.D., Ed.; p. 1. Available online: https://www.e3s-conferences.org/articles/e3sconf/abs/2019/20/contents/contents.html (accessed on 12 February 2019).
- Cahyadi, N.M.; Rahayu, R.W.; Heki, K.; Nakashima, Y. Harmonic ionospheric oscillation by the 2010 eruption of the Merapi volcano, Indonesia, and the relevance of its amplitude to the mass eruption rate. J. Volcanol. Geotherm. Res. 2020, 405, 1–8. [Google Scholar] [CrossRef]
- Tahira, M. Acoustic resonance of the atmospheric at 3.7 mHz. J. Atmos. Sci. 1995, 52, 2670–2674. [Google Scholar] [CrossRef]
- Dow, J.M.; Neilan, R.E.; Rizos, C. The International GNSS Service in a changing landscape of Global Navigation Satellite Systems. J. Geod. 2009, 83, 191–198. [Google Scholar] [CrossRef]
- Liu, L.; Wan, W.; Chen, Y.; Le, H. Solar activity effects of the ionosphere: A brief review. Chin. Sci. Bull. 2011, 56, 1202–1211. [Google Scholar] [CrossRef]
- Kutiev, I.; Tsagouri, I.; Perrone, L.; Pancheva, D.; Mukhtarov, P.; Mikhailov, A.; Lastovicka, J.; Jakowski, N.; Buresova, D.; Blanch, E.; et al. Solar activity impact on the Earth’s upper atmosphere. J. Space Weather Space Clim. 2013, 3, 1–21. [Google Scholar] [CrossRef]
- Zolesi, B.; Cander, L.R. Ionospheric Prediction and Forecasting; Springer: New York, NY, USA, 2014. [Google Scholar]
- Schunk, R.; Nagy, A. Ionospheres: Physics, Plasma Physics and Chemistry, 2nd ed.; Cambridge University Press: Cambridge, UK, 2009. [Google Scholar]
- Tapping, K.F. The 10.7 cm solar radio flux (F10.7). Space Weather 2013, 11, 394–406. [Google Scholar] [CrossRef]
- Stone, E.; Frandsen, A.; Mewaldt, R.; Christian, E.R.; Margolies, D.; Ormes, J.F.; Snow, F. The Advanced Composition Explorer. Space Sci. Rev. 1998, 86, 1–22. [Google Scholar] [CrossRef]
- Covington, A.E.; Harvey, G.A. Impulsive and long-enduring sudden enhancements of solar radio emission at 10 centimeter wavelength. J. R. Astron. Soc. Can. 1958, 52, 161–166. [Google Scholar]
- Hathaway, D.H. The Solar Cycle; Springer Nature: Cham, Switzerland, 2010. [Google Scholar]
- Bartels, J.; Heck, N.H.; Johnston, H.F. The three-hour-range index measuring geomagnetic activity. J. Geophys. Res. 1939, 44, 411–454. [Google Scholar] [CrossRef]
- Thomsen, M.F. Why Kp is such a good measure of magnetospheric convection. Space Weather 2004, 2, 1–10. [Google Scholar] [CrossRef]
- Menvielle, M.; Berthelier, A. The K-derived planetary indices: Description and availability. Rev. Geophys. 1991, 29, 415–432. [Google Scholar] [CrossRef]
- Chapman, S.; Bartels, J. Geomagnetism; Oxford University Press: Oxford, UK, 1940. [Google Scholar]
- Klobuchar, J.A. Ionospheric corrections for timing applications. In Proceedings of the 20th Annual Precise Time and Time Interval (PTTI) Application and Planning Meeting, Vienna, Virginia, 7–9 December 1988; Naval Observatory: Washington, DC, USA, 1988; pp. 193–204. [Google Scholar]
- Kintner, P.M.; Ledvina, B. The ionosphere, radio navigation and global navigation satellite systems. Adv. Space. Res. 2005, 35, 788–811. [Google Scholar] [CrossRef]
- Petrovski, I.; Tsujii, T. Digital Satellite Navigation and Geophysics; Cambridge University Press: Cambridge, UK, 2012. [Google Scholar]
- Liu, J.Y.; Tsai, H.F.; Jung, T.K. The IGS VTEC maps: A reliable source of ionospheric information since 1998. J. Geod. 2009, 83, 263–275. [Google Scholar]
- Liu, J.Y.; Tsai, H.F.; Jung, T.K. Total Electron Content Obtained by Using the Global Positioning System. Terr. Atmos. Ocean Sci. 1996, 7, 107–117. [Google Scholar] [CrossRef]
- Kouba, J. A Guide to Using International GNSS Service (IGS) Products; IGS Central Bureau: Pasadena, CA, USA, 2009. [Google Scholar]
- Schaer, S. Mapping and Predicting the Earth’s Ionosphere Using the Global Positioning System; Institut für Geodäsie und Photogrammetrie, Eidg. Technische Hochschule Zürich: Zürich, Switzerland, 1999. [Google Scholar]
- Subirana, J.S.; Zornoza, J.M.J.; Hernandez-Pajares, M. GNSS Data Processing, Volume I: Fundamentals and Algorithms; ESA Communications: Noordwijk, The Netherlands, 2013. [Google Scholar]
- Dyrud, L.; Jovancevic, A.; Brown, A.; Wilson, D.; Ganguly, S. Ionospheric measurement with GPS: Receiver techniques and methods. Radio Sci. 2008, 43, 1–11. [Google Scholar] [CrossRef]
- Bonaccorso, A.; Bonforte, A.; Calvari, S.; Del Negro, C.; Di Grazia, G.; Ganci, G.; Neri, M.; Vicari, A.; Boschi, E. The initial phases of the 2008–2009 Mount Etna eruption: A multidisciplinary approach for hazard assessment. J. Geophys. Res. 2011, 116, B03203. [Google Scholar] [CrossRef]
- Spampinato, L.; Calvari, S.; Oppenheimer, C.; Boschi, E. Volcano surveillance using infrared cameras. Earth Sci. Rev. 2011, 106, 63–91. [Google Scholar] [CrossRef]
- Blackett, M. An overview of infrared remote sensing of volcanic activity. J. Imaging 2017, 3, 13. [Google Scholar] [CrossRef]
- Fisher, W.A.; Mozham, R.M.; Polcyn, F.; Landis, G.H. Infrared surveys of Hawaiian Volcanoes. Science 1964, 146, 733–742. [Google Scholar] [CrossRef]
- Gawarecki, S.J.; Lyon, R.J.P.; Nordberg, W. Infrared spectral returns and imagery of the Earth from space and their application to geological problems: Scientific experiments for manned orbital flight. Am. Astronaut. Soc. Sci. Technol. 1965, 4, 13–133. [Google Scholar]
- Harris, A.J.L. Thermal Remote Sensing of Active Volcanoes: A User’s Manual; Cambridge University Press: Cambridge, UK, 2013. [Google Scholar]
- Coppola, D.; Laiolo, M.; Cigolini, C.; Massimetti, F.; Donne, D.D.; Ripepe, M.; Arias, H.; Barsotti, S.; Parra, C.B.; Centeno, R.G.; et al. Thermal Remote Sensing for Global Volcano Monitoring: Experiences from the MIROVA system. Front. Earth Sci. 2020, 7, 1–21. [Google Scholar] [CrossRef]
- Ganci, G.; Vicari, A.; Fortuna, L.; Del Negro, C. The HOTSAT volcano monitoring system based on a combined use of SEVIRI and MODIS multispectral data. Ann. Geophys. 2011, 54, 544–550. [Google Scholar]
- Coppola, D.; Laiolo, M.; Cigolini, C.; Delle Donne, D.; Ripepe, M. Enhanced volcanic hot-spot detection using MODIS IR data: Results from the MIROVA system. Geol. Soc. Spec. Publ. 2016, 426, 181–205. [Google Scholar] [CrossRef]
- Coppola, D.; Laiolo, M.; Massimetti, F.; Cigolini, C. Monitoring endogenous growth of open-vent volcanoes by balancing thermal and SO2 emissions data derived from space. Sci. Rep. 2019, 9, 1–12. [Google Scholar] [CrossRef]
- Toller, G.N.; Isaacman, A.; Kuyper, J. MODIS Level 1B Product User’s Guide; Members of the MODIS Characterization Support Team for NASA/Goddard Space Flight Center: Greenbelt, MD, USA, 2009; pp. 1–57. [Google Scholar]
- MIROVA. A Collaborative Project between the Universities of Turin and Florence (Italy). 2020. Available online: http://www.mirovaweb.it (accessed on 13 January 2020).
- International GNSS Service (IGS). Access to Products. 2020. Available online: https://kb.igs.org/hc/en-us/articles/115003935351-Access-to-Products (accessed on 1 July 2020).
- NASA, Goddard Space Flight Center. Coordinated Data Analysis Web (CDAWeb). 2020. Available online: https://cdaweb.gsfc.nasa.gov/istp_public (accessed on 13 March 2020).
- Coppola, D.; Laiolo, M.; Piscopo, D.; Cigolini, C. Rheological control on the radiant density of active lava flows and domes. J. Volcanol. Geotherm. Res. 2013, 249, 39–48. [Google Scholar] [CrossRef]
- Gurtner, W.; Estey, L. RINEX: The Receiver Independent Exchange Format. V3.01; IGS Central Bureau: Pasadena, CA, USA, 2009; pp. 1–100. [Google Scholar]
- Krishna, S.G. GPS-TEC Analysis Software Version 2.9. 2017. Available online: http://seemala.blogspot.in/ (accessed on 21 March 2019).
- Ren, X.; Zhang, X.; Weiliang, X.; Zhang, K.; Yuan, Y.; Li, X. Global Ionospheric Modelling using Multi-GNSS: BeiDou, Galileo, GLONASS and GPS. Sci. Rep. 2016, 6, 1–11. [Google Scholar] [CrossRef]
- Brčić, D. A Model of Non-Specific Daily Pattern of the Satellite Positioning Signal Ionospheric Delay. Ph.D. Thesis, Faculty of Maritime Studies, University of Rijeka, Rijeka, Croatia, 30 April 2015. Available online: https://repository.pfri.uniri.hr/en/islandora/object/pfri%3A175 (accessed on 13 May 2020).
- Brčić, D.; Filjar, R.; Kos, S.; Valčić, M. On Global Ionospheric Maps based winter-time ionospheric delay with reference to the Klobuchar model: Case study of the Northern Adriatic. Pomorstvo 2019, 33, 210–221. [Google Scholar] [CrossRef]
- Astronomical Institute of the University of Berne, Center for Orbit Determination in Europe (AIUB CODE). Differential Code Bias IONEX DCB Files. 2020. Available online: Ftp://ftp.aiub.unibe.ch/CODE/ (accessed on 14 February 2019).
- Xiang, Y.; Yang, G. An Enhanced Mapping Function with Ionospheric Varying Height. Remote Sens. 2019, 11, 1497. [Google Scholar] [CrossRef]
- Otsuka, Y.; Suzuki, K.; Nakagawa, S.; Nishioka, M.; Shiokawa, K.; Tsugawa, T. GPS observations of medium-scale traveling ionospheric disturbances over Europe. Ann. Geophys. 2013, 31, 163–172. [Google Scholar] [CrossRef]
- Hunsucker, R. Atmospheric gravity waves generated in the high-latitude ionosphere: A review. Rev. Geophys. 1982, 20, 293–315. [Google Scholar] [CrossRef]
- Kaso, A. Computation of the normalized cross-correlation by fast Fourier transform. PLoS ONE 2018, 13, e0203434. [Google Scholar] [CrossRef] [PubMed]
- Goldblum, C.E.; Ritter, R.C.; Gillies, G.T. Using the fast Fourier transform to determine the period of a physical oscillator with precision. Rev. Sci. Instrum. 1988, 59, 778–782. [Google Scholar] [CrossRef]
- Brigham, E.O.; Morrow, R.E. The fast Fourier transform. IEEE Spectr. 1967, 4, 63–70. [Google Scholar] [CrossRef]


| Criteria | VRP Threshold Value | Number of Days that Satisfy Criteria with Daily VRP Increase | ||||
|---|---|---|---|---|---|---|
| 5% | 15% | 25% | 35% | 45% | ||
| A | >1 × 10⁸ W | 445 | 402 | 350 | 293 | 226 |
| B | >4 × 10⁸ W | 260 | 236 | 201 | 167 | 121 |
| C | >8 × 10⁸ W | 172 | 156 | 131 | 111 | 78 |
| Crit | Mean | Median | St dev | Max | Min | |||||||||||
|---|---|---|---|---|---|---|---|---|---|---|---|---|---|---|---|---|
| Station | S | NI | NO | S | NI | NO | S | NI | NO | S | NI | NO | S | NI | NO | |
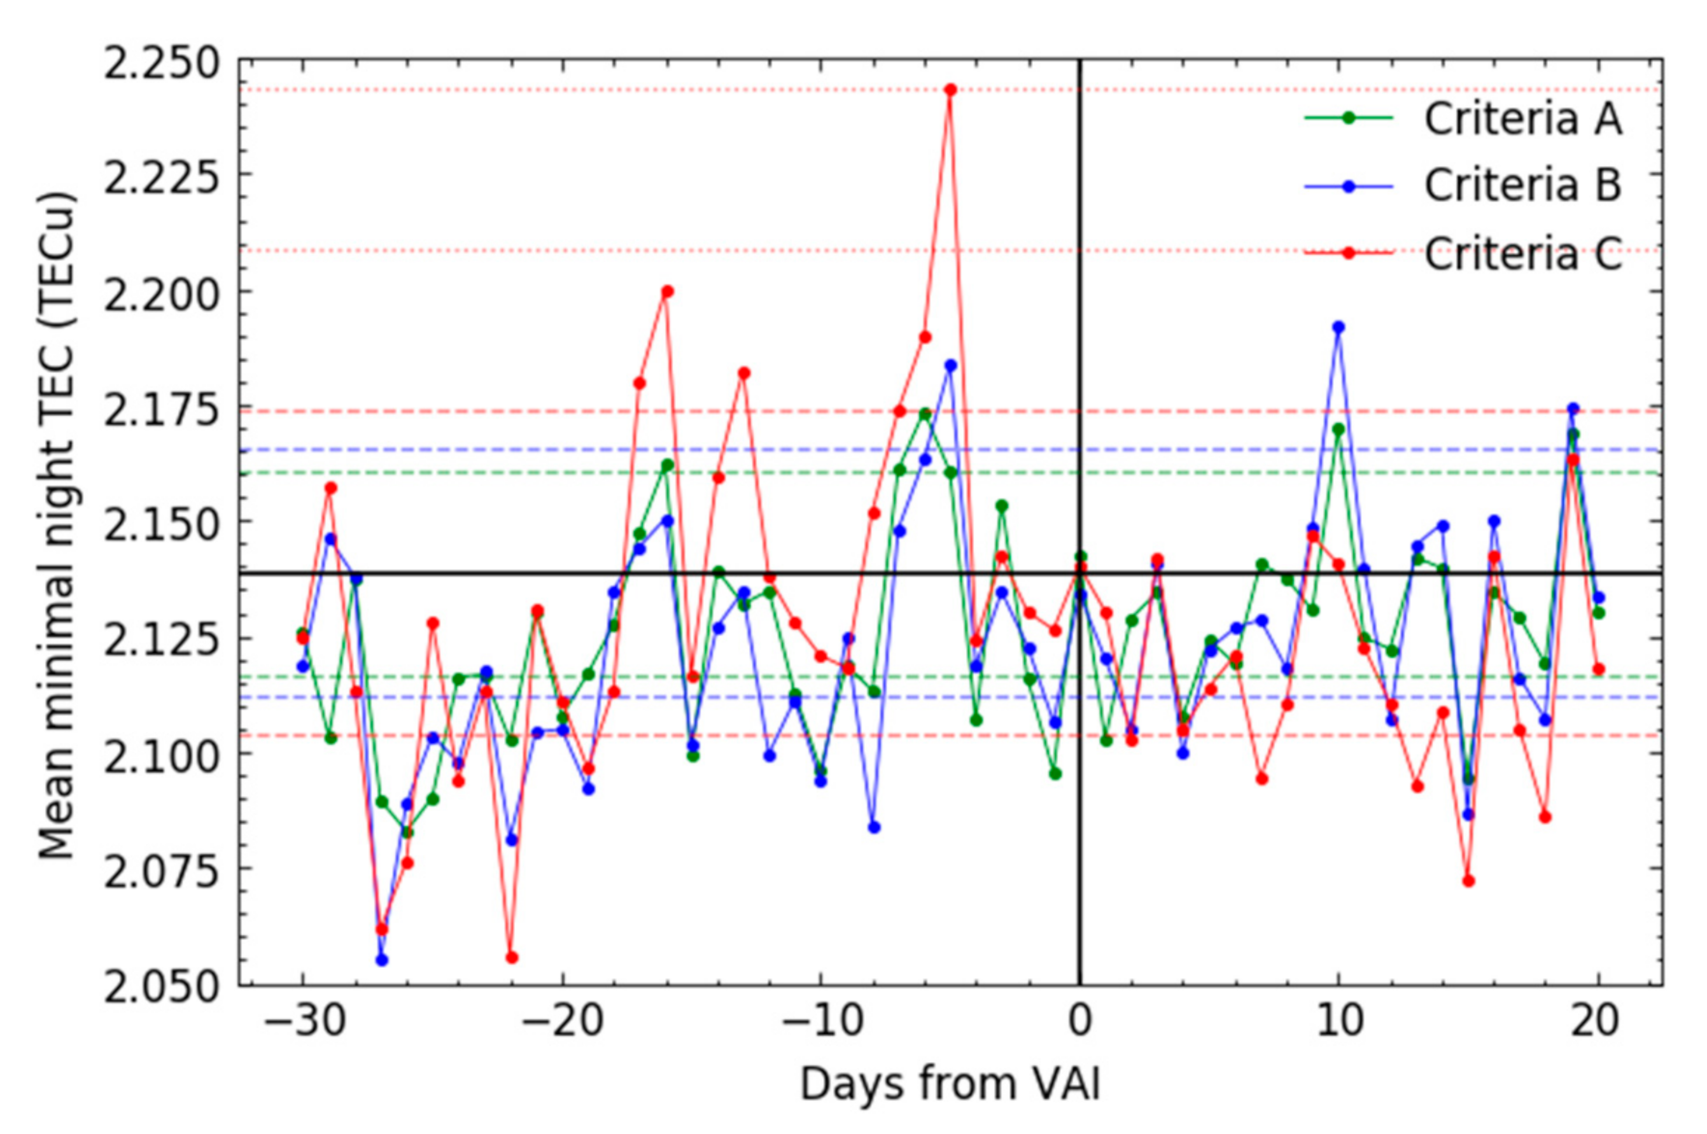
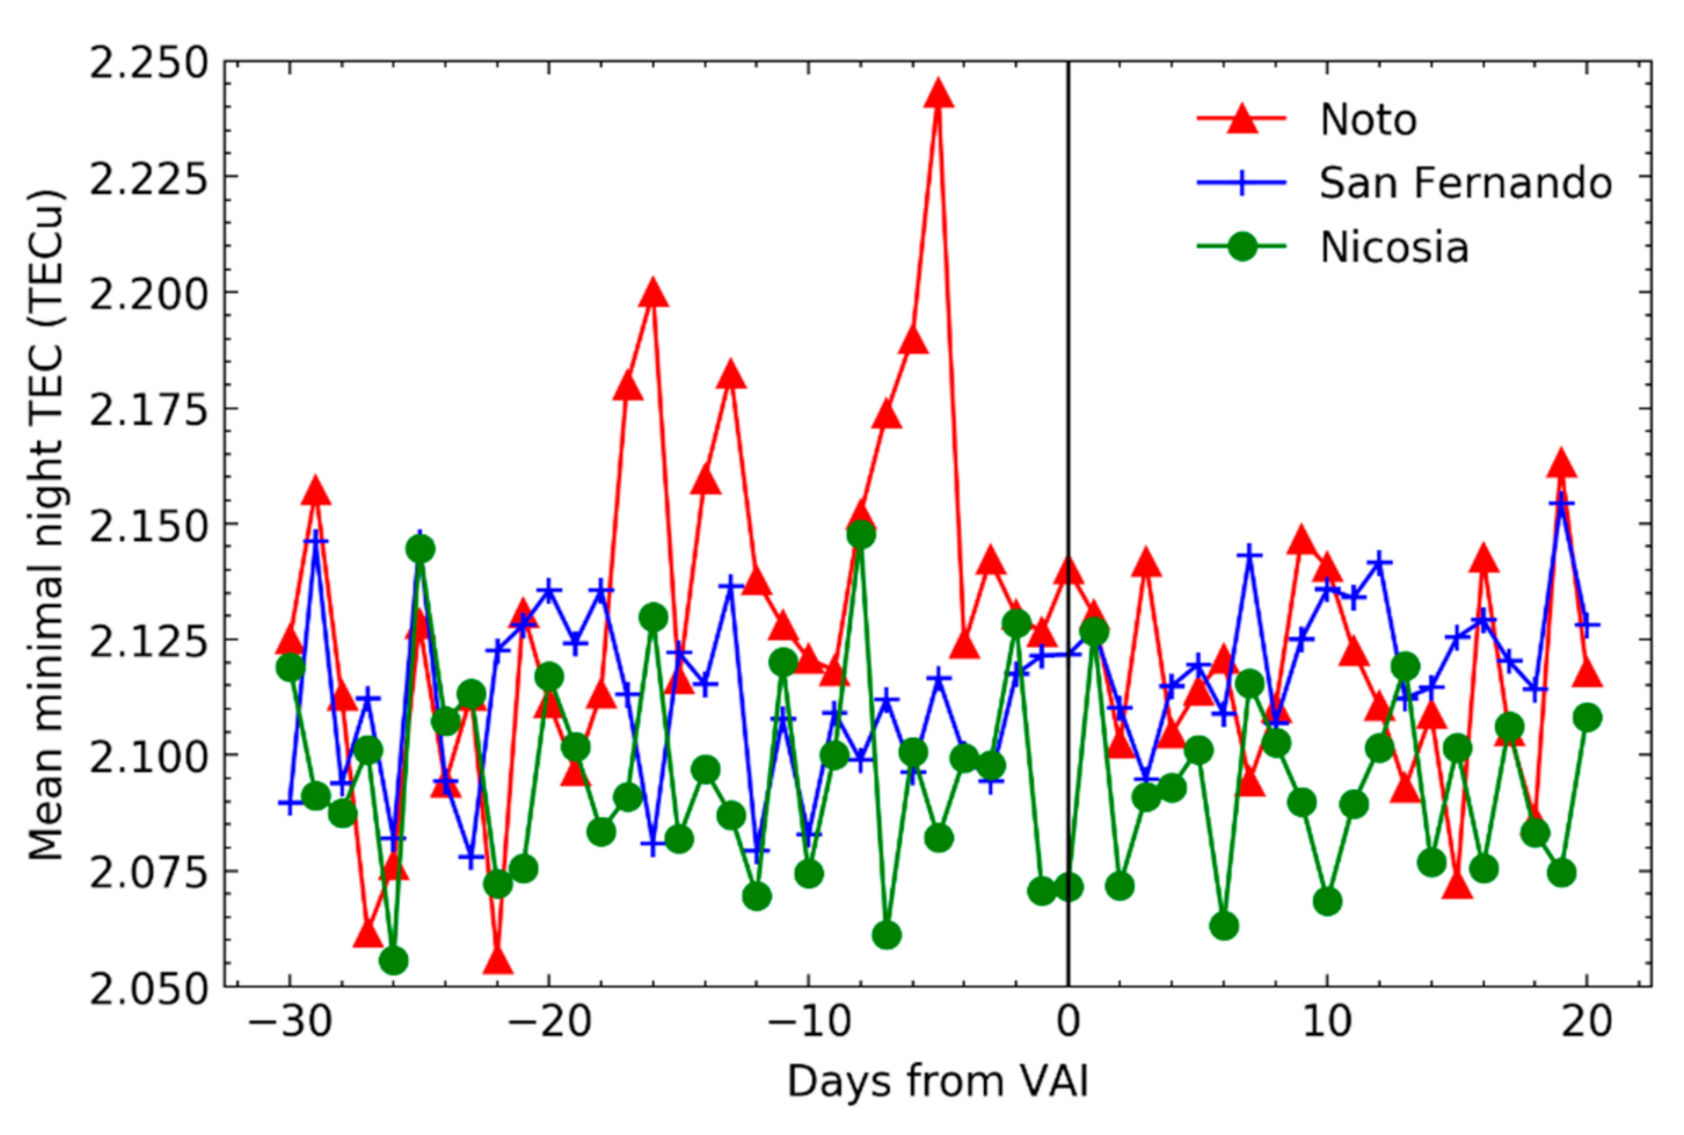
| All | - | 2.112 | 2.099 | 2.139 | 2.110 | 2.110 | 2.160 | 0.232 | 0.240 | 0.441 | 3.330 | 3.480 | 4.580 | 0.120 | 0.110 | 0.020 |
| VAI | A | 2.097 | 2.099 | 2.142 | 2.090 | 2.110 | 2.170 | 0.191 | 0.207 | 0.492 | 3.070 | 2.810 | 3.700 | 1.050 | 1.030 | 0.020 |
| B | 2.113 | 2.097 | 2.134 | 2.100 | 2.110 | 2.170 | 0.205 | 0.216 | 0.503 | 3.700 | 2.810 | 3.700 | 1.050 | 1.030 | 0.020 | |
| C | 2.122 | 2.071 | 2.140 | 2.105 | 2.110 | 2.180 | 0.147 | 0.240 | 0.501 | 2.680 | 2.810 | 3.700 | 1.570 | 1.030 | 0.020 | |
| 5 days before VAI | A | 2.102 | 2.094 | 2.161 | 2.100 | 2.100 | 2.180 | 0.154 | 0.247 | 0.438 | 2.670 | 3.120 | 3.320 | 1.480 | 0.230 | 0.090 |
| B | 2.112 | 2.100 | 2.188 | 2.100 | 2.120 | 2.195 | 0.161 | 0.293 | 0.441 | 2.670 | 3.120 | 3.320 | 1.610 | 0.230 | 0.090 | |
| C | 2.113 | 2.082 | 2.243 | 2.115 | 2.120 | 2.230 | 0.163 | 0.280 | 0.346 | 2.670 | 2.770 | 3.320 | 1.610 | 0.230 | 0.780 | |
| Station | Whole Series | Criteria A | Criteria B | Criteria C | |
|---|---|---|---|---|---|
| 5-day lag | Noto | 0.005 | 0.181 | 0.231 | 0.251 |
| San Fernando | −0.026 | −0.029 | −0.098 | −0.161 | |
| Nicosia | −0.035 | −0.037 | −0.068 | −0.052 |
Publisher’s Note: MDPI stays neutral with regard to jurisdictional claims in published maps and institutional affiliations. |
© 2021 by the authors. Licensee MDPI, Basel, Switzerland. This article is an open access article distributed under the terms and conditions of the Creative Commons Attribution (CC BY) license (http://creativecommons.org/licenses/by/4.0/).
Share and Cite
Toman, I.; Brčić, D.; Kos, S. Contribution to the Research of the Effects of Etna Volcano Activity on the Features of the Ionospheric Total Electron Content Behaviour. Remote Sens. 2021, 13, 1006. https://doi.org/10.3390/rs13051006
Toman I, Brčić D, Kos S. Contribution to the Research of the Effects of Etna Volcano Activity on the Features of the Ionospheric Total Electron Content Behaviour. Remote Sensing. 2021; 13(5):1006. https://doi.org/10.3390/rs13051006
Chicago/Turabian StyleToman, Ivan, David Brčić, and Serdjo Kos. 2021. "Contribution to the Research of the Effects of Etna Volcano Activity on the Features of the Ionospheric Total Electron Content Behaviour" Remote Sensing 13, no. 5: 1006. https://doi.org/10.3390/rs13051006
APA StyleToman, I., Brčić, D., & Kos, S. (2021). Contribution to the Research of the Effects of Etna Volcano Activity on the Features of the Ionospheric Total Electron Content Behaviour. Remote Sensing, 13(5), 1006. https://doi.org/10.3390/rs13051006