Article

Improving the Capability of the SCOPE Model for Simulating Solar-Induced Fluorescence and Gross Primary Production Using Data from OCO-2 and Flux Towers

1
Key Laboratory of Remote Sensing of Gansu Province, Heihe Remote Sensing Experimental Research Station, Northwest Institute of Eco-Environment and Resources, Chinese Academy of Sciences, Lanzhou 730000, China
2
Earth Systems Research Center, Institute for the Study of Earth, Oceans, and Space, University of New Hampshire, Durham, NH 03824, USA
*
Author to whom correspondence should be addressed.
Remote Sens. 2021, 13(4), 794; https://doi.org/10.3390/rs13040794
Submission received: 5 January 2021 / Revised: 3 February 2021 / Accepted: 18 February 2021 / Published: 21 February 2021
(This article belongs to the Special Issue Remote Sensing of Carbon Fluxes and Stocks)

Abstract

:
Solar-induced chlorophyll fluorescence (SIF) measured from space has shed light on the diagnosis of gross primary production (GPP) and has emerged as a promising way to quantify plant photosynthesis. The SCOPE model can explicitly simulate SIF and GPP, while the uncertainty in key model parameters can lead to significant uncertainty in simulations. Previous work has constrained uncertain parameters in the SCOPE model using coarse-resolution SIF observations from satellites, while few studies have used finer resolution SIF measured from the Orbiting Carbon Observatory-2 (OCO-2) to improve the model. Here, we identified the sensitive parameters to SIF and GPP estimation, and improved the performance of SCOPE in simulating SIF and GPP for temperate forests by constraining the physiological parameters relating to SIF and GPP by combining satellite-based SIF measurements (e.g., OCO-2) with flux tower GPP data. Our study showed that SIF had weak capability in constraining maximum carboxylation capacity (Vcmax), while GPP could constrain this parameter well. The OCO-2 SIF data constrained fluorescence quantum efficiency (fqe) well and improved the performance of SCOPE in SIF simulation. However, the use of the OCO-2 SIF alone cannot significantly improve the GPP simulation. The use of both satellite SIF and flux tower GPP data as constraints improved the performance of the model for simulating SIF and GPP simultaneously. This analysis is useful for improving the capability of the SCOPE model, understanding the relationships between GPP and SIF, and improving the estimation of both SIIF and GPP by incorporating satellite SIF products and flux tower data.

Graphical Abstract

1. Introduction

Solar-induced chlorophyll fluorescence (SIF), emitted by vegetation in the pigment beds of photosystems, is an indicator of the efficiency by which photons are transmitted into photochemical reaction centers [1]. SIF has recently emerged as a novel tool for the estimation of terrestrial gross primary production (GPP), the amount of carbon fixed by terrestrial vegetation via photosynthesis [2,3]. SIF is seen as a more promising proxy for GPP than the traditional vegetation indices that are derived from reflectance data [4,5,6]. GPP is a key component of the global carbon cycle, and its accurate estimation at region and global scales is vital for understanding the interactions between the terrestrial carbon cycle and climate change [7,8]. Previous studies have shown strong relationships between ecosystem SIF and GPP using SIF data from ground measurements (e.g., [9,10]), airborne imaging spectrometers (e.g., [4,11]), and satellite sensors such as the Greenhouse Gases Observing Satellite (GOSAT) [12], Global Ozone Monitoring Mission Experiment-2 (GOME-2) [13], and Orbiting Carbon Observatory-2 (OCO-2) [2,14]. These studies showed the great potential of SIF in estimating GPP at ecosystem to global scales. However, ground observations and airborne SIF measurements (e.g., [4,9,11]) often have limitations in spatio-temporal resolution and continuous monitoring of vegetation photosynthesis over large regions. Finer-resolution satellite SIF has limited swath width and does not provide globally continuous coverage during each repeat cycle. For example, the swath width of OCO-2 is only 10.3 km, leading to sparse SIF observations globally.
Process-based models have been used to explicitly simulate SIF. SIF has been incorporated into ecological models such as the 1-D (dimensional) SCOPE (Soil Canopy Observation, Photochemistry and Energy Fluxes) model [15,16] and 3-D models (e.g., DART [17], and FluorFLIGHT [18]) for more complex canopies. The SCOPE model is a state-of-the-art model integrating radiative transfer, photosynthesis, energy balance, and fluorescence [15] and has been widely used in SIF and photosynthesis studies (e.g., [19,20,21,22]). The model was partly developed for the upcoming Fluorescence Explorer (FLEX) mission that will be able to capture SIF for the full spectral range from 500 to 780 nm with 300-m spatial resolution and bi-weekly global coverage [23]. Currently, the SCOPE model has the capability of simulating fluorescence, spectral reflectance, and photosynthesis of vertically heterogeneous, multi-layer vegetation canopies [24]. The model has been incorporated in several terrestrial biosphere/land surface models including the Community Land Model (e.g., [25]). Coupling the SIF and photosynthesis processes together have extended the functions of these ecosystem models, and improves their capability in simulating GPP and thus the global carbon cycle [25].
Accurately calibrating key parameters related to ecosystem processes remains an important procedure in carbon cycle modeling [26,27]. Parameter uncertainty is one of the most important sources of uncertainty in model simulations [27,28,29]. The complexity of parameter calibration is in proportion to the complexity of the model and the number of parameters [30]. The SCOPE model integrates various sub-models and thereby contains a large number of parameters [15]. There is significant uncertainty associated with these parameters, which can in turn induce large uncertainty to simulated SIF and GPP. Therefore, it is increasingly important to identify strategies that are able to make full use of existing information from various data sources to improve ecosystem models. As an integrated model incorporating routines of momentum, carbon, and water fluxes as well as radiation transfer, transmission, and chlorophyll fluorescence, SCOPE contains over twenty biochemical and physiological parameters [15]. The sensitivity analysis (SA) can be used to evaluate the relative importance of the various explanatory variables in a model and can be employed to identify the most important variables that influence model outputs [31]. Two main types of SA methods have been commonly used in the screening of model parameters. The local SA methods only change one input variable at a time, and thus are not adequate for the sensitivity analysis of complex models that have many variables. In contrast, the global SA (GSA) methods explore the relative importance of each variable to model outputs with full input variable space [31,32], and are suitable to analyze the full parameter space of a complex model like SCOPE.
The model-data fusion (MDF) (or data assimilation) method has been increasingly used to optimize the parameters in carbon cycle models [26,27,29,33,34]. The MDF technique is a useful tool to constrain model parameters with various observations [27,33]. With this technique, various types of observations and prior knowledge of parameters can be used to estimate parameters and to reduce their uncertainties by minimizing the cost functions that compare observations and simulations [33]. The main optimization techniques of the MDF method can be either batch or sequential methods, which depends on whether the data are processed all at once or at a time [28]. The batch methods that process all data and observations simultaneously include gradient-based methods and global optimization algorithms such as the genetic algorithm [26] and shuffled complex evolution (SCE) approaches [35]. The sequential methods process data sequentially, and the most widely used sequential method is perhaps the Kalman filter [28]. Since the conventional optimization methods are computationally intensive, particularly for complex models with a large number of parameters, efforts have been made to reduce the computational burden of parameter optimization. The surrogate-based optimization, replacing the original expensive models with simplified statistical models during the optimization process, is one of the commonly used ways to efficiently optimize complex dynamic models [36,37,38]. Some previous studies have used surrogate models or emulators of SCOPE (e.g., [39,40]). The performance of the emulators was typically determined by the machine learning algorithm, dimensionality reduction method, and the number of components during the modeling [37,40]. Given the efficiency and effectiveness of the surrogate-based optimization, here we used the surrogate-based method in our study.
Meanwhile, previous studies have demonstrated the importance of optimizing the key parameters in simulating photosynthesis process using the SCOPE model (e.g., [19,41]). The maximum carboxylation capacity (Vcmax, μmol CO2 m−2 s−1) of RuBisCO is one of the most important parameters in the photosynthesis submodel [42]. SIF is related to the electron transport rate in the process of photosynthesis [3], and there are complex and intrinsic linkages among the absorbed photosynthetically active radiation (APAR), fluorescence radiance, and the rate of photochemistry [16,43]. Declining Vcmax reduces the saturated rate of photosynthesis and switches the light-limiting condition to the light-saturating condition at lower PAR, leading to the maximum photochemistry rate at which photochemical yield declines [43]. With the increase in PAR and nonphotochemical quenching, fluorescence yield first increases and then declines, while the fluorescence radiance (expected SIF) rises first nonlinearly and then linearly [43]. At a midday satellite overpass with high PAR, SIF tends to be higher for leaves with high Vcmax than for leaves with low Vcmax, leading to a positive relationship between SIF and Vcmax [43]. Due to its intrinsic relationship with vegetation photosynthetic activity, SIF has also been used to estimate Vcmax to better simulate GPP and SIF using the SCOPE model [41]. Several studies have evaluated the sensitivity of SIF and GPP to this parameter [39,41,44], and have shown that the SIF–Vcmax relationship was not stable and instead varied between different versions of the SCOPE model [19,39,45,46]. Two recent studies showed that SIF was less sensitive to Vcmax in SCOPE v1.6 [19,44]. However, the sensitivity of SIF to Vcmax in the SCOPE v1.7 model across different biomes has not been examined yet. In addition, no studies have used satellite SIF observations and flux tower GPP data to jointly constrain the parameters of the SCOPE model for improving SIF and GPP simulations.
Several previous studies have used satellite SIF products (e.g., GOSAT and GOME-2) to improve the GPP estimation in cropland and grassland (e.g., [20,41]), which has demonstrated the potential of SIF observations in constraining GPP [19,41]. However, the satellite-derived SIF products from GOSAT or GOME-2 have coarse spatial resolution (e.g., 10 km diameter for GOSAT, 40 × 80 km2 for GOME-2), leading to large scale mismatch between satellite grid cells and eddy covariance (EC) flux tower footprints [2]. The OCO-2 satellite, launched in 2014, has enabled the retrieval of finer-resolution (1.3 × 2.25 km2) SIF than the previous satellites/sensors [47]. The ground area of the OCO-2 SIF soundings is close to the typical footprint of EC flux towers, and therefore the OCO-2 SIF data can be better matched with EC observations to examine the relationship between SIF and GPP or to simultaneously constrain models [5]. To date, only a few studies have used the OCO-2 SIF products to evaluate or improve the SIF simulation of the SCOPE model (e.g., [44]). Here, we used SIF observations in the far red region from OCO-2 and GPP data from flux towers to improve the performance of the SCOPE model for simulating SIF and GPP by optimizing the key uncertain parameters in the model. We chose two temperate forests (Park Falls and Willow Creek in the USA) as our study sites. The objectives of this study were to (1) identify the key parameters of the SCOPE model in predicting SIF and GPP; and (2) examine the effects of parameter optimization on the simulation of SIF and GPP, and assess how well the SCOPE model simulations can be constrained by OCO-2 SIF and flux tower GPP, both separately and together. Our results are useful for improving the capability of the SCOPE model, understanding the relationships between GPP and SIF, and revealing the potential of improving the SIF and GPP estimation by incorporating the SIF products and flux tower data.

2. Materials and Methods

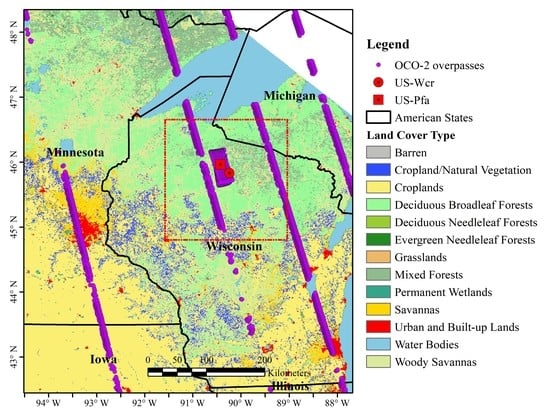
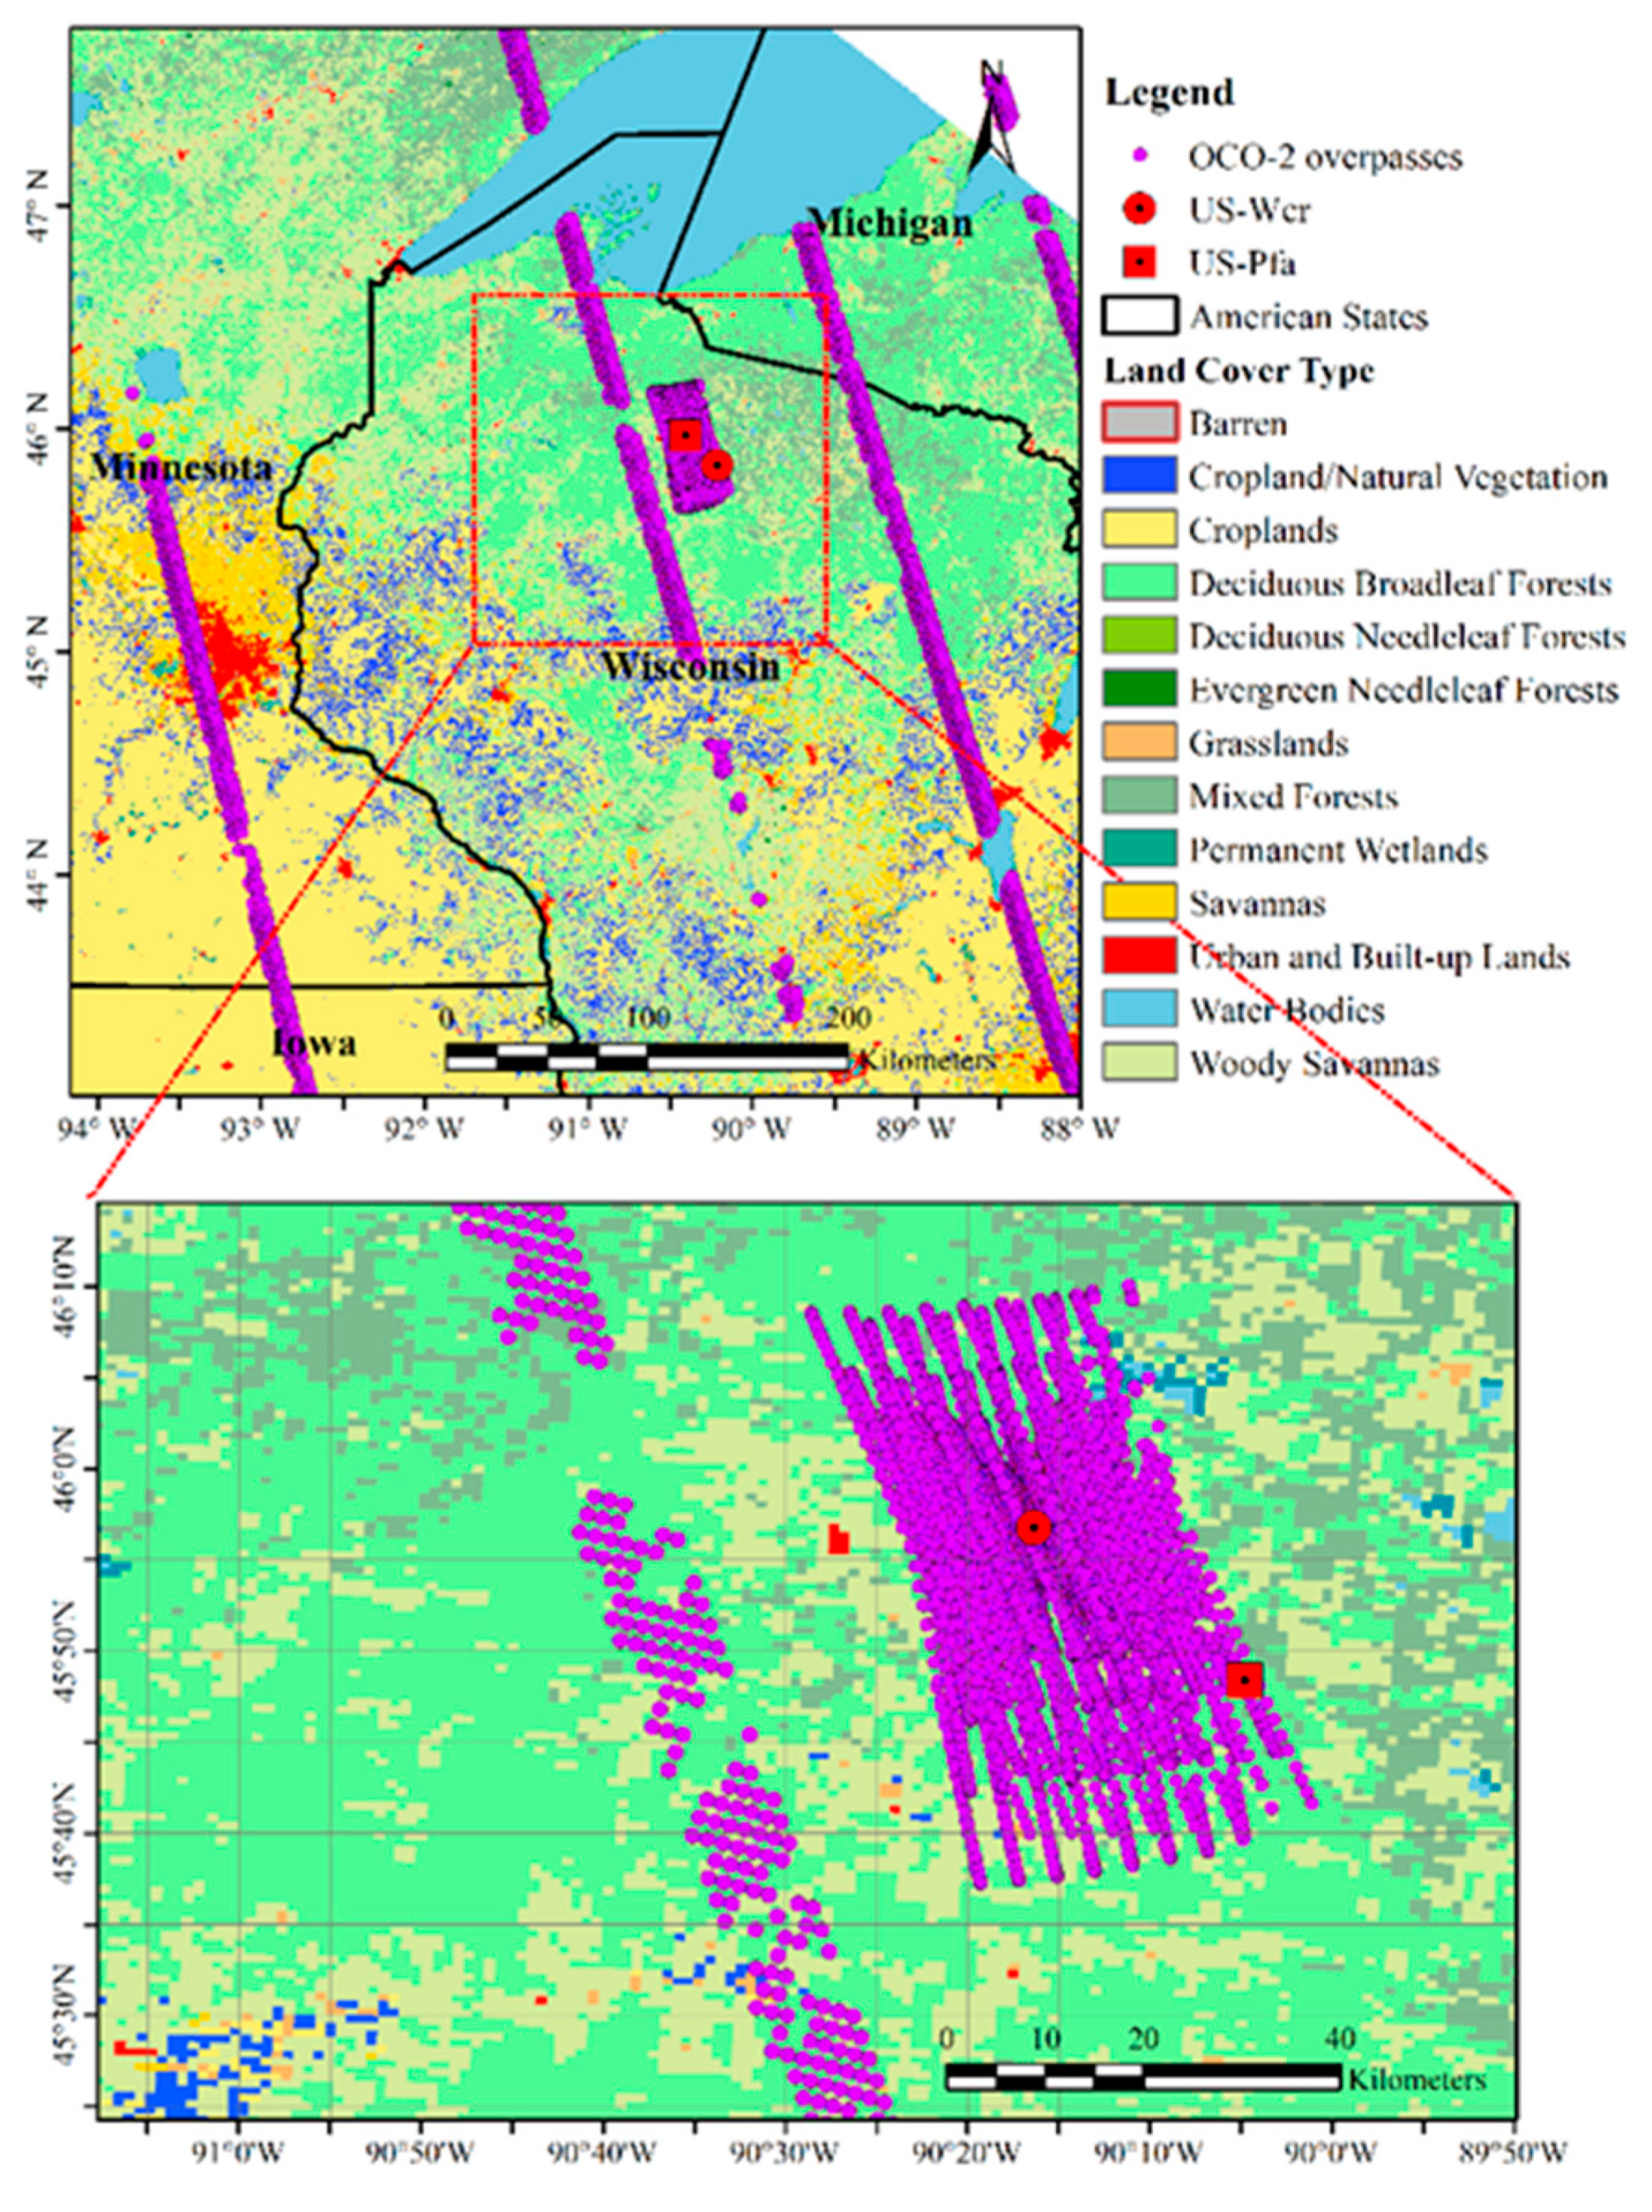
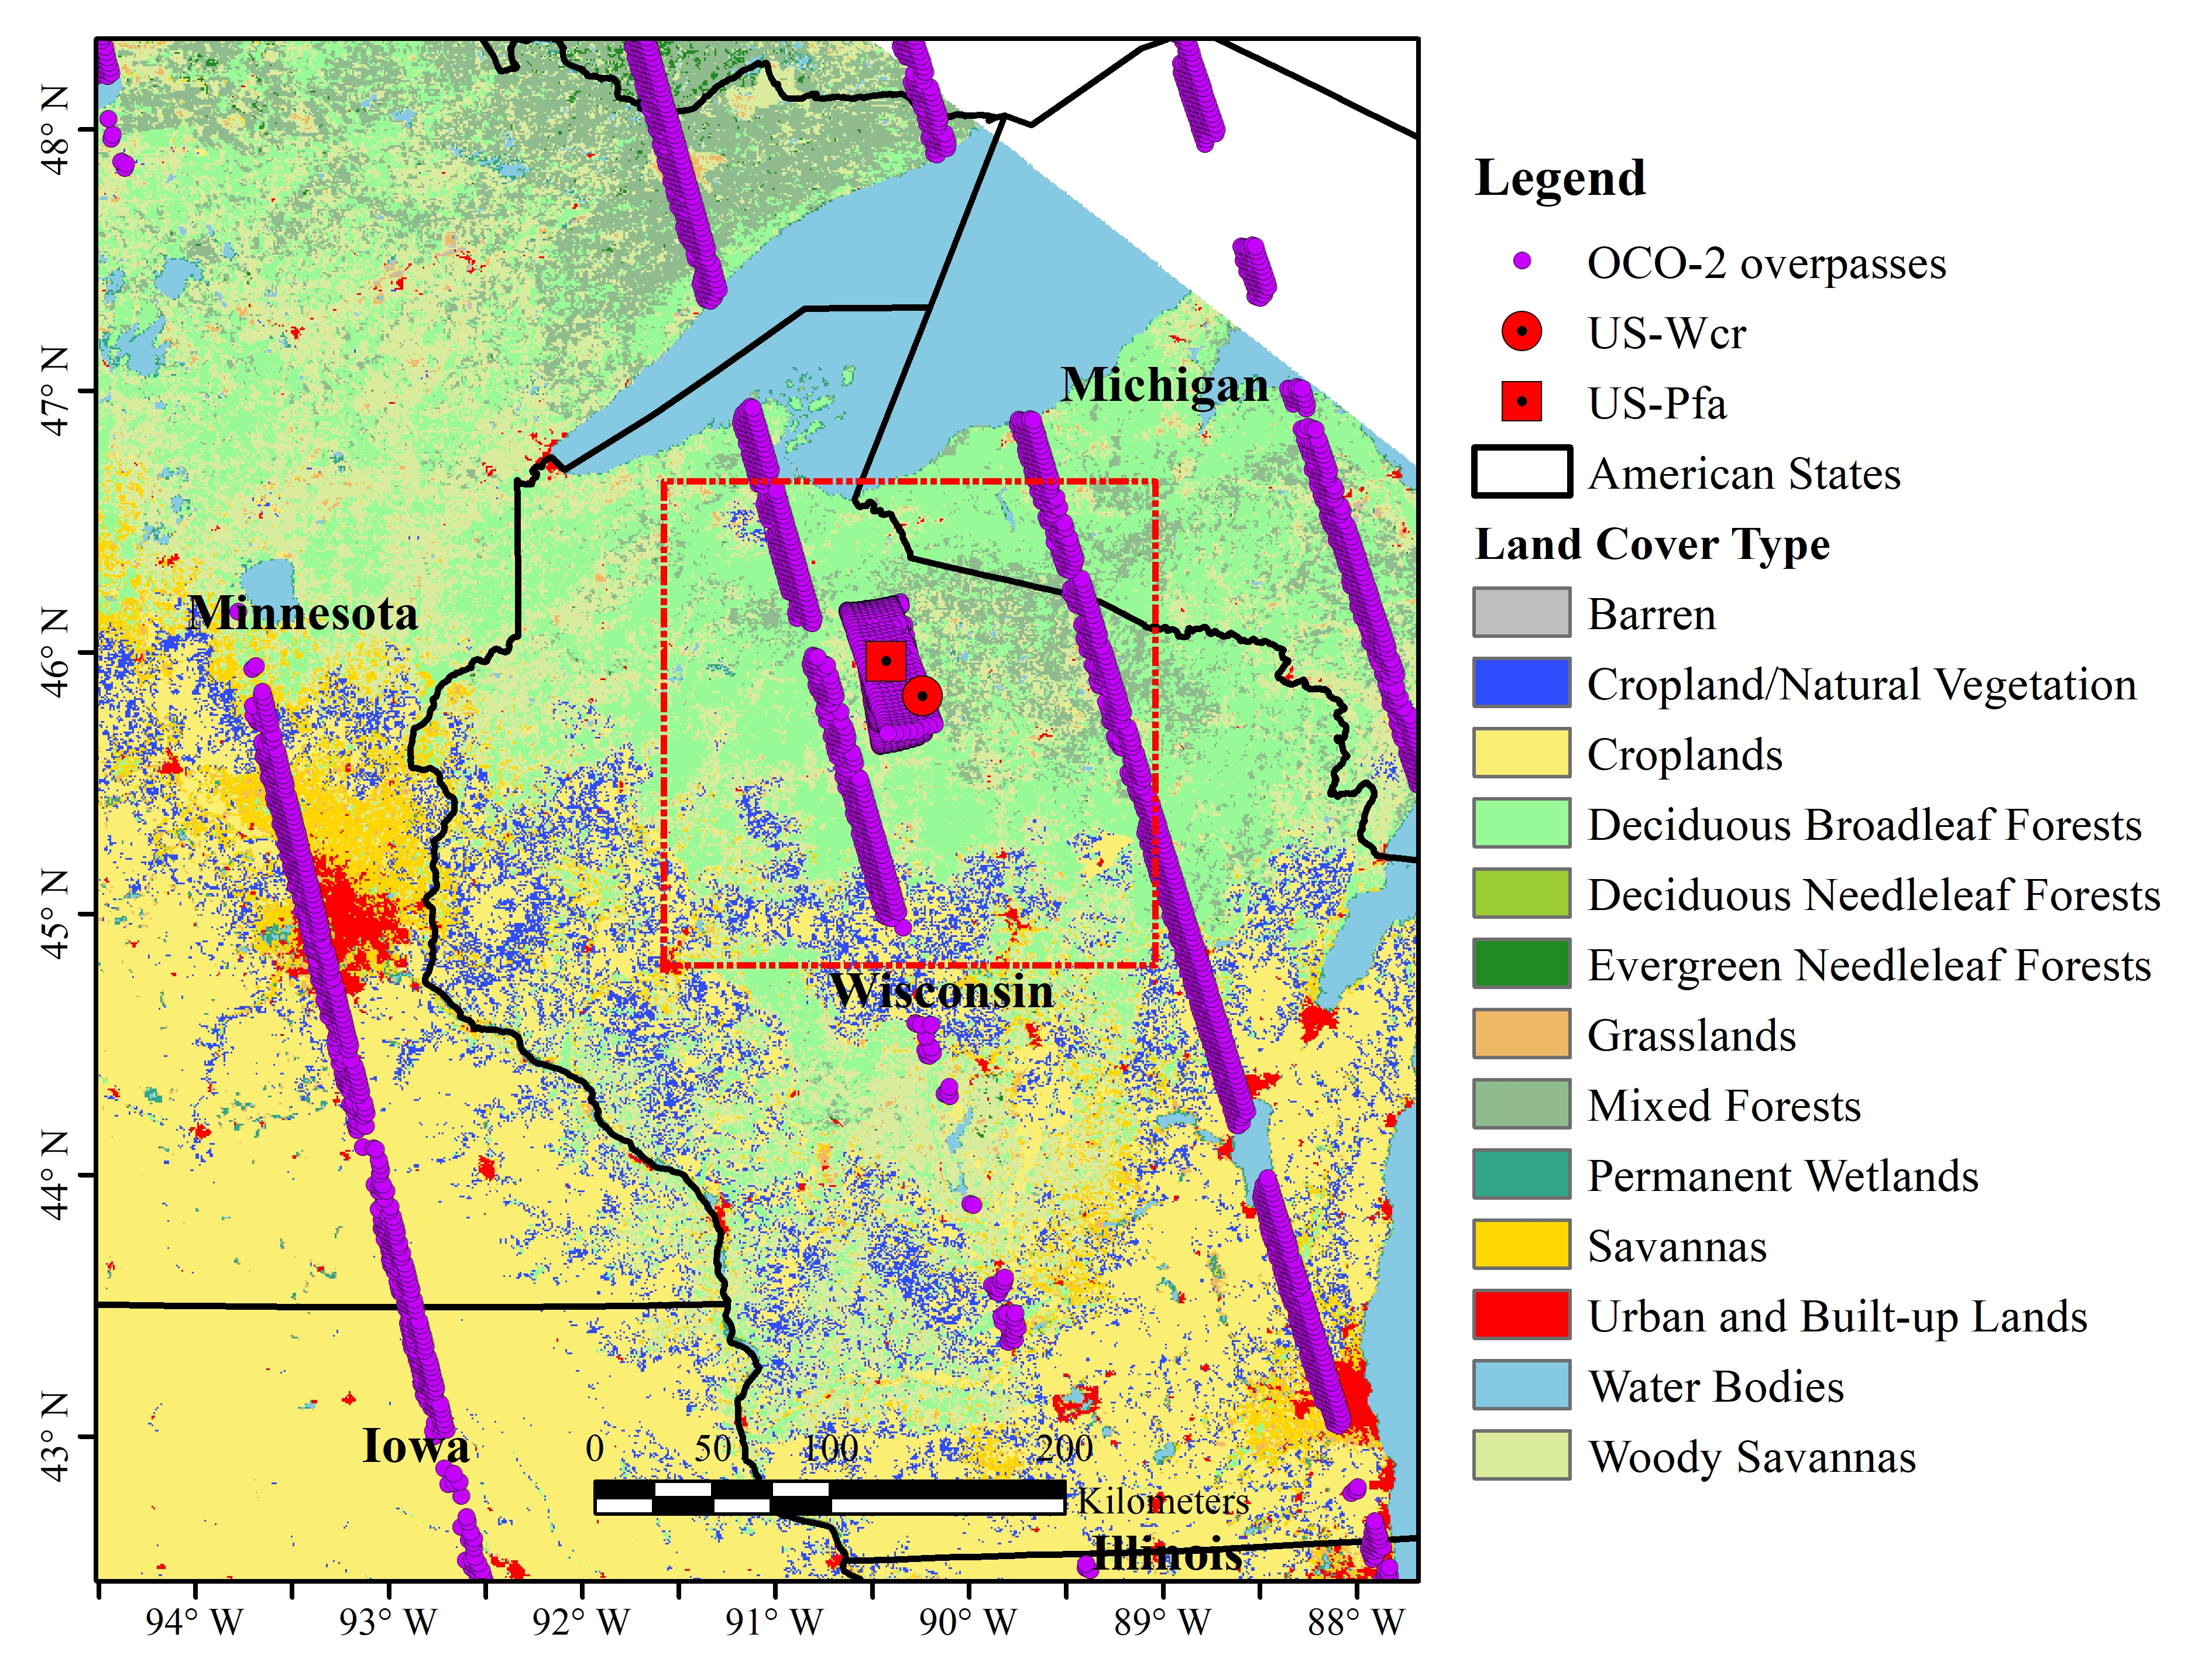
2.1. Site Description and Flux Tower Observations

Our study sites consisted of two EC flux sites in northern Wisconsin, USA: Park Falls (US-PFa, 45.945°N, 90.273°W) [48,49] and Willow Creek (US-WCr, 45.806°N, 90.080°W) [50]. Both sites are located in the Chequamegon-Nicolet National Forest, and are characterized by an interior continental climate [49]. Park Falls is dominated by a mixed landscape of upland forests (mainly deciduous but with a significant coniferous coverage) and open wetlands [49]. The Willow Creek site is located about twenty km to the southeast of Park Falls. Willow Creek is a 80–100-year-old deciduous broadleaf forest (DBF) stand consisting mainly of sugar maple, basswood, and green ash, with a closed canopy of about 24 m in height and a leaf area index (LAI) of 5.3 [50].
We used EC and meteorological measurements from these two forest sites for the period 2014–2017 to constrain the SCOPE model, and investigated the relationships between satellite-derived SIF and flux tower GPP for the same period. EC flux and meteorological measurements have been made continuously at Park Falls [48] and Willow Creek since 1996 and 1998, respectively. We used the hourly GPP and meteorological data at Park Falls and half-hourly data from Willow Creek for the period from 2014 to 2017 for constraining the SCOPE model, and also tested the model with the data since 2003 at Park Falls. The net ecosystem exchange (NEE) measurements obtained from the EC technique were partitioned to GPP and ecosystem respiration using a non-linear regression of nighttime NEE to surface soil temperature [51]. The details of the flux data processing procedures of these two sites have been described in previous studies [51,52]. We also used meteorological data such as wind speed, air temperature, incoming solar radiation, specific humidity, and soil moisture as the driving data of the SCOPE model. The canopy height was 19 m and 24 m at Park Falls and Willow Creek, respectively, while wind speed was measured at the height of 30 m and 29.6 m, respectively. The roughness length and zero plane displacement were calculated from vegetation height and LAI in the SCOPE model as described in [53].

2.2. Solar-Induced Chlorophyll Fluorescence (SIF) Observations from Orbiting Carbon Observatory-2 (OCO-2)

The OCO-2 has been collecting SIF measurements with a repeat frequency of approximately 16 days since September 2014. The OCO-2 SIF was retrieved using a simplified forward transition model exploiting the infilling of the Fraunhofer lines at 757 nm and 771 nm wavelengths from the O2 A-band observation records [47]. Although the spatial resolution of OCO-2 is 1.3 km × 2.25 km in the nadir mode, the total swath width is only 10.3 km. With the sparse coverage of the instrument, temporally dense SIF data are not available for most locations over the globe. The Park Falls site is a very tall tower and a validation site for the OCO-2 mission [2], and OCO-2 has been collecting SIF data in the target mode, leading to temporally well-spaced retrievals of SIF measurements near the flux tower site (Figure 1).
We obtained the level 2 SIF Lite product (OCO2_L2_Lite_SIF, version 8r) from the Land Processes Distributed Active Archive Center (LP DAAC). This product contains bias-corrected SIF along with other selected fields from the IMAP-DOAS algorithm [47]. For each site, we extracted all the OCO-2 SIF observations that were available within the 2.5 km × 2.5 km area surrounding the flux tower during the study period. The instantaneous SIF observations were calculated by averaging all the available samples within the surrounding area. Then, we converted the instantaneous SIF measurements to daily SIF using the daily correction factor contained in the product [47].

2.3. Moderate Resolution Imaging Spectroradiometer (MODIS) Data Products

We obtained the MODIS reflectance product (MCD43A4, V6) and leaf area index (LAI) product (MCD15A2H, V6) from the Land Processes Distributed Active Archive Center (LP DAAC) for the study period. MCD43A4 offers 500 m-resolution spectral reflectance adjusted by the nadir bidirectional reflectance distribution function (BRDF) based on reflectance data from both Terra and Aqua at the daily timescale, and the BRDF correction can minimize the effects of varying illumination and observation conditions on surface reflectance [54]. The MCD15A2H LAI product was retrieved from both Terra and Aqua with 8-day intervals. For each MODIS product, we extracted the pixel values for the area (2.5 km × 2.5 km) surrounding each flux tower. For each 8-day interval, we averaged the values with good quality based on the quality assurance (QA) flags. Since the vegetation indices are widely used to monitor vegetation greenness and have significant relationships with vegetation GPP [7,8,55], we also derived the widely-used vegetation index, enhanced vegetation index (EVI), and examined its relationship with GPP to illustrate the performance of SIF.

2.4. Model Description and Parameterization

To improve the capability of SCOPE in simulating SIF emission and photosynthesis at the ecosystem level, we assessed how well OCO-2 SIF and flux tower GPP could constrain key uncertain model parameters. The SCOPE model is a 1-D vertical schematization of integrated radiative transfer model (RTM) and energy balance model that enables the simulation of canopy reflectance and fluorescence as well as the heat, carbon, and water fluxes between soil, vegetation, and atmosphere [15,16]. The radiative transfer and chlorophyll fluorescence routines of the SCOPE model are calculated with the module Fluspect [15], which is based on the vastly used canopy RTM, PROSAIL [56], with the addition of backward and forward fluorescence spectra. The PROSAIL model is a RTM that couples a leaf-level model, PROSPECT [57], with a canopy RTM, SAIL [58]. PROSAIL is perhaps the most commonly used RTM for reflectance and fluorescence applications. The updated version of SCOPE (V1.7) uses a new version of PROSPECT, PROSPECT-D [59], which adds anthocyanins to carotenoids and chlorophylls, the two plant pigments in the current model. The biochemical model in SCOPE is based on [42] and [60] for C3 and C4 plants, respectively. The SCOPE model can simulate fluorescence emission and photosynthesis simultaneously, and more details are provided in previous studies [15,16].
SCOPE contains a series of vegetation physiological parameters and requires meteorological data such as incoming solar radiation, wind speed, air temperature, and relative humidity. The LAI and leaf chlorophyll content (Cab) are two important structural and physiological parameters. Given the consistence of SCOPE and PROSAIL in radiation transfer routines, we retrieved the seasonal variations of Cab and LAI using the MODIS reflectance products of band 1 to band 7 and the PROSAIL model. In this study, the genetic algorithm (GA) approach was used to retrieve the structural and physiological parameters. The GA algorithm is a global optimization approach based on an analogy that consists of natural selection and evolutionary genetics [26,61]. The GA algorithm employs various operations of evolutionary strategies: encoding, fitness evaluation, parent selection, genetic operation, and replacement [61]. Assuming that the best chromosome is a raw fitness, fbest, the fitness of the i-th chromosome (fi) in the ordered list is conducted using a linear function during the evaluation:
f i = f b e s t ( i 1 ) d
where d is the decrement rate. The average objective value of the population is mapped into the average fitness by Equation (1). The roulette wheel selection is commonly used to implement the proportionate scheme in GA. Giving the chromosome x with a fitness value f(x,t), its growth rate pi can be defined as follows:
p i =   f ( x , t ) F ( t )
where F(t) is the average fitness of the population. We minimized the following objective function (Equation (3)):
F s p e c = 1 n i = 1 n ( R e f i , s i m R e f i , o b s ) 2
where Refi,sim and Refi,obs are the ith simulated and observed reflectance band, respectively, and n is the number of reflectance bands. The prior ranges of the parameters (e.g., Cab, LAI) of the PROSAIL model are given in Table 1.
The LAI and Cab inverted by the PROSAIL model at Park Falls showed the seasonal patterns that were expected for temperate deciduous forests (Figure 2). The inverted LAI was generally consistent with the MODIS LAI, and the inverted Cab showed a similar seasonal cycle as the LAI.

2.5. Parameter Sensitivity Analysis and Inverse Estimation of Key Parameters

The physiological parameters related to SIF and GPP simulation are summarized in Table 1. The modules rely on different empirical parameterizations, which are based on a limited set of leaf-level data under some specific conditions. To examine the capability of the SCOPE model to predict SIF at satellite overpass time and assess how well the key parameters such as the Vcmax of RuBisCO can be constrained by OCO-2 SIF and flux tower GPP, we conducted a parameter sensitivity analysis and estimated the key parameters. Three different objective functions were used to assess the sensitivity of physiological parameters: optimization using SIF as the constraint (FSIF, Equation (4)), optimization using GPP as the constraint (FGPP, Equation (5)), and optimization using both SIF and GPP as constraints (FSIF_GPP, Equation (6)). The performance of the model was evaluated using the coefficient of determination (R2) of the linear regression between the measured and estimated values of SIF and GPP, measuring how much variation in the observations was explained by the models. The root mean square error (RMSE) was also used to evaluate the performance of the model. We minimized the following objective functions, respectively.
F S I F = 1 m i = 1 m ( S I F i , s i m S I F i , o b s ) 2
F G P P = 1 m i = 1 m ( G P P i , s i m G P P i , o b s ) 2
F S I F _ G P P = 0.5 × ( F G P P s t d G P P + F S I F s t d S I F )  
where SIFi,sim and SIFi,obs are the simulated and observed SIF at each time step, respectively; and GPPi,sim and GPPi,obs are the simulated and observed GPP at each time step, respectively; m is the number of timesteps; and stdGPP and stdSIF are the standard deviations of the observed GPP and SIF, respectively. The cost function for the optimization based on both SIF and GPP as constraints (Equation (6)) used the summed normalized errors of SIF and GPP to represent the total model error in simulating both SIF and GPP.
To identify the key parameters that are responsible for most of the variability in GPP and SIF simulated by SCOPE, both GSA method [31] and local SA approach were performed. In this study, we applied the Saltelli’s method [31] (i.e., extended Fourier amplitude sensitivity test, EFAST), a quantitative variance-based SA method that can identify the effects of both parameters and the interactions of parameters on model simulations [31]. The EFAST combined Sobol’s method and the Fourier amplitude sensitivity test (FAST) together [32], which can effectively quantify the main sensitivity effects (i.e., the first-order sensitivity index, SI 1st, representing the contribution of each input variable to the variance of model output), and total sensitivity effects of input variables (i.e., the total sensitivity index, SI total, the contribution to the total variance by the interactions between parameters) [32]. The sensitivity indices, SI 1st and SI total, are expressed as follows:
SI   1 st =   V i V ( Y ) = V [ E ( Y | X i ) ] V ( Y )
SI   total =   S I   1 s t + j i S I i j + = E [ V ( Y | X ~ i ) ] V ( Y )
where Vi is the partial variance of the i-th parameter on output Y; V(Y) is the total unconditional output variance; Sij is the contribution to the total variance by the interactions between parameters i and j; and X~i denotes variation in all input parameters. Following previous studies [32,64], the sensitivity indices of the EFAST can be derived at the cost of nk model evaluations for robust results (n is the sample size and k is the number of input parameters). Aside from the GSA approach that is based on the SIMLAB, we also used a local SA approach, the “one-factor-at-a-time” (OAT) approach to analyze the sensitivity of SIF and GPP simulations to Vcmax and light conditions. Since GOME-2 and OCO-2 SIF products are based on different wavelengths, we conducted a sensitivity analysis with different Vcmax values at different wavelengths to identify the feasibility and sensitivity of satellite-derived SIF in constraining GPP simulations.
With the parameter sensitivity analysis, we selected the key parameters for GPP and SIF simulations, and inverted these parameters by minimizing the differences between the observed and modeled values. The SCOPE model employs complicated radiative transfer processes [15], which has a high demand for computational resources and thus hinders the estimation of Vcmax easily. To reduce the computational burden, we also used an adaptive surrogate modeling-based optimization method [38] to optimize the key parameters of the model in simulating GPP and SIF. Although the surrogate-based method might not be able to provide exactly the same optimal solutions as the original models, it has been proven to be effective and efficient in obtaining approximate optimal parameters for land surface and radiative transfer models [36,37,62]. The surrogate-based method can acquire acceptable optimized results with fewer simulations. Following a previous study [62], we applied an adaptive, nonlinear regression method, Gaussian processes regression (GPR), to approximate and replace the original computation model with the surrogate model [38]. Previous studies [37,62] showed that the GPR method outperformed other surrogate methods. According to the results of the parameter sensitivity, we selected the key physiological parameters (i.e., Vcmax, Rd, and fqe) that are related to SIF and GPP estimation in the model for optimization. The SCE method [35] was used to find the optimal parameters. Similar to the parameter sensitivity analysis, the estimation of the parameters was also based on three different objective functions using SIF and GPP to optimize parameters separately and also using both SIF and GPP to constrain parameters at the same time. We used the data from 2015 to 2017 for calibration, and the remaining data for validation. We evaluated the performance of the SCOPE model for simulating SIF using both OCO-2 and GOME-2 SIF observations.

3. Results

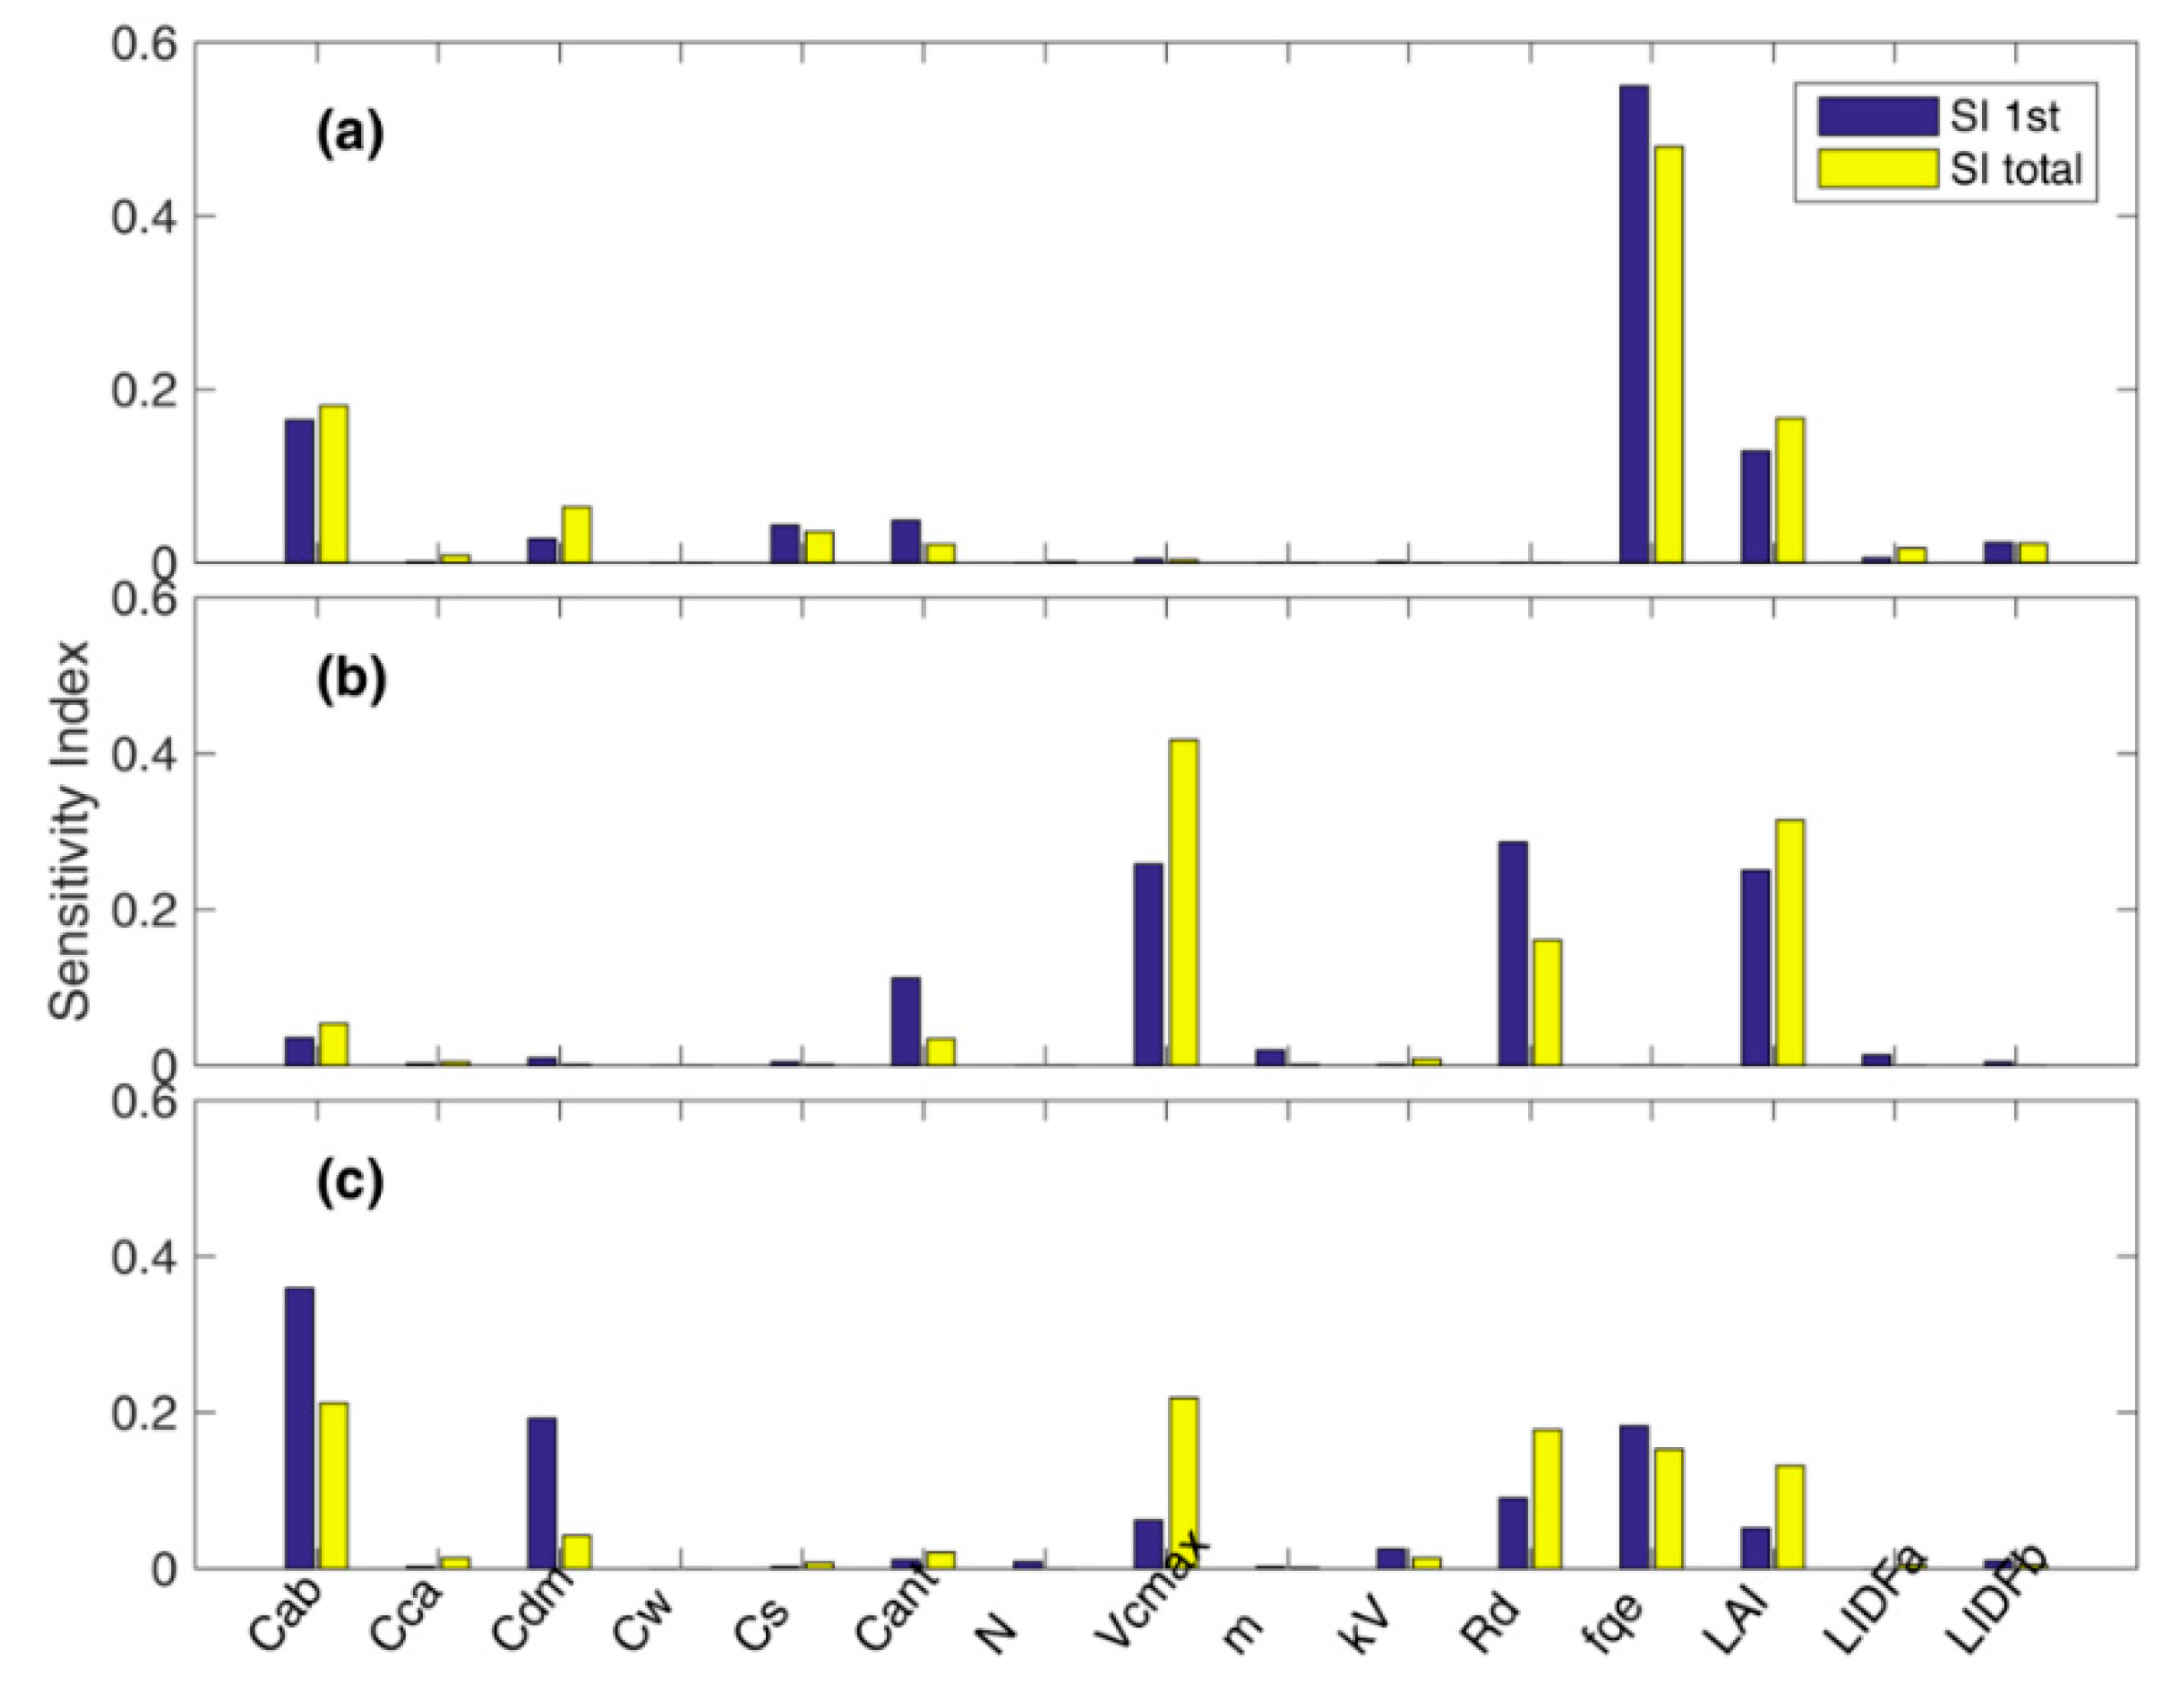
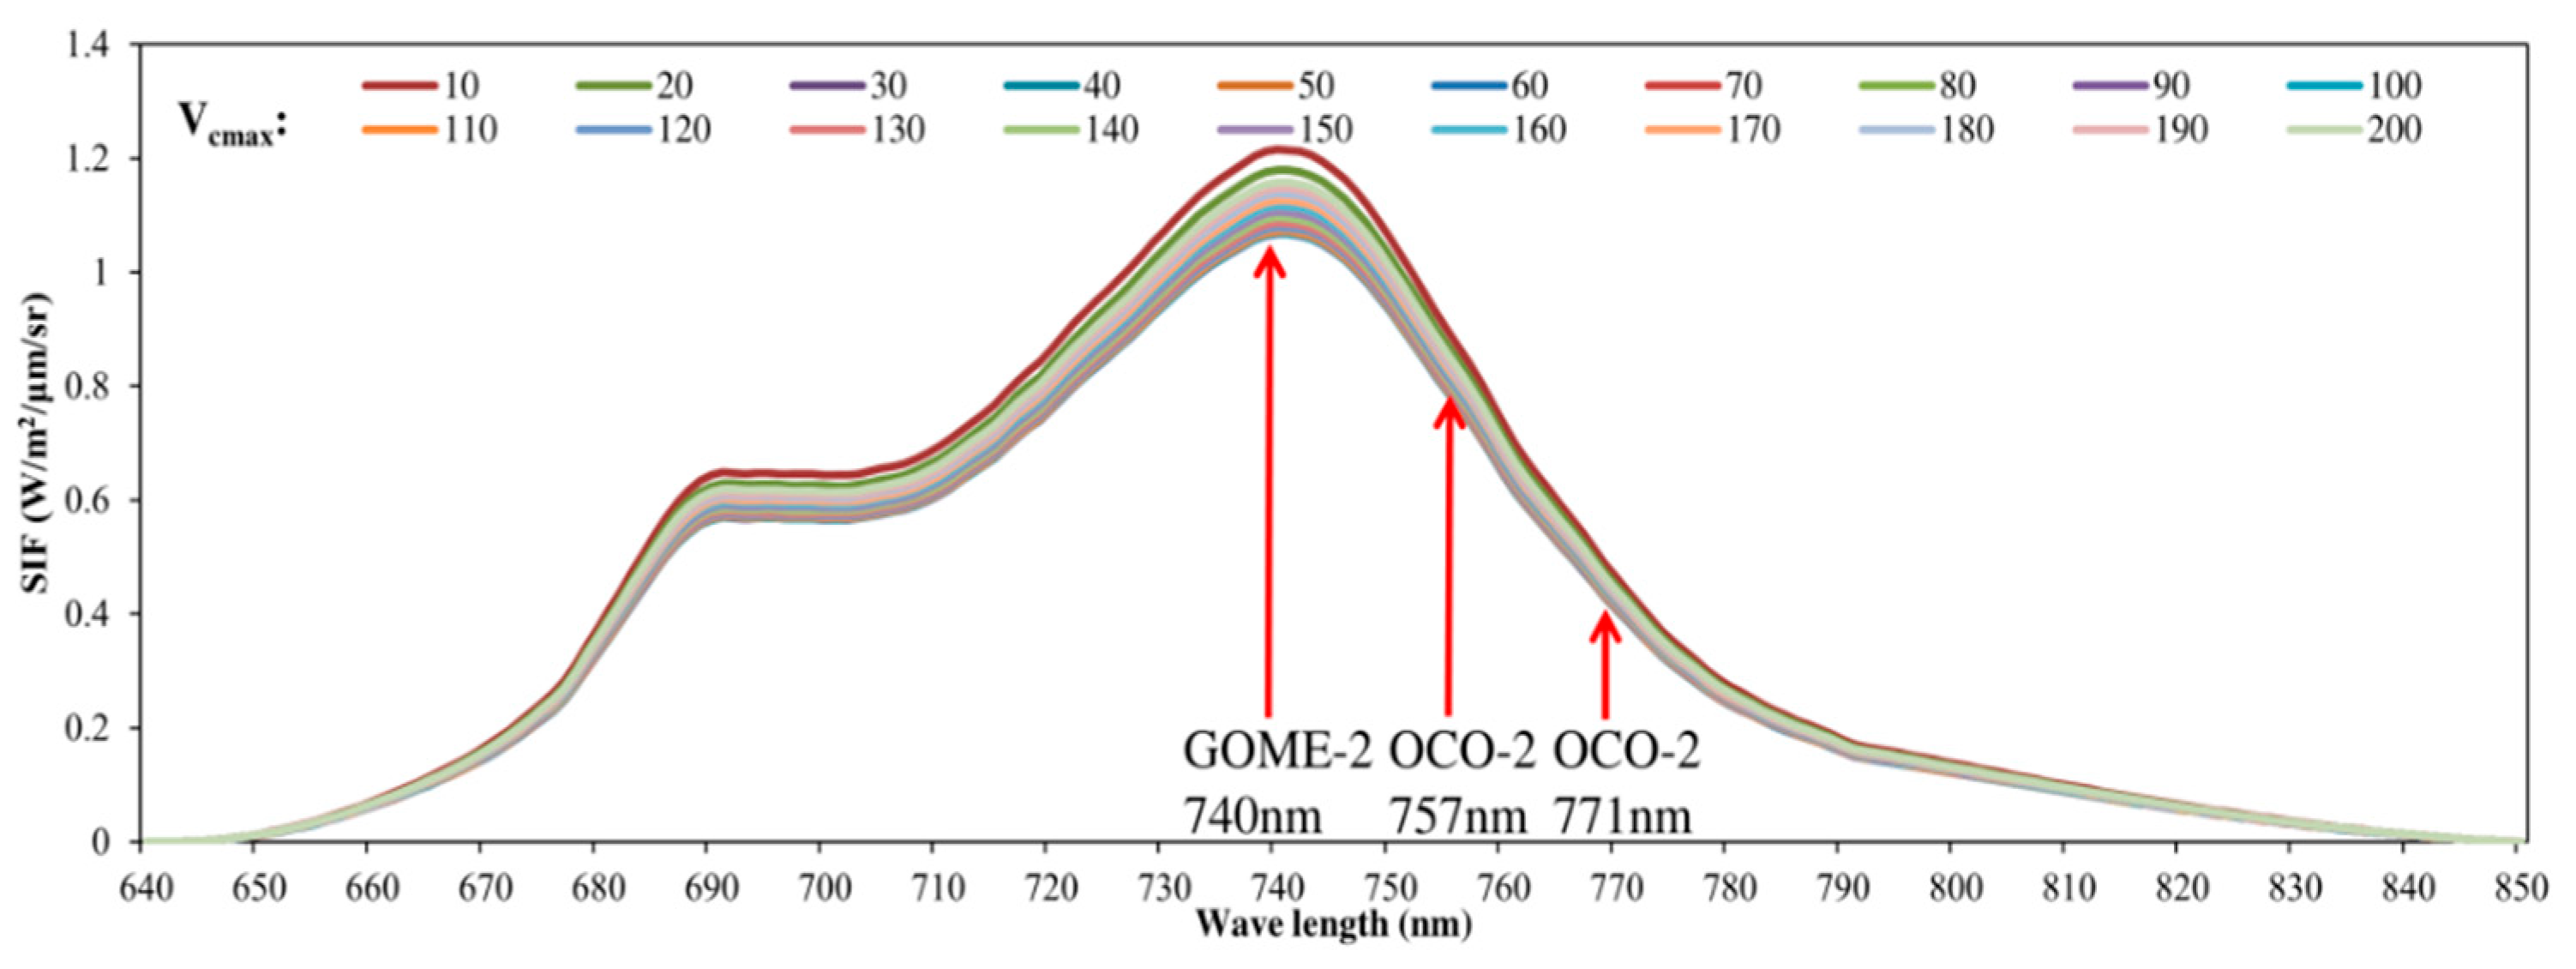
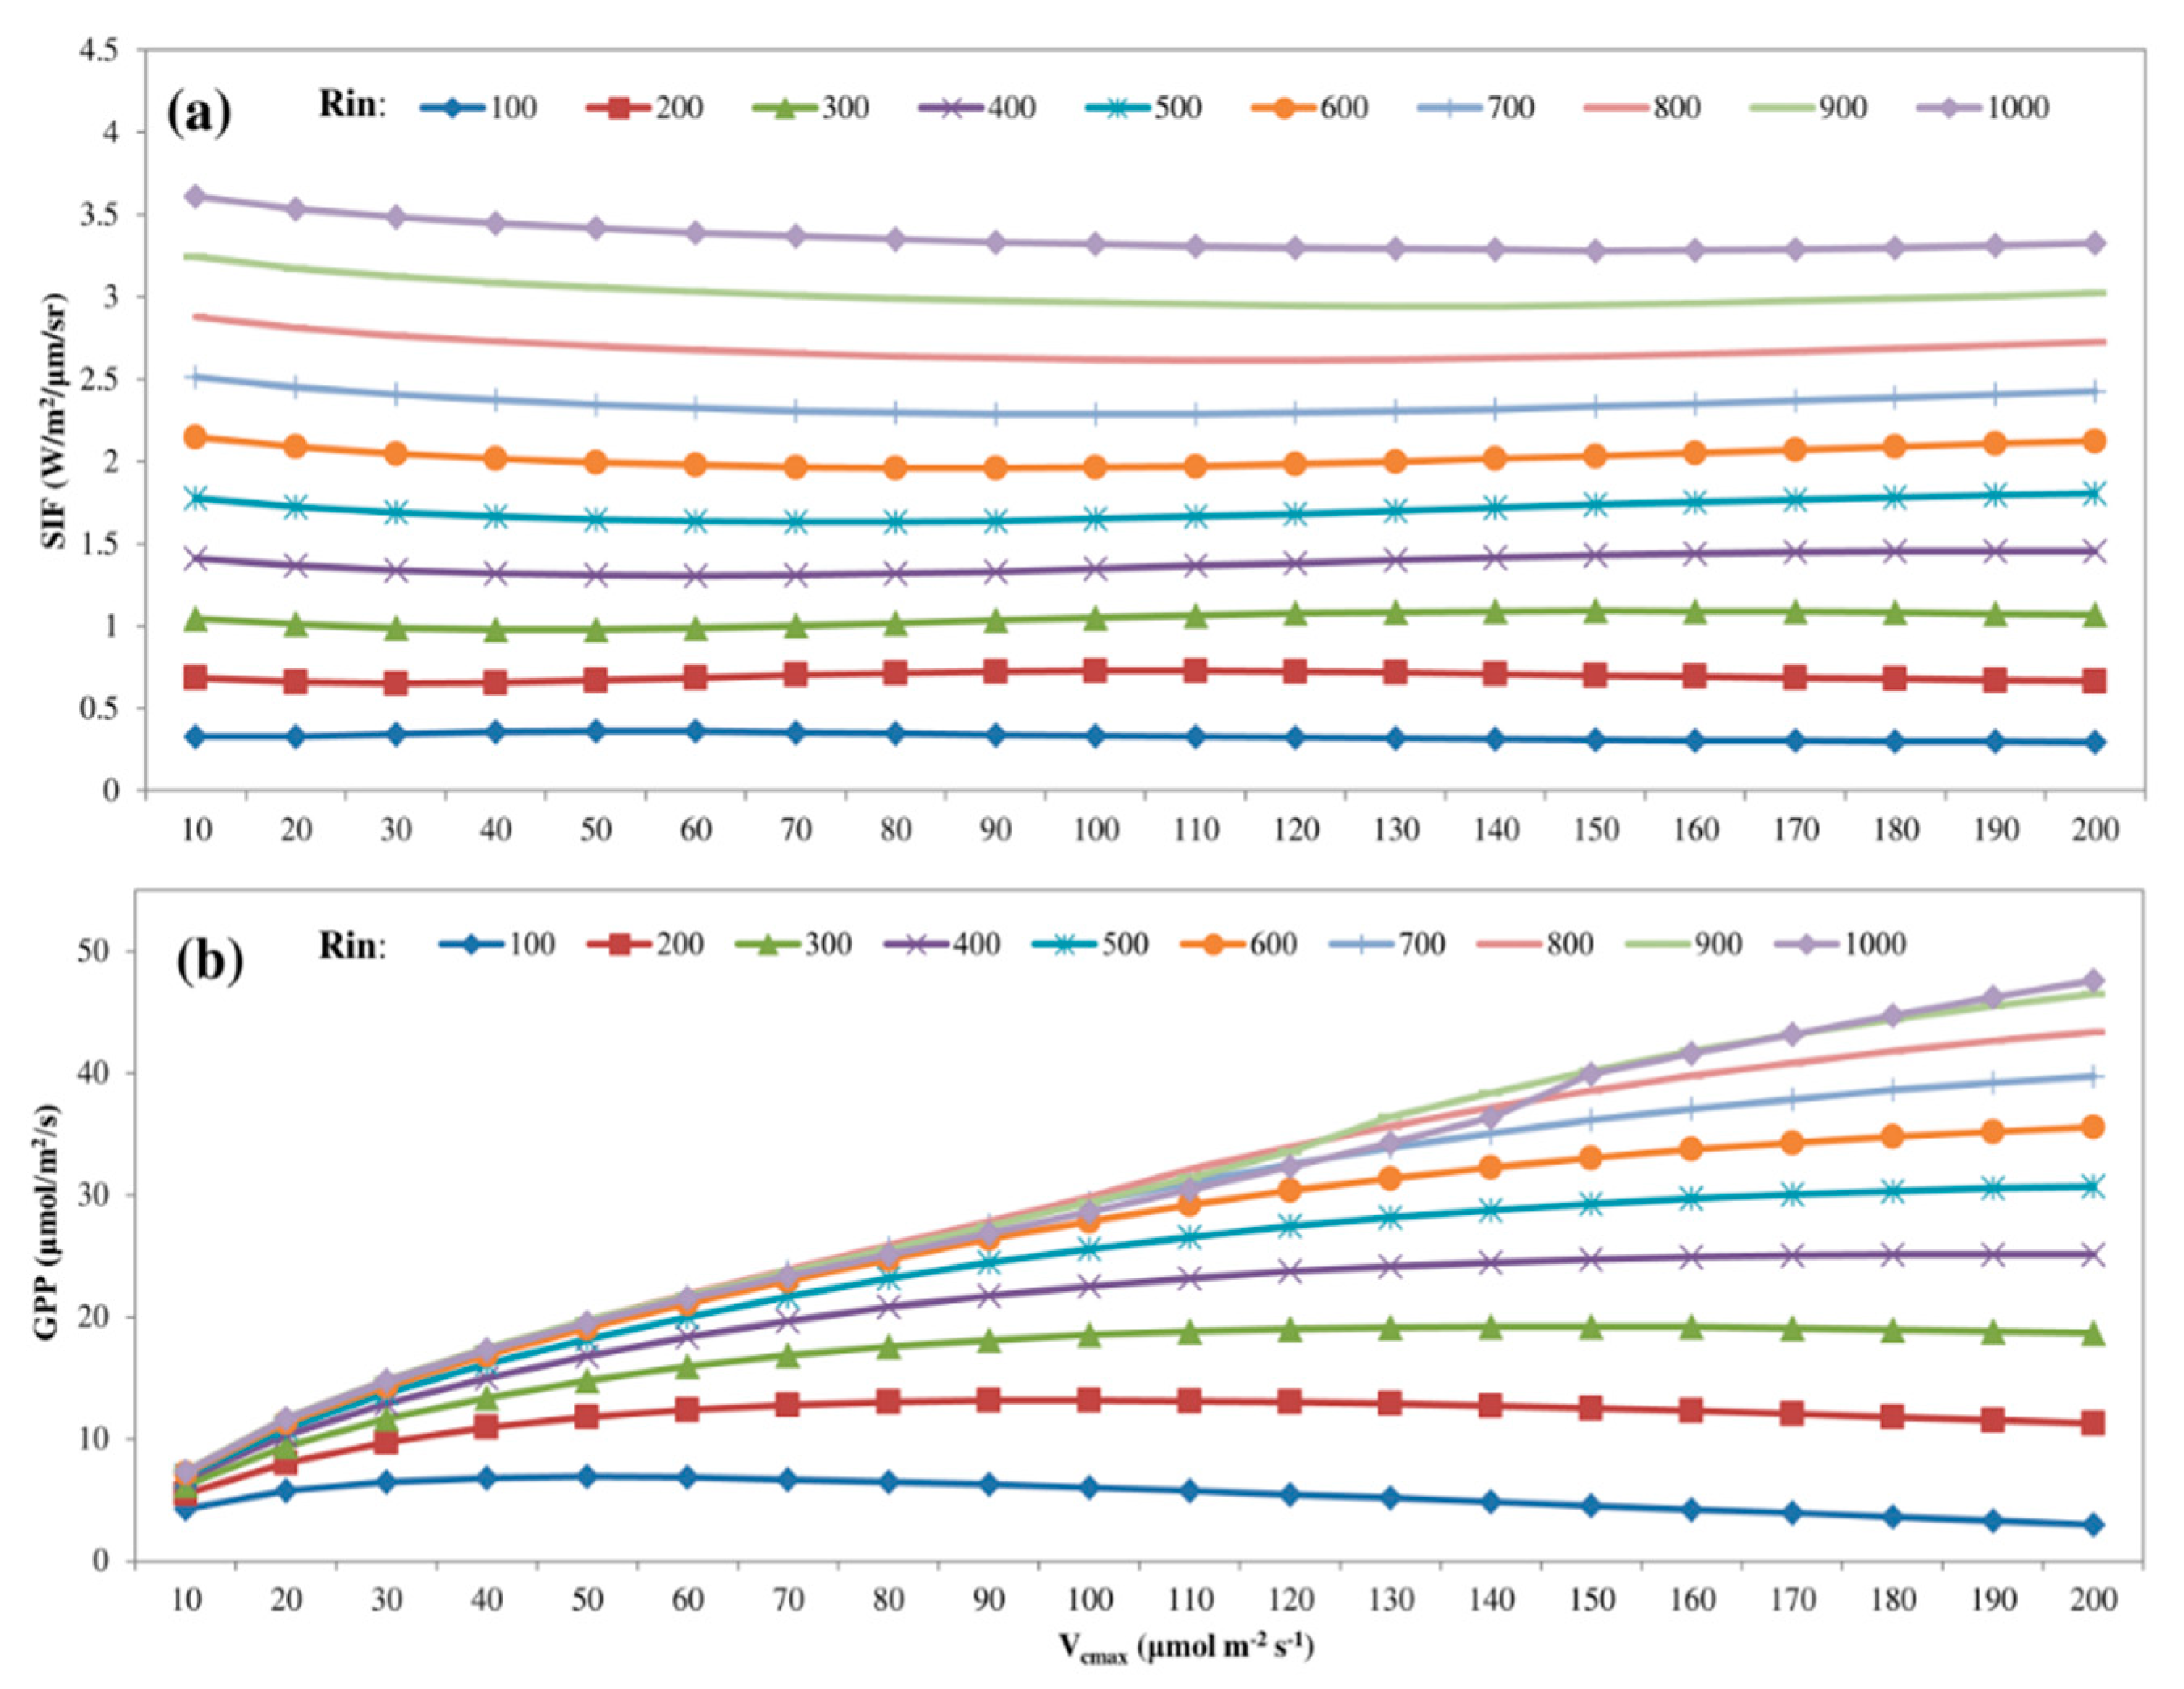
3.1. Parameter Sensitivity Analysis of the Soil Canopy Observation, Photochemistry and Energy Fluxes (SCOPE) Model

We performed a sensitivity analysis of all parameters related to photosynthesis and SIF simulations. The first sensitivity index (SI 1st) and the total sensitivity index (SI total) of model parameters for SCOPE-simulated SIF (in OCO-2 SIF wavelengths of 757 nm and 771 nm) and GPP are illustrated in Figure 3. The results of the sensitivity analysis showed that for the SIF estimation, fqe was the most sensitive parameter, while Vcmax was one of the least sensitive parameters (Figure 3a). The simulated SIF was sensitive to fqe, Cab, and LAI with the total-order impact ratio of 48.0%, 18.1%, and 16.7%, respectively. The other parameters had relatively low impact ratios (less than 5%). However, for the GPP simulation, the most sensitive parameters were Vcmax, LAI, Rd, and Cab with the total-order impact ratio of 41.7%, 31.4%, 16.1%, and 5.4%, respectively, and other parameters had relatively low impact ratio (Figure 3b). For the objective function of both SIF and GPP, both fqe and Vcmax were the most sensitive parameters (Figure 3c); both GPP and SIF were sensitive to Vcmax, Cab, Rd, fqe, and LAI with the total-order impact ratio of 21.9%, 21.2%, 17.7%, 15.3%, and 13.2%, respectively, while other parameters had relatively low impact ratio. Both LAI and Cab were used as input variables for the simulation of GPP and SIF and were therefore not optimized in this study.
To determine the feasibility and sensitivity of satellite measured SIF derived from different sensors (i.e., GOME-2 and OCO-2) to Vcmax, we conducted a sensitivity analysis with different Vcmax values ranging from 10 to 200 μmol m−2 s−1 (Figure 4). The SIF spectrum ranged from 640 to 850 nm with two peaks centered at 685 nm and 740 nm. The sensitivity of SIF to Vcmax was higher at 757 nm than at 771 nm. The GOME-2 wavelength (740 nm) is right at one of the SIF emission peaks, which is also the Vcmax sensitivity band for SIF prediction. The sensitivity of SIF to Vcmax at the GOME-2 wavelength (740 nm) was higher than that of the OCO-2 wavelengths (757 nm and 771 nm).
To investigate how both GPP and SIF responded to Vcmax and light conditions, we further performed a sensitivity analysis with varying Vcmax values and light conditions (Figure 5). With varying Vcmax at the constant irradiance, SIF did not significantly increase with increasing Vcmax; for a given Vcmax value, SIF increased with increasing solar irradiance (Figure 5a). In contrast, GPP increased with increasing Vcmax, particularly at higher light conditions, and light saturation of GPP occurred under lower light conditions with lower Vcmax values (Figure 5b).

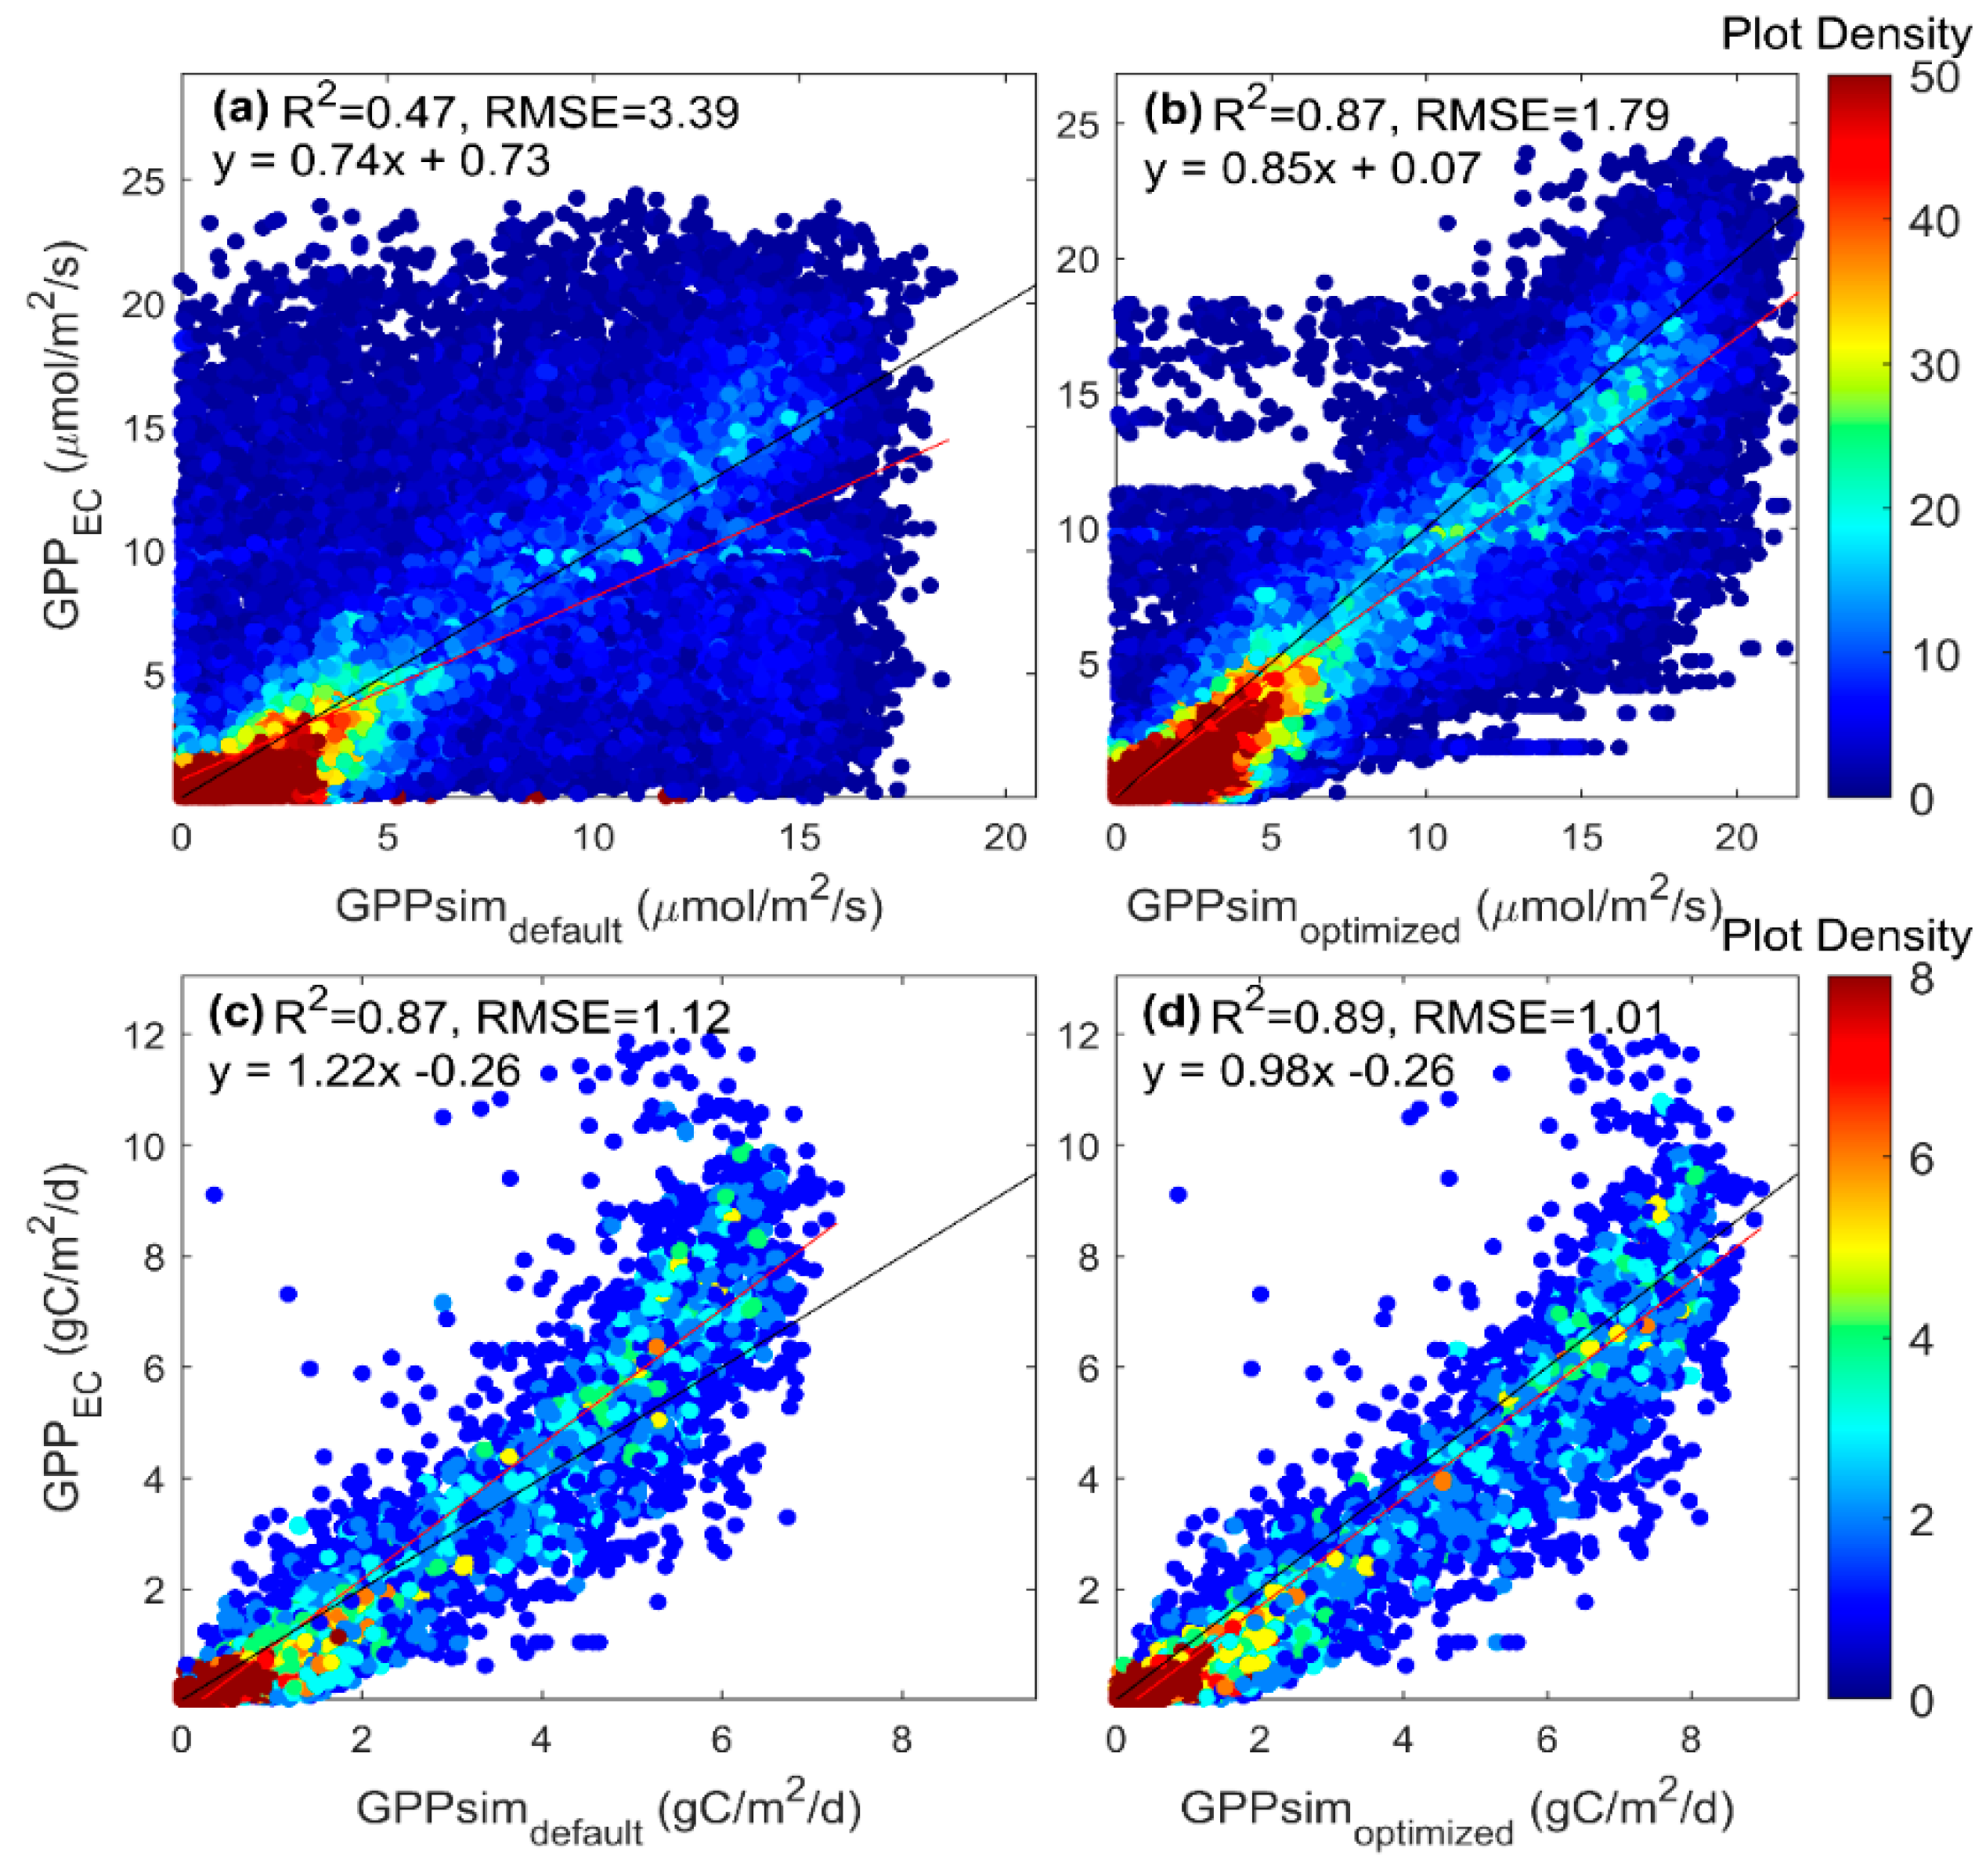
3.2. Parameter Estimation of the SCOPE Model

The optimized values of the three most important parameters (Vcmax, Rd, and fqe) in SIF and GPP simulations are given in Table 2. These optimized values were used for the SCOPE model simulation at Park Falls. Figure 6 shows the performance of SCOPE for estimating GPP and SIF at Park Falls, which illustrates the seasonal trajectories of GPP and SIF simulated by SCOPE with the objective function of SIF and GPP, respectively. The simulated GPP and SIF were validated with the flux tower-based GPP and OCO-2 SIF data, respectively. We found that the simulated GPP was well correlated with flux tower GPP with R2 values of 0.45 and 0.88 (RMSE = 2.11 and 1.20 gC m2 day−1) at the daily time scale for the objective function of SIF and GPP, respectively. The simulated SIF was strongly correlated with OCO-2 SIF with R2 values of 0.77 and 0.76 for the 757 nm wavelength (the RMSE were 0.14 and 0.54 W m−2 μm−1 sr−1), and 0.75 and 0.74 for the 771 nm wavelength (the RMSE were 0.06 and 0.27 W m−2 μm−1 sr−1) for the objective functions of SIF and GPP, respectively. Our results showed that the model performance varied with the objective function: GPP was better simulated with GPP as the objective function, and similarly, SIF was better simulated with SIF as the objective function.
Figure 7 shows the performance of the optimized SCOPE model using both GPP and SIF as constraints for simulating GPP and SIF at Park Falls. Generally, the original model based on the default parameters had a good performance. The SCOPE model with the optimized parameters improved the performance of GPP and SIF simulations, with R2 = 0.90 and RMSE = 0.90 gC m−2 day−1 for daily GPP, R2 = 0.77 and RMSE = 0.15 W m−2 μm−1 sr−1 for SIF at the 757 nm wavelength, and R2 = 0.74 and RMSE = 0.07 W m−2 μm−1 sr−1 for SIF at the 771 nm wavelength.
To further evaluate the performance of the optimized model, we validated the model optimized with both SIF and GPP as constraints independently at the Willow Creek site. We compared GPP and SIF simulated by the SCOPE model based on the default and optimized parameters against flux tower GPP and OCO-2 SIF observations at Willow Creek (Figure 8). The model based on the optimized parameters estimated both GPP and SIF fairly well (R2 = 0.88 and RMSE = 1.47 gC m2 day−1 for daily GPP, R2 = 0.70 and RMSE = 0.15 W m−2 μm−1 sr−1 for SIF at 757 nm, R2 = 0.61 and RMSE = 0.09 W m−2 μm−1 sr−1 for SIF at 771 nm). The simulated GPP and SIF based on the optimized parameters were more consistent with flux tower GPP and OCO-2 SIF in seasonal trajectories than the simulated GPP and SIF based on the default parameters (Figure 8).

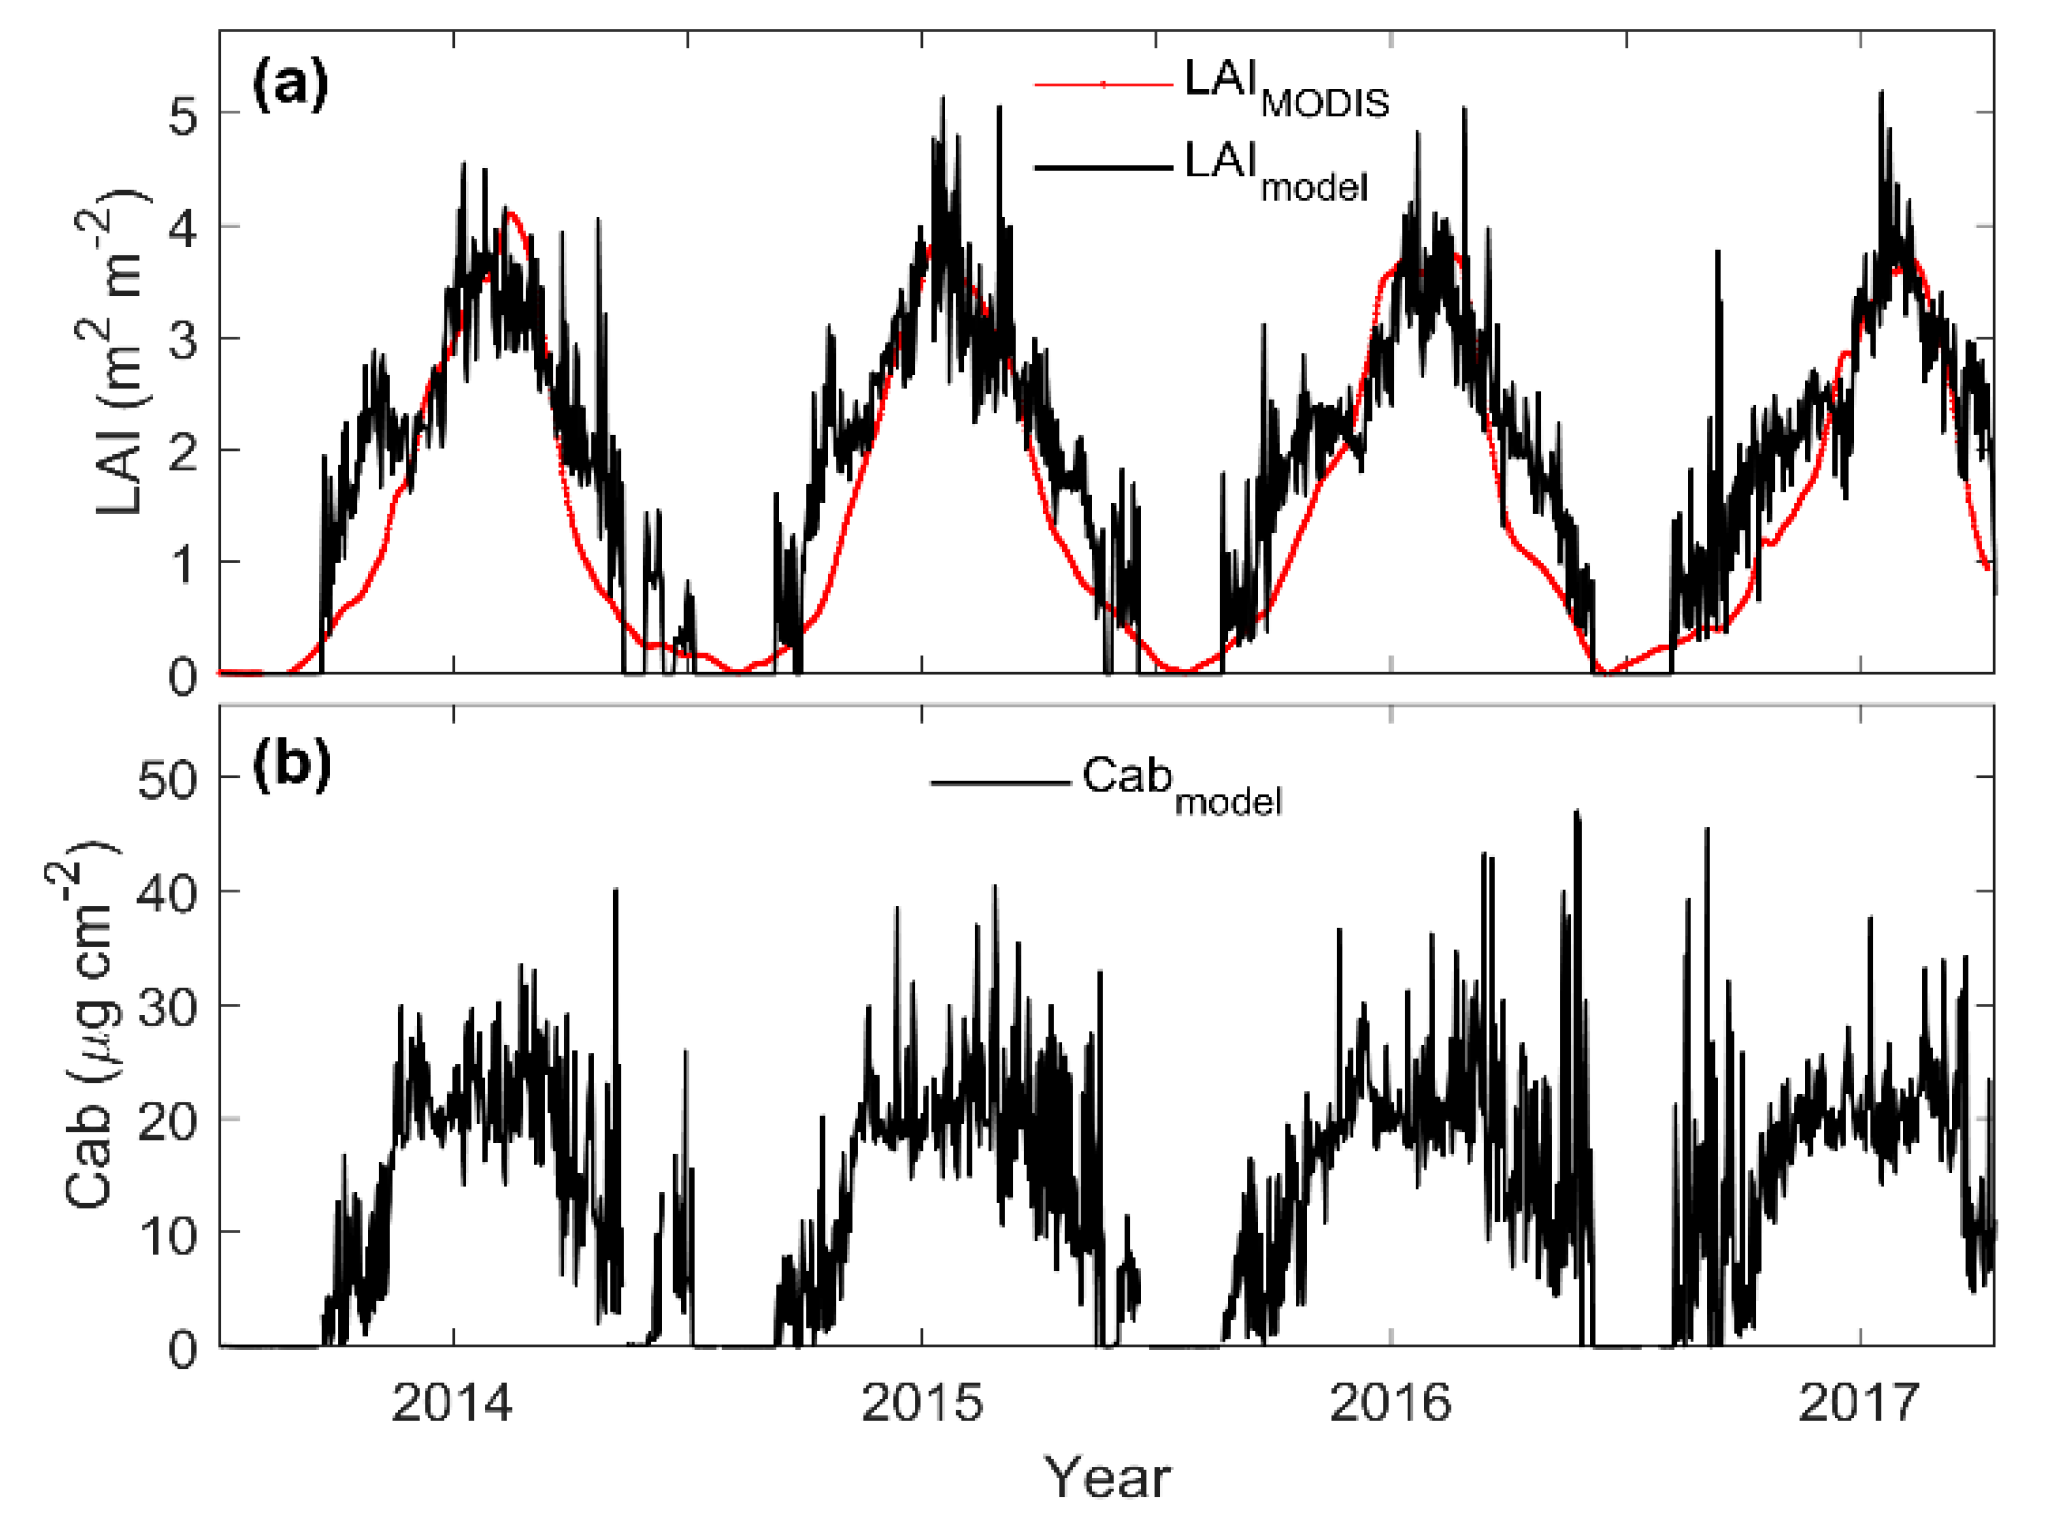
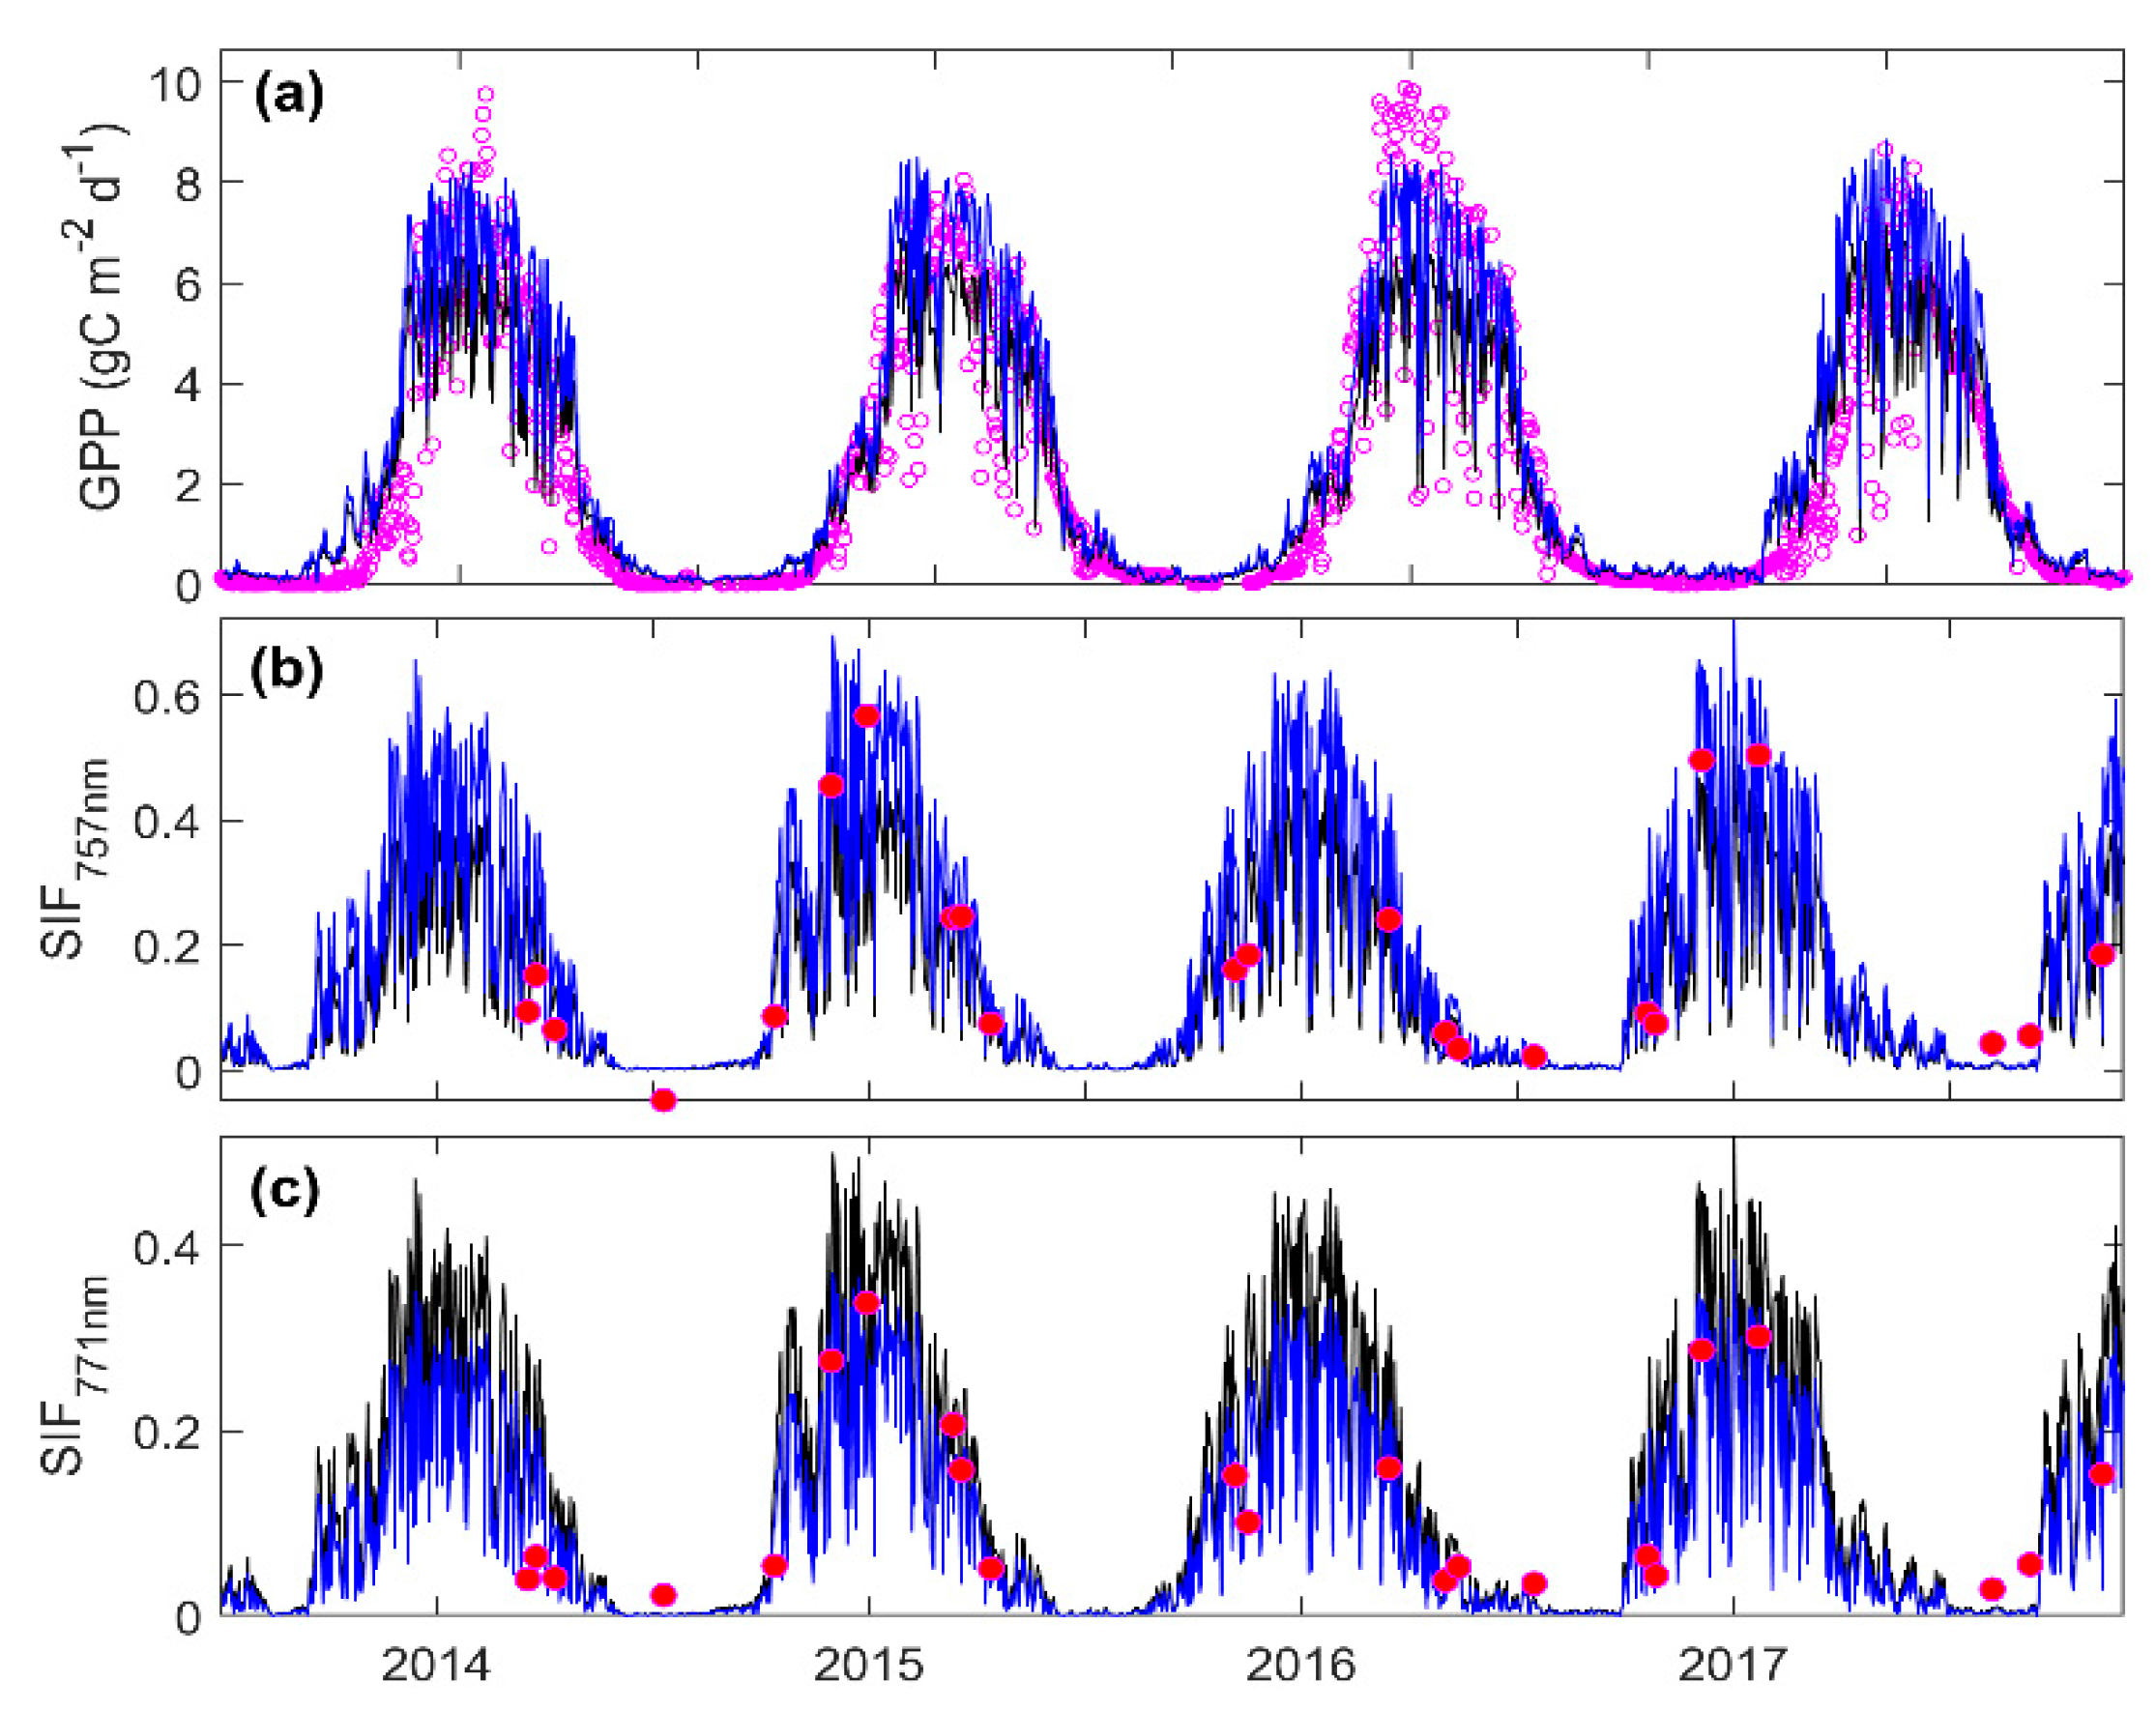
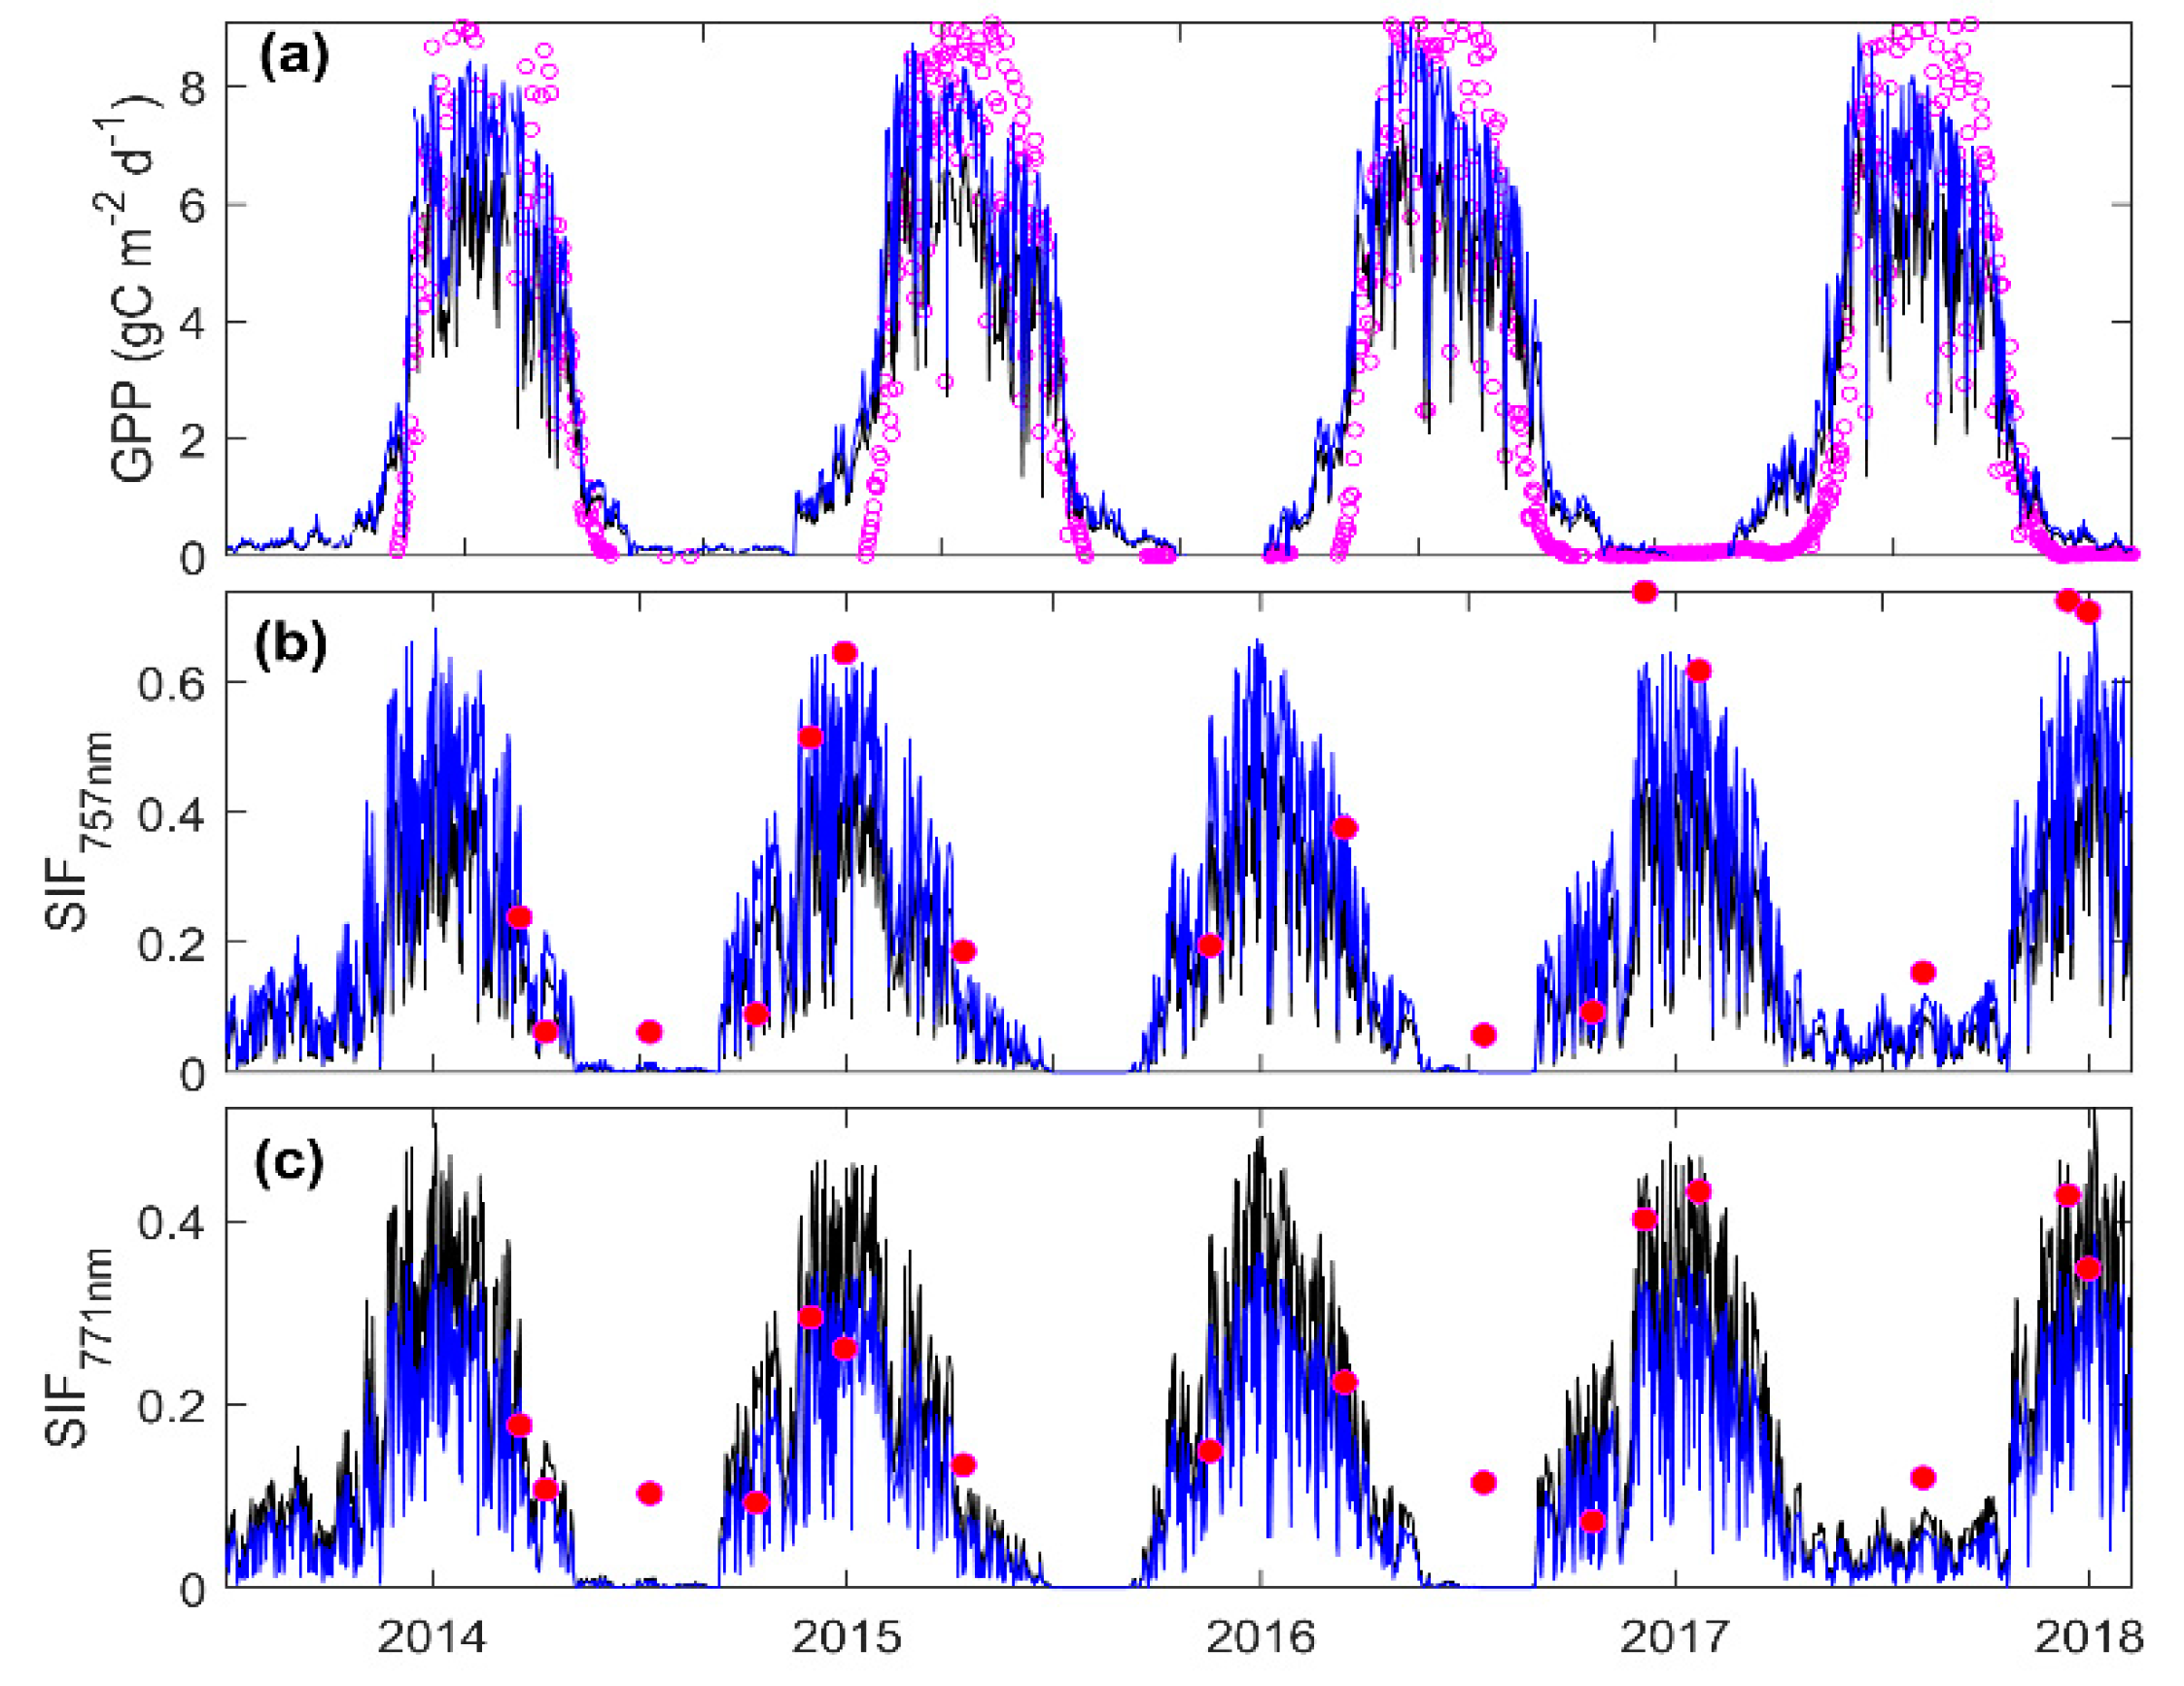
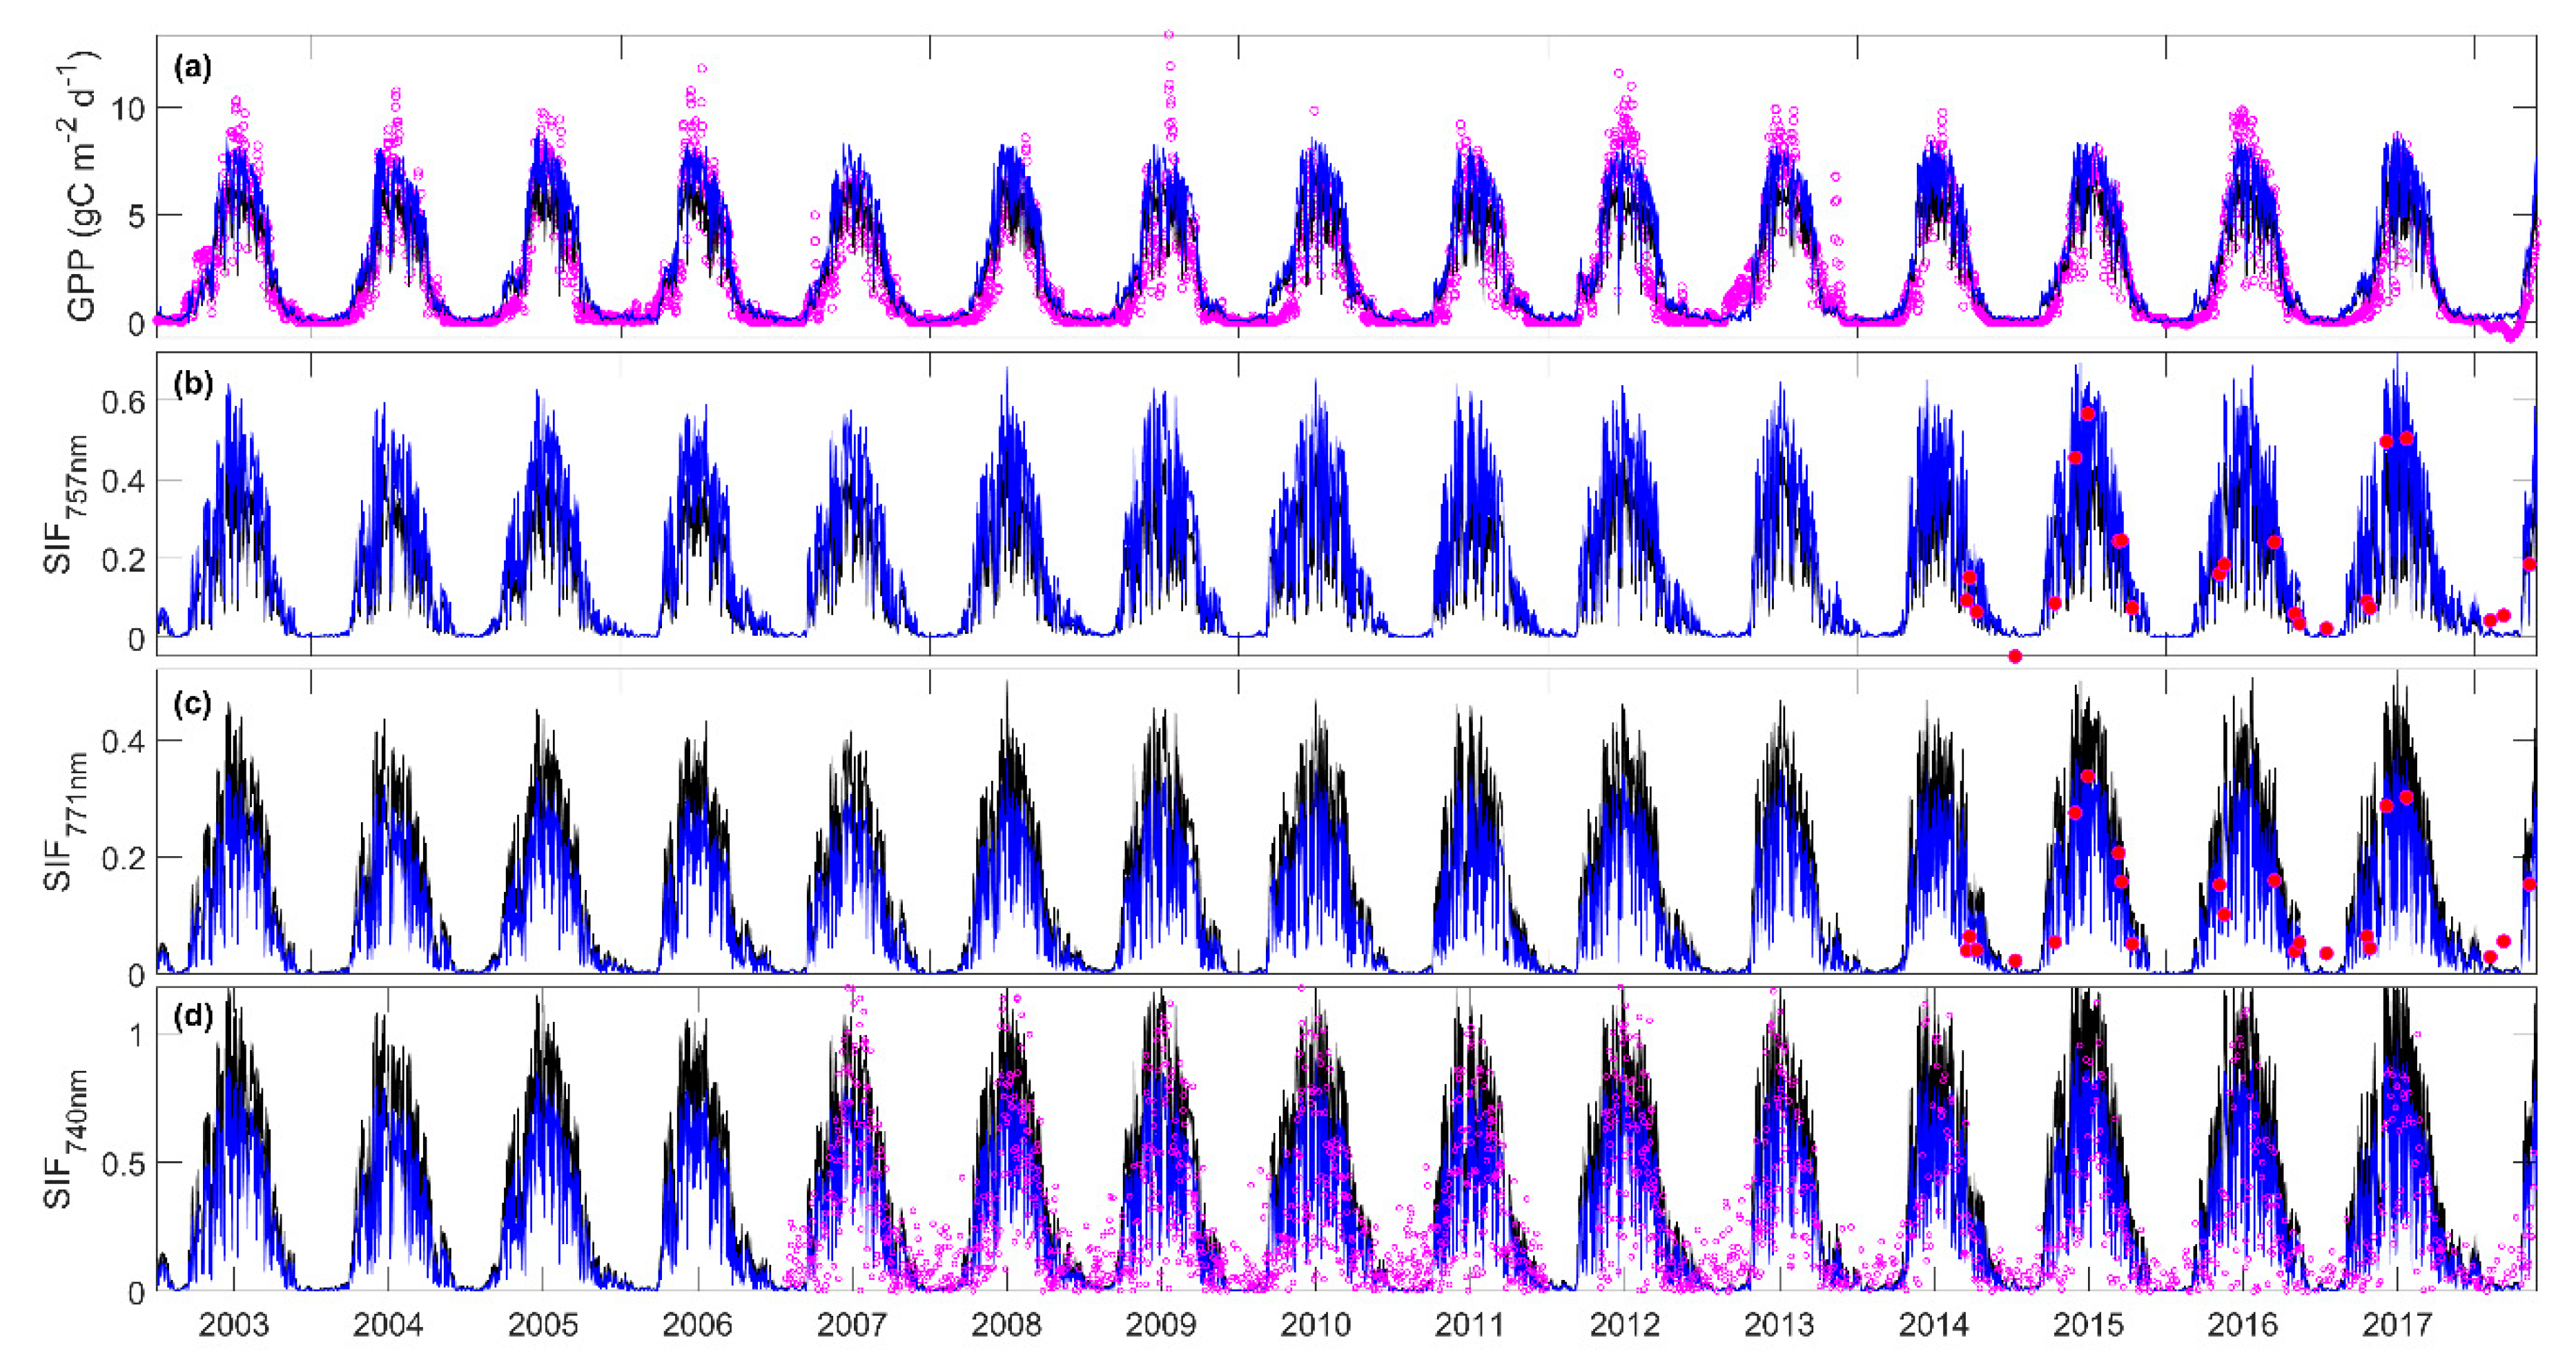
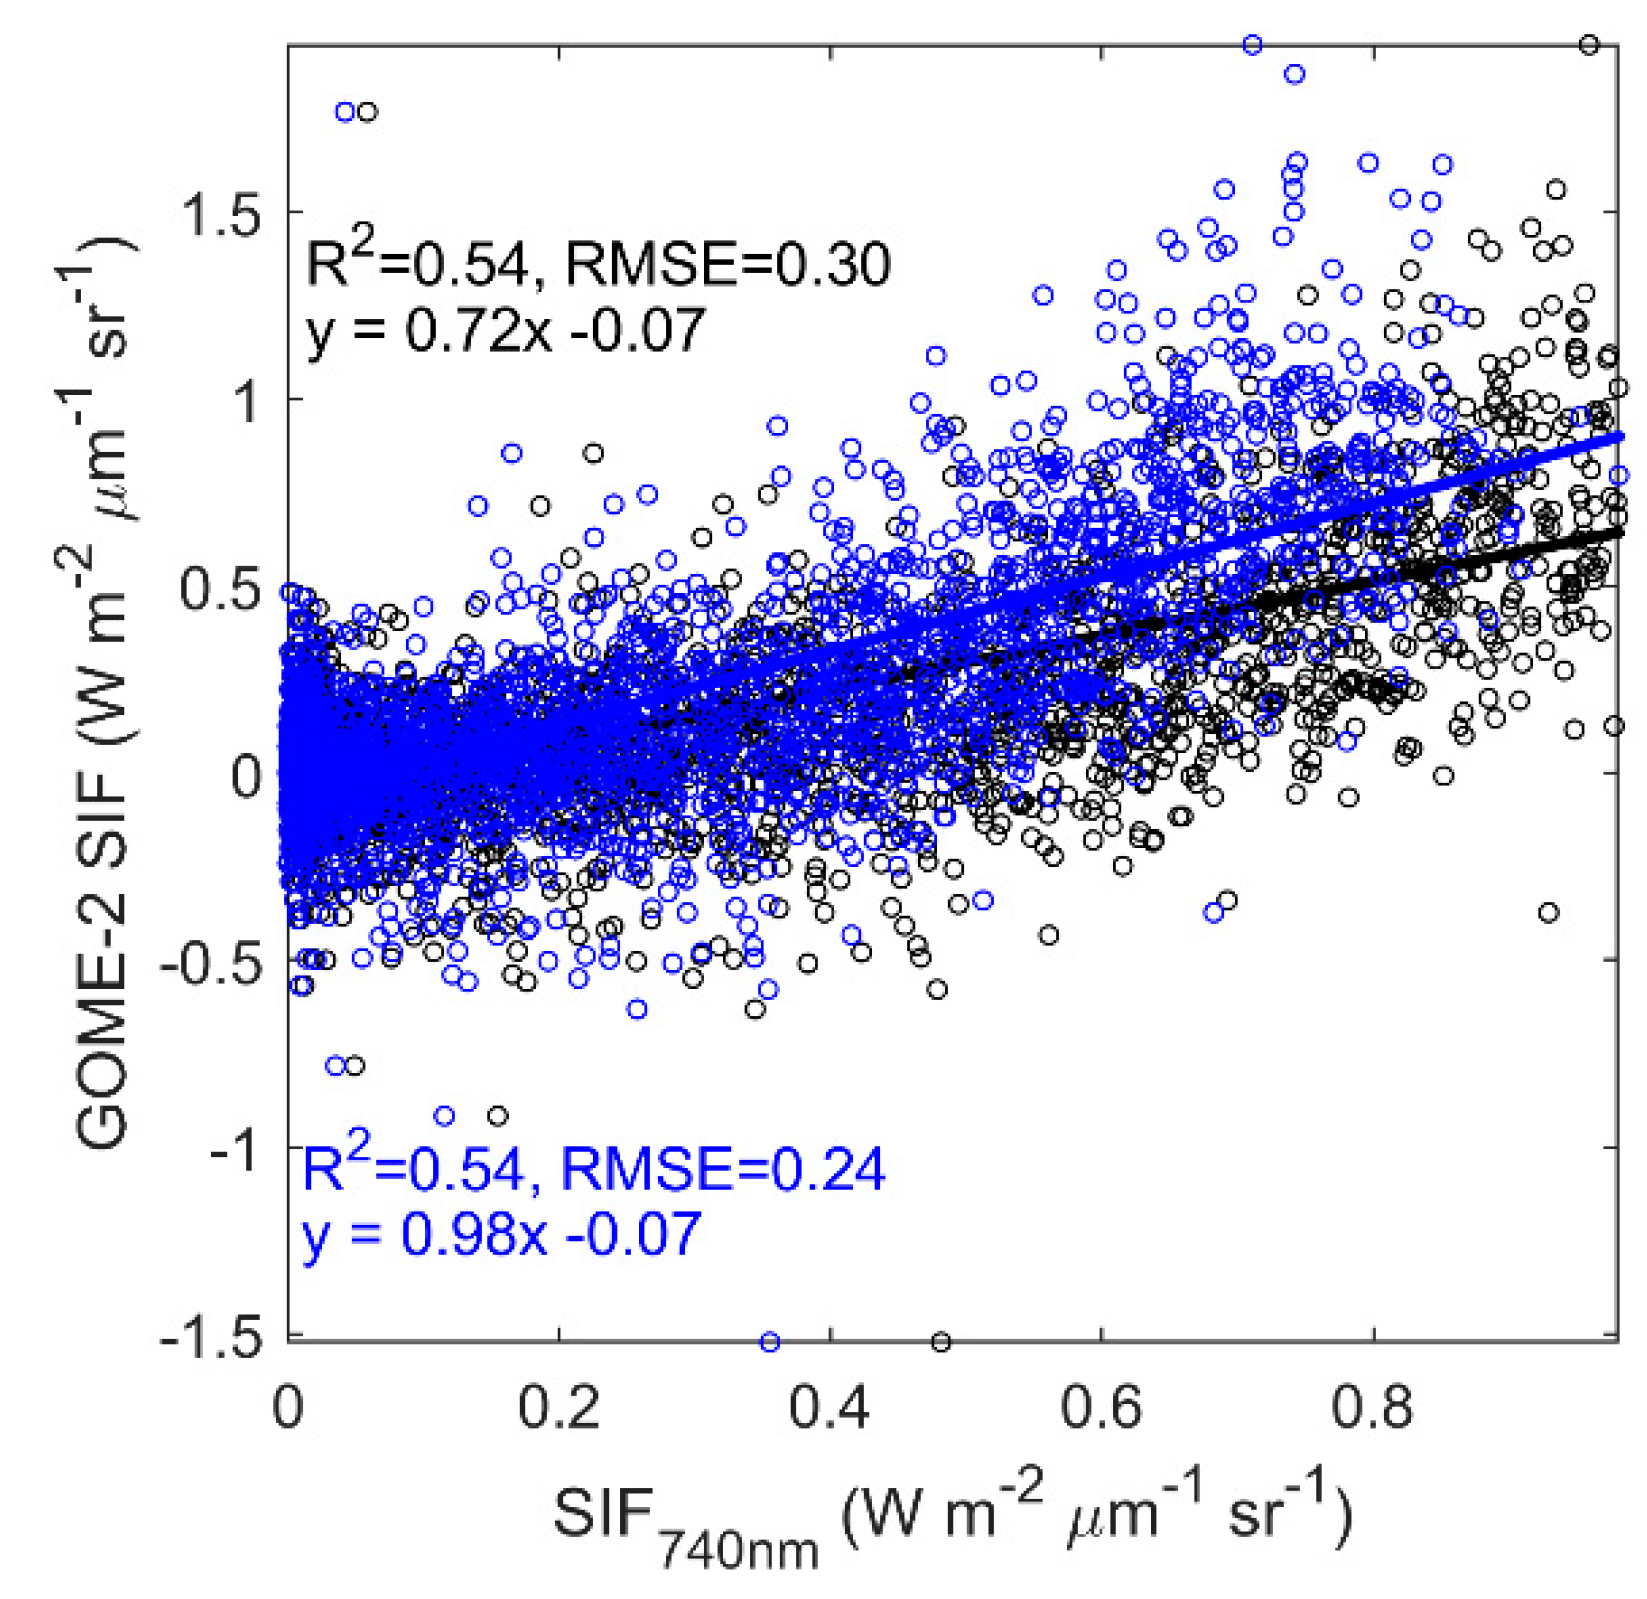
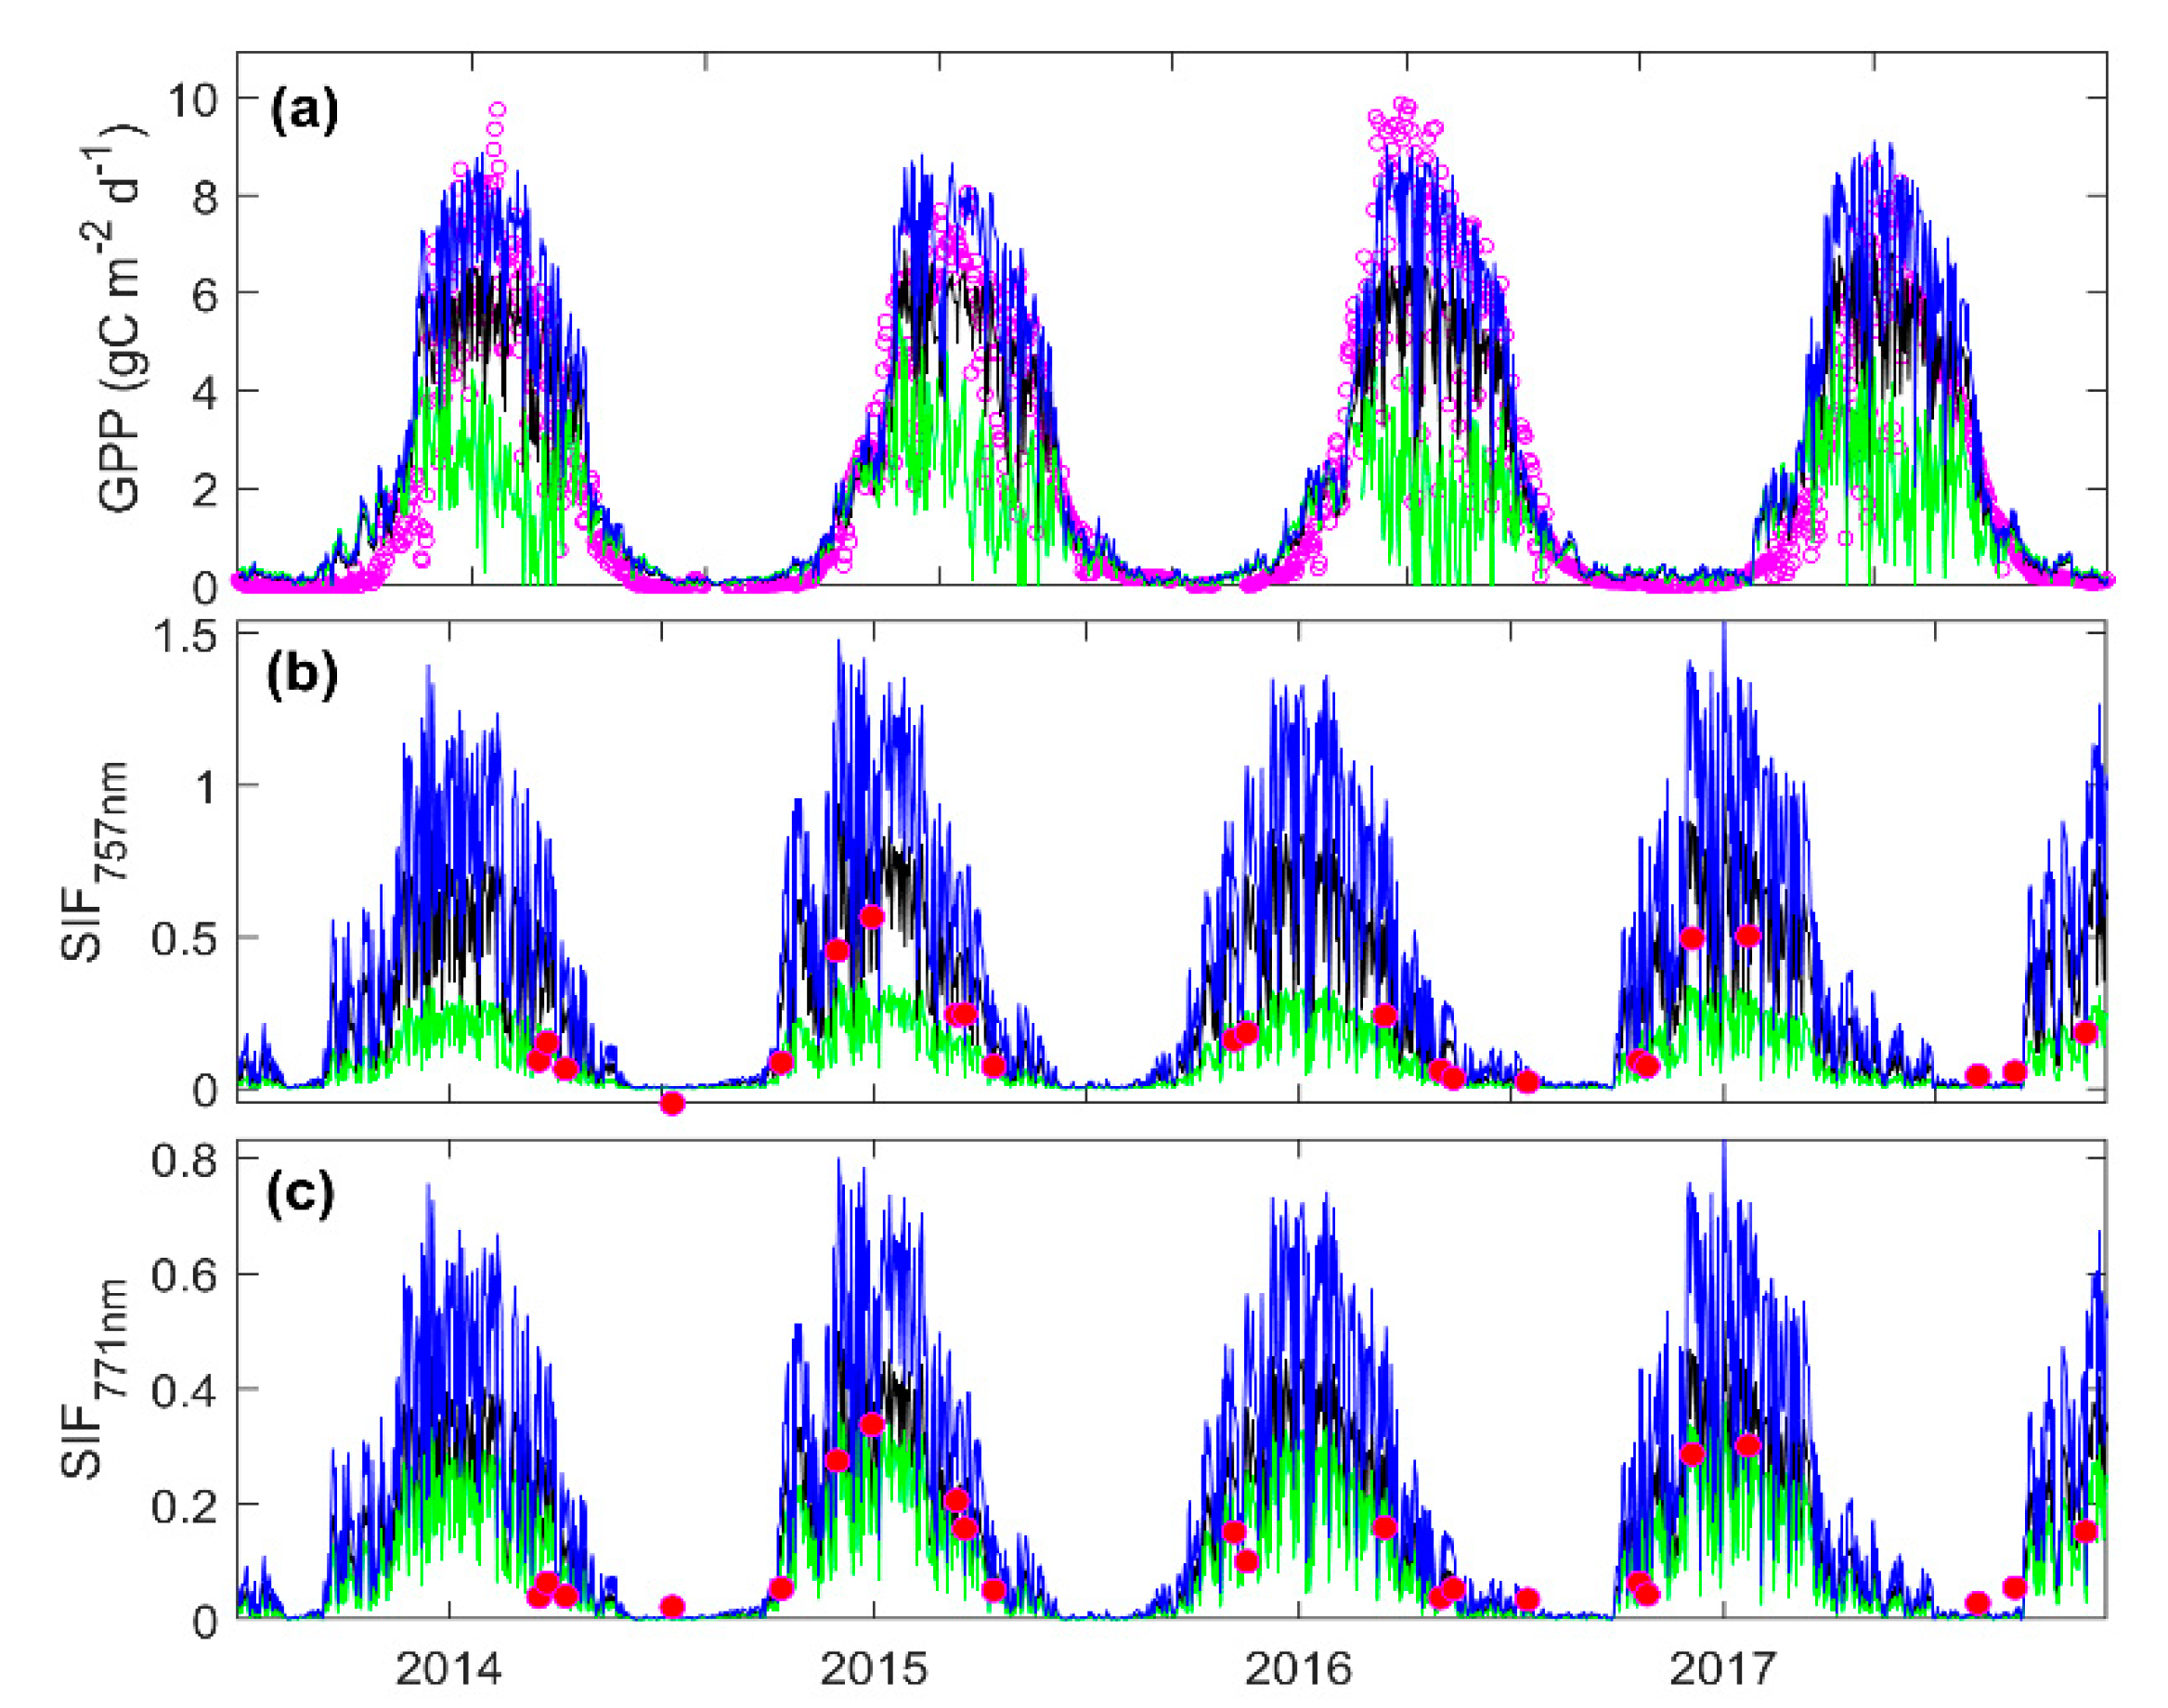
3.3. Predicting Long-Term SIF and GPP Using the Optimized Model

We further predicted the long-term SIF and GPP from 2003 to 2017 using the optimized SCOPE model. The GPP and SIF series simulated by the SCOPE model against flux tower GPP and satellite-based SIF data at Park Falls are illustrated in Figure 9 and Figure 10. The seasonal trajectories of GPP and SIF simulated based on the optimized parameters were compared against those based on the default parameters. The simulated daily GPP based on the optimized parameters was more consistent with the flux tower GPP compared with that based on the default parameters. Similarly, the simulated SIF (757 nm, 771 nm, and 740 nm) based on the optimized parameters were also more consistent with the OCO-2 and GOME-2 SIF observations compared with that based on the default parameters. Figure 10 shows the scatter plots of predicted GPP against flux tower GPP from 2003 to 2017. The optimized model had improved performance in predicting GPP than the model with the default parameters at both hourly and daily timescales. We also found that the model with the optimized parameters had higher performance (lower RMSE and higher slope) in predicting SIF at GOME-2 SIF wavelength (740 nm) over the period 2007–2017 (Figure 11).

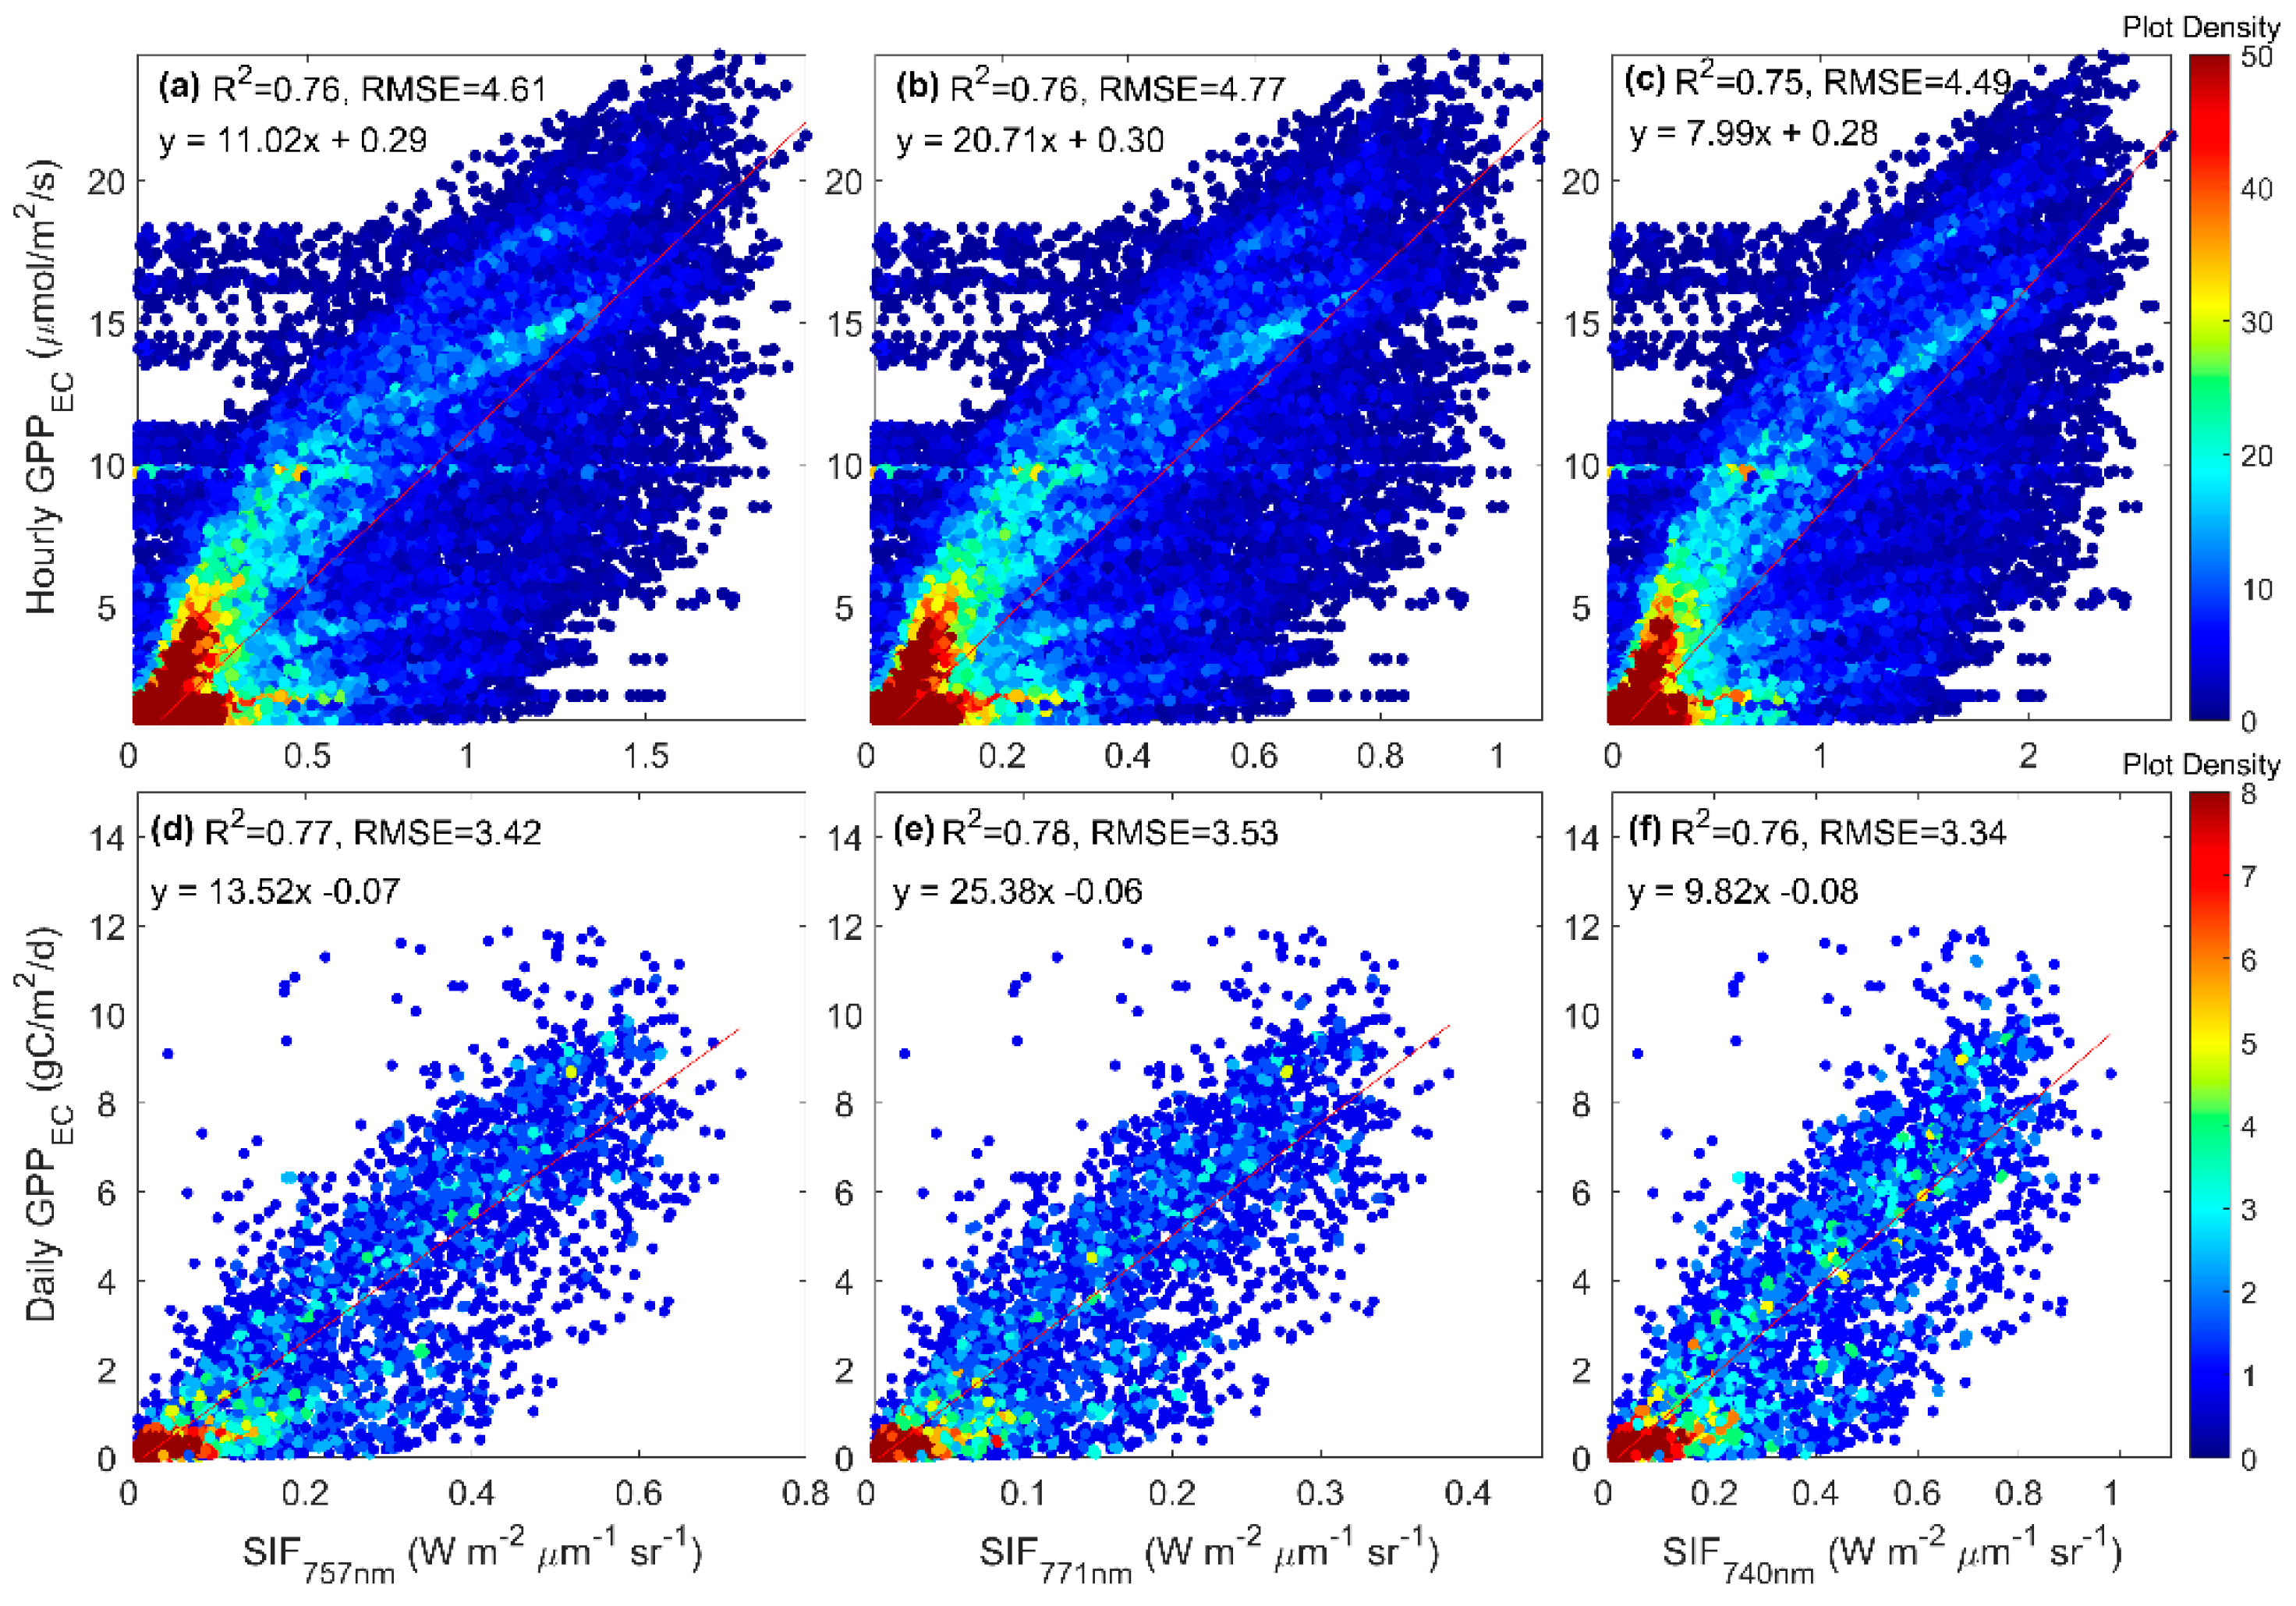
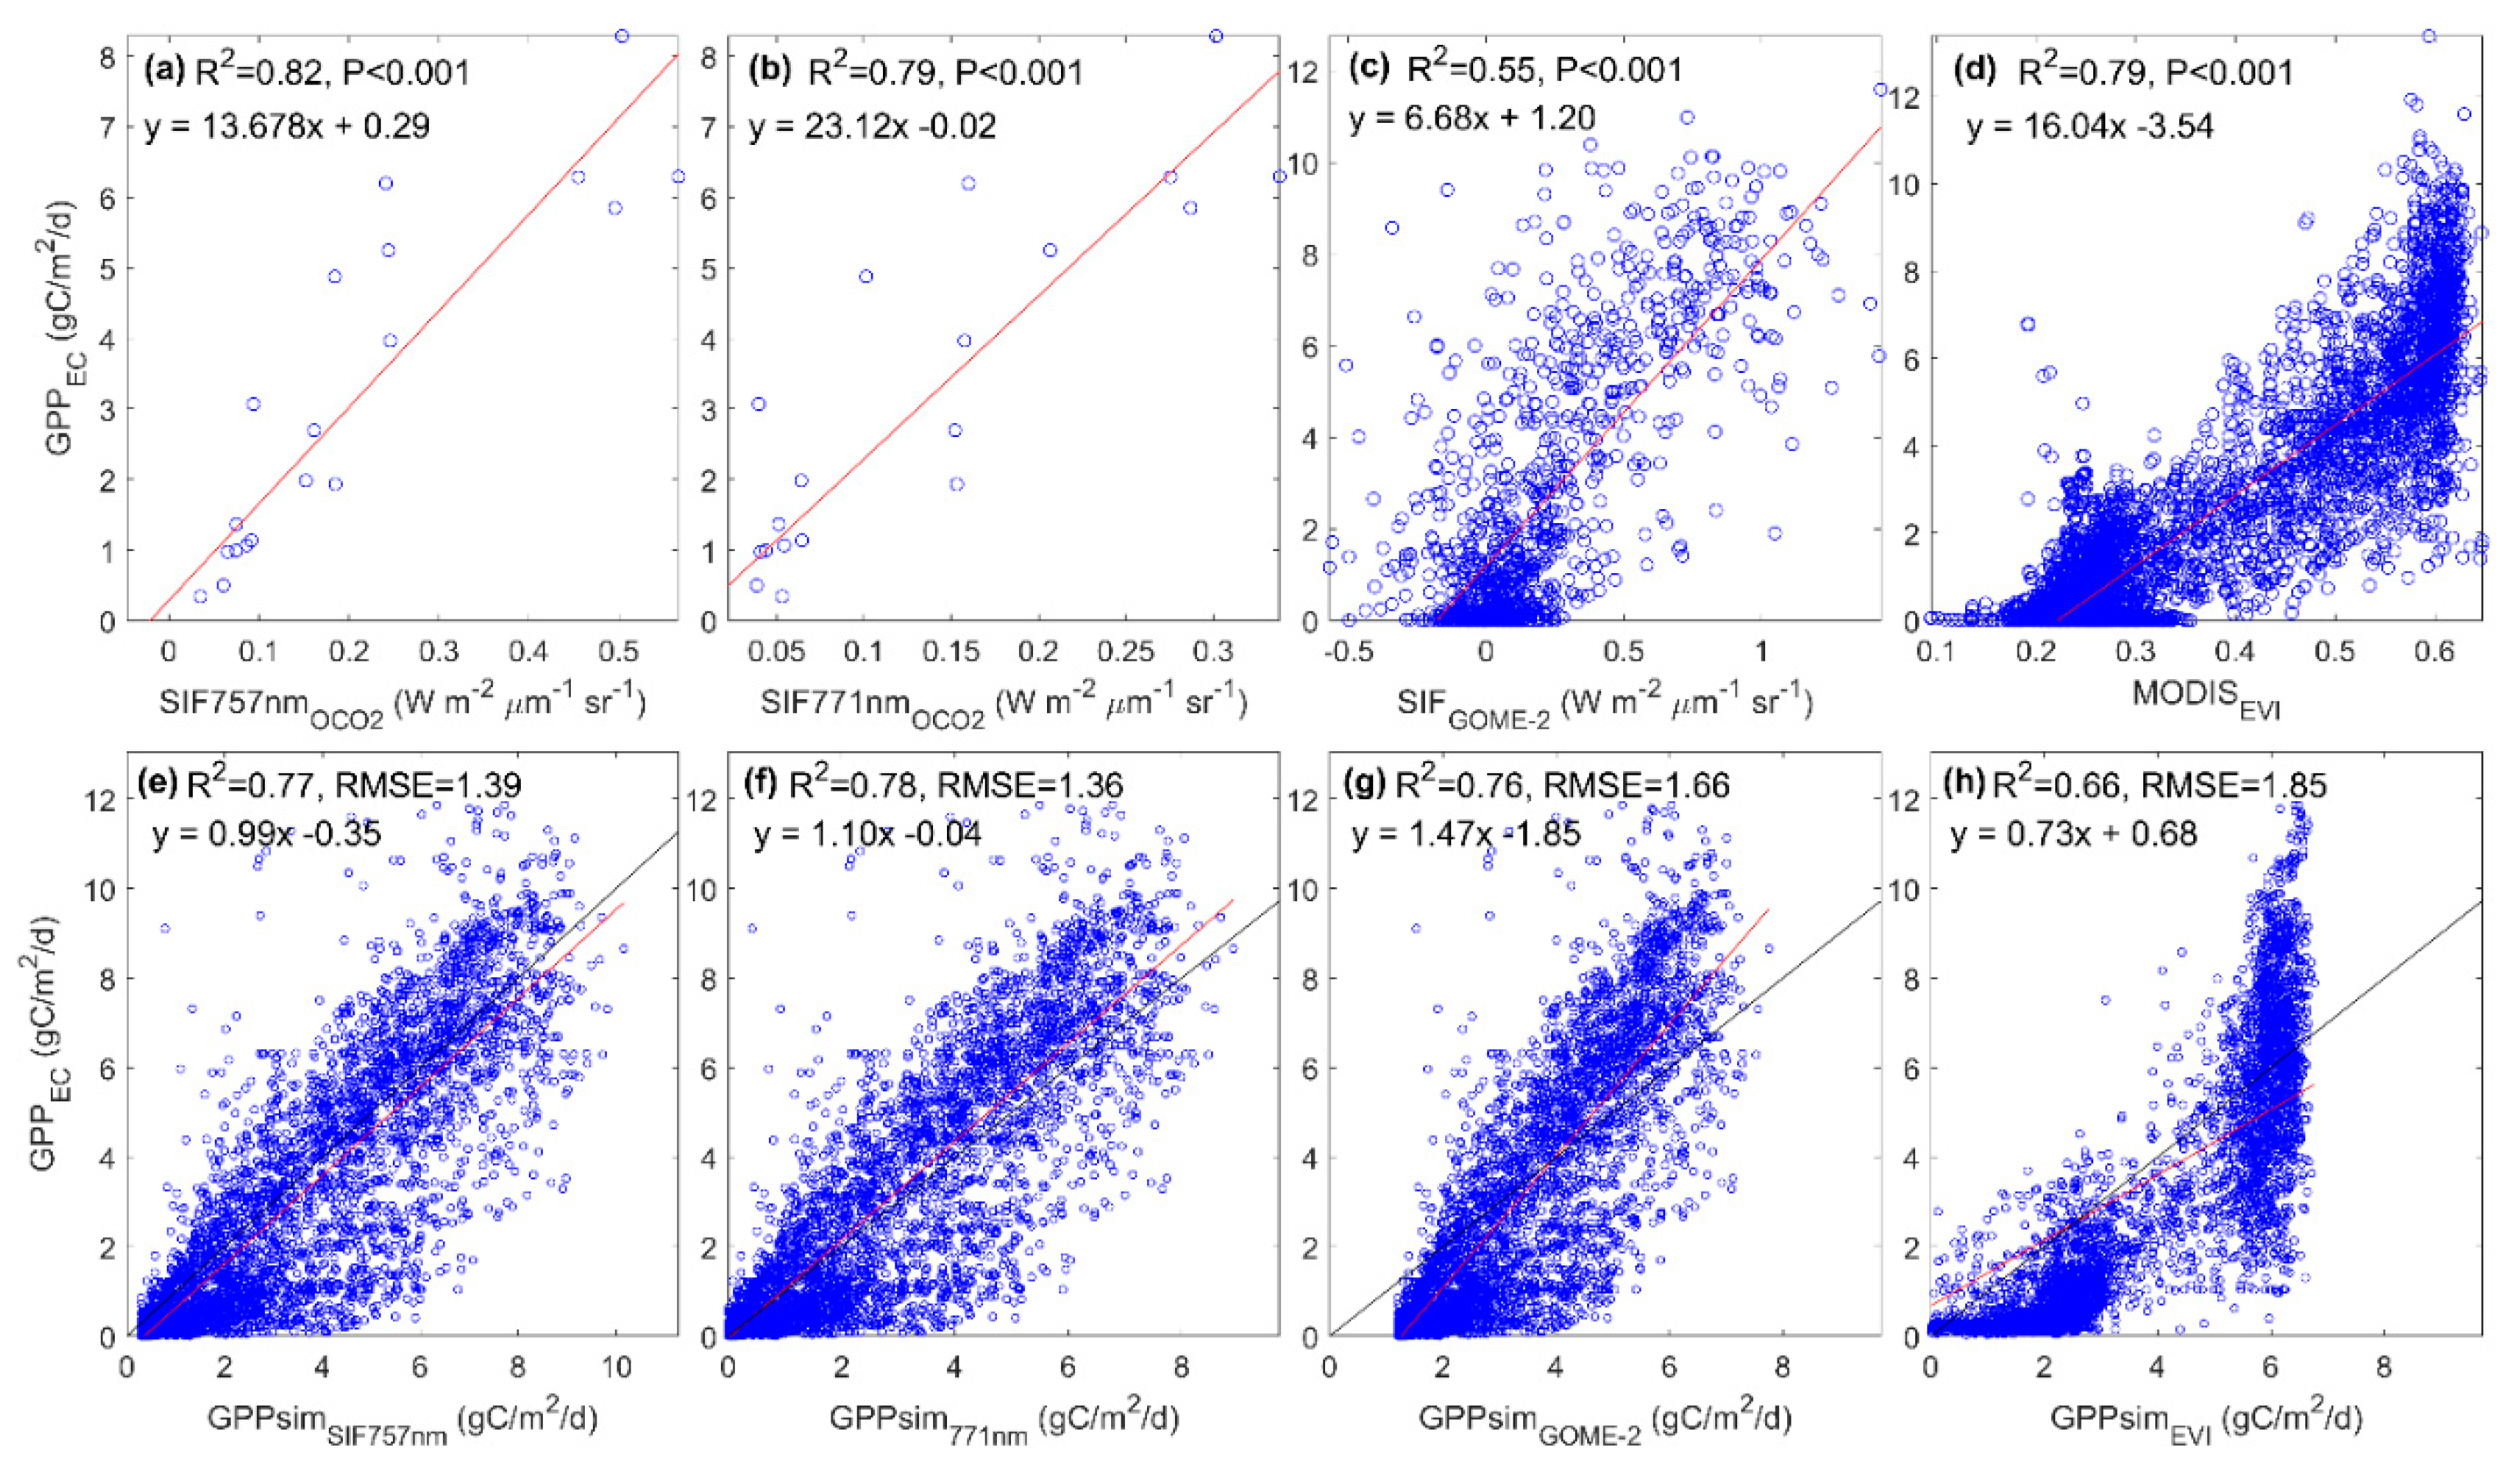
3.4. Evaluating the Capability of SIF in Estimating GPP

To evaluate the relationship between GPP and SIF at different timescales, we examined the relationships between our simulated SIF and flux tower GPP at different wavelengths at both instantaneous and daily timescales for the Park Falls site (Figure 12). The model predicted SIF exhibited consistently strong linear correlation with the flux tower GPP for different wavelengths (757 nm, 771 nm, and 740 nm) at both timescales (p value < 0.001). Meanwhile, for each wavelength, the RMSE was lower at the daily timescale than at the hourly timescale.
We also examined how well the simulated SIF by the optimized SCOPE model could be used to estimate GPP based on the relationship between these variables (Figure 13). Flux tower GPP had strong linear relationships with the satellite retrieved SIF and MODIS-derived EVI (p value < 0.001) (Figure 13a–d). The OCO-2 SIF at 757 nm was more strongly correlated with tower GPP than the OCO-2 SIF at 771 nm. The OCO-2 SIF and MODIS EVI data were more strongly correlated with tower GPP than GOME-2 SIF. We further used these relationships between satellite SIF and tower based GPP (Figure 13a–c) to predict the time series of GPP from our simulated SIF time series over the period 2003–2017 for different wavelengths (Figure 13e–g). For comparison purposes, we also calculated EVI from the surface reflectance simulated by the optimized SCOPE model for the period 2003–2017 and then used the relationship between tower GPP and MODIS EVI (Figure 13d) to predict GPP from EVI for the 15-year period (Figure 13h). The SIF-GPP models exhibited a better performance than the EVI-GPP model. Furthermore, the relationship between OCO-2 SIF and GPP had a better performance in predicting GPP than that between GOME-2 SIF and GPP. Our results showed that the SIF data simulated by the optimized SCOPE model can be used to predict GPP continuously.

4. Discussion

4.1. Parameter Sensitivity of the SCOPE Model

We first identified the sensitive parameters of the SCOPE model (v1.7) based on the OCO-2 SIF observations and flux tower GPP using both the GSA (i.e., Saltelli’s method) and OAT approaches. Sensitivity analysis often serves as a screening tool to reduce the parametric dimensionality and to identify the most important parameters on model performance for parameter optimization [31]. To accurately simulate and better understand the canopy fluorescence and photosynthesis dynamics, we identified and optimized the key physiological parameters in the SCOPE model (Vcmax, Rd, fqe). SIF is linked to the maximum carboxylation capacity, Vcmax, an important parameter that determines the capacity of photosynthesis [15,42], while their complex relationship is still not well understood. It is debatable to what extent SIF is sensitive to Vcmax across biomes [41,45]. A previous study [41] showed strong linear relationship between SIF and Vcmax using the SCOPE model and estimated seasonally-varying Vcmax based on the GOME-2 SIF product. In contrast, other studies have shown that the relationship between Vcmax and SIF within the SCOPE model was not stable and varied between different versions [19,20,39,45]. In this study, we used Saltelli’s method and OAT approach to quantify the sensitivity of SIF and GPP to key parameters in SCOPE at two temperate forest sites. Both approaches showed that SIF had low sensitivity to Vcmax, while GPP had high sensitivity to this parameter. Our results are inconsistent with the finding of a previous study [41] based on the old version of the SCOPE model that there is a strong linear relationship between SIF and Vcmax. Our finding is instead consistent with the previous results of SIF simulation using SCOPE v1.7 [19,44,62], showing a relatively low sensitivity of SIF to photosynthesis in the global parameter space of the model.
SIF is a signal that is mainly related to the electron transport rate in the light reactions of photosynthesis and only partly related to the carboxylation rates [3,43], while carboxylation rates mainly depend on the leaf nitrogen content and fraction of nitrogen in RuBisCO as well as the internal CO2 concentration [65]. It is noticed that the Vcmax cannot be constrained by the optical data alone, and the GPP simulation was improved by combined use of optical and thermal infrared data [66]. Previous studies have demonstrated that Vcmax only partly affected SIF [16,43]; our study also confirmed that SIF was less sensitive to Vcmax.
In addition, our study also suggested the SIF simulation was more sensitive to fqe, a parameter that directly influences the SIF emissions and is often based on empirical values [46], while Vcmax is the most important parameter for GPP simulation. The physiological parameters such as Cab and LAI are also sensitive parameters in SIF and GPP simulations, which is similar to the finding of a previous study [62]. Meanwhile, we also found that the SIF and GPP were constrained well by the concurrent use of OCO-2 SIF and flux tower GPP data. Vcmax is a parameter that directly influences the photosynthetic capacity and indirectly influences the SIF simulation.

4.2. Parameter Estimation and Model Evaluation

Given the complexity of the SCOPE model, the parameter estimation strategy is of great importance for photosynthesis and SIF simulations. Previous studies used simplified approaches (e.g., using the linear relationship between SIF and Vcmax or using a module of the SCOPE model) to optimize the parameters of the SCOPE model (e.g., [19,41]). As above-mentioned, we found that the relationship between SIF and Vcmax was not statistically significant in version 1.70 of the SCOPE model, while the simplified SCOPE module (i.e., only using a module of the SCOPE model) cannot reflect the linkages between SIF and photosynthesis processes. Therefore, we utilized the surrogate modeling-based approach to optimize the parameters of the model because this approach requires a limited number of model runs and is more computationally efficient. The surrogate approach has been proven to be efficient and effective in searching the approximate optimal parameters in previous studies (e.g., [37,40]). Our study showed that the surrogate approach is able to estimate parameters of a relatively complex model like SCOPE. However, it should be noted that the surrogate model is not the “real” model, and it is designed to use cheaper, approximate solutions to a simulation model. Its performance depends on multiple factors such as the surrogate method choice, optimization methods, and the initial sample size and complexity of the problems [37,40].
Previous studies have used inversion approaches to retrieve key parameters in controlling photosynthetic activity (e.g., [19,26,27,44]), and have demonstrated that optimizing the biochemical parameters such as the Vcmax can effectively improve the estimation of photosynthetic capacity [19]. Previous studies have mainly utilized coarse-resolution SIF observations from GOME-2 [12,13,47], and few studies have used finer-resolution OCO-2 SIF to constrain parameters in the SCOPE model (e.g., [44]). We used both OCO-2 SIF and flux tower GPP data to constrain the SIF and GPP simulation by optimizing photosynthetic parameters and SIF related parameters. The optimized SCOPE model had satisfactory performance in simulating SIF and GPP. Similar to two previous studies [44,45], our study demonstrated that the OCO-2 SIF measurements constrained the SIF related parameters such as fqe well but not Vcmax. Our study demonstrated that the OCO-2 SIF observations could improve the SIF simulation of the SCOPE model by optimizing uncertain parameters.
The optimized SCOPE model was evaluated using flux tower GPP data and SIF observations from both OCO-2 and GOME-2. Our results showed that the optimized model captured the magnitude, seasonality, and interannual variability of both SIF and GPP fairly well. This implies that the model can be used to effectively predict SIF and GPP. The simulated SIF and GPP can be potentially used to examine the responses of fluorescence and photosynthesis to extreme events like drought. Unlike satellite data (e.g., GOME-2, OCO-2), the SCOPE model can be to simulate SIF and GPP for the past, present, and future. In addition, the predicted SIF by the SCOPE model can potentially be used to fill the data gaps for the OCO-2 SIF products to generate spatially and temporally continuous SIF products over the globe. The uncertainty/bias in the meteorological data used by the SCOPE model will certainly introduce uncertainty to the SIF estimates. The model can be run without the satellite input, which makes it possible to scale from instantaneous data into diurnal cycles, and calculate the SIF and carbon fluxes in cloudy and rainy days [15]. The produced SIF can also be further used to improve carbon cycle modeling at large scales based on the SIF-GPP relationships.
Previous studies showed significant relationships between satellite-derived SIF measurements (GOSAT, GOME-2, and OCO-2) and gridded GPP data (e.g., [5,12,13]). The relationship between SIF and GPP is sometimes complex and ecosystem-specific [4], and SIF contains information on canopy physiological processes [67]. The ground area of OCO-2 SIF soundings is much closer to the flux tower footprint, and several recent studies showed linear relationship between the OCO-2 SIF and flux tower GPP (e.g., [2,5,14,44]). Meanwhile, modeling studies have also demonstrated the linear SIF-GPP relationship using processed-based models like SCOPE. Similar to [44] and [20], we found strong linear correlation between SIF and GPP from both observations and models. Our results also showed that the SIF simulated by our optimized SCOPE model could be used to estimate GPP fairly well based on the SIF-GPP relationship established from satellite-derived SIF data and flux tower GPP. The long-term SIF simulations and the resulting GPP estimates can be used to examine the dynamics of terrestrial photosynthesis at various timescales.

4.3. Uncertainties and Future Perspectives

The default values of the parameters in terrestrial ecosystem models are typically based on field measurements, literature, assumptions, or calibrations [15,16], and some parameters are associated with substantial uncertainty. The uncertainty in these parameters can lead to significant uncertainty in modeled fluxes [27,29]. Evaluating the uncertainty of simulated fluorescence and photosynthesis is a persistent challenge. Several important factors can affect the SIF and GPP model performance. Aside from the uncertainty of model parameters, the uncertainty of flux tower GPP estimation (e.g., [27,68], SIF retrieval uncertainty (e.g., [12,13]), the mismatch of the spatial scales between satellite observation (e.g., the coarse resolution of GOME-2 SIF measurements), and flux tower footprint can also introduce uncertainty to the simulated SIF and GPP. For example, different NEE partitioning approaches will induce uncertainty in GPP estimates [68]. Our study found that the model parameters optimized with OCO-2 SIF were able to better estimate SIF than those optimized with GOME-2 SIF since the use of OCO-2 SIF observations can substantially reduce the scale mismatch between satellite grid cells and the flux tower footprint than the use of GOME-2 SIF data.
In this study, we only assessed the capacity of the OCO-2 SIF measurements and flux tower data in constraining the photosynthesis and SIF parameters within the SCOPE model with version 1.7. The recently released SCOPE 2.0 is likely to improve the modeling of SIF and photosynthesis. In addition, new SIF observations from the TROPOspheric Monitoring Instrument (TROPOMI), which provides global SIF measurements on a daily basis, might be valuable for constraining parameters because of its temporal continuity [69]. However, it should also be recognized that its grid cell (3.5~15 km × 7 km) is larger than the typical footprint of flux towers, leading to a sizeable scale mismatch. The next generation SIF mission, the FLEX ([70]), will provide SIF data with a spectral range between 500 and 789 nm, temporal continuity, and small grid cells (300 m × 300 m), and these data will have greater potential for SIF and GPP modeling and parameter estimation than the currently available SIF observations. Additionally, the SCOPE model is based on a 1-D radiative transfer model (i.e., PROSAIL), and the model is thus limited to homogeneous vegetation canopies, and cannot reflect the inhomogeneity in vegetation properties of complex canopy (e.g., LAI in horizontal direction) well. The 3-D radiative transfer model (e.g., DART) can be expected to be used in the future for the SIF estimation of the vegetation with more complex canopies.

5. Conclusions

A SCOPE modeling study was conducted to examine how well OCO-2 SIF observations and flux tower GPP data could constrain uncertain parameters and thereby improve the capability of the model in simulating both SIF and GPP at two temperate forest sites. The sensitivity of GPP simulation to Vcmax was greater than that of SIF simulation in SCOPE. The performances of SIF and GPP estimation were improved with the inverse estimation of key parameters in the model. Incorporating the OCO-2 SIF data constrained key uncertain parameters related to SIF simulation, but did not significantly improve the GPP simulation, suggesting that SIF observations have low capability in constraining photosynthetic capacity. The concurrent use of satellite SIF observations and flux tower GPP data improved the simulations of both SIF and GPP. The optimized model can be used to simulate SIF and GPP continuously for the past, present, and future. The simulated SIF can also potentially be used to fill the data gaps for satellite SIF products like OCO-2 to produce spatially and temporally continuous SIF products and to improve the diagnosis of carbon cycle at large scales.

Author Contributions

H.W.: Conceptualization, Methodology, Formal analysis, Investigation, Writing—original draft. J.X.: Conceptualization, Formal analysis, Investigation, Writing—review & editing, Supervision. Both authors have read and agreed to the published version of the manuscript.

Funding

H. Wang was funded by the Major Project of China High-resolution Earth Observation System (grant no. 21-Y20B01-9001-19/22), and the National Natural Science Foundation of China (grant nos. 41871250 and 41401412), and J. Xiao was funded by the University of New Hampshire.

Institutional Review Board Statement

Not applicable.

Informed Consent Statement

Not applicable.

Data Availability Statement

Not Applicable.

Acknowledgments

We thank C. van der Tol for making the SCOPE model available, the OCO-2 and MODIS teams for making the OCO-2 and MODIS products available, Ankur R. Desai for sharing the flux tower data with us, Wei Gong for sharing the surrogate models, and Xing Li for helping with the density-based plots. We thank the two anonymous reviewers for their constructive comments on the manuscript.

Conflicts of Interest

The authors declare no conflict of interest.

References

  1. Meroni, M.; Rossini, M.; Guanter, L.; Alonso, L.; Rascher, U.; Colombo, R.; Moreno, J. Remote sensing of solar-induced chlorophyll fluorescence: Review of methods and applications. Remote Sens. Environ. 2009, 113, 2037–2051. [Google Scholar] [CrossRef]
  2. Li, X.; Xiao, J.; He, B. Chlorophyll fluorescence observed by OCO-2 is strongly related to gross primary productivity estimated from flux towers in temperate forests. Remote Sens. Environ. 2018, 204, 659–671. [Google Scholar] [CrossRef]
  3. Porcar-Castell, A.; Tyystjärvi, E.; Atherton, J.; van der Tol, C.; Flexas, J.; Pfündel, E.E.; Moreno, J.; Frankenberg, C.; Berry, J.A. Linking chlorophyll a fluorescence to photosynthesis for remote sensing applications: Mechanisms and challenges. J. Exp. Bot. 2014, 65, 4065–4095. [Google Scholar] [CrossRef]
  4. Damm, A.; Guanter, L.; Paul-Limoges, E.; van der Tol, C.; Hueni, A.; Buchmann, N.; Eugster, W.; Ammann, C.; Schaepman, M.E. Far-red sun-induced chlorophyll fluorescence shows ecosystem-specific relationships to gross primary production: An assessment based on observational and modeling approaches. Remote Sens. Environ. 2015, 166, 91–105. [Google Scholar] [CrossRef]
  5. Li, X.; Xiao, J.; He, B.; Altaf Arain, M.; Beringer, J.; Desai, A.R.; Emmel, C.; Hollinger, D.Y.; Krasnova, A.; Mammarella, I.; et al. Solar-induced chlorophyll fluorescence is strongly correlated with terrestrial photosynthesis for a wide variety of biomes: First global analysis based on OCO-2 and flux tower observations. Glob. Chang. Biol. 2018, 24, 3990–4008. [Google Scholar] [CrossRef] [PubMed]
  6. Xiao, J.; Chevallier, F.; Gomez, C.; Guanter, L.; Hicke, J.A.; Huete, A.R.; Ichii, K.; Ni, W.; Pang, Y.; Rahman, A.F.; et al. Remote sensing of the terrestrial carbon cycle: A review of advances over 50 years. Remote Sens. Environ. 2019, 233, 111383. [Google Scholar] [CrossRef]
  7. Wang, H.; Li, X.; Xiao, J.; Ma, M.; Tan, J.; Wang, X.; Geng, L. Carbon fluxes across alpine, oasis, and desert ecosystems in northwestern China: The importance of water availability. Sci. Total Environ. 2019, 697, 133978. [Google Scholar] [CrossRef]
  8. Wang, H.; Li, X.; Xiao, J.; Ma, M. Evapotranspiration components and water use efficiency from desert to alpine ecosystems in drylands. Agric. For. Meteorol. 2021, 298–299, 108283. [Google Scholar] [CrossRef]
  9. Yang, H.; Yang, X.; Zhang, Y.; Heskel, M.A.; Lu, X.; Munger, J.W.; Sun, S.; Tang, J. Chlorophyll fluorescence tracks seasonal variations of photosynthesis from leaf to canopy in a temperate forest. Glob. Chang. Biol. 2017, 23, 2874–2886. [Google Scholar] [CrossRef]
  10. Liu, L.; Guan, L.; Liu, X. Directly estimating diurnal changes in GPP for C3 and C4 crops using far-red sun-induced chlorophyll fluorescence. Agric. For. Meteorol. 2017, 232, 1–9. [Google Scholar] [CrossRef]
  11. Rascher, U.; Alonso, L.; Burkart, A.; Cilia, C.; Cogliati, S.; Colombo, R.; Damm, A.; Drusch, M.; Guanter, L.; Hanus, J.; et al. Sun-induced fluorescence—A new probe of photosynthesis: First maps from the imaging spectrometer HyPlant. Glob. Chang. Biol. 2015, 21, 4673–4684. [Google Scholar] [CrossRef] [Green Version]
  12. Frankenberg, C.; Fisher, J.B.; Worden, J.; Badgley, G.; Saatchi, S.S.; Lee, J.-E.; Toon, G.C.; Butz, A.; Jung, M.; Kuze, A.; et al. New global observations of the terrestrial carbon cycle from GOSAT: Patterns of plant fluorescence with gross primary productivity. Geophys. Res. Lett. 2011, 38. [Google Scholar] [CrossRef] [Green Version]
  13. Guanter, L.; Zhang, Y.; Jung, M.; Joiner, J.; Voigt, M.; Berry, J.A.; Frankenberg, C.; Huete, A.R.; Zarco-Tejada, P.; Lee, J.E.; et al. Global and time-resolved monitoring of crop photosynthesis with chlorophyll fluorescence. Proc. Natl. Acad. Sci. USA 2014, 111, E1327–E1333. [Google Scholar] [CrossRef] [Green Version]
  14. Sun, Y.; Frankenberg, C.; Wood, J.D.; Schimel, D.S.; Jung, M.; Guanter, L.; Drewry, D.T.; Verma, M.; Porcar-Castell, A.; Griffis, T.J.; et al. OCO-2 advances photosynthesis observation from space via solar-induced chlorophyll fluorescence. Science 2017, 358, eaam5747. [Google Scholar] [CrossRef] [Green Version]
  15. Van der Tol, C.; Verhoef, W.; Timmermans, J.; Verhoef, A.; Su, Z. An integrated model of soil-canopy spectral radiances, photosynthesis, fluorescence, temperature and energy balance. Biogeosciences 2009, 6, 3109–3129. [Google Scholar] [CrossRef] [Green Version]
  16. Van der Tol, C.; Berry, J.A.; Campbell, P.K.E.; Rascher, U. Models of fluorescence and photosynthesis for interpreting measurements of solar-induced chlorophyll fluorescence. J. Geophys. Res. Biogeosci. 2014, 119, 2312–2327. [Google Scholar] [CrossRef] [PubMed] [Green Version]
  17. Gastellu-Etchegorry, J.; Lauret, N.; Yin, T.; Landier, L.; Kallel, A.; Malenovský, Z.; Bitar, A.A.; Aval, J.; Benhmida, S.; Qi, J.; et al. DART: Recent Advances in Remote Sensing Data Modeling with Atmosphere, Polarization, and Chlorophyll Fluorescence. IEEE J. Sel. Top. Appl. Earth Obs. Remote Sens. 2017, 10, 2640–2649. [Google Scholar] [CrossRef]
  18. Hernández-Clemente, R.; North, P.R.J.; Hornero, A.; Zarco-Tejada, P.J. Assessing the effects of forest health on sun-induced chlorophyll fluorescence using the FluorFLIGHT 3-D radiative transfer model to account for forest structure. Remote Sens. Environ. 2017, 193, 165–179. [Google Scholar] [CrossRef] [Green Version]
  19. Zhang, Y.; Guanter, L.; Joiner, J.; Song, L.; Guan, K. Spatially-explicit monitoring of crop photosynthetic capacity through the use of space-based chlorophyll fluorescence data. Remote Sens. Environ. 2018, 210, 362–374. [Google Scholar] [CrossRef]
  20. Zhang, Y.; Guanter, L.; Berry, J.A.; van der Tol, C.; Yang, X.; Tang, J.; Zhang, F. Model-based analysis of the relationship between sun-induced chlorophyll fluorescence and gross primary production for remote sensing applications. Remote Sens. Environ. 2016, 187, 145–155. [Google Scholar] [CrossRef] [Green Version]
  21. Du, S.; Liu, L.; Liu, X.; Hu, J. Response of Canopy Solar-Induced Chlorophyll Fluorescence to the Absorbed Photosynthetically Active Radiation Absorbed by Chlorophyll. Remote Sens. 2017, 9, 911. [Google Scholar] [CrossRef] [Green Version]
  22. Hu, J.; Liu, L.; Guo, J.; Du, S.; Liu, X. Upscaling Solar-Induced Chlorophyll Fluorescence from an Instantaneous to Daily Scale Gives an Improved Estimation of the Gross Primary Productivity. Remote Sens. 2018, 10, 1663. [Google Scholar] [CrossRef] [Green Version]
  23. Coppo, P.; Taiti, A.; Pettinato, L.; Francois, M.; Taccola, M.; Drusch, M. Fluorescence Imaging Spectrometer (FLORIS) for ESA FLEX Mission. Remote Sens. 2017, 9, 649. [Google Scholar] [CrossRef] [Green Version]
  24. Yang, P.; Verhoef, W.; van der Tol, C. The mSCOPE model: A simple adaptation to the SCOPE model to describe reflectance, fluorescence and photosynthesis of vertically heterogeneous canopies. Remote Sens. Environ. 2017, 201, 1–11. [Google Scholar] [CrossRef]
  25. Lee, J.-E.; Berry, J.A.; van der Tol, C.; Yang, X.; Guanter, L.; Damm, A.; Baker, I.; Frankenberg, C. Simulations of chlorophyll fluorescence incorporated into the Community Land Model version 4. Glob. Chang. Biol. 2015, 21, 3469–3477. [Google Scholar] [CrossRef] [PubMed] [Green Version]
  26. Wang, H.B.; Ma, M.G.; Xie, Y.M.; Wang, X.F.; Wang, J. Parameter inversion estimation in photosynthetic models: Impact of different simulation methods. Photosynthetica 2014, 52, 233–246. [Google Scholar] [CrossRef]
  27. Wang, H.; Li, X.; Ma, M.; Geng, L. Improving Estimation of Gross Primary Production in Dryland Ecosystems by a Model-Data Fusion Approach. Remote Sens. 2019, 11, 225. [Google Scholar] [CrossRef] [Green Version]
  28. Li, X. Characterization, controlling, and reduction of uncertainties in the modeling and observation of land-surface systems. Sci. China Earth Sci. 2014, 57, 80–87. [Google Scholar] [CrossRef]
  29. Xiao, J.; Davis, K.J.; Urban, N.M.; Keller, K. Uncertainty in model parameters and regional carbon fluxes: A model-data fusion approach. Agric. For. Meteorol. 2014, 189–190, 175–186. [Google Scholar] [CrossRef]
  30. Van Werkhoven, K.; Wagener, T.; Reed, P.; Tang, Y. Sensitivity-guided reduction of parametric dimensionality for multi-objective calibration of watershed models. Adv. Water Resour. 2009, 32, 1154–1169. [Google Scholar] [CrossRef]
  31. Saltelli, A.; Annoni, P.; Azzini, I.; Campolongo, F.; Ratto, M.; Tarantola, S. Variance based sensitivity analysis of model output. Design and estimator for the total sensitivity index. Comput. Phys. Commun. 2010, 181, 259–270. [Google Scholar] [CrossRef]
  32. Saltelli, A.; Tarantola, S.; Chan, K.P.S. A Quantitative Model-Independent Method for Global Sensitivity Analysis of Model Output. Technometrics 1999, 41, 39–56. [Google Scholar] [CrossRef]
  33. Braswell, B.H.; Sacks, W.J.; Linder, E.; Schimel, D.S. Estimating diurnal to annual ecosystem parameters by synthesis of a carbon flux model with eddy covariance net ecosystem exchange observations. Glob. Chang. Biol. 2005, 11, 335–355. [Google Scholar] [CrossRef]
  34. Wang, H.; Ma, M. Comparing the seasonal variation of parameter estimation of ecosystem carbon exchange between alpine meadow and cropland in Heihe River Basin, northwestern China. Sci. Cold Arid Reg. 2015, 7, 216–228. [Google Scholar]
  35. Duan, Q.; Sorooshian, S.; Gupta, V. Effective and efficient global optimization for conceptual rainfall-runoff models. Water Resour. Res. 1992, 28, 1015–1031. [Google Scholar] [CrossRef]
  36. Gong, W.; Duan, Q.; Li, J.; Wang, C.; Di, Z.; Dai, Y.; Ye, A.; Miao, C. Multi-objective parameter optimization of common land model using adaptive surrogate modeling. Hydrol. Earth Syst. Sci. 2015, 19, 2409–2425. [Google Scholar] [CrossRef] [Green Version]
  37. Wang, C.; Duan, Q.; Gong, W.; Ye, A.; Di, Z.; Miao, C. An evaluation of adaptive surrogate modeling based optimization with two benchmark problems. Environ. Modeling Softw. 2014, 60, 167–179. [Google Scholar] [CrossRef] [Green Version]
  38. Gong, W.; Duan, Q.; Li, J.; Wang, C.; Di, Z.; Ye, A.; Miao, C.; Dai, Y. Multiobjective adaptive surrogate modeling-based optimization for parameter estimation of large, complex geophysical models. Water Resour. Res. 2016, 52, 1984–2008. [Google Scholar] [CrossRef] [Green Version]
  39. Verrelst, J.; Rivera, J.P.; van der Tol, C.; Magnani, F.; Mohammed, G.; Moreno, J. Global sensitivity analysis of the SCOPE model: What drives simulated canopy-leaving sun-induced fluorescence? Remote Sens. Environ. 2015, 166, 8–21. [Google Scholar] [CrossRef]
  40. Verrelst, J.; Rivera Caicedo, J.P.; Muñoz-Marí, J.; Camps-Valls, G.; Moreno, J. SCOPE-Based Emulators for Fast Generation of Synthetic Canopy Reflectance and Sun-Induced Fluorescence Spectra. Remote Sens. 2017, 9, 927. [Google Scholar] [CrossRef] [Green Version]
  41. Zhang, Y.; Guanter, L.; Berry, J.A.; Joiner, J.; van der Tol, C.; Huete, A.; Gitelson, A.; Voigt, M.; Kohler, P. Estimation of vegetation photosynthetic capacity from space-based measurements of chlorophyll fluorescence for terrestrial biosphere models. Glob. Chang. Biol. 2014, 20, 3727–3742. [Google Scholar] [CrossRef] [Green Version]
  42. Farquhar, G.D.; von Caemmerer, S.; Berry, J.A. A biochemical model of photosynthetic CO2 assimilation in leaves of C3 species. Planta 1980, 149, 78–90. [Google Scholar] [CrossRef] [PubMed] [Green Version]
  43. Frankenberg, C.; Berry, J. 3.10 Solar Induced Chlorophyll Fluorescence: Origins, Relation to Photosynthesis and Retrieval. In Comprehensive Remote Sensing; Liang, S., Ed.; Elsevier: Oxford, UK, 2018; pp. 143–162. [Google Scholar] [CrossRef]
  44. Verma, M.; Schimel, D.; Evans, B.; Frankenberg, C.; Beringer, J.; Drewry, D.T.; Magney, T.; Marang, I.; Hutley, L.; Moore, C.; et al. Effect of environmental conditions on the relationship between solar-induced fluorescence and gross primary productivity at an OzFlux grassland site. J. Geophys. Res. Biogeosci. 2017, 122, 716–733. [Google Scholar] [CrossRef] [Green Version]
  45. Koffi, E.N.; Rayner, P.J.; Norton, A.J.; Frankenberg, C.; Scholze, M. Investigating the usefulness of satellite-derived fluorescence data in inferring gross primary productivity within the carbon cycle data assimilation system. Biogeosciences 2015, 12, 4067–4084. [Google Scholar] [CrossRef] [Green Version]
  46. Van der Tol, C.; Rossini, M.; Cogliati, S.; Verhoef, W.; Colombo, R.; Rascher, U.; Mohammed, G. A model and measurement comparison of diurnal cycles of sun-induced chlorophyll fluorescence of crops. Remote Sens. Environ. 2016, 186, 663–677. [Google Scholar] [CrossRef]
  47. Frankenberg, C.; O’Dell, C.; Berry, J.; Guanter, L.; Joiner, J.; Köhler, P.; Pollock, R.; Taylor, T.E. Prospects for chlorophyll fluorescence remote sensing from the Orbiting Carbon Observatory-2. Remote Sens. Environ. 2014, 147, 1–12. [Google Scholar] [CrossRef] [Green Version]
  48. Davis, K.J.; Bakwin, P.S.; Yi, C.; Berger, B.W.; Zhao, C.; Teclaw, R.M.; Isebrands, J.G. The annual cycles of CO2 and H2O exchange over a northern mixed forest as observed from a very tall tower. Glob. Chang. Biol. 2003, 9, 1278–1293. [Google Scholar] [CrossRef]
  49. Desai, A.R.; Xu, K.; Tian, H.; Weishampel, P.; Thom, J.; Baumann, D.; Andrews, A.E.; Cook, B.D.; King, J.Y.; Kolka, R. Landscape-level terrestrial methane flux observed from a very tall tower. Agric. For. Meteorol. 2015, 201, 61–75. [Google Scholar] [CrossRef]
  50. Cook, B.D.; Davis, K.J.; Wang, W.; Desai, A.; Berger, B.W.; Teclaw, R.M.; Martin, J.G.; Bolstad, P.V.; Bakwin, P.S.; Yi, C.; et al. Carbon exchange and venting anomalies in an upland deciduous forest in northern Wisconsin, USA. Agric. For. Meteorol. 2004, 126, 271–295. [Google Scholar] [CrossRef]
  51. Desai, A.R.; Bolstad, P.V.; Cook, B.D.; Davis, K.J.; Carey, E.V. Comparing net ecosystem exchange of carbon dioxide between an old-growth and mature forest in the upper Midwest, USA. Agric. For. Meteorol. 2005, 128, 33–55. [Google Scholar] [CrossRef]
  52. Berger, B.W.; Davis, K.J.; Yi, C.; Bakwin, P.S.; Zhao, C.L. Long-term carbon dioxide fluxes from a very tall tower in a northern forest: Flux measurement methodology. J. Atmos. Ocean. Technol. 2001, 18, 529–542. [Google Scholar] [CrossRef]
  53. Verhoef, A.; McNaughton, K.; Jacobs, A. A parameterization of momentum roughness length and displacement height for a wide range of canopy densities. Hydrol. Earth Syst. Sci. 1997, 1, 81–91. [Google Scholar] [CrossRef]
  54. Schaaf, C.B.; Gao, F.; Strahler, A.H.; Lucht, W.; Li, X.; Tsang, T.; Strugnell, N.C.; Zhang, X.; Jin, Y.; Muller, J.-P.; et al. First operational BRDF, albedo nadir reflectance products from MODIS. Remote Sens. Environ. 2002, 83, 135–148. [Google Scholar] [CrossRef] [Green Version]
  55. Huang, X.; Xiao, J.; Ma, M. Evaluating the Performance of Satellite-Derived Vegetation Indices for Estimating Gross Primary Productivity Using FLUXNET Observations across the Globe. Remote Sens. 2019, 11, 1823. [Google Scholar] [CrossRef] [Green Version]
  56. Jacquemoud, S.; Verhoef, W.; Baret, F.; Bacour, C.; Zarco-Tejada, P.J.; Asner, G.P.; François, C.; Ustin, S.L. PROSPECT+SAIL models: A review of use for vegetation characterization. Remote Sens. Environ. 2009, 113, S56–S66. [Google Scholar] [CrossRef]
  57. Feret, J.-B.; François, C.; Asner, G.P.; Gitelson, A.A.; Martin, R.E.; Bidel, L.P.R.; Ustin, S.L.; le Maire, G.; Jacquemoud, S. PROSPECT-4 and 5: Advances in the leaf optical properties model separating photosynthetic pigments. Remote Sens. Environ. 2008, 112, 3030–3043. [Google Scholar] [CrossRef]
  58. Verhoef, W. Light scattering by leaf layers with application to canopy reflectance modeling: The SAIL model. Remote Sens. Environ. 1984, 16, 125–141. [Google Scholar] [CrossRef] [Green Version]
  59. Féret, J.B.; Gitelson, A.A.; Noble, S.D.; Jacquemoud, S. PROSPECT-D: Towards modeling leaf optical properties through a complete lifecycle. Remote Sens. Environ. 2017, 193, 204–215. [Google Scholar] [CrossRef] [Green Version]
  60. Collatz, G.J.; Ribas-Carbo, M.; Berry, J. Coupled photosynthesis-stomatal conductance model for leaves of C4 plants. Funct. Plant. Biol. 1992, 19, 519–538. [Google Scholar] [CrossRef]
  61. Tang, K.S.; Man, K.F.; Kwong, S.; He, Q. Genetic algorithms and their applications. IEEE Signal Process. Mag. 1996, 13, 22–37. [Google Scholar] [CrossRef]
  62. Verrelst, J.; van der Tol, C.; Magnani, F.; Sabater, N.; Rivera, J.P.; Mohammed, G.; Moreno, J. Evaluating the predictive power of sun-induced chlorophyll fluorescence to estimate net photosynthesis of vegetation canopies: A SCOPE modeling study. Remote Sens. Environ. 2016, 176, 139–151. [Google Scholar] [CrossRef]
  63. Pacheco-Labrador, J.; El-Madany, T.; Tol, C.; Martín, M.; González Cascón, R.; Pérez-Priego, O.; Moreno, G.; Carrara, A.; Reichstein, M.; Migliavacca, M. senSCOPE: Modeling radiative transfer and biochemical processes in mixed canopies combining green and senescent leaves with SCOPE. BioRxiv 2020. [Google Scholar] [CrossRef]
  64. Saltelli, A. Making best use of model evaluations to compute sensitivity indices. Comput. Phys. Commun. 2002, 145, 280–297. [Google Scholar] [CrossRef]
  65. Xu, L.; Baldocchi, D.D. Seasonal trends in photosynthetic parameters and stomatal conductance of blue oak (Quercus douglasii) under prolonged summer drought and high temperature. Tree Physiol. 2003, 23, 865–877. [Google Scholar] [CrossRef] [Green Version]
  66. Bayat, B.; van der Tol, C.; Verhoef, W. Integrating satellite optical and thermal infrared observations for improving daily ecosystem functioning estimations during a drought episode. Remote Sens. Environ. 2018, 209, 375–394. [Google Scholar] [CrossRef]
  67. Badgley, G.; Anderegg, L.D.L.; Berry, J.A.; Field, C.B. Terrestrial gross primary production: Using NIRV to scale from site to globe. Glob. Chang. Biol. 2019, 25, 3731–3740. [Google Scholar] [CrossRef]
  68. Raj, R.; Hamm, N.A.S.; Tol, C.V.D.; Stein, A. Uncertainty analysis of gross primary production partitioned from net ecosystem exchange measurements. Biogeosciences 2016, 13, 1409–1422. [Google Scholar] [CrossRef] [Green Version]
  69. Köhler, P.; Frankenberg, C.; Magney, T.S.; Guanter, L.; Joiner, J.; Landgraf, J. Global Retrievals of Solar-Induced Chlorophyll Fluorescence with TROPOMI: First Results and Intersensor Comparison to OCO-2. Geophys. Res. Lett. 2018, 45, 10456–10463. [Google Scholar] [CrossRef] [Green Version]
  70. Drusch, M.; Moreno, J.; Bello, U.D.; Franco, R.; Goulas, Y.; Huth, A.; Kraft, S.; Middleton, E.M.; Miglietta, F.; Mohammed, G.; et al. The FLuorescence EXplorer Mission Concept—ESA’s Earth Explorer 8. IEEE Trans. Geosci. Remote Sens. 2017, 55, 1273–1284. [Google Scholar] [CrossRef]
Figure 1. Orbiting Carbon Observatory-2 (OCO-2) solar-induced chlorophyll fluorescence (SIF) observations surrounding the Park Falls (US-PFa) and Willow Creek (US-WCr) sites on 1 July 2015. The base map is the MODIS land cover product (MCD12Q1) at 500 m spatial resolution.
Remotesensing 13 00794 g001
Figure 2. Seasonality of (a) leaf area index (LAI) and (b) chlorophyll (Cab) at the Park Falls site retrieved by inverting the PROSAIL model with Moderate Resolution Imaging Spectroradiometer (MODIS) reflectance (bands 1–7).
Remotesensing 13 00794 g002
Figure 3. Global sensitivity analysis (GSA) total sensitivity index for SCOPE-simulated SIF Orbiting Carbon Observatory-2 solar-induced chlorophyll fluorescence (OCO-2 SIF) and gross primary production (GPP). Three different objective functions were used: (a) SIF, (b) GPP, and (c) SIF and GPP together.
Remotesensing 13 00794 g003
Figure 4. The sensitivity of simulated SIF to Vcmax values in the SCOPE model. We used 20 different Vcmax values ranging from 10 to 200 μmol m−2 s−1.
Remotesensing 13 00794 g004
Figure 5. Modeled SIF (a) and GPP (b) at the leaf level as a function of Vcmax (μmol m−2 s−1) at different levels of light (Rin): 100, 200, 300, 400, 500, 600, 700, 800, 900, and 1000 W m−2. Vcmax ranged from 10 to 200 μmol m−2 s−1.
Remotesensing 13 00794 g005
Figure 6. Seasonal trajectories of GPP and SIF simulated by the SCOPE model at the Park Falls site. The black lines stand for the model results with the default parameters. The green lines and blue lines represent the simulations based on the parameters optimized with SIF and GPP, respectively (i.e., using the objective functions of FSIF and FGPP, respectively). The symbols stand for flux tower GPP (a) and OCO-2 SIF (b,c).
Remotesensing 13 00794 g006
Figure 7. Seasonal trajectories of GPP and SIF simulated by the SCOPE model at the Park Falls site. The black lines and blue lines represent the modeled GPP based on the default parameters and GPP based on the parameters optimized from both SIF and GPP (using the objective function of FSIF_GPP), respectively. The magenta symbols stand for flux tower GPP data (a) and OCO-2 SIF observations (b,c).
Remotesensing 13 00794 g007
Figure 8. Seasonal trajectories of GPP and SIF simulated by the SCOPE model at the Willow Creek site. The black lines and blue lines represent the modeled GPP based on the default parameters and modeled GPP based on parameters optimized with both SIF and GPP, respectively. The magenta symbols stand for flux tower GPP (a) and OCO-2 SIF observations (b,c).
Remotesensing 13 00794 g008
Figure 9. Seasonal trajectories of SIF and GPP simulated by the SCOPE model at Park Falls. The black lines and blue lines represent the modeled values with the default and optimized parameters, respectively. The magenta symbols stand for flux tower GPP (a), OCO-2 SIF (b,c), and GOME-2 SIF (d).
Remotesensing 13 00794 g009
Figure 10. Comparison of flux tower GPP (GPPEC) against GPP simulated by the SCOPE model at Park Falls using (a) simulated hourly GPP with default parameters; (b) simulated hourly GPP with optimized parameters; (c) simulated daily GPP with default parameters; (d) simulated daily GPP with optimized parameters.
Remotesensing 13 00794 g010
Figure 11. Comparison of simulated SIF (in GOME-2 SIF wavelength) against GOME-2 SIF observations from 2007 to 2017. The black points and blue points represent the SIF simulation with default parameters and that with the optimized parameters, respectively.
Remotesensing 13 00794 g011
Figure 12. Relationships between SIF simulated by the SCOPE model and flux tower GPP at the Park Falls site at both instantaneous and daily timescales.
Remotesensing 13 00794 g012
Figure 13. Relationships of flux tower GPP (GPPEC) with the SIF (by (a) OCO-2 at the 757 nm; (b) OCO-2 at the 771 nm; (c) GOME-2 at the 740 nm), (d) MODIS EVI, and GPP simulated by ((e) SIF at 757 nm, (f) SIF at 757 nm, (g) SIF at 757 nm, and (h) EVI) predicted by the optimized SCOPE model for the period 2003–2017.
Remotesensing 13 00794 g013
Table 1. Physiological and structural parameters in the PROSAIL and Soil Canopy Observation, Photochemistry and Energy Fluxes (SCOPE) model.
Parameters AcronymsDefinition Initial ValuesValue RangesReferences
Chlorophyll contentCabμg cm−2400~100[24]
Carotenoid contentCcaμg cm−2100~30[24]
Dry matter contentCdmmg cm−250~20[24]
Equivalent water thickness Cwmg cm−2200~100[62]
Senescent material Cs-0.10~1.2[62]
AnthocyaninsCantμg cm−200~40[59]
Leaf structure parametersN-1.41~3[24]
Maximum carboxylation capacityVcmaxμmol m−1 s−1300~200[62]
Stomatal conductance parameterm-82~20[62]
Extinction coefficient for canopyKv-0.640~0.8[62]
Dark respiration parameterRd-0.0150.001~0.03[62]
Fluorescence quantum efficiencyfqe-0.010.001~0.03[63]
Leaf area indexLAIm2 m−230~7[24]
Leaf angle distribution parameter aLIDFa-−0.35−1~1[24]
Leaf angle distribution parameter bLIDFb-−0.15−1~1[24]
Table 2. The key physiological parameters related to SIF and GPP estimation in the SCOPE model. The initial values and optimized values using three different objective functions were shown: (1) FSIF, optimized SIF; (2) FGPP, optimized GPP; (3) FSIF_GPP, optimized SIF and GPP. The units of Vcmax are μmol m−2 s−1, and the units of SIF and GPP are W m−2 μm−1 sr−1 and gC m−2 day−1, respectively.
ParametersInitial ValuesOptimized SIF (FSIF)Optimized GPP (FGPP)Optimized SIF and GPP (FSIF_GPP)
Vcmax3066.64834.2232.88
Rd0.0150.0210.0020.006
fqe0.010.0080.0300.008
Publisher’s Note: MDPI stays neutral with regard to jurisdictional claims in published maps and institutional affiliations.

