1. Introduction
Synthetic aperture radar (SAR) data acquired by space-born platforms are extensively applied in the study of natural or anthropogenic phenomena characterizing the Earth. The information carried by the phase and amplitude of the SAR signal can be exploited for several purposes, such as crustal deformations analysis [
1], classification studies [
2,
3] or damage mapping in post-emergency scenarios [
4,
5]. The large spatial coverage and the capacity to work in all weather conditions, day and night, together with the great improvements in sensor development, the revisit times of satellites and data processing techniques make SAR a useful tool in many application fields.
Since the Landers earthquake in 1992, one of the most widespread SAR-based applications consists of using a single pair of images, one acquired before and one after a seismic event, to measure any relative ground displacement by means of an interferometric SAR (InSAR) data processing technique [
6]. Nowadays, InSAR data are extensively used in seismology to image the coseismic ground displacement induced by relevant seismic events occurring anywhere on emerged lands [
7,
8,
9,
10,
11]. Moreover, depending on the seismic event characteristics, other SAR-based techniques can be exploited to retrieve a synoptic view of the induced coseismic displacement. Indeed, InSAR data are phase-based measurements and thus suffer from coherence loss and phase unwrapping problems, especially in the near-field zones of major to great earthquakes. Moreover, they are only able to constrain a displacement projected into the satellite Line-of-Sight (LOS) which is in most case similar to the vertical (UP) displacement component because of the satellite geometry of view. Conversely, they are less sensitive to the East-West (EW) component and quite insensitive to the North-South (NS) one. This can lead to underestimation of coseismic displacement in cases of seismic events characterized by a strike-slip mechanism with an almost-NS trending fault [
8,
12]. To overcome these problems, SAR pixel offset tracking (POT) and multiple aperture interferometry (MAI) techniques can be exploited [
13,
14]. POT works on the amplitude of the images and measures the shifts between images along both the satellite LOS (as with InSAR) and line-of-flight (LOF). LOF or azimuth direction is approximately equivalent to the NS component since the inclination of the orbit path of the satellites with respect to the north ranges from about 10° to 15°. MAI also estimates the azimuth displacement but, as with InSAR, it works on the phase signal, constructing an interferogram along the LOF direction by dividing the swath along this direction into (at least) two sub-swaths. These two techniques are definitely less well-known than InSAR and require particular care in the processing steps since they are more sensitive to errors and can be strongly affected by noise. Although less accurate, they can be very useful and have already been applied in the study of some strike-slip seismic events [
15,
16,
17].
The aim of this study was to evaluate the performances of a full SAR-based approach, i.e., using InSAR, POT and MAI data, in the study of strong strike-slip earthquakes. Our test-site was the 2019 Ridgecrest (Southern California, USA) seismic sequence, composed of an Mw 6.4 foreshock that occurred on July 4th, followed by an Mw 7.1 mainshock on July 6th [
18,
19,
20,
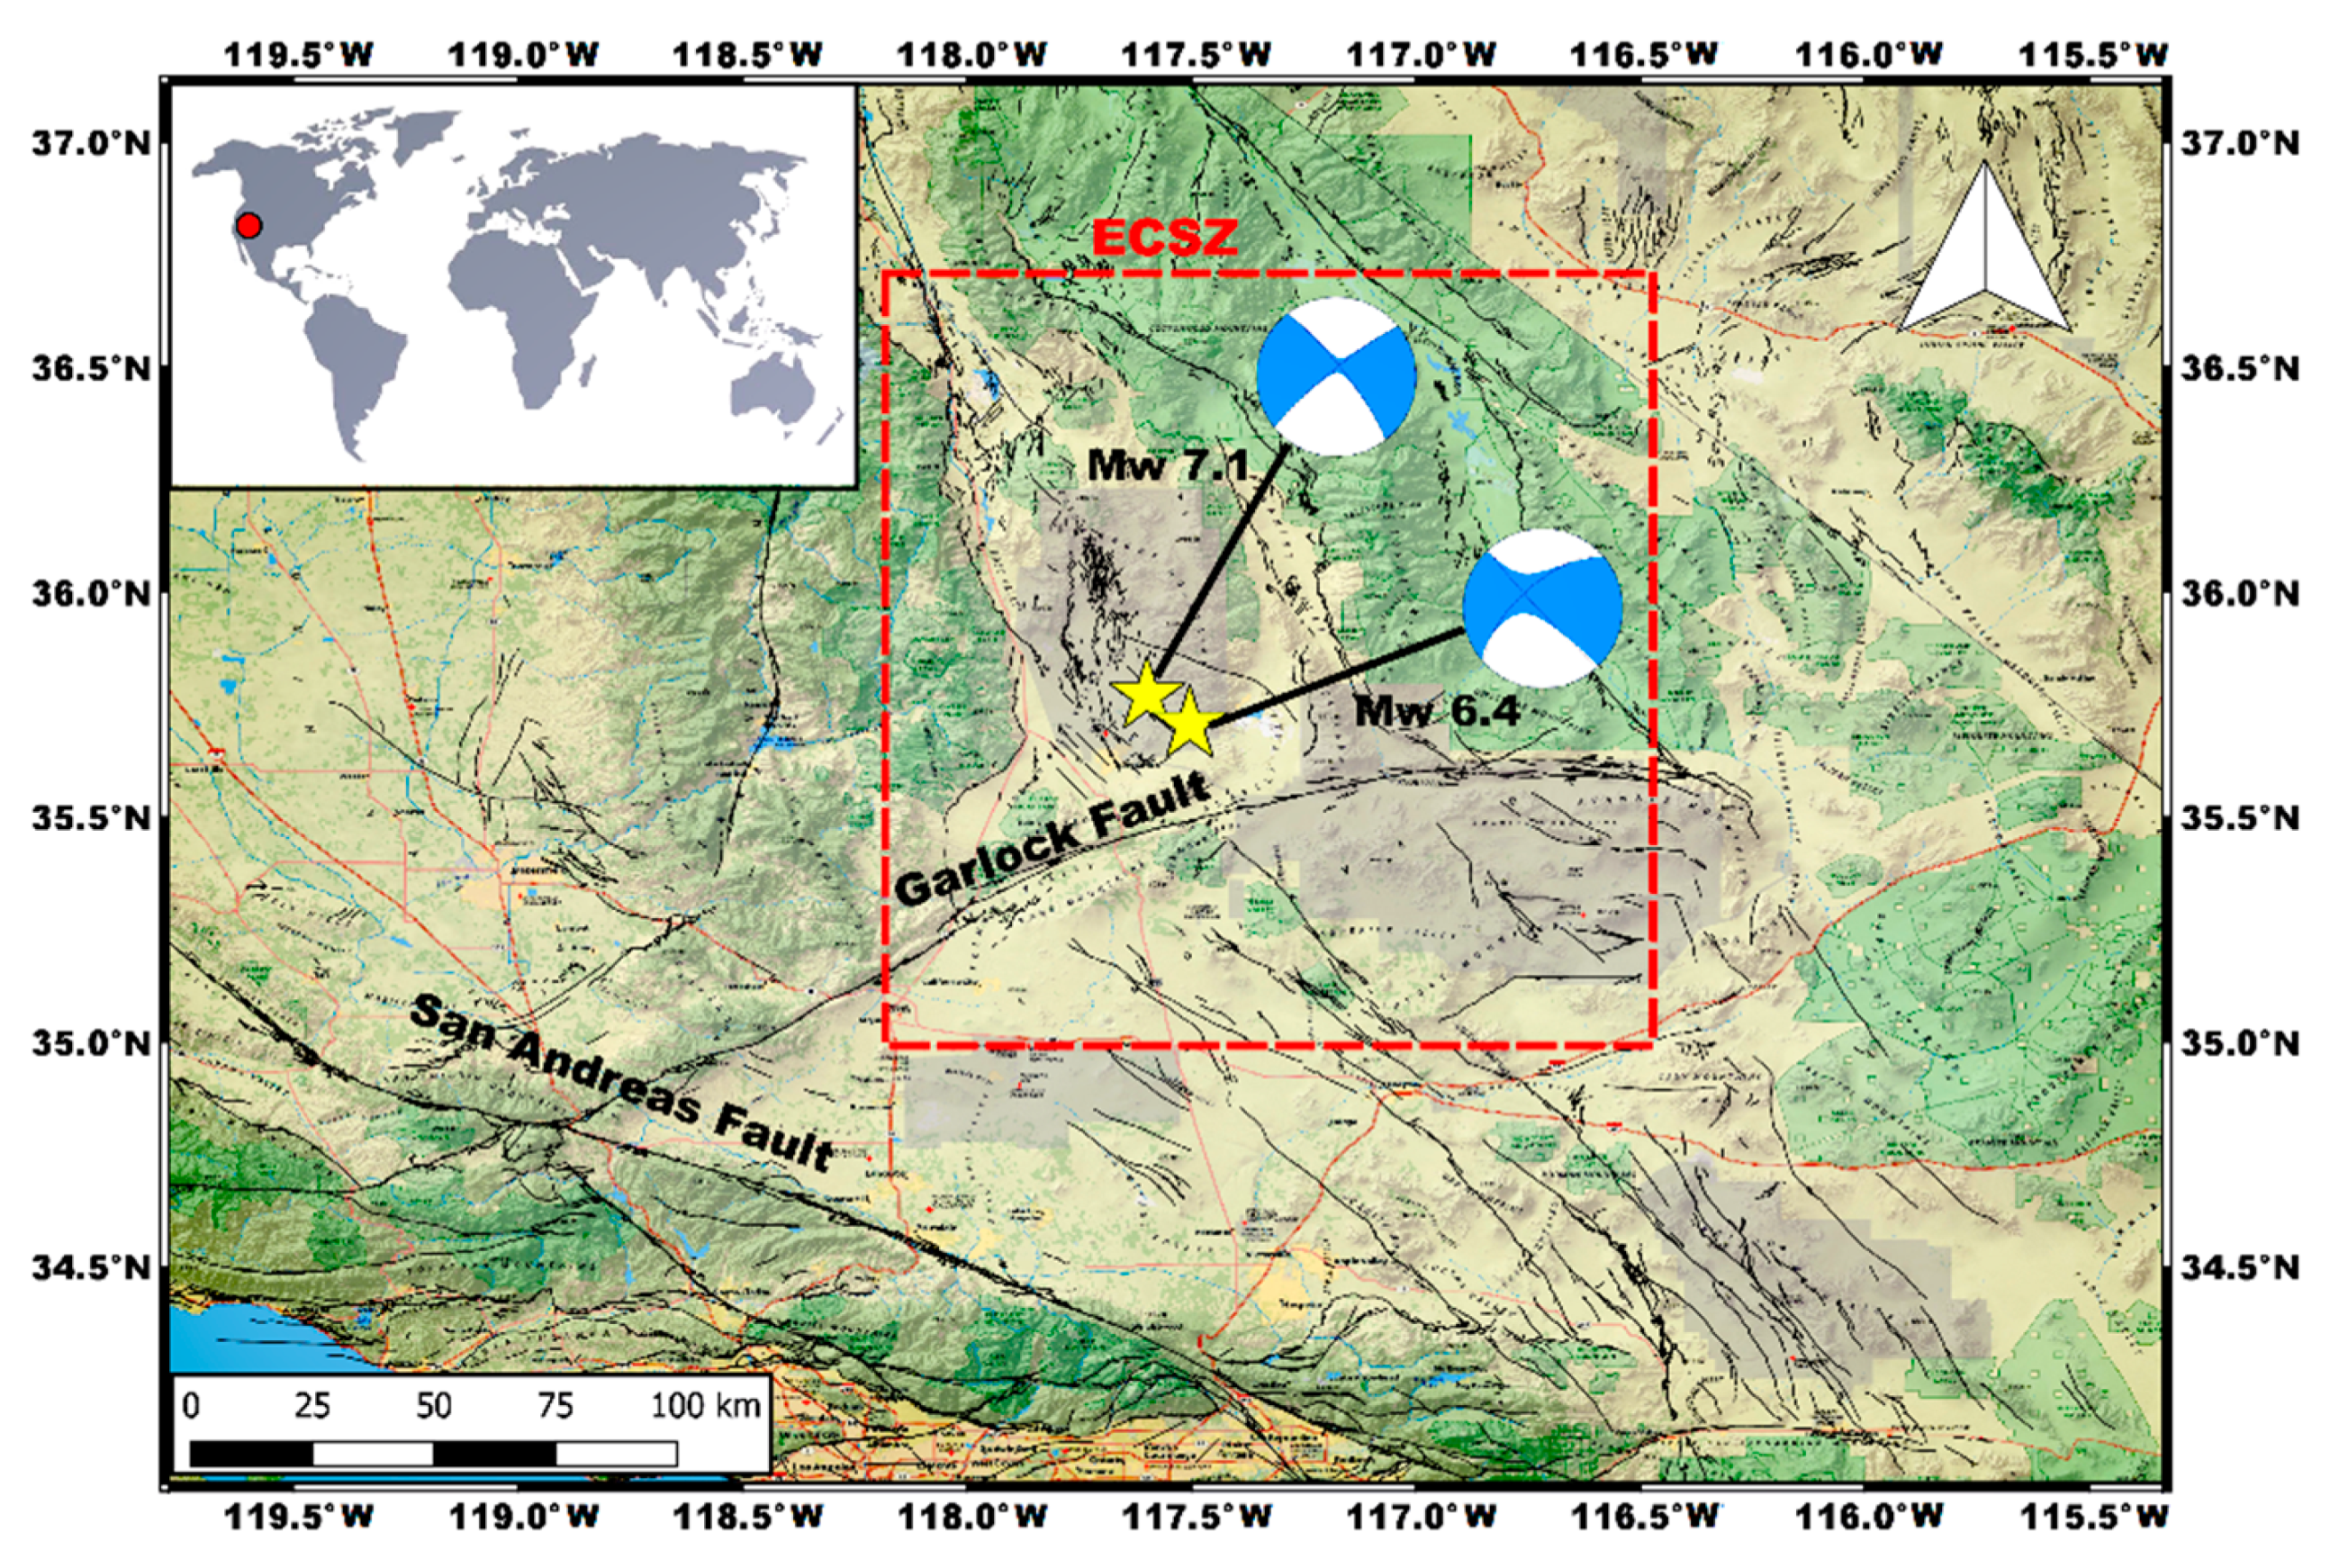
21]. This seismic sequence occurred within the framework of the eastern California shear zone (ECSZ), a nearly 125-km-wide zone of diffuse dextral shear that extends from the Owens Valley to the Mojave Desert, about 200 km east of the San Andreas fault system (
Figure 1), and involved numerous northwest-striking faults that accommodated as much as 25% of the motion between the Pacific and North American plates [
22]. The July 6th Mw 7.1 mainshock represents the strongest earthquake in California since the 1999 Mw 7.1 Hector Mine event.
We undertook our analysis using a single pair of SAR images acquired by the C-band Sentinel-1 (S1) mission of the European Space Agency (ESA) before the Mw 6.4 foreshock and after the Mw 7.1 mainshock. This made it possible to constrain the cumulative ground displacement induced by both events, as well as any early post-seismic deformation [
23]. The reliability of each SAR-based product was evaluated by comparing and validating the retrieved outcomes with the Global Navigation Satellite System (GNSS) measurements provided by the dense network in the area and collected from UNAVCO archive.
2. Tectonic Settings
The ECSZ is a diffuse shear zone involving numerous northwest-striking right-lateral strike-slip faults, with low individual slip rates, ranging from 1 to 3 mm/yr calculated from geological studies to 5 to 8 mm/yr gathered from geodetic observations [
18]. Recent earthquakes that occurred in the ECSZ include the 1992 Mw 7.2 Landers earthquake, the 1999 Mw 7.1 Hector Mine earthquake and the 2019 Ridgecrest earthquake sequence (
Figure 1). The latter occurred ∼50 km to the south of the 1872 ∼Mw 7.7 Owens Valley earthquake rupture [
24,
25]. The dominantly strike-slip Ridgecrest sequence occurred within the Little Lake fault zone (LLFZ) and the nearby Airport Lake fault zone on largely unmapped faults with a cumulatively length of about 75 km. The LLFZ is bounded to the southeast by the Garlock fault, a 260-km long left-lateral strike-slip fault capable of producing Mw ~7.8 earthquakes [
26]. The two major events ruptured a complex array of intersecting faults. The Mw 6.4 foreshock rupture started on a northwest-striking right-lateral fault strand and then continued on a southwest-striking fault with mainly left-lateral slip. The rupture of the Mw 7.1 mainshock was characterized by dominantly right-lateral slip on a series of northwest-striking fault strands, with a maximum slip of about 5 m at a depth range of 3–8 km [
23]. The 2019 Ridgecrest earthquake sequence produced a significant coulomb stress change on the Garlock fault segment (∼0.5 MPa coulomb stress increase) and triggered surface creep during the seismic sequence. Ponti et al. (2020) [
27] measured surface faulting and ground deformation for the Ridgecrest earthquake sequence. The Mw 6.4 event produced a nearly continuous left-lateral surface rupture, with little vertical displacement, along approximately 18 km of length. Left slip of more than 1.8 m was measured along this portion of the rupture, which can be observed to splay into several subparallel fault traces to the southwest. The Mw 7.1 earthquake produced rupture over a length of approximately 50 km, showing a dominant dextral slip variable in the range of 3–5 m.
3. SAR Data
The SAR data used in this study consisted of a pair of images acquired by the C-band Sentinel-1 mission of the European Space Agency (ESA) on July 4th (UTC start time: 01.50.23) and 10th (UTC start time 01.49.59), 2019 (
Table 1). Due to the NW–SE trending mechanism of the causative fault, we selected the ascending track since the orbit path is consistent with the fault geometry. Indeed, the azimuth angle in the ascending configuration, i.e., the orbit inclination with respect to the north, is about −13° whereas the incidence angle is about 41°. The original interferometric wide (IW) swath was composed of three sub-swaths, each divided into eight bursts, but here we used only two sub-swaths and six bursts, thus retrieving a frame of about 150 × 150 km surrounding the epicenters. InSAR, POT and MAI data processing techniques require a careful coregistration of the bursts when applied to S1 IW images. Therefore, we deramped all the coregistered bursts by the same phase ramp estimated for the primary image, which in this case was the first one, acquired on July 4th. Such coregistered and deramped data were then used as the input for each technique. The data processing was performed by package tools provided in the framework of GAMMA software [
28]. The original data resolution was about 3 × 15 m along the range and azimuth directions but we worked with averaged data in order to reduce the speckle noise by applying different multilook factors according to the needs of each technique. The retrieved displacement maps were then refined by in-house bash scripting tools applied to GAMMA tools. Finally, the digital elevation model (DEM) provided by the Shuttle Radar Topography Mission (SRTM) was exploited to remove the topographic contribution in the InSAR processing and geocode all the products.
3.1. InSAR
We applied a multilook factor of 24 looks in range and 6 along the azimuth, thus retrieving a pixel spacing of about 90 m. The standard InSAR approach was performed. We removed the topography by using the 90-m SRTM DEM and then filtered and unwrapped the obtained differential interferogram by adopting Goldstein filtering [
29] and a minimum-cost flow algorithm [
30]. Post-processing filtering was additionally applied to refine the result before the geocoding step.
3.2. POT
We applied a preliminary multilook process to the images with a very high factor of 64 looks in range and 16 along the azimuth, thus obtaining a pixel spacing of about 240 m. This choice was due to the need to minimize the significant noise effects on the POT and MAI products. We estimated the 2D shifts in the POT processing by setting the matching window size to 720 m. This matching window was used to search for the maximum of the normalized cross correlation (NCC) between the two images. The maximum NCC corresponds to the best estimation of the 2D shifts. This searching window has to be tens of units of radar resolution and is linearly related to the pixel spacing [
31]; here we set it to about three times the pixel spacing. Greater searching windows (up to 10–15 times the pixel spacing) return smoother and larger scale solutions. We then refined the obtained map by applying an adaptive spatial filter and masking the values outside the range by −+1.5 m.
3.3. MAI
Starting from the coregistered and deramped single look complex (SLC) S1 SAR images, we estimated the backward and forward images used in the MAI approach by splitting the antenna beam along the satellite LOF. This step was performed by squinting the beam and constructing two filters centered at frequencies backward- and forward-shifted with respect to the Doppler centroid. We set the frequency separation between the filter centers as equal to 0.5 the pulse repetition frequency (PRF), whereas the filters bandwidth was considered symmetrical with respect to the center frequencies and was the maximum possible within the processing bandwidth. Then, we retrieved the backward and forward interferograms and the MAI interferogram was obtained by estimating the phase difference between them, which is related to any LOF (azimuth) displacement.
Since a MAI interferogram is quite noisy we then refined the results by applying two-step filtering to minimize first the small-scale and then the large-scale artifacts.
4. GNSS Data
We collected available raw data for about 250 continuous stations located in a large region around the epicentral area from the UNAVCO archive. The GNNS phase observations, spanning the period from 2–8 July 2019, were processed using GAMIT/GLOBK 10.71 [
32] software. To eliminate phase biases related to drifts in the satellite and receiver clock oscillators, an ionosphere-free linear combination of GNSS phase observables was adopted during the processing by applying a double-differencing technique. The GNSS phase data were weighted according to an elevation angle-dependent error model [
33] using an iterative analysis procedure whereby the elevation dependence was determined by the observed scatter of phase residuals. In this analysis, the parameters of the satellites’ orbits were fixed to the International GNSS Service (IGS) final products. IGS absolute antenna phase center models for both satellite and ground-based antennas were adopted in order to improve the accuracy of vertical site position component estimations. The first-order ionospheric delay was eliminated by using the ionosphere-free linear combination, while second-order ionospheric corrections [
33] were applied using the The IONosphere Map Exchange (IONEX) files from the Center for Orbit Determination in Europe (CODE). The tropospheric delay was modeled as a piecewise linear model and estimated using Vienna Mapping Function 1 (VMF1) [
34] with a 10° cutoff. The earth orientation parameters (EOPs) were tightly constrained to prior values obtained from the International Earth Rotation and Reference Systems Service (IERS) Bulletin B. The ocean tidal loading was corrected using the FES2004 model [
35]. The IERS 2003 model for diurnal and semidiurnal solid Earth tides was also adopted. The results of this processing step were daily estimates of loosely constrained station coordinates and other parameters, along with the associated variance–covariance matrices. In the next step, the loosely constrained daily solutions were used as quasi-observations in a Kalman filter (GLOBK) in order to estimate a consistent set of daily coordinates (i.e., time series) for all sites involved. To compute the amount of 3D coseismic and early post-seismic displacement due to both the seismic events, we estimated the average site position in the two days before and after the events by applying minimal inner constraints (i.e., constraining translations, scale and rotations to 0.5 mm).
5. Results
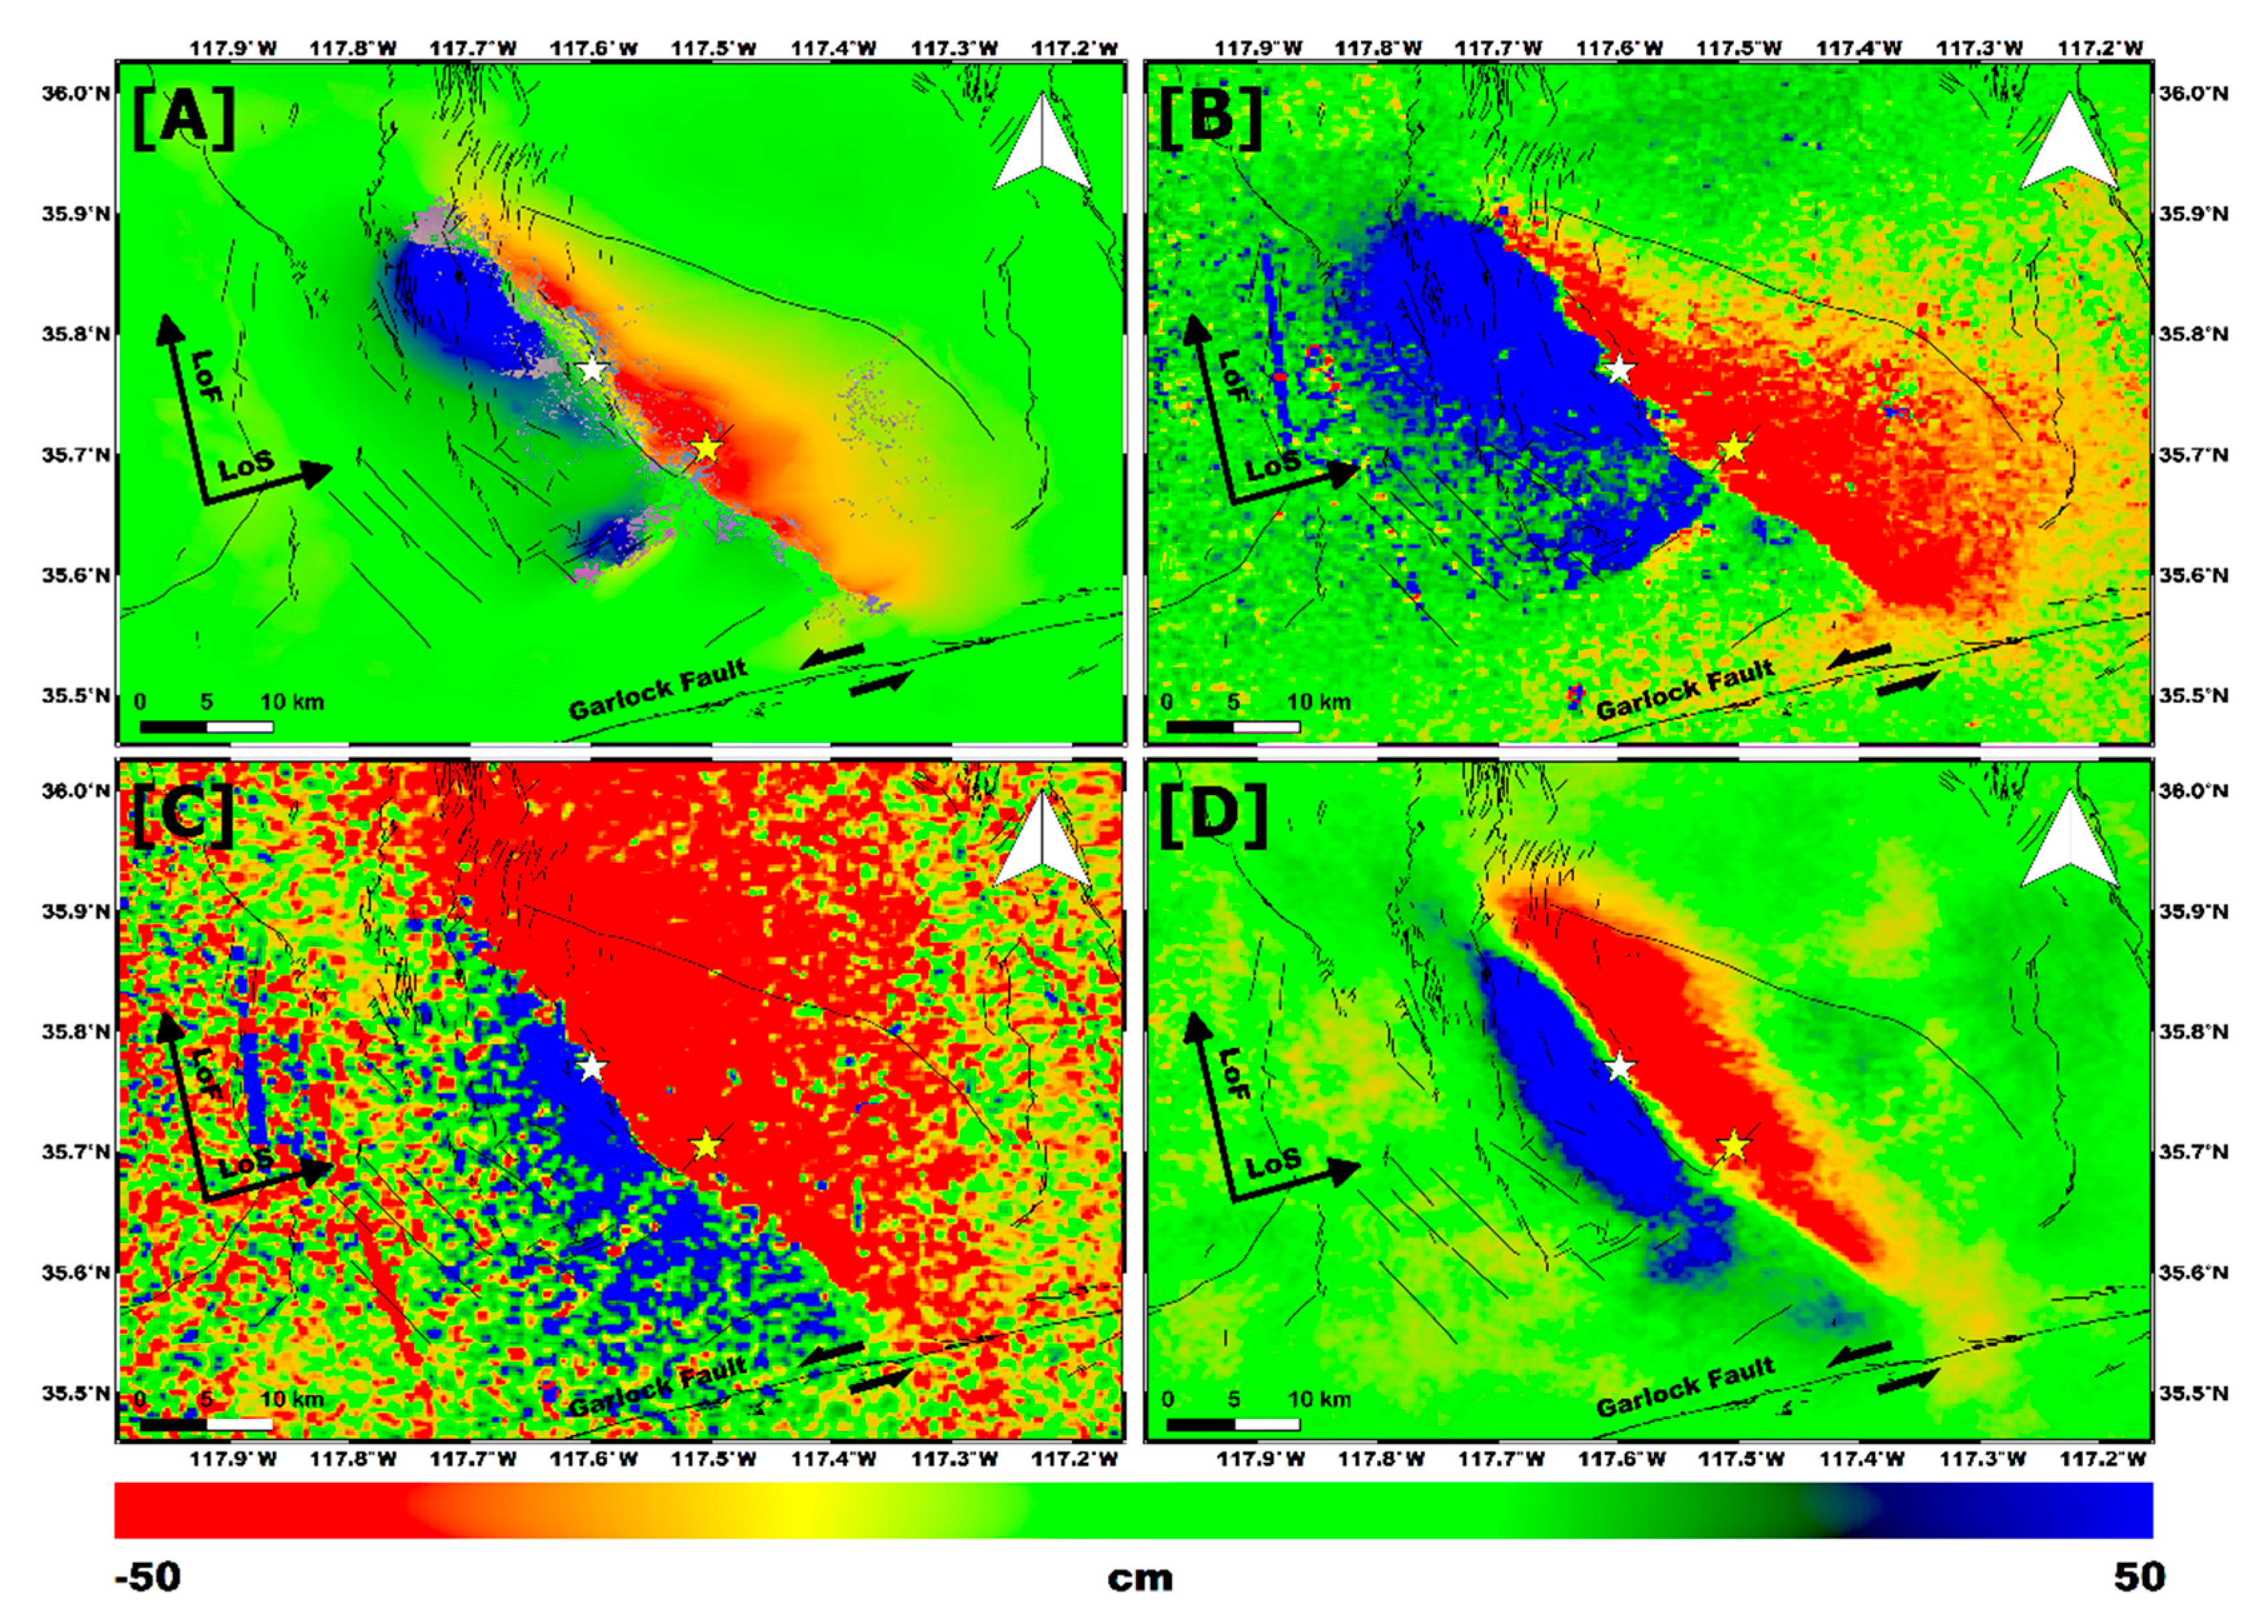
The results of the InSAR, POT and MAI approaches in terms of displacement maps are shown in
Figure 2, while
Figure 3 shows the GNSS coseismic and early post-seismic displacements encompassing both seismic events. In
Figure S2 is instead shown the original wrapped InSAR interferogram and in
Figure S3 we reported the GNSS time series of 5 stations in espicentral area. Lastly, in
Table S1 we summarize all the retrieved measurements.
Based on the distribution of the GNSS displacements larger than 4 mm, we focused our analysis on a window of about 100 × 100 km centered on the two epicenters (dashed green rectangle in
Figure 3).
As stated above, POT technique estimates the 2D shifts between images along both the LOS and LOF directions. Therefore, LOS and LOF POT displacement maps have to be consistent with InSAR and MAI displacement maps, respectively. Indeed, as expected, the deformation patterns detected, on the hand, by InSAR (
Figure 2A) and LOS POT (
Figure 2B) and, on the other hand, by MAI (
Figure 2D) and LOF POT (
Figure 2C) were in satisfactory agreement. Since the amplitude is a less stable parameter in SAR signal than the phase coherence, POT outcomes tend to be noisier being an amplitude-based technique unlike phase-based InSAR and MAI data. Moreover, POT seems to overestimate the ground deformation along both the LOS and LOF directions compared to InSAR and MAI. This is evident from a simple visual inspection of
Figure 2 but was further detailed with a profile analysis.
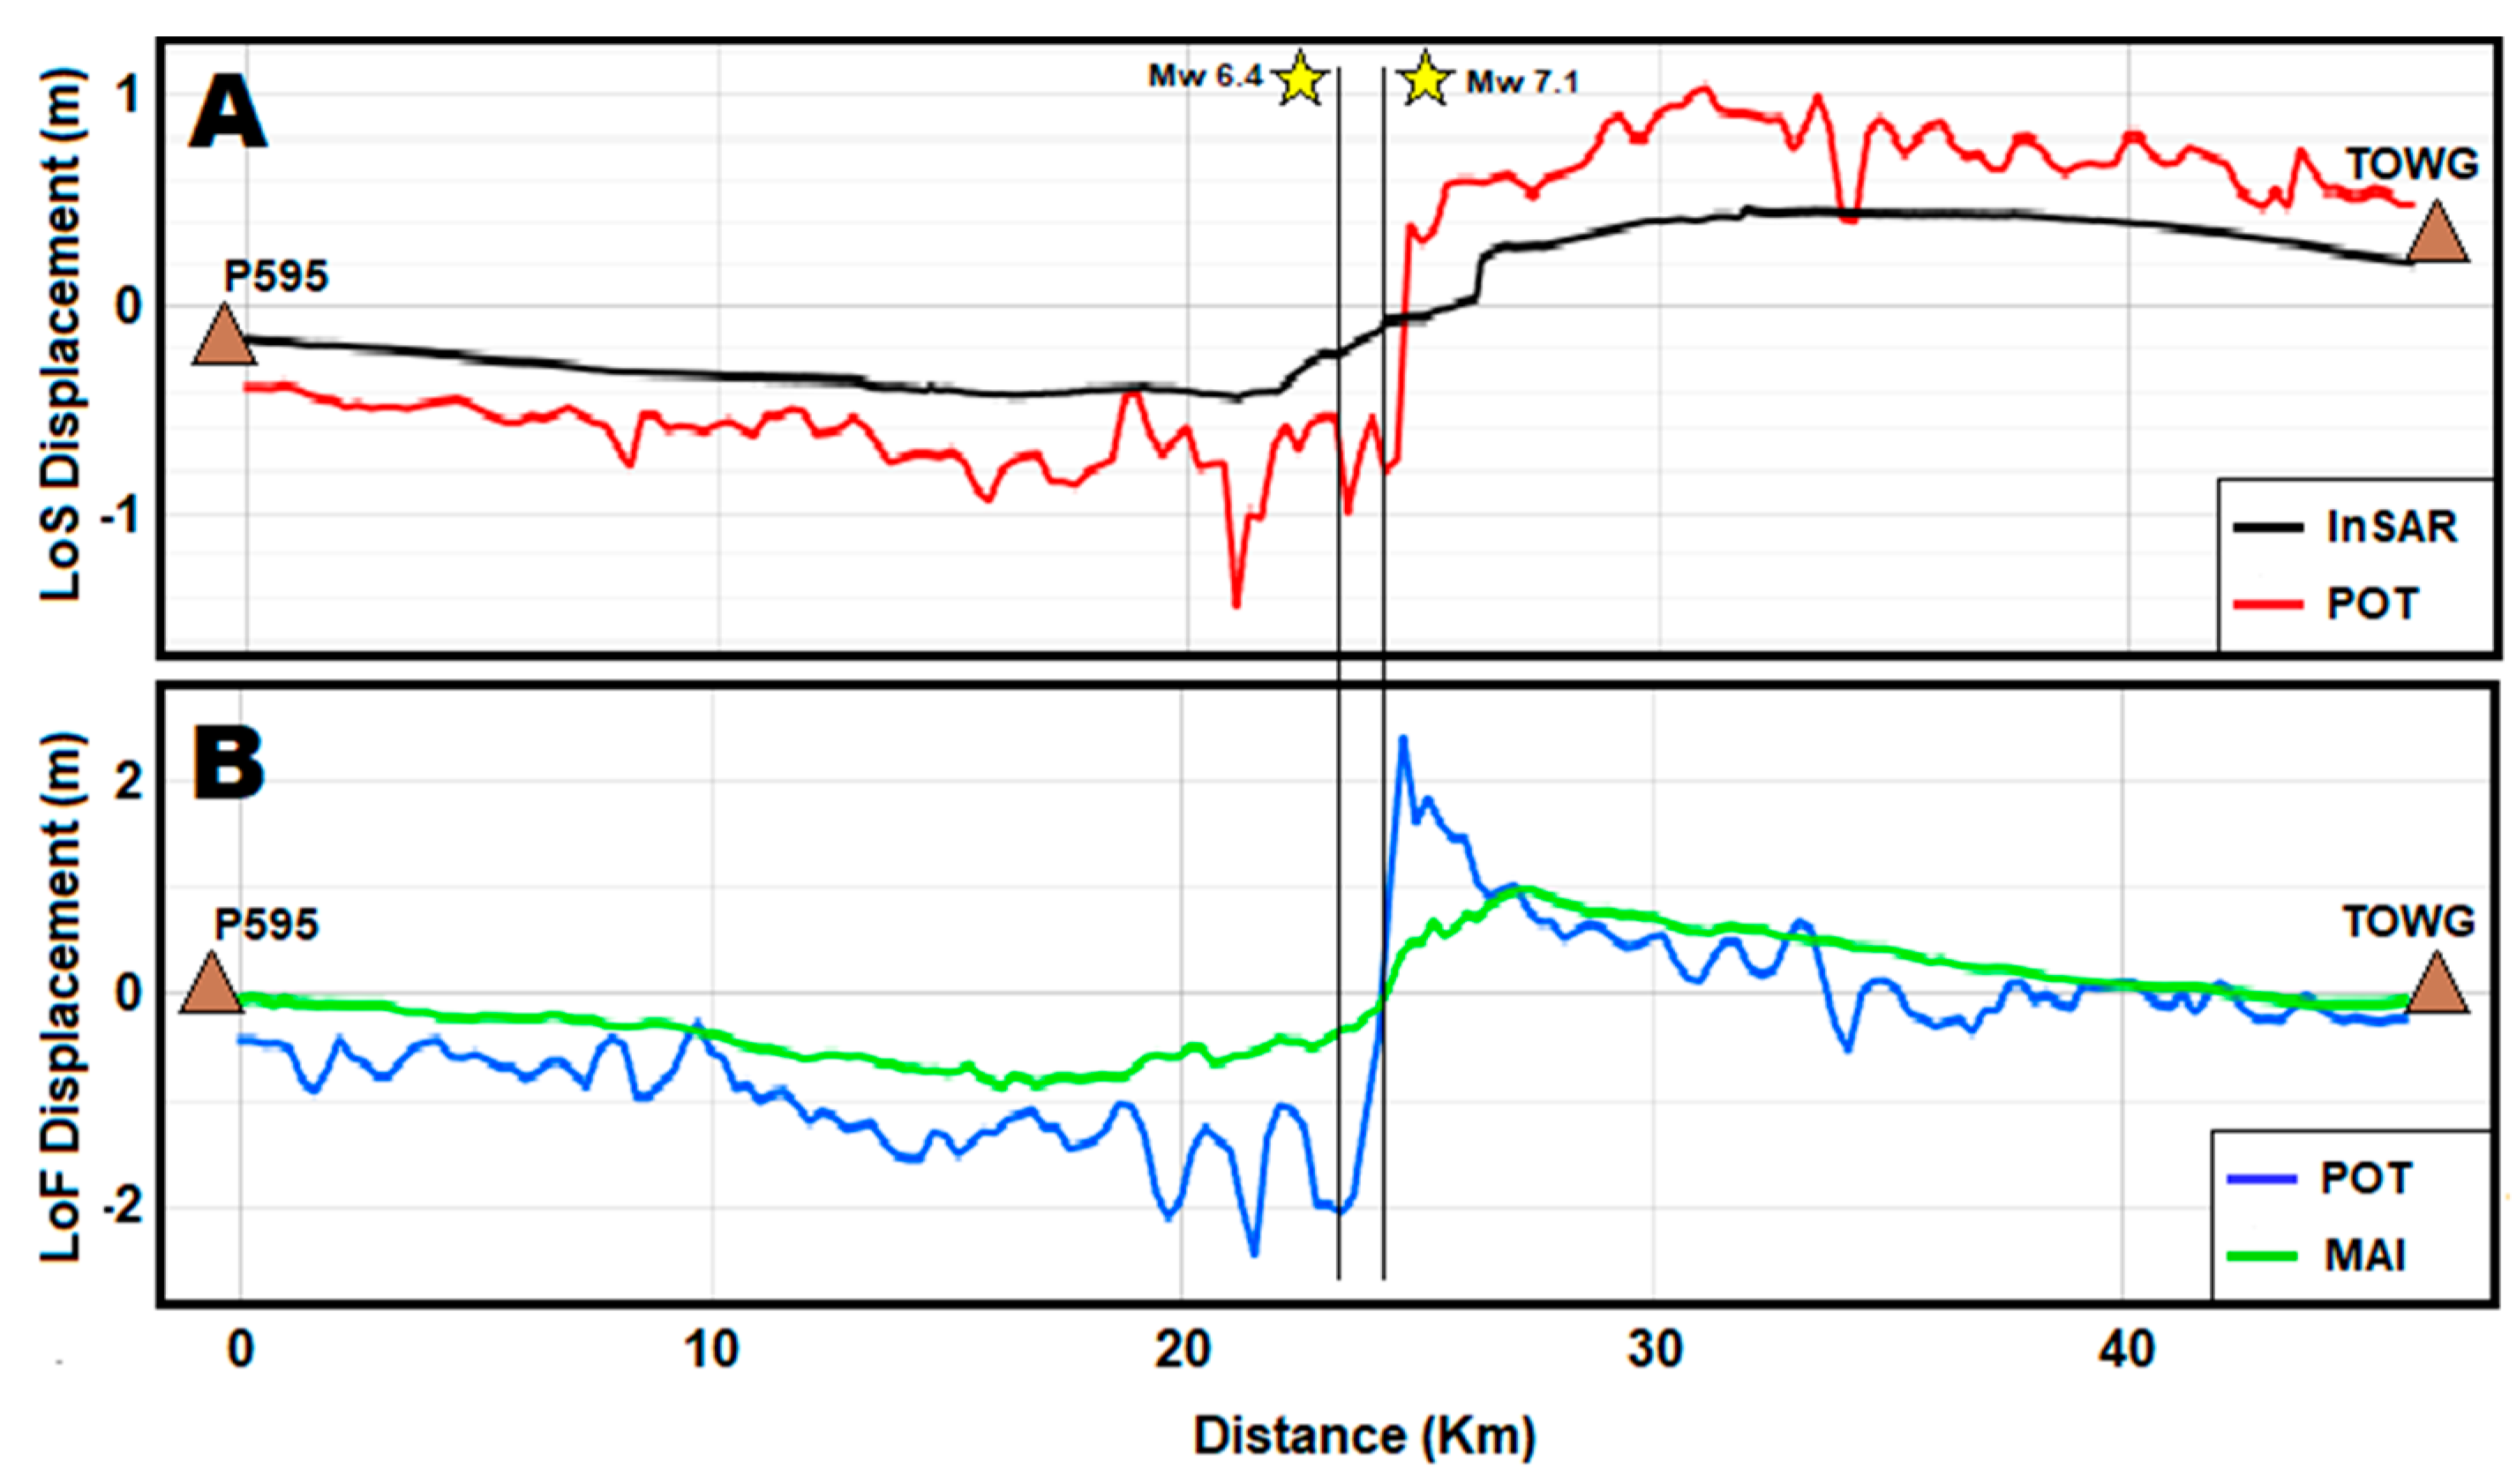
In particular, we traced the profiles for all the maps along two transepts (red dashed line in
Figure 3) crossing the earthquake epicenters and connecting the CCCC and P464 GNSS stations along the SW–NE direction and the TOWG and P595 GNSS stations along the SE–NW direction (
Figure 4 and
Figure 5). In
Figure S4 is instead reported the cross section perpendicular to the strike of the main event causative fault. The constraining of the surface fault rupture was in good agreement across all the data but it can be clearly seen that the intensity detected by POT data was about double along both the LOS and LOF directions compared to InSAR and MAI measurements.
Figure 4 and
Figure 5 show the SAR-amplitude noise effect resulting in very scattered behavior in the POT data profiles.
In order to understand whether the ground deformation was overestimated by POT data or underestimated by InSAR and MAI data, the validation of SAR remote sensing measurements was required. Therefore, in this study we assumed as ground truth the GNSS measurements of the stations represented in
Figure 3. To perform a reliable comparison, we projected all the GNSS measurements into the satellite LOS and LOF, since the errors are greater when decomposing InSAR, POT and MAI data in north–south, east–west and vertical deformation components. Then, we considered the SAR-based measurements extracted in correspondence to each GNSS station and averaged them with the three neighboring pixels. This analysis is shown in
Figure 6. The results in terms of the LOS displacement show some discrepancies between POT and GNSS data, especially with regard to the stations in the very near field, i.e., P594, P595, CCCC and TOWG, where up to about 60 cm of deviation of measurements was observed. InSAR and GNSS data showed a generally good agreement, with a difference of about 20 cm only for the P595 and TOWG stations. On the other hand, due to some coregistration inaccuracies along the azimuth direction characterizing the S1 IW mode images, LOF displacement showed worse results. In particular, POT also showed significant discrepancies in regions that were not very near field—for example, with regard to the DTPG and P568 stations—because of the strong random noise also observed in
Figure 2C. Finally, MAI results seemed more reliable, with shifts of a maximum of 20 cm only for the CCCC and P595 stations. The results in terms of RMSEs are summarized in
Table 2. As expected, InSAR data showed the best performance with an RMSE of 4 cm. MAI data were strongly influenced by the negative estimate on the CCCC station, which was instead located on the eastern side of the fault rupture moving northeastward (i.e., positive azimuth displacement). This was likely due to a local error and led to an RMSE of 10 cm. Lastly, POT data were noisier and were characterized by worse performances along both the LOS and LOF directions, showing RMSEs of 17 and 18 cm, respectively.
6. Discussion
The results highlight that the best agreement occurred between InSAR and GNSS data. Among all three SAR-based techniques, InSAR was the most accurate and it is known that InSAR-based data are particularly reliable in constraining the vertical displacement component. Such an outcome would be obvious when considering seismic events characterized by a vertical component stronger than the horizontal one, such as a normal or reverse faulting mechanism, but are quite unexpected in the study of strike-slip faulting mechanism earthquakes, as in the case of the 2019 Ridgecrest sequence. As shown in several studies [
17,
18,
19,
20], both the Mw 6.4 foreshock and the Mw 7.1 mainshock ruptured starting from northwest-striking right-lateral fault strands, thus mainly involving NS and EW displacement components. Since InSAR data are almost insensitive to any NS displacement, the good agreement found with GNSS measurements can be explained by the presence of a predominant EW displacement component. Such a feature was clearly highlighted in
Figure 3 by taking into account the dominant cumulative displacements measured at TOWG and P595 GNSS stations. Moreover, the sensitivity of InSAR data to EW displacements was increased because of the large incidence angle of the S1 SAR sensor, about 41° (see
Table 1). This also partially explains the better performance of LOS POT (RMSE 0.15) over LOF POT (RMSE 0.18). On the other hand, due to the azimuth angle of 13°, both LOF POT and MAI data were able to detect 97% of the NS displacement but only 22% of the EW one. Moreover, it is worth noting that the techniques seemed to overestimate (InSAR and POT data) or underestimate (MAI) the ground displacement in comparison to GNSS measurements when considering the stations closest to the epicenters, i.e., when the expected displacement should have been the greatest.
This was likely due to the different nature of the SAR-based and GNSS techniques. Indeed, GNSS data are punctual information related to the position of stations whereas in the SAR-based technique each pixel represents a ground section the size of which ranges from a few to several meters. Moreover, to reduce the noise effects, the SAR data were averaged, thus further increasing the pixel spacing. In particular, the retrieved InSAR pixel spacing was about 90 m, while the pixel spacing for both POT and MAI data was about 240 m, since a stronger filter was required.
Therefore, the displacement detected by SAR-based data sampled close to a given GNSS station represented the cumulative contribution of displacements estimated in areas of 90 m for InSAR and 240 m for POT and MAI; thus, the over/underestimation with regard to GNSS can be explained. This can be clearly observed at the P594, P595, CCCC and TOWG stations, especially considering the POT and MAI outcomes, which were characterized by worse spatial resolution than InSAR. Moreover, such coarse resolution of MAI and POT also affects the possible detection of local seismic-induced phenomena, such as landslides or soil liquefaction, which are often observed by InSAR techniques [
36,
37]. A general outcome of this analysis concerns the greater reliability of the SAR signal phase-based techniques, i.e., InSAR and MAI, with respect to the SAR signal amplitude based along both the LOS and LOF direction. The SAR phase signal is related to the radar target distance. Significant variation of this parameter can be due to real displacement signals or artifacts generally induced by atmosphere-related effects, typically in the order of a fraction of the radar wavelength. Therefore, in the case of C-band S1 data (λ = 5.33 cm), atmospheric artifacts of a few cm can be expected. Filtering out any large scale atmospheric artifacts can produce the smoothed solutions notably observed for the transition between positive and negative displacement in MAI data (
Figure 2D). On the other hand, SAR amplitude was strongly affected by SAR speckle noise, which was due to the cumulative effects of all the targets inside the resolution cell. This returned the very scattered behavior of the POT data observed in
Figure 4 and
Figure 5.
Therefore, POT data seems to be less reliable for exploitation for retrieving information about a seismic source. The strong noise together with the under/overestimation of the real displacement can severely impact modeling studies, returning significant errors in the retrieved depth or seismic source geometry, therefore leading to possible data misinterpretations. On the other hand, POT data can have an important role in tracing a rupture due to major to strong earthquakes, especially when SAR phase-based data fail because of the coherence loss due to great seismic-induced ground displacement. Such phenomenon can be observed for InSAR data in
Figure 2A, where there was no coverage in the proximity of the epicenters. Moreover, compared to POT and MAI data, InSAR data require a phase unwrapping step which is quite challenging and can potentially produce errors in the order of centimeters [
38].
To summarize the results, InSAR data show better performance than MAI and POT data by factors of about two and three, respectively, and thus they are confirmed, at least in the case of the 2019 Ridgecrest sequence, to be the most reliable SAR remote sensing techniques to infer information about a seismic source. On the other hand, MAI data seem to better constrain the azimuth deformation than POT data but the latter are very useful to retrieve the surface rupture trace.


