Article

Assessing Phytoplankton Bloom Phenology in Upwelling-Influenced Regions Using Ocean Color Remote Sensing

1
MARE—Marine and Environmental Sciences Centre, Faculdade de Ciências, Universidade de Lisboa, 1749-016 Lisbon, Portugal
2
IH—Instituto Hidrográfico, Rua das Trinas 49, 1200-677 Lisbon, Portugal
*
Author to whom correspondence should be addressed.
Remote Sens. 2021, 13(4), 675; https://doi.org/10.3390/rs13040675
Submission received: 16 January 2021 / Revised: 5 February 2021 / Accepted: 9 February 2021 / Published: 13 February 2021
(This article belongs to the Special Issue Remote Sensing Monitoring of Ocean and Coastal Biogeochemistry)

Abstract

:
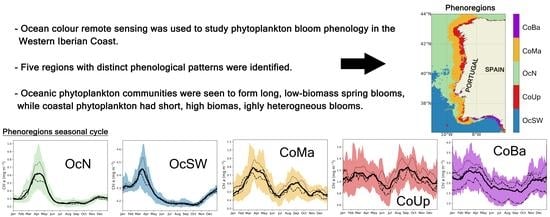
Phytoplankton bloom phenology studies are fundamental for the understanding of marine ecosystems. Mismatches between fish spawning and plankton peak biomass will become more frequent with climate change, highlighting the need for thorough phenology studies in coastal areas. This study was the first to assess phytoplankton bloom phenology in the Western Iberian Coast (WIC), a complex coastal region in SW Europe, using a multisensor long-term ocean color remote sensing dataset with daily resolution. Using surface chlorophyll a (chl-a) and biogeophysical datasets, five phenoregions (i.e., areas with coherent phenology patterns) were defined. Oceanic phytoplankton communities were seen to form long, low-biomass spring blooms, mainly influenced by atmospheric phenomena and water column conditions. Blooms in northern waters are more akin to the classical spring bloom, while blooms in southern waters typically initiate in late autumn and terminate in late spring. Coastal phytoplankton are characterized by short, high-biomass, highly heterogeneous blooms, as nutrients, sea surface height, and horizontal water transport are essential in shaping phenology. Wind-driven upwelling and riverine input were major factors influencing bloom phenology in the coastal areas. This work is expected to contribute to the management of the WIC and other upwelling systems, particularly under the threat of climate change.

Graphical Abstract

1. Introduction

Phytoplankton bloom phenology (i.e., the study of the annual timing and intensity of phytoplankton blooms) is key for the understanding of marine ecosystems. The development of phytoplankton blooms has important roles in the sequestration of CO2 [1,2] and may strongly influence marine food chains [3]. As a result, changes in bloom timing and intensity can have harmful consequences for the pelagic ecosystem, including mismatches between phytoplankton blooms and fish spawning, which may have severe impacts on pelagic fish communities and, consequently, on fisheries [4]. Moreover, with climate change threatening to alter bloom phenology and increase the frequency of extreme mismatches between fish reproduction and plankton peak biomass [5], changes in annual carbon sequestration budgets may occur [6]. However, even in regions such as the North Atlantic, where phenology studies have spanned over 60 years (e.g., [7,8,9]), certain aspects, such as what triggers the spring bloom initiation, remain uncertain [10]. Given its sensibility to exogenous forcing and different oceanographic regimes, phytoplankton phenology has been used as a major indicator of changes in the pelagic ecosystem [11] and is a tool to assess the ecosystem response to climate change [12,13].
Ocean color remote sensing (OCRS) has been increasingly important for the study of phytoplankton phenology. While OCRS data have their limitations (e.g., cloud coverage or lower accuracy in coastal waters due to colored dissolved organic matter (CDOM) or other seawater constituents), it enables the collection of long-term, continuous data at large spatial scales, contributing to major advances in phenology analysis. As satellite datasets become longer and both temporal and spatial resolution increase, the number of studies using OCRS to assess phenology has naturally increased (e.g., [14,15,16,17]. Most studies have a global or basin-wide focus (e.g., [14,18,19]), yet regional studies focusing on coastal regions are scarce. The higher complexity of coastal regions shapes bloom phenology, as the development of phytoplankton blooms is strongly influenced by variability patterns in environmental conditions stemming either from oceanographic phenomena (e.g., currents, upwelling, eddies; [20,21]) or anthropogenic pressure [22,23].
Several OCRS-based methods have been used to assess bloom phenology, typically focusing on the spring bloom. Most studies focused on the timing of the initiation of the spring bloom and/or the timing of its peak (i.e., when the maximum chl-a concentration is reached). While there is not a standard metric, studies usually define the initiation of the spring bloom based on thresholds set for the annual mean/median [8] or cumulative distribution of remote-sensing chl-a [24]. Ferreira et al. [25] found that either using a threshold of 15% of the cumulative distribution or a threshold of 5% above the yearly median delivers precise and comparable results, stressing that the best metric is case-dependent. Another important aspect is the temporal resolution of OCRS-based phenology studies. While a few studies have used satellite data with a weekly resolution, most use either fortnightly or monthly composites to avoid gaps (e.g., [15,17,19]). Using a temporal resolution coarser than one day may be insufficient to accurately assess changes in bloom phenology in areas where bloom-inducing conditions change rapidly [26]. Nevertheless, while daily resolution would be considered optimal for bloom phenology, it should be used carefully due to the potential existence of large, error-inducing gaps in time-series [25].
Thus, there is a lack of regional studies on phytoplankton bloom phenology based on long, continuous datasets with high temporal resolution. While OCRS-based works have become increasingly more common, most use a temporal resolution coarser than it would be optimal for bloom phenology. As climate change threatens to change bloom phenology globally, likely affecting regions differently, filling these gaps becomes increasingly crucial. This study aims to fill these research gaps by using the Western Iberian Coast (WIC), a complex coastal region located in SW Europe, as a case study. In this work, a long-term (22-years) satellite dataset with daily resolution will be used to assess phytoplankton bloom phenology. Using phenoregions (i.e., areas with coherent phenology patterns), this work seeks to answer the following questions: (i) How does phytoplankton bloom phenology vary across WIC? (ii) Has bloom phenology in the WIC changed over the past 20 years? and, (iii) What are the main drivers of interannual changes in bloom timing and intensity along the different areas of WIC?

2. Data and Methods

2.1. Study Area

The Western Iberian Coast (36–45°N, 6–12°W; Figure 1) is located in Southwestern Europe, encompassing the Atlantic coast of both Portugal and Spain. Oceanographically, this is considered a complex and heterogeneous region. Regional phytoplankton communities are influenced by several agents, from basin-wide agents such as the North Atlantic Oscillation (NAO) or the Atlantic Multidecadal Oscillation (AMO) pattern to mesoscale and local ones (e.g., coastal upwelling, eddies, larger river basins drainages [27,28,29,30]. Wind-driven coastal upwelling is a major factor shaping biological communities during the summer [31,32], owing to WIC’s placement in the northernmost sector of the Canary Current Upwelling System. Although several upwelling centers can be found, the main one is located in Northwestern WIC, coinciding with an Iberian sardine recruitment hotspot [33]. Recent studies have shown that, while drivers of phytoplankton biomass vary within the WIC, the most common include NAO, AMO, mixed layer depth (MLD), sea surface height (SSH), and wind direction (e.g., [29,30,34,35]).

2.2. Chl-a Data

Satellite-derived chl-a (mg m−3) was used as a proxy of phytoplankton biomass. Level 3 daily chl-a data, for the period 1997–2018, with a spatial resolution of 4 × 4 km, was extracted from the ESA Ocean Color-Climate Change Initiative (OC-CCI) product (version 4.2; available online at https://esa-oceancolor-cci.org/; (accessed on 13 May 2020) [36]). This product integrates OCRS data from four distinct ocean color sensors: the Sea-Viewing Wide Field-of-View Sensor (SeaWiFS; 1997–2010), the medium-resolution imaging spectrometer (MERIS; 2002–2012), the moderate resolution imaging spectroradiometer (MODIS; 2002–present), and the visible infrared imaging radiometer suite (VIIRS; 2011–present). To integrate data from different sensors, data were initially atmospherically corrected using the POLYMER v4.1 algorithm (MERIS [37]) and the l2 gen tool from SeaDAS v7.5 (SeaWiFS, MODIS, and VIIRS). Data were subsequently band-shifted to the main SeaWiFS bands, bias-corrected, and merged. A valuable characteristic of this dataset is that it contains information on the error and bias of its measurements, using generated optical water classes based on remote-sensing reflectance to identify the best performing algorithms for each water class (more information in [38,39]). The OC-CCI chl-a product is validated with extensive in situ data with global distribution (see [40]), exhibiting a good correlation with in situ measurements for case 1 waters (R2 = 0.73 [39]).
Nevertheless, to study coastal regions, it is essential to ensure that the algorithm has a good regional performance due to the possible influence of case 2 waters. Case 2 waters are those whose inherent optical properties (IOPs) are not predominantly shaped by phytoplankton. Typically, these coincide with coastal or inland waters with higher concentrations of CDOM and mineral particles. IOPs of case 1 waters, on the contrary, are dominated by phytoplankton, which makes it easier to derive chl-a or other ocean color variables. Within the WIC, a regional validation has already been performed for version 1 of the OC-CCI chl-a product, using in situ data from the Portuguese Coast [41]. The authors reported root-mean-square error (RMSE = 0.33), standard deviation, and coefficient of determination (R2 = 0.74) comparable to other products (e.g., MODIS OC3M). For the current study, a new validation exercise for version 4.2 of the OC-CCI product [36], using more recent in situ data from the Portuguese Coast, confirmed these results (data not shown). Among others, the determination coefficient was seen to be similar (R2 = 0.6), and the root-mean-square and bias errors were lower, a signal of an increase in performance from the initial version of the product (n = 113). Thus, the performance of the OC-CCI v4.2 chl-a product seems appropriate to evaluate regional phytoplankton bloom phenology in the WIC.

2.3. Estimating Bloom Phenology

Since the estimation of bloom phenology metrics may be highly impacted by missing data [42], the chl-a dataset was preprocessed using two methodologies. First, a 3-step gap-filling algorithm, as implemented by Racault et al. [42], was applied. This algorithm consists of sequentially filling gaps with a 3-pixel-size window using the mean value of its neighbors along the three dimensions of the dataset (i.e., longitudinally, latitudinally, and over time; see [42] for more details). Second, a 3-week centered moving mean was used to smooth the chl-a signal, helping fill the remaining gaps that could yet be present in the time-series, following [25]. While there is the risk that these procedures may slightly alter the chl-a signal linked to short enrichment events (e.g., upwelling events), it is necessary to prevent phenology metrics from being skewed by anomalous biomass spikes that may occur during such events. To evaluate the mean phenology metrics between 1998 and 2018 across WIC, an average of the chl-a concentration for each day of the year during 1998–2018 was calculated for each pixel. Data corresponding to 29 February was discarded since it only occurs in leap years and would be severely under-represented. Thus, for each pixel, a vector containing the mean annual cycle (n = 365) was obtained.
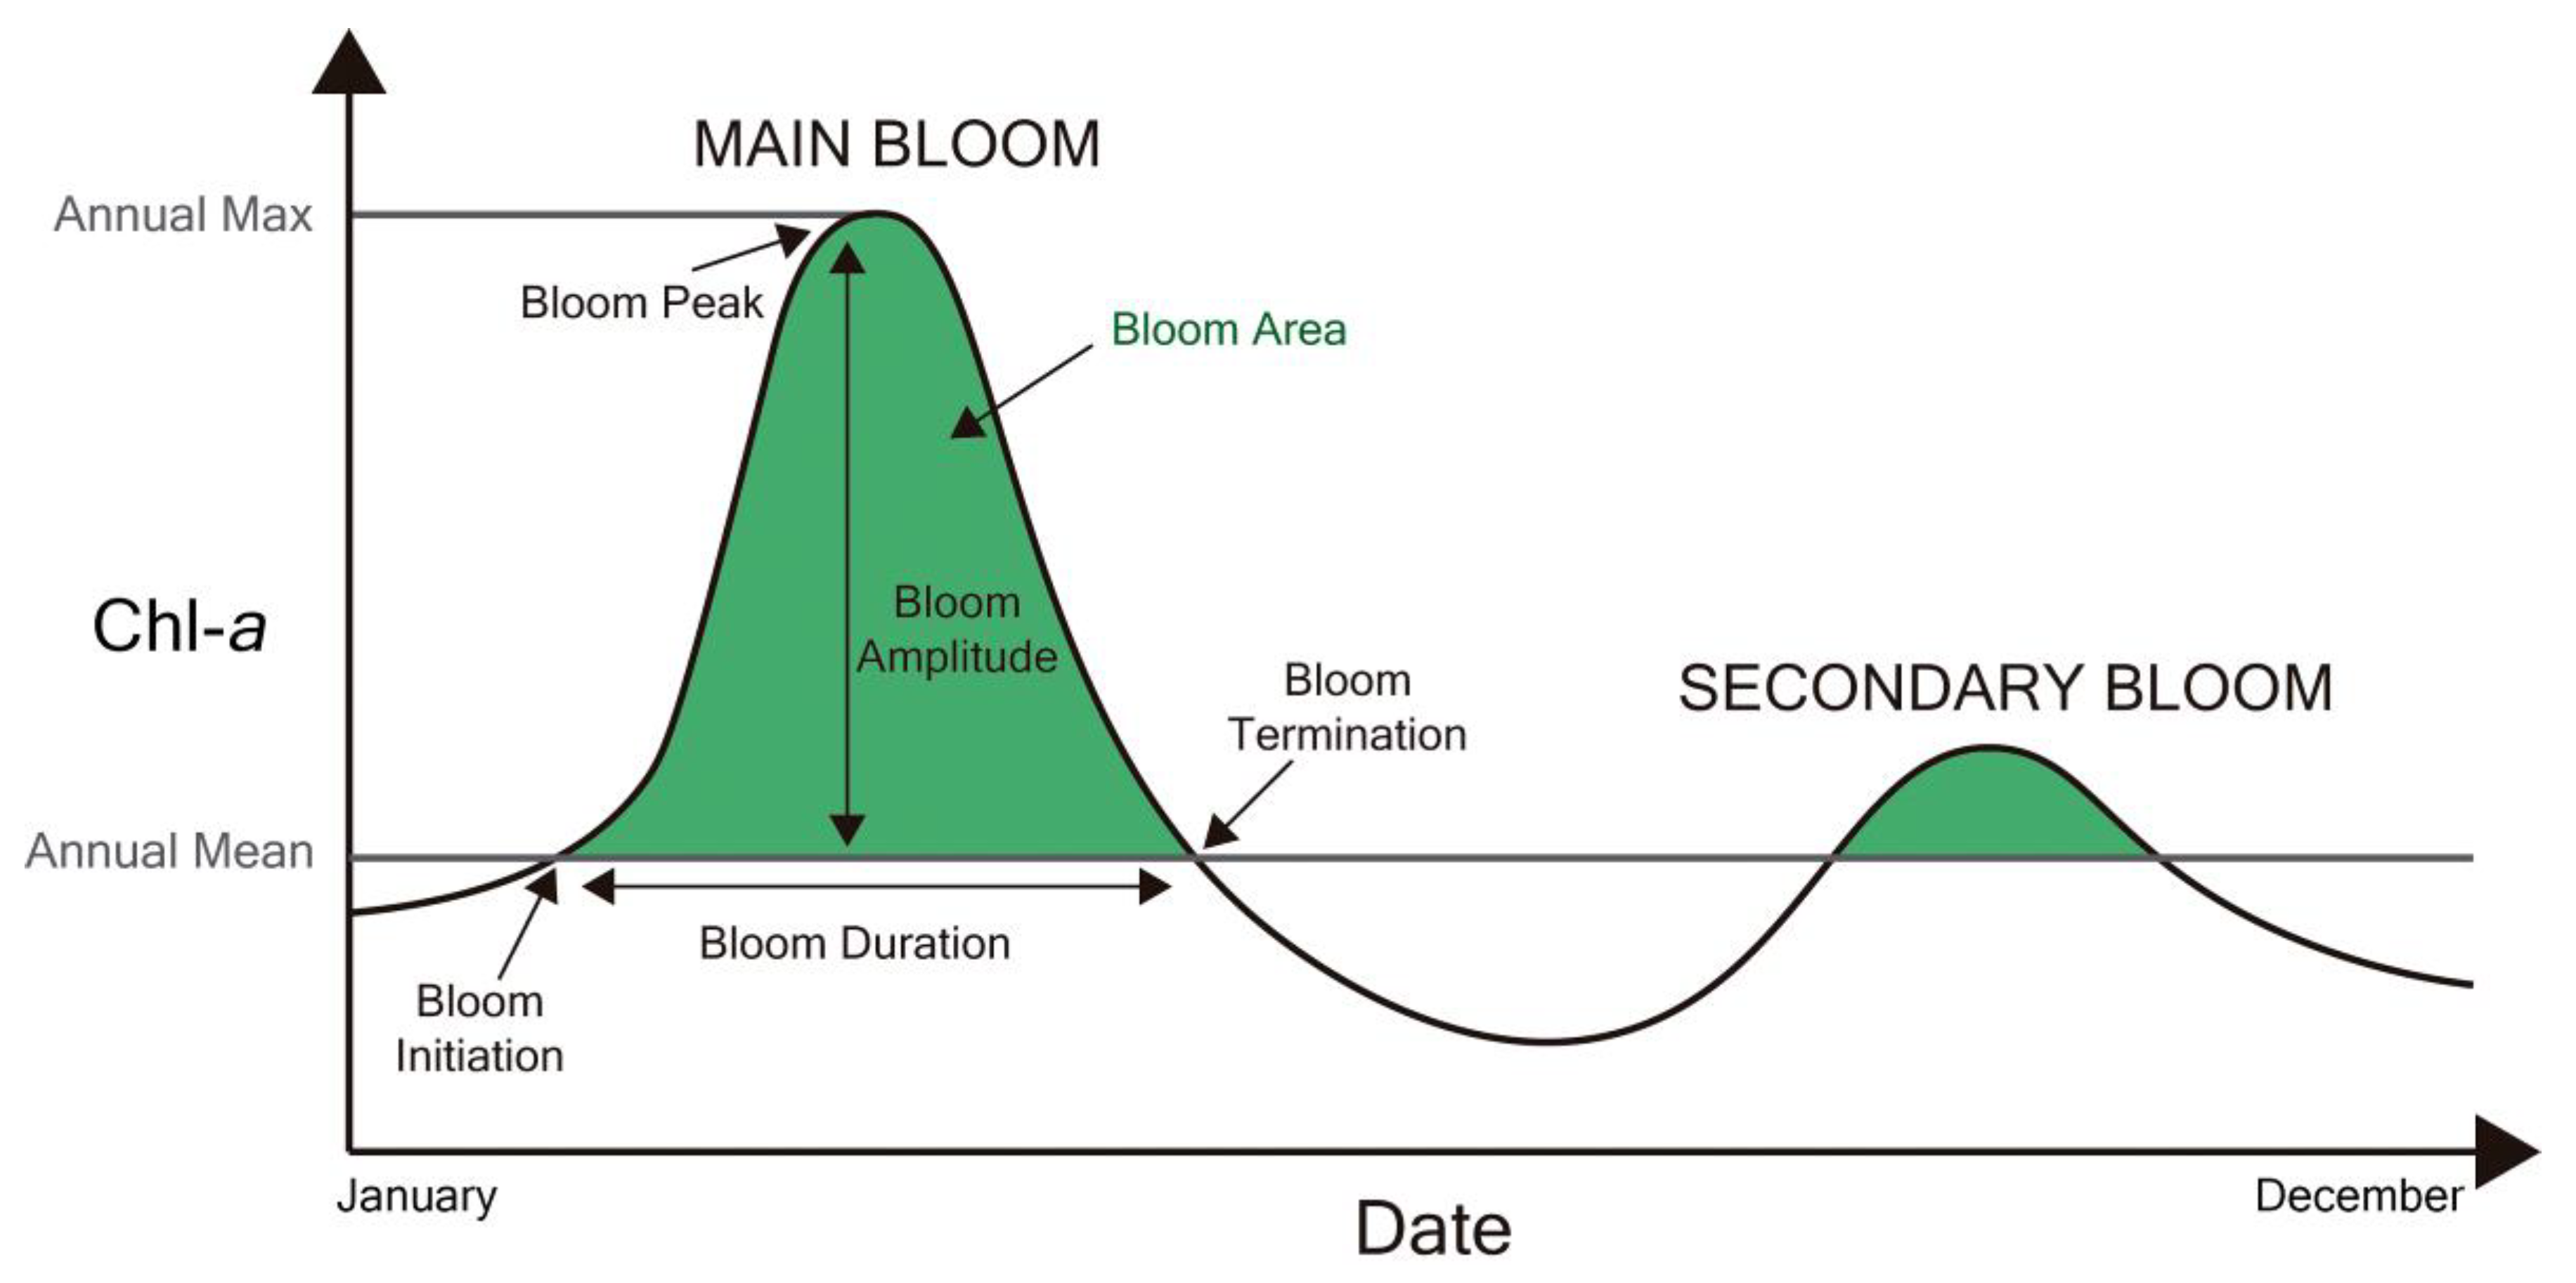
The following phenological metrics were estimated for each pixel (Table 1): (1) yearly chl-a mean (mg m−3); (2) yearly chl-a maximum (mg m−3); (3) amplitude of the bloom (mg m−3; BAmp); (4) day of bloom initiation (day of the year; BInit); (5) day of bloom termination (day of the year; BTerm); (6) duration of the bloom (days; BDur); (7) day of the peak chl-a concentration registered during the bloom (day of the year; BPeak); (8) area of the bloom (mg m−3; BArea); (9) bloom frequency (blooms year−1; BFreq); and (10) yearly area (mg m−3; YArea). Figure 2 shows an example of how certain metrics were derived.
The metrics BAmp, BInit, BTerm, BDur, BPeak, and BArea, were only calculated for the main bloom of the year (i.e., where the maximum chl-a concentration was identified). Blooms were identified using two criteria [24,43]: (1) chl-a must surpass a threshold of 5% of the annual chl-a median, and (2) this condition must be maintained for a minimum of 15 days.
While this approach does exclude blooms shorter than two weeks, this approach helps reduce noise and delivers robust results [25]. Moreover, it should be better suited for studying blooms across the year than algorithms that focus on the cumulative distribution of chl-a (e.g., [24,44]), which is better suited for identifying the spring bloom. Bloom initiation (BInit) and bloom termination (BTerm) dates were defined as the day of the year before and after the bloom, respectively (i.e., when chl-a biomass fell below 5% of the annual median). Bloom duration (BDur) was calculated as the difference in days between termination and initiation of the bloom, while the amplitude (BAmp) corresponds to the difference between the yearly maximum and mean. BArea was estimated by numerically integrating the area of the graphical representation of chl-a biomass during the period of the bloom, using Simpson’s rule, and used as a measure of the magnitude of the bloom in terms of phytoplankton biomass. The YArea was calculated exactly as BArea, but for the entire yearly cycle. Note that, since these two methods integrate chl-a data, they maintain their units and may yield a wide range of chl-a concentration depending on the chl-a and duration of the bloom (10–1000 mg m−3).

2.4. Regional Analysis of Bloom Phenology

Subsequently, to account for its spatial heterogeneity, the WIC was partitioned into phenoregions (i.e., regions with coherent phenology) using the phenology metrics calculated in Section 2.3. This approach has already been successfully applied (e.g., [15,45]) and enables further analysis of the annual chl-a cycles within each phenoregion. First, autocorrelated phenology metrics were discarded from the analysis (R2 > 0.75). Second, an agglomerative hierarchical clustering analysis was performed using the following phenology metrics calculated for each pixel: yearly maximum, BPeak, BInit, BTerm, BDur, BArea, and BFreq. Data were normalized before analysis. Euclidean distance was used as the distance metric between pixels and Ward’s method [46] as the linkage criterion. Ward’s method is considered as one of the most robust hierarchical clustering methods and has the advantage of being able to separate clusters surrounded by noise [47], a valuable feature due to the complexity of WIC.
Finally, for each one of the defined phenoregions, chl-a was spatially averaged and used to estimate the same eleven phenology metrics for each year (n = 21). To account for blooms that span over two calendar years (e.g., a bloom that starts in November and ends in January), a 1-year temporal window spanning 6 months before the BPeak to 6 months after was used. Metrics were subsequently calculated for this window, following [43]. Whenever this was not possible (e.g., at the beginning and end of the dataset), the corresponding year was excluded from the analysis. For each of the calculated metrics, a linear trend was calculated for the period 1998–2019 by estimating the slope of the least-squares fit.

2.5. Environmental Data Products

To investigate the drivers of phytoplankton bloom phenology for each of the phenoregions identified, a comprehensive suite of environmental variables were gathered (Table 2): sea surface temperature (SST; °C), mixed layer depth (MLD; m), salinity (SAL; unitless), sea surface height, a proxy of heat storage as warmer waters expand and exhibit higher SSH (SSH; m), the zonal (V) and meridional (U) component of surface seawater direction (m.s−1), nitrate (NO3; µM), ammonium (NH4+; µM), phosphate (PO43−; µM), silicon (Si; µM) and the euphotic zone depth (Zeu; m).
SST (daily 4 km spatial resolution) was extracted from the ODYSSEA Level 4 reprocessed SST product over the European North West Shelf/Iberia Biscay Irish Sea [48]. Model-based MLD, SAL, SSH, U, and V were acquired from the Copernicus Marine Environmental Monitoring Service (CMEMS) North Atlantic Iberian Biscay Irish Regional Seas Ocean Physics Reanalysis Product [49], with a temporal and spatial resolution of 1 day and ≈8 km, respectively. NO3, NH4+, PO3−4, Si, and Zeu modeled data were retrieved from CMEM’s North Atlantic Iberian Biscay Irish Regional Seas Ocean Biogeochemistry Non-Assimilative Hindcast product [50], again with a temporal and spatial resolution of 1 day and ≈8 km. Dissolved inorganic nitrogen (DIN; µM) was calculated as the sum of NO3 and NH4+. All these products are available online at CMEMS (http:/marine.copernicus.eu/ (accessed on 13 May 2020)). Each product is specific for the North-West Atlantic region, which encompasses the Iberian West coast. Plus, it is internally validated using data from various sources (e.g., remote sensing, modeled, and in situ data) prior to distribution, ensuring higher quality. Yearly datasets on the NAO, AMO, and multivariate El Niño/Southern Oscillation Index (MEI) spanning 1998–2018 were also acquired from NOAA (available online at https://www.esrl.noaa.gov/psd/data/climateindices/ (accessed on 13 May 2020)).

2.6. Random Forest Analysis

Random forest (RF) models [51] were used to identify and evaluate the main drivers of each metric of bloom phenology. RF is one of the most popular analysis tools in ecology for identifying predictors of a given response (e.g., [52,53,54,55,56]), mainly due to its suite of advantages: (1) high flexibility and capability to detect nonlinear links between the predictors and the response variable; (2) high robustness to overfitting; (3) ability to successfully cope with outliers, high-dimensional data and collinearity among predictors; (4) consistent and easily understandable results [52,57,58].
RF is based on the aggregation of multiple decision trees. Each regression tree is built using a random sample from the input dataset. Along the tree, a random selection of predictors is available at each decision node, where a splitting predictor is chosen based on a criterion until a final prediction is made at the end of the tree. An important component of the RF algorithm is the use of out-of-bag observations (i.e., a random subset of observations not used for training the algorithm [51]) error to internally validate the trees.
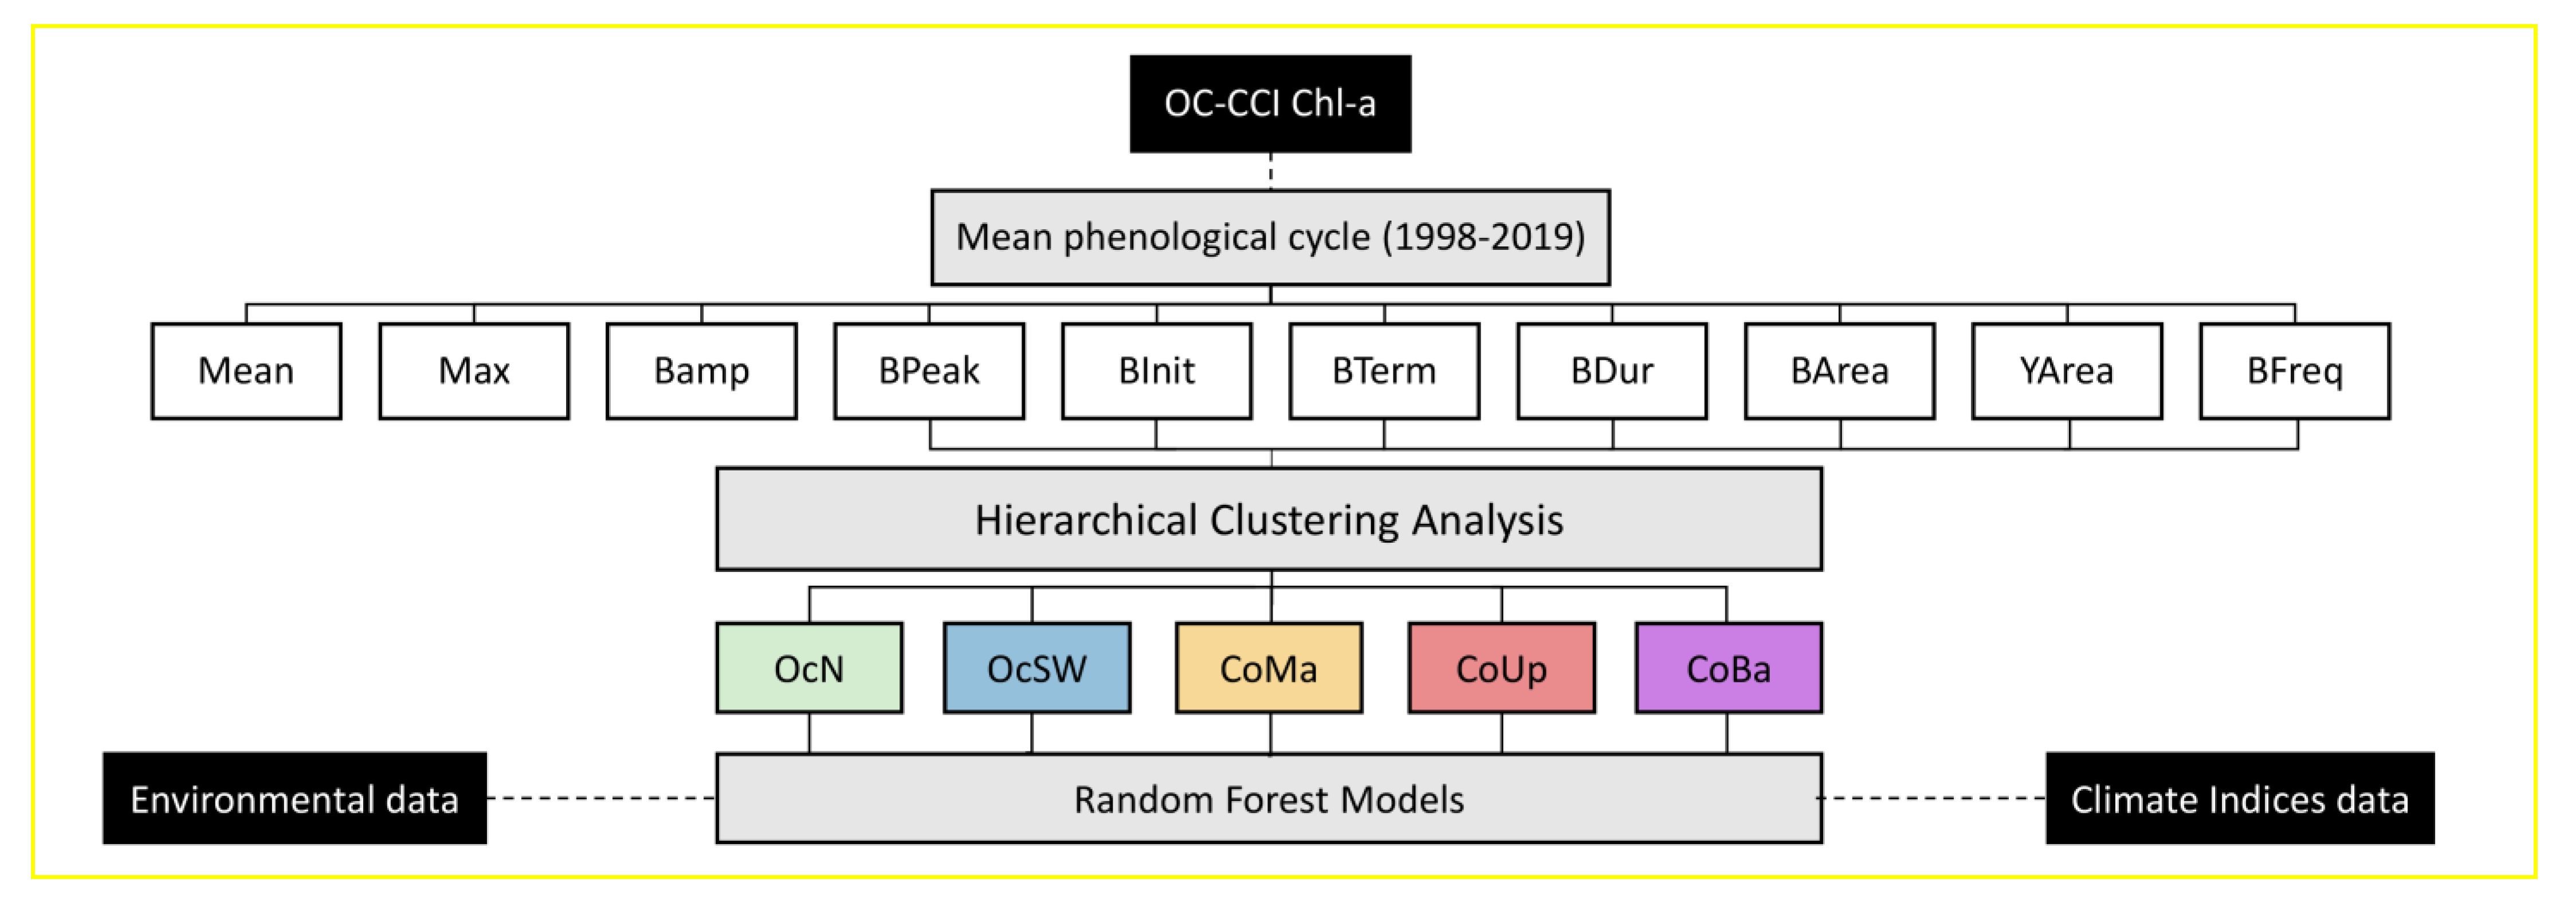
For each determined phenoregion. 10 RF models were performed, one for each phenology metric. The number of trees for the RF was set to 500, as in [55,56]. The model performance was assessed by calculating the coefficient of determination (R2) and the root-mean-square error (RMSE). Drop-column importance, a method that assesses the importance (i.e., explanatory power) of each predictor by comparing the performance gained or lost when dropping each predictor to the performance of a baseline model with all predictors [59], was used. A summary of the workflow of the methodology is presented in Figure 3.

3. Results

3.1. Phytoplankton biomass off Western Iberia

Chl-a concentration off Western Iberia (Figure 1) range from <0.5 mg m−3 (low productive oceanic regions) to >3 mg m−3 (productive coastal patches). The most productive areas are located in the northern and central sections of the WIC and the Gulf of Cádiz (SW Spain). Moreover, for offshore waters, there is a gradient from low to high biomass towards northern latitudes on oceanic water, a consequence of the stronger spring blooms observed in northern waters.
Seasonality in phytoplankton biomass in the WIC (see Supplementary Figure S1) is evident, particularly in offshore waters. Overall, spring is the most productive season of the year, as mean oceanic chl-a concentration increase to over 1 mg m−3. Onshore-wise, a clear chl-a maximum in spring can also be seen in the waters enclosed by the Gulf of Cádiz (>3 mg m−3). The decrease in oceanic chl-a from spring to summer is clear, while biomass increases near upwelling centers (e.g., NW Portugal and Spain). Autumn exhibits a similar pattern to summer, although results suggest oceanic phytoplankton biomass slightly increases in the northernmost latitudes. Winter chl-a biomass reveals a transition towards spring, as oceanic chl-a concentration increases, while chl-a near upwelling zones diminishes.

3.2. Bloom Phenology Metrics

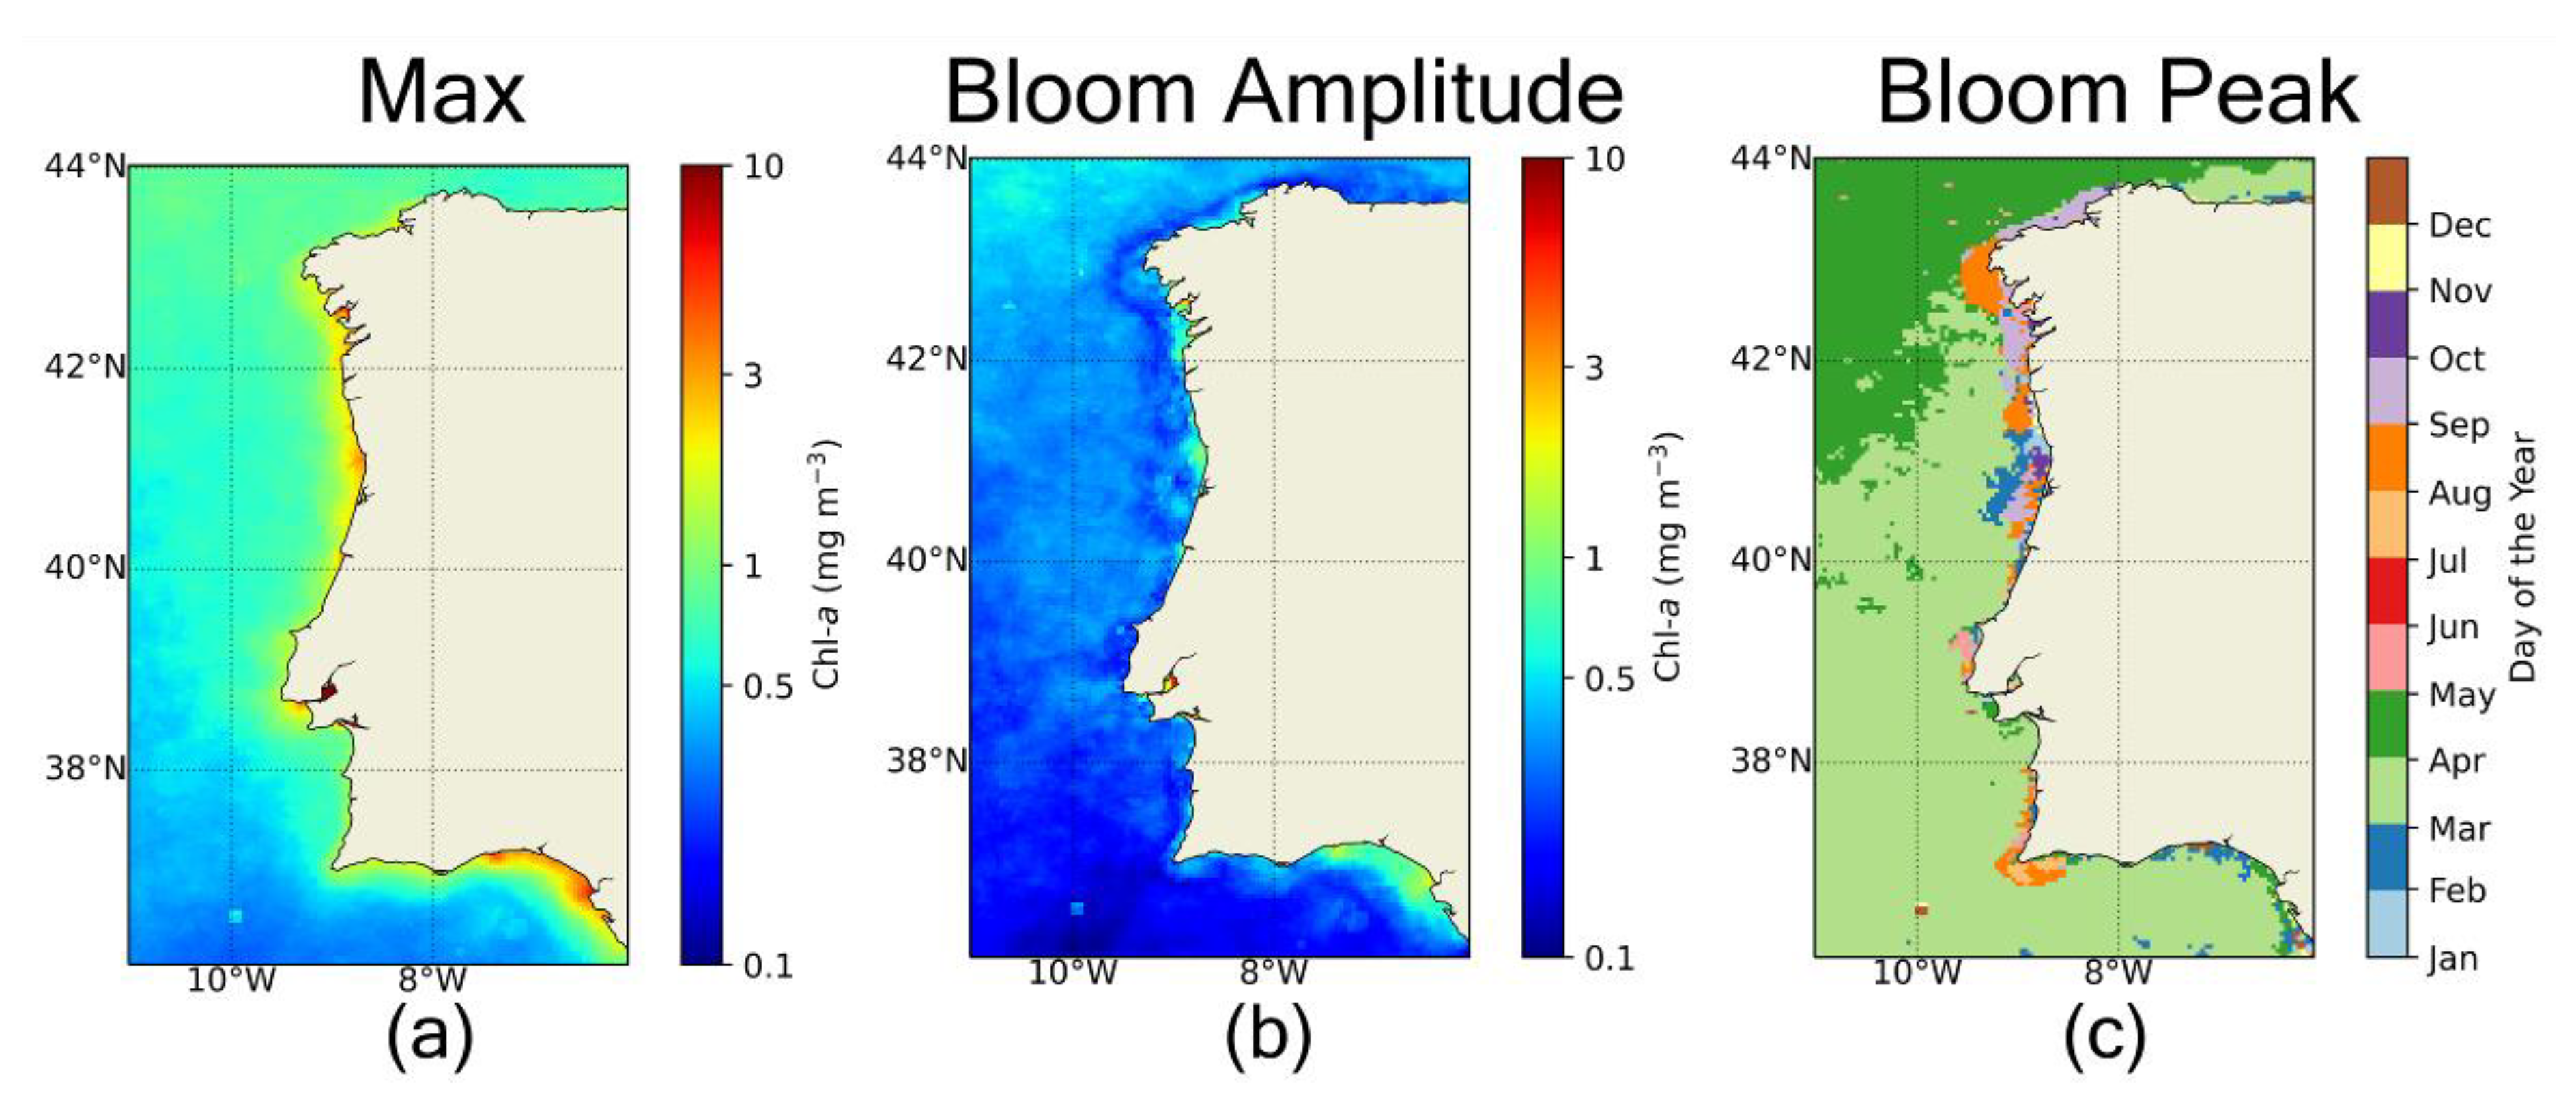
Estimated bloom phenology metrics along WIC highlight its complexity (Figure 4). Results show that yearly maximum chl-a concentration exceeds 1 mg m−3 in most oceanic waters and 2 mg m−3 in coastal waters (Figure 4a). As with mean chl-a concentration, Bloom amplitude (BAmp; Figure 4b) is also higher towards northern latitudes offshore. Coastal waters also tend to have higher BAmp, reaching amplitudes over 2 mg m−3 in several biomass-rich areas (e.g., NW coast, Gulf of Cádiz). While the bloom peak date (BPeak; Figure 4c) is rather homogeneous offshore (March–April), blooms in higher latitudes (>41°N) tend to peak later (April). Coastal-wise, there is more variability. Blooms in some regions (e.g., Gulf of Cádiz) appear to peak during the early spring, while blooms in upwelling centers peak later.
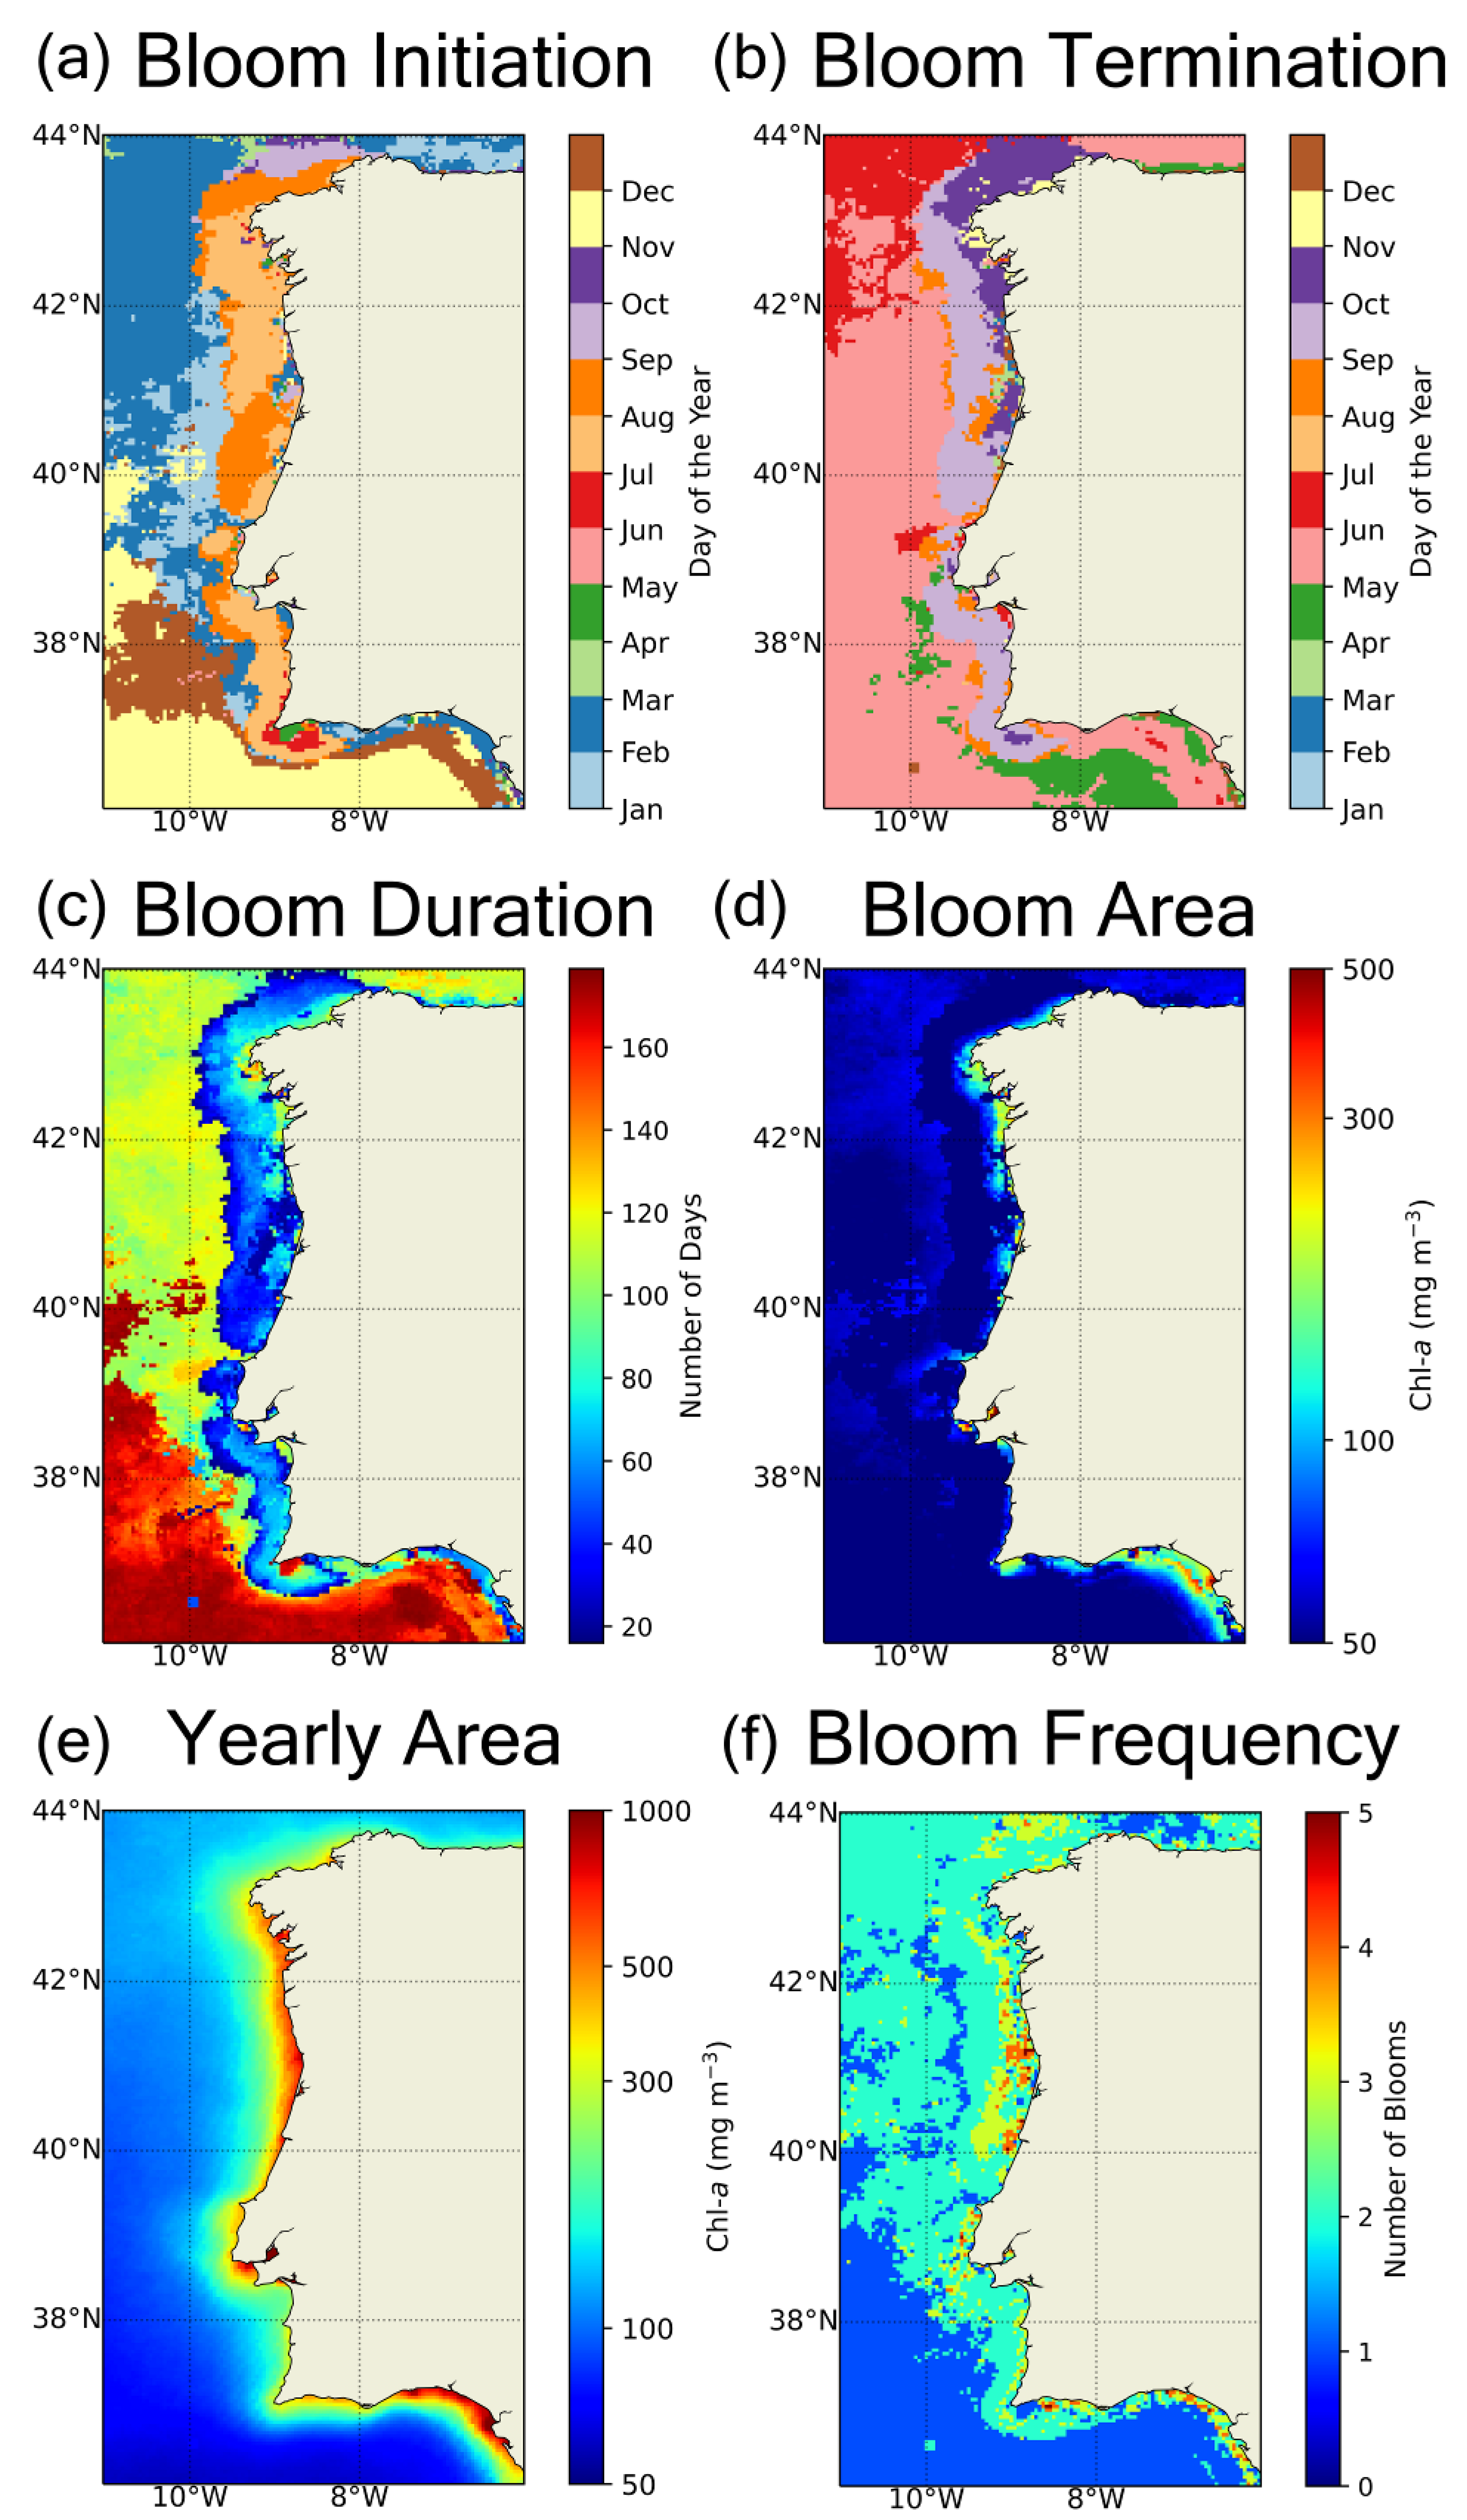
Bloom timing was also seen to vary across latitude and between oceanic and coastal waters (Figure 5). Offshore, bloom initiation (BInit; Figure 5a) ranged between November–February, with spring blooms off SW Iberia typically starting and ending (Figure 5b) earlier, i.e., compared to a typical North Atlantic spring bloom, and lasting longer (2 months; Figure 5c) than blooms north of 39°N. Onshore, clear differences were observed along the West and South coast, with Sagres acting as a transition zone. While blooms along the eastern sector of the South coast (8–6°W) initiate between December–February, blooms off the remaining coast appear to start later (June–August). Overall, coastal blooms typically lasted under 80 days, generally terminating between October–November. Bloom area (BArea; Figure 5d) was higher onshore, in some areas exceeding 300 mg m−3. The less productive blooms (<50 mg m−3) appear to be located in the SW oceanic waters and in a coastal patch along the continental shelf break off the Western coast.
Overall, the most productive areas are coastal, mostly overlapping with the areas characterized by higher YArea (>500 mg m−3) and BFreq (>3 blooms year−1; Figure 5e). Offshore, the annual cumulative production is, as expected, significantly lower (50–200 mg m−3). Bloom frequency (BFreq; Figure 5f) was also seen to be higher onshore (2–5 blooms year−1). Blooms were especially frequent in NW Iberia, with several pixels being characterized by 4–5 blooms year−1. Again, a distinction in bloom phenology between oceanic phytoplankton communities can be seen, as communities below 39°N, excluding those in the Gulf of Cádiz, are characterized by a single yearly bloom, while communities further north already display an additional bloom apart from the spring bloom.

3.3. Regional Patterns of Bloom Phenology

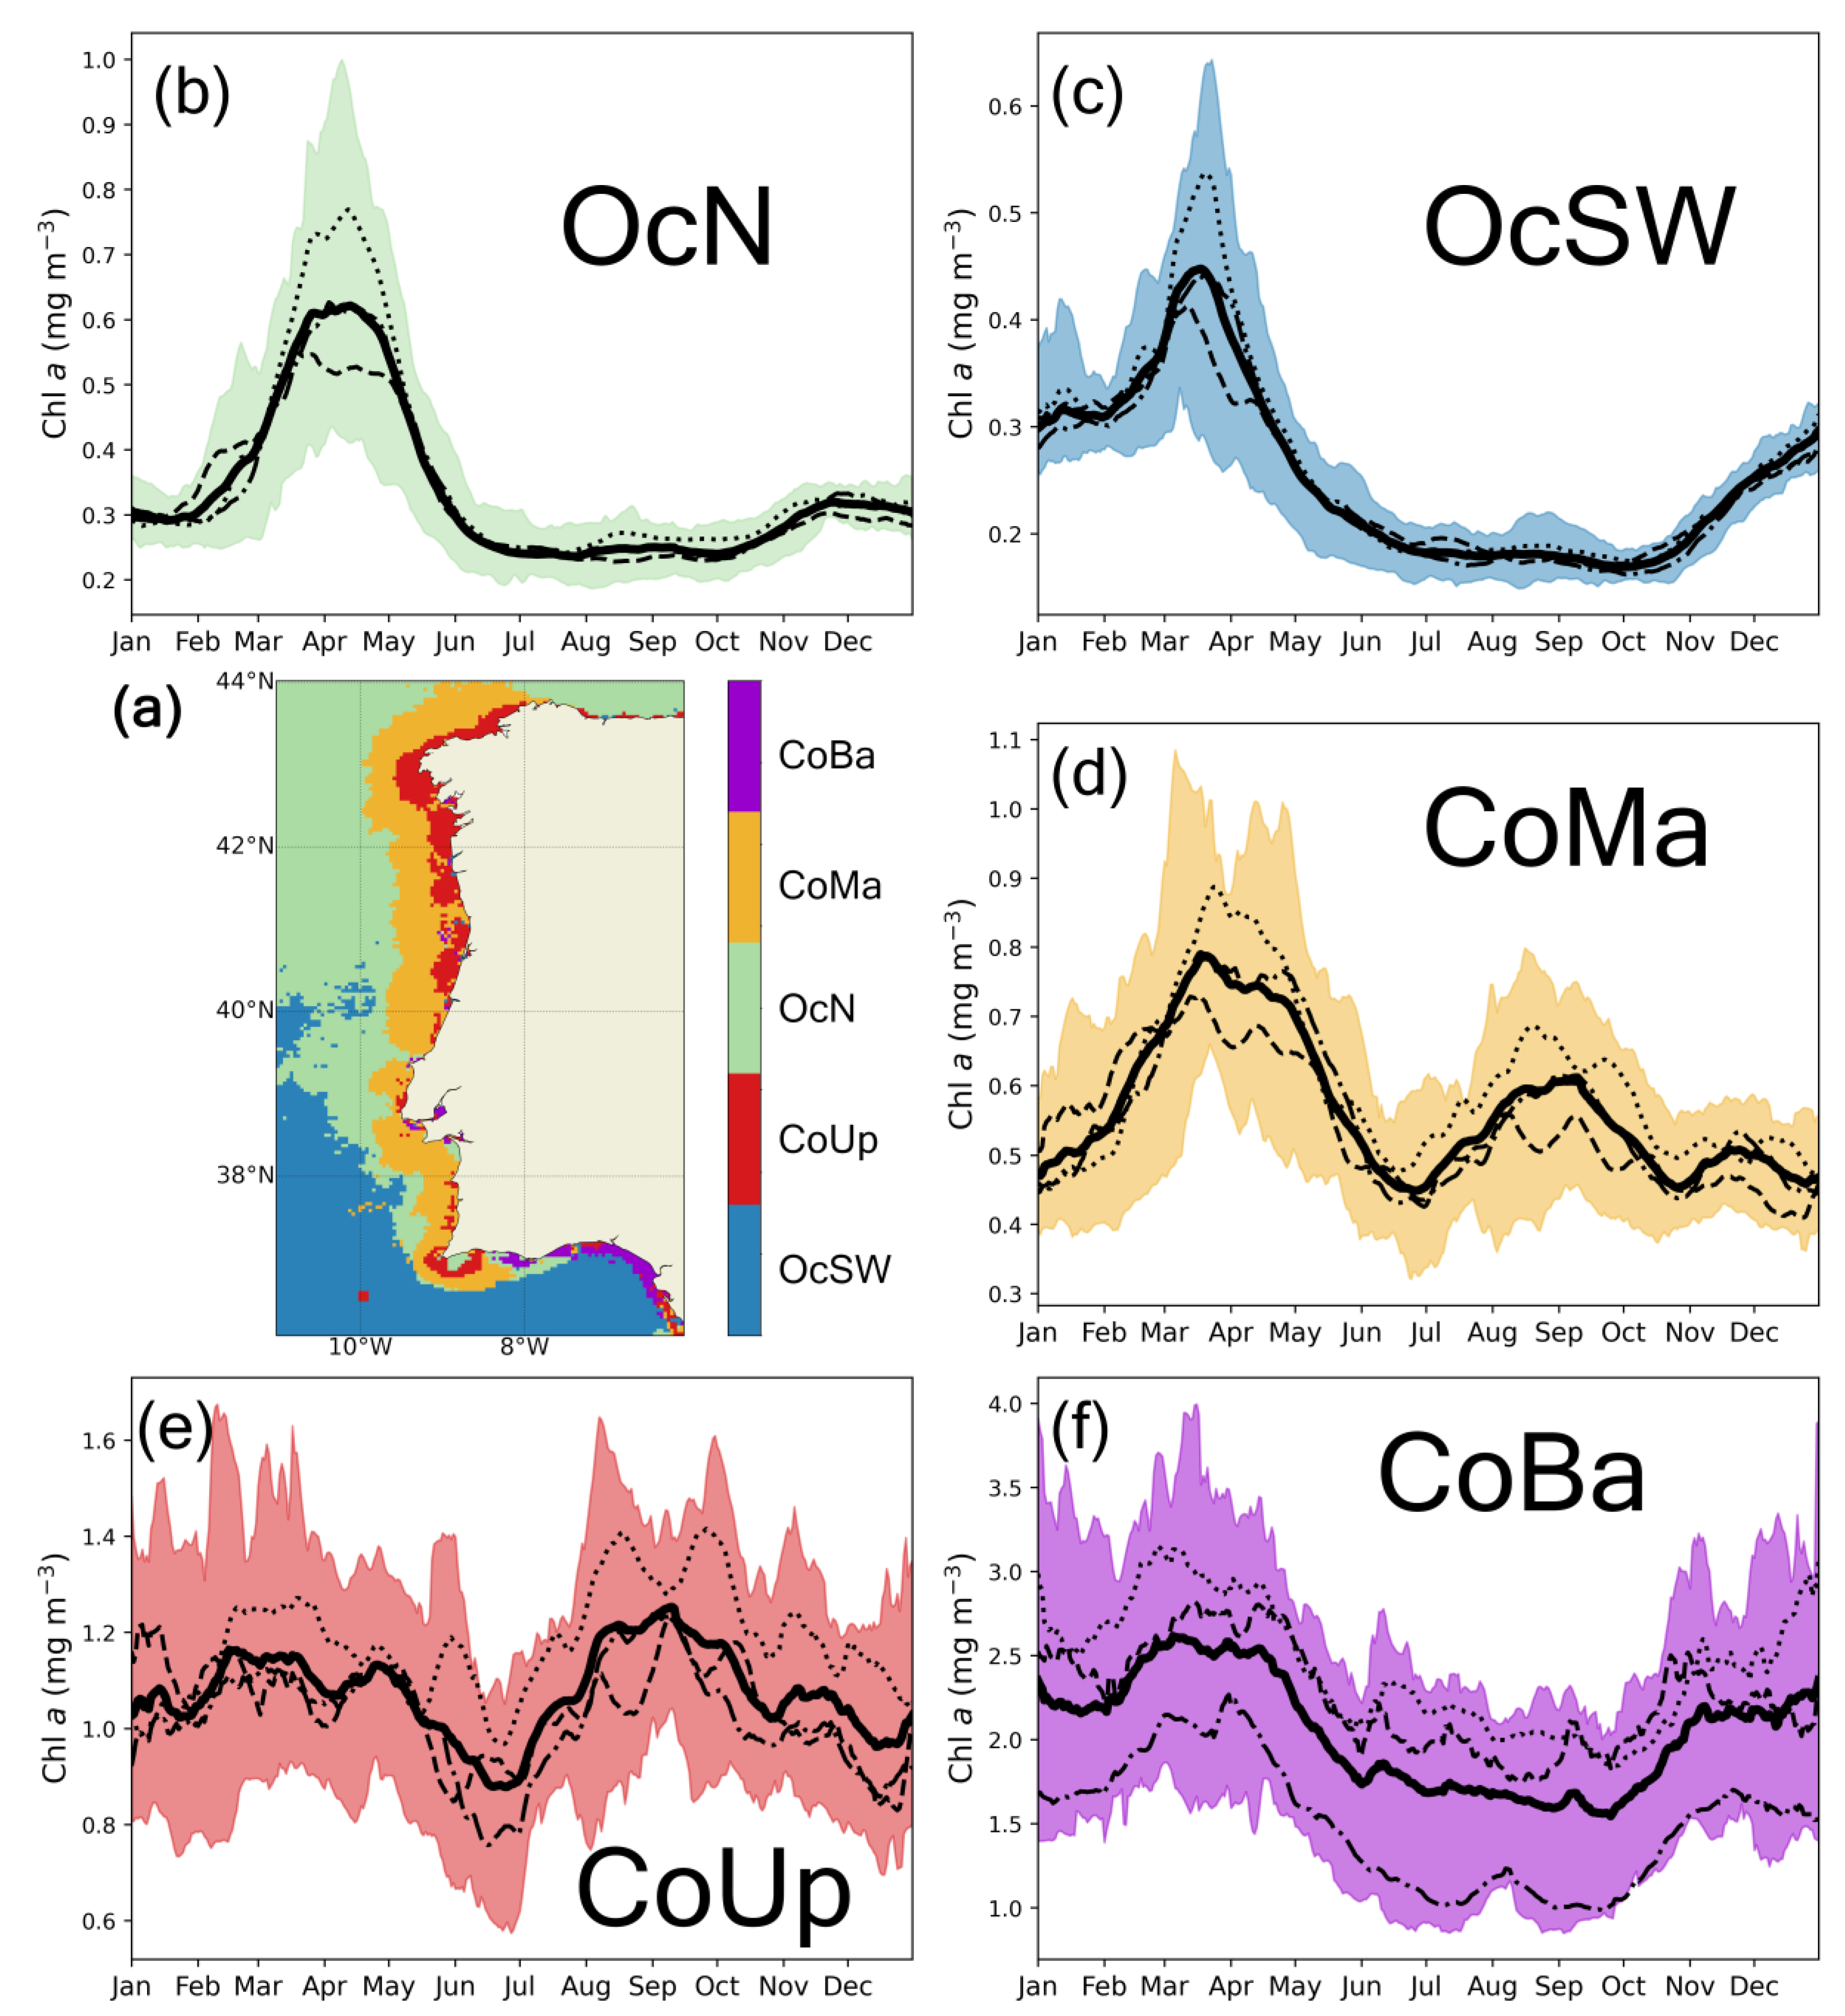
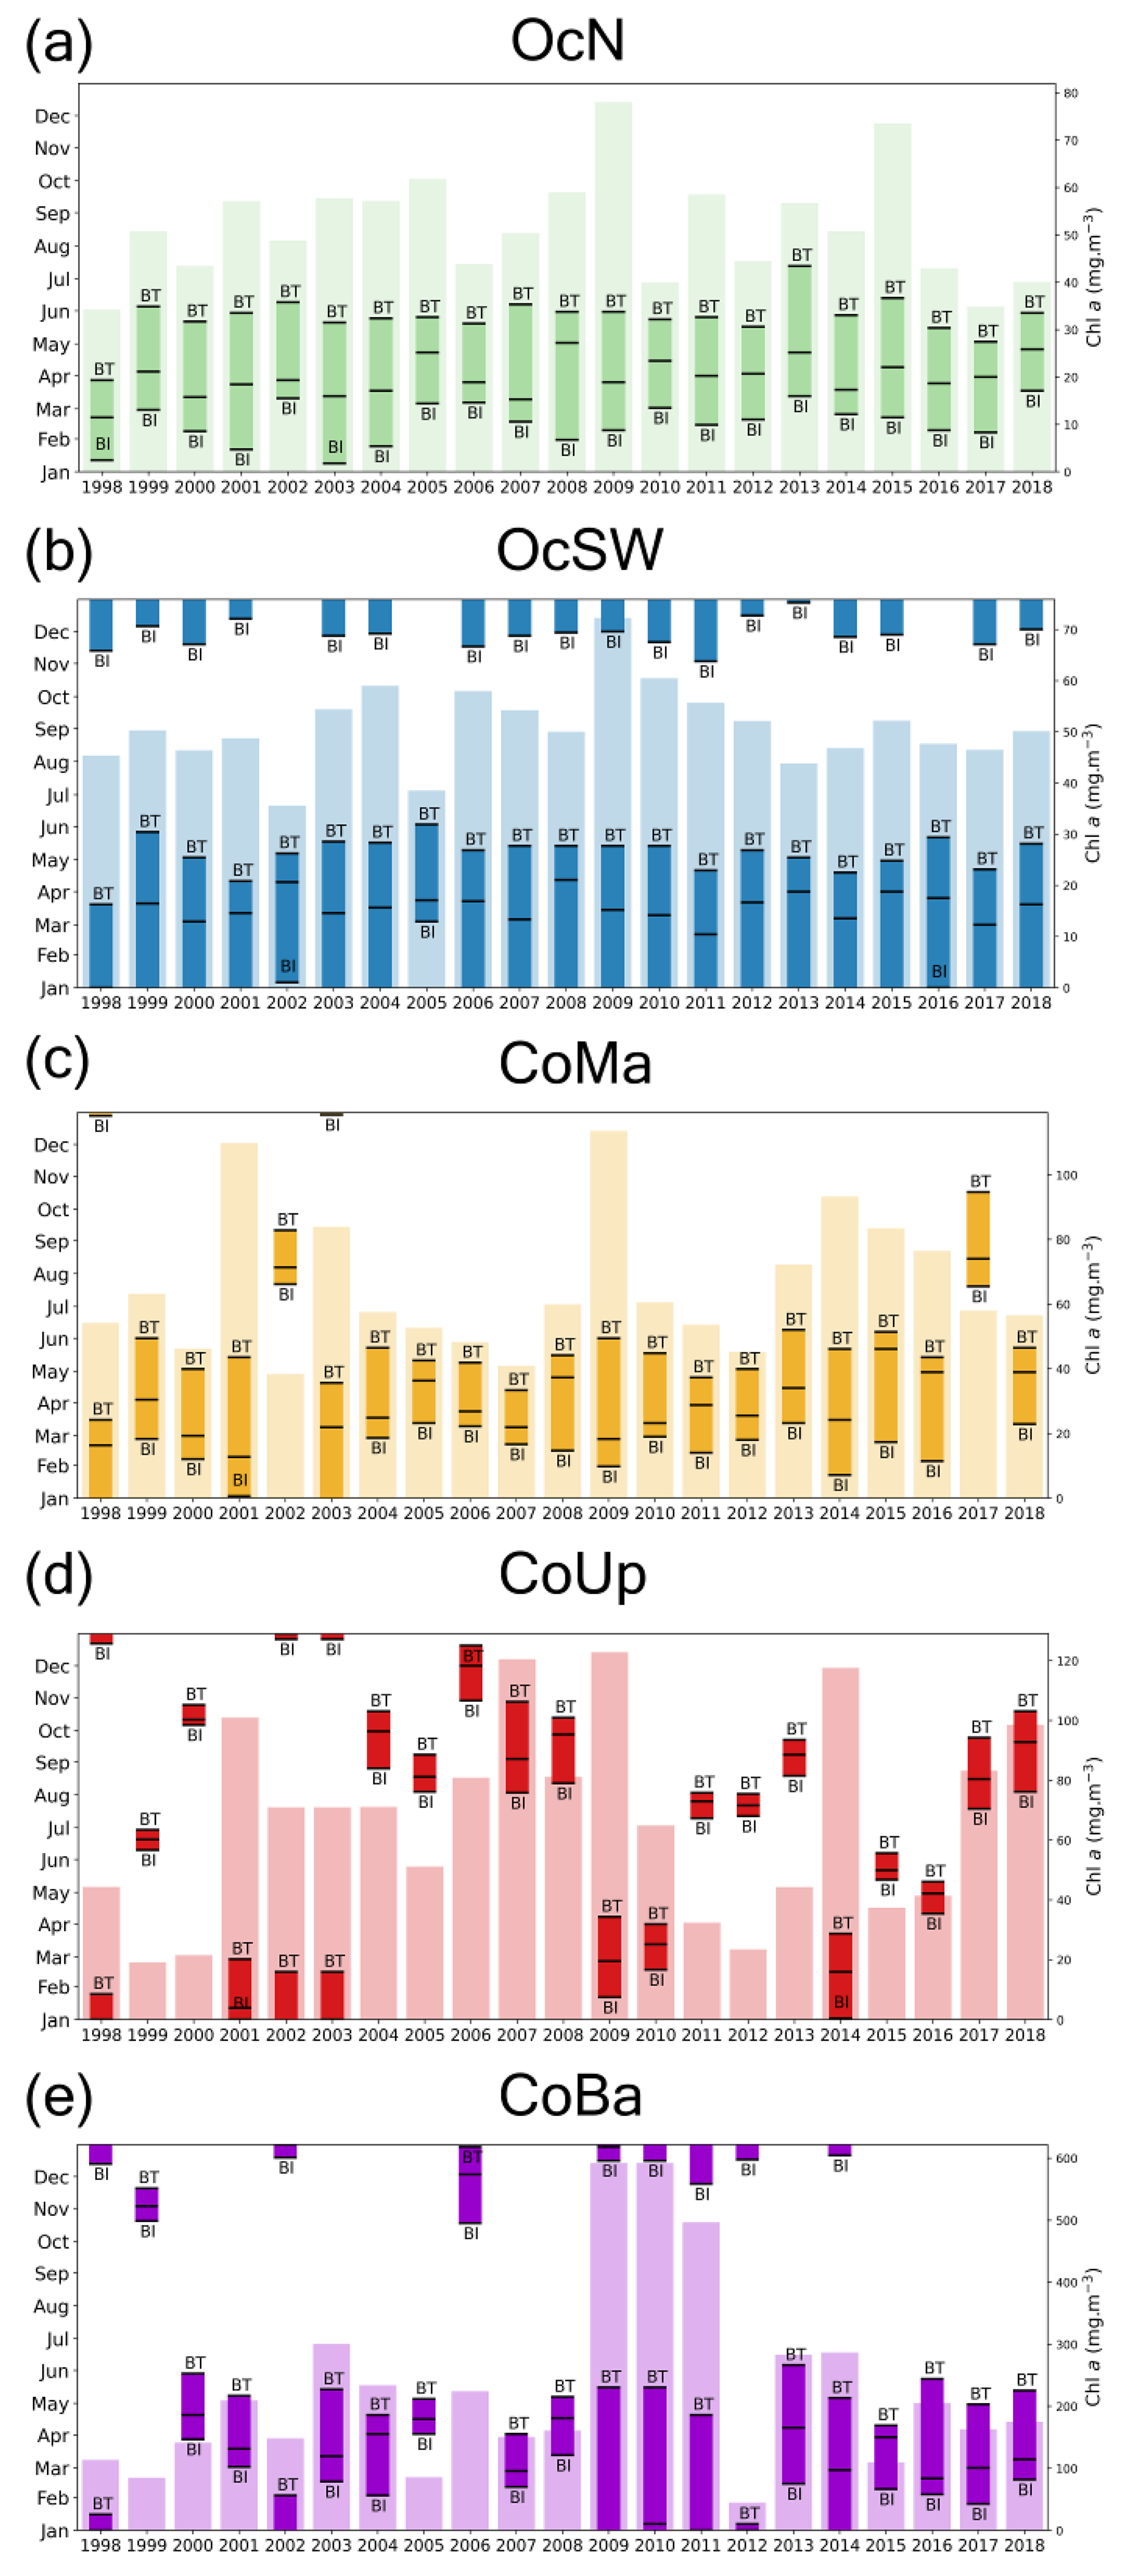
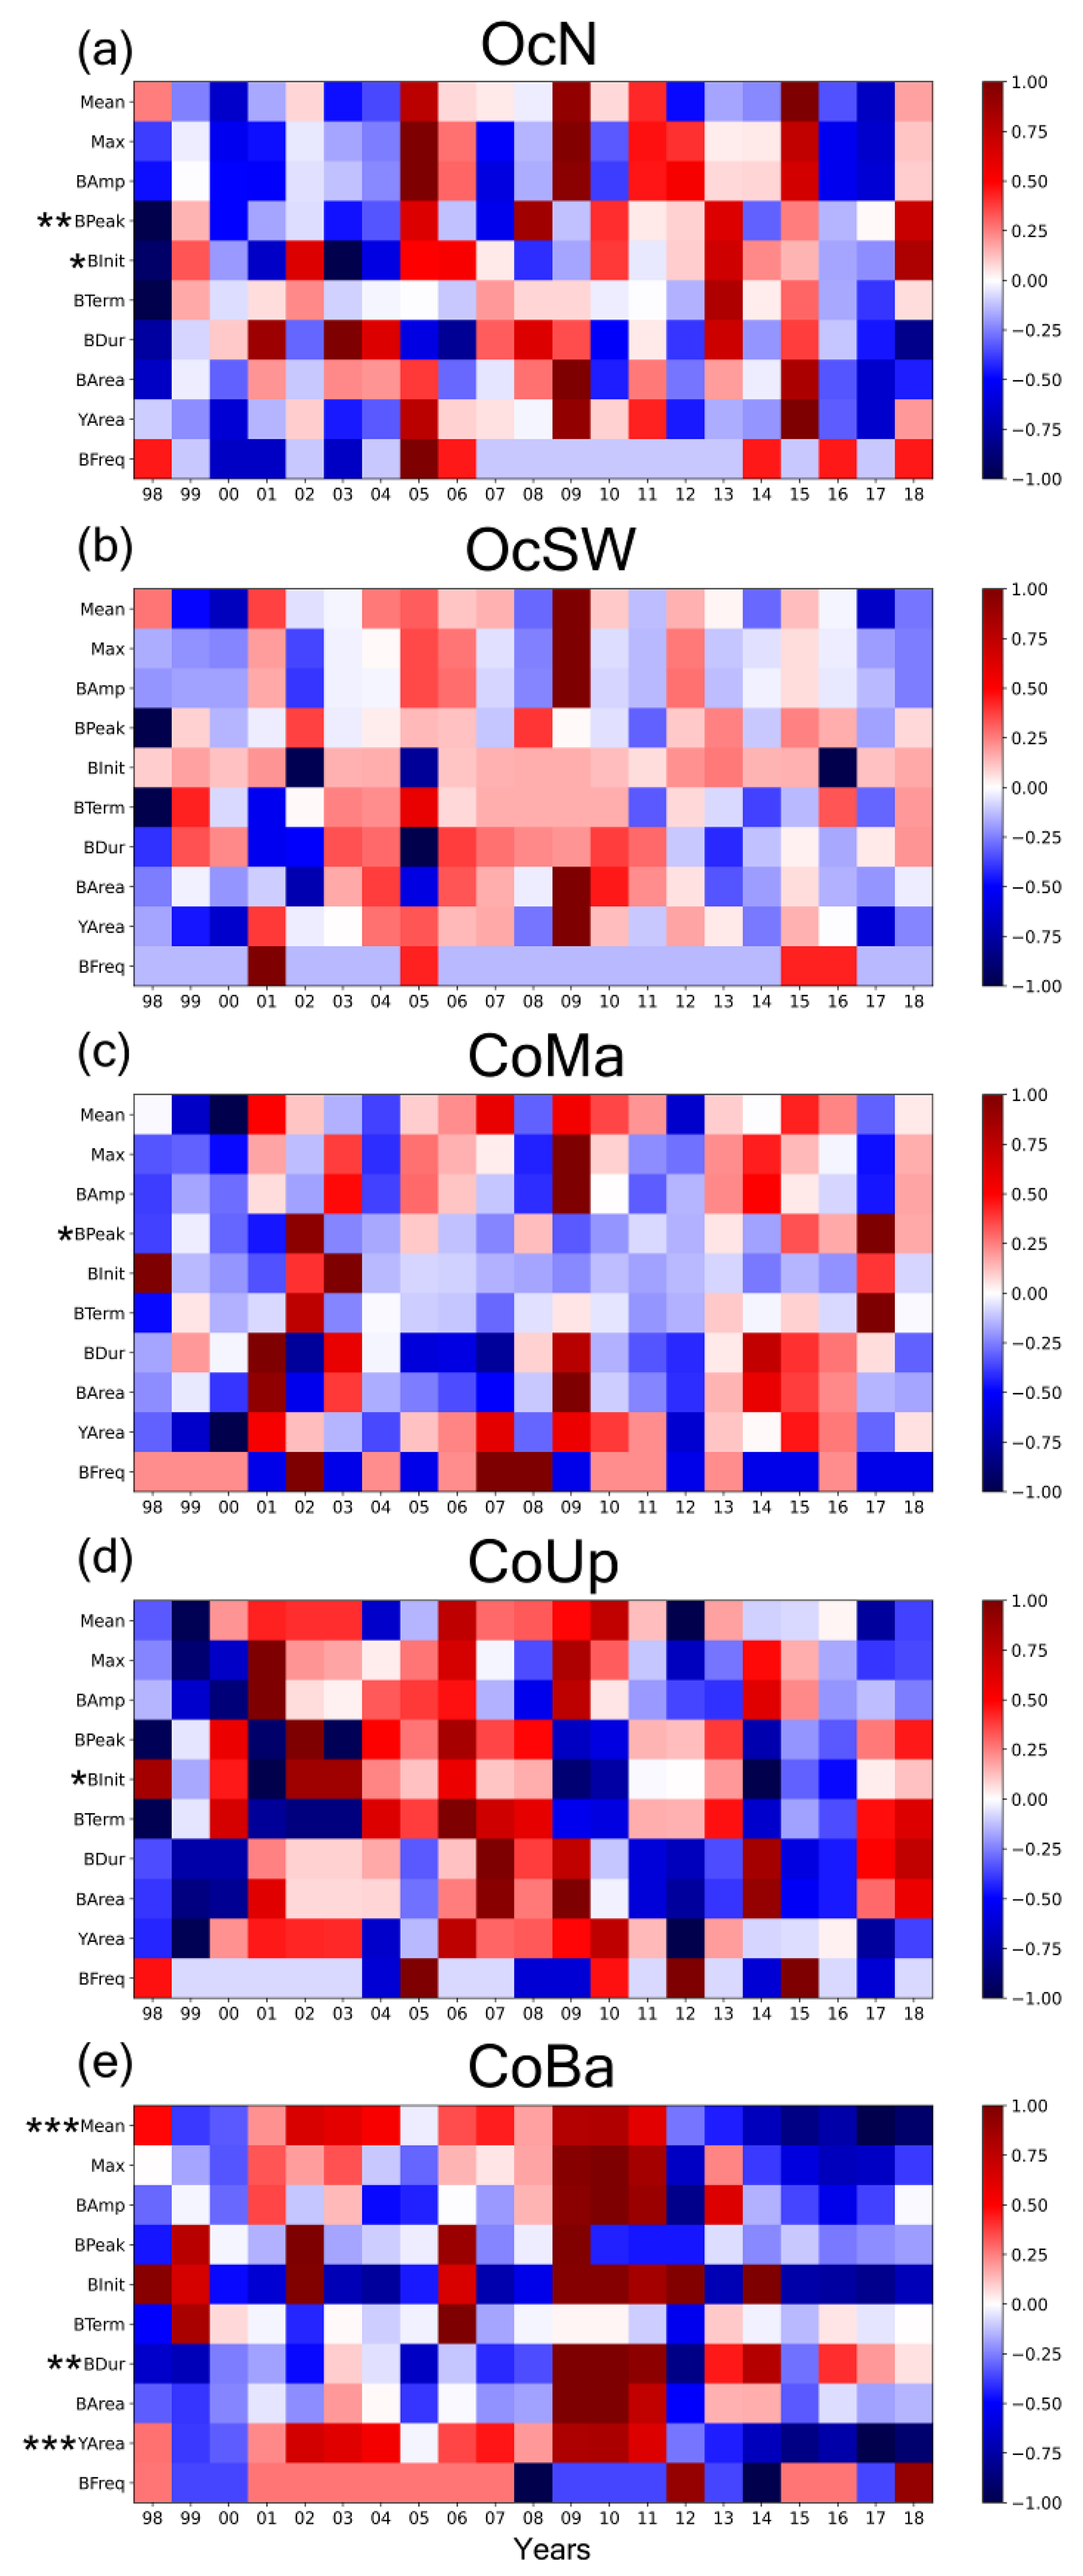
Five phenoregions were defined in the WIC, based on the dendrogram extracted from the hierarchical clustering analysis (Figure 6a, Supplemental Figure S2). Oceanic waters in the WIC were separated into two phenoregions: one limited to waters north of 39°N (OcN; Figure 6b) and another limited to waters in the southern part of WIC, from 11°W to 6°W (OcSW; Figure 6c). A transitional region, encompassing waters of both coastal and oceanic characteristics along the continental shelf margin of the Western coast (CoMa; Figure 6d), was also defined. Finally, two coastal phenoregions were also established. CoUp (Figure 6e) included pixels along of two main upwelling centers—Center and NW Iberia and Sagres, while CoBa (Figure 6f) appears to be limited to the Gulf of Cádiz and small areas within the vicinities of major river basins (e.g., Sado, Tagus, Ria de Aveiro, Douro, Ría de Vigo, and Ría de Pontevedra). For each phenoregion identified, statistical metrics and intercorrelation results are presented in Table 3. Yearly bloom information (Figure 7) and bloom phenology metrics anomalies (Figure 8) for each phenoregion are also exhibited.
Oceanic North (OcN) was the largest identified phenoregion. Being a largely oceanic region, OcN displays low productivity (mean chl-a of 0.34 mg m−3). Blooms occurring in this region are clearly defined as spring blooms, typically spanning February–May. On average, two blooms occur per year. Linear trend analysis results indicate that blooms are starting (p-value < 0.1) and peaking (p-value < 0.05) later over the past 22 years. Nevertheless, no significant decline was observed in bloom duration. Correlation-wise, later BInit was negatively correlated with bloom duration. In addition, blooms with a longer duration and with a later BTerm were associated with higher bloom area.
Oceanic Southwest (OcSW), the other purely oceanic phenoregion delineated, was the least productive one, with low mean chl-a (0.25 mg m−3). While OcSW also exhibits spring blooms, these initiate much earlier (early December) than blooms observed in OcN. Despite its much longer blooms, their total biomass is also low (50.88 mg m−3). Plus, there is usually only one bloom per year, with a mean duration of 5 months. Contrary to OcN, blooms in OcSW with later peaks were linked with earlier bloom termination dates. At the same time, the spring blooms starting in December were seen to match longer blooms and higher biomass.
Coastal Continental Margin (CoMa) shared characteristics with the oceanic and coastal phenoregions identified, exhibiting intermediary productivity. In terms of timing, blooms were seen to frequently initiate in February, peak in early–spring and end in May. Blooms were more frequent (~3 blooms year−1) and of higher biomass than in the oceanic phenoregions (65.16 mg m−3). Over the dataset period, rising trends were detected for the BPeak, indicating blooms have been peaking increasingly later in the year (p-value < 0.1). Years with high maximum chl-a were linked with fewer, high biomass blooms.
Coastal Upwelling (CoUp) is a productive and variable coastal region (mean chl-a concentration of 1.11 mg m−3). The main bloom of the year is typically short (47 days), starting in late August, peaking in early October and ending in late October. Blooms in CoUp were frequent and exhibited higher biomass (66.61 mg m−3). A trend can be seen towards earlier bloom initiation dates (−6.88 days year−1; p-value < 0.1). CoUp, along with CoMa, were the only regions where BArea was not correlated to mean or YArea, suggesting that the biomass associated with the main bloom is independent of the yearly productivity.
Coastal River Basins (CoBa) was the most productive phenoregion delineated. Blooms in this region started in January/February and usually ended in April/March. Blooms in CoBa were also the richest in biomass in the WIC (228.66 mg m−3). Nevertheless, similarly to CoUp, the biomass amassed by these blooms were only a small fraction of the YArea. Trend-wise, over the past 20 years, statistically significant declines were identified for mean chl-a (p-value < 0.01), YArea (p-value < 0.05) and BDur (p-value < 0.01). Nevertheless, it should be noted these results should be carefully regarded as they may be largely influenced by a recent sequence of negative anomalies in mean chl-a, YArea, and BDur (2012–2018) that followed three years with high biomass (2009–2011). Correlation analysis results show that earlier blooms (i.e., lower BInit) corresponded to higher bloom area, higher mean chl-a, and yearly cumulative area.

3.4. Drivers of Bloom Phenology

The explanatory power of the random forest models (RF) ranged between 43% and 87% (as seen by the calculated in-sample R2), depending on the region and the metrics considered (Table 4). Table 4 also contains information on each metric’s response to the main predictors (i.e., with above-average importance) identified by the RF. The partial response of each metric to an increase in its main predictors (bold) is represented as +, − or 0, based on the partial dependence plots (Supplemental Figure S3). For a given metric and predictor, if above-average values of the predictor lead to a constant increase or decrease of the metric, the response is represented as + or −, respectively. Else, if no constant response is observed, the response is considered neutral (0). For further clarification on the effect of each main predictor, consult Supplemental Figure S3.
DIN, Si, MLD, and AMO were identified as the main drivers of phytoplankton phenology in the OcN phenoregion. Higher DIN concentration was associated with increases in the mean chl-a and YArea, as well as with later spring blooms. Si was seen to negatively influence max chl-a and bloom biomass. Deeper mixed layers were associated with blooms with later peak dates. AMO was linked to bloom termination, duration, and frequency.
Regarding the OcSW region, DIN, MEI, and Si were the most common drivers singled out by the models. DIN was seen to be instrumental towards years with higher max chl-a and biomass (YArea). Higher values of MEI also led to higher mean chl-a and earlier blooms. Finally, higher Si concentration was associated with lower biomass blooms with earlier peaks and fewer blooms.
Random forests for the CoMa phenoregion were characterized by the sea surface height (SSH) and DIN as major predictors. Higher SSH was seen to be associated with blooms with later peaks and end dates, as well as higher biomass blooms and overall higher YArea. DIN was linked to higher chl-a and BAmp and blooms with earlier termination. Results suggest that bloom initiation, however, was shaped by the MLD.
CoUp had no clear predominant predictors, with salinity (Sal), MEI, SSH, and the meridional water transport (Uo) being among the most common. Higher salinity was linked to years characterized by fewer blooms and higher biomass overall. MEI was seen to contribute to higher max chl-a, BAmp, and earlier blooms (i.e., starting earlier). SSH was the main factor behind bloom peak and termination, with lower SSH contributing to earlier peak and termination dates. Higher Uo (i.e., westward transport) was associated with longer blooms, while lower Uo (eastward transport) led to higher-biomass blooms.
Phenology in CoBa was also very heterogeneous in terms of model results. Nevertheless, Sal, Si, and Uo were among the most frequent predictors. Surface waters with higher salinity were associated with higher mean and max chl-a, as well as with higher yearly biomass. Higher Si concentration was, on the other hand, linked to lower BAmp and earlier blooms. Moreover, the RF models for CoBa suggest eastward water transport was also instrumental, contributing to lower overall chl-a mean, yet higher biomass, longer blooms.

4. Discussion

4.1. Phytoplankton Bloom Phenology in the WIC

Phytoplankton in oceanic waters off Western Iberia are clearly defined by a spring bloom. However, there is a difference between the spring blooms north of 40°N and the spring blooms south of 38°N. While both situations are variants of the North Atlantic spring bloom, the first is more akin to the classical spring blooms [7,60], and its duration is in line with previous studies [8] for the same latitudes. Moreover, a fall bloom typically follows, benefiting from the increase in the MLD and the consequent enclosing of nutrients [61]. South of 38°N, however, phenology was characterized by much longer, yet lower biomass blooms and a single bloom per year.
WIC’s role as a transition region between North Atlantic temperate and subtropical waters has already been pointed out for phytoplankton biomass [30]. This study not only corroborates those findings but also confirms that this transition also shapes phytoplankton bloom phenology. Moreover, basin-wide studies have shown differences in bloom initiation across WIC (e.g., [8,15,19,62]). Furthermore, trend-analysis performed in this work suggest blooms north of 40° appear to be initiating and peaking almost a month later. On the contrary, [19] observed a trend towards earlier bloom initiation off NW Iberia. Nevertheless, this study sought to evaluate phenology at a basin-wide scale. Thus, a much lower spatial (100 × 100 km) and temporal resolution (8 days) were used by those authors, which may have contributed to the observed differences.
Bloom phenology in the WIC was seen to vary even more along the coast as three separate phenoregions were clearly defined. A clear transition region (CoMa) was identified along the continental shelf margin, exhibiting intermediate productivity (comparing to the coastal and oceanic phenoregions) and a typical spring bloom, like its adjacent oceanic waters. These results corroborate the findings of [63,64], which also observed a similar transition in the slope area. Moreover, [63] found that the slope area off NW Iberia was more similar to the oceanic area than to the shelf area in terms of the chl-a annual cycle.
Near the main upwelling centers (NW Iberia and Sagres; CoUp), phytoplankton was characterized by frequent, irregular high-biomass blooms. The strongest blooms occur during the late summer and early autumn, matching the seasonal upwelling observed off NW Iberia [32,65] and previous phenology studies [66,67]. The high-frequency of blooms and their short duration is a sign of the pulsed input of nutrients and turbulence that characterize wind-driven coastal upwelling-downwelling cycles, leading to high variability in bloom timing. It is also important to consider the observed shift towards earlier blooms. While it is difficult to know what is behind this shift, the increase in upwelling intensity off NW Iberia [65,68], which is contributing to an increase in overall phytoplankton biomass [30], may also be leading to the establishment of the summer bloom, allowing for earlier main blooms.
CoBa included pixels close to several large river basins, more specifically the Tagus, Sado, Ria de Aveiro, and, overall, the Gulf of Cádiz systems, which share a similar signature in terms of bloom phenology. This region’s short and frequent blooms, as well as its high variability in bloom timing, suggests bloom phenology is regulated by pulses of favorable environmental conditions. This is expected, as river discharges (and its nutrient input) are a major factor in regulating phytoplankton biomass in the Gulf of Cádiz [29,69] and off river mouths. Despite its variability, most blooms were seen to initiate in mid-winter, which is typically when river discharges are at their highest volume [70] and terminate in spring. This, along with the high chl-a, could be a sign that this phenoregion may be characterized as case 2 waters. In case 2 waters, CDOM, sediment interference, and particle resuspension absorb sunlight in the blue/green bands, inducing errors in the chl-a signal [71]. Plus, the presence of suspended particulate matter (SPM) may also difficult the atmospheric correction procedure of remote sensing imagery [72]. Thus, care should be taken regarding a possible chl-a overestimation caused by CDOM and SPM. While this may affect all coastal pixels, pixels belonging to CoBa are the most likely to be overestimated due to their proximity to river basins. This phenoregion was also the one that changed more over the past 20 years, as it became less productive and with higher bloom duration. This could be a consequence of the already observed significant reduction in river discharges [73]. If river discharges continue to decrease as projected (estimate decline of 61–92% by 2050 [73]), nutrient availability should decrease, leading to overall lower biomass. It is, however, unclear what are the consequences of this shift for other phenology metrics, as bloom area and frequency remained unchanged despite being correlated with bloom duration.

4.2. Drivers of Bloom Phenology

Understanding what drives phytoplankton phenology is particularly important in complex coastal regions, where water column conditions are not as stable as in the open ocean, and a suite of agents work together to shape phytoplankton. Offshore, bloom phenology north of 38°N (OcN) was mainly seen to be driven by changes in the DIN, Si, MLD, and AMO. As mentioned above, OcN displayed a typical temperate North Atlantic spring bloom. Thus, it makes sense that nutrients, basin-wide agents (AMO), and MLD, a known major factor in bloom regulation in the NE Atlantic [74], have significant roles in phenology. While the onset of the spring bloom is still not completely understood [10], DIN concentration was here identified as the main factor behind the bloom initiation. While this result does not mean that DIN is a factor in bloom initiation, it is likely that years with higher DIN concentration allow for faster growth and, therefore, earlier bloom initiation dates as calculated here using the 15% of the mean threshold. Moreover, the fact that higher Si concentration is associated with lower max chl-a, bloom amplitude, and bloom area might be due to high Si consumption on more productive years by diatoms, the main phytoplankton group behind the spring bloom. Higher (warmer) values of AMO correspond to higher surface temperature, surface pressure, and precipitation in Western Europe [75]. Due to the large temporal scale of AMO, it becomes difficult to conclude how higher AMO could lead to earlier termination, shorter blooms, and higher bloom frequency. Nevertheless, it is possible that the more unstable weather and higher precipitation in this region could become disadvantageous for phytoplankton growth, therefore interrupting a bloom and contributing to its earlier termination and, eventually, the onset of a new bloom (thus, the higher bloom frequency).
The similarity between OcSW and OcN is reflected by the two shared main predictors identified by the RF models: DIN and Si. Nevertheless, the way these predictors interact with the bloom phenology metrics is different. DIN here is related to the chl-a max, BAmp, and yearly biomass, while Si is linked to bloom peak date, bloom biomass, and yearly biomass. In OcSW, PAR is higher; seawater is typically warmer, scarce in macronutrients, and with a shallower mixed layer [30]. While MLD and AMO are important for bloom phenology in the northern waters, the same is not true in OcSW. With typically lower MLDs, deep nutrient cycling is not as effective, resulting in lower nutrient availability at the surface [8] and contributing to lower biomass. This corroborates the results here presented, which suggest DIN is the main factor regulation max chl-a and BAmp. Another major driver of bloom phenology in OcSW was MEI. OcSW, in agreement with [15], was also the only phenoregion that had MEI as one of its major predictors. Positive MEI in the temperate North Atlantic has been linked, among others, to intensified winds and lower phytoplankton growth [14]. Here, on the contrary, it was associated with a higher mean chl-a. It is possible that higher MEI could be promoting more intense winds and, consequently, higher mixing. Since waters in the OcSW are more stratified and poorer in macronutrients, this mixing could increase surface nutrient availability, increasing phytoplankton biomass. These results corroborate how important vertical mixing and nutrient availability is for the highly oligotrophic waters off the SW Iberia [14,29,64].
Bloom phenology in CoMa was seen to be regulated by DIN and SSH. DIN again appears as the main nutrient available for phytoplankton communities, mirroring the two oceanic phenoregions. SSH allows to map warmer/colder areas and mesoscale processes (e.g., upwelling, eddies), making it likely that SST also has a role in this region’s bloom phenology, although this variable was not signaled by the RF models. Previous studies [76,77,78] have shown that this area is characterized by eddies and currents. These phenomena contribute to deeper mixed layers, fueling nutrient cycling and entrainment, essentially sustaining phytoplankton [21]. Corroborating these studies, the RFs showed that higher average SSH was linked to higher bloom and overall productivity, as well as longer blooms. This is also in line with previous studies that found a strong coupling between phytoplankton biomass and distribution and small-scale oceanographic features in NW Iberia [35].
CoUp and CoBa were two highly heterogenous phenoregions in terms of main predictors, which shared several predictors. For CoUp, as a phenoregion characterized by coastal upwelling, it is logical that phytoplankton bloom phenology should be modulated by factors associated with upwelling. The fact that westward water transport (typical of upwelling off the NW Iberia) was linked to a higher bloom area corroborates this hypothesis. Plus, the association of MEI and higher max chl-a and BAmp might be a consequence of the intensified winds as a result of positive MEI in the temperate North Atlantic, which would lead to more intense upwelling in this region. Higher salinity, being linked to higher phytoplankton biomass and higher bloom frequency, could be a proxy of the upwelling of more dense (higher salinity) waters, providing nutrients essential for phytoplankton growth. Coastal upwelling intensity in the WIC is expected to increase in the future, as in other eastern boundary upwelling systems (e.g., [79,80]), even though recent studies have contradicted this trend in the WIC [81]. While higher upwelling intensity should promote higher nutrient availability, the expected increased wind intensity will also cause deeper water column mixing and light limitation, leading to lower phytoplankton biomass in some regions [79]. Apart from biomass, bloom phenology may also be impacted by the predicted changes in upwelling [20]. For instance, in the northern California Current, the spring bloom timing is expected to change, possibly causing mismatches throughout the food web [82]. With upwelling-related drivers being so important for bloom phenology in the WIC, it is essential to continue monitoring this region.
On CoBa, like CoUp, higher salinity was linked to higher biomass. Since this region’s productivity is highly dependent on river discharges and its nutrient input, it would be expected that lower, not higher; salinity would be the factor behind years with higher biomass. Bloom initiation was seen to occur early with lower NAO, Si, and the euphotic zone depth (Zeu). While higher Si and deeper Zeu provide typical favorable conditions for bloom growth, higher (positive) NAO index values are linked with lower river flow in the Iberian Peninsula [83], which leads to lower riverine nutrient input. Thus, CoBa appears to be a phenoregion for which the RF results exhibit several contradictions, which is expected since it was the phenoregion with the worst performance, likely due to the inherent variability of the region.
Overall, drivers of productivity in each of the phenoregions were successfully identified, exhibiting the importance of these studies and potential for the use of RF models for studying phytoplankton ecology. Nevertheless, interannual variations in bloom initiation were more difficult to assess (lower model performances for BPeak, Binit, and BTerm). Likely that the length of the dataset used (21 years) may not be enough to offset the high variability in bloom timing in coastal areas. Henson et al. [6] suggested that 30–60 years of data may be required to disentangle natural and anthropogenic signals in phytoplankton. Plus, while CoUp and CoBa exhibit coherent phenological patterns, they include small areas that likely have small environmental differences (e.g., different upwelling sites, different rivers, etc.). Thus, the predictors for these coastal phenoregions should be interpreted carefully. To improve on these results, newer studies should focus on smaller specific areas and use higher spatial resolution (1 km or 300 m).

4.3. Remote Sensing as a Tool for Assessing Bloom Phenology in Coastal Regions

While ocean color remote sensing has been extensively used to study phytoplankton bloom phenology, there are a few caveats that should be considered. First, the collection of continuous, high-quality ocean color remote sensing data only started in 1998. Thus, only recently have +20 year datasets been available, which may be insufficient to fully characterize bloom phenology in a given region. Second, it is essential that spatial and temporal resolution match the region of interest and the question at hand. For instance, global phenology studies allow for coarser spatial and temporal resolution than complex coastal regions, such as WIC. Otherwise, studies may overlook relevant phenology patterns, such as smaller yet intense blooms or shifts in bloom timing.
This study used 21 years’ worth of data (1998–2018) with a moderate (4 × 4 km) spatial resolution and a high (1 day) temporal resolution. To avoid temporal gaps in the dataset, a combination of two gap-filling methodologies from previous studies [25,42] was successfully applied. To the authors’ best knowledge, this is the first phytoplankton phenology studies using daily data. Results were promising as this not only helped discern bloom timing with higher detail but also identify significant trends in bloom timing, which otherwise might not have been possible. Plus, the additional resolution allowed the detection of subtle differences in bloom timing and duration between phenoregions, highlighting the importance of using a daily resolution to assess phenology in coastal regions. This difference in information gained between daily and weekly resolution may be essential for accurate environmental management of coastal areas. Water-quality management, fisheries, or aquaculture may especially benefit from this. Nevertheless, it is important to be careful when OCRS in optically complex waters since the increase in uncertainty and variability may lead to contradictory results, as happened in this study for the most sensible phenology metrics in coastal phenoregions.
Due to the projected continuity of operational ocean color missions [84], ocean color datasets will not only increase their temporal span but also allow for phytoplankton phenology studies with higher temporal and spatial resolution. Furthermore, the launch of hyperspectral sensors, such as the Ocean Color Instrument (OCI) aboard NASA-PACE, will enable improved assessment of phytoplankton groups, paving the way for high-resolution group-specific phenology studies at a global scale. In the end, ocean color datasets are expected to enable the disentangling of interannual and multidecadal variability in phenology patterns, allowing scientists to discern the impacts of climate change on its variability [84].

5. Final Considerations

Oceanic phytoplankton communities form typically long, low-biomass spring blooms, mainly influenced by atmospheric phenomena and water column conditions. Nevertheless, a clear difference exists between northern and southern waters in the WIC, as blooms in northern waters are more akin to the classical spring bloom and appear to have been starting and peaking later over the past 20 years. Coastal phytoplankton, however, are characterized by short, high-biomass, highly heterogeneous blooms, as nutrients, sea surface height and horizontal transport had major roles in shaping phenology. Wind-driven upwelling and riverine input were seen to be major factors affecting bloom phenology in the coastal areas.
Changes in phytoplankton bloom phenology should be considered in coastal management and monitored due to their possible consequences to the functioning of the ecosystem. This work is expected to contribute to the understanding of phenology in the WIC. WIC is located amid the northern zone of the Canary Upwelling System (one of the four eastern boundary upwelling systems in the world [85]). These systems are responsible for over 20% of the world’s fisheries production, and phytoplankton bloom phenology is intertwined with fish recruitment. Mismatches between the seasonal timings of fish reproduction and the peak biomass of plankton typically lead to poor fish recruitment [4], and extreme mismatches (>30 days) in the WIC will likely become more frequent in the future due to climate change [5]. Therefore, future studies should focus on the possible implications of changes in bloom phenology on these resources as a trophic mismatch or bottom-up phenomena may negatively impact stock biomass and recruitment. Moreover, this study can be helpful for future bloom phenology studies across the other eastern boundary upwelling systems, such as the California, Benguela and Peru upwelling systems, as they all share several oceanographical features.
The five phenoregions here described and their associated phenology metrics and drivers should be useful for the assessment of phytoplankton in the EU Marine Strategy Framework Directive (Directive 2008/56/EC) subregion “Bay of Biscay and the Iberian Coast” and for the implementation of the EU Water Framework Directive (Directive 2000/60/EC) [86]. It also complements other works in the WIC using ocean color remote sensing to aid the management of regional fisheries and aquaculture activities (e.g., [87,88,89,90]).

Supplementary Materials

The following are available online at https://www.mdpi.com/2072-4292/13/4/675/s1, Figure S1: Seasonal chlorophyll-a in the WIC, Figure S2: Phenoregions hierarchical clustering dendrogram, Figure S3: random forest partial dependency plots.

Author Contributions

Conceptualization, A.F., A.C.B. and V.B.; methodology, A.F. and A.C.B.; software, A.F.; formal analysis, A.F. and A.C.B.; writing—original draft preparation, A.F.; writing—review and editing, V.B., C.P., C.B., A.C.B.; visualization, V.B., A.C.B., A.F.; supervision, V.B. and A.C.B.; project administration, V.B., C.P., A.C.B.; funding acquisition, V.B., C.P., A.C.B. All authors have read and agreed to the published version of the manuscript.

Funding

A. Ferreira received a grant from the Mar2020—Programa Operacional Mar2020, under the AQUIMAR project (MAR-02-01-01-FEAMP-0107) and a PhD grant (SFRH/BD/144586/2019) from Fundação para a Ciência e a Tecnologia (FCT). A.C. Brito was funded by FCT through the Scientific Employment Stimulus Programme (CEECIND/00095/2017). This work benefited from the Infrastructure CoastNet (http://geoportal.coastnet.pt (accessed on 13 May 2020)), funded by Foundation for Science and Technology (FCT) and the European Regional Development Fund (FEDER), through LISBOA2020 and ALENTEJO2020 regional operational programmes, in the framework of the National Roadmap of Research Infrastructures of strategic relevance (PINFRA/22128/2016). This study also received further support from FCT through MARE’s strategic programme (UID/MAR/04292/2019). In addition, this work was also funded by the European Union’s Horizon 2020 Research and Innovation Programme under grant agreement N 810139: Project Portugal Twinning for Innovation and Excellence in Marine Science and Earth Observation—PORTWIMS.

Institutional Review Board Statement

Not applicable.

Acknowledgments

The authors are grateful to Carolina Sá for all the support and thoughtful remarks during the discussion of the manuscript. Authors are also indebted to the ESA Ocean Color—Climate Change Initiative project (https://esa-oceancolor-cci.org/ (accessed on 13 May 2020)) and Copernicus Marine Environment Monitoring Service (https://marine.copernicus.eu/ (accessed on 13 May 2020)) for providing access to the datasets used in this work. Finally, the authors are thankful to the three anonymous reviewers who contributed to the manuscript with valuable comments.

Conflicts of Interest

The authors declare no conflict of interest.

References

  1. Lutz, M.J.; Caldeira, K.; Dunbar, R.B.; Behrenfeld, M.J. Seasonal rhythms of net primary production and particulate organic carbon flux to depth describe the efficiency of biological pump in the global ocean. J. Geophys. Res. Oceans. 2007, 112. [Google Scholar] [CrossRef]
  2. Palevsky, H.I.; Quay, P.D. Influence of biological carbon export on ocean carbon uptake over the annual cycle across the North Pacific Ocean. Glob. Biogeochem. Cycles 2017, 31, 81–95. [Google Scholar] [CrossRef] [Green Version]
  3. Koeller, P.; Fuentes-Yaco, C.; Platt, T.; Sathyendranath, S.; Richards, A.; Ouellet, P.; Orr, D.; Skúladóttir, U.; Wieland, K.; Savard, L.; et al. Basin-scale coherence in phenology of shrimps and phytoplankton in the North Atlantic Ocean. Science 2009, 8, 791–793. [Google Scholar] [CrossRef]
  4. Platt, T.; Fuentes-Yaco, C.; Frank, K.T. Spring algal bloom and larval fish survival. Nature 2003, 423, 398–399. [Google Scholar] [CrossRef] [PubMed]
  5. Asch, R.G.; Stock, C.A.; Sarmiento, J.L. Climate change impacts on mismatches between phytoplankton blooms and fish spawning phenology. Glob. Chang. Biol. 2019, 25, 2544–2559. [Google Scholar] [CrossRef] [PubMed]
  6. Henson, S.A.; Cole, H.S.; Hopkins, J.; Martin, A.P.; Yool, A. Detection of climate change-driven trends in phytoplankton phenology. Glob. Chang. Biol. 2018, 24, e101–e111. [Google Scholar] [CrossRef] [Green Version]
  7. Sverdrup, H. On conditions for the vernal blooming of phytoplankton. J. Cons. Int. Explor. Mer. 1953, 18, 287–295. [Google Scholar] [CrossRef]
  8. Siegel, D.; Doney, S.; Yoder, J. The north atlantic spring phytoplankton bloom and Sverdrup’s critical depth hypothesis. Science 2002, 296, 730–733. [Google Scholar] [CrossRef]
  9. Lindemann, C.; St John, M.A. A seasonal diary of phytoplankton in the north atlantic. Front. Mar. Sci. 2014, 1, 37. [Google Scholar] [CrossRef] [Green Version]
  10. Sathyendranath, S.; Ji, R.; Browman, H.I. Revisiting Sverdrup’s critical depth hypothesis. ICES J. Mar. Sci. 2015, 72, 1892–1896. [Google Scholar] [CrossRef]
  11. Racault, M.F.; Le Quéré, C.; Buitenhuis, E.; Sathyendranath, S.; Platt, T. Phytoplankton phenology in the global ocean. Ecol. Indic. 2012, 14, 152–163. [Google Scholar] [CrossRef]
  12. Kahru, M.; Brotas, V.; Manzano-Sarabia, M.; Mitchell, B.G. Are phytoplankton blooms occurring earlier in the Arctic? Glob. Chang. Biol. 2011, 17, 1733–1739. [Google Scholar] [CrossRef]
  13. Bracher, A.; Bouman, H.A.; Brewin, R.J.; Bricaud, A.; Brotas, V.; Ciotti, A.M.; Clementson, L.; Devred, E.; Di Cicco, A.; Dutkiewicz, S.; et al. Obtaining phytoplankton diversity from ocean color: A scientific roadmap for future development. Front. Mar. Sci. 2017, 4, 55. [Google Scholar] [CrossRef] [Green Version]
  14. Racault, M.-F.; Sathyendranath, S.; Menon, N.; Platt, T. Phenological responses to ENSO in the global oceans. In Integrative Study of the Mean Sea Level and Its Components; Cazenave, A., Champollion, N., Paul, F., Benveniste, J., Eds.; Springer: Cham, Swizerland, 2017; pp. 281–297. [Google Scholar]
  15. Krug, L.A.; Platt, T.; Sathyendranath, S.; Barbosa, A.B. Patterns and drivers of phytoplankton phenology off sw iberia: A phenoregion based perspective. Prog. Oceanogr. 2018, 165, 233–256. [Google Scholar] [CrossRef]
  16. Gittings, J.A.; Raitsos, D.E.; Kheireddine, M.; Racault, M.-F.; Claustre, H.; Hoteit, I. Evaluating tropical phytoplankton phenology metrics using contemporary tools. Sci. Rep. 2019, 9, 1–9. [Google Scholar] [CrossRef] [PubMed]
  17. Salgado-Hernanz, P.; Racault, M.-F.; Font-Munõz, J.; Basterretxea, G. Trends in phytoplankton phenology in the mediterranean sea based on ocean-colour remote sensing. Remote Sens. Environ. 2019, 221, 50–64. [Google Scholar] [CrossRef]
  18. Soppa, M.A.; Völker, C.; Bracher, A. Diatom phenology in the Southern Ocean: Mean patterns, trends and the role of climate oscillations. Remote Sens. 2016, 8, 420. [Google Scholar] [CrossRef] [Green Version]
  19. Friedland, K.D.; Mouw, C.B.; Asch, R.G.; Ferreira, A.S.A.; Henson, S.; Hyde, K.J.; Morse, R.E.; Thomas, A.C.; Brady, D.C. Phenology and time series trends of the dominant seasonal phytoplankton bloom across global scales. Glob. Ecol. Biogeogr. 2018, 27, 551–569. [Google Scholar] [CrossRef]
  20. Louw, D.C.; van der Plas, A.K.; Mohrholz, V.; Wasmund, N.; Junker, T.; Eggert, A. Seasonal and interannual phytoplankton dynamics and forcing mechanisms in the Northern Benguela upwelling system. J. Mar. Syst. 2016, 157, 124–134. [Google Scholar] [CrossRef]
  21. Mahadevan, A. The impact of submesoscale physics on primary productivity of plankton. Annu. Rev. Mar. Sci. 2016, 8, 161–184. [Google Scholar] [CrossRef] [Green Version]
  22. Häder, D.P.; Gao, K. Interactions of anthropogenic stress factors on marine phytoplankton. Front. Env. Sci. 2015, 3, 14. [Google Scholar] [CrossRef] [Green Version]
  23. Marić, D.; Kraus, R.; Godrijan, J.; Supić, N.; Djakovac, T.; Precali, R. Phytoplankton response to climatic and anthropogenic influences in the north-eastern Adriatic during the last four decades. Estuar. Coast. Shelf Sci. 2012, 115, 98–112. [Google Scholar] [CrossRef]
  24. Brody, S.R.; Lozier, M.S.; Dunne, J.P. A comparison of methods to determine phytoplankton bloom initiation. J. Geophys. Res. Oceans 2013, 118, 2345–2357. [Google Scholar] [CrossRef]
  25. Ferreira, A.S.; Visser, A.W.; MacKenzie, B.R.; Payne, M.R. Accuracy and precision in the calculation of phenology metrics. J. Geophys. Res. Oceans 2014, 119, 8438–8453. [Google Scholar] [CrossRef]
  26. Rolinski, S.; Horn, H.; Petzoldt, T.; Paul, L. Identifying cardinal dates in phytoplankton time series to enable the analysis of long-term trends. Oecologia 2007, 153, 997–1008. [Google Scholar] [CrossRef]
  27. Navarro, G.; Ruiz, J. Spatial and temporal variability of phytoplankton in the gulf of cádiz through remote sensing images. Deep Sea Res. Part II Top. Stud. Oceanogr. 2006, 53, 1241–1260. [Google Scholar] [CrossRef]
  28. Goela, P.; Danchenko, S.; Icely, J.; Lubian, L.M.; Cristina, S.; Newton, A. Using chemtax to evaluate seasonal and interannual dynamics of the phytoplankton community off the south-west coast of Portugal. Estuar. Coast. Shelf Sci. 2014, 151, 112–123. [Google Scholar] [CrossRef] [Green Version]
  29. Krug, L.A.; Platt, T.; Sathyendranath, S.; Barbosa, A.B. Unravelling region-specific environmental drivers of phytoplankton across a complex marine domain (off sw iberia). Remote Sens. Environ. 2017, 203, 162–184. [Google Scholar] [CrossRef]
  30. Ferreira, A.; Garrido-Amador, P.; Brito, A.C. Disentangling environmental drivers of phytoplankton biomass off western Iberia. Front. Mar. Sci. 2019, 6, 44. [Google Scholar] [CrossRef] [Green Version]
  31. Tilstone, G.H.; Figueiras, F.G.; Lorenzo, L.M.; Arbones, B. Phytoplankton composition, photosynthesis and primary production during different hydrographic conditions at the Northwest Iberian upwelling system. Mar. Ecol. Prog. Ser. 2003, 252, 89–104. [Google Scholar] [CrossRef] [Green Version]
  32. Relvas, P.; Barton, E.D.; Dubert, J.; Oliveira, P.B.; Peliz, A.; Da Silva, J.; Santos, A.M.P. Physical oceanography of the western Iberia ecosystem: Latest views and challenges. Prog. Oceanogr. 2007, 74, 149–173. [Google Scholar] [CrossRef] [Green Version]
  33. Garrido, S.; Silva, A.; Marques, V.; Figueiredo, I.; Bryére, P.; Mangin, A.; Santos, A.M.P. Temperature and food-mediated variability of european atlantic sardine recruitment. Prog. Oceanogr. 2017, 159, 267–275. [Google Scholar] [CrossRef]
  34. Vidal, T.; Calado, A.J.; Moita, M.T.; Cunha, M.R. Phytoplankton dynamics in relation to seasonal variability and upwelling and relaxation patterns at the mouth of Ria de Aveiro (West Iberian Margin) over a four-year period. PLoS ONE 2017, 12, e0177237. [Google Scholar] [CrossRef] [PubMed]
  35. Oliveira, P.; Amorim, F.; Dubert, J.; Nolasco, R.; Moita, T. Phytoplankton distribution and physical processes off NW iberia during two consecutive upwelling seasons. Cont. Shelf Res. 2019, 190, 103987. [Google Scholar] [CrossRef]
  36. Sathyendranath, S.; Brewin, R.J.; Brockmann, C.; Brotas, V.; Calton, B.; Chuprin, A.; Cipollini, P.; Couto, A.B.; Dingle, J.; Doerffer, R.; et al. An Ocean-Colour Time Series for Use in Climate Studies: The Experience of the Ocean-Colour Climate Change Initiative (OC-CCI). Sensors 2019, 19, 4285. [Google Scholar] [CrossRef] [Green Version]
  37. Steinmetz, F.; Deschamps, P.Y.; Ramon, D. Atmospheric correction in presence of sun glint: Application to MERIS. Opt. Express 2011, 19, 9783–9800. [Google Scholar] [CrossRef] [Green Version]
  38. Jackson, T.; Sathyendranath, S.; Mélin, F. An improved optical classification scheme for the Ocean Colour Essential Climate Variable and its applications. Remote Sens. Environ. 2017, 203, 152–161. [Google Scholar] [CrossRef]
  39. Ocean Colour Climate Change Initiative Dataset, Version 4.2., European Space Agency. Available online: http://www.esa-oceancolour-cci.org/ (accessed on 13 May 2020).
  40. Valente, A.; Sathyendranath, S.; Brotas, V.; Groom, S.; Grant, M.; Taberner, M.; Antoine, D.; Arnone, R.; Balch, W.M.; Barker, K.; et al. A compilation of global bio-optical in situ data for ocean-colour satellite applications-version two. Earth Syst. Sci. Data 2019, 11, 1037–1068. [Google Scholar] [CrossRef] [Green Version]
  41. Sá, C.; D’Alimonte, D.; Brito, A.; Kajiyama, T.; Mendes, C.; Vitorino, J.; Oliveira, P.; Da Silva, J.; Brotas, V. Validation of standard and alternative satellite ocean-color chlorophyll products off western iberia. Remote Sens. Environ. 2015, 168, 403–419. [Google Scholar] [CrossRef]
  42. Racault, M.-F.; Sathyendranath, S.; Platt, T. Impact of missing data on the estimation of ecological indicators from satellite ocean-colour time-series. Remote Sens. Environ. 2014, 152, 15–28. [Google Scholar] [CrossRef] [Green Version]
  43. Cole, H.; Henson, S.; Martin, A.; Yool, A. Mind the gap: The impact of missing data on the calculation of phytoplankton phenology metrics. J. Geophys. Res. Oceans 2012, 117. [Google Scholar] [CrossRef]
  44. Greve, W.; Prinage, S.; Zidowitz, H.; Nast, J.; Reiners, F. On the phenology of north sea ichthyoplankton. ICES J. Mar. Sci. 2005, 62, 1216–1223. [Google Scholar] [CrossRef]
  45. Sasaoka, K.; Chiba, S.; Saino, T. Climatic forcing and phytoplankton phenology over the subarctic North Pacific from 1998 to 2006, as observed from ocean color data. Geophys. Res. Lett. 2011, 38. [Google Scholar] [CrossRef] [Green Version]
  46. Ward, J.H., Jr. Hierarchical grouping to optimize an objective function. J. Am. Stat. Assoc. 1963, 58, 236–244. [Google Scholar] [CrossRef]
  47. Balcan, M.-F.; Liang, Y.; Gupta, P. Robust hierarchical clustering. J. Mach. Learn. Res. 2014, 15, 3831–3871. [Google Scholar]
  48. Autret, E.; Tandéo, P.; Paul, F.; Prévost, C.; Piollé, J. Product user manual for level 4 ODYSSEA reprocessed SST product over the European North West Shelf/Iberia Biscay Irish Seas. EU Copernicus Marine Service, 1.1 ed.. 2019. Available online: https://resources.marine.copernicus.eu/documents/PUM/CMEMS-SST-PUM-010-026.pdf (accessed on 13 May 2020).
  49. Amo, A.B.; Gutknecht, E.; Sotillo, M.G. Product user manual for Atlantic—Iberian Biscay Irish—biogeochemistry multi-year non-assimilative hindcast product. EU Copernicus Marine Service, 3.2 ed.. 2019. Available online: https://resources.marine.copernicus.eu/documents/PUM/CMEMS-IBI-PUM-005-003.pdf (accessed on 13 May 2020).
  50. Amo, A.B.; Levier, B.; Sotillo, M.G. Product user manual for Atlantic—Iberian Biscay Irish—Ocean physics reanalysis product. EU Copernicus Marine Service, 3.2 ed.. 2019. Available online: https://cmems-resources.cls.fr/documents/PUM/CMEMS-IBI-PUM-005-002.pdf (accessed on 13 May 2020).
  51. Breiman, L. Random forests. Mach. Learn. 2001, 45, 5–32. [Google Scholar] [CrossRef] [Green Version]
  52. Cutler, D.R.; Edwards, T.C., Jr.; Beard, K.H.; Cutler, A.; Hess, K.T.; Gibson, J.; Lawler, J.J. Random forests for classification in ecology. Ecology 2007, 88, 2783–2792. [Google Scholar] [CrossRef]
  53. Wei, C.L.; Rowe, G.T.; Escobar-Briones, E.; Boetius, A.; Soltwedel, T.; Caley, M.J.; Soliman, Y.; Huettmann, F.; Qu, F.; Yu, Z.; et al. Global patterns and predictions of seafloor biomass using random forests. PLoS ONE 2010, 5, e15323. [Google Scholar] [CrossRef] [PubMed]
  54. Kruk, C.; Devercelli, M.; Huszar, V.L.; Hernández, E.; Beamud, G.; Diaz, M.; Silva, L.H.; Segura, A.M. Classification of reynolds phytoplankton functional groups using individual traits and machine learning techniques. Freshw. Biol. 2017, 62, 1681–1692. [Google Scholar] [CrossRef]
  55. Hu, S.; Liu, H.; Zhao, W.; Shi, T.; Hu, Z.; Li, Q.; Wu, G. Comparison of machine learning techniques in inferring phytoplankton size classes. Remote Sens. 2018, 10, 191. [Google Scholar] [CrossRef] [Green Version]
  56. Liu, X.; Feng, J.; Wang, Y. Chlorophyll a predictability and relative importance of factors governing lake phytoplankton at different timescales. Sci. Total Environ. 2019, 648, 472–480. [Google Scholar] [CrossRef]
  57. Scornet, E.; Biau, G.; Vert, J.-P. Consistency of random forests. Ann. Stat. 2015, 43, 1716–1741. [Google Scholar] [CrossRef]
  58. Genuer, R.; Poggi, J.-M.; Tuleau-Malot, C.; Villa-Vialaneix, N. Random forests for big data. Big Data Res. 2017, 9, 28–46. [Google Scholar] [CrossRef]
  59. Parr, T.; Turgutlu, K.; Csiszar, C.; Howard, J. Beware Default Random Forest Importances. 2018. Available online: https://explained.ai/rf-importance/ (accessed on 13 May 2020).
  60. Riley, G.A. Phytoplankton of the north central Sargasso sea, 1950–52 1. Limnol. Oceanogr. 1957, 2, 252–270. [Google Scholar] [CrossRef]
  61. Longhurst, A. Seasonal cycles of pelagic production and consumption. Prog. Oceanogr. 1995, 36, 77–167. [Google Scholar] [CrossRef]
  62. González Taboada, F.; Anadón, R. Seasonality of north atlantic phytoplankton from space: Impact of environmental forcing on a changing phenology (1998–2012). Glob. Chang. Biol. 2014, 20, 698–712. [Google Scholar] [CrossRef] [PubMed] [Green Version]
  63. Beca-Carretero, P.; Otero, J.; Land, P.; Groom, S.; Alvarez-Salgado, X.A. Seasonal and inter-annual variability of net primary production in the nw iberian margin (1998–2016) in relation to wind stress and sea surface temperature. Prog. Oceanogr. 2019, 178, 102135. [Google Scholar] [CrossRef]
  64. Krug, L.A.; Platt, T.; Barbosa, A.B. Delineation of ocean surface provinces over a complex marine domain (off SW Iberia): An objective abiotic-based approach. Reg. Stud. Mar. Sci. 2018, 18, 80–96. [Google Scholar] [CrossRef]
  65. Sousa, M.C.; de Castro, M.; Alvarez, I.; Gomez-Gesteira, M.; Dias, J.M. Why coastal upwelling is expected to increase along the western iberian peninsula over the next century? Sci. Total Environ. 2017, 592, 243–251. [Google Scholar] [CrossRef] [PubMed]
  66. Silva, A.; Palma, S.; Oliveira, P.B.; Moita, M.T. Composition and interannual variability of phytoplankton in a coastal upwelling region (Lisbon Bay, Portugal). J. Sea Res. 2009, 62, 238–249. [Google Scholar] [CrossRef]
  67. Pitcher, G.C.; Figueiras, F.G.; Hickey, B.M.; Moita, M.T. The physical oceanography of upwelling systems and the development of harmful algal blooms. Prog. Oceanogr. 2010, 85, 5–32. [Google Scholar] [CrossRef] [PubMed] [Green Version]
  68. Varela, R.; Alvarez, I.; Santos, F.; de Castro, M.; Gómez-Gesteira, M. Has upwelling’ strengthened along worldwide coasts over 1982–2010? Sci. Rep. 2015, 5, 1–15. [Google Scholar] [CrossRef] [PubMed]
  69. González-García, C.; Forja, J.; González-Cabrera, M.C.; Jiménez, M.P.; Lubián, L.M. Annual variations of total and fractionated chlorophyll and phytoplankton groups in the Gulf of Cadiz. Sci. Total Environ. 2018, 613, 1551–1565. [Google Scholar] [CrossRef] [PubMed]
  70. Gómez-Enri, J.; Escudier, R.; Pascual, A.; Mañanes, R. Heavy Guadalquivir River discharge detection with satellite altimetry: The case of the eastern continental shelf of the Gulf of Cadiz (Iberian Peninsula). Adv. Space Res. 2015, 55, 1590–1603. [Google Scholar] [CrossRef] [Green Version]
  71. IOCCG. Synergy between Ocean Colour and Biogeochemical/Ecosystem Models; Dutkiewicz, S., Ed.; IOCCG Report Series; 2020. No. 19; International Ocean Colour Coordinating Group: Dartmouth, NS, Canada, 2020; p. 184. [Google Scholar]
  72. Novoa, S.; Doxaran, D.; Ody, A.; Vanhellemont, Q.; Lafon, V.; Lubac, B.; Gernez, P. Atmospheric corrections and multi-conditional algorithm for multi-sensor remote sensing of suspended particulate matter in low-to-high turbidity levels coastal waters. Remote Sens. 2017, 9, 61. [Google Scholar] [CrossRef] [Green Version]
  73. Guerreiro, S.B.; Birkinshaw, S.; Kilsby, C.; Fowler, H.J.; Lewis, E. Dry getting drier–the future of transnational river basins in Iberia. J. Hydrol. Reg. Stud. 2017, 12, 238–252. [Google Scholar] [CrossRef]
  74. Lehahn, Y.; d’Ovidio, F.; Lévy, M.; Heifetz, E. Stirring of the northeast Atlantic spring bloom: A Lagrangian analysis based on multisatellite data. J. Geophys. Res. Oceans. 2007, 112. [Google Scholar] [CrossRef] [Green Version]
  75. Zampieri, M.; Toreti, A.; Schindler, A.; Scoccimarro, E.; Gualdi, S. Atlantic multi-decadal oscillation influence on weather regimes over Europe and the Mediterranean in spring and summer. Glob. Planet. Chang. 2017, 151, 92–100. [Google Scholar] [CrossRef]
  76. Fraga, F. Upwelling off the galician coast, northwest Spain. In Coastal Upwelling; Francis, A.R., Ed.; American Geophysical Union: Washington, DC, USA, 1981; Volume 1, pp. 176–182. [Google Scholar]
  77. Peliz, A.; Dubert, J.; Santos, A.M.P.; Oliveira, P.B.; Le Cann, B. Winter upper ocean´ circulation in the western iberian basin fronts, eddies and poleward flows: An overview. Deep Sea Res. Part I Oceanogr. Res. Pap. 2005, 52, 621–646. [Google Scholar] [CrossRef]
  78. Arístegui, J.; Barton, E.D.; Álvarez-Salgado, X.A.; Santos, A.M.P.; Figueiras, F.G.; Kifani, S.; Hernández-León, S.; Mason, E.; Machú, E.; Demarcq, H. Sub-regional ecosystem variability in the Canary Current upwelling. Prog. Oceanogr. 2009, 83, 33–48. [Google Scholar] [CrossRef] [Green Version]
  79. Bakun, A.; Black, B.A.; Bograd, S.J.; Garcia-Reyes, M.; Miller, A.J.; Rykaczewski, R.R.; Sydeman, W.J. Anticipated effects of climate change on coastal upwelling ecosystems. Curr. Clim. Chang. Rep. 2015, 1, 85–93. [Google Scholar] [CrossRef] [Green Version]
  80. Wang, D.; Gouhier, T.C.; Menge, B.A.; Ganguly, A.R. Intensification and spatial homogenization of coastal upwelling under climate change. Nature 2015, 518, 390–394. [Google Scholar] [CrossRef]
  81. Sousa, M.C.; Ribeiro, A.; Des, M.; Gomez-Gesteira, M.; de Castro, M.; Dias, J.M. NW Iberian peninsula coastal upwelling future weakening: Competition between wind intensification and surface heating. Sci. Total Environ. 2020, 703, 134808. [Google Scholar] [CrossRef] [PubMed]
  82. Bograd, S.J.; Schroeder, I.; Sarkar, N.; Qiu, X.; Sydeman, W.J.; Schwing, F.B. Phenology of coastal upwelling in the california current. Geophys. Res. Lett. 2009, 36. [Google Scholar] [CrossRef] [Green Version]
  83. Trigo, R.M.; Pozo-Vázquez, D.; Osborn, T.J.; Castro-Díez, Y.; Gámiz-Fortis, S.; Esteban-Parra, M.J. North Atlantic oscillation influence on precipitation, river flow and water resources in the Iberian Peninsula. Int. J. Climatol. 2004, 24, 925–944. [Google Scholar] [CrossRef]
  84. Groom, S.B.; Sathyendranath, S.; Ban, Y.; Bernard, S.; Brewin, B.; Brotas, V.; Brockmann, C.; Chauhan, P.; Choi, J.K.; Chuprin, A.; et al. Satellite ocean colour: Current status and future perspective. Front. Mar. Sci. 2019, 6, 485. [Google Scholar] [CrossRef] [Green Version]
  85. Chavez, F.P.; Messié, M. A comparison of eastern boundary upwelling ecosystem. Prog. Oceanogr. 2009, 83, 80–96. [Google Scholar] [CrossRef]
  86. Brito, A.C.; Garrido-Amador, P.; Gameiro, C.; Nogueira, M.; Moita, T.; Cabrita, M.T. Integrating In Situ and Ocean Color Data to Evaluate Ecological Quality under the Water Framework Directive. Water 2020, 12, 3443. [Google Scholar] [CrossRef]
  87. Garrido, S.; Ben-Hamadou, R.; Oliveira, P.B.; Cunha, M.E.; Chícharo, M.A.; van der Lingen, C.D. Diet and feeding intensity of sardine Sardina pilchardus: Correlation with satellite-derived chlorophyll data. Mar. Ecol. Prog. Ser. 2008, 354, 245–256. [Google Scholar] [CrossRef] [Green Version]
  88. Sherman, K.; O’Reilly, J.; Belkin, I.M.; Melrose, C.; Friedland, K.D. The application of satellite remote sensing for assessing productivity in relation to fisheries yields of the world’s large marine ecosystems. ICES J. Mar. Sci. 2011, 68, 667–676. [Google Scholar] [CrossRef]
  89. Brotas, V.; Couto, A.B.; Sá, C.; Amorim, A.; Brito, A.; Laanen, M.; Peters, S.; Poser, K.; Eleveld, M.; Miller, P.; et al. Deriving Aquaculture indicators from Earth Observation in the AQUA-USERS project (AQUAculture USEr driven operational Remote Sensing information Services). Ocean Opt. XXII 2014, 1–9. [Google Scholar] [CrossRef]
  90. Gomes, M.; Correia, A.; Pinto, L.; Sá, C.; Brotas, V.; Mateus, M. Coastal Water Quality in an Atlantic Sea Bass Farm Site (Sines, Portugal): A First Assessment. Front. Mar. Sci. 2020, 7, 175. [Google Scholar] [CrossRef]
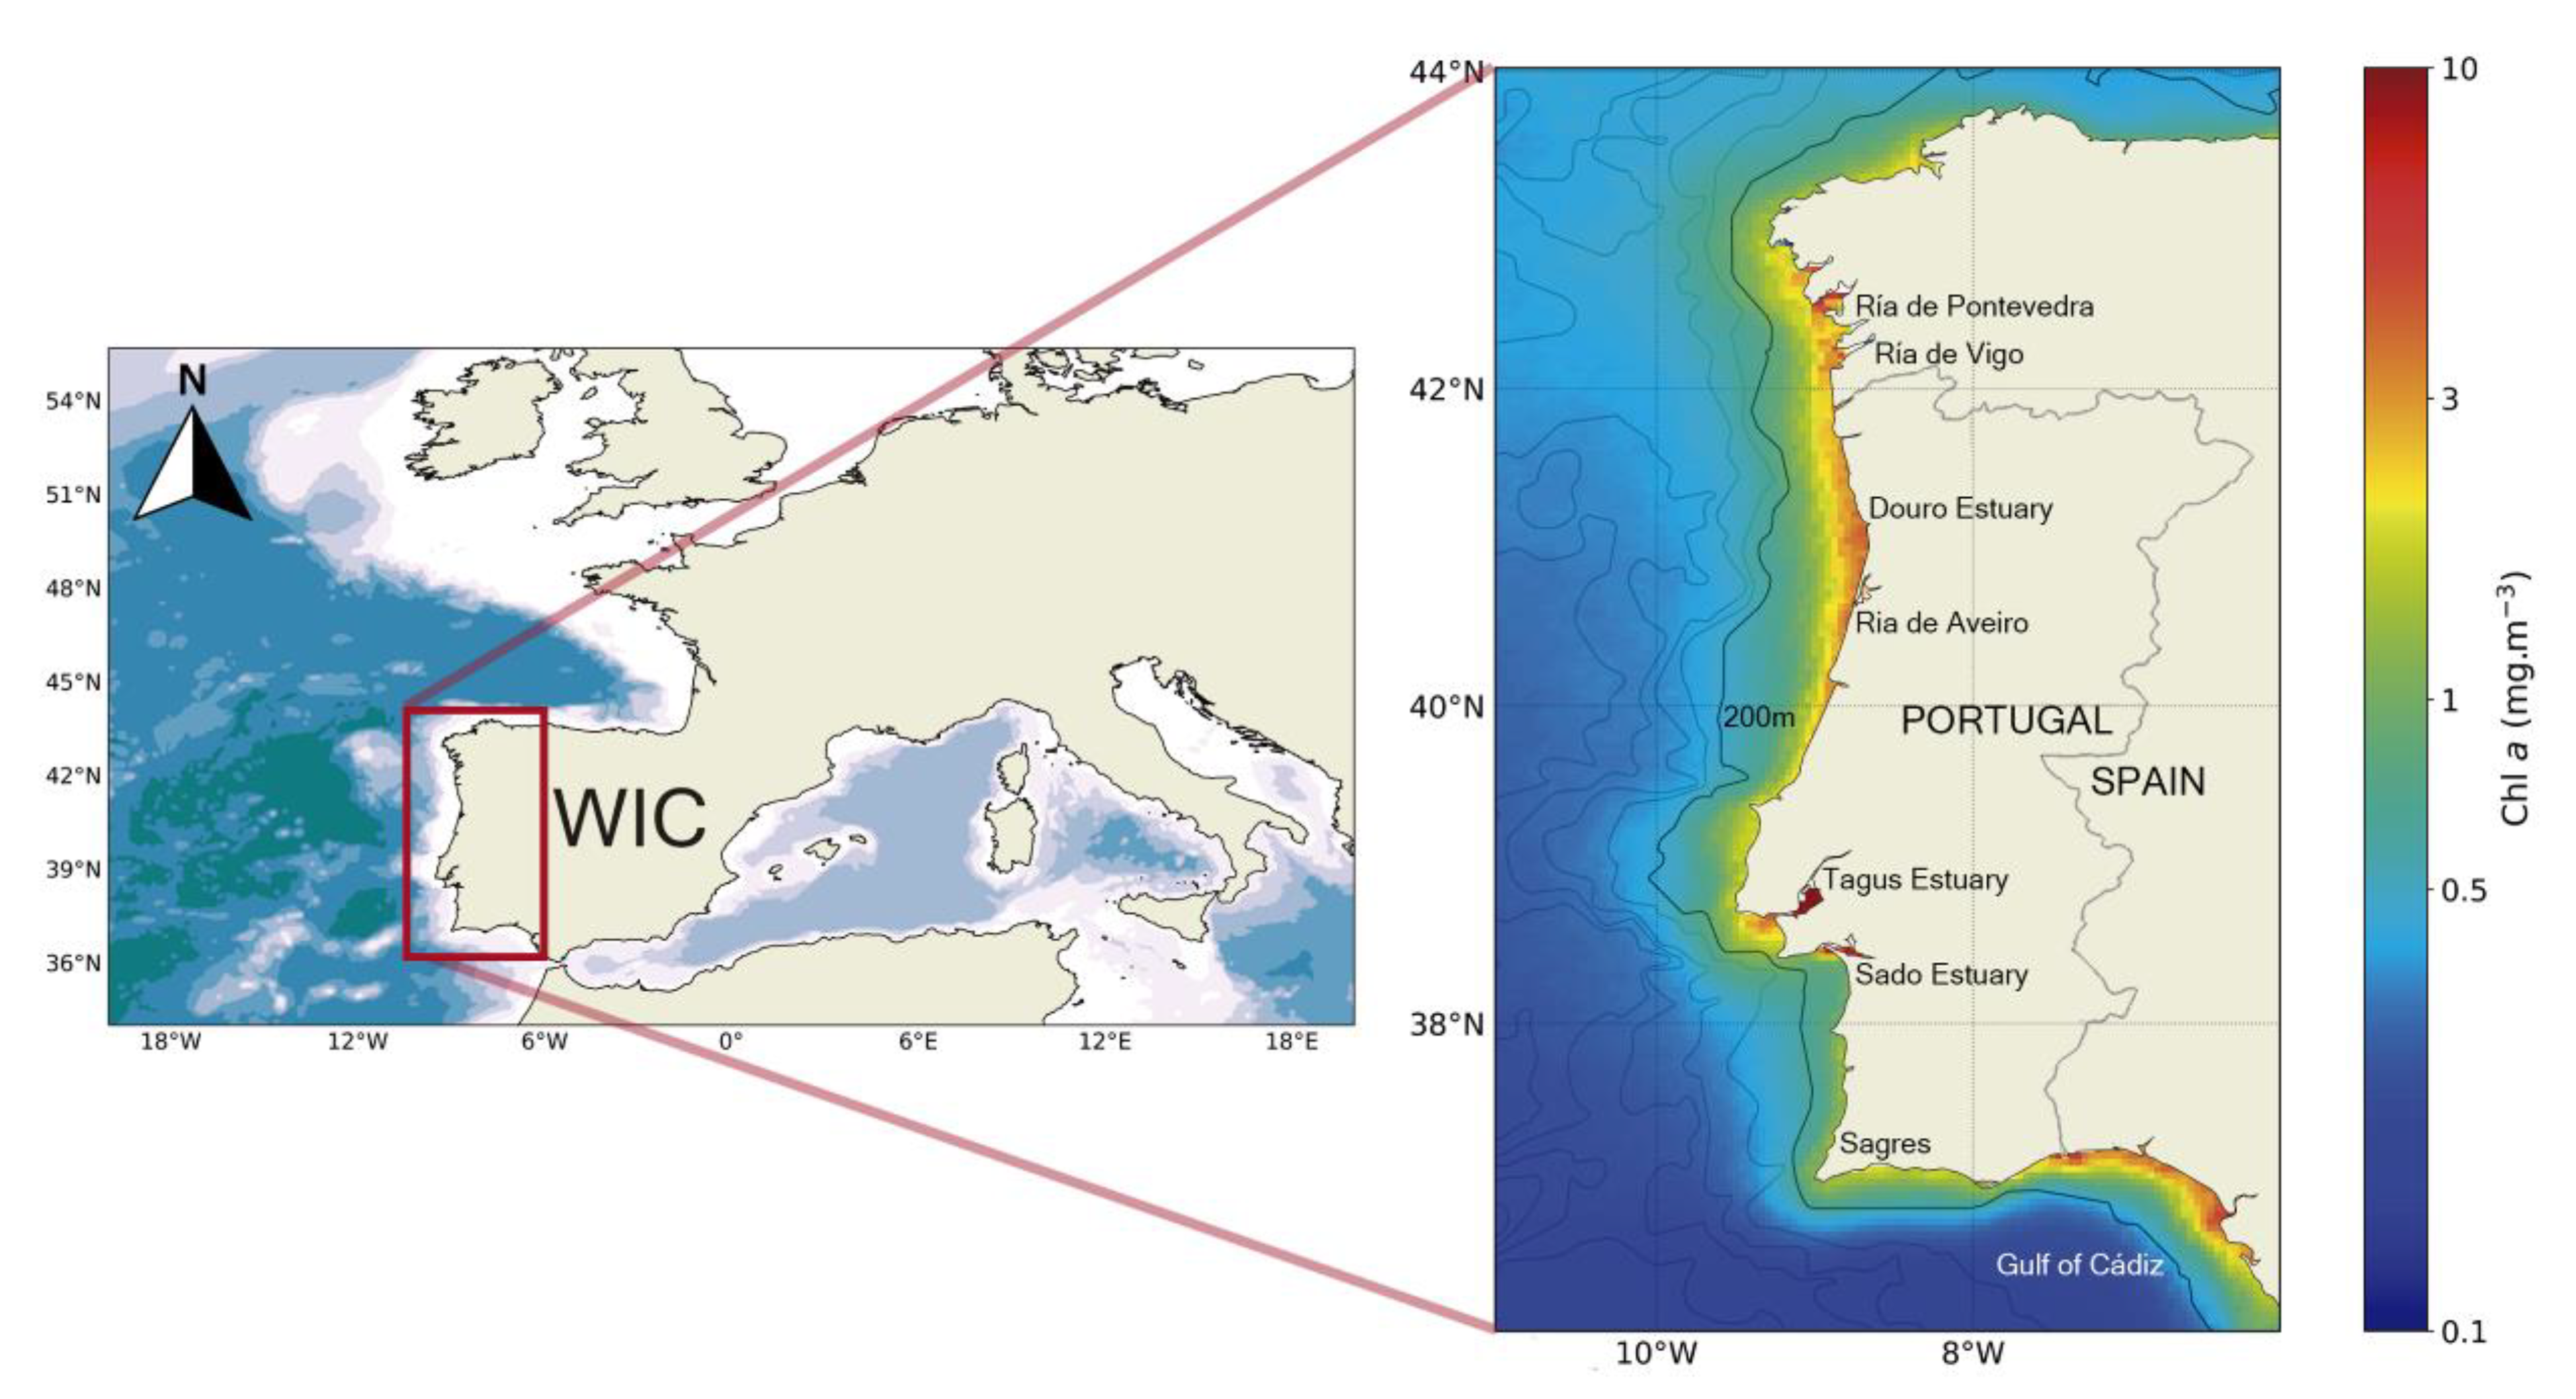
Figure 1. Location of the Western Iberian Coast (WIC) and mean satellite chl-a concentration during 1997–2019. Black lines correspond to isobathymetric lines at 200 m, 1000 m, 2000 m, 3000 m, 4000 m, 5000, and 6000 m depths. Note that the background color in the left plot represents oceanic bathymetry.
Remotesensing 13 00675 g001
Figure 2. Representation of phytoplankton bloom phenology metrics calculated in this work: chl-a mean, chl-a max, bloom amplitude, days of bloom initiation and termination, bloom duration, day of bloom peak, and bloom area (green). Bloom frequency and yearly area are not shown.
Remotesensing 13 00675 g002
Figure 3. Flowchart representing the workflow presented in this work. See Table 1 for more information on the phenological metrics.
Remotesensing 13 00675 g003
Figure 4. (a) Max yearly chl-a (mg m−3); (b) mean bloom amplitude (mg m−3); and (c) mean bloom peak date (i.e., peak chl-a concentration) calculated for the period 1998–2018.
Remotesensing 13 00675 g004
Figure 5. Mean dates of (a) main bloom initiation and (b) termination; (c) mean bloom duration; (d) mean area (mg m−3); (e) mean yearly area (mg m−3); and (f) mean bloom frequency (blooms year−1) during 1997–2018.
Remotesensing 13 00675 g005
Figure 6. (a) Phenoregions identified from the clustering analysis (see the color code): OcN (Oceanic North; (b)), OcSW (Oceanic Southwest; (c)), CoMa (Coastal Continental Margin; (d)), CoUp (Coastal Upwelling; (e)), and CoBa (Coastal River Basins; (f)). For each phenoregion, the chl-a (mg m−3) annual cycle between 1998 and 2019 is plotted (black solid line), along with the 1998–2004 (dashed), 2005–2011 (dotted), and 2012–2018 (dash-dotted) mean cycles.
Remotesensing 13 00675 g006
Figure 7. Yearly main bloom statistics between 1998 and 2018 for each phenoregion: (a) Oceanic North (OcN), (b) Oceanic Southwest (OcSW), (c) Coastal Continental Margin (CoMa), (d) Coastal Upwelling (CoUp), (e) Coastal River Basins (CoBa). Main axis: each box represents the period of the main bloom during the corresponding year, with bloom initiation (BI), termination (BT), and peak (black horizontal line within each box) signaled. Secondary axis: bars in the background are the area (mg m−3) corresponding to each bloom.
Remotesensing 13 00675 g007
Figure 8. Yearly phenology metrics anomalies between 1998 and 2018 for each phenoregion: (a) OcN, (b) OcSW, (c) CoMa, (d) CoUp, (e) CoBa (normalized between −1 and 1). Asterisks represent significant positive linear trends, as seen in Table 3. ***, **, and * correspond to the degree of statistical significance (p-value < 0.1, p-value < 0.05, p-value < 0.01, respectively).
Remotesensing 13 00675 g008
Table 1. Summary of the phenology metrics used in this work, including description. DOY stands for the day of the year.
MetricFull NameUnitDescription
MeanChl a meanmg m−3Mean Chl a concentration of the seasonal cycle
MaxChl a maximummg m−3Maximum Chl a concentration of the seasonal cycle
BAmpBloom amplitudemg m−3Difference between Chl a maximum and mean
BPeakBloom peak-DOY of Chl a Maximum
BInitBloom initiation-DOY of initiation of the main bloom in the seasonal cycle
BTermBloom termination-DOY of termination of the main bloom in the seasonal cycle
BDurBloom durationdaysDuration of the main bloom in the seasonal cycle
BAreaBloom areamg m−3Biomass of the main bloom in the seasonal cycle
YAreaYearly areamg m−3Total biomass accumulated during the seasonal cycle
BFreqBloom Frequencyblooms year−1Number of blooms in the seasonal cycle
Table 2. Summary of the environmental variables and climate indices metrics used in this work.
MetricFull NameUnit
SSTSea surface temperature°C
MLDMixed layer depthm
SALSalinity(unitless)
SSHSea surface heightm
VoMeridional component of water transportm s−1
UoZonal component of water transportm s−1
DINDissolved inorganic nitrogen (nitrate + ammonium) concentrationµM
PO43−Phosphate concentrationµM
SiSilicon concentrationµM
ZeuEuphotic zone depthm
NAONorth Atlantic Oscillation index(unitless)
AMOAtlantic Meridional Oscillation index(unitless)
MEIMultivariate El-Niño Southern Oscillation index(unitless)
Table 3. Phenoregions statistical metrics and intercorrelation results calculated for phenology metrics (see Table 1 for full names and description). For each phenoregion, mean, minimum (Min), maximum (Max), standard deviation (Stdev), 10th and 90th percentiles (P10 and P90), and mode are presented for the phenology metrics for the 1998–2018 period. The linear trend (Trend) is the slope of the least-squares regression for each metric. Correlation results between phenology metrics are shown in red (positive correlation) or blue (negative correlation). Only statistically significant correlations and trends are displayed. *, ** and *** equals p-value < 0.1, p-value < 0.05 and p-value < 0.01.
OcN
MeanMaxBAmpBPeakBinitBTermBDurBAreaYAreaBFreq
Mean0.340.730.3990 (March)47 (February)146 (May)10051.64123.972.19
Min0.30.490.1952 (February)9 (January)87 (March)7334.25111.181
Max0.391.110.73122 (May)77 (March)194 (July)13278.051444
Stdev0.020.180.161719181811.188.980.73
P100.310.530.21---7539.98114.891
P900.381.010.62---12261.83139.293
Mode---MarchFebruaryMay----
Trend---1.32**1.20*-----
MeanMaxBAmpBPeakBInitBTermBDurBAreaYAreaBFreq
Mean 0.760.69 0.60.98
Max 1 0.660.79
BAmp 0.640.73
BPeak 0.590.54
Binit 0.55−0.48 0.49
BTerm 0.470.53
BDur 0.62 −0.69
Barea 0.67
YArea
BFreq
OcSW
MeanMaxBAmpBPeakBInitBTermBDurBAreaYAreaBFreq
Mean0.250.510.2674 (March)339 (December)127 (May)15250.8892.531.24
Min0.220.340.091 (January)1 (January)79 (March)9135.5480.931
Max0.30.990.69102 (April)362 (December)154 (June)17472.27110.663
Stdev0.020.140.13202416227.736.490.53
P100.230.40.16---12143.8284.271
P900.270.640.38---17258.9998.582
Mode---MarNovMay----
Trend----------
MeanMaxBAmpBPeakBInitBTermBDurBAreaYAreaBFreq
Mean 0.790.74 0.470.96
Max 1 0.580.84
BAmp 0.580.79
BPeak 0.69
Binit 0.540.51
BTerm
BDur 0.7 −0.54
Barea 0.63
YArea
BFreq
CoMa
MeanMaxBAmpBPeakBInitBTermBDurBAreaYAreaBFreq
Mean0.570.990.4190 (March)48 (February)137 (May)8665.16207.832.71
Min0.460.760.2340 (February)3 (January)75 (March)5138.39167.732
Max0.641.460.83227 (August)363 (December)290 (October)131113.54231.824
Stdev0.050.170.154444402220.6717.010.7
P100.50.780.26---5945.28182.632
P900.631.170.61---11993.27228.914
Mode---MarFebMay----
Trend---3.00*------
MeanMaxBAmpBPeakBInitBTermBDurBAreaYAreaBFreq
Mean 0.64 0.99
Max 0.97 0.670.67−0.45
BAmp 0.660.47−0.51
BPeak 0.87
Binit
BTerm
BDur 0.93 −0.51
Barea −0.55
YArea
BFreq
CoUp
MeanMaxBAmpBPeakBInitBTermBDurBAreaYAreaBFreq
Mean1.111.620.51274 (October)242 (August)292 (October)4766.61405.093.14
Min0.91.110.091 (January)1 (January)25 (January)1919.05327.992
Max1.272.20.99365 (December)360 (December)354 (December)86122.84463.265
Stdev0.110.280.221061061262132.1239.510.94
P100.951.250.25---2123.48345.572
P901.2120.81---76117.59442.965
Mode---SeptemberAugustOctober----
Trend----−6.88*-----
MeanMaxBAmpBPeakBInitBTermBDurBAreaYAreaBFreq
Mean 0.65 1
Max 0.93 0.450.630.65
BAmp −0.45 0.450.6
BPeak 0.460.75
Binit
BTerm
BDur 0.97 −0.59
Barea −0.54
YArea
BFreq
CoBa
MeanMaxBAmpBPeakBInitBTermBDurBAreaYAreaBFreq
Mean2.153.611.4649 (February)19 (January)110 (April)78228.66781.852.57
Min1.292.210.331 (January)26 (January)7 (January)2144.9472.941
Max2.835.672.83365 (December)355 (December)363 (December)151592.121035.394
Stdev0.511.030.6850485541151.6183.30.79
P101.432.250.81---3385.73522.322
P902.75.352.68---147496.57987.453
Mode---AprilFebMay----
Trend−0.05***-----3.17**-−16.66***-
MeanMaxBAmpBPeakBInitBTermBDurBAreaYAreaBFreq
Mean 0.810.48 0.48 0.491
Max 0.9 0.510.810.82
BAmp 0.690.850.5−0.44
BPeak 0.5
Binit
BTerm
BDur 0.89 −0.46
Barea 0.52
YArea
BFreq
Table 4. Random forest models result for each phenoregion. For each phenology metric, the coefficient of determination (R2), the root-mean-squared error (RMSE) and the predictors are presented in order of importance. The partial response of each metric to an increase in its main predictors (*) is also represented as plus (increase), minus (decrease) or 0 (neutral), following the order of the predictors.
OcN
MetricR2RMSEModel PredictorsResponse to main predictors increase
Mean0.750.01DIN *, AMO, Uo, MEI, Fe, NAO+
Max0.750.09Si *, MLD, NAO, DIN, Sal, MEI, SSH
BAmp0.760.08Si *, NAO, MLD, DIN, Sal
BPeak0.719.2MLD *, Fe, Vo+
BInit0.6311.45DIN *, Vo+
BTerm0.88.39AMO *, Fe, NAO, DIN, Sal, Vo
BDur0.739.33AMO *, Si, Uo, MLD
BArea0.874.09Si *, Uo
YArea0.774.3DIN *, AMO, Uo+
BFreq0.610.45AMO *, MEI *, Vo *+ 0 −
OcSW
MetricR2RMSEModel PredictorsResponse to main predictors increase
Mean0.630.01MEI *, NAO *, Si+ −
Max0.690.08DIN *, Si, SST, NAO, Sal, Vo, Fe, Uo, SSH+
BAmp0.70.07DIN *, SST, Si, Vo, Sal, NAO, SSH, Uo, Fe+
BPeak0.89.07Sal *, Si *, SST, DIN, SSH0 −
BInit0.4779.19MEI *
BTerm0.5111.56SST *, Si+
BDur0.6513.3Fe *, NAO+
BArea0.823.24Fe *, SST *, Sal *. Si *, NAO, MEI, Uo, Vo+ + + −
YArea0.633.95DIN *, Si*, NAO, Vo, Uo+ −
BFreq0.80.23Si *, SST *, Fe, Vo− 0
CoMa
MetricR2RMSEModel PredictorsResponse to main predictors increase
Mean0.650.03Vo *, DIN, MLD, SSH, Sal, Si+
Max0.630.1DIN *, Sal, MLD+
BAmp0.630.09DIN *, Sal, MLD, Uo+
BPeak0.5332.61SSH *. Fe *, Sal+ −
BInit0.8439.78MLD *, AMO, Fe, SST, NAO, Si, MEI, SSH, Vo, Sal
BTerm0.4334.65DIN *, SSH *, Fe, AMO, Sal− +
BDur0.7111.94SSH *, Sal *, DIN, AMO0 −
BArea0.6811.78SSH *. Sal *, Si, DIN, Uo, MLD0
YArea0.866.38SSH *, Vo *, MLD, DIN, Sal, Si, Uo+ +
BFreq0.640.42MEI *, Sal *, MLD, DIN+ +
CoUp
MetricR2RMSEModel PredictorsResponse to main predictors increase
Mean0.690.06Sal *+
Max0.860.1Sal *, MEI *, Zeu, Vo, Uo, DIN, SST+ +
BAmp0.660.13MEI *, DIN, NAO, Uo, Fe+
BPeak0.759.52SSH *, Zeu
BInit0.7257.42DIN *, MEI *, Uo *, SST, AMO, Sal, Si, NAO− + 0
BTerm0.8736.17SSH *, NAO, Uo, AMO, Fe, MEI, Si
BDur0.5613.83Uo *, MLD, Si+
BArea0.5820.83Uo *, MLD
YArea0.6922Sal *+
BFreq0.590.6Sal *. Fe+
CoBa
MetricR2RMSEModel PredictorsResponse to main predictors increase
Mean0.730.26Sal *, Uo*+ −
Max0.580.67Sal *+
BAmp0.610.43Si *, Uo, SSH, Sal, Fe
BPeak0.6667.7SST *, NAO, Vo, MEI+
BInit0.689.81NAO *, Si *, Zeu *, AMO− − −
BTerm0.4857.33Si *, SST *, NAO, SSH0 +
BDur0.7121.62Uo *, Si, MLD+
BArea0.5106.92Uo *, MLD+
YArea0.7396.11Sal *, Uo+
BFreq0.60.5MEI *, Zeu, Uo, Si, MLD, SST+
Publisher’s Note: MDPI stays neutral with regard to jurisdictional claims in published maps and institutional affiliations.