Abstract
With the rapid advances and abundant observations from Chinese Fengyun-3 (FY-3) meteorological satellites, it is of great interest to summarize a decade of quality assessments of FY-3 observations. The topics covered are noise characterization, bias estimation, striping noise detection and mitigation of striping noise, radio frequency interference detection, geolocation accuracy estimation and improvement, data assimilation cloud detection and quality control for observations from the MicroWave Temperature Sounder (MWTS), the MicroWave Humidity Sounder (MWHS), the MicroWave Radiation Imager (MWRI) and the Hyperspectral Infrared Atmospheric Sounder (HIRAS) instruments on board FY-3A/B/C/D. Whether and how much FY-3 data assimilation could improve the numerical weather forecast skill strongly depends on how well the FY-3 data characteristics and errors listed above are known. This review article shall contribute to promoting internal and national usages of FY-3 observations for weather and climate studies.
1. Introduction
Having high-quality meteorological observations is a prerequisite for skillful numerical weather prediction (NWP). Characterized by global coverage, multiple types of instruments, not limited by natural conditions and national boundaries, polar-orbiting environmental satellite (POES) observations plays a key role in NWP, complementary to and not replaceable by any other observational means (e.g., radar, radiosonde, surface station and flight observations). Therefore, POES observations are indispensable in atmospheric data assimilation for numerical weather forecasts, and are particularly important to improve the forecasts of disastrous weather (typhoon, rainstorm, flood, drought, haze, etc.).
Premier Zhou Enlai approved and assigned the task of developing China’s own meteorological satellites in 1970. Under the leadership of Zou Jingmeng, who was the Director of China Meteorological Administration, China’s meteorological satellite industry embarked on the road of independent development. FY-1A, which was the first satellite in the first generation of FengYun-1 (FY-1) POES series, was successfully launched in 1988 and ended the history of no meteorological satellite in China. However, digitized satellites observations of brightness temperature are not available from FY-1 series for assimilation in NWP models. At the beginning of the 21st century, China started a fast track of development of meteorological satellites, the FengYun-3 (FY-3) series. The first four FY-3 satellites, FY-3A/B/C/D, were successively launched into POES orbits on 27 May 2008, 5 December 2010, 23 September 2013 and 15 November 2017, respectively. Several follow-on FY-3 satellites are planned for launch before 2035 [1,2,3,4].
The microwave temperature sounder (MWTS), microwave humidity sounder (MWHS), microwave radiation imager (MWRI) and hyperspectral infrared sounder (HIRAS) are four major types of FY-3 instruments that provide observations of brightness temperature for direct assimilation in NWP modeling systems. These instruments lagged behind similar instruments from the United States (US) for more than a decade. For examples, the MWTS onboard FY-3A/B is similar to the Microwave Sounding Unit (MSU) on board the early National Oceanic and Atmospheric Administration (NOAA) Television and Infrared Observation Satellite (TIROS)-N started in 1979 [5]. Except for lacking two window channels, the MWTS onboard FY-3C/D is similar to the Advanced Microwave Sounding Unit module A (AMSU-A) onboard NOAA-15 launched in 1998 [6]. The MWHS onboard FY-3A/B/C/D are similar to the microwave humidity sounder (MHS) onboard NOAA-15, except that MWHS onboard FY-3C/D added eight more channels located near the 118-GHz oxygen absorption band. The MWRI onboard FY-3A/B/C/D has most of the frequencies of the Advanced Microwave Scanning Radiometer–EOS (AMSR-E) onboard the National Aeronautics and Space Administration (NASA) Aqua satellite launched in May 2002, except for lacking the C-band (6.9 GHz) [7]. The HIRAS is similar to the hyperspectral infrared sounder Atmospheric Infrared Sounder (AIRS) onboard the NASA Aqua satellite launched in May 2002 [8].
More than a decade has passed since the beginning of the FY-3 series. A series of quality assessments and improvements of FY-3 observations were carried out, in which US satellite observations from similar instruments were used as references. This paper summarizes the research results completed over the past 10 years (2011-2020) on FY-3 observations from MWTS, MWHS, MWRI and HIRAD. The first purpose is to assess the comparability of FY-3 satellite data with similar international instruments. The second purpose is to expand the impact of FY-3 satellite data in research and operational applications. Section 2 provides an overview on satellite data assimilation. FY-3 observations and related research are summarized in Section 3. The works on bias characterization, striping noise mitigation, radio frequency interference (RFI), cloud detection, and data assimilation of FY-3 observations are carefully reviewed in Section 4. This article ends in Section 5 with a future plan.
2. The Role of Satellite Data on Atmospheric Data Assimilation
Atmospheric data assimilation is a process of incorporating various observational data into numerical weather prediction by producing the “best” description of the atmospheric state at a desired resolution in an “optimal” sense statistically. Whichever data assimilation methods one chooses to use, the analyses (
) produced could be written into a general form of the following expression:
, where
is the a priori knowledge of the model state (called background field),
is the a posteriori weighting matrix, which differs from each of different data assimilation methods,
represents all observations assimilated, H represents an observation operator, and
is the analysis field obtained by the data assimilation. The dimension of
is much larger than 106 × 106, which prevents it from being stored on current computers. Therefore, the analysis field
is not directly derived from an explicit expression of
,
but implicitly and approximately requiring only the product of matrix and vector at such large dimensions [9]. In atmospheric data assimilation, observations are fitted to within observation errors, observation operators are physically consistent with what data represent, background information is included, biases are removed, appropriate dynamic and physical constraints at the scales of interest are incorporated, noise is removed and/or suppressed, and computational expense is restricted to be within hardware constrains and the data assimilation time constraint.
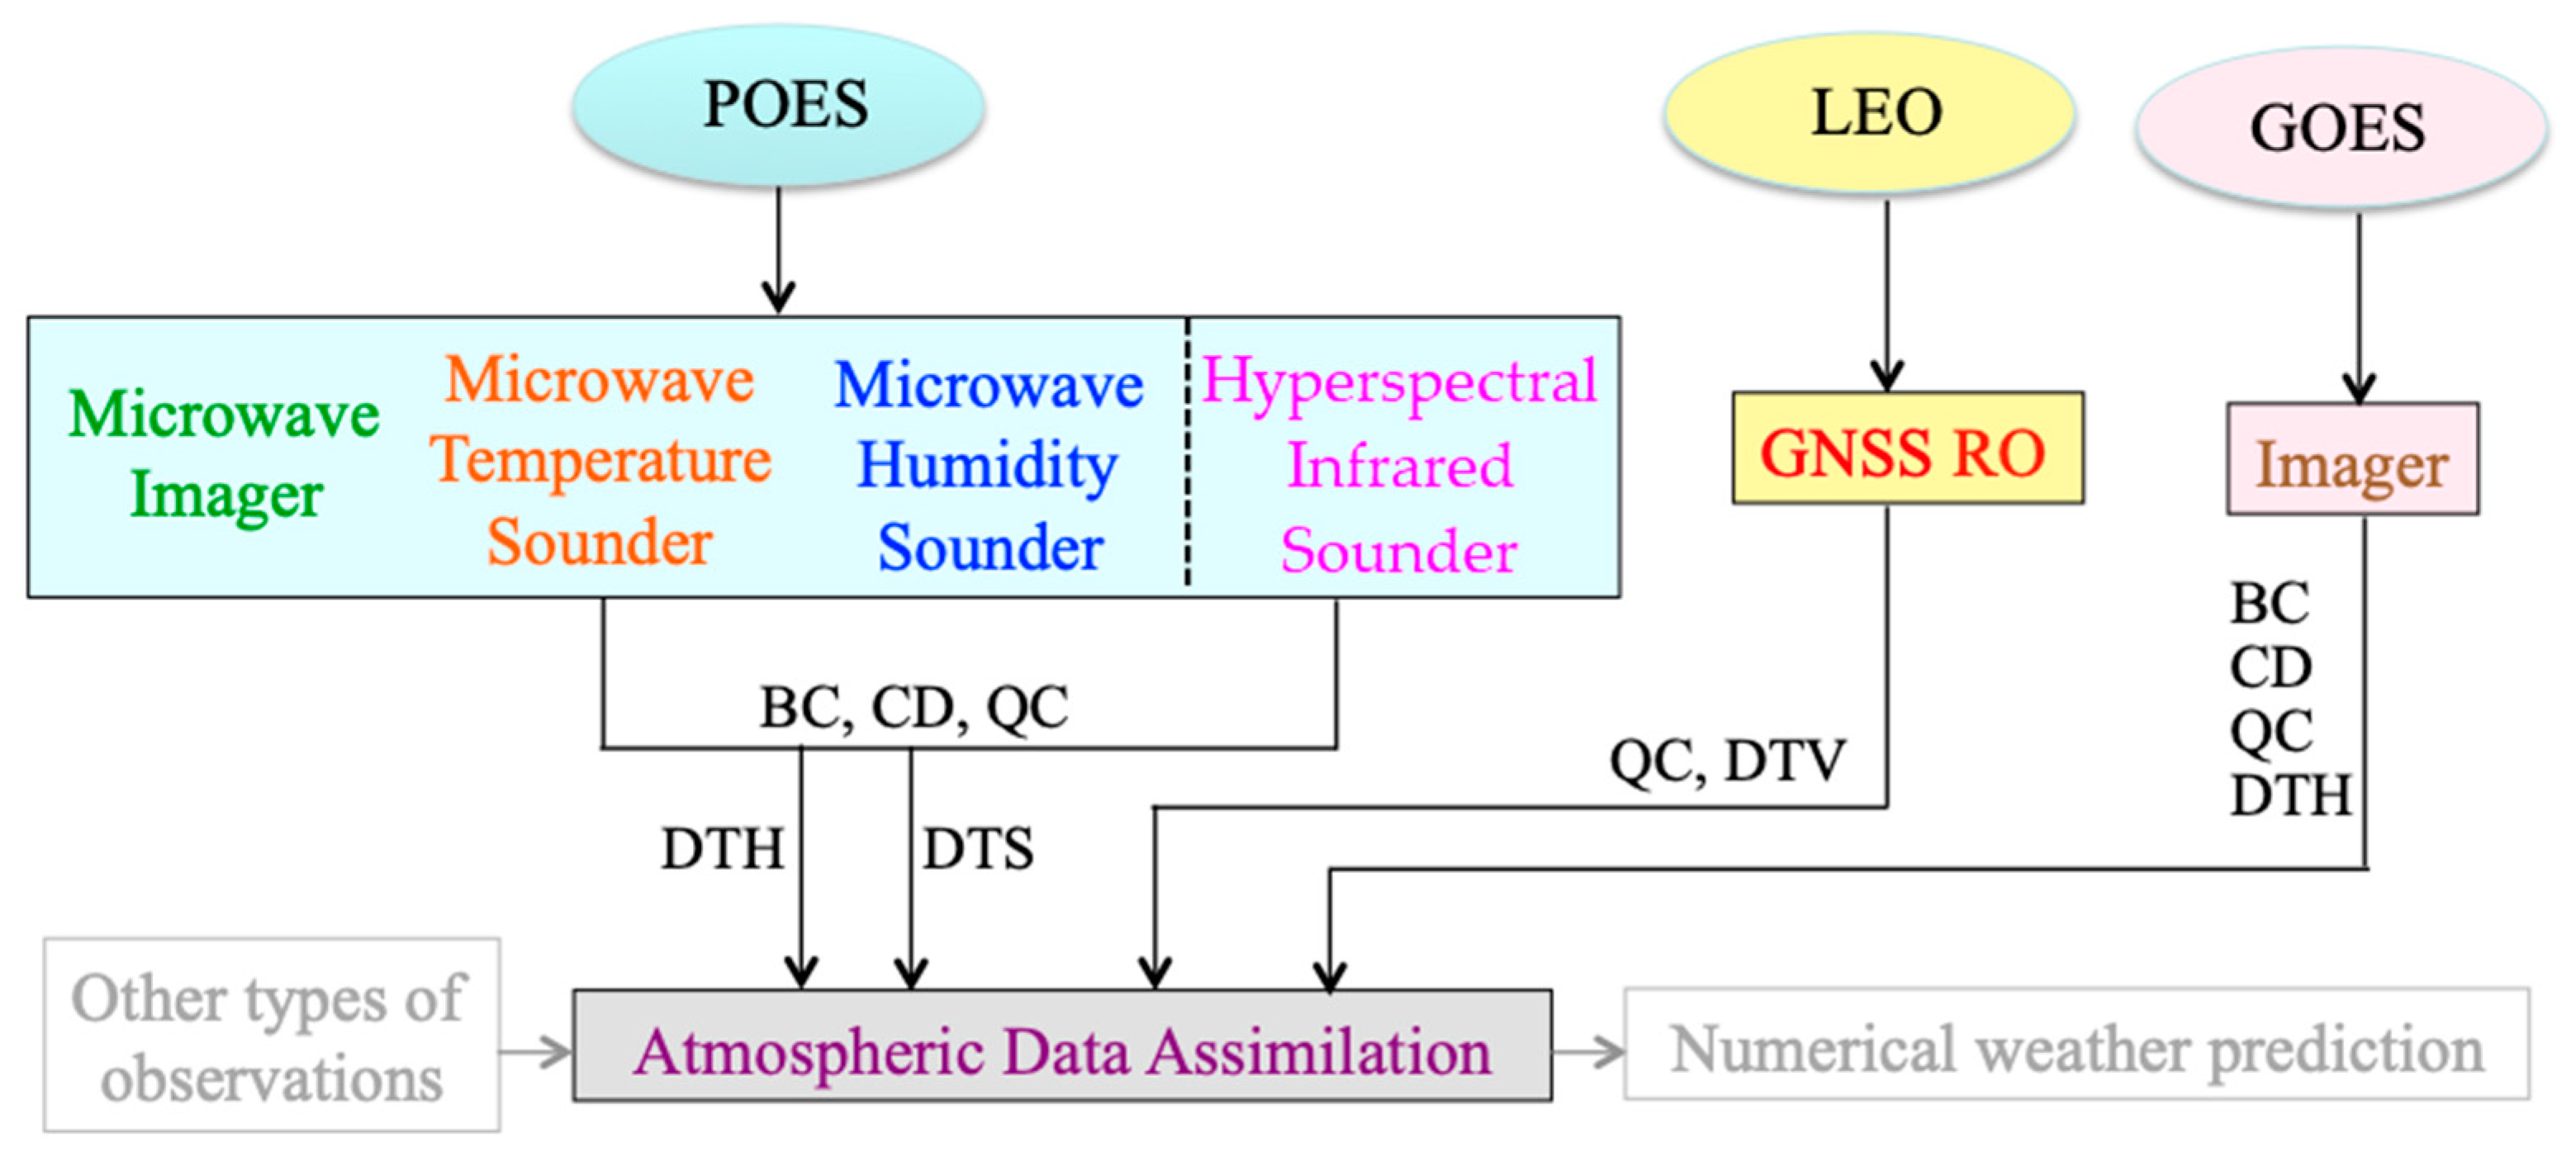
Observations are the motivation for conducting atmospheric data assimilation. The data assimilation provides initial conditions for numerical weather prediction (NWP) models and generates a reanalysis dataset for studying atmospheric dynamics and climate change. More than 95% of assimilated data are satellite observations [10]. Figure 1 shows the following six major satellite instruments providing data for numerical weather prediction: microwave imager, microwave temperature sounder, microwave humidity sounder and hyperspectral infrared sounder onboard POESs, the global navigation satellite system (GNSS) radio occultation receiver carried by low orbit satellites (LEO), and imager onboard geostationary environmental satellites (GOES). The POES and GOES observations of thermal radiation at different frequencies measured by different instruments are mainly determined by the atmospheric state at different altitudes. The GNSS radio occultation observations are also routinely assimilated in research and operational data assimilation systems. The GOES imager can provide high temporal and horizontal resolution imager data in the visible, near infrared and infrared electromagnetic spectrum at the highest horizontal resolution. Whether and how much satellite data assimilation can improve the level of numerical weather prediction depends on the research work of satellite data bias estimation, cloud detection, quality control, NWP model resolution dependent data thinning, etc.
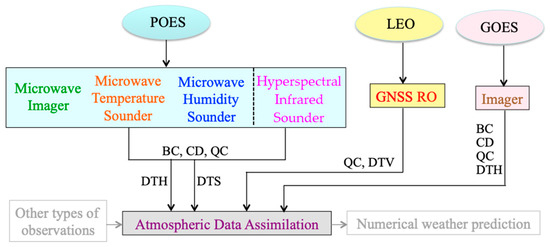
Figure 1.
Six major remote-sensing instruments: POES microwave imager, microwave temperature sounder, microwave humidity sounder and hyperspectral infrared sounder onboard POES, GNSS RO receiver carried by LEO satellite, and GOES imager, as well as main tasks for assimilation of observations from these instruments, including bias correction (BC), cloud detection (CD), quality control (QC), data thinning in horizontal (DTH) and vertical (DTV) directions and/or spectral (DTS) parameter space.
Since the 20th century, satellite radiance observations have routinely been assimilated into numerical weather prediction systems worldwide, such as the National Centers for Environmental Prediction (NCEP) [11] and the European Centre of Medium-Range Weather Forecasts (ECMWF) [12,13]. The ECMWF has always been in the leading position in satellite data assimilation. Since 2004, China began to independently develop the Global/Regional Assimilation PrEdiction System (GRAPES). The GRAPES 3D-Var [14] and 4D-Var [15] versions became operational in 2016 and 2018, respectively.
The assimilation effect of satellite observations depends on not only the NWP models, but also on the key technologies such as bias correction (BC), cloud detection (CD), quality control (QC) and data thinning in horizontal (DTH) and vertical (DTV) directions and/or spectral (DTS) parameter space. Only when these works on satellite observations are done well can satellite data make the most significant positive contribution to maximizing the forecasting skill of numerical weather prediction and generating the best reanalysis dataset. In return, reanalysis datasets could also be used to find the data quality problems and to examine the noise characteristics of satellite observations, so as to improve the quality and accuracy of satellite observations.
3. Quality Assessments and Improvements of FY-3 Observations
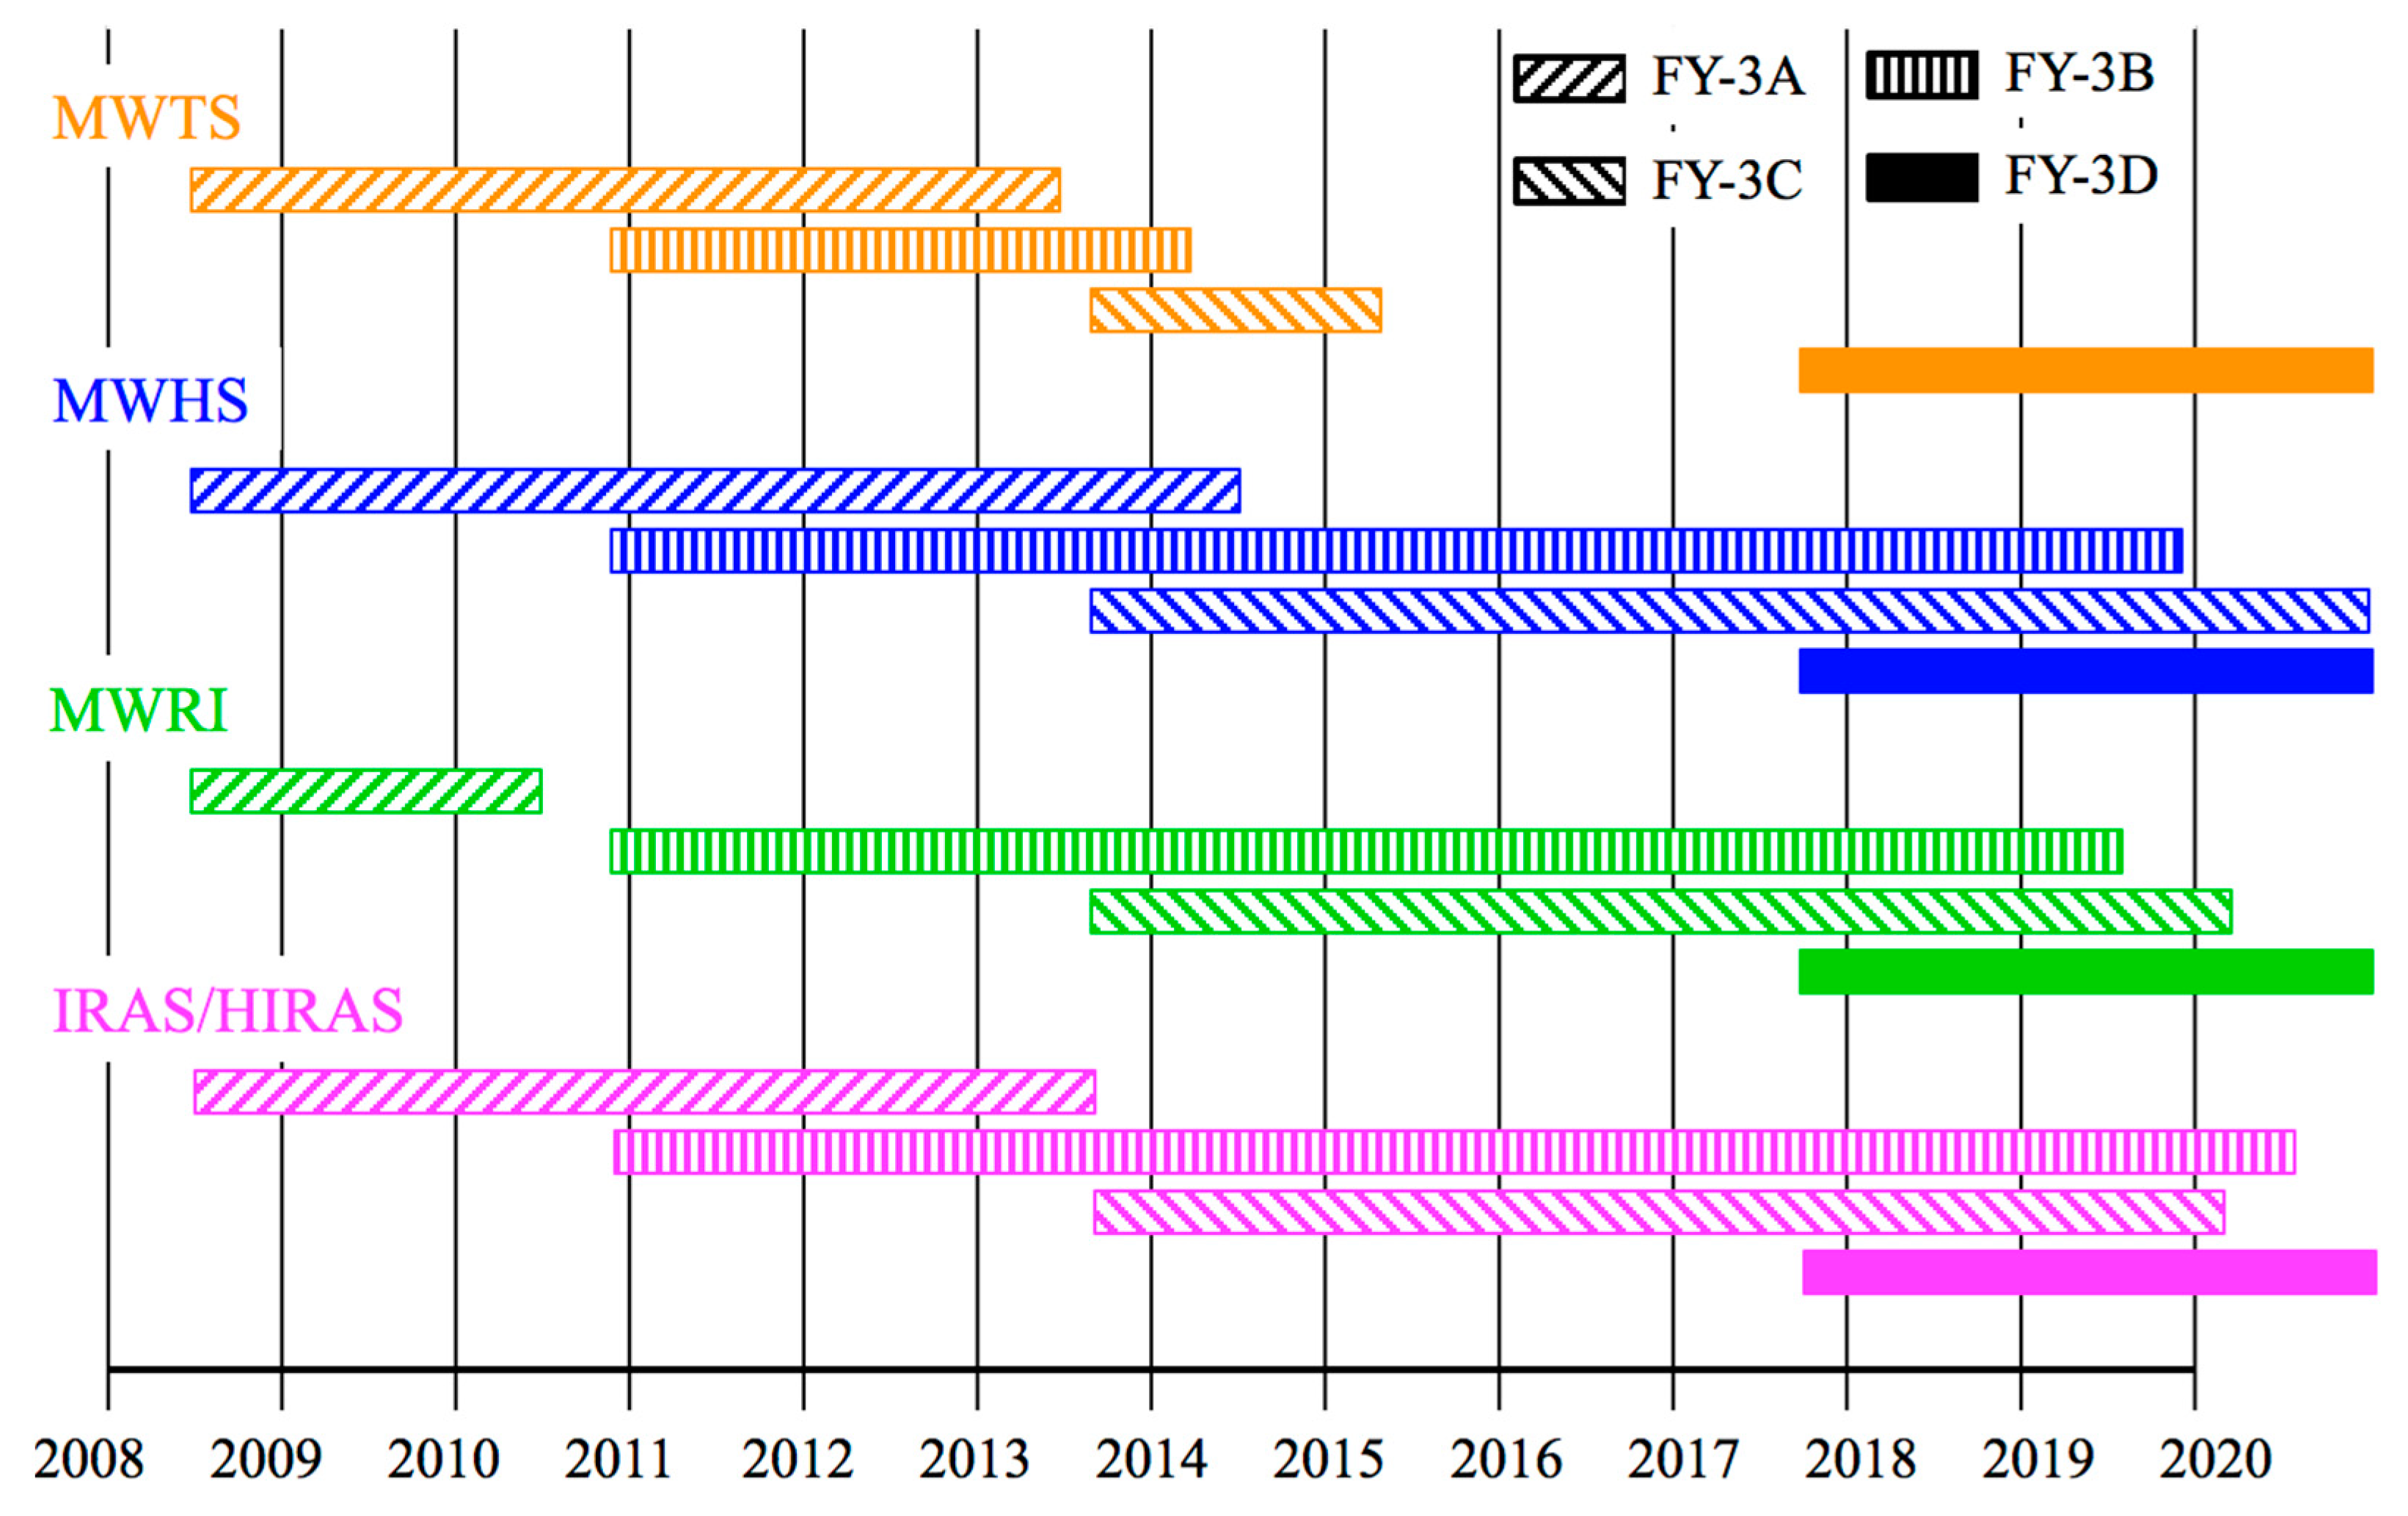
The Chinese FY-3 POES series are achievements of independent research and development in China. Figure 2 shows the lifetimes of FY-3A/B/C/D MWTS, MWHS, MWRI and IRAS/HIRADS from 2008 to 2020. MWHS and IRAS/HIRAS have continuous data from 2008 to 2020. This is important for establishing satellite climate data records involving FY-3 in the future [16]. A single satellite has a limited 5–10-year life span. However, MWTS onboard FY-3C and MWRI onboard FY-3A worked for only about two years. As a result, MWTS has a large gap from 2015 to 2017, and MWRI has a small gap in 2010. The lifetimes of MWHS onboard FY-3A/B/C are consistently longer than both MWTS and MWRI.
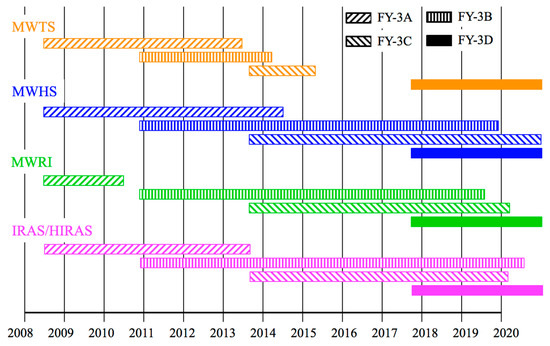
Figure 2.
The instrument lifetime of FY-3 MWTS, MWHS, MWRI and IRAS/HIRAS from http://satellite.nsmc.org.cn/PortalSite/Data/DataView.aspx (accessed on 11 February 2021).
The MWTS onboard FY-3A/B is a four-channel cross-track scanning radiometer that is similar to the MSU on board the early NOAA satellites from Television and Infrared Observation Satellite (TIROS)-N through NOAA-14 from 1979 to 2007. Except for lacking two window channels located at 23.8 GHz and 31.4 GHz, the MWTS onboard FY-3C/D has 13 channels located at atmospheric oxygen absorption band near 50–60 GHz and is similar to the AMSU-A onboard NOAA-15, -16, -17, -18, and -19, and the European Organization for the Exploitation of Meteorological Satellites (EUMETSAT) MetOp-A/B/C. The MWHS onboard FY-3A/B/C/D is similar, but not identical, in channel specification to MHS onboard NOAA-15 to 19 and MetOp-A/B/C satellites. The center frequencies of three MWHS sounding channels located at the 183 GHz water vapor absorption line are the same as MHS. The MWHS has two window channels located at 150 GHz with horizontal polarization and vertical polarization [17], while MHS’s two window channels are located at 89 and 157 GHz with single polarization. MWRI has most of the frequencies of the AMSR-E, the U.S. Naval Research Laboratory launched the WindSat radiometer on the Department of Defense Coriolis satellite [18], and the successor of AMSR-E, i.e., AMSR-2, on board the Global Change Observation Mission 1st-Water (GCOM-W1) satellite [19]. The HIRAS onboard FY-3D is the first Chinese hyperspectral infrared sounder, a spaceborne Fourier transform spectrometer with 2275 spectral channels. It is similar to the AIRS, the Infrared Atmospheric Sounding Interferometer (IASI) onboard the EUMETSAT Polar System’s three polar-orbiting meteorological satellites MetOp-A/B/C [20], and the Cross-track Infrared Sounder (CrIS) onboard the Suomi National Polar-Orbiting Partnership (S-NPP) and NOAA-20 satellites [21].
Since the FY-3 series was the first series of a digital meteorological satellite that can provide observed values of brightness temperature to NWP, it is important to carefully examine the FY-3 data quality. For this reason, with her colleagues, the author conducted a series of scientific research studies on FY-3 data over the past 10 years, and documented their findings in a total of 22 papers in refereed journals (Figure 3). The published works on bias characterization, striping noise mitigation and cloud detection of FY-3 MWTS, MWHS, MWRI and HIRAS observations are briefly reviewed in the next section.

Figure 3.
Publication history of researches on FY-3 observations from MWTS, MWHS, MWRI and HIRAS. The citing number of each publication in the reference list is indicated in parentheses.
4. Quality Assessments and Improvements of FY-3 Observations
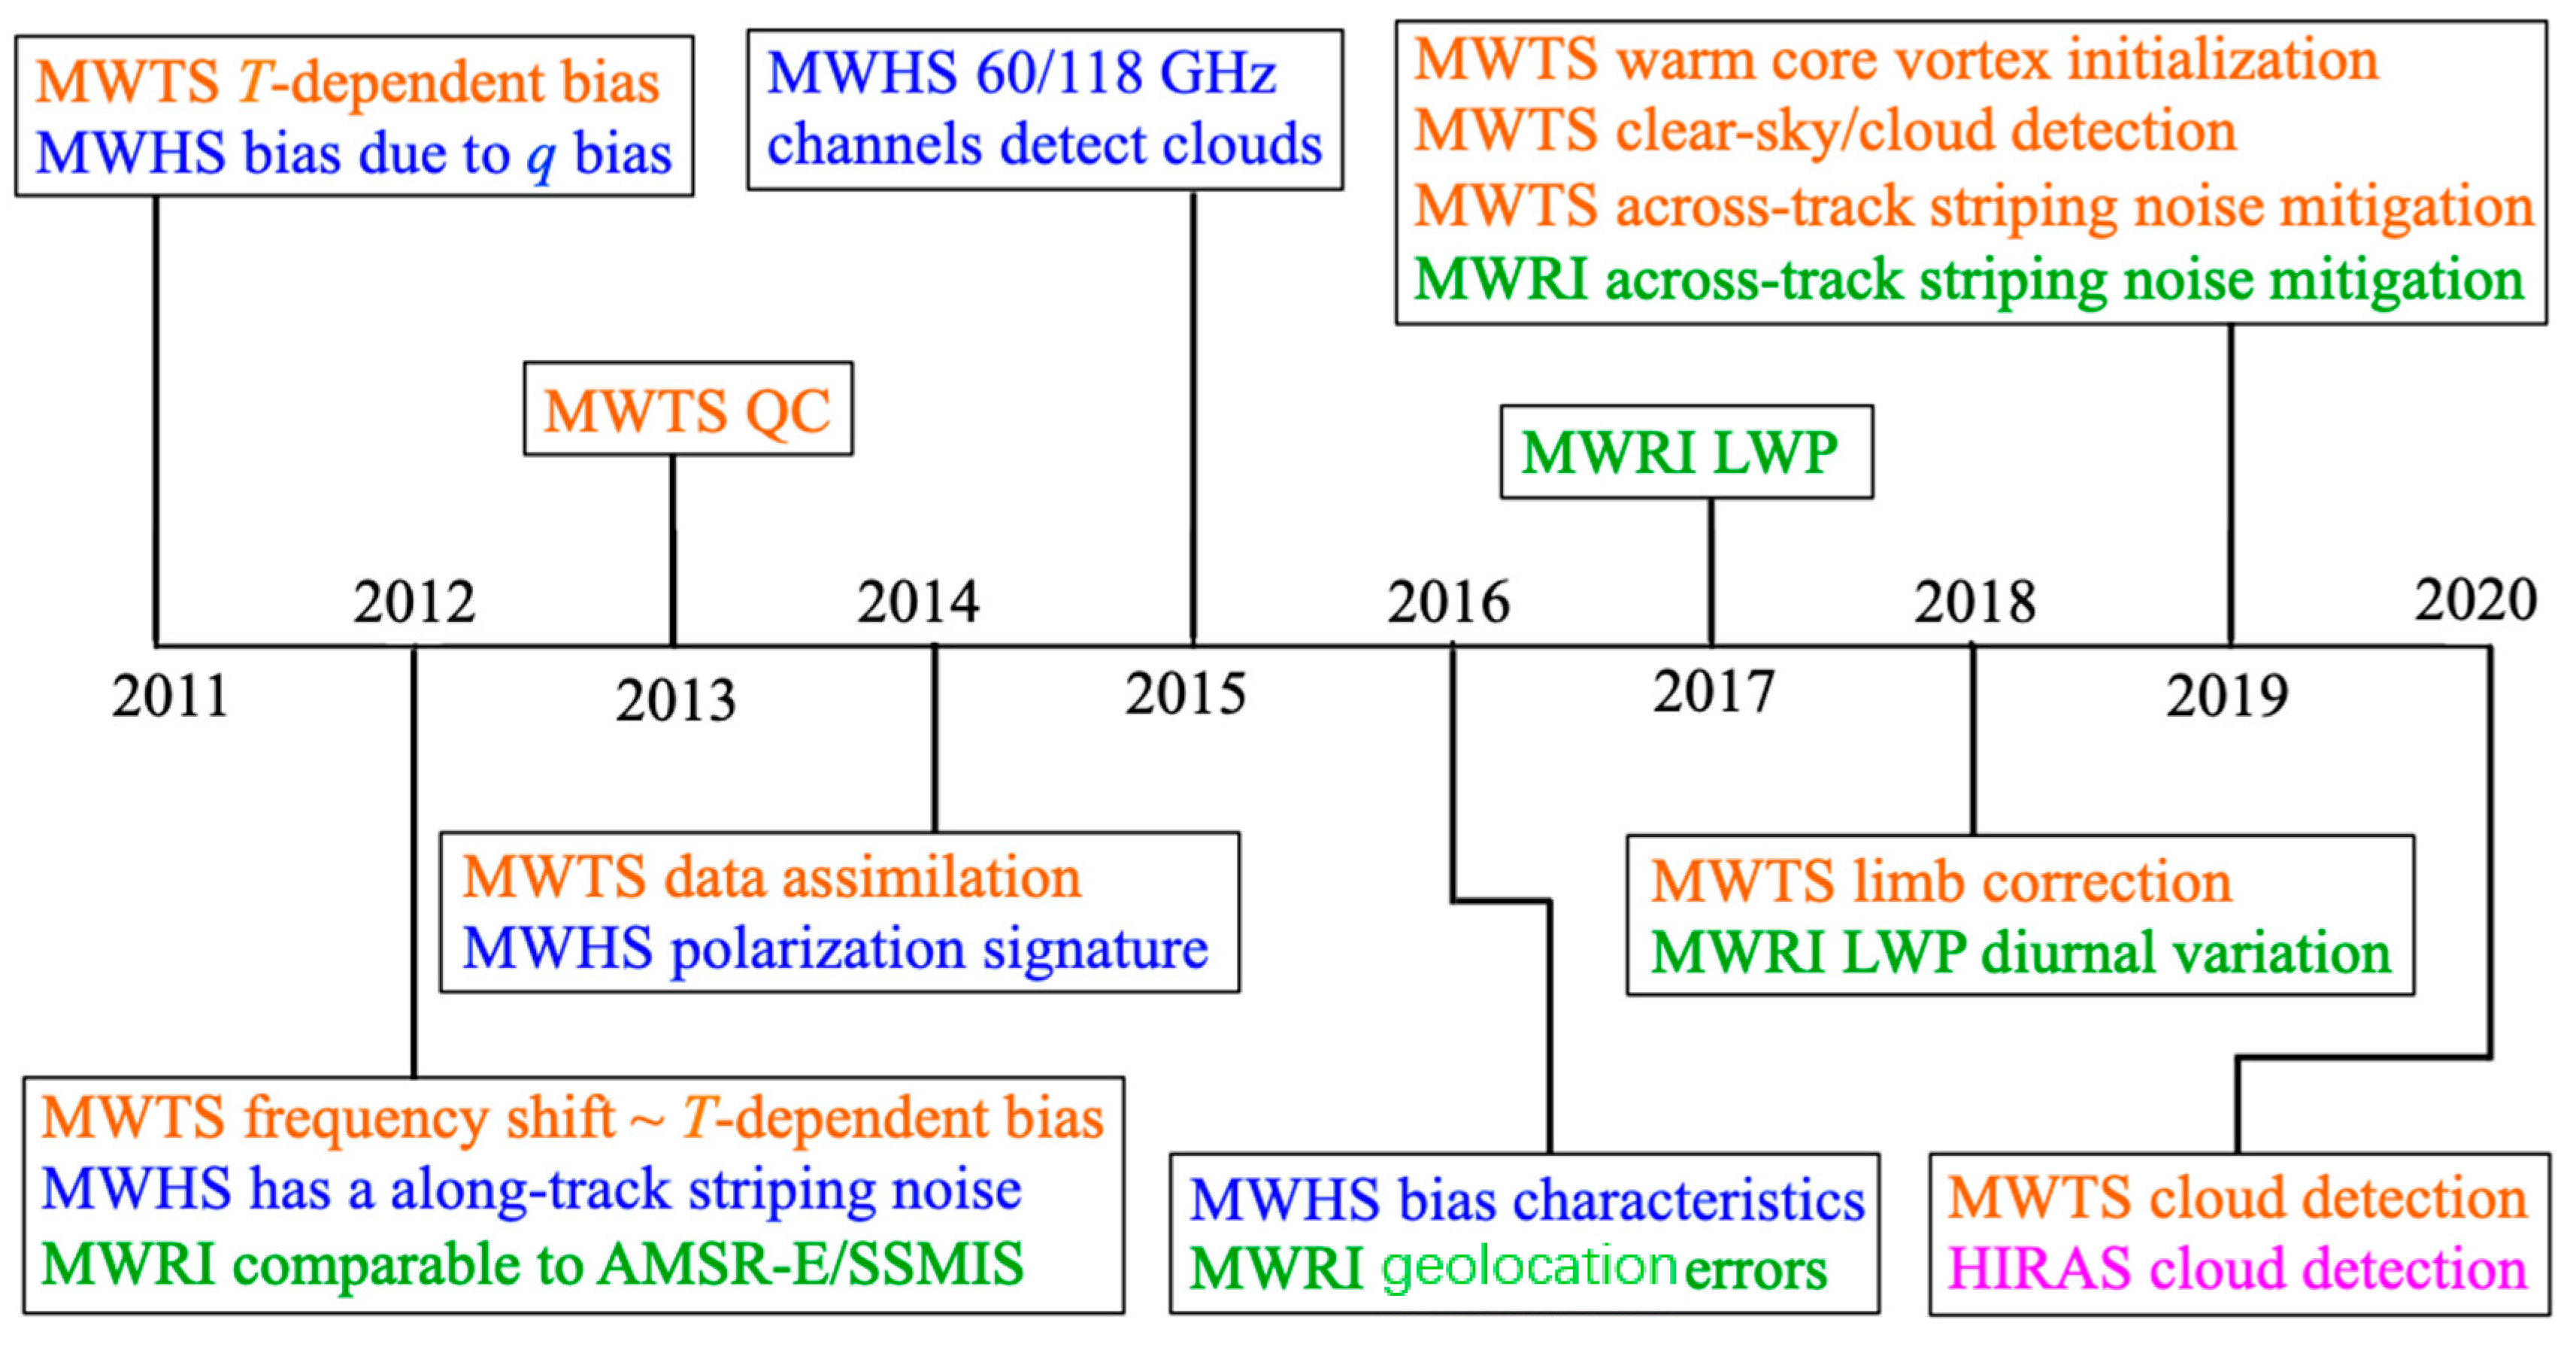
Our studies of FY-3 observations over the past 10 years mainly covered the following topics: (i) bias characterization and estimate for MWTS and MWHS sounding channels, (ii) detection and mitigation of striping noise, (iii) detection of RFI signals in the 10.65-GHz MWRI channel, (iv) estimate and improvement of geolocation accuracy for MWRI data, (v) cloud detection for MWTS and HIRAS data, (vi) liquid water path (LWP) retrievals for MWTS/MWHS combined and MWRI data, (vii) quality control for MWTS data assimilation, and (viii) limb correction and warm core retrievals for monitoring and vortex initialization of tropical cyclones (TCs). The major topics addressed in each year’s papers shown in Figure 3 are briefly highlighted in Figure 4 and summarized below.
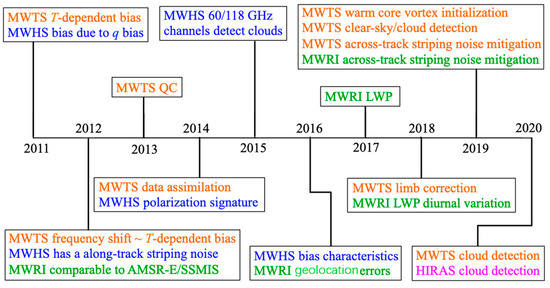
Figure 4.
Highlights of topics addressed in the 22 publications on FY-3 observations from MWTS, MWHS, MWRI and HIRAS. “ q ” represents the specific humidity.
4.1. Bias Characterization and Estimate of MWTS and MWHS Data
Measurements of MWTS and MWHS antenna temperature are converted from the “raw” measurements of digitized calibration counts of earth scene (Ce) by the following radiometer transfer function [2]:
where
and
represent the measured cold space and warm target calibration counts, respectively,
is the cosmic radiometric temperature (e.g., 2.728 K),
is the warm target temperature, and
is the peak nonlinearity at x = 0.5. The value of
is obtained by pre-launch thermal vacuum test data. Therefore, residual nonlinearity could introduce temperature-dependent biases of satellite observations. In addition, both MWTS and MWHS are cross-track microwave radiometers and their measurements are provided at a single polarization for each channel. However, pure vertical or horizontal polarization measurements only occur at the nadir position. Measurements obtained by Equation (1) at non-nadir positions represent a mixed contribution from both vertical and horizontal polarizations. Therefore, polarization approximation could also introduce scan-dependent biases of satellite observations. At large scan angles, the Earth scene radiation can be contaminated by spacecraft radiance reflection and emission from the antenna sidelobes, introducing additional biases at large scan angles.
In dealing with satellite data, the truth is not available and the biases are estimated based on a large sample of the differences of brightness temperature between satellite observations (O) and simulations (B) calculated by the radiative transfer model (H) based on NWP model fields (x):
While the limb effect of cross-track radiometers is modeled in forward radiative transfer models, higher atmospheric inhomogeneity of atmospheric temperature and cloud within the fields-of-view (FOVs) at larger scan angles cannot be fully simulated, nor the sidelobe effect by the spacecraft radiance reflection and emission at large scan angles. Surface temperature, surface emissivity. rain, etc., can also affect limb-darkening correction for cross-tracks microwave radiometers, especially for the window and surface-sensitive low tropospheric channels. All of which could introduce scan-dependent biases in O-B. Fortunately, we only need to estimate the difference
, instead of
and
separately, in satellite data assimilation [6].
We may express each observation as
, where t is time,
is longitude,
is latitude and
is scan angle. A practical way to estimate
is to separately estimate latitudinal-dependent bias () and scan-dependent bias (μ(α)):
Set
. Impacts of cloud contamination on bias estimate are removed by selecting those data in clear-sky conditions based on cloud-sensitive data from the same (see Section 4.3) or foreign instruments. In References [9,18,19], an MWTS FOV with 5% cloud fraction is regarded as a clear-sky data point, where the cloud fraction is provided by the visible/infrared instrument called the Medium Resolution Spectral Imager (MERSI) on board FY-3A. For AMUS-A, clear-sky conditions are defined by LWP < 0.05 kg m−2.
The biases of the FY-3A MWTS observations of brightness temperature were estimated and compared them with those of the AMSU-A observations from NOAA-18 satellite [22]. They found a major difference between the two instruments: the MWTS biases in channels 3 and 4 are negative in low latitudes and positive in high latitudes, while the AMSU-A biases are negative in all latitudes. A detailed analysis of the data revealed that such a difference is due to the fact that MWTS biases vary with the scene temperature, while the AMSU-A biases are independent of the scene temperature. The temperature dependence of MWTS bias appears as a latitudinal dependence (i.e.,μ(φ)).
The root cause of the temperature dependence of MWTS bias was found to arise from a central frequency shift from each of the designed band central frequencies of 50.3, 53.6, 54.9, and 57.3 GHz for the three upper level sounding channels (i.e., MWTS channels 2, 3, 4) after the satellite was launched into orbit [23,24]. This was confirmed by Wang et al. (2012) [23], who showed that the mean difference of the brightness temperature simulations with
()
and without
()
, incorporating the frequency shifts into the radiative transfer model resembled the temperature dependence of MWTS O-B biases. Therefore, FY-3A MWTS data can still be made useful for NWP applications by incorporating the new passband parameters into the radiative transfer models employed in MWTS data assimilation. For climate applications, by subtracting the mean difference
(), the FY-3A MWTS observations of
can be linked to MetOp-A/NOAA-18 AMSU-A data to establishing satellite climate data records [25].
A bias estimate was also conducted for FY-3A MWHS data [26]. The measurements from FY-3A MWHS were compared to the MHS data from NOAA-18 under various atmospheric and surface conditions. Using the six-hour forecast fields of the NCEP Global Forecast System (GFS) for simulations (B), Guan et al. (2011) [26] found that the global bias and standard deviation of O-B from MWHS brightness temperatures are comparable in magnitudes to those of MHS measurements. There was a positive O-B bias in the MWHS/MHS channel 3 and a negative O-B bias in the MWHS/MHS channels 4 and 5. Through sensitivity experiments, it was hypothesized that the positive O-B bias in the MWHS/MHS channel 3 could arise from a wet bias in the NCEP GFS input profiles in the upper troposphere, and the negative biases MWHS/MHS channels 4 and 5 data over land may arise from errors mostly in surface emissivity and partially a smooth input model terrain to model simulations.
Zou et al. (2012) [27] calculated the scan biases and found a scan-angle-dependent cohesive noise in MWHS channels 3–5, i.e., nearly constant at a fixed FOV. This noise did not cancel out when a large amount of data over a sufficiently long period of time was averaged, making the scan biases oscillate at a wavelength around 2.5 FOVs. The magnitude of the noise is around 0.2–0.3 K. Zou et al. (2012) [27] proposed a method to remove such noise. The MWHS cohesive noise was primarily contained in the first principal component (PC) mode. The first PC accounts for more than 99.91% total variance in the three MWHS sounding channels. A five-point smoother was applied to the first PC in the across-track direction, with a three-point average for the edge points. It effectively removed the noise signals with their wavelength centered around 2.5 FOVs. The scan-angle-dependent bias from the reconstructed MWHS data became smooth and was consistent with the NOAA-18 MHS data.
Biases can also be quantified using GNSS radio occultation observations for generating simulations of brightness temperature (i.e., B) because GNSS radio occultation observations have high accuracy, high precision, high vertical resolution, no cloud contamination, no requirement of system calibration, and no instrument drift [28]. Of the 12 channels of FY-3C MWHS, eight are located near the 118-GHz oxygen absorption band. FY-3C MWHS was the first satellite in the world to provide observations at 118 GHz. The MWHS calibration accuracy for the five upper level sounding channels 2–9 located near the 118-GHz oxygen absorption band was assessed using the collocated Constellation Observing System for Meteorology, Ionosphere, and Climate (COSMIC) radio occultation data in clear-sky conditions from August 2014 to February 2015 [29]. It was found that the bias of MWHS data relative to COSMIC RO simulation ranges within ±1.5 K and is channel-dependent.
These studies [13,22,23,26,27,29] on MWTS and MWHS bias estimate and analysis demonstrated the utility of using a well-calibrated mature microwave radiometer like AMSU-A or MHS as a reference for the assessment of a new instrument MWTS or MWHS with the same model fields as inputs for forward radiative transfer simulations.
4.2. Striping Noise, RFI and Geolocation Errors of MWRI Data
Extensive on-orbit calibrations and validations were carried out before the MWRI brightness temperature observations were delivered to users [30]. However, striping noise, RFI and geolocation errors were found to exist in the MWRI brightness temperature observations.
A noticeable striping noise was found to exist in brightness temperature observations from the MWRIs onboard the FY-3B, FY-3C, and FY-3D satellites. Dong and Zou (2019) [31] applied a destriping method similar to the one proposed by Zou et al. (2017) [32] for removing the striping noise in the Advanced Technology Microwave Sounder (ATMS) observations. The main ideas for the ATMS destriping method are summarized below.
Striping noise was found in the O-B differences of brightness temperature between observations and model simulation observations of ATMS upper-level temperature sounding channels [33,34]. The striping noise appears constant along a scan line but has a random magnitude in the along-track direction. Qin et al. (2013) [34] proposed to first isolate scan-dependent features including the cross-track striping from the atmospheric signal using the principal component (PC) decomposition, and then to extract the along-track random noise using an Ensemble Empirical Mode Decomposition (EEMD). The first PC mode mainly describes a scan-dependent feature of cross-track radiometer measurements and the first PC component captures the striping noise. The PC coefficient of the first PC mode exhibits a high-frequency random noise in the along-track direction. The first three high-frequency intrinsic mode functions can be extracted by the EEMD method and removed from the data. The magnitude of the ATMS striping noise is about ±0.3 K for the temperature sounding channels and ±1.0 K for the moisture sounding channels. The magnitude of the striping noise is similar for upper-level temperature sounding channels. However, this PCA/EEMD method for striping noise mitigation only works for upper-level temperature sounding channels. It is worth mentioning that striping noise was also found in MWTS observations [35]. In fact, the magnitude of the MWTS striping noise is significantly higher than that detected in ATMS observations.
For ATMS window and surface-sensitive channels (channels 1–5 and 16–18), artifacts are generated in the destriped observations at places where ATMS scanlines are aligned with either coastline curves or the edges of deep clouds. At these places, there is a sharp gradient of brightness temperature of these channels in the along-track direction when ATMS Earth scenes change from ocean to land or clear-sky to deep clouds and vice versa for the along-track. Accordingly, the PC coefficient of the first few PC modes experiences a big jump at these places, which could be misinterpreted as part of the high-frequency noise. To eliminate such impacts of the along-track sharp gradients of brightness temperature at places where ATMS scanlines are aligned with either coastline curves or the edges of deep clouds, an additional step was added to the above PCA/EEMD method [32]. The modified destriping method performed well in reducing the striping noise at the ATMS window channels without introducing the artifacts to the destriped brightness temperature fields.
Since the central frequencies of all FY-3 MWRI channels are in the atmospheric window region, Dong and Zou (2019) [31] applied the same method to FY-3 MWRI data as the one proposed by Zou and Dong (2017) [32] for the ATMS window and surface-sensitive low-level sounding channels. Their study not only showed a successful destriping for MWRI data, but also revealed that the magnitude of the striping noise in the brightness temperature observations of MWRI channels 10 was significantly reduced. They also pointed out that striping noise features, if not removed, appeared in the LWP retrieval product, with a non-negligible difference of 0.07 kg m−2 with and without applying striping noise mitigation.
The MWRIs onboard the FY-3 satellites have ten channels at five frequencies at 10.65, 18.7, 23.8, 36.5, and 89.0 GHz, with dual channels at vertical and horizontal polarization states, respectively. The RFI is another type of observation error found in FY-3 MWRI brightness temperatures at 10.65 GHz (X-band) over land. This refers to satellite microwave thermal emission mixed with signals from the active sensors, such as radar technologies used in civil, military, and government institutes for weather monitoring, air traffic control, garage remote control, GNSS on the highway, defense tracking, and vehicle speed detection for law enforcement. Thus, the MWRI X-band operates in unprotected frequency bands, and the natural thermal emission of the Earth can be easily obscured by signals from these active microwave transmitters. Since the RFI only occurs in the lowest frequency channels, natural radiations make measurements of all the channels correlated, the RFI signals are, in general, detectable from a spectral difference method and a principal component analysis (PCA) method. Early examinations of AMSR-E data showed evidence of extensive RFI signals in brightness temperature measurements at low-frequency (e.g., C-band and X-band) channels [36,37]. However, both the spectral and PCA methods cannot detect RFI reliably over frozen grounds and scattering surfaces, where the brightness temperature difference between 10.65 and 18.7 GHz is large.
In order to detect the RFI in the FY-3 MWRI data over all surfaces throughout the seasons, Zou et al. (2012) [38] developed a normalized PCA method for RFI detection. The normalized PCA method for the RFI detection algorithm worked well for MWRI data, confirming that the RFI at 10.65 GHz distributed widely over Europe and Japan, and was less prevalent over the United States and China. The RFI detection for the lowest-frequency FY-3 MWRI observations are important for minimizing retrieval errors of those surface parameters involving the 10.65-GHz channels, such as soil moisture, sea surface temperature and snow cover. These retrievals are best carried out with RFI-filtered data.
The third type of FY-3 MWRI observation errors can be caused by geolocation errors. Tang et al. (2016) [39] made an estimation of geolocation errors in the FY-3C MWRI data using the coastline inflection method and reported that the mean geolocation errors in the 89-GHz channels are approximately 5–6 km in along and cross-track directions. Since the geolocation errors were found to be stable, the mean geolocation errors were utilized to adjust the satellite attitude angles (e.g., pitch, roll, and raw) in the instrument coordinate system to correct the geolocation errors. After the attitude angle correction, the MWRI geolocation becomes very accurate at 89 GHz. Geolocation errors in other MWRI channels may be corrected through their co-registration relationships to the 89-GHz channel.
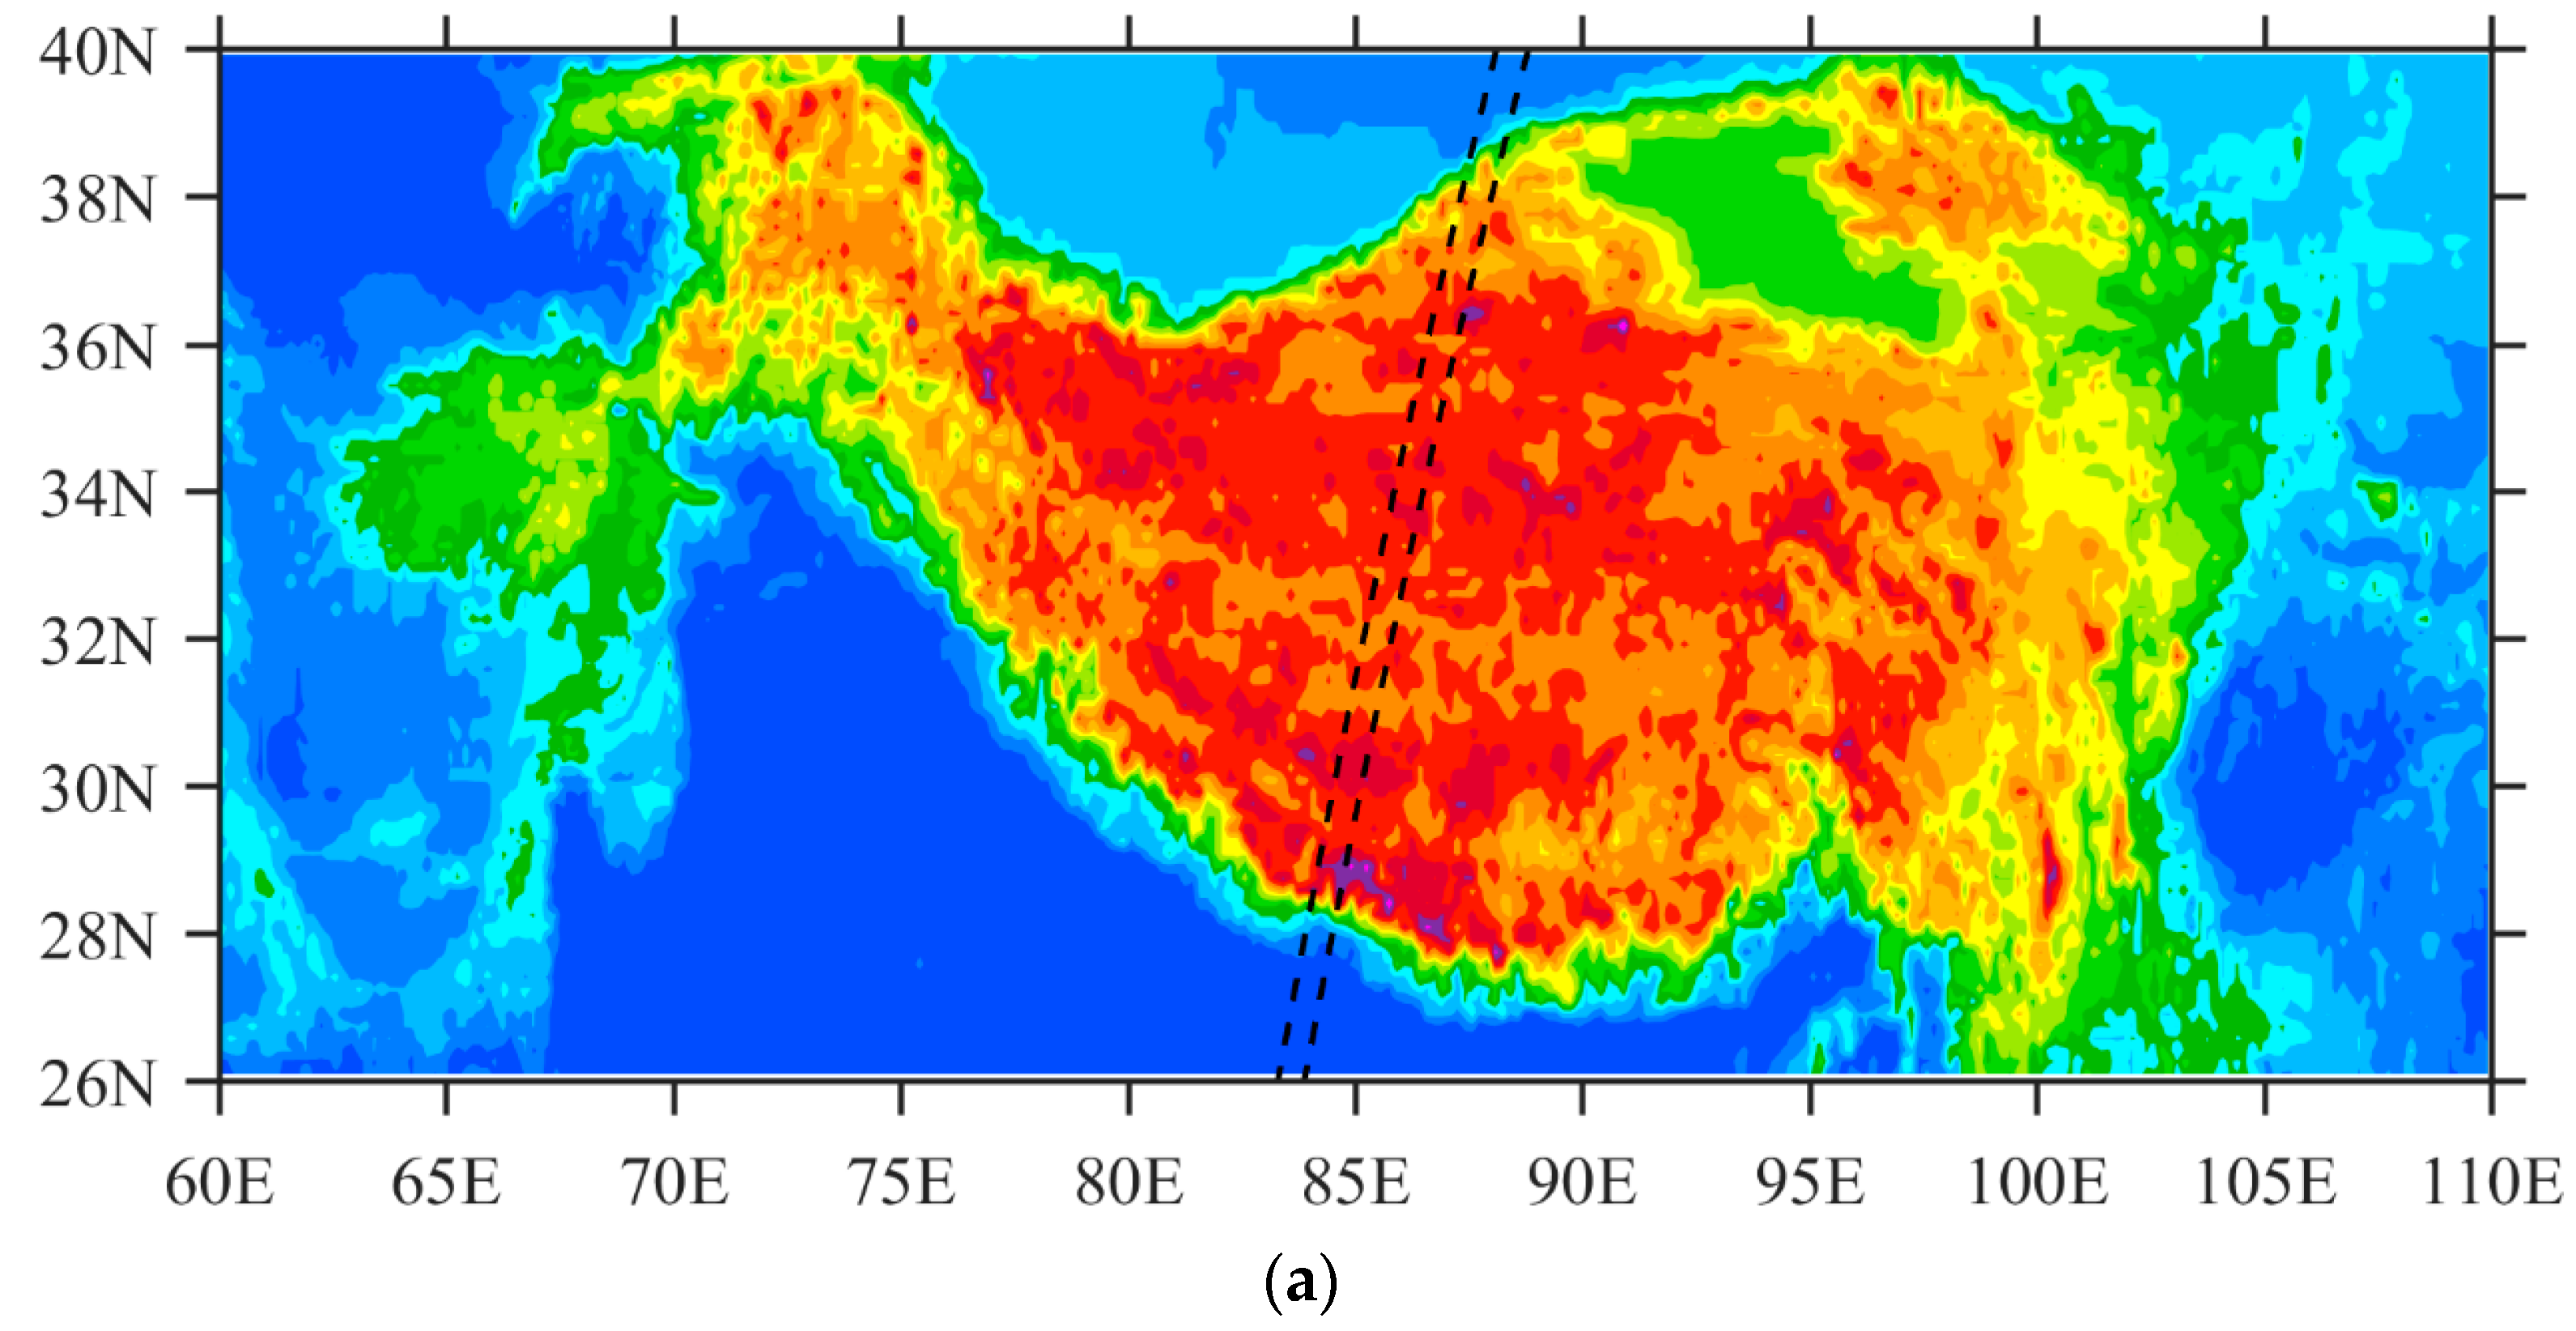
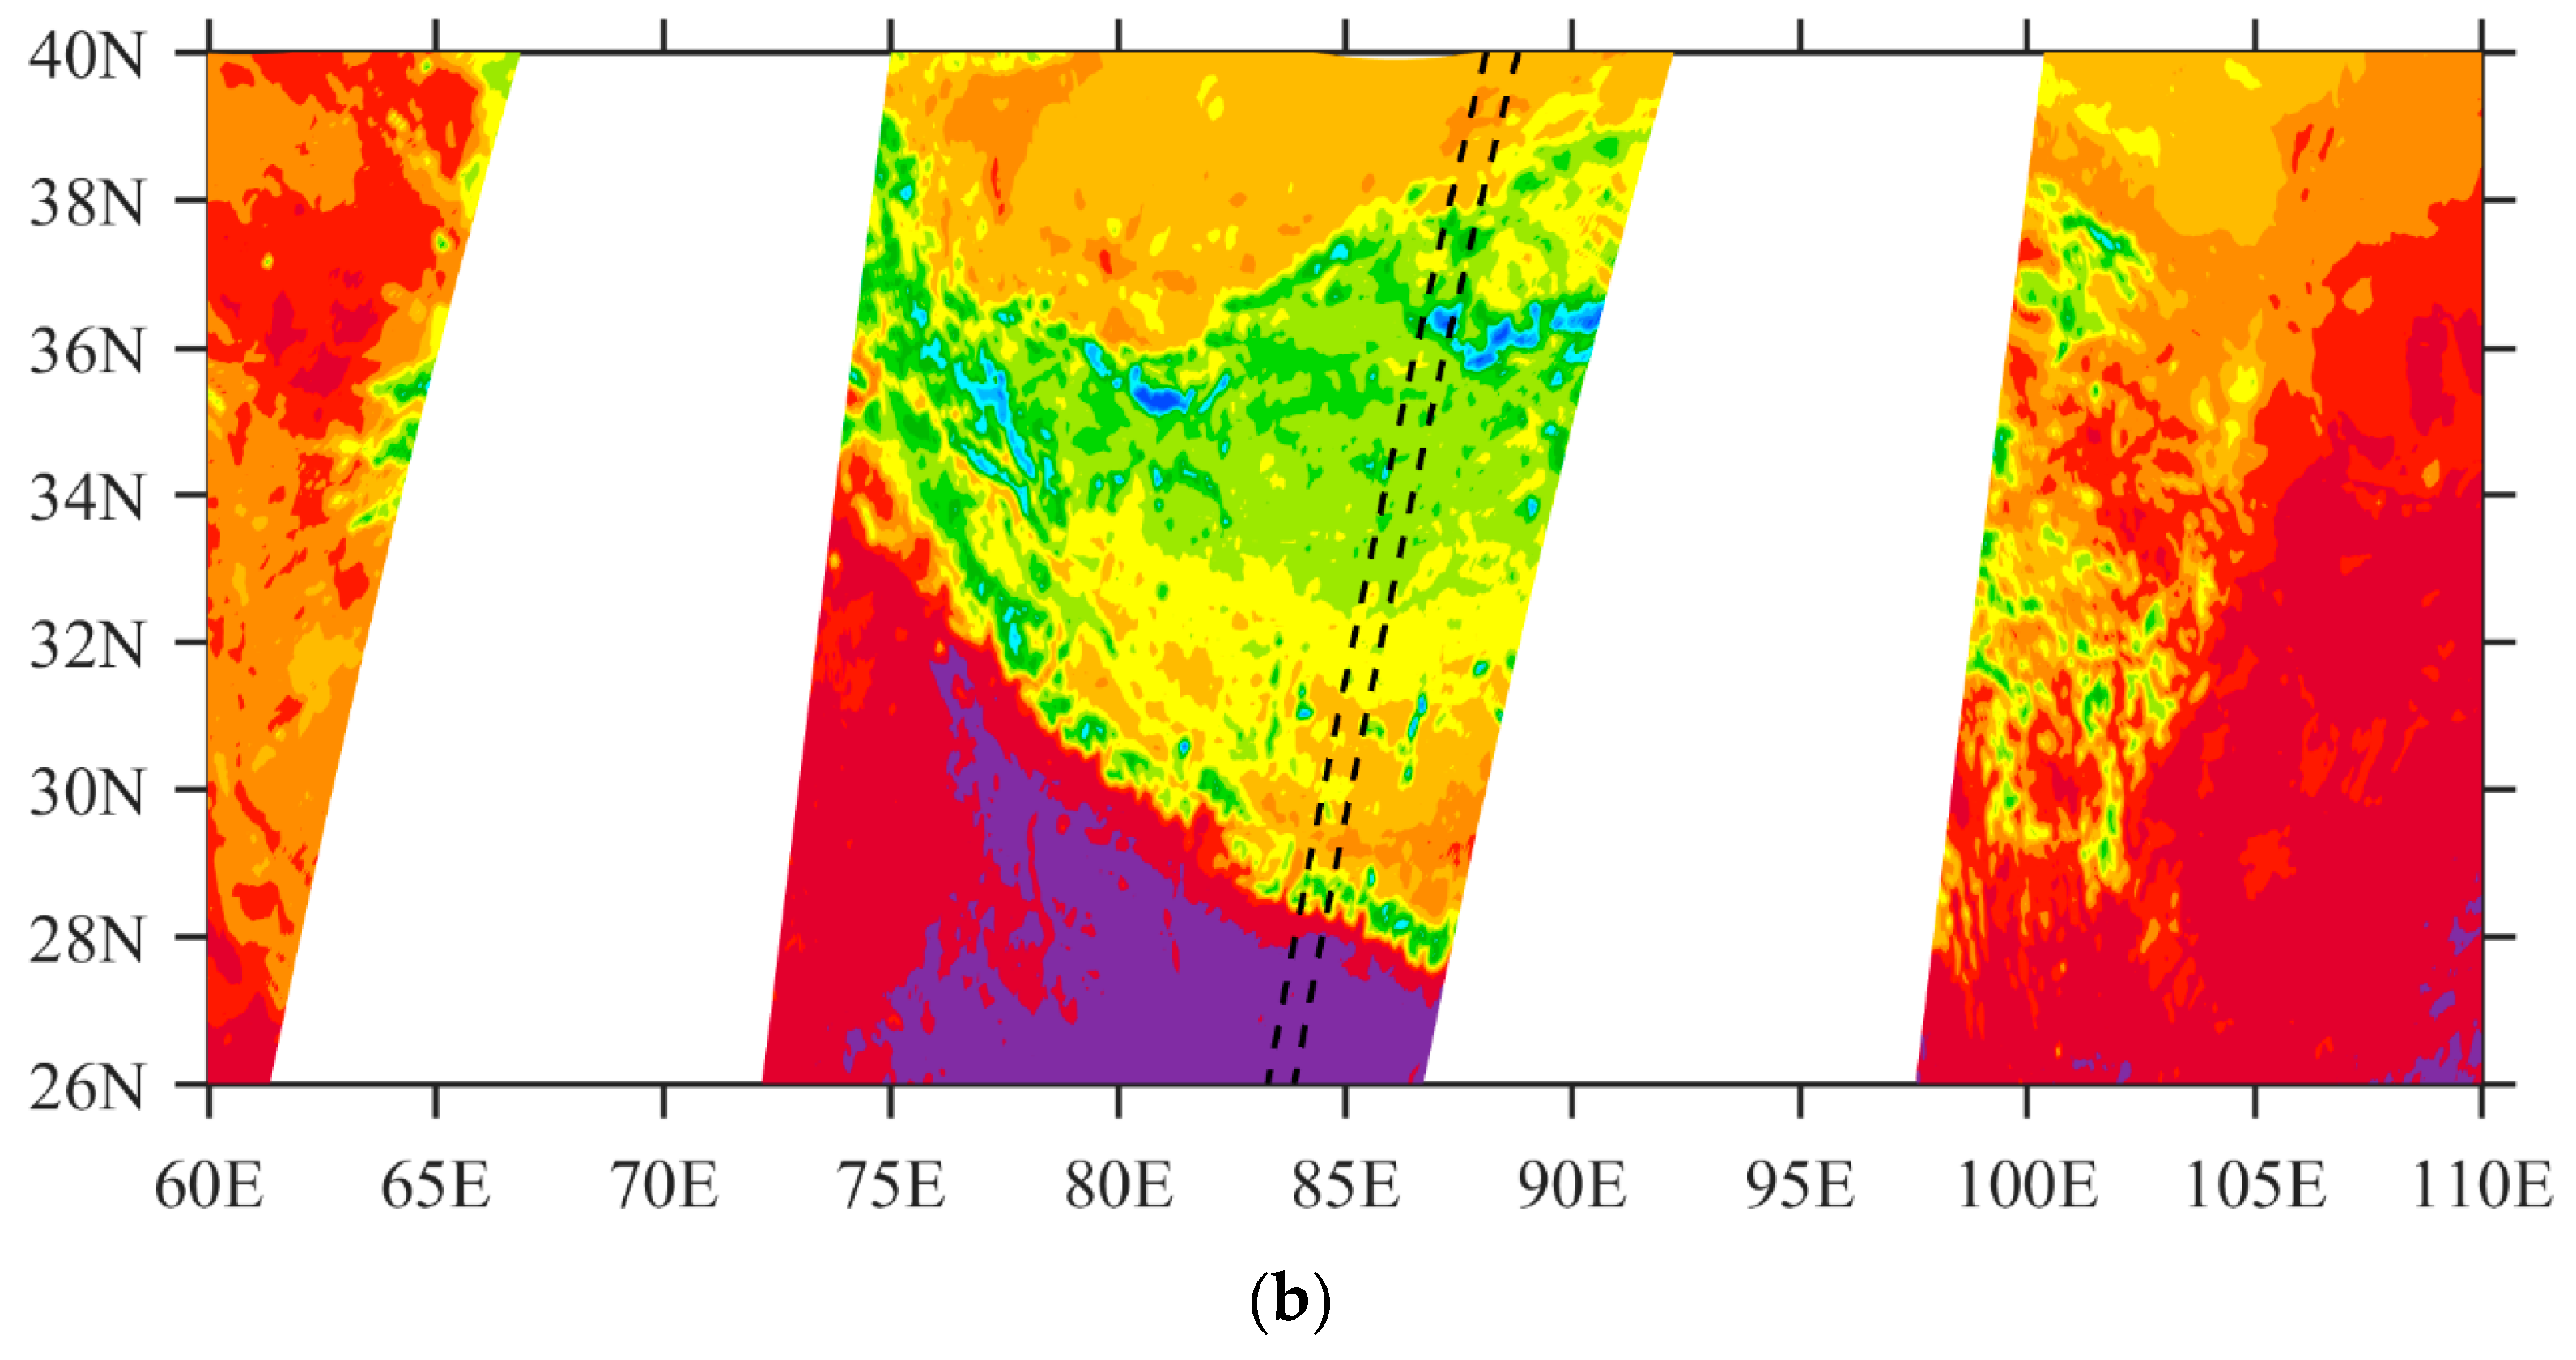
The fields-of-view size of MWRI channels at 89 GHz is 9 × 15 km2. The geolocation errors around 5–6 km are not negligibly small, especially near coastlines and steep terrains. We may illustrate the significance of the correction of the MWRI geolocation errors by showing the spatial distributions of the MWRI observations of brightness temperature over the Tibet Plateau (Figure 5, Figure 6 and Figure 7). A swath of the FY-3C MWRI observations at 0455 UTC 1 January 2014, went over part of the Tibet Plateau from 75°–86° E. As the terrain height increases rapidly from less than 150 m to more than 5 km within a very short along-track distance at the southern edge of the Tibet Plateau (Figure 5a), the observed brightness temperature decreased rapidly from about 270 K to less than 210 K (Figure 5b).
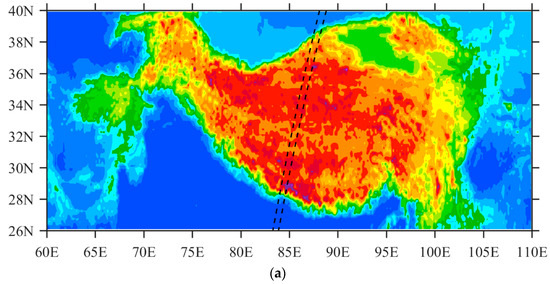
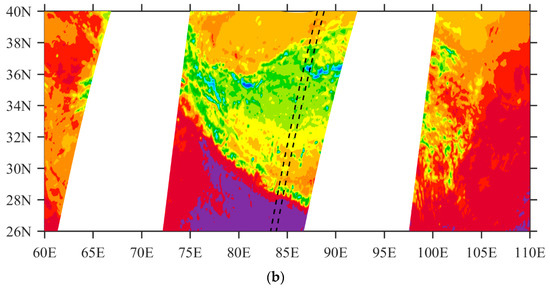
Figure 5.
(a) Terrain height and (b) FY-3C MWRI brightness temperature observations at 89-GHz horizontal polarization at 0455 UTC January 1, 2014, over the Tibet Plateau. Each of the two black-dashed lines connects the center of a fixed number of FOV and the FOVs along the two lines are the neighboring FOVs.
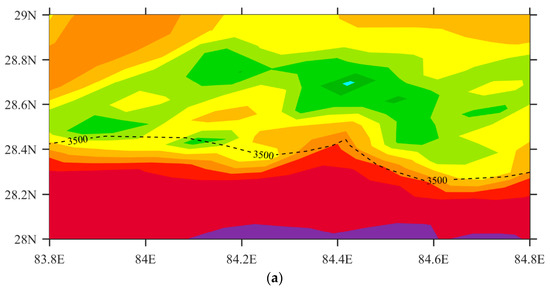
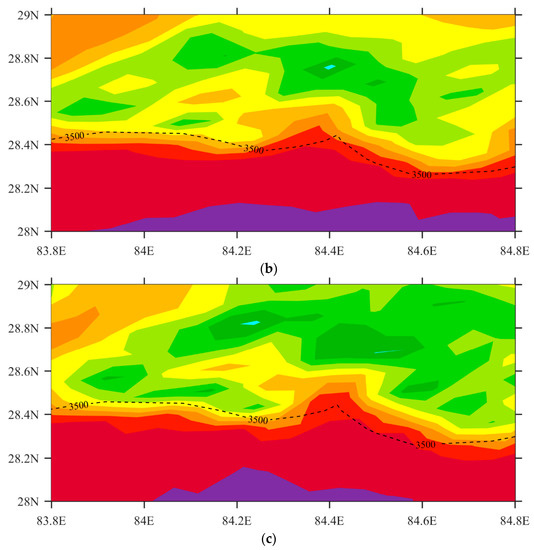
Figure 6.
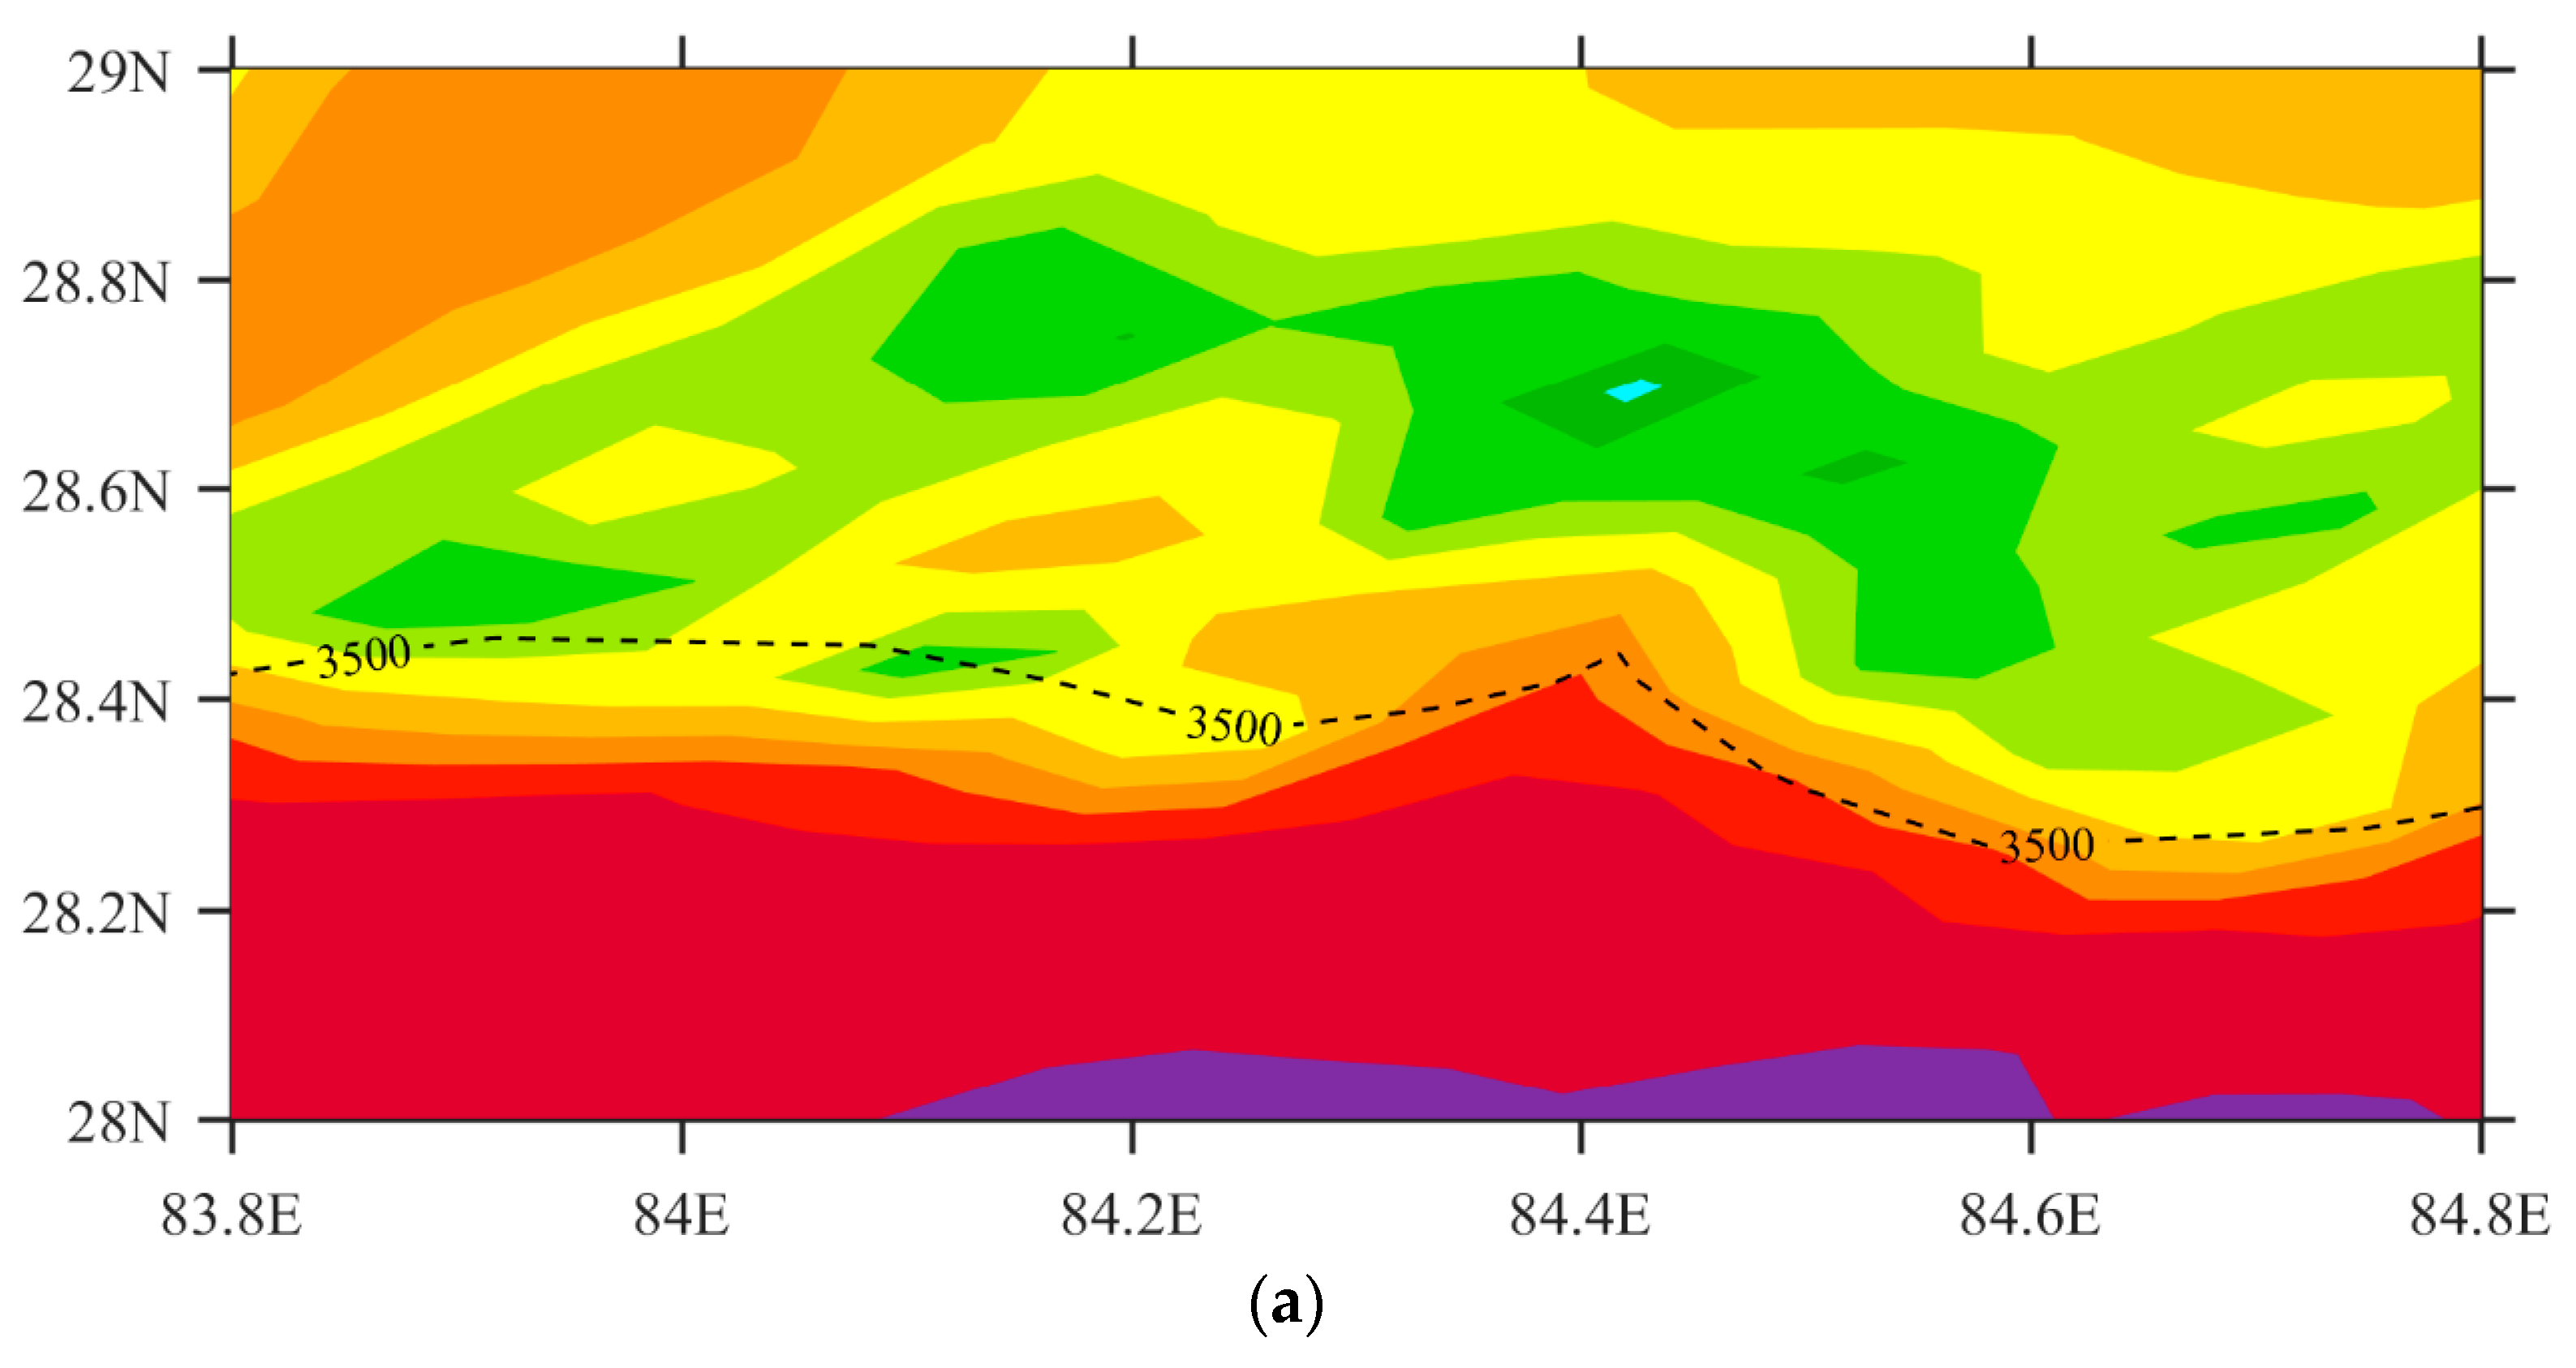
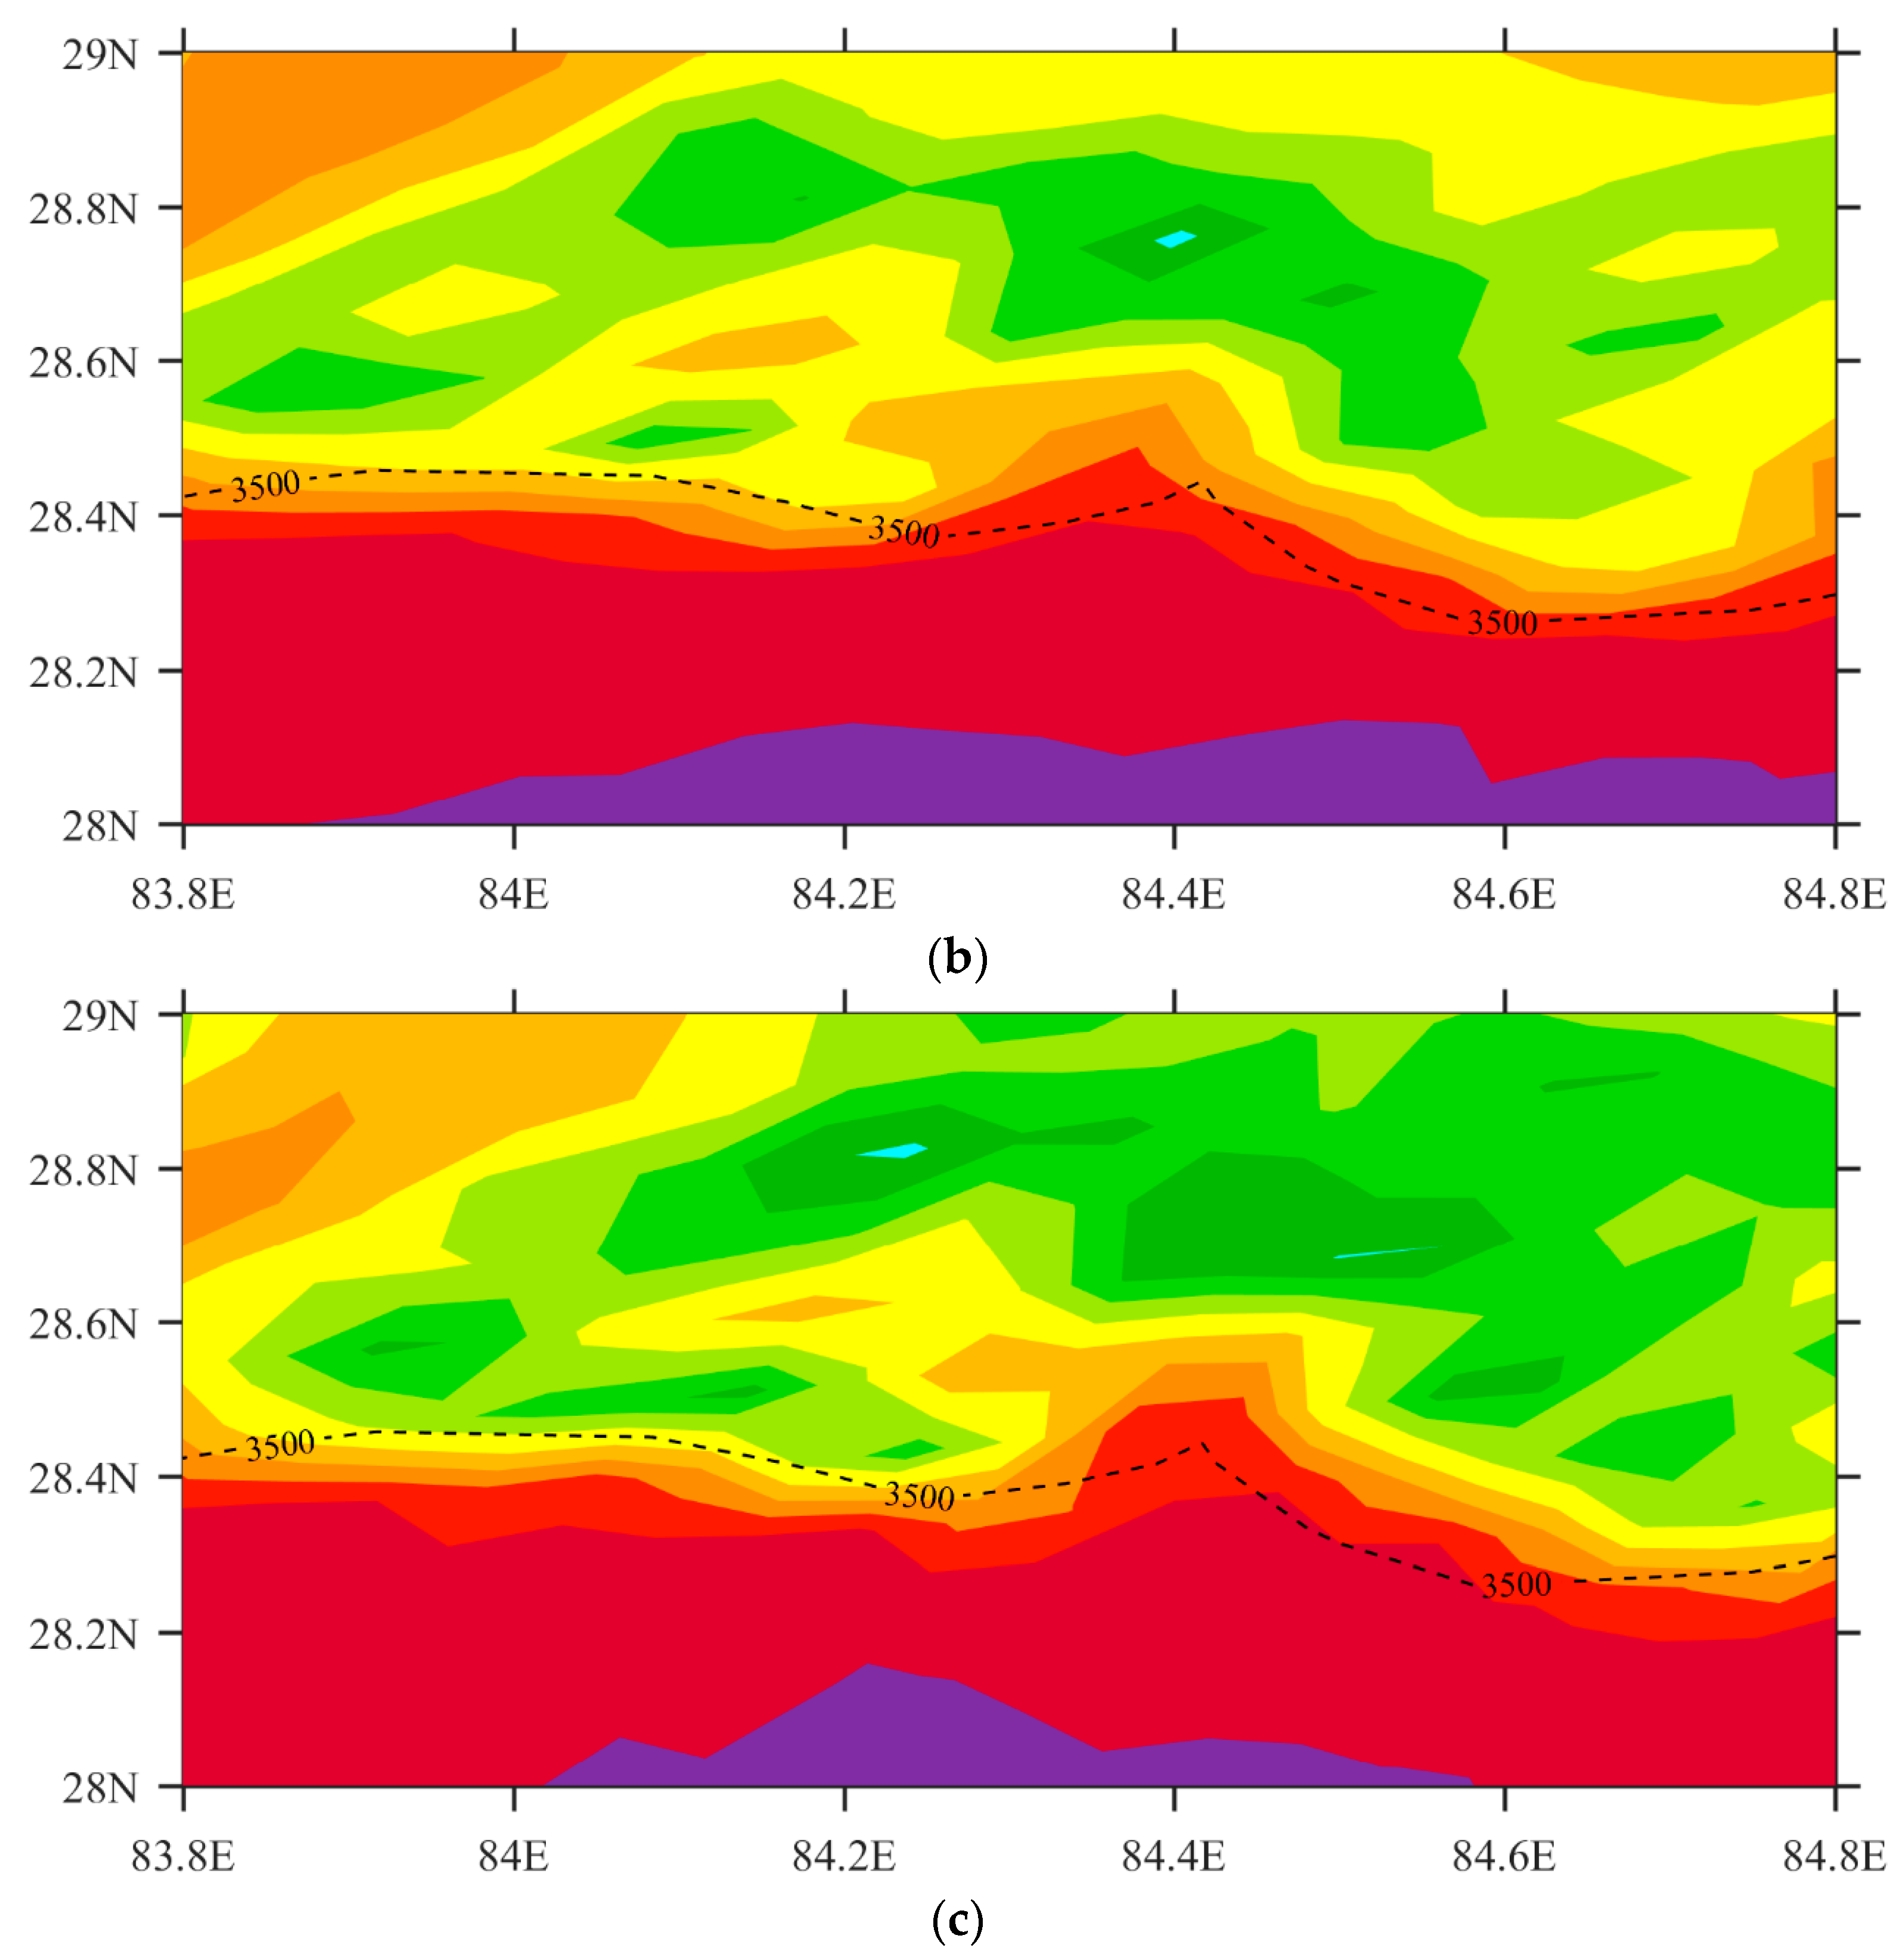
Brightness temperature observations at 89 GHz horizontal polarization (color shading) from FY-3C MWRI (a) before and (b) after geolocation error correction, and (c) GCOM-W1 AMSR-2 at 0455 UTC 1 January 2014 within a small area located at the southern part of the Tibet Plateau. The 3.5 km terrain height is indicated by a black dashed curve.
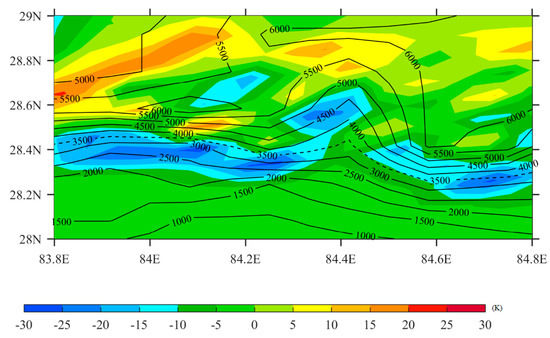
Figure 7.
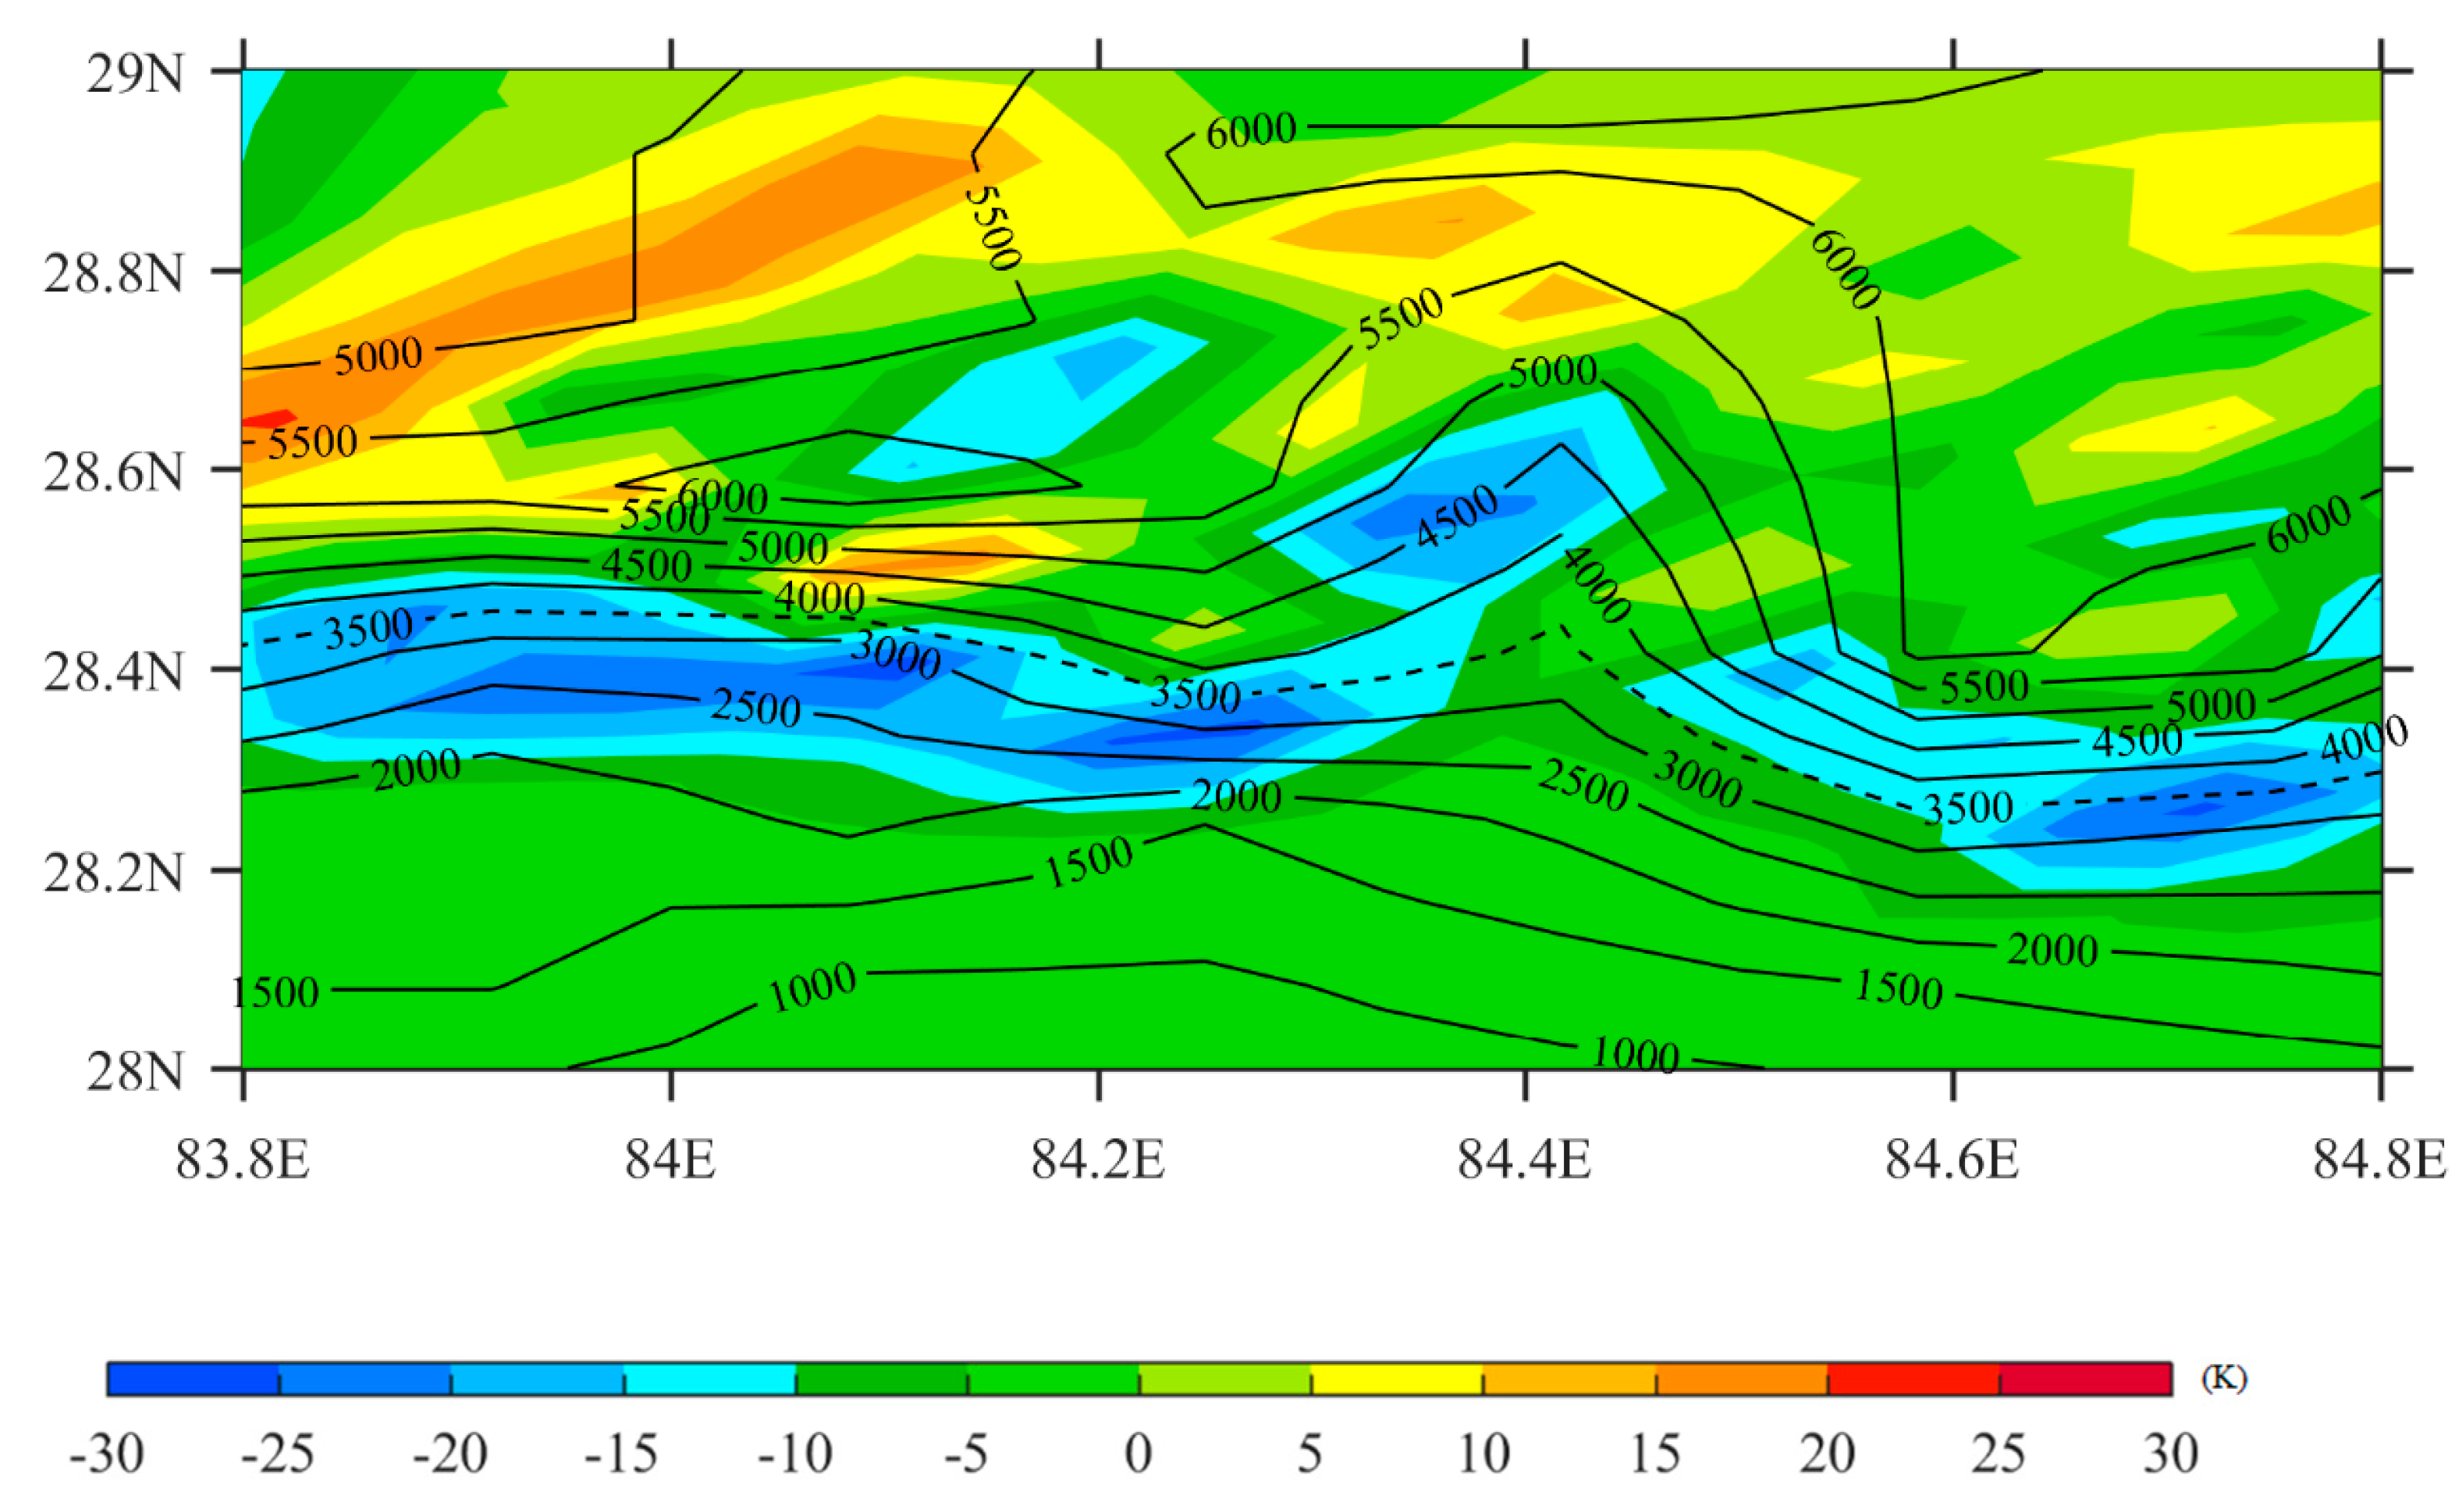
Differences of FY-3C MWRI brightness temperature observations at 89-GHz horizontal polarization (color shading) before (
) and after (
)
geolocation error correction at 0455 UTC 1 January, 2014. The terrain height is indicated by black solid and dashed curves.
We show the spatial distributions of brightness temperature observations within the 1° × 1° area centered at (84.3°E, 28.5°N) before and after the geolocation error correction (Figure 6a,b) and we compared them with the AMSR-2 observations (Figure 6c). As a position reference, the 3.5 km terrain height is indicated by a black dashed curve in Figure 6. The distribution of brightness temperature (Figure 6a) is shifted northward by the geolocation error correction (Figure 6b). The later compares more favorably with AMSR-2 observations (Figure 6c).
Observation differences of brightness temperature between the MWRI and AMSR-2 mainly come from resolution differences between the two microwave imagers. The fields-of-view size of AMSR-2 channels at 89 GHz is 5 × 3 km2, which is much smaller than that of MWRI. Note that a geographic positioning error of about 6 km in the direction of the largest terrain height gradient can cause up to 30 K errors of brightness temperature near the southern edge of the Tibet Plateau with a steep terrain (Figure 7). After applying the geolocation error correction to the FY-3C MWRI, the brightness temperature distribution is much more natural, with the sharpest gradient occurring at the steepest terrain location. Since the differences of brightness temperature between land and oceans along coastlines are of similar magnitudes (30–40 K) [35] as those between flat terrain and the Tibet Plateau, a 6 km geolocation error could also be critical along the Chinese coastline (e.g., the Yellow Sea).
In summary, for MWRI brightness temperature observations, striping noise can be detected and removed, RFI can be detected, and geolocation errors can be quantified and corrected. Obviously, the required accuracy of MWRI data depends on specific applications, as is shown by the importance of the above works.
4.3. Cloud Detection for MWTS, MWHS, HIRAD and MWRI Data
Microwave temperature sounding radiances have been assimilated into the NWP models worldwide. The radiative transfer models do not simulate radiances affected by cloud as accurately as in clear sky conditions, due to either a lack of accurate cloud microphysical parameters input or an inconsistency in the use of microphysical parameters between RTMs and NWP models. Observational errors must be quantified separately for cloudy and clear-sky conditions, which requires cloud detection. The two lowest-frequency AMSU-A channels at 23.8 GHz and 31.4 GHz can be used to retrieve cloud LWP, which can then be used for cloud detection. FY-3 MWTS does not have the 23.8-GHz and 31.4-GHz window channels. Therefore, cloud detection is a challenging problem for MWTS data assimilation.
A cloud detection algorithm was developed based on the FY-3 MWTS observations [40,41]. Firstly, these studies showed that cloud regions become distinguishable in the global distribution of
of the MWTS-2 50.3-GHz channel 1 (or equivalently AMSU-A channel 3). The ECMWF ERA-interim and ERA-5 reanalysis was used in Niu and Zou (2019) and Niu et al. (2020), respectively. The fields of
are not dominated by the limb effect as O-B does for both AMSU-A channel 3 [40] and MWTS channel 1 [41], where
and
are calculated using data collocated with AMSU-A clear-sky data points (LWP < 0.01 g kg−1). Many of the cloud features seen in the LWP field are revealed in the
fields. The value of O-B-μ(α)-μ(φ) is generally less (greater) than 2 K for AMSU-A channel 3 or MWTS channel 1 data with LWP less (greater) than 0.05 kg m−2 (see Figure 10 in Reference [41]). We can thus use
as the basis for developing a clear-sky data selection algorithm for the FY-3 MWTS. We mention here that the scan-dependent features in MWTS observations can be removed by a limb correction [42]. The limb-corrected brightness temperature observations more clearly show the features of temperature and liquid water path.
Secondly, a point is defined as a tentative clear-sky point (
) if
, and a point is defined as a tentative cloudy point () if
. Thirdly, a tentative clear-sky point
is defined as a final clear-sky (
) point if all points within its 60 km radial distance are tentative clear-sky points, and a tentative cloudy point
is defined as a final cloudy (
) point if all points within its 100 km radial distance are tentative cloudy points.
Finally, if the mean value of the bias-removed differences of brightness temperature between observations and simulations in the 100 km circle from a remaining tentative cloudy point are smaller than or equal to 2 K, i.e.,
, all tentative clear-sky points within this circle are taken as the final clear-sky points, and if
all tentative clear-sky points within this circle are taken as the final cloudy points, where
where
is the spatial location of the ith data point,
is the spatial location of the jth data point, and Ni is the total number of data points within the 100 km radial distance from the ith data point. The proposed cloud detection algorithm successively identified more than 70% (95%) of the clear-sky (cloudy) data points for MWTS observations [41].
Another way of detecting cloud and precipitation is to combine the dual oxygen absorption bands of MWTS and MWHS onboard FY-3C/D [43]. The MWTS has 13 channels located at the oxygen absorption band at 50–60 GHz for profiling the atmospheric temperature. The MWHS has eight channels located at 118 GHz for probing the cloud and precipitation, in addition to the five channels similar to MHS (three channels at 183 GHz and the other two at 89 and 157 GHz). FY-3C is the first polar-orbiting operational environmental satellite to explore the applications of 118 GHz by a spaceborne cross-track microwave instrument. Due to a strong frequency dependence of ice particle scattering in convective areas, the brightness temperatures at 118 GHz are much lower than those at 50–60 GHz [44]. Based on this physical consideration, Han et al. (2015) [43] showed a new capability of using these FY-3C dual oxygen bands to detect the vertical structures of cloud and precipitation associated with hurricane and typhoon systems. By pairing the oxygen MWTS and MWHS 118-GHz sounding channel with the same peak weighting function altitude, a cloud emission and scattering index (CESI) is defined to indicate the amounts of the vertically integrated cloud water path above that level. The CESI distributions from three paired MWTS/MWHS channels revealed unique three-dimensional structures of clouds and precipitation within Super Typhoon Neoguri that occurred in July 2014.
The third cloud detection algorithm was developed for HIRAS onboard FY-3D [45]. FY-3D HIRAS is the first Chinese hyperspectral infrared sounder that provides 2275 spectral channels. It is similar, but not identical, to the CrIS onboard the S-NPP and NOAA-20 satellites. Observations from these hyperspectral infrared instruments have been used worldwide for NWP and climate research. Both HIRAS and CrIS have designed channels located within two CO2 absorption bands, one at LWIR (15-μm) and the other at SWIR (4.3-μm) spectral ranges. As CO2 is a uniformly mixed gas in the atmosphere, differences between LWIR and SWIR channels at similar altitudes may provide information on the cloud at a high vertical resolution.
For HIRAS data, Xia and Zou (2020) [45] tested the method proposed by Lin et al. (2017) [46] for detecting clouds located in different layers of the atmosphere by combining CrIS double CO2 bands and proposed some modifications for pairing the LWIR and SWIR CO2 channels. Reference [39] defined a set of the cloud emission and scattering indices (CESIs) for detecting clouds located in different layers of the atmosphere by CrIS LWIR and SWIR CO2 channel pairs. The paring of LWIR and SWIR CO2 channels is carried out by requiring that both the differences of altitude of weighting function peaks (
) and cloud-sensitive levels (
)
are less than 50 hPa. The parameter pcs,lw is the highest vertical level where the brightness temperature fractional differences between cloudy and clear-sky simulations for the longwave channel are less than 0.01. Similarly, the parameter pcs,sw is defined for the shortwave channels, except that the brightness temperature fractional differences between cloudy and clear-sky simulations for this shortwave channel are less than 0.1. Xia and Zou (2020) [45] made two modifications to the LWIR and SWIR channels pairing method proposed by Lin et al. (2017) [46]. The first modification is to select that a pair of LWIR and SWIR not only with similar weighting function peaks, but also with the closest weighting function broadness. The second modification is to make the threshold of the cloud-sensitive-level difference height dependent. A CESI was defined for each paired LWIR/SWIR channel:
where
represents the SWIR brightness temperature observations,
represents the LWIR brightness temperature observations,
is the SWIR brightness temperature obtain by the regression model
, and
are regression coefficients and their values are determined by clear-sky HIRAS observations. The effectiveness of the improved HIRAS cloud detection scheme was illustrated by comparing the CESI with the cloud retrieval products of ice cloud optical depth and cloud-top pressure from the Atmospheric Infrared Sounder (AIRS). The spatial distributions of the modified CESIs at different altitudes can better capture the tropical features in the AIRS-retrieved ice cloud optical depth and cloud-top pressure than the original method. Due to significant noise in brightness temperature observations of HIRAS SWIR channels with peak channels with peak WFs above 200 hPa (see Figure 2a in Xia and Zou, 2020), only SWIR channels with WF peaks below the 200-hPa altitude were used for generating HIRAS CESIs. Further investigation is required to examine the CESI accuracy and its variation with altitudes.
The cloud detection for MWRI data is often carried out using the LWP retrieval products. Tang and Zou (2017) [47] developed a LWP retrieval algorithm. By using different MWRI channels for different magnitudes of LWP, the spiral cloud structures within and around TCs can be well captured. The lowest frequency channels are the most appropriate for retrieving LWP when its values are large, such as in the TC eyewall region where the LWP is greater than 3 mm. The cloud detection for MWRI data can use LWP values. It was reported that the diurnal cycle of LWP over the southeast Pacific Ocean was captured by the afternoon FY-3B and midmorning FY-3C MWRI observations [48].
Of course, compared to GOES, POES observations have weaknesses in time continuity for detecting the diurnal variation of meteorological variables at a given location. FY-3 series have Local Equatorial Crossing Times (LECTs), either around 10:00 or 01:40 am/pm. It also means that the temperature trend (e.g., global warming) derived from MWTS observations may have some limitations for long-term climate analysis. Observations can be affected by differences in the center frequency, incidence angle, and local equator crossing time (LECT) among the instruments, orbital drift, sensor deterioration, etc. While POES microwave temperature sounding data have been widely used in the study of climate trends over the past decades, merging FY-3 MWTS data to the advanced microwave sounding unit-A (AMSU-A) data from the NOAA-15, -18, and -19 satellites and the EUMETSAT MetOp-A/B/C collected first requires inter-calibration to remove inter-sensor biases and then a diurnal correction [49].
4.4. MWTS Data for TC Vortex Initialization and Direct Assimilation
TCs have warmer centers than their environments by more than several degrees in the upper troposphere and also sometimes in the middle and lower troposphere. Adiabatic atmospheric subsidence warming in the eye and convective downdrafts, the latent heat release associated with cloud formation and precipitation near and outside of the TC eye wall, and the sensible heat flux over warm sea surface temperatures all contribute to TCs having warm cores. Based on satellite observations, reconnaissance aircraft data, dropsonde observations, buoys, measuring instruments mounted on ships, weather stations on islands, and model simulations, the altitudes of TC warm-cores can extend from upper troposphere to lower troposphere of varying altitudes and are case dependent.
The 13 MWTS temperature-sounding channels are located in the oxygen absorption band with central frequencies varying from 50.3 GHz to 57.6 GHz. A brightness temperature measurement at one of these channels represents the atmospheric radiation within a layer of the atmosphere near its peak weighting function height. In other words, the atmospheric radiation from the altitude where the weighting function peak is the largest. Since oxygen is well mixed in the atmosphere, the MWTS measured brightness temperatures at different channels are mainly functions of the atmospheric temperature. The weighting functions of these MWTS sounding channels are evenly distributed vertically using the logarithmic pressure coordinate from the low troposphere to about 0.1 hPa. The MWTS/AMSU-A observed brightness temperatures at different channels thus reflect the vertical distribution of the atmospheric temperature. Not only that, the MWTS-observed brightness temperatures responds linearly to atmospheric temperatures. Therefore, atmospheric temperatures can be retrieved from MWTS observations by expressing the atmospheric temperature at a specified pressure level (
) as a weighted sum of different MWTS channels’ brightness temperature observations. Therefore, TC warm cores can be directly retrieved from microwave temperature sounding channels [50,51]. Since the FOV sizes of MWTS and ATMS sounding channels are nearly twice smaller than those of AMSU-A, a remapping algorithm could be applied to make MWTS and ATMS observations of the same FOVs as AMSU-A so that the MWTS and ATMS retrieved warm cores are consistent to those obtained from AMSU-A onboard NOAA-15, NOAA-18, MetOp-A and MetOp-B [51]. By doing so, the impact of ATMS’s large observational noise on warm-core retrievals can also be reduced.
The stronger the TCs, the warmer the TC centers than their environments. The warm cores of Hurricane Sandy, which occurred in October 2012 and produced a great societal impact, were initially confined to the upper troposphere during its intensifying stage when it was located in the tropics, and then extended to the entire troposphere when it reached its maximum intensity and moved into subtropics and middle latitudes and stopped its further intensification [50]. It was also found that TC-warm cores at upper-tropospheric levels (250 hPa) had a single-peaked diurnal cycle with a maximum around midnight [52].
Furthermore, the FY-3D MWTS and S-NPP and NOAA-20 ATMS retrieved TC-warm cores were successfully incorporated into TC vortex initialization [53]. The four-dimensional variational (4D-Var) vortex initialization (VI) system employed a nonhydrostatic axisymmetric numerical model with convection accounting for serves as a strong constraint. The 4D-Var VI assimilation of TC-warm cores produced an “optimal” initial vortex with realistic vertical structures of all model state variables. The intensity forecasts of TCs were greatly improved.
FY-3A MWTS brightness temperature observations were also directly assimilated into the Chinese Global and Regional Assimilation and PrEdiction System (GRAPES) [54,55]. The cloud detection for the MWTS data was based on the cloud fraction product provided by the Visible and Infrared Radiometer (VIRR) onboard FY-3A. It was shown that the mean and standard deviation of analysis increments O-A, where A represents analysis, became much smaller than those of O–B. TC track prediction was improved by MWTS data assimilation.
5. Future Plan
In this article, summaries are provided of past research on assessing and improving the quality of FY-3 observations from four instruments: MWTS, MWHS, MWRI and HIRAS. Topics included are biases of MWTS and MWHS and their estimates, along-track striping noise of MWHS, across-track striping noise of MWTS and MWRI data and their mitigation, RFI signals at the MWRI lowest frequency channels and their detection, cloud detection of MWTS, MWHS, MWRI and HIRAS data, and MWTS data for TC vortex initialization and direct assimilation in NWP modeling systems. Initial comparisons show that FY-3 MWTS, MWHS, MWRI, and HIRAS could be of comparable quality to NOAA, EUMETSAT, and NASA/JAXA instruments. We plan to work on observation error estimates and data thinning in the near future. The reviewed work on FY-3 observations will contribute to and accelerate data applications from past, current and future FY-3 satellites. It is anticipated that the impact of FY-3 satellite data will be further expanded in research and operational applications nationally and internationally.
Funding
This research was supported by the National Key R&D Program of China Grant 2018YFC1507004.
Acknowledgments
I thank the National Satellite Meteorological Center at China Meteorological Administration for providing FY3C/D MWTS-2 data to user community, F. Tang for generating (Figure 5, Figure 6 and Figure 7, and three anonymous reviewers for providing constructive comments and suggestions that significantly improved this manuscript.
Conflicts of Interest
The authors declare no conflict of interest.
References
- Dong, C.J.; Yang, J.; Zhang, W.; Yang, Z.; Lu, N.; Shi, J.; Zhang, P.; Liu, Y.; Cai, B. An overview of a new Chinese weather satellite FY-3A. Bull. Am. Meteorol. Soc. 2009, 90, 1531–1544. [Google Scholar] [CrossRef]
- Yang, J.; Dong, C.; Lu, N.; Yang, Z.; Shi, J.; Zhang, P.; Liu, Y.; Cai, B. Chinese new generation of polar-orbiting satellites FY-3. Acta Meteorol. Sin. 2009, 67, 501–509. [Google Scholar]
- Zhang, P.; Yang, J.; Dong, C.; Lu, N.; Yang, Z.; Shi, J. General introduction on payloads, ground segment and data application of Fengyun 3A. Front. Earth Sci. China 2009, 3, 367–373. [Google Scholar] [CrossRef]
- Zhang, P.; Chen, L.; Xian, D.; Xu, Z. Recent progress of Fengyun Meteorology satellites. China J. Space Sci. 2018, 38, 788–796. [Google Scholar]
- Mo, T.; Goldberg, M.D.; Crosby, D.S.; Zhaohui Cheng, Z. Recalibration of the NOAA microwave sounding unit. J. Geophys. Res. Atmos. 2001, 106, 10145–10150. [Google Scholar] [CrossRef]
- Goodrum, G.; Kidwell, K.; Winston, W. Advanced Microwave Sounding Unit-A. NOAA User’s Guide with NOAA-N, -N9. 2009; pp. 35–44. Available online: http://www2.ncdc.noaa.gov/docs/klm/cover.htm (accessed on 1 July 2010).
- Kawanishi, T.; Sezai, T.; Ito, Y.; Imaoka, K.; Takeshima, T.; Ishido, Y.; Shibata, A.; Miura, M.; Inahata, H.; Spencer, W. The Advanced Microwave Scanning Radiometer for the Earth Observing System (AMSR-E), NASDA’s contribution to the EOS for global energy and water cycle studies. IEEE Trans. Geosci. Remote Sens. 2003, 41, 184–194. [Google Scholar] [CrossRef]
- Aumann, H.; Chahine, M.; Gautier, C.; Goldberg, M.; Kalnay, E.; McMillin, L.; Revercomb, H.; Rosenkranz, P.; Smith, W.; Staelin, D.; et al. AIRS/AMSU/HSB on the Aqua mission: Design, science objectives, data products, and processing systems. IEEE Trans. Geosci. Remote Sens. 2003, 41, 253–264. [Google Scholar] [CrossRef]
- Zou, X. Atmospheric Satellite Observations: Variational Assimilation and Quality Assurance; Academic Press: Cambridge, MA, USA; Elsevier Inc.: Amsterdam, The Netherlands, 2020; p. 313. [Google Scholar]
- Kelly, G.; Thépaut, J. Evaluation of the Impact of the Space Component of Global Observing System through Observing System Experiment; ECMWF Publication: Reading, UK, 2007; pp. 327–346. [Google Scholar]
- Derber, J.C.; Wu, W.-S. The use of TOVS cloud-cleared radiances in the NCEP SSI analysis system. Mon. Weather Rev. 1998, 126, 2287–2299. [Google Scholar] [CrossRef]
- Eyre, J.R.; Kelly, G.A.; McNally, A.P.; Andersson, E.; Persson, A. Assimilation of TOVS radiance information through one-dimensional variational analysis. Q. J. R. Meteorol. Soc. 1993, 119, 1427–1463. [Google Scholar] [CrossRef]
- Andersson, E.; Pailleux, J.; Thépaut, J.-N.; Eyre, J.R.; McNally, A.P.; Kelly, G.A.; Courtier, P. Use of cloud-cleared radiances in three/four-dimensional variational data assimilation. Q. J. R. Meteorol. Soc. 1994, 120, 627–653. [Google Scholar] [CrossRef]
- Xue, J.S.; Zhuang, S.Y.; Zhu, G.F.; Zhang, H.; Liu, Z.Q.; Liu, Y.; Zhuang, Z.R. Scientific design and preliminary results of three-dimensional variational data assimilation system of GRAPES. Chin. Sci. Bull. 2008, 53, 3446–3457. [Google Scholar] [CrossRef]
- Zhang, L.; Liu, Y.; Liu, Y.; Gong, J.; Lu, H.; Jin, Z.; Tian, W.; Liu, G.; Zhou, B.; Zhao, B. The operational global four-dimensional variational data assimilation system at the China Meteorological Administration. Q. J. R. Meteorol. Soc. 2019, 145, 1882–1896. [Google Scholar] [CrossRef]
- Zou, X.; Wang, X.; Weng, F.; Li, G. Assessments of Chinese FengYun Microwave Temperature Sounder (MWTS) measurements for weather and climate applications. J. Atmos. Ocean. Technol. 2011, 28, 1206–1227. [Google Scholar] [CrossRef]
- Zou, X.; Chen, X.; Weng, F. Diagnosis of polarization signatures from two window channels of MicroWave Humidity Sounder (MWHS) onboard Chinese FengYun-3. J. Front. Earth Sci. 2014, 8, 625–633. [Google Scholar] [CrossRef]
- Gaiser, P.W.; Germain, K.M.S.; Twarog, E.M.; Poe, G.A.; Purdy, W.; Richardson, D.; Grossman, W.; Jones, W.L.; Spencer, D.; Golba, G.; et al. The WindSat spaceborne polarimetric microwave radiometer: Sensor description and early orbit performance. IEEE Trans. Geosci. Remote Sens. 2004, 42, 2347–2361. [Google Scholar] [CrossRef]
- Imaoka, K.; Maeda, T.; Kachi, M.; Kasahara, M.; Ito, N.; Nakagawa, K. Status of AMSR2 instrument on GCOM-W1. Proc. SPIE 2012, 8528, 15. [Google Scholar]
- Collard, A.D. Selection of IASI channels for use in numerical weather prediction. Q. J. R. Meteorol. Soc. 2007, 133, 1977–1991. [Google Scholar] [CrossRef]
- Han, Y.; Revercomb, H.E.; Cromp, M.; Gu, D.; Johnson, D.B.; Mooney, D.; Scott, D.; Strow, L.L.; Bingham, G.E.; Borg, L.; et al. Suomi NPP CrIS measurements, sensor data record algorithm, calibration and validation activities, and record data quality. J. Geophys. Res. Atmos. 2013, 118, 12734–12748. [Google Scholar] [CrossRef]
- Wang, X.; Zou, X. Quality assessments of Chinese FengYun-3B Microwave Temperature Sounder (MWTS) measurements. IEEE Trans. Geosci. Remote Sens. 2011, 50, 4875–4884. [Google Scholar] [CrossRef]
- Wang, X.; Zou, X.; Weng, F.; You, R. An assessment of the FY-3A microwave temperature sounder using the NCEP numerical weather prediction model. IEEE Trans. Geosci. Remote Sens. 2012, 50, 4860–4874. [Google Scholar] [CrossRef]
- Lu, Q.; Bell, W.; Bauer, P.; Bormann, N.; Peubey, C. Characterizing the FY-3A microwave temperature sounder using the ECMWF model. J. Atmos. Ocean. Technol. 2011, 28, 1373–1389. [Google Scholar] [CrossRef]
- Zou, C.Z.; Wang, W. Intersatellite calibration of AMSU-A observations for weather and climate applications. J. Geophys. Res. Atmos. 2011, 116, D23113. [Google Scholar] [CrossRef]
- Guan, L.; Zou, X.; Weng, F.; Li, G. Assessments of FY-3A Microwave Humidity Sounder (MWHS) measurements using NOAA-18 Microwave Humidity Sounder (MHS). J. Geophys. Res. Atmos. 2011, 116, D10106. [Google Scholar] [CrossRef]
- Zou, X.; Ma, Y.; Qin, Z. FengYun-3B Microwave Humidity Sounder (MWHS) data noise characterization and filtering using principle component analysis. IEEE Trans. Geosci. Remote Sens. 2012, 50, 4892–4902. [Google Scholar] [CrossRef]
- Zou, X.; Lin, L.; Weng, F. Absolute calibration of ATMS upper level temperature sounding channels using GPS RO observations. IEEE Trans. Geosci. Remote Sens. 2014, 52, 1397–1406. [Google Scholar] [CrossRef]
- Qin, Z.; Zou, X. Uncertainty in FengYun-3C Microwave Humidity Sounder measurements at 118 GHz with respect to simulations from GPS RO Data. IEEE Trans. Geosci. Remote Sens. 2016, 54, 6907–6918. [Google Scholar] [CrossRef]
- Yang, H.; Zou, X.; Li, X.; You, R. Environmental Data Records (EDRs) from FengYun-3B Microwave Radiation Imager (MWRI). IEEE Trans. Geosci. Remote Sens. 2012, 50, 4986–4993. [Google Scholar] [CrossRef]
- Dong, H.; Zou, X. Smaller striping noise in microwave radiation imager data from FengYun-3D than FengYun-3B/3C. Q. J. R. Meteorol. Soc. 2019, 145, 3819–3831. [Google Scholar] [CrossRef]
- Zou, X.; Dong, H.; Qin, Z. 2017: Striping noise reduction at ATMS window channels using a modified destriping algorithm. Q. J. R. Meteorol. Soc. 2017, 143, 2567–2577. [Google Scholar] [CrossRef]
- Bormann, N.; Fouilloux, A.; Bell, W. Evaluation and Assimilation of ATMS Data in the ECMWF System. ECMWF Technical Memoranda; ECMWF: Reading, UK, 2013; p. 689. [Google Scholar]
- Qin, Z.; Zou, X.; Weng, F. Analysis of ATMS and AMSU striping noise from their earth scene observations. J. Geophys. Res. Atmos. 2013, 118, 13214–13229. [Google Scholar] [CrossRef]
- Zou, X.; Tian, X. 2019: Striping noise analysis and mitigation for Microwave Temperature Sounder (MWTS)-2 observations. Adv. Atmos. Sci. 2019, 36, 711–720. [Google Scholar] [CrossRef]
- Li, L.; Njoku, E.; Im, E.; Chang, P.; Germain, K.S. A preliminary survey of radio-frequency interference over the U.S. in Aqua AMSR-E data. IEEE Trans. Geosci. Remote Sens. 2004, 42, 380–390. [Google Scholar] [CrossRef]
- Njoku, E.; Ashcroft, P.; Chan, T.; Li, L. Global survey and statistics of radio-frequency interference in AMSR-E land observations. IEEE Trans. Geosci. Remote Sens. 2005, 43, 938–947. [Google Scholar] [CrossRef]
- Zou, X.; Zhao, J.; Weng, F.; Qin, Z. Detection of radio-frequency interference signal over land from FY-3B Microwave Radiation Imager (MWRI). IEEE Trans. Geosci. Remote Sens. 2012, 50, 4994–5003. [Google Scholar] [CrossRef]
- Tang, F.; Zou, X.; Yang, H.; Weng, F. Geolocation error estimate and correction for FengYun-3C microwave radiation imager. IEEE Trans. Geosci. Remote Sens. 2016, 54, 407–421. [Google Scholar] [CrossRef]
- Niu, Z.; Zou, X. Development of a new algorithm for identifying clear sky MSU data using AMSU-A data for verification. IEEE Trans. Geosci. Remote Sens. 2019, 57, 700–708. [Google Scholar] [CrossRef]
- Niu, Z.; Zou, X.; Ray, P.S. Development and testing of a clear-sky data selection algorithm for FY-3C/D Microwave Temperature Sounder-2. Remote Sens. 2020, 12, 1478. [Google Scholar] [CrossRef]
- Tian, X.; Zou, X.; Yang, S. A limb correction method for MWTS-2 and its applications. Adv. Atmos. Sci. 2018, 35, 1547–1552. [Google Scholar] [CrossRef]
- Han, Y.; Zou, X.; Yang, H.; Weng, F. 2015: Cloud and precipitation features of super Typhoon Neoguri revealed from dual oxygen absorption band sounding instruments on board FengYun-3C satellite. Geophys. Res. Lett. 2015, 42, 916–924. [Google Scholar] [CrossRef]
- Blackwell, W.J.; Barrett, J.W.; Chen, F.W.; Leslie, R.V.; Rosenkranz, P.W.; Schwartz, M.J.; Staelin, D.H. NPOESS Aircraft Sounder Testbed-Microwave (NAST-M): Instrument description and initial flight results. IEEE Trans. Geosci. Remote Sens. 2001, 39, 2444–2453. [Google Scholar] [CrossRef]
- Xia, X.; Zou, X. Development of CO2 band-based cloud emission and scattering indices and their applications to FY-3D Hyperspectral Infrared Atmospheric Sounder. Remote Sens. 2020, 12, 4171. [Google Scholar] [CrossRef]
- Lin, L.; Zou, X.; Weng, F. Combining CrIS double CO2 bands for detecting clouds located in different vertical layers of the atmosphere. J. Geophys. Res. Atmos. 2017, 122, 1811–1827. [Google Scholar] [CrossRef]
- Tang, F.; Zou, X. Liquid water path retrieval using the lowest frequency channels of FengYun-3C Microwave Radiation Imager (MWRI). J. Meteorol. Res. 2017, 31, 1109–1122. [Google Scholar] [CrossRef]
- Tang, F.; Zou, X. Diurnal variation of liquid water path derived from two polar-orbiting FengYun-3 microwave radiation imagers. Geophys. Res. Lett. 2018, 45, 6281–6288. [Google Scholar] [CrossRef]
- Xia, X.; Zou, X. Impacts of AMSU-A inter-sensor calibration and diurnal correction on satellite-derived linear and nonlinear decadal climate trends of atmospheric temperature. Clim. Dyn. 2020, 54, 1245–1265. [Google Scholar] [CrossRef]
- Tian, X.; Zou, X. ATMS and AMSU—A derived warm core structures using a modified retrieval algorithm. J. Geophys. Res. Atmos. 2016, 121, 12630–12646. [Google Scholar] [CrossRef]
- Zou, X.; Tian, X. Hurricane warm core retrievals from AMSU-A and remapped ATMS measurements with rain contamination eliminated. J. Geophys. Res. Atmos. 2018, 123, 10815–10829. [Google Scholar] [CrossRef]
- Tian, X.; Zou, X. Polar-orbiting satellite microwave radiometers capturing size and intensity changes of Hurricane Irma and Maria. J. Atmos. Sci. 2018, 75, 2509–2522. [Google Scholar] [CrossRef]
- Tian, X.; Zou, X. A comprehensive 4D-Var vortex initialization using a nonhydrostatic axisymmetric hurricane model. Tellus A Dyn. Meteorol. Oceanogr. 2019, 71, 1653138. [Google Scholar] [CrossRef]
- Li, J.; Zou, X. A quality control procedure for FY-3A MWTS measurements with emphasis on cloud detection using VIRR cloud fraction. J. Atmos. Ocean. Technol. 2013, 30, 1704–1715. [Google Scholar] [CrossRef][Green Version]
- Li, J.; Zou, X. Impact of FY-3A MWTS radiances on prediction in GRAPES with comparison of two quality control schemes. Front. Earth Sci. 2014, 8, 251–263. [Google Scholar] [CrossRef]
Publisher’s Note: MDPI stays neutral with regard to jurisdictional claims in published maps and institutional affiliations. |
© 2021 by the author. Licensee MDPI, Basel, Switzerland. This article is an open access article distributed under the terms and conditions of the Creative Commons Attribution (CC BY) license (http://creativecommons.org/licenses/by/4.0/).

