Article

Spatial and Temporal Differences in Alpine Meadow, Alpine Steppe and All Vegetation of the Qinghai-Tibetan Plateau and Their Responses to Climate Change

Key Laboratory of Desert and Desertification, Northwest Institute of Eco-Environment and Resources, Chinese Academy of Sciences, Lanzhou 730000, China
*
Author to whom correspondence should be addressed.
Remote Sens. 2021, 13(4), 669; https://doi.org/10.3390/rs13040669
Submission received: 18 January 2021 / Revised: 4 February 2021 / Accepted: 10 February 2021 / Published: 12 February 2021
(This article belongs to the Section Environmental Remote Sensing)

Abstract

:
Alpine meadow and alpine steppe are the two most widely distributed nonzonal vegetation types in the Qinghai-Tibet Plateau. In the context of global climate change, the differences in spatial-temporal variation trends and their responses to climate change are discussed. It is of great significance to reveal the response of the Qinghai-Tibet Plateau to global climate change and the construction of ecological security barriers. This study takes alpine meadow, alpine steppe and the overall vegetation of the Qinghai-Tibet Plateau as the research objects. The normalized difference vegetation index (NDVI) data and meteorological data were used as the data sources between 2000 and 2018. By using the mean value method, threshold method, trend analysis method and correlation analysis method, the spatial and temporal variation trends in the alpine meadow, alpine steppe and the overall vegetation of the Qinghai-Tibet Plateau were compared and analyzed, and their differences in the responses to climate change were discussed. The results showed the following: (1) The growing season length of alpine meadow was 145~289 d, while that of alpine steppe and the overall vegetation of the Qinghai-Tibet Plateau was 161~273 d, and their growing season lengths were significantly shorter than that of alpine meadow. (2) The annual variation trends of the growing season NDVI for the alpine meadow, alpine steppe and the overall vegetation of the Qinghai-Tibet Plateau increased obviously, but their fluctuation range and change rate were significantly different. (3) The overall vegetation improvement in the Qinghai-Tibet Plateau was primarily dominated by alpine steppe and alpine meadow, while the degradation was primarily dominated by alpine meadow. (4) The responses between the growing season NDVI and climatic factors in the alpine meadow, alpine steppe and the overall vegetation of the Qinghai-Tibet Plateau had great spatial heterogeneity in the Qinghai-Tibet Plateau. These findings provide evidence towards understanding the characteristics of the different vegetation types in the Qinghai-Tibet Plateau and their spatial differences in response to climate change.

Graphical Abstract

1. Introduction

As an important part of the global terrestrial ecosystem, vegetation plays an important role in the global material and energy cycles, carbon balance regulation and maintenance of climate stability [1,2,3,4]. Additionally, vegetation is the natural link between soil, atmosphere and water, and is both affected by and positively responsive to climate change [5,6,7,8]. In recent years, in the context of global climate change, vegetation change has attracted more attention. Vegetation dynamics affect global environmental evolution, and the study of surface vegetation cover has become a popular field of global change research. The vegetation-climate response is of great practical significance to studying the relationship between climate factors and terrestrial ecosystems and has become one of the primary indicators of global change [9,10,11,12,13].
In studying spatial-temporal dynamic changes in vegetation, the normalized difference vegetation index (NDVI), an important factor used to evaluate vegetation growth status and vegetation coverage, can reflect not only the vegetation growth status and distribution pattern on the global or regional scale, but also the changing trend over a long time series [14,15]. It is also the most effective indicator used to monitor regional or global vegetation and ecological environment changes [16,17]. The NDVI has been widely used to study vegetation change in the Sahel [18,19], South Africa [20,21], North America [22], the Mongolia Plateau [23,24], the Qinghai-Tibet Plateau (QTP) [25,26] and on a global scale [27,28,29] and has achieved good results. Additionally, the NDVI can accurately reflect the changing characteristics of vegetation during different seasons and the differences among different vegetation types [30,31]. The dynamic in vegetation cover can reflect the local climate change trend to some extent. With global warming, the monitoring of vegetation, the acquisition of surface vegetation cover and its dynamic information, and the study of the vegetation response to climate change have become popular points of interest in the current study of vegetation change [32,33,34]. The vegetation index is widely applied to study the correlation between vegetation and climate change, scales in different regions, different seasons, different time series, and different resolutions of remote sensing data. Several studies have been performed on the relationship between vegetation and climate factors, and the results indicate that there is a given degree of correlation between the vegetation index and climatic factors [35,36,37,38]. Among them, precipitation and temperature were considered the two most important climatic factors affecting vegetation dynamics [39,40], and their influences and intensities reflected strong spatial heterogeneity according to the different vegetation types, climatic conditions, regional topography and landforms in each study area [41,42,43].
As the most unique geomorphic unit on earth, the QTP has an average altitude of more than 4000 m, and its annual average temperature is significantly lower than that of other regions of the same latitude. It is known as the “third pole” of the Earth [44,45,46]. As a “sensor” and “sensitive area” of climate change in Asia and even the Northern Hemisphere, the vegetation growth of the QTP plays an important regulatory role in response to regional or global climate change [47,48]. The QTP has a relatively unique natural environment and ecosystem because of its diverse vegetation, complex geographical environment and relatively little interference from human activity. These features formed the two characteristics of primitiveness and fragility, making the plateau an ideal place to study the dynamic in vegetation and its response to climate change [49,50]. Climate change, with climate warming as the primary feature, has an important influence on the land cover variation on the QTP, and alpine grassland ecosystems are one of the most sensitive ecosystems affected by climate change [51,52,53]. Alpine grasslands cover more than 60% of the plateau and primarily include alpine meadow (AM) and alpine steppe (AS), which are the two most typical types of alpine grassland ecosystems [54,55]. Alpine meadow is mainly composed of cold-tolerant mesophytic perennial herbs, with dense grass community, low grass layer and no obvious hierarchical differentiation, while alpine steppe is mainly composed of cold and dry perennial grasses and Tibetan Carex, with sparse vegetation and obvious vertical stratification structure [56]. Due to the spatial differences in their species, distributions and growth environments, there are significant differences in their change characteristics and their responses to climate change [57,58]. Although several studies have been performed on vegetation change and its response to climate change in the QTP, information on regional differences in the relationship between different types of vegetation and climate factors is lacking, especially in the AM and AS, which have the most extensive distributions. If the QTP is studied as a whole, it is difficult to reflect the internal difference in vegetation cover on the QTP in response to climate change [43]. Even the same vegetation type has different responses to climate change under different environmental conditions. Therefore, it is necessary to distinguish the spatial heterogeneity in vegetation variation and the change response on the QTP, and this information is of great significance to the sustainable development of grassland livestock husbandry and the improved function of grassland ecosystem services.
Based on the above research status, in this study, the NDVI data were synthesized every 16 d from MOD 13A2 from 2000 to 2018, and the observation data from the ground meteorological stations were selected as the data sources, the differences in growing seasons, the annual and seasonal variation trends of the NDVI in the AM, AS and the overall vegetation of the Qinghai-Tibetan Plateau (abbreviated as VQTP, NDVI > 0.1) were compared and analyzed, and the correlation between the growing season NDVI (AM, AS and VQTP) and climate factors (precipitation and temperature) were discussed from the spatial scale pixel by pixel. The results reveal the response of mixed vegetation and different alpine grassland types to climate change on the QTP to provide a scientific basis and decision-making services for monitoring the stability of the regional ecosystem, providing disaster warning, mitigating vegetation degradation and taking corresponding protection measures within the context of climate change.

2. Materials and Methods

2.1. Study Area

Located in Southwest China, the QTP is the highest physical geographic unit in the world, with an average altitude of over 4000 m. It is also an important ecological security barrier for China and Asia [59,60]. It ranges from 26°00′12″N ~ 39°46′50″N and 73°18′52″ E ~ 104°46′59” E (Figure 1). The south-north extent of the study area reaches from the southern foot of the Himalayas to the northern Kunlun and Qilian Mountains, and the east-west extent reaches from the Hengduan Mountains to the Pamirs Plateau. The total area is approximately 2.57 × 10⁶ km2, accounting for 26.8% of China’s total land area [61,62]. The administrative divisions cover six provinces, including the Xizang (Tibet) Autonomous Region and Qinghai Province, as well as parts of Xinjiang Autonomous Region and Yunnan, Sichuan and Gansu Provinces (Figure 1). Due to the fragile ecosystem of the QTP and its vulnerability to climate change, the behavior of the plateau vegetation system can predict global changes in a more timely and clear fashion than other regions, making it an ideal region to study global change [63].
Due to its special terrain and geographical position, the QTP has formed a unique nonzonal plateau climate [64]. Its climate is characterized by strong solar radiation, low air temperatures throughout the year, large regional differences and diurnal temperature differences, distinct dry and wet conditions [65], less precipitation and an uneven distribution, with more in the southeast and less in the northwest [48]. Under the influence of hydrothermal conditions and altitude, the climate of the QTP changes from humid and warm in the southeast to cold and dry in the northwest. The hydrothermal, dry and wet conditions of the QTP indirectly affect the growth process of alpine grasslands [66]. There are various vegetation types in the QTP, including mountain forest, mountain shrub, AM, AS and alpine desert from the southeast to northwest [67], among which grassland resources are the most widely distributed. Therefore, the study of vegetation change in alpine grasslands (i.e., AM and AS) on the QTP is of great value for the rational use of grassland resources and the protection of alpine ecosystems.

2.2. Data Sources and Preprocessing

The data used in this study mainly include remote sensing data set (NDVI), meteorological data, vegetation type data and Digital Elevation Model data of the study area, and their detailed introduction and preprocessing are as follows:

2.2.1. RS Data

The vegetation index used in this study was from the Land Processes Distributed Active Archive Center (LP DAAC) of the United States (http://lp-daac.usgs.gov/main.asp). The MOD13A2 Version 6 product, which was extracted from the Terra Moderate Resolution Imaging Spectroradiometer (MODIS), has a temporal resolution of 16 d, a spatial resolution of 1 km, and a time span of 2000-2018. The track numbers of MODIS products in the study area were h23v05, h24v05, h25v04, h25v05, h25v06, h26v05 and h26v06. The data format is HDF-EOS, and the projection is sinusoidal.
The MODIS Re-Projection Tool (MRT) was used for image mosaic, format conversion, resampling and projection transformation. The original HDF format was converted into Geotiff, and the sinusoidal projection was converted into the Albers conical equal area with the datum D_WGS_1984. The resampling method was the nearest neighbor method with a resolution of 1 km. The maximum value composite (MVC) method was then used to obtain the monthly NDVI from 2000 to 2018, which effectively removed the influence of the clouds, atmosphere and solar elevation angle [68]. Lastly, the mean value method was used to obtain the NDVI during the growing season and different seasons to eliminate the influence of climatic anomalies in extreme years on vegetation growth. The vector boundary of the QTP was used to clip the NDVI data in ArcGIS to obtain the NDVI time-series data set of the study area. The value range of the NDVI is −1.0~1.0. According to a large number of research results in the QTP [13,69,70], it is generally believed that an average NDVI value in the growing season above 0.1 indicates vegetation cover, while a value below 0.1 indicates no vegetation cover on the surface, such as bare soil, desert, the Gobi, a water body, snow, ice and clouds. Because the object of this study was vegetation, to calculate the results more accurately, only pixels with an average NDVI value during the growing season of greater than 0.1 were calculated in this study. The vegetation cover area after the mask was employed as the targeted region of this paper.

2.2.2. Meteorological Data

The meteorological data used in this study were provided by the Resource and Environment Science and Data Center (RESDC) and the China Meteorological Data Service Center (CMDC). The spatial interpolation data sets of annual precipitation and annual average temperature from 2000 to 2015 were derived from the RESDC, with a spatial resolution of 1 km. The spatial interpolation data sets of annual precipitation and annual average temperatures from 2016 to 2018 were obtained by using ANUSPLIN software based on the monitoring data from meteorological stations, and the spatial resolution of the data sets was the same as that of the MODIS-NDVI remote sensing image. In this study, a total of 180 meteorological stations in the QTP and in its surrounding provinces were selected for spatial interpolation (Figure 1). The data sources, interpolation methods and spatial resolutions used during both periods were all the same, to establish the spatial interpolation data set of temperature and precipitation on the QTP from 2000 to 2018.

2.2.3. Vegetation and Digital Elevation Model Data

The vegetation type data were obtained from a digitized 1:1,000,000 vegetation map of China compiled by the Chinese Academy of Sciences (CAS), which was provided by the RESDC (http://www.resdc.cn). The vector boundary of the QTP was used to clip out the vegetation type data from the QTP, and the spatial distribution range of AM and AS on the QTP was classified by summarizing and extracting the same vegetation type (Figure 2) [71].
The Vegetation and Digital Elevation Model (DEM) data were taken from radar terrain mapping SRTM (Shuttle Radar Topography Mission, SRTM) data from the U.S. space shuttle Endeavour. The data set was based on the latest SRTM V4.1 data and downloaded from the RESDC with a spatial resolution of 1 km, which was primarily used as the covariate of meteorological data interpolation and topographic map production.

2.3. Methods

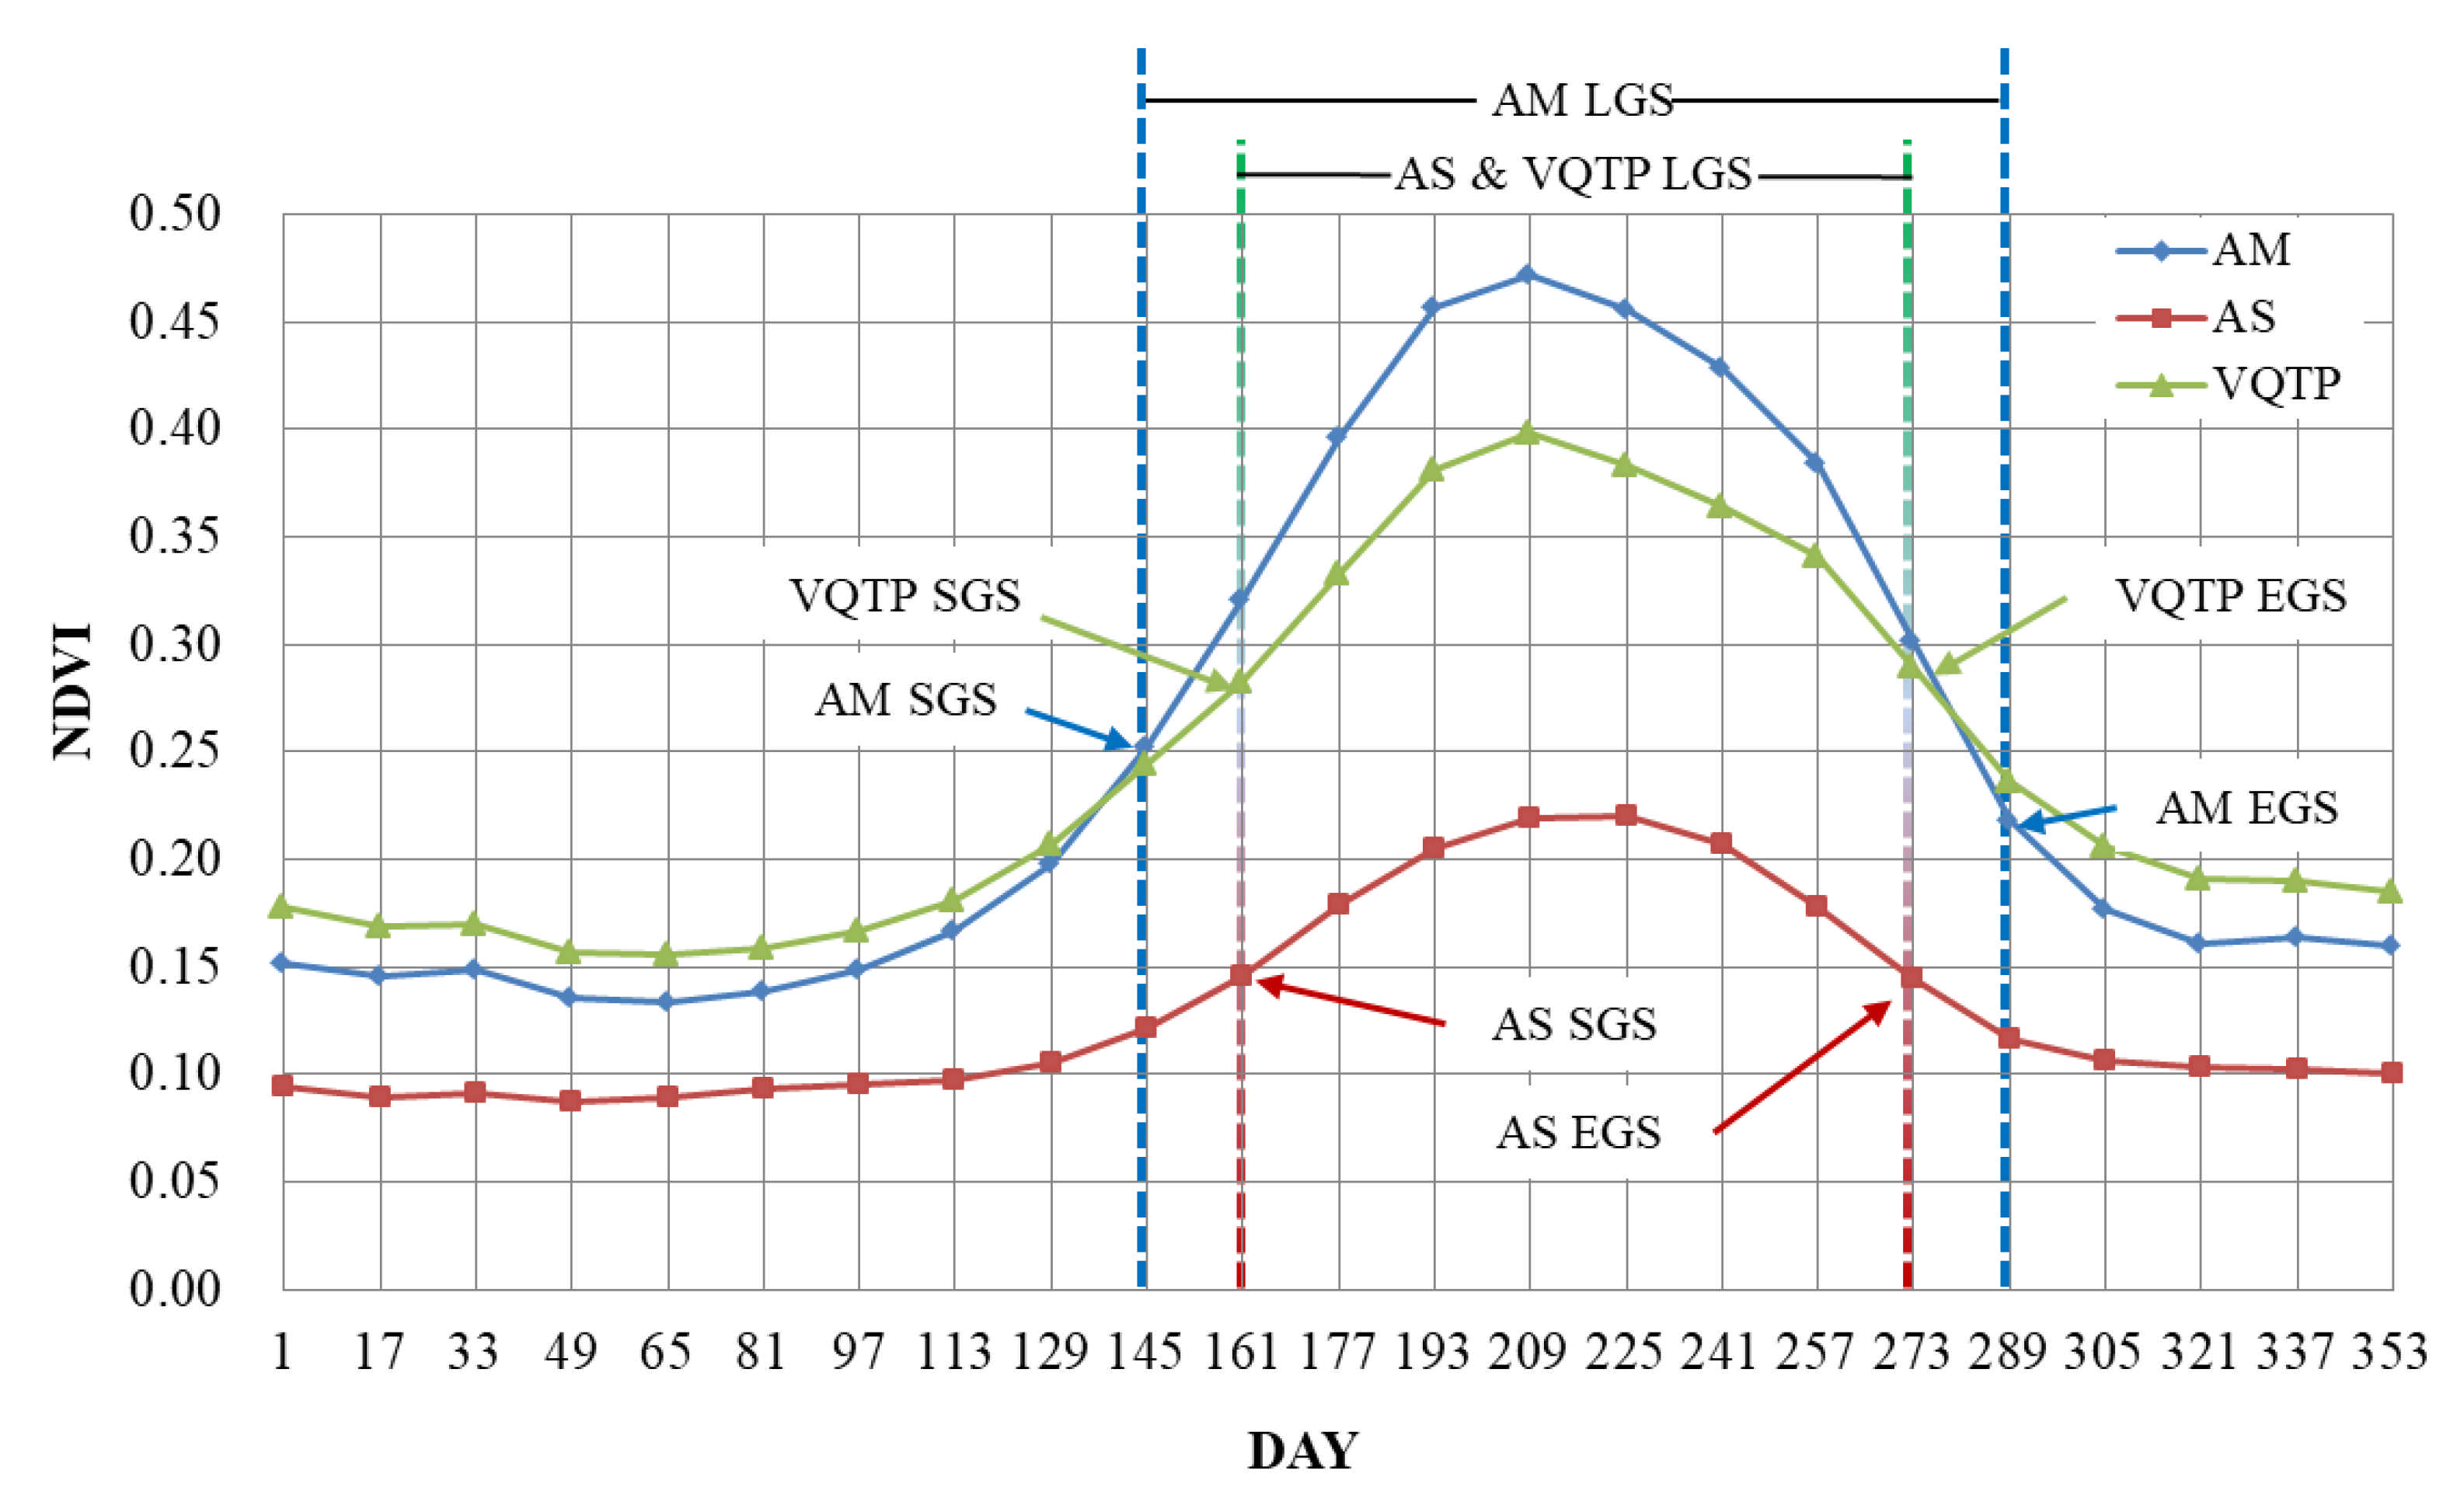
2.3.1. Determination of the Growing Season

In this paper, three phenological parameters, namely, the start of the growing season (SGS), the end of the growing season (EOS) and the length of the growing season (LGS), were selected as indicators for monitoring the vegetation growth season on the QTP to determine the spatial-temporal differences in the SGS, EOS and LGS of AM, AS and VQTP. Based on the MODIS-NDVI time-series data set, the maximum slope method was used to determine the start and end dates of the vegetation growing season. According to the vegetation growth process, the maximum slope method defines the time corresponding to the point with the maximum rate of change in the NDVI fitting curve as the corresponding key phenological period for the vegetation [2,72]. The slope of the fitting curve is calculated as follows:
N D V I s l o p e t = N D V I t + 1 N D V I t N D V I t
where NDVIslope(t) is the slope of the NDVI fitting curve at time t, and NDVI(t+1) and NDVI(t) are the NDVI values at times t + 1 and t, respectively. The date corresponding to the maximum change rate of the NDVIslope(t) on the left side of the growth curve (i.e., the inflection point when rising) is defined as the beginning of the growing season, and the date corresponding to the maximum rate of change on the right side of the growth curve (i.e., the inflection point when falling) is defined as the end of the growing season. The length between the beginning and end of the growing season is defined as the growing season length.

2.3.2. Trend Analysis Method

The dynamic variation trend of the NDVI in each pixel was simulated by using the linear regression method, and the spatial and temporal pattern evolution of vegetation during the growing season was comprehensively reflected by the pixel scale. Slope_NDVI is defined as the slope of the NDVI for the annual growing season as fitted using the least square method within a given time range, which can better reflect the variation characteristics of aboveground biomass and vegetation cover, thus revealing the spatial pattern and variation trend in vegetation on the QTP over the last 20 years. The Slope_NDVI is calculated as follows [73,74]:
S l o p e _ N D V I = n × i = 1 n i × N D V I i i = 1 n i × i = 1 n N D V I i n × i = 1 n i 2 i = 1 n i 2
where Slope_NDVI is the trend of the growing season NDVI, n is the range of the time series (n = 19), i is the order of years from 1 to n, and NDVIi is the growing season NDVI for the ith year. Slope_NDVI > 0 indicates that the growing season NDVI shows an increasing trend during the study period and vice versa.

2.3.3. Correlational Analysis Method

The correlation analysis method was used to study the relationship between vegetation and climatic factors. The correlation coefficient between the annual growing season NDVI and the annual precipitation and annual mean temperature of the corresponding year on the QTP from 2000 to 2018 was calculated, and a significance test was conducted to reflect the degree of correlation between different climatic factors and the NDVI. Its formula is as follows [75,76]:
R = i = 1 n x i x ¯ y i y ¯ i = 1 n x i x ¯ 2 i = 1 n y i y ¯ 2  
where R is the correlation coefficient between the variables x and y, which represents the correlation degree between the two factors, and its value ranges from −1 to 1. n is the cumulative number of years during the monitoring period. xi and yi are the values of independent variables x and y in the ith year. x ¯ and y ¯ are the means of the values of independent variables x and y for all years. According to the correlation coefficient test table, the correlation degree is divided into five grades: extremely significant negative correlation (R < 0, p < 0.01), significantly negative correlation (R < 0, 0.01 < p < 0.05), no significant correlation (p > 0.05), significantly positive correlation (R > 0, 0.01 < p < 0.05), and extremely significant positive correlation (R > 0, p < 0.01).

2.3.4. Mann-Kendall (MK) Test

The MK test, which was developed by Mann and Kendall [77], is a nonparametric test method used for detecting statistically significant trends in the NDVI and the continuous environmental variable time series [78]. It does not require the samples to be independent and normally distributed and has been widely used in vegetation dynamics [79,80]. The MK test statistic Z is computed as follows:
Z = S 1 V a r S S > 0 0 S = 0 S + 1 V a r S   S < 0
where
S = i = 1 n 1 j = i + 1 n s g n x j x i
in which n is the length of the time series, xj and xi are the sequential data values in time series i and j (j > i), and sgn(xjxi) is the symbolic function as follows:
s g n x j x i = 1 x j x i > 0 0 x j x i = 0 1 x j x i < 0
The variance is computed as follows:
V a r S = n n 1 2 n + 5 i = 1 m t i t i 1 2 t i + 5 18
in which Var(S) represents the variance of S, m is the number of tied groups and ti is the number of ties for extent i. A tied group is a set of sample data that have the same value.
Positive Z values indicate increasing trends, while negative Z values show decreasing trends in the time series. The significance test is estimated at the given α significance level. When |Z| > Z1−α/2, the null hypothesis is rejected, and a significant trend is present in the time series. In this study, significance levels of α = 0.05 and α = 0.01 were used, and their Z1−α/2 values were 1.96 and 2.576, respectively.

3. Results

3.1. Phenological Characteristic Differences of AM, AS and QTP

The three phenological parameters of AM, AS and VQTP, namely, the SGS, EGS and LGS, were extracted from the NDVI time-series curves for 16 d from 2000 to 2018 using the maximum slope method. As shown in Figure 3, the NDVI time-series curves of AM, AS and VQTP all show parabolic shapes that are low on both sides and high in the middle, reflecting the changing rules of each NDVI curve over different periods of a year. Through the comparative analysis of various phenological parameters, it was found that the SGS of the AM occurred in late May (145 d), and the SGS of the AS and VQTP was in early June (161 d). The SGS of the AM occurred approximately half a month earlier than that of AM and VQTP. The EGS of the AM was in the middle of October (289 d), and the EGS of the AS and VQTP was in late September (273 d), half a month earlier than that of the AM, which was consistent with the field observation results. The SGS of the AM lasted for 145 days, from 145 d to 289 d, and the SGS of the AS and VQTP started from 161 d to 273 d and lasted for 112 days. The LGSs of the AS and VQTP were significantly shorter than that of the AM. It can be observed from the variation curves of the NDVI in the AM, AS and VQTP that the NDVI of VQTP was greater than that of AM in the non-growing season (that was before the SGS and after the EGS) (Figure 3), while the NDVI of AM was greater than that of VQTP in the growing season. This indicated that the NDVI of AM was lower as a whole because it was dormant in the non-growing season. However, due to the influence of forests and evergreen vegetation in the southeastern part of the QTP, the overall NDVI of VQTP during this period was relatively high. When the growing season came, AM began to grow and gradually reached the growth peak period, while the NDVI of VQTP was slightly lower than that of AM in the growing season due to the influence of large-area low vegetation cover regions such as AS and desert grassland. The maximum NDVI values of the AM and VQTP appeared at the end of July (209 d), while the maximum value of the AS appeared in the middle of August (225 d), which was slightly delayed. The primary reasons for the differences in phenological characteristics were as follows: the AM was mainly distributed over the central and eastern parts of the plateau, while the AS was mainly distributed over the northwestern part of the plateau. There was a significant regional difference in the surface temperature. The precipitation was largely controlled by the southwest monsoon and gradually decreased from the southeast to northwest. The hydrothermal conditions in the distribution area of the AM were better than those in the distribution area of the AS.

3.2. Interannual Variation Characteristics of the NDVI during the Growing Seasons of AM, AS and VQTP

The mean value method was used to obtain the mean value of the NDVI during the growing seasons of the AM, AS and VQTP, and then the annual variation trend of the three was analyzed. As shown in the change curves in Figure 4, the growing season NDVI of the AM, AS and VQTP all showed a significant increasing trend from 2000 to 2018 (VQTP: p < 0.05, AM & AS: p < 0.01). Before 2012, the increasing trends of the three were all extremely significant (p < 0.01), in which the vegetation of VQTP and AM fluctuated greatly, while the growth trend of the AS was relatively stable. After 2014, the vegetation curves of the AM and VQTP fluctuated and increased with the same trend. Both VQTP and AM had a significant trough in 2014, while AS had a trough in 2015, and then AS showed a sharp upward trend. Over the past 19 years, the AS had the most obvious increasing trend (p < 0.01). The NDVI value during the growing season increased from 0.176 in 2000 to 0.206 in 2018, with an average annual growth rate of 0.009 yr−1. The NDVI of VQTP during the growing season increased from 0.326 in 2000 to 0.346 in 2018, with an average annual growth rate of 0.003 yr−1. The increase of the AM was relatively small, increasing from 0.355 in 2000 to 0.372 in 2018, with an average annual growth rate of 0.0026 yr−1. A comparative analysis showed that except for the similar variation trends of AM and VQTP in the growing season, AS is different from them in all periods. The NDVI of the three types has obvious differences in the value range, fluctuation amplitude and change rate.

3.3. Interannual Variation Characteristics of the AM, AS and VQTP during Different Seasons

Through the statistics on the annual average NDVI values for the AM, AS and VQTP during the growing season, spring, summer and autumn, the annual NDVI variation curves were obtained for different seasons from 2000 to 2018 (Figure 5). Due to the influence of snow cover, the winter vegetation was not considered. The average seasonal NDVI of the AM, AS and VQTP showed increasing trends from 2000 to 2018, but the variation trends were different to some extent. Among them, the NDVI of the AM and VQTP increased at the fastest rate in the spring, with rates of 0.0014 yr−1 and 0.0015 yr−1, respectively. The NDVI of the AS increased at the fastest rate, at 0.0011 yr-1, during the growing season. The VQTP and AM curves primarily occurred between 0.30 and 0.40 during the growing season, and the AS curve was between 0.15 and 0.20. In the spring, the VQTP and AM curves primarily ranged between 0.15 and 0.20, the value of the VQTP curve was slightly larger than that of AM, and the AS curve primarily fluctuated at approximately 0.10. The NDVI values of all the types during the spring were significantly lower than those of the growing season. In the summer, the AM curve primarily fluctuated at approximately 0.40, which was significantly higher than that during the growing season and in the spring, while the VQTP and AS curves were slightly higher than that during the growing season. In the autumn, the AM, AS and VQTP curves were all significantly higher than those in the spring but lower than those for the summer and the growing season. Therefore, from a seasonal point of view, the AM, AS and VQTP flourishing periods all occurred in the summer, followed by autumn and lastly spring. The mean value of the growing season was used as a reference, and the mean value of the NDVI was only less than that of the summer.
According to the interannual variation curve of the NDVI during each season (Figure 5), the interannual fluctuation trends of the AM and VQTP during different seasons were highly consistent, and the two were significantly correlated at the 0.01 level (Table 1). This result indicated that the AM made a high contribution to the overall vegetation change on the QTP. The fluctuation trends of the AS and VQTP during different seasons were also relatively consistent. The correlation between AS and VQTP was slightly weaker in the growing season (p < 0.05) but not significant in summer (p > 0.05) (Table 1). The variation trends in the AM and AS were highly consistent in the growing season, spring and autumn (p < 0.01) but different in the summer (p > 0.05). The difference of AS in summer may be due to the overall influence of the QTP by other vegetation types or the sensitive response of the AS to climate change. In general, AM and AS are the two primary vegetation types on the QTP, and their changes play key and decisive roles in the overall vegetation change trend for the QTP.

3.4. Spatiotemporal Change Trends in Growing Season NDVI (AM, AS and VQTP) and Significance Test

Based on the trend analysis method, the variation trend in the NDVI during the growing season was estimated from 2000 to 2018 in the study area, and the corresponding significance level was tested by the MK method. According to the trend analysis and significance tests over the past 19 years, the spatial distribution of the slope of the NDVI during the growing season was divided into six categories: extremely significant increase (p < 0.01 and slope > 0), significant increase (0.01 < p < 0.05 and slope > 0), nonsignificant increase (0.05 < p and slope > 0), nonsignificant decrease (0.05 < p and slope < 0), significant decrease (0.01 < p < 0.05 and slope < 0), and extremely significant decrease (p < 0.01 and slope < 0) (Figure 6). As shown in Figure 6 and Table 2, the growing season NDVI of the VQTP showed an increasing trend in most areas of the QTP from 2000 to 2008, especially in the Qilian Mountains. The decreasing regions were mainly distributed over the central and southeastern mountains of the QTP. The area showing an increasing trend accounted for 69.44% of the total monitoring area (Figure 6a, Table 2), of which 22.99% of the areas passed the significance test (p < 0.05) (Figure 6b, Table 2). The significantly increased areas were largely distributed throughout the north-central and northeastern parts of the QTP, especially in the Qilian Mountains, and this result was closely related to the ecological and environmental protection project and policy implementation in the Qilian Mountain region in recent years. The area showing a decreasing trend accounted for 30.56% of the total monitoring area (Figure 6a, Table 2), of which only 1.90% passed the significance test (Figure 6b, Table 2). The areas with significant declines were mainly distributed within the surrounding areas of Namtso and Siling Co in Tibet and the source region of the Yangtze River in Qinghai. These two regions have clearly been disturbed by human activities and were the primary distribution areas of vegetation degradation throughout the QTP.
Using the AM and AS vector boundaries to extract the spatial and temporal variation trends of the growing season NDVI and its test results for the QTP, the spatial distribution of the variation trends and significance test results for the AM and AS were obtained, respectively (Figure 7). The results showed that the increasing region of the AM was mainly distributed over the central and eastern parts of the QTP, and its area accounted for 29.25% of the vegetation increase in the monitored area, of which the region with a significant increase (p < 0.05) accounted for 22.63% (Figure 7a1 and a2, Table 3). In addition to the mountainous region in the southeastern QTP, the vegetation degradation trend in the AM distribution region was clear. The region with a decreasing trend in the AM accounted for 51.49% of the vegetation degradation in the monitored area, of which the significantly decreased area (p < 0.05) accounted for 39.78% of the monitored area with a significant decrease (p < 0.05), which was mainly distributed within the source region of the Yangtze River, northwest of Lhasa and along National Highway 109 (within Lhasa) (Figure 7a1 and a2, Table 3). The above analysis showed that more than half of the vegetation degradation on the QTP occurred in the AM, and the significant degradation region accounted for a higher proportion of the significant degradation in the monitored area.
The results of the AS change trend showed (Figure 7b1 and b2, Table 3) that the region where the growing season NDVI of AS showed an increasing trend was much larger than the region showing a decreasing trend. The increasing region of the AS was largely distributed over the central and western parts of the QTP, the Qinghai Lake Basin and Qilian Mountains in the northeast, and its area accounted for 33.17% of the vegetation increase in the monitored area, among which the significantly increased region (p < 0.05) accounted for 45.39% of the monitored area that had a significant increase (p < 0.05). The region where the AS showed a downward trend accounted for 18.22% of the vegetation decline in the monitored area, and the region with a significant decline (p < 0.05) accounted for 26.05% of the monitored area that had a significant decrease (p < 0.05). The overall improvement in vegetation on the QTP was primarily based on alpine meadow and alpine steppe data. They were also the main distribution regions of vegetation degradation on the QTP. Although they accounted for a relatively high proportion, the absolute area was relatively small, with a value of only 2.35 × 10⁴ km2.

3.5. NDVI Responses to Climate Change during the Annual Growing Seasons of the AM, AS and VQTP

3.5.1. Interannual Variation Characteristics of Climatic Factors

The average value of the meteorological interpolation data was calculated in the study area from 2000 to 2018, and the spatial distribution of the annual precipitation and annual mean temperature was obtained for the past 19 years (Figure 8a,b). As shown in Figure 8a, the average multiyear precipitation on the QTP showed an obvious step-like distribution, gradually decreasing from the southeast to northwest, with a range of 50.81~2450.21 mm, which represented a large span. The regions with high precipitation were primarily concentrated in the western Sichuan Plateau and the northwest mountainous Yunnan Province, and the average annual precipitation was over 1500 mm. The regions with low precipitation were largely distributed in the Qaidam Basin and the central and western parts of the Ali region of Tibet. The average annual precipitation was below 300 mm. As shown in Figure 8b, the spatial distribution range of multi-year mean temperature is from −19.50 °C to 23.99 °C. Except for the higher temperature in the Qaidam Basin, the distribution of the regional average annual temperatures was similar to that of the precipitation, which gradually decreased from the southeast to northwest as the altitude increased. Due to the effect of the altitude and terrain, the regions with high temperatures were mainly distributed in the southern and southeastern valleys of Tibet at lower altitudes. The regions with low temperatures were mostly distributed in the Kunlun Mountains and the Qiangtang Plateau region. The average altitude of this region was above 4000 m, and it was the main distribution area of AS and alpine desert.
Through a statistical analysis of the spatial interpolation data set on the annual mean temperature and annual precipitation on the QTP, the interannual variation in the annual mean temperature and annual precipitation was obtained for the study area for the last 19 years (Figure 8c,d). As shown in Figure 8c, the annual precipitation in the AM, AS and VQTP distribution regions showed fluctuating and decreasing trends from 2000 to 2018, and the variation trends of the three were similar. Among them, the change trends of the three were relatively stable from 2000 to 2014, showing slight increasing trends. Due to the impact of extreme drought years in 2015, the annual precipitation declined sharply after 2014, reached the lowest point in 2015, and gradually increased thereafter. The annual precipitation of the AM, AS and VQTP experienced a process of slow increase—sharp decline—gradual increase. Viewed over the entire study period, the annual precipitation of the VQTP and AS showed significant downward trends, and both passed the 0.05 significance test (Figure 8c). Viewed from the spatial variation trend in annual precipitation (Figure 8e), the annual precipitation in most regions of the QTP showed a decreasing trend, among which the decline was more obvious in the southeastern and southwestern parts of the plateau; only the southeastern part of Qinghai Province and the northwestern area of Sichuan Province increased, in addition to parts of southern Tibet. The annual variation trend in the average temperature (Figure 8d) indicates that the annual average temperatures for the AM, AS and VQTP all showed fluctuating upward trends, with rates of increase of 0.26 °C/10 yr−1, 0.46 °C/10 yr−1 and 0.17 °C/10 yr−1, respectively, of which the warming rate of the AS was the fastest, followed by the AM. Between them, the temperature change curves of the QTP and AM were extremely close, with a fluctuation range between −1.0 °C and 1.0 °C. The average annual temperature of the AS was below −1 °C, and the change curve was between −3.0 °C and −1.0 °C. The annual mean temperature rising trends in the QTP and AM were not obvious, while the annual mean temperature rise trend in the AS was extremely significant, which passed the significance test of 0.01. Combined with the spatial variation trend in the annual mean temperature (Figure 8f), except for some regions in the north and south QTP, the annual mean temperature in most other regions showed an increasing trend, among which the most obvious increasing trend occurred in the Ali region, Nagqu region and Zhongba County in the central and western regions of the plateau. This result indicates that under the influence of global warming, the warming effect is relatively obvious in areas where the AS is widely distributed.

3.5.2. Correlation between Growing Season NDVI (AM, AS and VQTP) and Precipitation

The spatial distribution of the correlation between the growing season NDVI and the climatic factors was determined, the significance level of the correlation coefficient between them was tested, and the correlation coefficient was graded according to the significance level (Figure 9). The spatial distribution of the significance level in the correlation coefficient between the growing season NDVI and annual precipitation (Figure 9a) shows that the regions with a positive correlation between the growing season NDVI and the annual precipitation were mainly distributed in the central region of the QTP, along the northeast to the southwest direction, accounting for 51.11% of the total monitored area. The significant positive correlation areas were mainly distributed within the source region of the Yangtze and Yellow Rivers in southeastern Qinghai Province and in the central part of the Tibet Autonomous Region, accounting for 12.11% of the total monitored area, indicating that the positive feedback effect of precipitation on vegetation changes in these areas was relatively obvious. The regions with a negative correlation between the growing season NDVI and annual precipitation were mainly distributed within the western Sichuan Plateau, southeastern Tibet, northwestern Tibet and the Qilian Mountains, accounting for 48.89% of the total monitored area, among which the regions with a significant negative correlation accounted for 5.37%. Based on the analysis of the vegetation change trend, it is clear that except for the increase in annual precipitation in the western Sichuan Plateau, the annual precipitation in other negatively correlated regions decreased. However, the growing season NDVI in these regions tended to increase significantly during the growing season, especially in the Qilian Mountains. This result shows that the improvement in vegetation in these areas was not significantly affected by the precipitation. In general, the regions with a significant positive correlation between the growing season NDVI and annual precipitation on the QTP were significantly larger than the regions with a significant negative correlation.
To understand the differences in the AM and AS responses to precipitation change on the QTP, the spatial distribution characteristics of the correlation between the AM, AS and annual precipitation were discussed in this study (Figure 9a1,a2). The results showed that the regions with a significant positive correlation between the growing season NDVI and the annual precipitation of the AM were mainly distributed between the 400 mm and 600 mm isohyets along the “northeast to southwest direction,” accounting for 46.02% of the regions with a significant positive correlation in the study area. The significant negative correlation area accounted for 23.88% of the regions with a significant positive correlation in the study area. The regions with a significant positive correlation between the growing season NDVI and the annual precipitation of the AS were largely distributed around the 400 mm isohyet in central and eastern Qinghai Province and central Tibet, accounting for 35.85% of the regions with a significant positive correlation in the study area. The significant negative correlation area accounted for 28.32% of the regions with a significant negative correlation in the study area. Given the above analysis, it was concluded that the significant positive feedback region of AM to annual precipitation was mainly in the isohyet region of 400~600 mm, while the positive feedback region of AS to annual precipitation was mainly distributed around the 400 mm isohyet. The total proportion of regions with significant positive correlations between the AM and AS and annual precipitation in the study area was as high as 81.87%, indicating that the regions with significant positive correlations between the growing season NDVI and annual precipitation on the QTP were primarily AM and AS.

3.5.3. Correlation between Growing Season NDVI (AM, AS and VQTP) and Temperature

The correlation coefficient between the growing season NDVI and the annual mean temperature was calculated to describe the closeness between the two quantitatively, and the spatial distribution of the correlation coefficient was classified according to the correlation between the growing season NDVI and the annual mean temperature and its significance level (Figure 9b). The spatial distribution map showing the significance level of the correlation coefficient indicates that the growing season NDVI and annual mean temperature in most regions of the QTP were positively correlated, and its proportion accounted for 59.06% of the total monitored area, of which the significant positive correlation area accounted for 5.73% of the total monitored area, which was mainly distributed in the Ali region of northwest Tibet and in southeastern Qinghai Province. The NDVI in these regions increased with the increasing temperature. The increase in temperature promoted the growth of vegetation in this area, especially in the Ali region of Tibet. The regions with a negative correlation between the growing season NDVI and the annual mean temperature were also widely distributed. The regions with a negative correlation accounted for 40.94% of the total monitored area, and the significantly negatively correlated regions accounted for only 3.68% of the total monitored area, primarily in the western Qilian Mountains and the eastern margin of the Qaidam Basin. As indicated by the temperature variation trend in Figure 8f, the temperature in this region showed a downward trend, while the vegetation displayed an obvious increasing trend, indicating that the vegetation increased with the decreasing temperature. In other words, once the temperature increases in this region, vegetation degradation will occur, which is the total opposite to the situation in the Ali region.
To understand the differences in the responses of the AM and AS to temperature changes on the QTP, the spatial distribution characteristics of the correlation between the AM and AS and the annual mean temperature were discussed (Figure 9b1,b2). The results showed that the regions with a significant positive correlation between the growing season NDVI and the annual mean temperature of the AM were mainly distributed in the source region of the Yellow River in the southeastern Qinghai Province, between the −5 °C and 1 °C isotherms, of which the significant positive correlation area accounted for 28.79% of the total significant positive correlation in the study area. The regions with a significant positive correlation between the AM and AS and the annual mean temperature were all located between the −5 °C and 1 °C isotherms, accounting for 78.62% of the regions with a significant positive correlation and 58.97% of the regions with a significant negative correlation in the study area, indicating that the significant influence of the temperature on the vegetation of the QTP was mainly dominated by alpine grassland.

4. Discussion

At present, it is very common to use the vegetation index to monitor the dynamic changes in vegetation. The existing research includes many related studies using the annual average NDVI, annual maximum NDVI, summer NDVI and growing season NDVI. Among them, the growing season NDVI has been widely recognized and has achieved better results. However, there is no strict theoretical basis for the definition of the growing season in different vegetation monitoring studies, most of which use April to October (according to empirical values) or March to November (according to the season) as the growing season. The selection of the growing season is arbitrary and unscientific, which is likely to cause deviations in the monitoring results on vegetation changes in the same area based on the same data source. Additionally, due to the influence of comprehensive factors such as the topography, climate, soil and vegetation types, the changes in different vegetation types in different regions, the start and end of the growing season and its length are different. If the average value of the regional vegetation index is used to reflect the vegetation change trend of the entire study area and its response to climate change, the inherent details of regional vegetation change and their sensitivity differences to climate change are ignored. Based on the above problems, this study, from the perspective of remote sensing phenology and considering the differences in vegetation types, first determined the start, end and length of the growing seasons of the AM, AS and VQTP. Using the VQTP monitoring results as a reference, the phenological characteristics of the AM, AS and VQTP, the difference in the NDVI in different seasons, the spatial-temporal trends of the growing season NDVI and their correlations with climatic factors were compared. Compared with traditional vegetation change monitoring methods, this study defined the vegetation growing season more strictly and accurately and classified different types of vegetation in a targeted way, which more intuitively and comprehensively reflected the spatial and temporal differentiation characteristics of regional vegetation and its spatial heterogeneity in response to climate change.
Several studies [81,82,83] have shown that, whether in the 1980s or after 2000, the growing season NDVI of the QTP showed an overall increasing trend, and grassland dominated, with some regions being degraded, showing an “overall improvement and local degradation” pattern [84], which was consistent with the results of this study. The climate change trend showed that before 2014, the annual precipitation and annual mean temperature of the QTP both increased, and the regional climate was “warming and humid.” However, after 2014, an extreme drought year, the annual precipitation in 2015 dropped rapidly, and this result has also been confirmed by relevant research [85]. Moreover, this study found that the annual precipitation on the QTP began to decline slowly from 2000 to 2018, while the annual mean temperature displayed an upward trend. The results of this study on vegetation change and climate change trends are consistent with previous studies. In comparing the spatial correlation between the growing season NDVI and climate factors, it was observed that the response degrees and spatial distributions of the growing season NDVI to climate change were different from the results of previous studies. This difference was primarily due to the data sources, research periods, definitions of the growing season, and selection of the number of weather stations. All these factors may cause a given deviation in the spatial distribution of the NDVI data, meteorological data and their correlation coefficients.
There are significant differences in the spatial distribution of vegetation NDVI and climatic factors of the QTP. It is not scientific to use only the statistical data of the research area or some site data to represent the vegetation change trend of the entire region and its response to climate change. Therefore, this study used spatial interpolation technology to interpolate temperature and precipitation into raster data with the same spatial resolution as that of the NDVI and to analyze the NDVI change trend and its correlation with meteorological factors at the pixel scale. This approach works around the deficiency in traditional results in which the surface is represented by the results on the point so that the spatial heterogeneity of the monitoring results can be displayed more intuitively in space. However, due to the vast territory of the QTP, there are relatively few ground meteorological stations, most of which are mainly located in the central and eastern regions, and the number of stations in the northwestern region is small. This characteristic will inevitably affect the accuracy of the spatial interpolation of meteorological data. In addition, due to the influence of data access permissions, this study analyzed only the interannual response relationship between the growing season NDVI and climatic factors on the temporal scale and did not consider the time lag in climate factor impacts on the growth season NDVI at different periods, such as months and seasons. Therefore, more appropriate interpolation methods will be developed in studies to follow, while focusing on improving the interpolation accuracy of meteorological factors in regions without meteorological stations and obtaining more comprehensive meteorological observation data to reveal the impact of climate factors on vegetation change in the QTP.
The changes in the NDVI of different vegetation types have different responses to climate change, and the spatial-temporal evolution of the vegetation NDVI is the combined result of natural and human activities such as climate change, soil and water conservation, and land use. This paper discusses only the influences of the two primary meteorological factors, temperature and precipitation, on vegetation change in the QTP, without considering other climatic factors, such as sunshine, evaporation, humidity and CO2. Additionally, since it is difficult to quantify the relevant indicators of human activities in space and because we cannot match and establish a corresponding relationship with the NDVI on the spatial scale, it was not considered in this paper. In future research, the quantitative exploration of human factors should be strengthened.

5. Conclusions

Based on the MOD 13A2 NDVI time-series data and the observational data from surface meteorological stations on the Qinghai-Tibet Plateau from 2000 to 2018, this study extracted the related phenological parameters from the AM, AS and VQTP and determined the phenological characteristics and differences in the three. The trend analysis method was used to analyze the spatiotemporal dynamic change trend of the growing season NDVI in the AM, AS and VQTP from the perspectives of time and space. Lastly, a correlation analysis was used to discuss the correlation between the growing season NDVI and climatic factors in the AM, AS and VQTP and their response differences. The primary conclusions are as follows:
(1)
Due to different vegetation types and regional differences in temperature and precipitation, the SGS, EGS and LGS of the AM, AS and VQTP were different. The SGS of the AS and VQTP were approximately half a month later than that of the AM, while the EGS were approximately half a month earlier than that of the AM. Their LGS values were clearly shorter than that of AM.
(2)
The growing season NDVI of the AM, AS and VQTP all showed significant upward trends from 2000 to 2018, and there were obvious differences in the fluctuation range and change rate between them, among which the AS had the fastest change rate.
(3)
From 2000 to 2018, the NDVI of the AM, AS and VQTP all showed upward trends in each season. The NDVI of the AM and VQTP increased at the fastest rate in the spring, while the NDVI of the AS increased at the fastest rate during the growing season. The peak growth periods of the AM, AS and VQTP were all in the summer. The fluctuation trends of the NDVI for the AM, AS and VQTP were relatively consistent during different seasons, indicating that the AM and AS played key and decisive roles in the overall vegetation change trend on the Qinghai-Tibet Plateau.
(4)
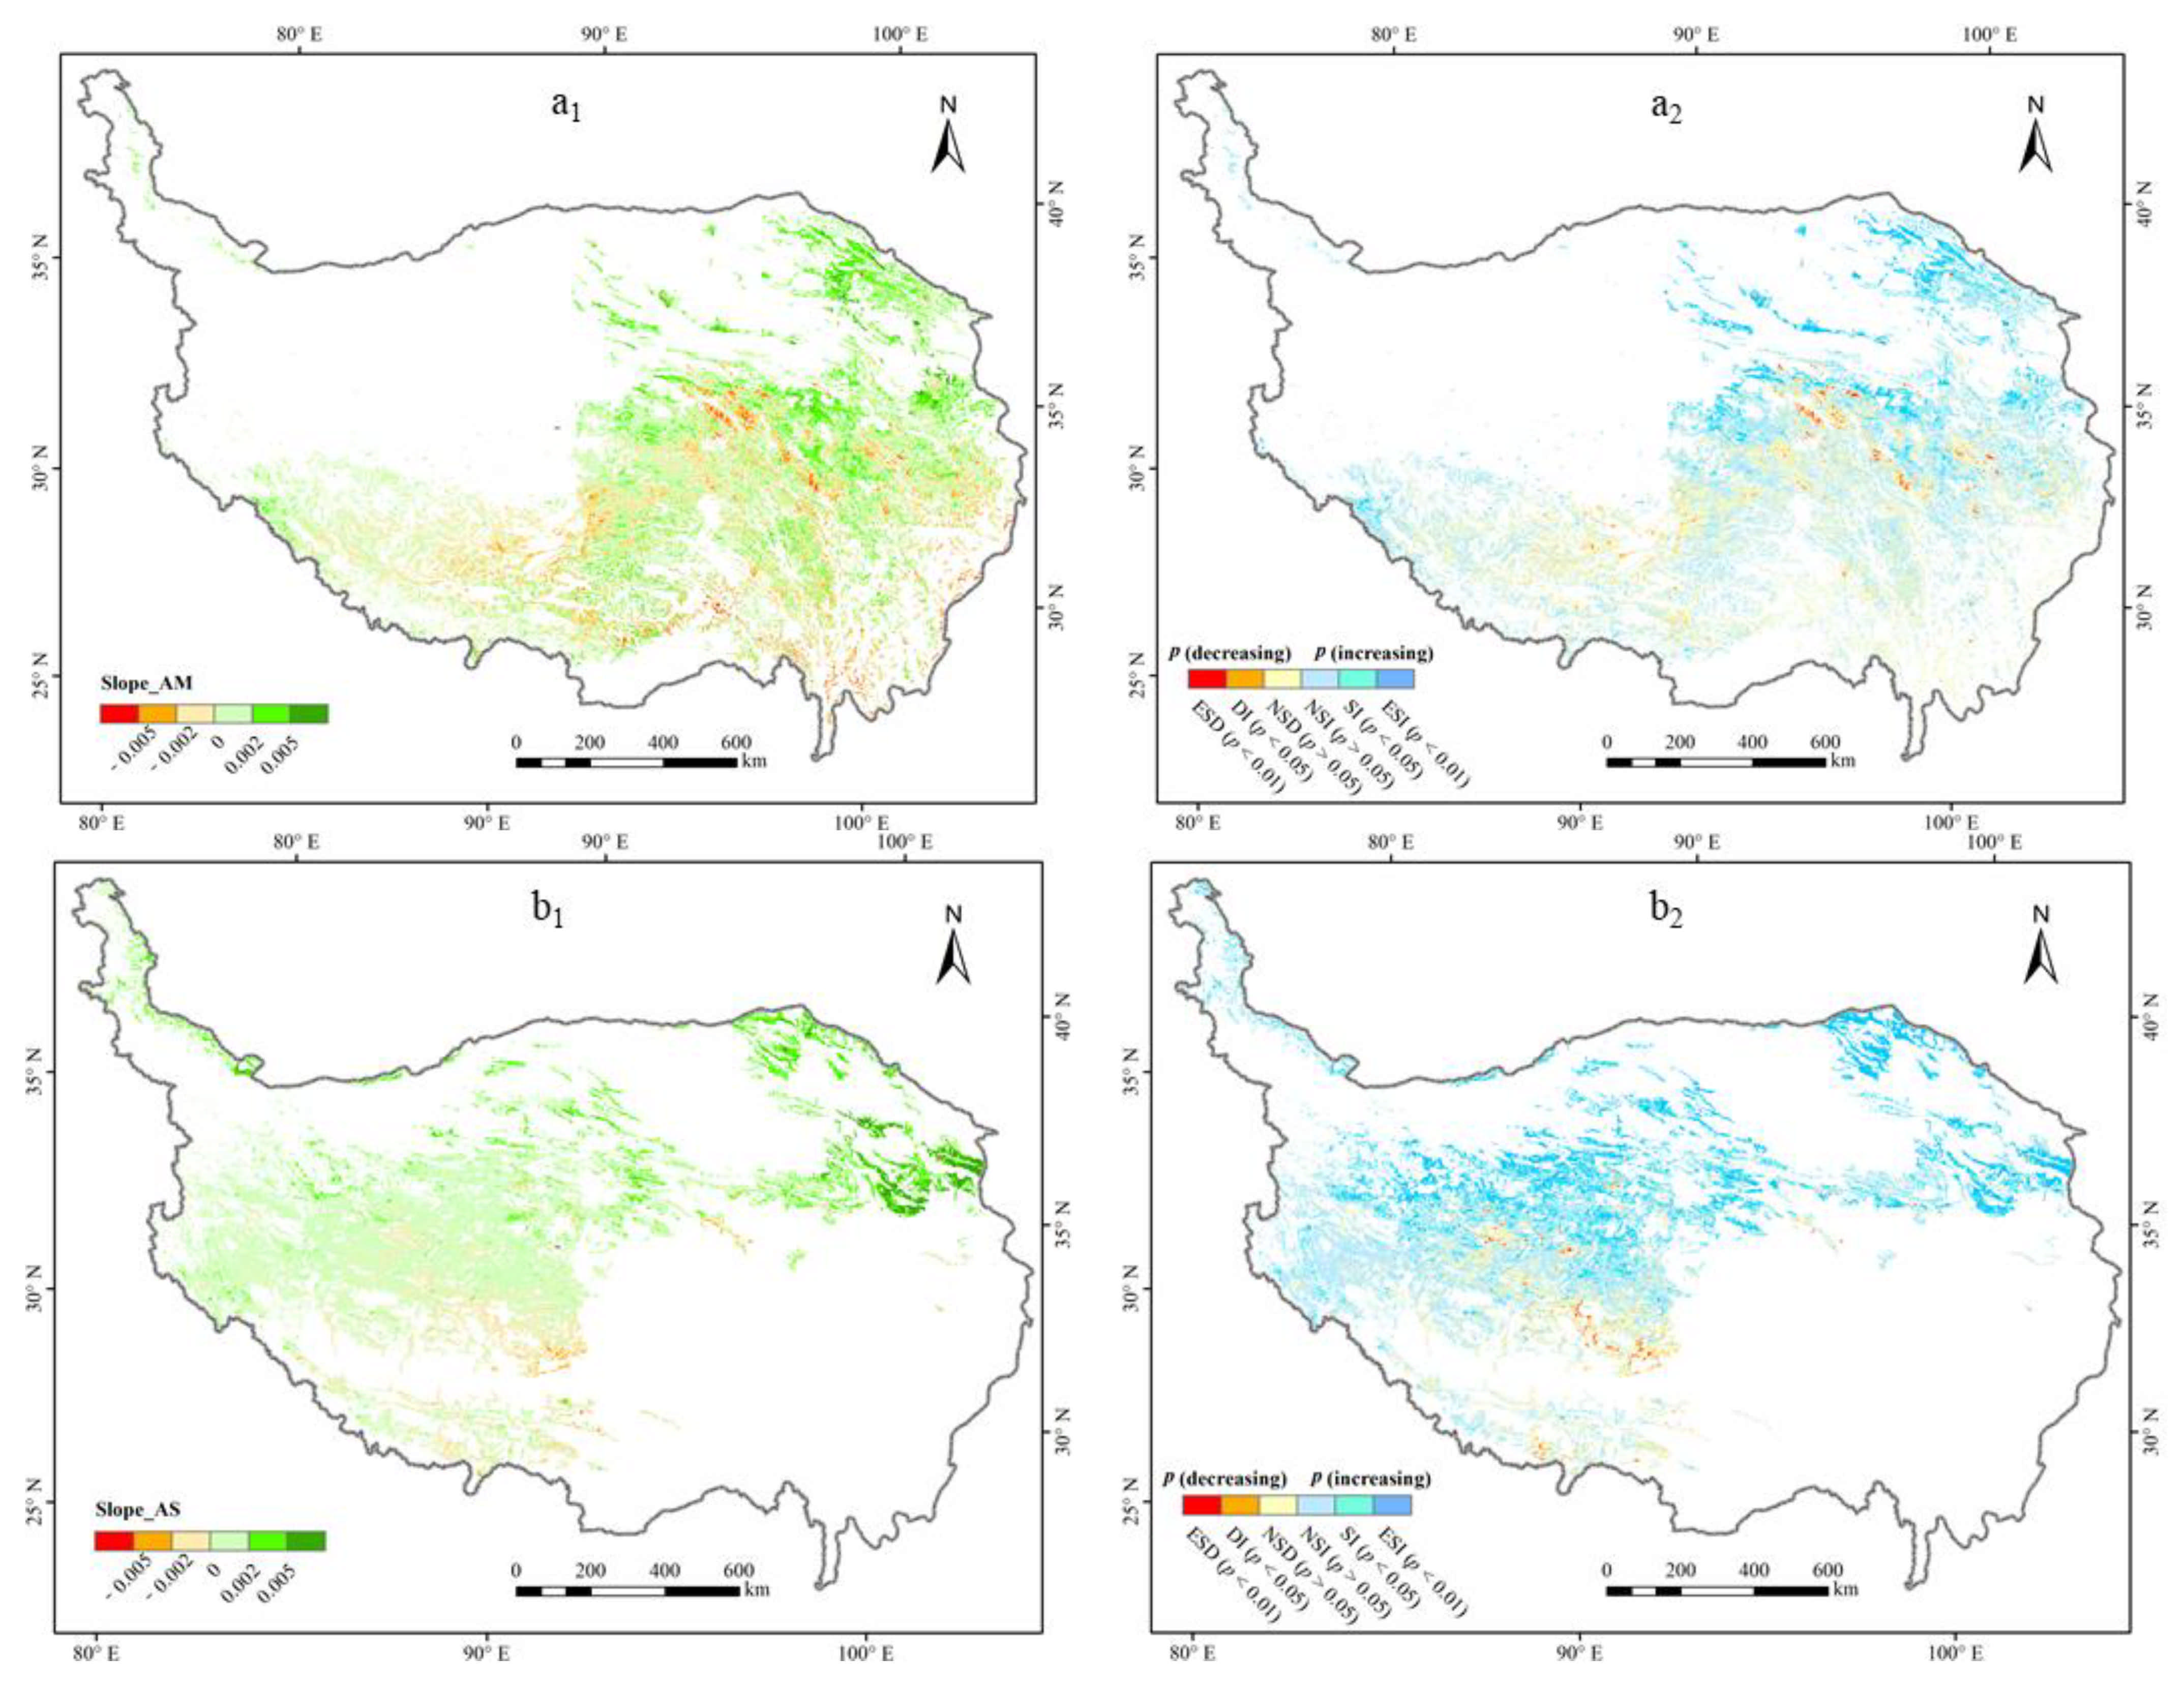
The growing season NDVI showed an increasing trend in most regions of the Qinghai-Tibet Plateau from 2000 to 2018, among which the significantly increased regions were mainly distributed along the midwestern and northeastern regions of the Qinghai-Tibet Plateau, with the Qilian Mountains being the most typical region. The areas of significant decline were mainly distributed among the surrounding areas of Namtso and Siling Co in Tibet and the source region of the Yangtze River in Qinghai Province. The overall improvement in vegetation on the Qinghai-Tibet Plateau was mainly dominated by AM and AS, while vegetation degradation primarily occurred in the AM, and the seriously degraded regions were largely concentrated in areas where AM was distributed.
(5)
The significant positive feedback region of the AM on annual precipitation was primarily between the 400 mm and 600 mm isohyet areas, while the positive feedback region of the AS on annual precipitation was mostly distributed around the 400 mm isohyet area. The regions with a significant positive correlation between AM and AS and annual mean temperatures were all located between the −5 °C and 1 °C isotherm areas, and the significant impact of the temperature on the vegetation of the Qinghai-Tibet Plateau was mostly based on alpine grassland. The correlation between the NDVI and climatic factors in different regions and different vegetation types had great spatial heterogeneity.

Author Contributions

Conceptualization, H.D. and X.X.; methodology, H.D.; software, H.D. and W.K.; validation, H.D.; formal analysis, H.D.; investigation, W.K. and S.L.; resources, W.K.; data curation, H.D.; writing—original draft preparation, H.D.; writing—review and editing, X.X.; visualization, J.L.; supervision, T.W.; project administration, J.L.; funding acquisition, X.X. and T.W. All authors have read and agreed to the published version of the manuscript.

Funding

This research was funded by the Second Tibetan Plateau Scientific Expedition and Research Program (2019QZKK0305), the Strategic Priority Research Program of the Chinese Academy of Sciences (XDA20100101), and the National Natural Science Foundation of China (41771233).

Institutional Review Board Statement

Not applicable.

Informed Consent Statement

Not applicable.

Data Availability Statement

The data presented in this study are available on request from the corresponding author.

Acknowledgments

We thank the Land Processes Distributed Active Archive Center (LP DAAC) of the United States for providing remote sensing data, the Resource and Environment Science and Data Center (RESDC) and the China Meteorological Data Service Center (CMDC) for providing vegetation type data, DEM data and meteorological data. We also thank the four anonymous reviewers for their insightful comments and the editor’s help that further improved our manuscript.

Conflicts of Interest

The authors declare no conflict of interest.

References

  1. Ding, M.J.; Zhang, Y.L.; Sun, X.M.; Liu, L.S.; Wang, Z.F.; Bai, W.Q. Spatiotemporal variation in alpine grassland phenology in the Qinghai-Tibetan Plateau from 1999 to 2009. Chin. Sci. Bull. 2013, 58, 396–405. [Google Scholar] [CrossRef]
  2. Jeong, S.J.; Ho, C.H.; Gim, H.J.; Brown, M.E. Phenology shifts at start vs. end of growing season in temperate vegetation over the Northern Hemisphere for the period 1982–2008. Glob. Chang. Biol. 2011, 17, 2385–2399. [Google Scholar] [CrossRef]
  3. Myneni, R.B.; Keeling, C.D.; Tucker, C.J.; Asrar, G.; Nemani, R.R. Increased plant growth in the northern high latitudes from 1981 to 1991. Nature 1997, 386, 698–702. [Google Scholar] [CrossRef]
  4. Peng, J.; Liu, Z.H.; Liu, Y.H.; Wu, J.S.; Han, Y.A. Trend analysis of vegetation dynamics in Qinghai-Tibet Plateau using Hurst Exponent. Ecol. Indic. 2012, 14, 28–39. [Google Scholar] [CrossRef]
  5. Dutrieux, L.P.; Bartholomeus, H.; Herold, M.; Verbesselt, J. Relationships between declining summer sea ice, increasing temperatures and changing vegetation in the Siberian Arctic tundra from MODIS time series (2000–2011). Environ. Res. Lett. 2012, 7, 044028. [Google Scholar] [CrossRef]
  6. Jia, L.; Li, Z.B.; Xu, G.C.; Ren, Z.P.; Li, P.; Cheng, Y.T.; Zhang, Y.X.; Wang, B.; Zhang, J.X.; Yu, S. Dynamic change of vegetation and its response to climate and topographic factors in the Xijiang River basin, China. Environ. Sci. Pollut. Res. 2020, 27, 11637–11648. [Google Scholar] [CrossRef] [PubMed]
  7. Kawabata, A.; Ichii, K.; Yamaguchi, Y. Global monitoring of interannual changes in vegetation activities using NDVI and its relationships to temperature and precipitation. Int. J. Remote Sens. 2001, 22, 1377–1382. [Google Scholar] [CrossRef]
  8. Zhong, L.; Ma, Y.M.; Xue, Y.K.; Piao, S.L. Climate Change Trends and Impacts on Vegetation Greening Over the Tibetan Plateau. J. Geophys. Res. Atmos. 2019, 124, 7540–7552. [Google Scholar] [CrossRef]
  9. Nemani, R.R.; Keeling, C.D.; Hashimoto, H.; Jolly, W.M.; Piper, S.C.; Tucker, C.J.; Myneni, R.B.; Running, S.W. Climate-driven increases in global terrestrial net primary production from 1982 to 1999. Science 2003, 300, 1560–1563. [Google Scholar] [CrossRef] [PubMed]
  10. Piao, S.L.; Fang, J.Y.; He, J.S. Variations in vegetation net primary production in the Qinghai-Xizang Plateau, China, from 1982 to 1999. Clim. Chang. 2006, 74, 253–267. [Google Scholar] [CrossRef]
  11. Roerink, G.J.; Menenti, M.; Soepboer, W.; Su, Z. Assessment of climate impact on vegetation dynamics by using remote sensing. Phys. Chem. Earth 2003, 28, 103–109. [Google Scholar] [CrossRef]
  12. Weiss, E.; Marsh, S.E.; Pfirman, E.S. Application of NOAA-AVHRR NDVI time-series data to assess changes in Saudi Arabia’s rangelands. Int. J. Remote Sens. 2001, 22, 1005–1027. [Google Scholar] [CrossRef]
  13. Zhang, L.; Guo, H.D.; Ji, L.; Lei, L.P.; Wang, C.Z.; Yan, D.M.; Li, B.; Li, J. Vegetation greenness trend (2000 to 2009) and the climate controls in the Qinghai-Tibetan Plateau. J. Appl. Remote Sens. 2013, 7, 073572. [Google Scholar] [CrossRef]
  14. Biswas, K.; Chatterjee, A.; Chakraborty, J. Comparison of Air Pollutants Between Kolkata and Siliguri, India, and Its Relationship to Temperature Change. J. Geovis. Spat. Anal. 2020, 4, 25. [Google Scholar] [CrossRef]
  15. Han, B.H.; Zhou, B.R.; Yan, Y.Q.; Shi, M.M.; Su, S.L.; Zhao, H.H.; Niu, D.C.; Fu, H. Analysis of vegetation coverage change and its driving factors over Tibetan Plateau from 2000 to 2008. Acta Agrestia Sin. 2019, 27, 1651–1658. [Google Scholar] [CrossRef]
  16. Ding, M.J.; Zhang, Y.L.; Liu, L.S.; Zhang, W.; Wang, Z.F.; Bai, W.Q. The relationship between NDVI and precipitation on the Tibetan Plateau. J. Geogr. Sci. 2007, 17, 259–268. [Google Scholar] [CrossRef]
  17. Tucker, C.J.; Slayback, D.A.; Pinzon, J.E.; Los, S.O.; Myneni, R.B.; Taylor, M.G. Higher northern latitude normalized difference vegetation index and growing season trends from 1982 to 1999. Int. J. Biometeorol. 2001, 45, 184–190. [Google Scholar] [CrossRef]
  18. Anyamba, A.; Tucker, C.J. Analysis of Sahelian vegetation dynamics using NOAA-AVHRR NDVI data from 1981–2003. J. Arid. Environ. 2005, 63, 596–614. [Google Scholar] [CrossRef]
  19. Jamali, S.; Seaquist, J.; Eldundh, L.; Ardo, J. Automated mapping of vegetation trends with polynomials using NDVI imagery over the Sahel. Remote Sens. Environ. 2014, 141, 79–89. [Google Scholar] [CrossRef]
  20. Maxwell, S.K.; Sylvester, K.M. Identification of “ever-cropped” land (1984–2010) using Landsat annual maximum NDVI image composites: Southwestern Kansas case study. Remote Sens. Environ. 2012, 121, 186–195. [Google Scholar] [CrossRef]
  21. Munyati, C.; Mboweni, G. Variation in NDVI values with change in spatial resolution for semi-arid savanna vegetation: A case study in northwestern South Africa. Int. J. Remote Sens. 2013, 34, 2253–2267. [Google Scholar] [CrossRef]
  22. Walker, D.A.; Epstein, H.E.; Raynolds, M.K.; Kuss, P.; Kopecky, M.A.; Frost, G.V.; Daniels, F.J.A.; Leibman, M.O.; Moskalenko, N.G.; Matyshak, G.V.; et al. Environment, vegetation and greenness (NDVI) along the North America and Eurasia Arctic transects. Environ. Res. Lett. 2012, 7, 015504. [Google Scholar] [CrossRef]
  23. Bao, G.; Qin, Z.H.; Bao, Y.H.; Zhou, Y.; Li, W.J.; Sanjjav, A. NDVI-Based Long-Term Vegetation Dynamics and Its Response to Climatic Change in the Mongolian Plateau. Remote Sens. 2014, 6, 8337–8358. [Google Scholar] [CrossRef]
  24. Zhou, X.; Yamaguchi, Y.; Arjasakusuma, S. Distinguishing the vegetation dynamics induced by anthropogenic factors using vegetation optical depth and AVHRR NDVI: A cross-border study on the Mongolian Plateau. Sci. Total Environ. 2018, 616, 730–743. [Google Scholar] [CrossRef]
  25. Pang, G.J.; Wang, X.J.; Yang, M.X. Using the NDVI to identify variations in, and responses of, vegetation to climate change on the Tibetan Plateau from 1982 to 2012. Quat. Int. 2017, 444, 87–96. [Google Scholar] [CrossRef]
  26. Zhang, G.L.; Zhang, Y.J.; Dong, J.W.; Xiao, X.M. Green-up dates in the Tibetan Plateau have continuously advanced from 1982 to 2011. Proc. Natl. Acad. Sci. USA 2013, 110, 4309–4314. [Google Scholar] [CrossRef]
  27. Eastman, J.R.; Sangermano, F.; Machado, E.A.; Rogan, J.; Anyamba, A. Global Trends in Seasonality of Normalized Difference Vegetation Index (NDVI), 1982-2011. Remote Sens. 2013, 5, 4799–4818. [Google Scholar] [CrossRef]
  28. Fensholt, R.; Proud, S.R. Evaluation of Earth Observation based global long term vegetation trends—Comparing GIMMS and MODIS global NDVI time series. Remote Sens. Environ. 2012, 119, 131–147. [Google Scholar] [CrossRef]
  29. Wu, D.H.; Wu, H.; Zhao, X.; Zhou, T.; Tang, B.J.; Zhao, W.Q.; Jia, K. Evaluation of Spatiotemporal Variations of Global Fractional Vegetation Cover Based on GIMMS NDVI Data from 1982 to 2011. Remote Sens. 2014, 6, 4217–4239. [Google Scholar] [CrossRef]
  30. Piao, S.L.; Fang, J.Y.; Zhou, L.M.; Guo, Q.H.; Henderson, M.; Ji, W.; Li, Y.; Tao, S. Interannual variations of monthly and seasonal normalized difference vegetation index (NDVI) in China from 1982 to 1999. J. Geophys. Res. Atmos. 2003, 108. [Google Scholar] [CrossRef]
  31. Sarmah, S.; Jia, G.S.; Zhang, A.Z.; Singha, M. Assessing seasonal trends and variability of vegetation growth from NDVI3g, MODIS NDVI and EVI over South Asia. Remote Sens. Lett. 2018, 9, 1195–1204. [Google Scholar] [CrossRef]
  32. Ji, L.; Peters, A.J. A spatial regression procedure for evaluating the relationship between AVHRR-NDVI and climate in the northern Great Plains. Int. J. Remote Sens. 2004, 25, 297–311. [Google Scholar] [CrossRef]
  33. Ren, S.L.; Yi, S.H.; Peichl, M.; Wang, X.Y. Diverse Responses of Vegetation Phenology to Climate Change in Different Grasslands in Inner Mongolia during 2000–2016. Remote Sens. 2018, 10, 17. [Google Scholar] [CrossRef]
  34. Wu, S.H.; Zhou, S.L.; Chen, D.X.; Wei, Z.Q.; Dai, L.; Li, X.G. Determining the contributions of urbanisation and climate change to NPP variations over the last decade in the Yangtze River Delta, China. Sci. Total Environ. 2014, 472, 397–406. [Google Scholar] [CrossRef]
  35. Camberlin, P.; Martiny, N.; Philippon, N.; Richard, Y. Determinants of the interannual relationships between remote sensed photosynthetic activity and rainfall in tropical Africa. Remote Sens. Environ. 2007, 106, 199–216. [Google Scholar] [CrossRef]
  36. Detsch, F.; Otte, I.; Appelhans, T.; Hemp, A.; Nauss, T. Seasonal and long-term vegetation dynamics from 1-km GIMMS-based NDVI time series at Mt. Kilimanjaro, Tanzania. Remote Sens. Environ. 2016, 178, 70–83. [Google Scholar] [CrossRef]
  37. Piao, S.L.; Fang, J.Y.; Chen, A.P. Seasonal dynamics of terrestrial net primary production in response to climate changes in China. Acta Bot. Sin. 2003, 45, 269–275. [Google Scholar]
  38. Zhou, L.M.; Tucker, C.J.; Kaufmann, R.K.; Slayback, D.; Shabanov, N.V.; Myneni, R.B. Variations in northern vegetation activity inferred from satellite data of vegetation index during 1981 to 1999. J. Geophys. Res. Atmos. 2001, 106, 20069–20083. [Google Scholar] [CrossRef]
  39. He, B.; Chen, A.F.; Wang, H.L.; Wang, Q.F. Dynamic Response of Satellite-Derived Vegetation Growth to Climate Change in the Three North Shelter Forest Region in China. Remote Sens. 2015, 7, 9998–10016. [Google Scholar] [CrossRef]
  40. Kang, C.; Zhang, Y.L.; Wang, Z.F.; Liu, L.S.; Zhang, H.M.; Jo, Y. The Driving Force Analysis of NDVI Dynamics in the Trans-Boundary Tumen River Basin between 2000 and 2015. Sustainability 2017, 9, 2350. [Google Scholar] [CrossRef]
  41. Duo, A.; Zhao, W.J.; Qua, X.Y.; Jing, R.; Xiong, K. Spatio-temporal variation of vegetation coverage and its response to climate change in North China plain in the last 33 years. Int. J. Appl. Earth Obs. 2016, 53, 103–117. [Google Scholar] [CrossRef]
  42. Wang, L.W.; Wei, Y.X.; Niu, Z. Spatial and temporal variations of vegetation in Qinghai Province based on satellite data. J. Geogr. Sci. 2008, 18, 73–84. [Google Scholar] [CrossRef]
  43. Zhang, G.L.; Ouyang, H.; Zhang, X.Z.; Zhou, C.P.; Xu, X.L. Vegetation change and its responses to climatic variation based on eco-geographical regions of Tibetan Plateau. Geogr. Res. 2010, 29, 2004–2016. [Google Scholar] [CrossRef]
  44. Immerzeel, W.W.; van Beek, L.P.H.; Bierkens, M.F.P. Climate Change Will Affect the Asian Water Towers. Science 2010, 328, 1382–1385. [Google Scholar] [CrossRef] [PubMed]
  45. Rajagopalan, B.; Molnar, P. Signatures of Tibetan Plateau heating on Indian summer monsoon rainfall variability. J. Geophys. Res. Atmos. 2013, 118, 1170–1178. [Google Scholar] [CrossRef]
  46. Zhang, Q.; Kong, D.D.; Shi, P.J.; Singh, V.P.; Sun, P. Vegetation phenology on the Qinghai-Tibetan Plateau and its response to climate change (1982–2013). Agric. For. Meteorol. 2018, 248, 408–417. [Google Scholar] [CrossRef]
  47. Sun, H.L.; Zheng, D.; Yao, T.D.; Zhang, Y.L. Protection and Construction of the National Ecological Security Shelter Zone on Tibetan Plateau. Acta Geogr. Sin. 2012, 67, 3–12. [Google Scholar] [CrossRef]
  48. Zhong, L.; Ma, Y.M.; Salama, M.S.; Su, Z.B. Assessment of vegetation dynamics and their response to variations in precipitation and temperature in the Tibetan Plateau. Clim. Chang. 2010, 103, 519–535. [Google Scholar] [CrossRef]
  49. Wang, B.; Bao, Q.; Hoskins, B.; Wu, G.X.; Liu, Y.M. Tibetan plateau warming and precipitation changes in East Asia. Geophys. Res. Lett. 2008, 35. [Google Scholar] [CrossRef]
  50. Zhang, L.; Guo, H.D.; Wang, C.Z.; Ji, L.; Li, J.; Wang, K.; Dai, L. The long-term trends (1982–2006) in vegetation greenness of the alpine ecosystem in the Qinghai-Tibetan Plateau. Environ. Earth Sci. 2014, 72, 1827–1841. [Google Scholar] [CrossRef]
  51. Sun, J.; Qin, X.J.; Yang, J. The response of vegetation dynamics of the different alpine grassland types to temperature and precipitation on the Tibetan Plateau. Environ. Monit. Assess. 2016, 188. [Google Scholar] [CrossRef]
  52. Zhang, H.Y.; Fan, J.W.; Wang, J.B.; Cao, W.; Harris, W. Spatial and temporal variability of grassland yield and its response to climate change and anthropogenic activities on the Tibetan Plateau from 1988 to 2013. Ecol. Indic. 2018, 95, 141–151. [Google Scholar] [CrossRef]
  53. Zhou, W.; Gang, C.C.; Chen, Y.Z.; Mu, S.J.; Sun, Z.G.; Li, J.L. Grassland coverage inter-annual variation and its coupling relation with hydrothermal factors in China during 1982-2010. J. Geogr. Sci. 2014, 24, 593–611. [Google Scholar] [CrossRef]
  54. Wang, C.Z.; Guo, H.D.; Zhang, L.; Liu, S.Y.; Qiu, Y.B.; Sun, Z.C. Assessing phenological change and climatic control of alpine grasslands in the Tibetan Plateau with MODIS time series. Int. J. Biometeorol. 2015, 59, 11–23. [Google Scholar] [CrossRef]
  55. Xia, J.Z.; Ma, M.N.; Liang, T.G.; Wu, C.Y.; Yang, Y.H.; Zhang, L.; Zhang, Y.J.; Yuan, W.P. Estimates of grassland biomass and turnover time on the Tibetan Plateau. Environ. Res. Lett. 2018, 13. [Google Scholar] [CrossRef]
  56. Hao, A.H.; Xue, X.; Peng, F.; You, Q.G.; Liao, J.; Duan, H.C.; Huang, C.H.; Dong, S.Y. Different vegetation and soil degradation characteristics of a typical grassland in the Qinghai-Tibetan Plateau. Acta Ecol. Sin. 2020, 40, 964–975. [Google Scholar] [CrossRef]
  57. Ganjurjav, H.; Gao, Q.Z.; Gornish, E.S.; Schwartz, M.W.; Liang, Y.; Cao, X.J.; Zhang, W.N.; Zhang, Y.; Li, W.H.; Wan, Y.F.; et al. Differential response of alpine steppe and alpine meadow to climate warming in the central Qinghai-Tibetan Plateau. Agric. For. Meteorol. 2016, 223, 233–240. [Google Scholar] [CrossRef]
  58. Peng, F.; Xue, X.; Li, C.Y.; Lai, C.M.; Sun, J.; Tsubo, M.; Tsunekawa, A.; Wang, T. Plant community of alpine steppe shows stronger association with soil properties than alpine meadow alongside degradation. Sci. Total Environ. 2020, 733. [Google Scholar] [CrossRef]
  59. Shen, M.G.; Zhang, G.X.; Cong, N.; Wang, S.P.; Kong, W.D.; Piao, S.L. Increasing altitudinal gradient of spring vegetation phenology during the last decade on the Qinghai-Tibetan Plateau. Agric. For. Meteorol. 2014, 189, 71–80. [Google Scholar] [CrossRef]
  60. Yao, T.; Wu, F.; Ding, L.; Sun, J.; Zhu, L.; Piao, S.L.; Deng, T.; Ni, X.; Zheng, H.; Ouyang, H. Multispherical interactions and their effects on the Tibetan Plateau’s earth system: A review of the recent researches. Natl Sci. Rev. 2015, 2, 468–488. [Google Scholar] [CrossRef]
  61. Chen, X.Q.; An, S.; Inouye, D.W.; Schwartz, M.D. Temperature and snowfall trigger alpine vegetation green-up on the world’s roof. Glob. Chang. Biol. 2015, 21, 3635–3646. [Google Scholar] [CrossRef]
  62. Zhang, Y.L.; Li, B.Y.; Zheng, D. A discussion on the boundary and area of the Tibetan Plateau in China. Geogr. Res. 2002, 21, 128. [Google Scholar] [CrossRef]
  63. Xu, H.J.; Wang, X.P.; Zhang, X.X. Alpine grasslands response to climatic factors and anthropogenic activities on the Tibetan Plateau from 2000 to 2012. Ecol. Eng. 2016, 92, 251–259. [Google Scholar] [CrossRef]
  64. Mo, S.G.; Zhang, B.P.; Cheng, W.M.; Tan, Y.; Xiao, F.; Wu, H.Z. Major environmental effects of the Tibetan Plateau. Prog. Geogr. 2004, 23, 88–96. [Google Scholar] [CrossRef]
  65. Luo, T.X.; Pan, Y.D.; Ouyang, H.; Shi, P.L.; Luo, J.; Yu, Z.L.; Lu, Q. Leaf area index and net primary productivity along subtropical to alpine gradients in the Tibetan Plateau. Glob. Ecol. Biogeogr. 2004, 13, 345–358. [Google Scholar] [CrossRef]
  66. Luo, C.Y.; Xu, G.P.; Chao, Z.G.; Wang, S.P.; Lin, X.W.; Hu, Y.G.; Zhang, Z.H.; Duan, J.C.; Chang, X.F.; Su, A.L.; et al. Effect of warming and grazing on litter mass loss and temperature sensitivity of litter and dung mass loss on the Tibetan plateau. Glob. Chang. Biol. 2010, 16, 1606–1617. [Google Scholar] [CrossRef]
  67. Li, L.H.; Liu, L.S.; Zhang, Y.L.; Ding, M.J.; Li, S.C.; Chen, Q. Elevation-dependent alpine grassland phenology on the Tibetan Plateau. Geogr. Res. 2017, 36, 26–36. [Google Scholar] [CrossRef]
  68. Holben, B.N. Characteristics of Maximum-Value Composite Images from Temporal Avhrr Data. Int. J. Remote Sens. 1986, 7, 1417–1434. [Google Scholar] [CrossRef]
  69. Li, P.; Peng, C.H.; Wang, M.; Luo, Y.P.; Li, M.X.; Zhang, K.R.; Zhang, D.L.; Zhu, Q.A. Dynamics of vegetation autumn phenology and its response to multiple environmental factors from 1982 to 2012 on Qinghai-Tibetan Plateau in China. Sci. Total Environ. 2018, 637, 855–864. [Google Scholar] [CrossRef] [PubMed]
  70. Piao, S.L.; Fang, J.Y.; Zhou, L.M.; Ciais, P.; Zhu, B. Variations in satellite-derived phenology in China’s temperate vegetation. Glob. Chang. Biol. 2006, 12, 672–685. [Google Scholar] [CrossRef]
  71. You, Q.Y.; Xue, X.; Peng, F.; Xu, M.H.; Duan, H.C.; Dong, S.Y. Comparison of ecosystem characteristics between degraded and intact alpine meadow in the Qinghai-Tibetan Plateau, China. Ecol. Eng. 2014, 71, 133–143. [Google Scholar] [CrossRef]
  72. Ma, M.G.; Veroustraete, F. Reconstructing pathfinder AVHRR land NDVI time-series data for the Northwest of China. Adv. Space Res. Ser. 2006, 37, 835–840. [Google Scholar] [CrossRef]
  73. Duan, H.C.; Yan, C.Z.; Tsunekawa, A.; Song, X.; Li, S.; Xie, J.L. Assessing vegetation dynamics in the Three-North Shelter Forest region of China using AVHRR NDVI data. Environ. Earth Sci. 2011, 64, 1011–1020. [Google Scholar] [CrossRef]
  74. He, D.; Huang, X.L.; Tian, Q.J.; Zhang, Z.C. Changes in Vegetation Growth Dynamics and Relations with Climate in Inner Mongolia under More Strict Multiple Pre-Processing (2000–2018). Sustainability 2020, 12, 2534. [Google Scholar] [CrossRef]
  75. Guo, W.; Ni, X.N.; Jing, D.Y.; Li, S.H. Spatial-temporal patterns of vegetation dynamics and their relationships to climate variations in Qinghai Lake Basin using MODIS time-series data. J. Geogr. Sci. 2014, 24, 1009–1021. [Google Scholar] [CrossRef]
  76. Mu, S.J.; Yang, H.F.; Li, J.L.; Chen, Y.Z.; Gang, C.C.; Zhou, W.; Ju, W.M. Spatio-temporal dynamics of vegetation coverage and its relationship with climate factors in Inner Mongolia, China. J. Geogr. Sci. 2013, 23, 231–246. [Google Scholar] [CrossRef]
  77. Ran, Q.W.; Hao, Y.B.; Xia, A.Q.; Liu, W.J.; Hu, R.H.; Cui, X.Y.; Xue, K.; Song, X.N.; Xu, C.; Ding, B.Y.; et al. Quantitative Assessment of the Impact of Physical and Anthropogenic Factors on Vegetation Spatial-Temporal Variation in Northern Tibet. Remote Sens. 2019, 11, 1183. [Google Scholar] [CrossRef]
  78. Qi, X.Z.; Jia, J.H.; Liu, H.Y.; Lin, Z.S. Relative importance of climate change and human activities for vegetation changes on China’s silk road economic belt over multiple timescales. Catena 2019, 180, 224–237. [Google Scholar] [CrossRef]
  79. Liu, Y.L.; Lei, H.M. Responses of Natural Vegetation Dynamics to Climate Drivers in China from 1982 to 2011. Remote Sens. 2015, 7, 10243–10268. [Google Scholar] [CrossRef]
  80. Sayemuzzaman, M.; Jha, M.K. Seasonal and annual precipitation time series trend analysis in North Carolina, United States. Atmos. Res. 2014, 137, 183–194. [Google Scholar] [CrossRef]
  81. Chen, J.H.; Yan, F.; Lu, Q. Spatiotemporal Variation of Vegetation on the Qinghai-Tibet Plateau and the Influence of Climatic Factors and Human Activities on Vegetation Trend (2000–2019). Remote Sens. 2020, 12, 3150. [Google Scholar] [CrossRef]
  82. Piao, S.L.; Fang, J.Y. Terrestrial net primary production and its spatio-temporal patterns in Qinghai-Xizang Plateau, China during 1982–1999. J. Nat. Resour. 2002, 17, 373–380. [Google Scholar] [CrossRef]
  83. Xu, W.X.; Liu, X.D. Response of vegetation in the Qinghai-Tibet Plateau to global warming. Chin. Geogr. Sci. 2007, 17, 151–159. [Google Scholar] [CrossRef]
  84. Zhang, X.Z.; Yang, Y.P.; Piao, S.L.; Bao, W.K.; Wang, S.P.; Wang, G.X.; Sun, H.; Luo, T.X.; Zhang, Y.J.; Shi, P.L.; et al. Ecological change on the Tibetan Plateau. Chin. Sci. Bull. 2015, 60, 3048–3056. [Google Scholar] [CrossRef]
  85. Huang, X.L.; Zhang, T.B.; Yi, G.H.; He, D.; Zhou, X.B.; Li, J.J.; Bie, X.J.; Miao, J.Q. Dynamic Changes of NDVI in the Growing Season of the Tibetan Plateau During the Past 17 Years and Its Response to Climate Change. Int. J. Environ. Res. Public Health 2019, 16, 3452. [Google Scholar] [CrossRef] [PubMed]
Figure 1. Geographical location and topographic map of the Qinghai-Tibet Plateau.
Remotesensing 13 00669 g001
Figure 2. Spatial distribution map of alpine meadow and alpine steppe along the Qinghai-Tibet Plateau as adapted from the 1:1,000,000 vegetation map.
Remotesensing 13 00669 g002
Figure 3. Comparison of phenological parameters (SGS, EGS and LGS) of the AM, AS and VQTP based on the 16-day NDVI time series. SGS, start of the growing season; EGS, end of the growing season; LGS, length of the growing season; AM, alpine meadow; AS, alpine steppe; VQTP, overall vegetation of the Qinghai-Tibetan Plateau.
Remotesensing 13 00669 g003
Figure 4. Interannual variation characteristics of the growing season NDVI from 2000 to 2018: (a) VQTP, (b) AM, and (c) AS.
Remotesensing 13 00669 g004
Figure 5. Interannual variation characteristics of the AM, AS and VQTP seasonal NDVI: (a) growing season, (b) spring, (c) summer, and (d) autumn.
Remotesensing 13 00669 g005
Figure 6. Spatial distribution of the NDVI slope (a) and significance level (b) in the Qinghai-Tibet Plateau (QTP) during the growing season from 2000 to 2018. p(decreasing) and p(increasing) are the p values of the decrease and increase for the growing season NDVI, respectively, which are divided into three levels: p < 0.01, 0.01 < p < 0.05, and p > 0.05.
Remotesensing 13 00669 g006
Figure 7. Spatial distribution of the AM_NDVI slope (a1) and its significance level (SL) (a2) and the AS_NDVI slope (b1) and its significance level (SL) (b2) during the growing season from 2000 to 2018. p(decreasing) and p(increasing) are the p values of the decrease and increase for the growing season NDVI, respectively, which are divided into three levels: p < 0.01, 0.01 < p < 0.05, and p > 0.05.
Remotesensing 13 00669 g007
Figure 8. The spatial distribution characteristics of climatic factors and their interannual variation trend from 2000 to 2018: (a) Spatial distribution of average annual precipitation over the QTP, (b) spatial distribution of average annual mean temperature over the QTP, (c) the variation trend in annual precipitation in the QTP, AM and AS from 2000 to 2018, (d) the variation trend in annual mean temperature in the QTP, AM and AS from 2000 to 2018, (e) slope spatial distribution of annual precipitation in the QTP from 2000 to 2018, and (f) slope spatial distribution of annual mean temperature in the QTP from 2000 to 2018.
Remotesensing 13 00669 g008aRemotesensing 13 00669 g008b
Figure 9. The correlation and spatial distribution of the significance level between the growing season NDVI and annual precipitation, annual mean temperature: (a) VQTP_NDVI and precipitation, (a1) AM_NDVI and precipitation, (a2) AS_NDVI and precipitation, (b) VQTP_NDVI and temperature, (b1) AM_NDVI and temperature, (b2) AS_NDVI and temperature.
Remotesensing 13 00669 g009
Table 1. Correlation coefficient and significance of the NDVI during different seasons for the AM, AS and VQTP from 2000 to 2018.
CorrelativityGrowing SeasonSpringSummerAutumn
AM & VQTP0.803 **0.935 **0.920 **0.954 **
AS & VQTP0.463 *0.604 **0.4200.739 **
AM & AS0.670 **0.725 **0.4280.607 **
* indicates a significant correlation at the 0.05 level. ** indicates a significant correlation at the 0.01 level.
Table 2. Statistics on the variation trend in the NDVI during the growing seasons in the VQTP from 2000 to 2018.
Variation TrendZ ValueArea/×104 km2Area
Percentage/%
Extremely significant increase
(slope > 0, p < 0.01)
≥2.57624.8113.18
Significant increase
(slope > 0, 0.01 < Pp < 0.05)
1.96~2.57618.469.81
Nonsignificant increase
(slope > 0, p > 0.05)
0~1.9687.4446.45
Nonsignificant decrease
(slope < 0, p > 0.05)
−1.96–053.9628.66
Significant decrease
(slope < 0, 0.01 < p < 0.05)
−2.576~−1.962.501.33
Extremely significant decrease
(slope < 0, p < 0.01)
≤−2.5761.070.57
Note: the significance levels of 0.05 (Z = 1.96) and 0.01 (Z = 2.576) are regarded as the categorized criteria.
Table 3. Statistics for the growing season NDVI variation trends for the AM, AS and VQTP in the QTP from 2000 to 2018.
TypesIncreasing Area
/×104 km2
Decreasing Area
/×104 km2
Significant
Increasing
area/×104 km2
Significant
Decreasing
Area/×104 km2
AM38.2329.629.791.42
AS43.3510.4819.640.93
VQTP130.7157.5343.273.57
AM/VQTP (%)29.2551.4922.6339.78
AS/VQTP (%)33.1718.2245.3926.05
Publisher’s Note: MDPI stays neutral with regard to jurisdictional claims in published maps and institutional affiliations.

