Article

Spatio-Temporal Changes and Driving Forces of Vegetation Coverage on the Loess Plateau of Northern Shaanxi

1
Shaanxi Key Laboratory of Earth Surface System and Environmental Carrying Capacity, College of Urban and Environmental Science, Northwest University, Xi’an 710127, China
2
Department of Physical Geography, College of Urban and Environmental Science, Northwest University, Xi’an 710127, China
3
Key Laboratory of the Loess Plateau Soil Erosion and Water Loss Process and Control of MWR, Yellow River Institute of Hydraulic Research, Zhengzhou 450003, China
*
Author to whom correspondence should be addressed.
Remote Sens. 2021, 13(4), 613; https://doi.org/10.3390/rs13040613
Submission received: 4 January 2021 / Revised: 5 February 2021 / Accepted: 6 February 2021 / Published: 9 February 2021
(This article belongs to the Section Environmental Remote Sensing)

Abstract

:
As an important indicator of terrestrial ecosystems, vegetation plays an important role in the study of global or regional ecological environmental changes. Northern Shaanxi is located in the ecologically fragile area of the Loess Plateau, which is affected by interactions between natural and human factors. Here, we used the Normalized Difference Vegetation Index (NDVI) as an indicator to study the temporal and spatial variations of vegetation in Northern Shaanxi from 2000 to 2018. Based on the geographic detector method which can detect spatial differentiation, we analyzed the spatial differentiation characteristics and driving forces of vegetation in Northern Shaanxi, and revealed the most appropriate range or type of influencing factors for promoting vegetation growth. The results showed that the overall vegetation coverage improved in the study area, and NDVI showed an increasing trend with a growth rate of 0.10/10 years from 2000 to 2018. Natural and human factors are crucial driving forces of NDVI change, among which gross domestic product, land-use type, slope, and temperature have the greatest influence. The interaction between natural and human factors on NDVI was dominated by nonlinear and mutual enhancement effects, and the influence of interactions among all factors was significantly higher than that of a single factor. The range or types of factors suitable for vegetation growth were analyzed in the study area, and the joint action of natural and human factors had a more significant impact on vegetation. These findings provide a scientific basis for local governments to intervene in vegetation changes and ecological restoration through natural and human factors within the favorable scope.

Graphical Abstract

1. Introduction

Vegetation is an important component of ecosystems that connects the atmosphere, soil, and hydrosphere [1]. It is also a sensitive factor that directly reflects changes in the ecological environment. As an important part of terrestrial ecosystems, vegetation provides ecological services and maintains the functions of terrestrial ecosystems [2]. Vegetation is sensitive to changes in the natural environment and human activities, reflecting the impacts of climate change and human activities in a short time period [3,4]. Therefore, comprehensive studies on long-term vegetation changes are of great significance to better understand the sensitivity of vegetation to changes in the natural environment. At the same time, it has important guiding significance to the management of natural resources and the formulation of strategies [5]. The Normalized Difference Vegetation Index (NDVI), as an important index reflecting the study of vegetation growth and spatio-temporal change, is closely related to vegetation coverage, patterns, biomass, and photosynthesis, and is also a vital indicator for monitoring land degradation [6]. Therefore, most scholars have extensively used NDVI to study global or regional vegetation cover changes and the driving forces [7,8,9].
The influencing factors of dynamic changes in vegetation have been studied by many scholars. In past studies, satellite remote sensing has provided a reproducible means of monitoring vegetation cover changes at different space and time scales [10]. Climate change and human activities are the main factors affecting changes in vegetation cover. For example, the climate on the global scale of ENSO has global influences, especially in southern and eastern Africa, eastern Australia, and northeast Asia [11,12]. Among the climatic factors affecting vegetation cover in the Northern Hemisphere, temperature was identified as the key factor affecting high-latitude vegetation, and solar radiation corresponded to the vegetation trend in eastern China [13]. Studies on the driving forces of vegetation in typical regions in China focus on ecologically fragile areas, such as the Loess Plateau, the Tibetan Plateau, and the arid areas of northwest China [14,15,16]. These studies have shown strong correlations between vegetation cover changes and precipitation and temperature. Other natural factors, such as topographic factors, impact vegetation formation and vegetation cover, among which slope and aspect can affect regional vegetation humidity, sunshine radiation, and temperature [17,18,19]. Nowadays, with the intervention of human activities on the natural environment, influences on the spatial change of vegetation cover and vegetation productivity also tend to increase [20]. Political and socio-economic reforms, exponential population growth, and urbanization have accelerated the decline in ecosystem function. Land use involves the management and transformation of the natural environment into residential areas, such as cultivated land, pastures, and artificial forest. Therefore, land-use change is considered the most direct and comprehensive indicator of human activities, and is the main driving factor for long-term vegetation change in China [21,22]. Exploring the relationship between land-use and vegetation changes can effectively reveal the impact of human activities on vegetation growth. A number of positive human interventions, particularly through ecological restoration projects to reduce the development of land degradation, have improved human well-being from socioeconomic and ecological perspectives [23,24,25]. Moreover, China’s urbanization process will not necessarily lead to large-scale vegetation degradation, and the development of marginal areas outside the urban core should be avoided as much as possible to effectively alleviate vegetation degradation [26]. Studying the temporal and spatial variation of vegetation cover and conducting coupling analysis of natural and human activity factors can enhance ecological sustainability and reduce the limitations caused by the influence of only one factor.
Northern Shaanxi is located in the hilly and gully region of the Loess Plateau. It has an arid climate and fragile ecology, and is also the key area to implement the project of returning cultivated land to forest and grassland [27,28]. Drought is expected to become more frequent and severe in the 21st century due to both natural factors and human activities [29,30,31]. At present, the warming and drying of the climate and the increase of extreme weather caused by global warming increase the risk to the ecological environment. Consequently, it is of practical significance to analyze the vegetation cover and driving forces in Northern Shaanxi to investigate this current trend. There have been some research achievements related to the change in vegetation cover on the Loess Plateau in Northern Shaanxi, which have been more concentrated in the 10 years prior to and after the implementation of the returning farmland to forest project process. Most such studies focus on the interannual impact of human activities or natural environmental factors on vegetation cover changes [32,33]. According to previous studies, in the present study, slope, aspect, and soil type were selected as surface factors, precipitation and temperature were selected as climate factors, and land-use type, gross domestic product (GDP), and population density were selected as human factors.
Linear, trend, and correlation analyses methods were mostly used to qualitatively analyze the spatio-temporal changes in vegetation cover in previous studies [34,35,36], while the geographical detector model can detect numerical and qualitative data and effectively identify spatial differentiation of vegetation [37,38]. As a powerful tool for driving force and factor analyses, a geographical detector is able to quantify the driving force and the influence of its interaction in a robust and direct manner, and does not have to strictly follow the assumptions of traditional statistical methods [39,40,41]. Thus, this approach has been successfully used to quantify the impact of driving factors on vegetation change and may be an effective tool for uncovering the causes of vegetation changes in terrestrial ecosystems. Through this model, this study investigated the spatial differentiation of vegetation and quantified and calculated the influence of various natural and human factors on the spatial distribution of vegetation as well as the types and ranges suitable for vegetation growth. It provides a scientific basis for promoting soil and water conservation, vegetation, and ecological restoration in Northern Shaanxi.

2. Materials and Methods

2.1. Study Area

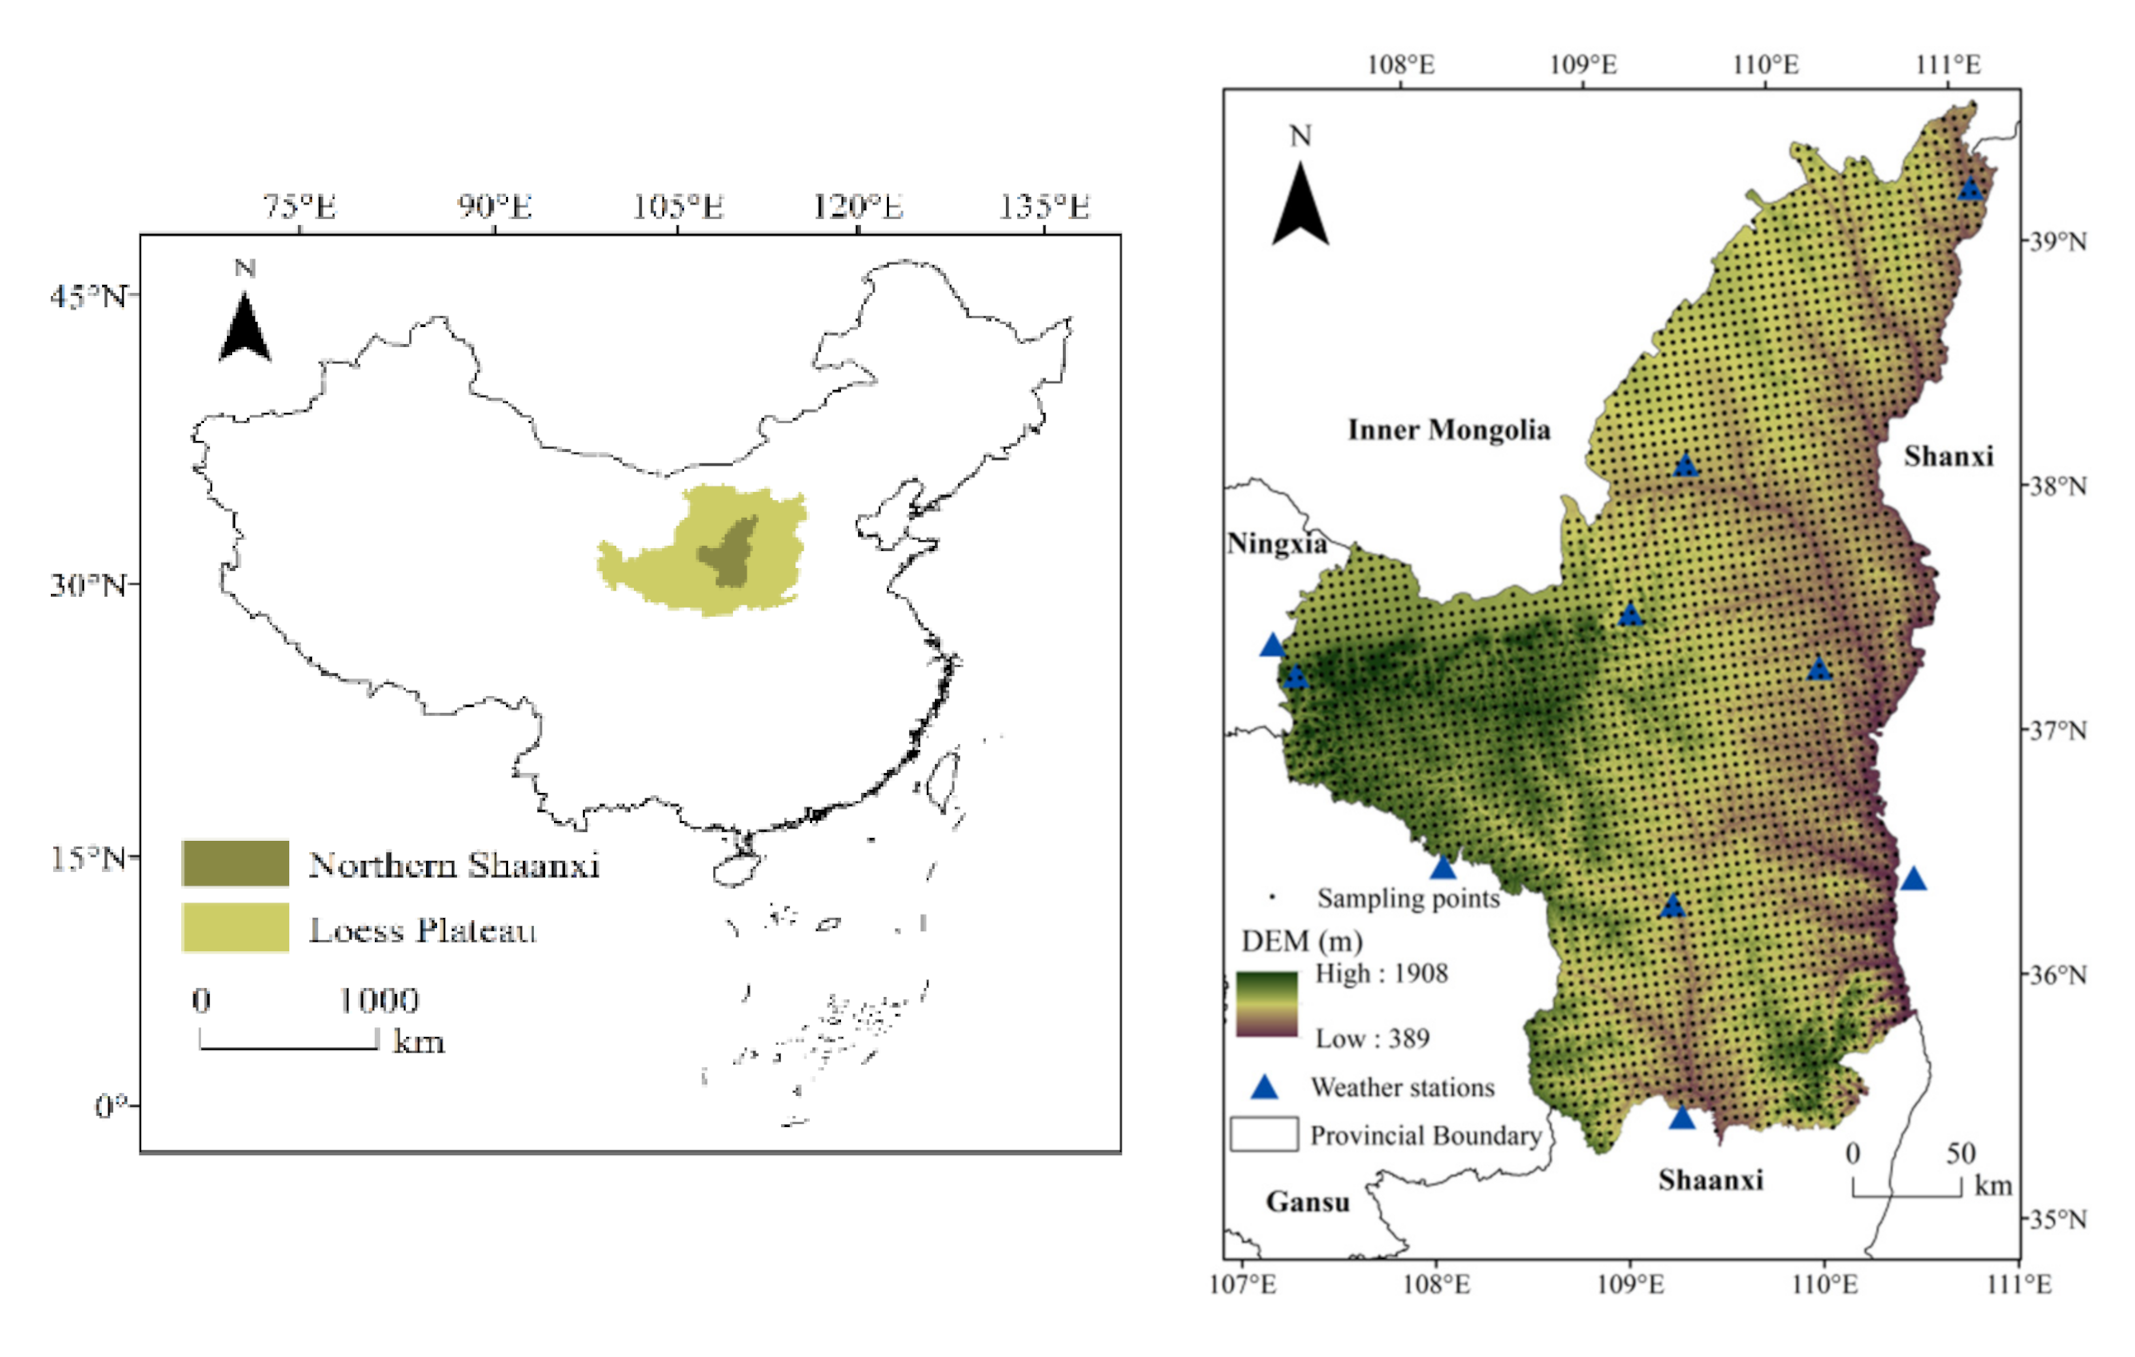
The Loess Plateau of Northern Shaanxi is located in the central region of the Loess Plateau, between 35°21′–39°34′N and 107°15′–111°14′E, and has a total area of 92,521.4 km2 (Figure 1). This region has a temperate continental monsoon climate, and is located in the semi-arid and arid transition zone. The annual average temperature ranges from 7.5 to 12.3 °C, and average annual precipitation is 350–660 mm. Northern Shaanxi is adjacent to the southern edge of the Mu Us Desert. The terrain is high in the east and low in the west. Meanwhile, the terrain is flat and the vegetation is sparse, while the central mountainous area is composed of ridges and hills of loess. Natural vegetation is fragile and has been suffering gradual degradation, due to the long-term farming activities [42]. Since the implementation of the returning farmland to forests and grassland project in 1999, the impact of human activities on surface vegetation has been considerable, the condition of human activities on surface vegetation has been great, and vegetation has been significantly improved.

2.2. Data Sources

NDVI, aspect, slope, soil type, precipitation, temperature, land-use type, population density, and GDP were used in this study. NDVI of MODIS data (https://ladsweb.nascom.nasa.gov/ accessed on 11 December 2020) [43] 16-day’ time resolution and spatial resolution of 250 m MOD13Q1 NDVI, the Maximum Value Composite method was used to synthesize the monthly data, and finally, to composite 2000, 2005, 2010, 2015, and 2018 NDVI data. According to the NDVI value, data were divided into five categories according to the same spacing classification method. In order to better reflect the change in vegetation cover, they were classified as low grade (0–0.2), low-middle grade (0.2–0.4), middle grade (0.4–0.6), middle-high grade (0.6–0.8) and high grade (0.8–1) [44].
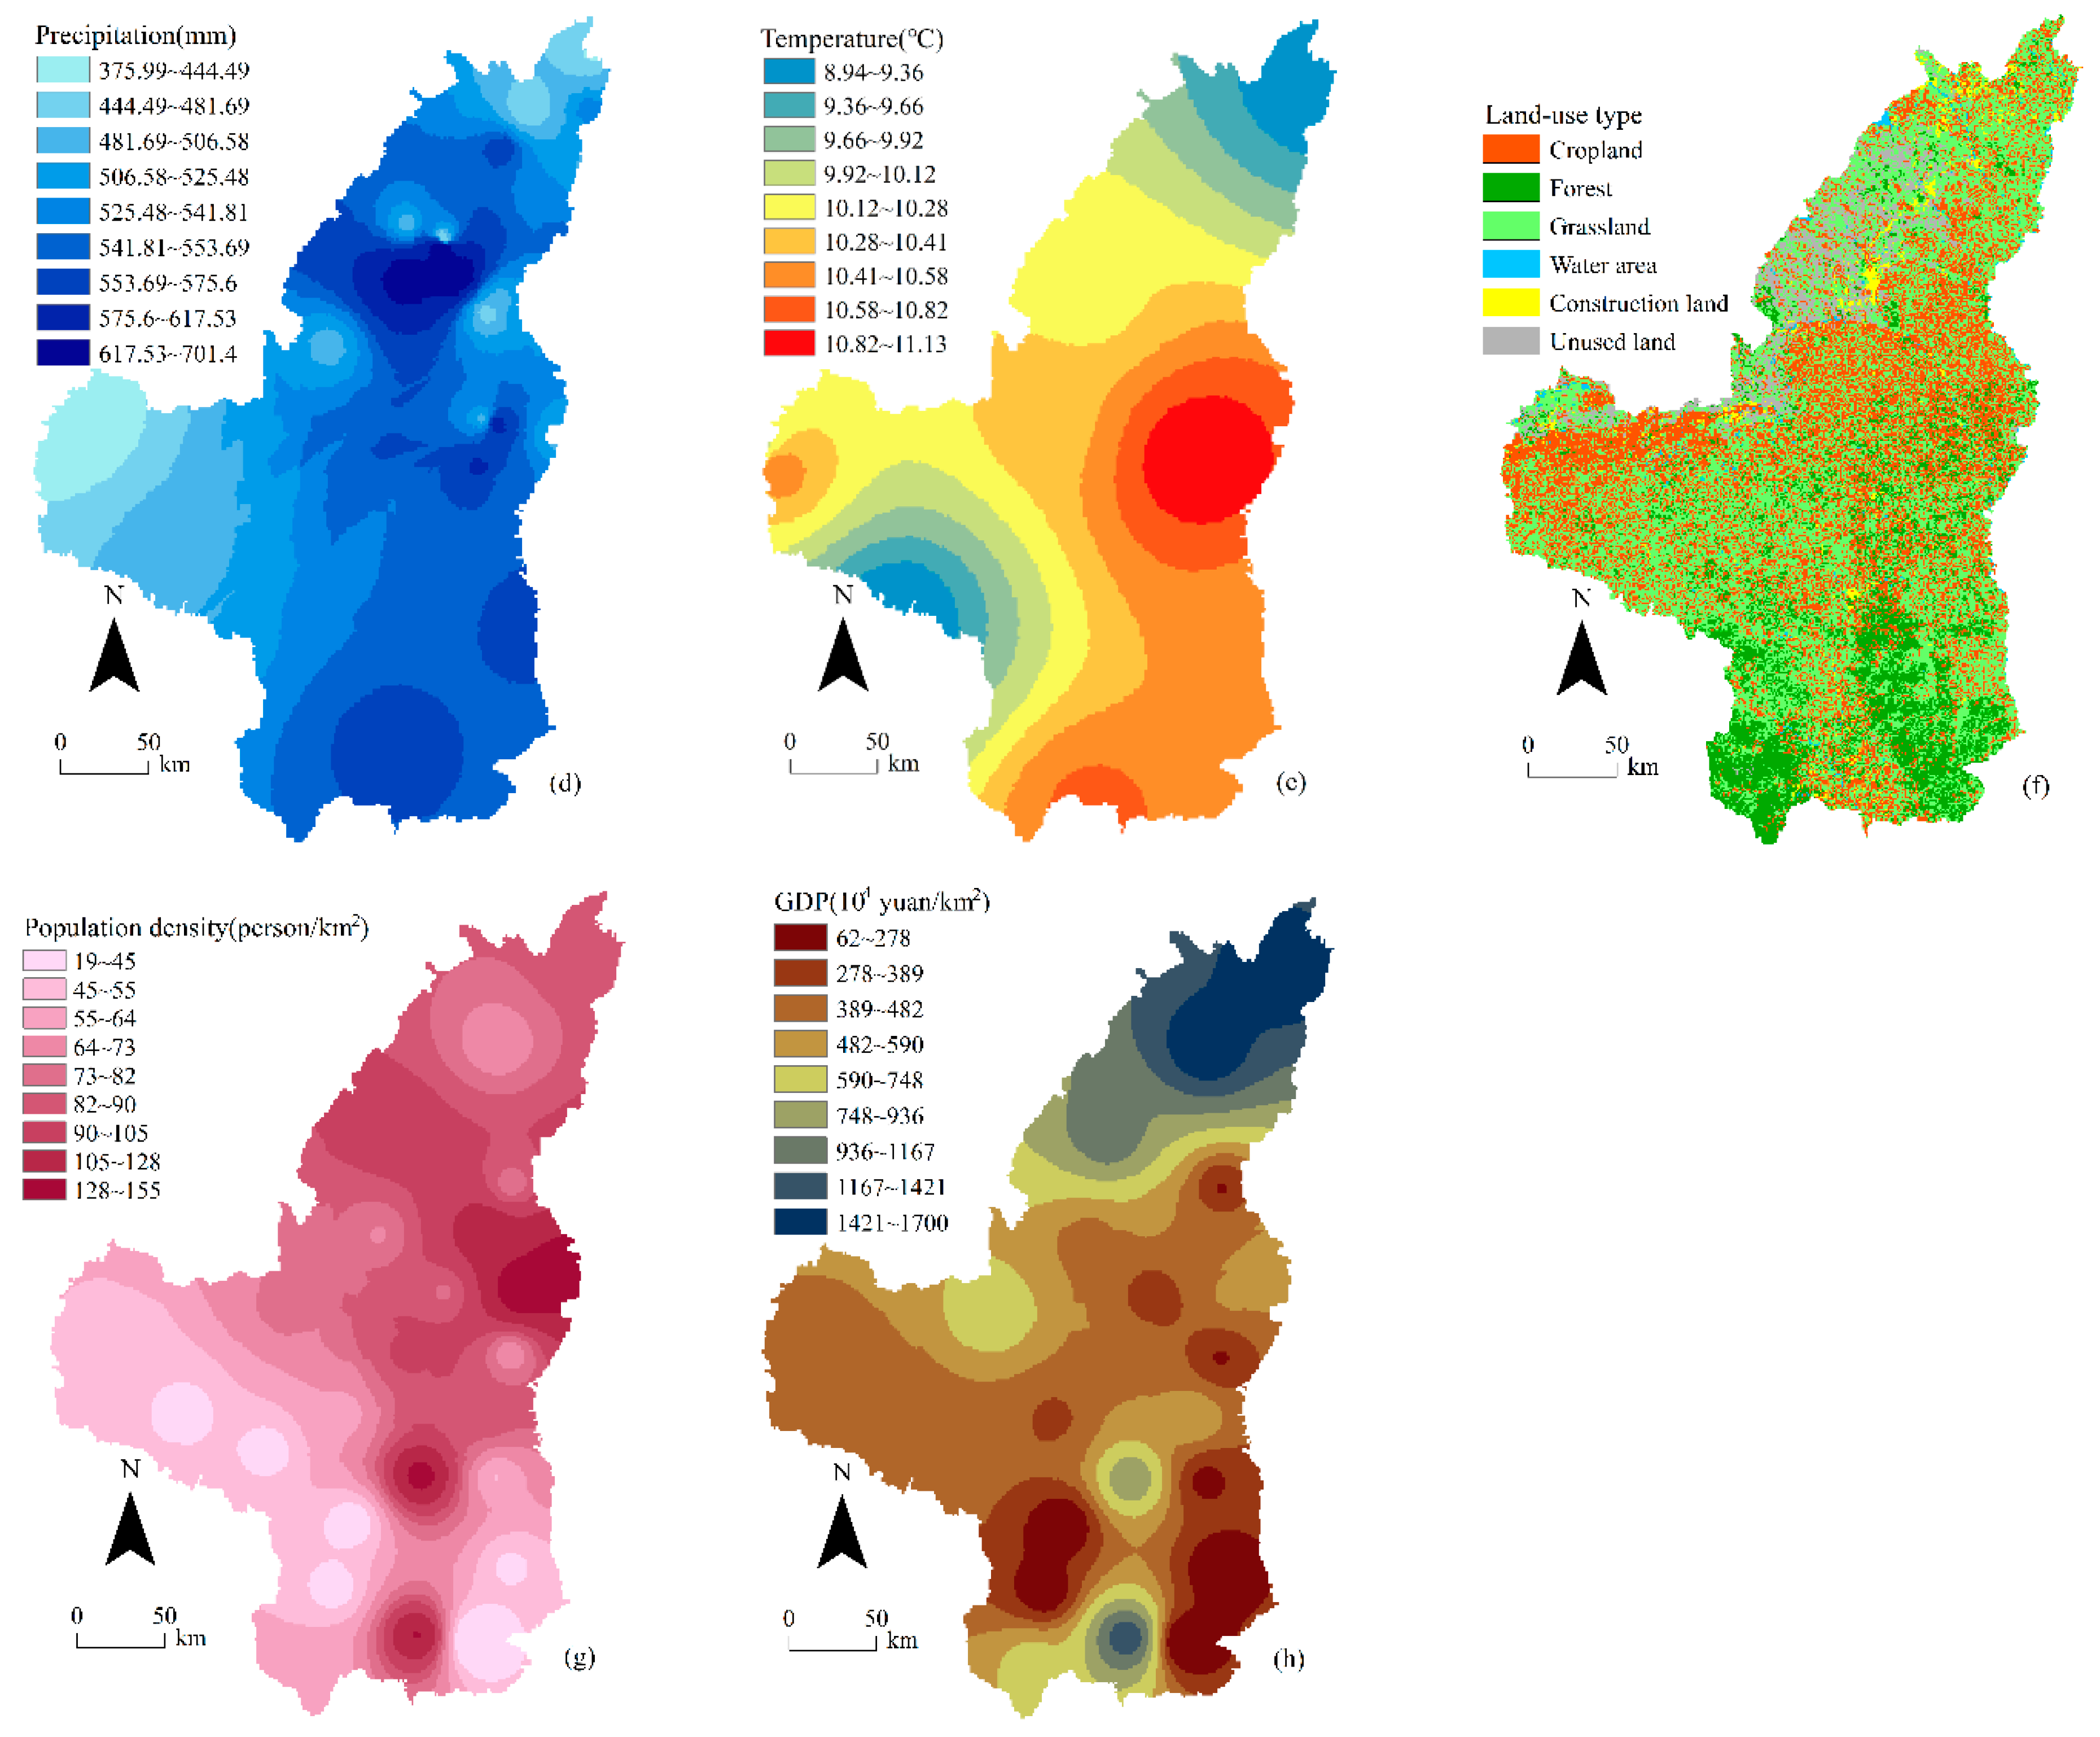
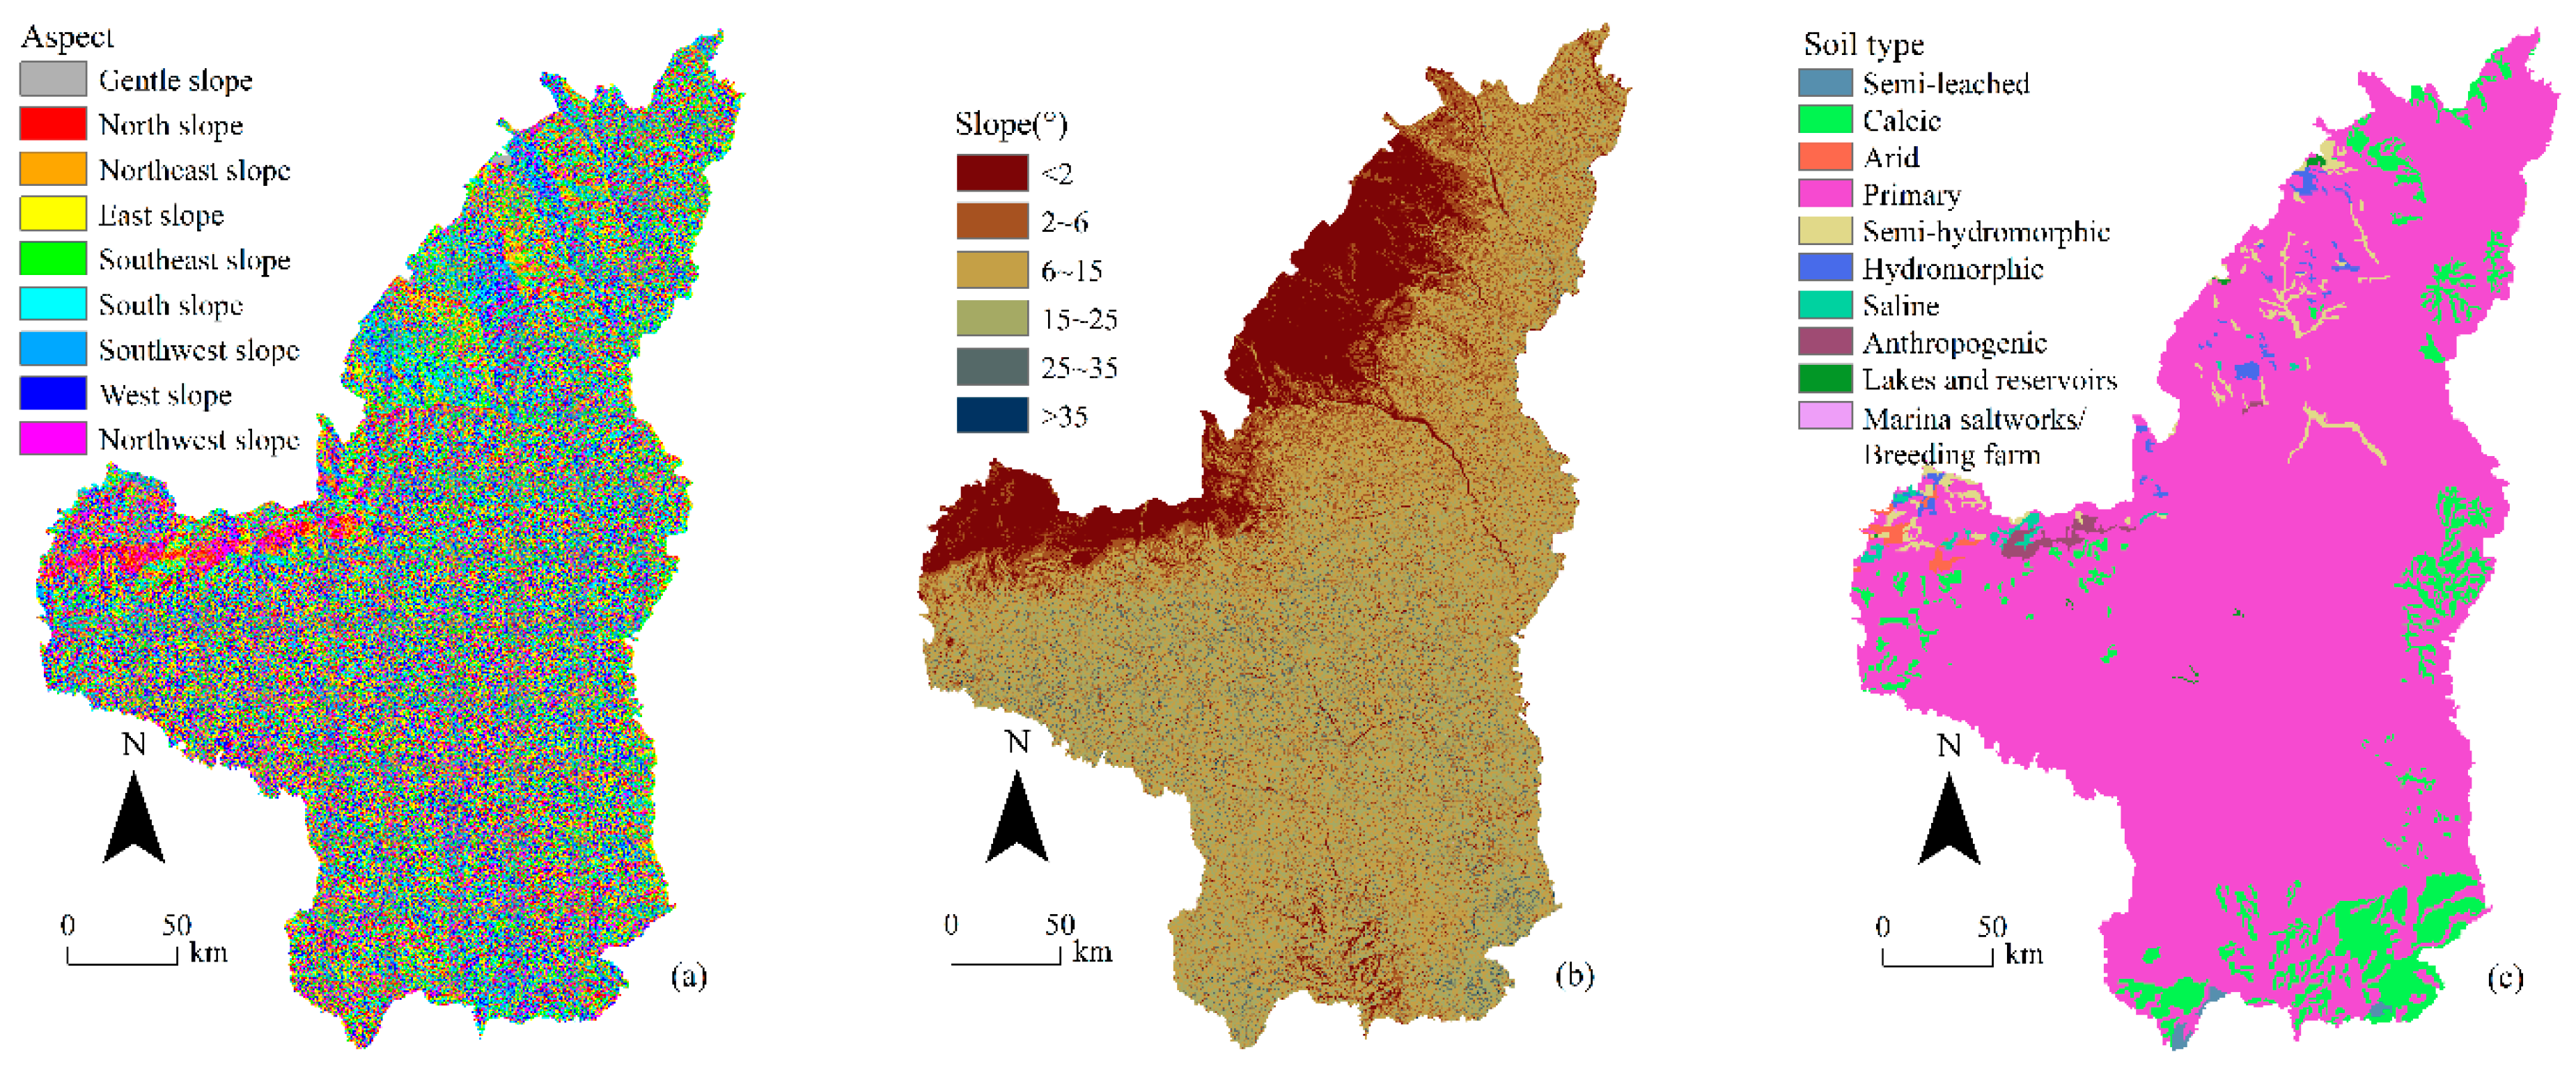
Soil type and land-use data were selected from the Resources and Environmental Sciences and Data Center (http://www.resdc.cn accessed on 11 December 2020), with a 1-km spatial resolution. Precipitation and temperature data were obtained from the China Meteorological Data Network (http://data.cma.cn accessed on 11 December 2020) from 2000 to 2018, and the data were preprocessed by spatial interpolation. Population and GDP data were derived from the statistical yearbook of Shaanxi Province from 2000 to 2018, and population density and GDP data were obtained through spatial interpolation. The aspect and slope were calculated based on 90-m spatial resolution DEM data, and DEM data were derived from the Geospatial Data Cloud (http://www.gscloud.cn accessed on 11 December 2020). There are 3181 sampling points were finally formed (as shown in Figure 1) based on 5 km × 5 km regular grid by using ArcGIS Create fishnet tool. Slope was reclassified and divided into six categories according to the Technical Regulations for Land Use Status Survey (Figure 2b). Soil type was reclassified and divided into 10 categories according to the 1:100,000 Soil Map of the People’s Republic of China (Figure 2c). Aspect and land-use were reclassified according to the existing specifications, and divided into nine and six categories, respectively (Figure 2a,f). Precipitation, temperature, population density and GDP were graded according to the natural breakpoint method, and divided into nine categories (Figure 2d,e,g,h). Projection transformation, administrative mask, resampling, and other processing were performed on the data of each factor using ArcGIS and the final pixel size remained consistent with the 250-m spatial resolution.

2.3. Methods

2.3.1. NDVI Trend Analysis

The change trend of NDVI was studied using a linear regression analysis method, and the spatio-temporal pattern change of vegetation in the study period was comprehensively analyzed. Its calculation formula is
S   =   n · i = 1 n i · NDVI i i = 1 n i i = 1 n NDVI i n · i = 1 n i 2   i = 1 n i 2
where S is the slope of the NDVI regression equation and n is the annual span of the monitoring time period. The time span studied in this study was 2000–2018, and n is 19. NDVI i represents the NDVI value of the year i . S > 0 indicates that regional vegetation cover presents an increasing trend, and NDVI increases with time. S < 0 indicates that NDVI showed a downward trend over time.
In order to better evaluate the vegetation restoration status in Northern Shaanxi, by referring to existing study [45], and since it contains the same study area, S was divided into seven levels (Table 1): severe degradation, moderate degradation, slight degradation, basically unchanged, slight improvement, moderate improvement, and significant improvement.

2.3.2. Geographic Detector Model

The purpose of geographic detection is to detect spatial differentiation, which consists of factor detection, ecological detection, interaction detection, and risk factor detection [38,46]. It is a statistical method that can be used for both quantitative and qualitative data.
(1) Factor detection: The influences of natural (including surface and climatic factors) and human factors (Table 2) on NDVI spatial distribution can be calculated through factor detection, which is a q value. The greater the q value, the greater the impact on the NDVI. The expression is
q   =   1 h = 1 L N h σ h 2 N σ 2
where h = 1,…, L is the stratification of the NDVI attribute or natural and human factor X, N h and N are the number of units in the layer and the whole region, respectively; and σ h 2   and σ 2   are the variances of the values in the layer h and the whole region Y, respectively.
(2) Ecological detection: Ecological detection is used to compare whether there are significant differences between natural and human factors in the vegetation spatial distribution, such as determining whether factors X1 and X2 have more influence on vegetation NDVI spatial distribution, and is expressed as an F-statistic
F   =   N X 1 N X 2   1 SSW X 1 N X 2 N X 1   1 SSW X 2
SSW X 1 = h = 1 L 1 N h σ h 2 ,   SSW X 2 = h = 1 L 2 N h σ h 2
where   N X 1   and N X 2 represent the sample size of the two factors; SSW X 1 and SSW X 2 represent the sum of intra-layer variances formed by two natural and human factors, respectively; and L1 and L2 represent the number of layers for variables X1 and X2, respectively.
(3) Interaction detection: Represents the interaction between different impact factors. It compares the single factor q value, double factor q value, and the sum of two factor interactions, and evaluates whether factors X1 and X2 increase or decrease the explanatory power for the dependent variable NDVI, namely the main comparative q (X), q (X1) + q (X2), and q (X1∩X2).
(4) Risk factor detection: A statistical significance test is performed by calculating the mean NDVI value in a sub-region of an impact factor. The larger the mean NDVI value, the more than the sub-region of the impact factor is suitable for vegetation growth, which can be used to judge the suitable range or type of each impact factor. The test expression is
t   =   Y - h = 1 Y - h = 2 Var Y h = 1 n h = 1 + Var Y h = 2 n h = 2 1 / 2
where Y h ¯ is the mean value of NDVI attributes of vegetation in the sub-region h; n h is the number of samples in sub-region h; and Var is the variance.

3. Results

3.1. Spatio-Temporal Vegetation Coverage Changes

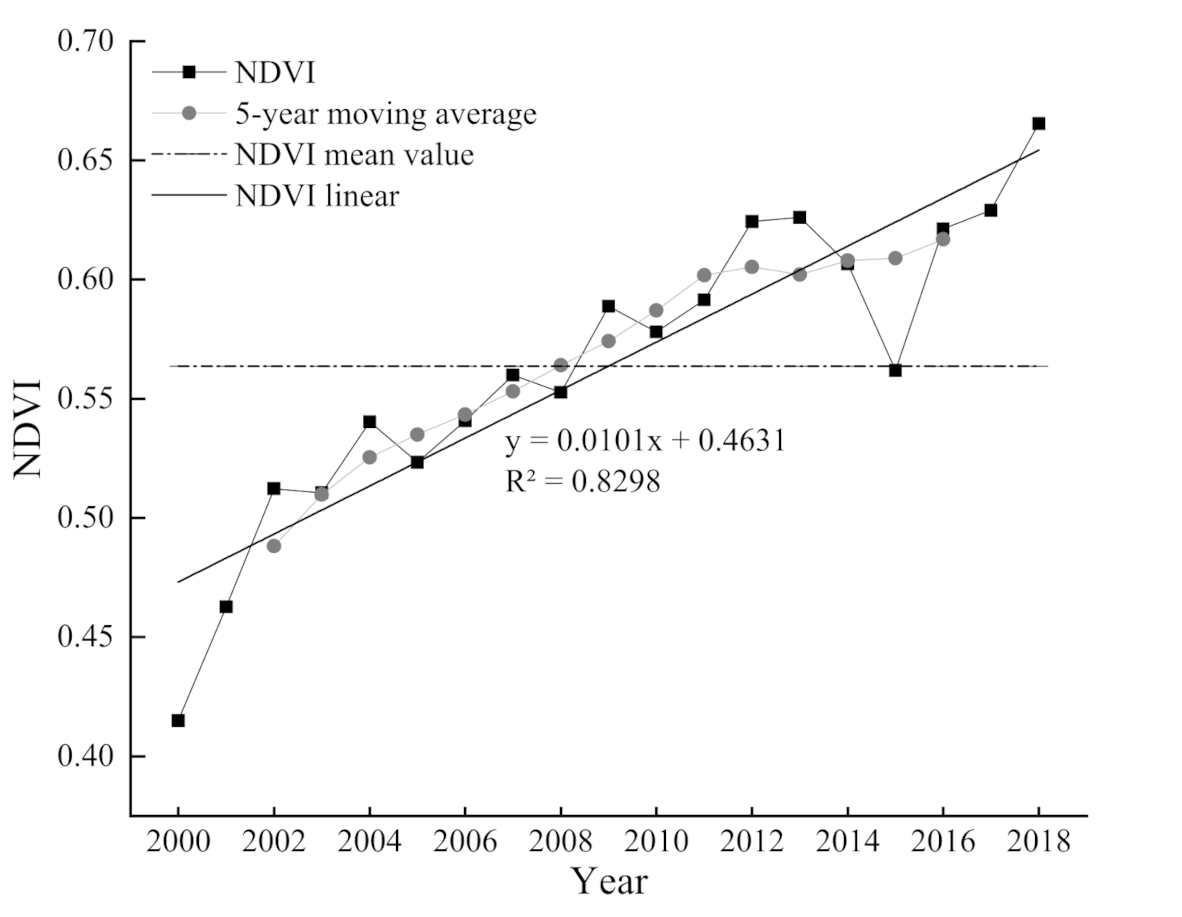
As shown in Figure 3, the mean vegetation coverage in Northern Shaanxi showed an increasing trend from 2000 to 2018, with a growth rate of 0.10/10 years. The vegetation coverage growth rate was 0.13/10 years, which showed relatively rapid growth rate by 2012. The growth rate of vegetation coverage was 0.05/10 years, which provided evidence of a slowing trend. On a long-term scale, NDVI exceeded the mean of 0.564 after 2008. It can be seen from the analysis of the five-year moving average method that the increasing trend of NDVI was obvious prior to 2012, but slowed down after 2012. Since 1999, the returning farmland to forest and grassland project has been implemented, which increased vegetation coverage and caused a rapid increase in NDVI after 2000. However, the reduction in the rate in vegetation coverage growth after 2012 may be related to the increase in large-scale drought events.
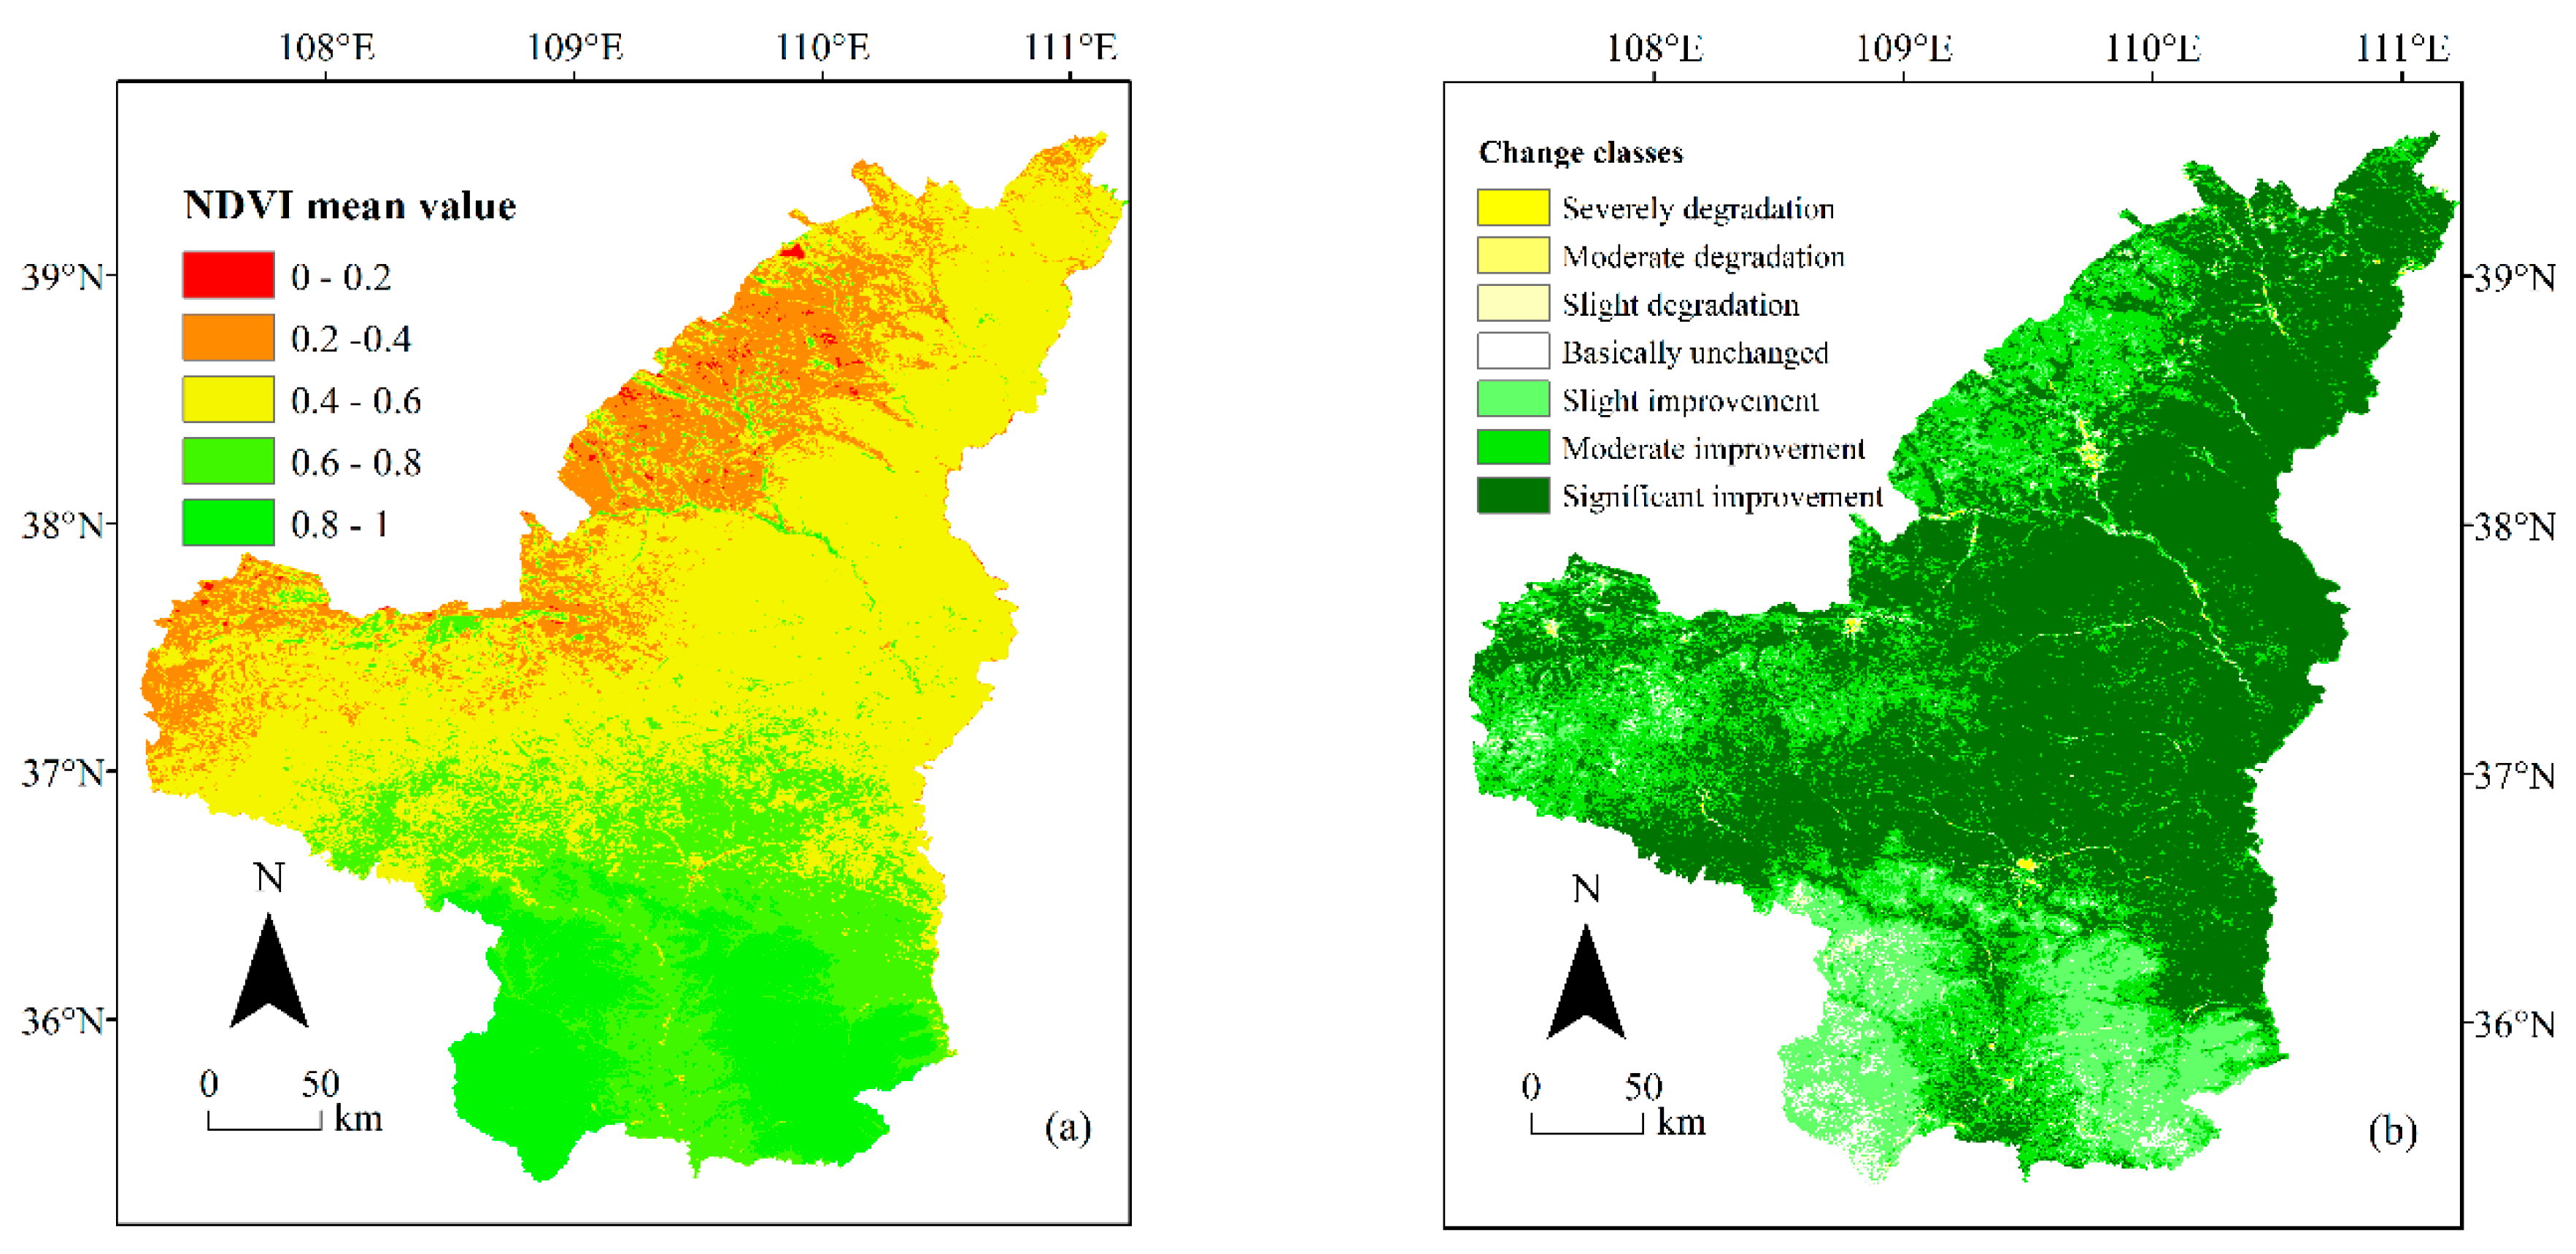
The vegetation coverage pattern of Northern Shaanxi showed a distribution characteristic of being high in the south and low in the north (Figure 4a). The high vegetation coverage areas with NDVI > 0.8 were mainly located in the southwest and southeast of the Yan’an region, accounting for 13.12% of the entire area. The south is mostly low mountains and plains with a humid climate and water and temperature conditions that are suitable for vegetation growth. The areas with low vegetation coverage and NDVI < 0.4 were mainly located in the northwest of the Yulin region, accounting for 14.6% of the total area. The northwest is a windy and sandy area with arid climate and scarce rainfall, which is not conducive to vegetation growth. As shown in Figure 4b, the vegetation index in the study area showed an overall improvement trend, and 96.85% of the area showed an improvement trend. The area of significant improvement was mainly located in the eastern part of Northern Shaanxi, and is a key area for the country to implement the returning farmland to forest and grassland project. After years of treatment, the ecology was effectively restored. Basically, unchanged areas were mainly distributed in the west of the Yulin region, and southwest and southeast of the Yan’an region, accounting for 2.2% of the area of Northern Shaanxi. Areas with obvious degradation trends accounted for < 1% of the area of Northern Shaanxi, and were scattered in Dingbian, Jingbian, and Yuyang in the Yulin region, and in Baota of the Yan’an region. The land-use types in these areas have changed from grassland and cultivated land to construction land, and the NDVI presents a significant vegetation degradation trend. Urban development occupies a considerable amount of farmland and ecological land, reducing the area covered by vegetation.
By using the statistical NDVI spatial distribution from 2000 to 2018, the transfer matrix of different categories of NDVI was calculated (Table 3). In this period, the variation of NDVI mainly showed obvious transformation in the region of 0–0.4. As a result, there was a significant decrease in regions with NDVI from 0 to 0.4 and a significant increase in regions with NDVI > 0.6. Over this time period, 40,977.78 km2 and 39,743.13 km2 were removed from regions with NDVI from 0 to 0.4 and NDVI > 0.6, respectively. Meanwhile, 2382.12 km2 and 47,816.76 km2 were added to these two types of regions, respectively. Therefore, there has been a decrease in the area of regions with NDVI from 0 to 0.4, and an increase in the area of regions with NDVI > 0.6.

3.2. Detection of Factor Influence

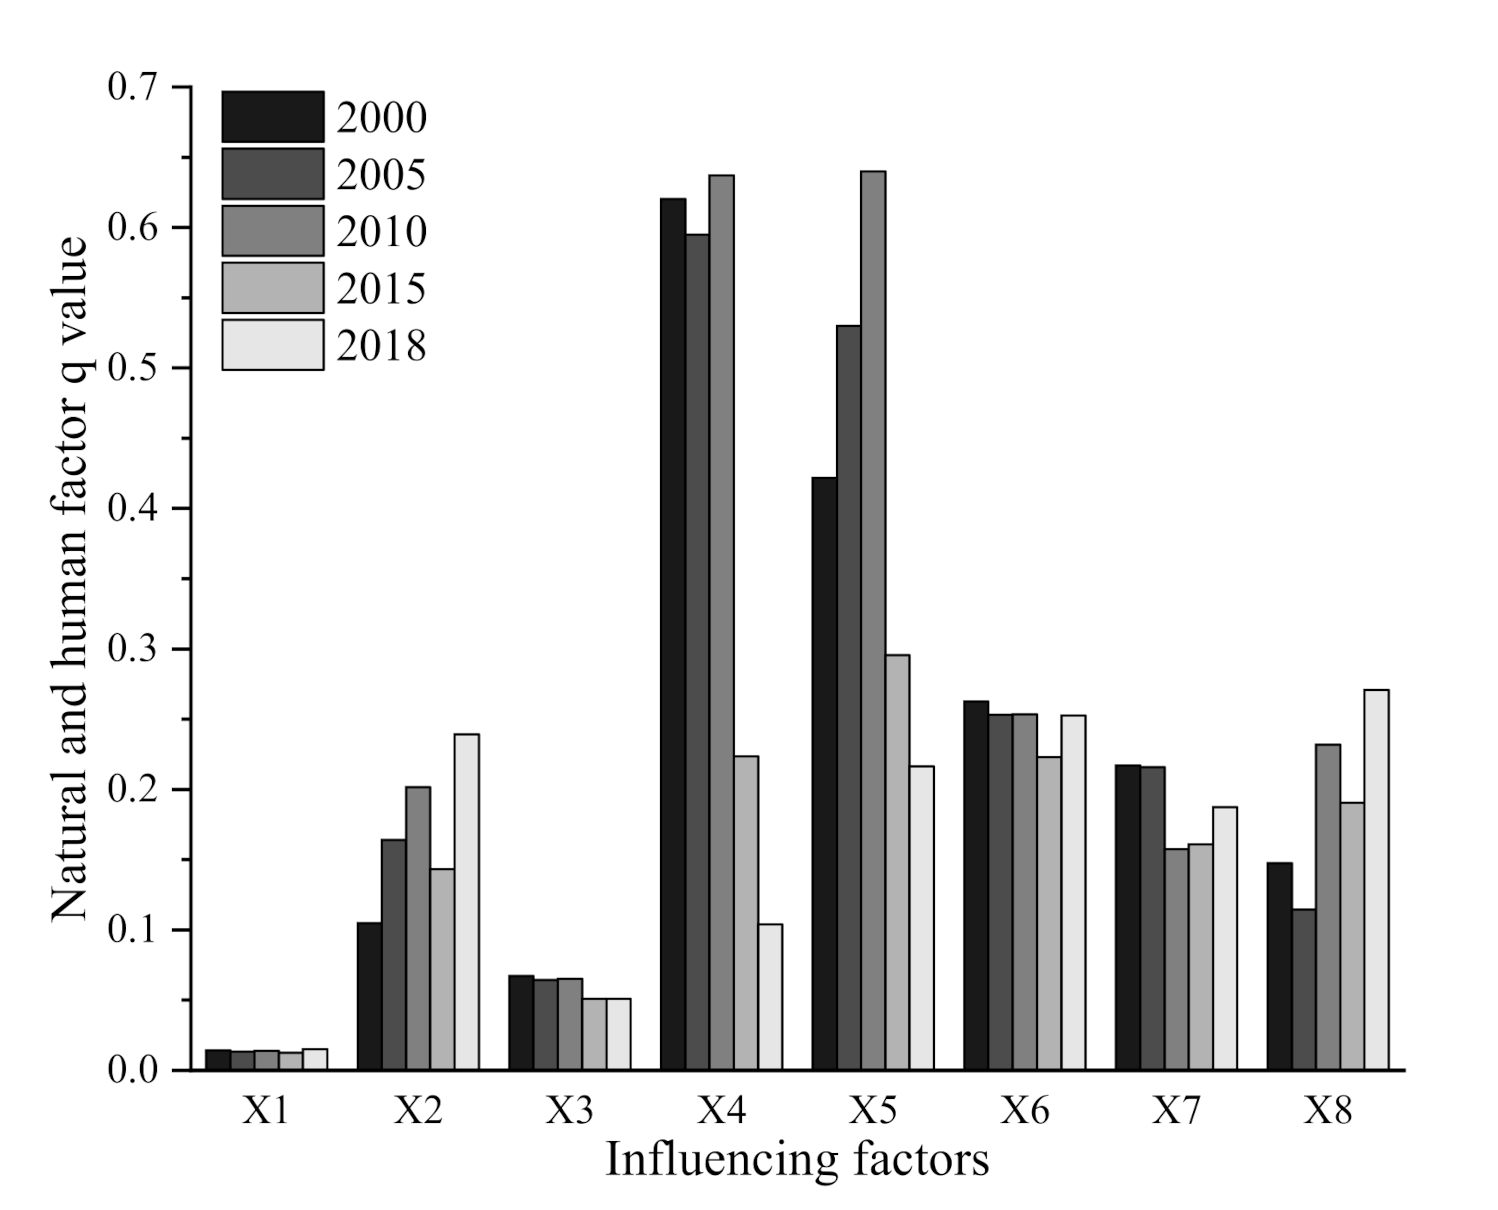
A factor detector is used to represent the influence of various natural and human factors on vegetation NDVI, and the calculated q value indicates the explanatory power of NDVI. In addition to the soil type factor, the other seven categories of factors exerted significant effects on NDVI changes (p < 0.05). Table 4 shows that in 2018, the rank of the q values of various natural and humanistic factors was: GDP (0.271) > land-use type (0.253) > slope (0.239) > temperature (0.216) > population density (0.187) > precipitation (0.104) > soil type (0.051) > aspect (0.015). In the eight categories of natural and human factors, the q values of GDP, land-use type, slope, and temperature all accounted for >20%. Therefore, GDP was the primary factor affecting the spatial differentiation of vegetation cover. The q values of population density and precipitation were 0.187 and 0.104, respectively, and both accounted for > 10%, which were secondary influencing factors. The influences of soil type and slope direction factors were not more than 5%, which had indirect influences on the spatial distribution of vegetation.

3.3. Detection of Time Variations of Factors

The results of the five data periods from 2000 to 2018 show that the influences of soil type, precipitation, temperature, land-use type, and population density on vegetation decreased, while the q values of aspect, slope, and GDP generally showed increasing trends (Figure 5). Among them, the q values of slope and temperature increased from 2000 to 2005, while those of the other factors decreased. During 2005–2010, except for the decrease in population density q, the other factor, q, increased. During 2010–2015, aspect, slope, soil type, precipitation, temperature, land-use type, and GDP q values decreased, while the q value of population density showed an increasing trend. During 2015–2018, except for the soil type, precipitation, and temperature for which q values decreased, the q value of all other factors showed increasing trends. When the influence of natural factors such as precipitation and soil type was weak, the influence of human activity factors was strong, and the NDVI was mainly affected by human activity. The possible reason for this is that when precipitation is insufficient to meet the water demand of vegetation growth in the region, human activities reduce water restrictions to a certain extent, and increase the water supply.

3.4. Detection of Significant Differences between Factors

Ecological factor detection was used to compare whether two factors had significant differences in the spatial distribution of vegetation NDVI. As shown in Table 5, there were significant differences between aspect and slope, precipitation, temperature, land-use type, population density, and GDP on the spatial distribution of NDVI in Northern Shaanxi, whereas there was no significant difference between aspect and soil type. Soil type was significantly different from slope, precipitation, temperature, land-use type, population density, and GDP, and had no significant influence on aspect. There were significant differences between GDP and aspect, soil type, precipitation, temperature, population density, which were not significantly different from slope and land-use types. The results showed that aspect and soil type factors had no significant influence on the spatial distribution of vegetation, and that the influences of aspect and soil type factors on vegetation spatial distribution were significantly different from the influences of other factors. Furthermore, aspect and soil type had minimal direct influences on vegetation.

3.5. Detection of Interactions between Factors

The q values of most factor interactions were greater than those of a single factor, and the types of factor interactions were nonlinear enhancement and mutual enhancement, with no independent relationships (Table 6). Interactions occurred between human factors and other factors on vegetation NDVI, such as X8∩X5 (0.500) > X8∩X7 (0.448) > X8∩X6 (0.447) > X8∩X4 (0.434) > X8∩X2 (0.400) > X8∩X3 (0.334) > X8∩X1 (0.295), and the results show that the interactions between GDP and temperature, precipitation, soil type, and aspect presented a nonlinear enhancement effect, and the relationships between GDP and population density, land-use type, and slope presented mutual enhancement. Interactions occurred between natural factors and other factors on vegetation NDVI, such as X6∩X2 (0.404) > X8∩X2 (0.400) > X5∩X2 (0.385) > X7∩X2 (0.374) > X4∩X2 (0.362) > X3∩X2 (0.275) > X2∩X1 (0.252). The interactions between slope and land-use type, GDP, temperature, population density, soil type, and aspect presented a nonlinear enhancement effect, while the interactions between slope presented a mutual enhancement effect with precipitation. In conclusion, the interactions between the eight natural and human factors were more significant than those between single factors and NDVI. The multi-factor interaction was not independent but, rather, was significantly related to mutual enhancement and nonlinear enhancement.

3.6. Adaptation Ranges/Types Suitable of Factors to Vegetation

Based on the risk detector analysis, the range or type of factors conducive to vegetation growth is analyzed. We presented a specific analysis of factors with high influence.

3.6.1. Adaptation Range of GDP to Vegetation

In this study, GDP was divided into nine categories, represented by A1–A9 (Table 7). In area A1, the mean value of vegetation NDVI reached a maximum of 0.831; this range is more suitable for vegetation growth than other ranges. The statistical test showed that the mean NDVI value in the A1 region was significantly different from that in other regions. The vegetation coverage is optimal in the range of 62 × 104 to 278 × 104 yuan/km2. Economic development and the ecological environment interact and both of which coordinate with each other to influence the long-term sustainable development of the region.

3.6.2. Adaptation of Land-Use Type to Vegetation

Human activities have the most direct impact on vegetation through land-use changes, such as returning farmland to forests, afforestation, forest tending, and other measures used to increase vegetation cover. In this study, the land-use type was divided into six partitions, represented by B1–B6 (Table 8). The mean vegetation NDVI value in Northern Shaanxi was > 0.6 in zones B1, B26, and B3, indicating that these zones were conducive to vegetation growth. Statistical tests showed significant differences between vegetation NDVI in B2 and those in B1, B3, B4, B5, B6, and the NDVI value of land-use type vegetation was the highest in forest land.

3.6.3. Adaptation Range of Slope to Vegetation

The maximum mean vegetation NDVI value was 0.752 in the slope range of 25–35°, within which the topographic factor was conducive to vegetation growth (Table 9). In the low terrain area of Northern Shaanxi (<6°), which is the main area of human activities, vegetation coverage was relatively low. With the continuous increase in slope (6–15°), human activities decreased and vegetation coverage increased. Between 15–25°, through the implementation of ecological projects, the transformation of cultivated land to forest and grassland gradually occupied the dominant position of this terrain. In this area, vegetation restoration stabilized the slopes and enhanced local biodiversity and ecological integrity, and artificial planting and natural restoration of forest and grass increased the vegetation coverage. The NDVI value was the highest in the area between 25–35°, where the steep slopes are not suitable for production and life, and, therefore, the vegetation coverage was relatively high.

3.6.4. Adaptation Range of Temperature to Vegetation

Climatic factors restricted vegetation growth. In this study, the temperature was divided into nine categories, represented by D1–D9. Table 10 shows that the mean vegetation NDVI value in the D7 region was the largest, indicating that this range promotes vegetation growth. Statistical tests showed that the mean value of NDVI in the D7 area was significantly different from those in other areas. Therefore, the vegetation coverage was optimal in the temperature range 10.41–10.58 °C. Temperature has an obvious suitable range for vegetation growth, and moderate warming has a positive effect on vegetation activity.

4. Discussion

4.1. Synergistic Effects between Factors

The spatial pattern of vegetation in Northern Shaanxi is affected by many factors and cannot be regarded as an isolated phenomenon. There is a close relationship between nature and human ecosystem. This study shows that the spatial distribution pattern of vegetation is affected by both natural and human factors. Therefore, we further discuss the influence of factors on vegetation and Table 11 is summarized.
GDP reflects the economic development of a region, and excessively rapid economic development will have an impact on the development of the natural environment [47]. Related studies suggest that social and economic development obtains natural resources from the ecological environment, especially in urban centers and surrounding areas with obvious vegetation degradation, resulting in vegetation destruction, ecological quality degradation, and other adverse effects [48]. However, the vegetation restoration project also requires the support of a strong economic foundation. The level of ecological environment development is lower than economic development, which is related to the investment in ecological environment governance cannot keep pace with the economic development. This uncoordinated state affects sustainable economic development. Hu [49] argue that a region that adopts good policies can simultaneously achieve rapid economic development and vegetation coverage improvement. In order to achieve balanced economic and environmental development, measures such as the Grain for Green, soil and water conservation, and a series of ecological restoration projects were undertaken in Northern Shaanxi to improve vegetation coverage and promote ecological environment restoration.
Jiang [50] suggested that land-use conversion in ecological restoration promotes soil carbon sequestration, and that vegetation restoration in ecological planning plays a significant role in soil conservation. Forest land type provides favorable topographic conditions for vegetation growth. Since the implementation of the project for converting cultivated land to forest and grassland, the vegetation coverage of cultivated land to forest land has been increasing continuously, and the change in land-use type has had a direct impact on the vegetation distribution.
Population growth had a stress effect on vegetation cover, occupying ecological land and reducing vegetation cover. Population density affected vegetation cover, which increased the pressure of vegetation cover and ecological protection, and was not conducive to vegetation restoration. Statistical tests show that 19–45 person/km2 is considered the optimal range for vegetation growth restoration. With the acceleration of urbanization and the increased urban population, population pressure increases the fragility of the ecological environment, which further indicates the importance of human activities on vegetation cover in Northern Shaanxi.
Some scholars believe that vegetation cover in mainland China has a significant correlation with precipitation and temperature, and that the correlation with temperature is more obvious [51]. This study shows that the NDVI change of vegetation in northern Shaanxi was significantly affected by temperature. In the semi-arid region of northern Shaanxi, temperature had a greater influence on vegetation growth than precipitation, and warmer and wetter climates and ecological projects promote photosynthesis and improve net primary productivity. Nevertheless, high temperatures lead to increased evaporation and decreased soil moisture, affecting vegetation change. Additionally, in arid areas of the Loess Plateau, water resources have become an important limiting factor for vegetation growth, and precipitation is the basic source of water supply required for vegetation growth. The response of vegetation to precipitation has a lag effect, so precipitation has an influence on vegetation coverage. The amount and distribution of precipitation affect changes in soil moisture and may indirectly alter the coupling between soil and vegetation. The mean vegetation NDVI values in the six zones of precipitation reached a maximum, ranging from 541.81 mm to 553.69 mm. Within this range, warm and humid hydrothermal conditions are more conducive to vegetation activities. The interaction between precipitation and temperature significantly enhanced the influence of temperature on vegetation, and the coordination of hydrothermal conditions was conducive to vegetation growth.
Soil types were divided into nine categories (Figure 2). Statistical tests showed the semi-leached soil was the most suitable for vegetation growth. Relevant studies have shown that soil moisture is an important factor limiting vegetation growth in areas with less precipitation. The interaction between precipitation and soil enhanced the influence of the soil type on the spatial distribution of vegetation NDVI, and the input of precipitation reduced the variability of soil water. The direct influence of the aspect on vegetation was small, however, the interaction with other natural and human factors significantly enhanced the influence of aspect on vegetation. Soil moisture availability is related to topography, which affects vegetation growth [52]. Topographic factors affect the formation of vegetation. The north slope receives less solar radiation and, thus, there is less evaporation than on the south slope and the soil moisture is relatively high; therefore, it is more suitable for vegetation growth.

4.2. Effectiveness and Limitations

Previous studies on vegetation mostly used linear regression and correlation analysis, but few more previously conducted similar research that used geographic detector model to analyze vegetation in Northern Shaanxi. The geographic detector model adopted in this study can effectively detect spatial differentiation, analyze the driving forces of various phenomena, and identify multi-factor interactions, and has been widely used in the analysis of driving forces [53]. The selection of impact factors should be based on existing research, professional knowledge, or exploratory analysis, and the numerical values should be discretized with the help of ArcGIS. The selection of sampling lattice points should consider both accuracy and efficiency. However, because of the need for discretization in the processing of numerical values, different classification standards in the process of discretization have a certain impact on the results. Therefore, it is necessary to carry out multiple calculations and compare different classification methods to comprehensively reach important conclusions. Meanwhile, it is necessary to pay attention to the deviation of the vegetation index from the true value of vegetation coverage when NDVI is used to study vegetation change. In this study, the use of MODIS NDVI exhibited a good characterization effect on the vegetation coverage of the study area; however, MODIS images remain uncertain and further testing is required.
Great achievements have been made in the program of returning cultivated land to forest and grassland in hilly and gully loess regions [54]. Relevant studies have shown that human activities caused by national or local policies have had a great impact on vegetation change, which is consistent with the conclusions of this study. In this study, the impact of human activities on vegetation change was shown to be greater than that of climate factors, which is consistent with existing studies [55]. In terms of the spatial distribution of major driving factors, human activities are the dominant factor controlling vegetation change. It is of great significance for vegetation restoration and ecological protection to coordinate the relationship between human activities and the natural environment.

5. Conclusions

Northern Shaanxi is a key area for China’s ecological project of returning cultivated land to forest. Since the project was implemented in 1999, vegetation has significantly improved. Human activities have a positive impact on the ecological environment that cannot be ignored. This study involved analyses of the spatiotemporal differentiation of NDVI during 2000–2018 to explore the mechanism of the effects of natural factors and human activities on the vegetation distribution. The spatial distribution of vegetation was influenced by both natural factors and human activities. Compared with natural factors, human activities have had a more significant impact on vegetation restoration in recent years.
The Loess Plateau in Northern Shaanxi is an important ecological area for soil and water conservation. In this study, the spatial distribution characteristics and variation trend of NDVI in Northern Shaanxi were analyzed using the trend analysis method. Meanwhile, based on the geographic detector model, the influence mechanisms of eight natural and human factors on vegetation NDVI in Northern Shaanxi were analyzed, and the influences and interactive influences of each factor on vegetation were summarized. The spatial distribution characteristics of NDVI in Northern Shaanxi were high in the south and low in the north, among which the high-grade vegetation was distributed in the southwest and southeast, and the low vegetation coverage was mainly located in the northwest. Vegetation tended to improve significantly between 2000–2018. Natural and human factors had common influences on vegetation in Northern Shaanxi. Among them, GDP, land-use type, slope, and temperature had the greatest influences on vegetation. Eight natural and human factors had interactive effects on the NDVI, and the interactive effects between the factors had a mutual or nonlinear enhancement relationship on the spatial distribution of vegetation, and there were no independent relationships. The geographic detector revealed the most suitable range or type of vegetation for each factor, which is helpful for the local government to intervene in vegetation changes within a favorable range and mitigate the negative impact brought by human development. It can provide a reference for promoting vegetation construction and ecological restoration in Northern Shaanxi. Meanwhile, the success of ecological restoration in the region reflects the positive role of environmental policy and the need for adaptive management approaches.
The intricate natural and human factors in Northern Shaanxi have important influences on changes in NDVI. In the selection of indicators, the effects of natural and human factors, and their interactions on vegetation change were considered, while some other conditions were not fully considered. In the future, based on the vegetation NDVI change in vulnerable areas such as Northern Shaanxi, natural and human factors should be selected to analyze and reveal the impacts of driving factors and their interactions on vegetation change as scientifically as possible, so as to effectively guide vegetation restoration and protection in Northern Shaanxi and throughout the Loess Plateau. At the same time, the research area should be expanded and there should be further improvements in the selection and classification of natural and human factors so as to correctly determine the most appropriate range or type of natural and human factors to promote vegetation growth.
Author Contributions

Methodology, T.N.; Software, T.N.; Validation, Y.L.; Formal analysis, Y.L.; Investigation, T.N.; Resources, G.D.; Data curation, T.N.; Writing—original draft preparation, T.N.; Writing—review and editing, G.D.; Visualization, G.D.; Supervision, G.D.; Project administration, G.D. and X.J.; Funding acquisition, G.D. and X.J. All authors have read and agreed to the published version of the manuscript.

Funding

This research was supported by the National Natural Science Fund (51779099, 51779209, 51909099), and the National key research and development plan (2016YFC0402400).

Institutional Review Board Statement

Not applicable.

Informed Consent Statement

Not applicable.

Data Availability Statement

The data presented in this study are available on request from the corresponding author. The data are not publicly available due to privacy.

Conflicts of Interest

The authors declare no conflict of interest.

References

  1. Song, W.; Mu, X.; Ruan, G.; Gao, Z.; Li, L.; Yan, G. Estimating fractional vegetation cover and the vegetation index of bare soil and highly dense vegetation with a physically based method. Int. J. Appl. Earth Obs. Geoinf. 2017, 58, 168–176. [Google Scholar] [CrossRef]
  2. Zhang, X.; Liao, C.; Li, J.; Sun, Q. Fractional vegetation cover estimation in arid and semi-arid environments using HJ-1 satellite hyperspectral data. Int. J. Appl. Earth Obs. Geoinf. 2013, 21, 506–512. [Google Scholar] [CrossRef]
  3. Piao, S.; Nan, H.; Huntingford, C.; Ciais, P.; Friedlingstein, P.; Sitch, S.; Peng, S.; Ahlström, A.; Canadell, J.G.; Cong, N.; et al. Evidence for a weakening relationship between interannual temperature variability and northern vegetation activity. Nat. Commun. 2014, 5, 5018. [Google Scholar] [CrossRef] [PubMed] [Green Version]
  4. Meng, E.; Huang, S.; Huang, Q.; Fang, W.; Wu, L.; Wang, L. A robust method for non-stationary streamflow prediction based on improved EMD-SVM model. J. Hydrol. 2019, 568, 462–478. [Google Scholar] [CrossRef]
  5. Gillespie, T.W.; Ostermann-Kelm, S.; Dong, C.; Willis, K.S.; Okin, G.S.; Macdonald, G.M. Monitoring changes of NDVI in protected areas of southern California. Ecol. Indic. 2018, 88, 485–494. [Google Scholar] [CrossRef]
  6. Mutti, P.R.; Lúcio, P.S.; Dubreuil, V.; Bezerra, B.G. NDVI time series stochastic models for the forecast of vegetation dynamics over desertification hotspots. Int. J. Remote. Sens. 2019, 41, 2759–2788. [Google Scholar] [CrossRef]
  7. Liu, Z.; Menzel, L. Identifying long-term variations in vegetation and climatic variables and their scale-dependent relationships: A case study in Southwest Germany. Glob. Planet. Chang. 2016, 147, 54–66. [Google Scholar] [CrossRef]
  8. Huang, S.; Wang, L.; Wang, H.; Huang, Q.; Leng, G.; Fang, W.; Zhang, Y. Spatio-temporal characteristics of drought structure across China using an integrated drought index. Agric. Water Manag. 2019, 218, 182–192. [Google Scholar] [CrossRef]
  9. Recuero, L.; Litago, J.; Pinzon, J.E.; Huesca, M.; Moyano, M.C.; Palacios-Orueta, A. Mapping Periodic Patterns of Global Vegetation Based on Spectral Analysis of NDVI Time Series. Remote. Sens. 2019, 11, 2497. [Google Scholar] [CrossRef] [Green Version]
  10. Wen, Z.; Wu, S.; Chen, J.; Lü, M. NDVI indicated long-term interannual changes in vegetation activities and their responses to climatic and anthropogenic factors in the Three Gorges Reservoir Region, China. Sci. Total. Environ. 2017, 574, 947–959. [Google Scholar] [CrossRef]
  11. Zhao, L.; Dai, A.; Dong, B. Changes in global vegetation activity and its driving factors during 1982–2013. Agric. For. Meteorol. 2018, 249, 198–209. [Google Scholar] [CrossRef]
  12. Arjasakusuma, S.; Mutaqin, B.W.; Sekaranom, A.B.; Marfai, M.A. Sensitivity of remote sensing-based vegetation proxies to climate and sea surface temperature variabilities in Australia and parts of Southeast Asia. Int. J. Remote. Sens. 2020, 41, 8631–8653. [Google Scholar] [CrossRef]
  13. Kong, D.; Zhang, Q.; Singh, V.P.; Shi, P. Seasonal vegetation response to climate change in the Northern Hemisphere (1982–2013). Glob. Planet. Chang. 2017, 148, 1–8. [Google Scholar] [CrossRef] [Green Version]
  14. Yuan, M.; Zhang, Y.; Zhao, Y.; Deng, J. Effect of rainfall gradient and vegetation restoration on gully initiation under a large-scale extreme rainfall event on the hilly Loess Plateau: A case study from the Wuding River basin, China. Sci. Total. Environ. 2020, 739, 140066. [Google Scholar] [CrossRef]
  15. Cong, N.; Shen, M.; Yang, W.; Yang, Z.; Zhang, G.; Piao, S. Varying responses of vegetation activity to climate changes on the Tibetan Plateau grassland. Int. J. Biometeorol. 2017, 61, 1433–1444. [Google Scholar] [CrossRef]
  16. Sun, C.; Liu, Y.; Song, H.; Li, Q.; Cai, Q.; Wang, L.; Fang, C.; Liu, R. Tree-ring evidence of the impacts of climate change and agricultural cultivation on vegetation coverage in the upper reaches of the Weihe River, northwest China. Sci. Total. Environ. 2020, 707, 136160. [Google Scholar] [CrossRef]
  17. Asefa, M.; Cao, M.; He, Y.; Mekonnen, E.; Song, X.; Yang, J. Ethiopian vegetation types, climate and topography. Plant Divers. 2020, 42, 302–311. [Google Scholar] [CrossRef]
  18. Sato, H.; Kobayashi, H.; Beer, C.; Fedorov, A.N. Simulating interactions between topography, permafrost, and vegetation in Siberian larch forest. Environ. Res. Lett. 2020, 15, 095006. [Google Scholar] [CrossRef]
  19. Wang, R.; Yan, F.; Wang, Y. Vegetation Growth Status and Topographic Effects in the Pisha Sandstone Area of China. Remote. Sens. 2020, 12, 2759. [Google Scholar] [CrossRef]
  20. Jiang, H.; Xu, X.; Guan, M.; Wang, L.; Huang, Y.; Jiang, Y. Determining the contributions of climate change and human activities to vegetation dynamics in agro-pastural transitional zone of northern China from 2000 to 2015. Sci. Total. Environ. 2020, 718, 134871. [Google Scholar] [CrossRef]
  21. Hua, W.; Chen, H.; Zhou, L.; Xie, Z.; Qin, M.; Li, X.; Ma, H.; Huang, Q.; Sun, S. Observational Quantification of Climatic and Human Influences on Vegetation Greening in China. Remote. Sens. 2017, 9, 425. [Google Scholar] [CrossRef] [Green Version]
  22. Piao, S.; Wang, X.; Park, T.; Chen, C.; Lian, X.; He, Y.; Bjerke, J.W.; Chen, A.; Ciais, P.; Tømmervik, H.; et al. Characteristics, drivers and feedbacks of global greening. Nat. Rev. Earth Environ. 2020, 1, 14–27. [Google Scholar] [CrossRef]
  23. Bryan, B.; Gao, L.; Ye, Y.; Sun, X.; Connor, J.D.; Crossman, N.D.; Stafford-Smith, M.; Wu, J.; He, C.; Yu, D.; et al. China’s response to a national land-system sustainability emergency. Nat. Cell Biol. 2018, 559, 193–204. [Google Scholar] [CrossRef]
  24. Cao, S.; Chen, L.; Shankman, D.; Wang, C.; Wang, X.; Zhang, H. Excessive reliance on afforestation in China’s arid and semi-arid regions: Lessons in ecological restoration. Earth Sci. Rev. 2011, 104, 240–245. [Google Scholar] [CrossRef]
  25. Mao, D.; Wang, Z.; Wu, B.; Zeng, Y.; Luo, L.; Zhang, B. Land degradation and restoration in the arid and semiarid zones of China: Quantified evidence and implications from satellites. Land Degrad. Dev. 2018, 29, 3841–3851. [Google Scholar] [CrossRef]
  26. Li, D.; Wu, S.; Liang, Z.; Li, S. The impacts of urbanization and climate change on urban vegetation dynamics in China. Urban For. Urban Green. 2020, 54, 126764. [Google Scholar] [CrossRef]
  27. Zhang, P.; Shao, G.; Zhao, G.; Le Master, D.C.; Parker, G.R.; Dunning, J.B.; Li, Q. China’s forest policy for the 21st century. Science 2000, 288, 2135–2136. [Google Scholar] [CrossRef] [PubMed] [Green Version]
  28. Liu, J.; Diamond, J. China’s environment in a globalizing world. Nat. Cell Biol. 2005, 435, 1179–1186. [Google Scholar] [CrossRef]
  29. Coumou, D.; Rahmstorf, S. A decade of weather extremes. Nat. Clim. Chang. 2012, 2, 491–496. [Google Scholar] [CrossRef]
  30. Sheffield, J.; Wood, E.F. Projected changes in drought occurrence under future global warming from multi-model, multi-scenario, IPCC AR4 simulations. Clim. Dyn. 2008, 31, 79–105. [Google Scholar] [CrossRef]
  31. Zhang, Q.; Singh, V.P.; Li, J.; Chen, X. Analysis of the periods of maximum consecutive wet days in China. J. Geophys. Res. Space Phys. 2011, 116, 23106. [Google Scholar] [CrossRef]
  32. Sun, W.; Song, X.; Mu, X.; Gao, P.; Wang, F.; Zhao, G. Spatiotemporal vegetation cover variations associated with climate change and ecological restoration in the Loess Plateau. Agric. For. Meteorol. 2015, 209, 87–99. [Google Scholar] [CrossRef]
  33. Xie, B.; Jia, X.; Qin, Z. Vegetation dynamics and cli-mate change on the Loess Plateau, China: 1982—2011. Reg. Environ. Chang. 2016, 16, 1–12. (In Chinese) [Google Scholar] [CrossRef]
  34. Wang, Z.; Zhang, Y.; Yang, Y.; Zhou, W.; Gang, C.; Zhang, Y.; Li, J.; An, R.; Wang, K.; Odeh, I.; et al. Quantitative assess the driving forces on the grassland degradation in the Qinghai–Tibet Plateau, in China. Ecol. Inform. 2016, 33, 32–44. [Google Scholar] [CrossRef]
  35. Whetton, R.; Zhao, Y.; Shaddad, S.; Mouazen, A.M. Nonlinear parametric modelling to study how soil properties affect crop yields and NDVI. Comput. Electron. Agric. 2017, 138, 127–136. [Google Scholar] [CrossRef] [Green Version]
  36. Liu, H.; Zhang, M.; Lin, Z.; Xu, X. Spatial heterogeneity of the relationship between vegetation dynamics and climate change and their driving forces at multiple time scales in Southwest China. Agric. For. Meteorol. 2018, 256, 10–21. [Google Scholar] [CrossRef]
  37. Wang, J.F.; Zhang, T.L.; Fu, B.J. A measure of spatial stratified heterogeneity. Ecol. Indic. 2016, 67, 250–256. [Google Scholar] [CrossRef]
  38. Wang, J.F.; Xu, C.D. Geodetector: Principle and prospective. Acta Geogr. Sinica 2017, 72, 116–134. (In Chinese) [Google Scholar]
  39. Liang, P.; Yang, X. Landscape spatial patterns in the Maowusu (Mu Us) Sandy Land, northern China and their impact factors. Catena 2016, 145, 321–333. [Google Scholar] [CrossRef]
  40. Pan, H.; Huang, P.; Xu, J. The spatial and temporal pattern evolution of vegetation NPP and its driving forces in mid-dle-lower areas of the Min river based on geo-graphical detector analyses. Acta Geogr. Sinica 2019, 39, 7621–7631. (In Chinese) [Google Scholar]
  41. Zhang, J.; Zang, C. Spatial and temporal variability characteristics and driving mechanisms of land use in the southeastern River Basin from 1990 to 2015. Acta Geogr. Sinica 2019, 39, 9339–9350. (In Chinese) [Google Scholar]
  42. Wen, X. Temporal and special relationships between soil erosion and ecological restoration in semi-arid regions: A case study in Northern Shaanxi, China. Gisci. Remote Sens. 2020, 57, 572–590. [Google Scholar] [CrossRef]
  43. Normalized Difference Vegetation Index (NDVI) Database of the NASA. Available online: https://ladsweb.nascom.nasa.gov/ (accessed on 5 February 2021).
  44. Peng, W.; Kuang, T.; Tao, S. Quantifying influences of natural factors on vegetation NDVI changes based on geographical detector in Sichuan, western China. J. Clean. Prod. 2019, 233, 353–367. [Google Scholar] [CrossRef]
  45. Li, S.S.; Yan, J.P.; Wan, J. The Spatio-temporal Changes of Vegetation Restoration on Loess Plateau in Shaan-xi-Gansu-Ningxia Region. Acta Geogr. Sinica 2012, 67, 960–970. (In Chinese) [Google Scholar]
  46. Wang, J.F.; Li, X.H.; Christakos, G.; Liao, Y.L.; Zhang, T.; Gu, X.; Zheng, X.Y. Geographical detectors-based health risk assessment and its application in the neural tube defects study of the Heshun region, China. Int. J. Geogr. Inf. Sci. 2010, 24, 107–127. [Google Scholar] [CrossRef]
  47. Liu, C.; Xie, W.; Lao, T.; Yao, Y.-T.; Zhang, J. Application of a novel grey forecasting model with time power term to predict China’s GDP. Grey Syst. Theory Appl. 2020, 2043–9377. [Google Scholar] [CrossRef]
  48. Du, J.; Quan, Z.; Fang, S.; Liu, C.; Wu, J.; Fu, Q. Spatiotemporal changes in vegetation coverage and its causes in China since the Chinese economic reform. Environ. Sci. Pollut. Res. 2019, 27, 1144–1159. [Google Scholar] [CrossRef]
  49. Hu, M.; Xia, B. A significant increase in the normalized difference vegetation index during the rapid economic development in the Pearl river delta of China. Land Degrad. Dev. 2019, 30, 359–370. [Google Scholar] [CrossRef]
  50. Jiang, C.; Zhang, H.; Tang, Z.; Labzovskii, L. Evaluating the coupling effects of climate variability and vegetation restoration on ecosystems of the Loess Plateau, China. Land Use Policy 2017, 69, 134–148. [Google Scholar] [CrossRef]
  51. Chen, H.; Ren, Z.Y. Response of Vegetation Coverage to Changes of Precipitation and Temperature in Chinses Mainland. Bull. Soil Conserv. 2013, 33, 78–82. (In Chinese) [Google Scholar]
  52. Fan, J.; Xu, Y.; Ge, H.; Yang, W. Vegetation growth variation in relation to topography in Horqin Sandy Land. Ecol. Indic. 2020, 113, 106215. [Google Scholar] [CrossRef]
  53. Zhou, Y.; Li, X.; Liu, Y. Land use change and driving factors in rural China during the period 1995–2015. Land Use Policy 2020, 99, 105048. [Google Scholar] [CrossRef]
  54. Li, Y.; Mao, D.; Feng, A.; Schillerberg, T. Will Human-Induced Vegetation Regreening Continually Decrease Runoff in the Loess Plateau of China? Forests 2019, 10, 906. [Google Scholar] [CrossRef] [Green Version]
  55. Wang, H.; Sun, B.; Yu, X.; Xin, Z.; Jia, G. The driver-pattern-effect connection of vegetation dynamics in the transition area between semi-arid and semi-humid northern China. Catena 2020, 194, 104713. [Google Scholar] [CrossRef]
Figure 1. Location of the study area.
Remotesensing 13 00613 g001
Figure 2. Spatial distributions of natural and human factors: (a) aspect; (b) slope; (c) soil type; (d) precipitation; (e) temperature; (f) land-use type; (g) population density; and (h) GDP.
Remotesensing 13 00613 g002aRemotesensing 13 00613 g002b
Figure 3. Trend of the mean NDVI in Northern Shaanxi from 2000 to 2018.
Remotesensing 13 00613 g003
Figure 4. Spatial distribution characteristics of the mean NDVI values and changing trends in Northern Shaanxi: (a) the spatial distribution characteristics of the mean NDVI values in Northern Shaanxi; (b) the spatial distribution characteristics of the changing trends in Northern Shaanxi.
Remotesensing 13 00613 g004
Figure 5. Changes in natural and human factors q value from 2000 to 2018.
Remotesensing 13 00613 g005
Table 1. Classification standard for vegetation coverage changes.
LevelNDVI Variation TrendLevelNDVI Variation Trend
Severely degradationS ≤ −0.0091Slight improvement0.0009 < S ≤ 0.0045
Moderate degradation−0.0091 < S ≤ −0.0045Moderate improvement0.0045 < S ≤ 0.0090
Slight degradation−0.0045 < S ≤ −0.0010Significant improvementS ≥ 0.0090
Basically unchanged−0.0010 < S ≤ 0.0009
Table 2. Indicators of natural and human factors.
Natural factorsHuman Factors
Surface FactorsClimatic Factors
Aspect (X1)Precipitation (X4)Land-use type (X6)
Slope (X2)Temperature (X5)Population density (X7)
Soil type (X3) GDP (X8)
Table 3. Transfer matrix of vegetation NDVI changes in 2000–2018 (unit: km2).
NDVI0–0.20.2–0.40.4–0.60.6–0.80.8–1.02018 TotalTransfer in
0–0.251.6010.911.550.280.2664.6012.99
0.2–0.42287.541939.2471.3710.130.094308.372369.13
0.4–0.62220.7214,357.301069.7158.120.5117,706.3516,636.64
0.6–0.8517.0323,359.7012,656.201811.9713.5038,358.4036,546.43
0.8–118.35588.352672.887990.754045.9215,316.2511,270.33
2000 total5095.2440,255.5016,471.719871.254060.2775,753.96
Transfer out5043.6438,316.2615,402.008059.2814.35
Change−5030.65−35,947.131234.6528,487.1511,255.98
Table 4. q values of natural and human factors.
FactorsX1X2X3X4X5X6X7X8
q value0.0150.2390.0510.1040.2160.2530.1870.271
p value0.0000.0000.0150.0000.0000.0000.0000.000
Table 5. Significant differences between factors.
FactorsX1X2X3X4X5X6X7X8
X1
X2Y
X3NY
X4YYY
X5YNYY
X6YNYYY
X7YYYYNY
X8YNYYYNY
Note: At a confidence level of 0.95, Y indicates a significant difference between the two factors in the impact of vegetation NDVI and N indicates no significant difference.
Table 6. Interaction detection factors results.
CA + BResultInterpretation
X1∩X2 = 0.252<0.255 = X1 + X2C < A + B
X1∩X3 = 0.080>0.066 = X1 + X3C > A + B↑↑
X1∩X4 = 0.138>0.119 = X1 + X4C > A + B↑↑
X1∩X5 = 0.251>0.232 = X1 + X5C > A + B↑↑
X1∩X6 = 0.273> 0.268 = X1 + X6C > A + B↑↑
X1∩X7 = 0.210>0.202 = X1 + X7C > A + B↑↑
X1∩X8 = 0.295>0.286 = X1 + X8C > A + B↑↑
X2∩X3 = 0.275<0.290 = X2 + X3C < A + B
X2∩X4 = 0.362>0.343 = X2 + X4C > A + B↑↑
X2∩X5 = 0.385<0.456 = X2 + X5C < A + B
X2∩X6 = 0.404<0.492 = X2 + X6C < A + B
X2∩X7 = 0.374<0.427 = X2 + X7C < A + B
X2∩X8 = 0.400< 0.510 = X2 + X8C < A + B
X3∩X4 = 0.161>0.155 = X3 + X4C > A + B↑↑
X3∩X5 = 0.259<0.267 = X3 + X5C < A + B
X3∩X6 = 0.294<0.304 = X3 + X6C < A + B
X3∩X7 = 0.250>0.238 = X3 + X7C > A + B↑↑
X3∩X8 = 0.334>0.322 = X3 + X8C > A + B↑↑
X4∩X5 = 0.384>0.320 = X4 + X5C > A + B↑↑
X4∩X6 = 0.348<0.357 = X4 + X6C < A + B
X4∩X7 = 0.428>0.291 = X4 + X7C > A + B↑↑
X4∩X8 = 0.434>0.375 = X4 + X8C > A + B↑↑
X5∩X6 = 0.404<0.469 = X5 + X6C < A + B
X5∩X7 = 0.481>0.404 = X5 + X7C > A + B↑↑
X5∩X8 = 0.500>0.487 = X5 + X8C > A + B↑↑
X6∩X7 = 0.381<0.440 = X6 + X7C < A + B
X6∩X8 = 0.447<0.523 = X6 + X8C < A + B
X7∩X8 = 0.448<0.458 = X7 + X8C < A + B
Note: “↑” denotes that X1 and X2 are mutually enhanced; “↑↑” denotes that X1 and X2 are non-linearly enhanced.
Table 7. Mean NDVI and statistical significance for every two divisions of GDP (95% confidence level).
PartitionA1A2A3A4A5A6A7A8A9
A1
A2Y
A3YY
A4YYN
A5YYNN
A6YYYYY
A7YYYYYY
A8YYYYYYY
A9YYYYYYYN
Mean NDVI0.8310.7530.6740.6740.6610.5960.5090.5550.548
Note: A1~A9 are respectively (unit: yuan/km2): 62–278, 278–389, 389–482, 482–590, 590–748, 748–936, 936–1167, 1167–1421, 1421–1700 (The value range is left open and right closed).
Table 8. Mean vegetation NDVI and statistical significance for every two divisions of land use type (95% confidence level).
PartitionB1B2B3B4B5B6
B1
B2Y
B3NY
B4YYY
B5YYYN
B6YYYNN
Mean NDVI0.6590.7880.6590.5320.4930.450
Note: B1~B6 are cropland, forest, grassland, water area, construction land, and unused land, respectively.
Table 9. Mean vegetation NDVI and statistical significance for every two divisions of slope (95% confidence level).
PartitionC1C2C3C4C5C6
C1
C2Y
C3YY
C4YYY
C5YYYY
C6YNNNN
Mean NDVI0.5110.6360.6870.7310.7520.722
Note: C1~C6 are respectively (unit: °): <2°, 2°–6°, 6°–15°, 15°–25°, 25°–35°, >35° (The value range is left open and right closed).
Table 10. Mean vegetation NDVI and statistical significance for every two divisions of temperature (95% confidence level).
PartitionD1D2D3D4D5D6D7D8D9
D1
D2N
D3NN
D4NNN
D5YYYY
D6YYYYY
D7YYYYYY
D8YYYYYYY
D9NNNNYNYY
Mean NDVI0.6320.6340.6380.6340.5810.6600.7800.7010.651
Note: D1~D9 are respectively (unit: °C): 8.94–9.36, 9.36–9.66, 9.66–9.92, 9.92–10.12, 10.12–10.28, 10.28–10.41, 10.41–10.58, 10.58–10.82, and 10.82–11.13 (The value range is left open and right closed).
Table 11. Adaptation ranges/types suitable of factors to vegetation.
FactorsAdaptation Range/TypeThe Mean NDVI
AspectNorth slope0.681
Slope (°)25–350.752
Soil typeSemi-leached soil0.889
Precipitation (mm)541.81–553.690.709
Temperature (°C)10.41–10.580.780
Land-use typeForest land0.788
Population density (person/km2)19–450.737
GDP (yuan/km2)62 × 104–278 × 1040.831
Publisher’s Note: MDPI stays neutral with regard to jurisdictional claims in published maps and institutional affiliations.