Abstract
Both a decrease of sea ice and an increase of surface meltwater, which may induce ice-flow speedup and frontal collapse, have a significant impact on the stability of the floating ice shelf in Greenland. However, detailed dynamic precursors and drivers prior to a fast-calving process remain unclear due to sparse remote sensing observations. Here, we present a comprehensive investigation on hydrological and kinematic precursors before the calving event on 26 July 2017 of Petermann Glacier in northern Greenland, by jointly using remote sensing observations at high-temporal resolution and an ice-flow model. Time series of ice-flow velocity fields during July 2017 were retrieved with Sentinel-2 observations with a sub-weekly sampling interval. The ice-flow speed quickly reached 30 m/d on 26 July (the day before the calving), which is roughly 10 times quicker than the mean glacier velocity. Additionally, a significant decrease in the radar backscatter coefficient of Sentinel-1 images suggests a rapid transformation from landfast sea ice into open water, associated with a decrease in sea ice extent. Additionally, the area of melt ponds on the floating ice tongue began to increase in mid-May, quickly reached a peak at the end of June and lasted for nearly one month until the calving occurred. We used the ice sheet system model to model the spatial-temporal damage and stress on the floating ice, thereby finding an abnormal stress distribution in a cracked region. It is inferred that this calving event may relate to a weakening of the sea ice, shearing of the tributary glacier, and meltwater infiltrating crevasses.
1. Introduction
Ice shelf calving in Greenland can trigger and/or enhance ice flow acceleration and glacier front retreat [1], which is becoming a crucial factor affecting Greenland’s ice sheet stability [2]. In particular, loss of an ice shelf can reduce resistance to ice flow from a grounded glacier [3,4,5], leading to increased discharge from the ice-sheet interior into the oceans [6,7]. Ice shelf calving is an important component of dynamic ice sheet changes, representing the greatest source of uncertainty in projections of sea level rise. Although some observation and modeling investigations suggest that tidewater glaciers are sensitive to both atmospheric and oceanic forcing [8,9,10], the physical processes of the frontal collapse and their responses to warming air and sea temperatures are not fully understood [2].
The frontal collapse of floating ice shelf is a complex process, which is mainly driven by several hydrological and kinematic forces, including tributary glacier inflow, sea ice buttressing and supraglacial pond drainage. During the past decades, ocean warming [11,12] and increased air temperature [13] reduced sea ice concentration in the fjords and intensified glacier surface melt, influencing the vulnerability of marine-terminating glaciers [14,15,16]. Some studies suggested that an increase of surface melting induced instability of the outlet of the glacier, leading to hydro-fracturing or even collapse due to melt ponds filling some crevasses in Northeast Greenland [17,18]. Additionally, sea-ice concentration controlled the seasonal dynamics of the ice velocity response to buttressing fluctuations in the Totten Ice Shelf of Antarctica [19]. In addition, the tributary glacier inflow destabilized ice structural heterogeneity and intensified the vulnerability of the Larsen C ice shelf [20,21]. The dynamic characteristics of the hydrological and kinematic precursors and underlying response mechanisms, which control the development of ice calving, remain poorly understood. Thus, it is crucial when investigating a frontal collapse process to capture the spatial-temporal variability of these hydrological and kinematic precursors.
Satellite remote sensing has proven to be a useful tool to observe ice velocity change [22], supraglacial lakes [23,24,25,26] and sea ice evolution [19,27,28]. Optical and microwave remote sensing images (e.g., Landsat-8 and Sentinel-1) have been widely applied to extract annual and seasonal ice velocity of outlet glaciers in Greenland [29,30,31]. Very long-term remote sensing observations have recorded the multi-decadal evolution of supraglacial lakes on the Larsen B ice shelf before it collapsed in 2002 [32,33]. However, ice flow speed-up, terminus calving and lake drainage usually occur at daily to weekly timescales. Limited by the spatial-temporal resolution of the available remote sensing images, it is a challenge to acquire dense and abundant observations to characterize such short-lived dynamic process [31,34]. In recent years, the focus in optical remote sensing has shifted from the use of a few scenes from individual satellites to utilizing data from multiple satellites. Twin satellites or constellations of satellites can shorten the revisit time and meet continuous coverage. The advantages of the short-temporal sampling rate and increasing spatial resolution recently have been exploited to capture rapid changes in glacier flow [35], indicating a huge potential to acquire the high spatial-temporal characteristics of hydrological and kinematic precursors of ice calving.
The Petermann Glacier (PG), located in the outermost northwest corner of Greenland, is one of only three glaciers in Greenland with a floating ice tongue. Two major calving events occurred in PG between 2010 and 2012, which dramatically reduced the ice tongue length from approximately 85 km in 2010 to around 50 km in 2012 [36]. Previous studies showed that the 2010 calving event was noted to be followed by minimal glacier acceleration (<100 m a−1) and had no significant ice dynamical effect on glacier stability [36,37]. However, recent observations showed that an average acceleration of 10% between winter 2011/2012 and winter 2016/2017 was directly connected to the 2012 calving event based on ice flow modeling [38]. Another model verified the idea that once calving removes ice within 12 km of the grounding line, loss of these thicker and stiffer sections of the ice tongue could perturb stresses at the grounding line enough to substantially increase inland flow speeds, and so grounded ice discharge [39]. Since the 2012 calving event, the Petermann ice shelf has been steadily advancing, but a newly developing fracture, as shown in Figure 1, from the eastern margin to the center of the ice tongue, marks a forthcoming calving event [39]. The winter 2016/2017 speedup [38], followed by the latest relatively small calving event occurring on 26 July in 2017, broke the steady-state and focused more attention on future instability. Even though the relatively small calving event did not have a direct impact on upstream stability, this frontal collapse lost the connection with the fjord and reduced the lateral drag, weakening the ice tongue’s structural integrity. Additionally, it may reactivate the new fracture and promote the adjacent fracture’s extension. Consequently, it may imply to initiate a new cycle of calving, given signs of ice shelf break-up even during recent years. Exploring the precursors and causes of the relatively small calving event was crucial to assessing the instability of the Petermann glacier tongue to predict a forthcoming calving event [40].
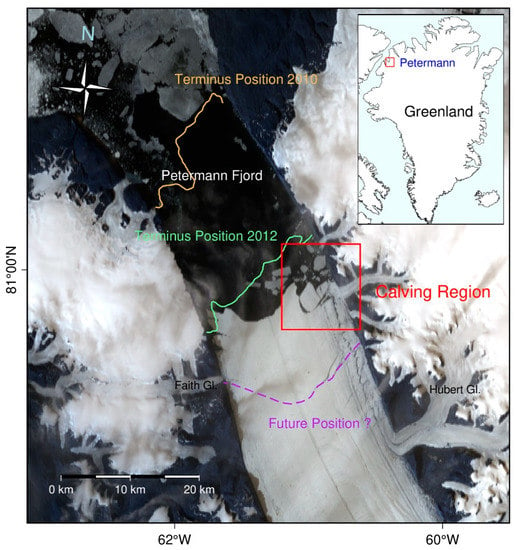
Figure 1.
Overview of study map in the Petermann Glacier frontal collapse in 2017. The background image is from a composite of visible-band Landsat 8 scene for 26 July 2017. The light brown and green line illustrate the ice fronts of 2010 and 2012 calving events. The purple line represents a newly developing fracture, from the eastern margin to the center of the ice tongue, marking a forthcoming calving event [38].
In this study, we aimed to characterize the hydrological and kinematic precursors of the frontal collapse on 26 July 2017 at the Petermann Glacier, by jointly using high-resolution remote sensing and ice flow modeling. The surface velocity, melt ponds and sea-ice backscatter were derived from Sentinel1/2 images to capture their dynamic response variations before the collapse occurred in the melt season of 2017. Moreover, the distribution of stress and damage solution was modeled with the ice sheet system model (ISSM) to assess the dynamic structural instability of the floating ice tongue. Finally, we discussed what triggered the frontal collapse of the PG in 2017, including the weakening of landfast sea ice, the shearing of tributary glacier inflow and the meltwater infiltrated crevasses.
2. Study Site
The Petermann Glacier in northern Greenland is approximately 70 km in length, with a 15 km in width floating ice tongue whose thickness changes from about 600 m at its grounding line to about 30–80 m at the ice front [41]. Draining approximately 4% of the Greenland ice sheet [36], PG is the second largest floating ice tongue in Greenland. About 80% of the mass flux across the grounding line is lost through basal melting of the PG ice shelf [41], and the other mass loss (~20%) takes place during the intermittent calving events and the processes of surface sublimation in winter and meltwater runoff in summer. The glacier lost ~40% of its tongue in two massive calving events in 2010 and 2012, and its terminus is now at its most retreated position since records began [36,37]. The mass loss has been attributed to increased oceanic heat flux to Greenland’s glaciated margins [12,42], which is related to the increase in calving rate, including the collapse of ice shelves and the retreat of grounding lines. The latest relatively small calving event occurred on 26 July in 2017, along a pre-existing rift in the Petermann Glacier, northern Greenland, branched off from the glacier’s terminus. The tabular iceberg formed covered 8.9 square kilometers and drifted in the fjord. The frontal collapse made the ice tongue terminus further retreat and lose the connection with right side of fjord wall.
3. Data and Methodologies
3.1. Satellite Images
The European Copernicus Sentinel-2 satellites mission consists of a constellation of Sentinel-2A and Sentinel-2B satellites, launched successively in June 2015 and March 2017. The swath width of a frame is 290 km, and the spatial resolutions of the four bands (blue, green, red and near-infrared (NIR) are 10 m. Compared with the revisit time (16 days) of Landsat 8, Sentinel-2 reduces this by 11 days. Remote sensing satellites passing from neighboring orbits could further shorten initial revisit time (5 days) due Petermann in North-West Greenland located high latitudes region. This is of benefit when monitoring the changes of glacier surfaces at a finer temporal scale, especially for short-lived collapse events. In this study, Sentinel-2A/B images were respectively acquired with ≤10% cloud cover during the summer months (May to July) to derive the ice velocity and melt ponds in PG from the European Space Agency Copernicus Open Access Hub and Google Earth Engine in Tables S1 and S2. In addition, Landsat 8 OLI (Operational Land Imager) was preferred in using to cover the whole extent of sea ice just from one scene of images without mosaics other frame images seen in Table S3.
The Sentinel-1 synthetic aperture radar (SAR) Level-1 Ground Range Detected (GRD) data product (https://developers.google.com/earth-engine/guides/sentinel1) (accessed on 7 February 2021) was employed to quantify the hardness of the landfast sea ice neighboring ice front of PG in July 2017. These data were processed using the SNAP Sentinel-1 Toolbox (https://step.esa.int/main/toolboxes/sentinel-1-toolbox/) (accessed on 7 February 2021) to estimate the backscatter (applying a precise orbit, border noise removal, thermal noise removal, radiometric calibration, and terrain correction) via the Google Earth Engine platform. All the corresponding remote sensing images are presented in the Table S4.
3.2. Extracting Ice Velocity and Melt Pond Extent
We utilized cross-correlation feature tracking [43] to derive the ice flow on the selected Sentinel-2 images near-infrared (NIR) band between May and September in 2017. The ice flow was first established by a speckle tracking technique in two dimensions implemented on COSI-Corr software [43,44]. We then used the Rosenau filter algorithm to remove the speed outliers [45], which is processed by region growth filter, median and directional filter to remove from velocity field. Additionally, the inverse distance weight algorithm is used to interpolate velocity field. Finally, we chose the mean speed in a non-glacier stable region for the accuracy estimation [46].
Melt ponds were extracted from the floating ice in the Sentinel-2 images by a threshold segmentation algorithm executed on the Google Earth Engine platform [23]. We applied this physically based technique to the pond outlines defined with the normalized difference water index (NDWI) [47], which was set to 0.25 for segmentation threshold. NDWI is calculated with the difference ratio of the red and blue bands, following Equation (1):
The pixels were classified as water and no-water to count meltwater extent statistics. We visually check manually the results corresponding Sentinel-2 images to excluded evident gross error due to could, shade and coverage void. Finally, we calculated the whole melt ponds area at each scene and acquire the time series of melt ponds evolution.
3.3. Numerical Ice-Flow Modeling
We applied an analytical forward model implemented in the ice sheet system model to calculate the spatial-temporal distribution of damage and stress [48]. The ice flow was approximated using MacAyeal/Morland’s “shelfy stream approximation” (SSA) technique within a 2-D model. The observed velocity and rheology assumed as constant were used to calculate the stress field of floating ice according to Glen’s flow law, which revealed an approximately proportional relationship between glacier strain rate and deviatoric stress [49]. An important consequence of this analytical solution is that the damage and effective deviatoric stress can be calculated analytically as the stress balance evolves to quantify and diagnose the glacier instability state. The axes of the principal stress was computed by using the surface stress to compare with the orientation of the crevasses on glacier terminate position [50]. We can write the expression for effective stress and damage in the simplified form [48,50]:
where respectively represent effective stress, transverse stress, shear stress and longitudinal stress; is damage scalar; is transverse strain rate; is the contribution of lateral and shear strain rate terms; is the density of ice; is gravitational acceleration; is the ice thickness; is the ice rigidity.
The model geometry was obtained from the mass conserving bed product in the Bed-Machine v3 Greenland dataset [51]. This dataset includes the ice thickness and ice base derived from the ice surface by employing the floating condition. We updated the recent ice fronts and set up the boundary conditions, in which a stress-free surface and water pressure were respectively applied at the ice-atmosphere and ice-ocean interface. Along the other boundaries of the model domain, Dirichlet conditions were applied to ensure that the ice velocity equaled the observed velocity, and that the direction of the ice velocity was tangential to the boundary. The modeling domain covered the Petermann Glacier basin. The model calculation was performed on an adaptive finite element grid, with a high resolution of 50 m in fast-flowing regions and a coarser resolution of 2000 m in the slow-moving region. For the fracture of floating ice, the region was refined with a mesh resolution of 20 m. In total, the mesh was made up of about 1,757,389 elements.
4. Results
4.1. The Sub-Week Timescale Ice Flow
Sentinel 2A/2B images characterized the frontal collapse process near the glacier terminus in PG, as shown in Figure 2. We acquired the high-resolution 20-m ice velocity with a sub-week or even daily overpass timescale in July in 2017. There is a sign of widening of the fracture taking place on the day (25 July 2017), prior to the calving event date (26 July 2017). The contours of the PG terminus position are shown in Figure 3, and we calculated the mean velocity to analyze the trend of the flow rates. Average surface velocities on the calving region show a relatively steady state of 3 m/d, with a huge peak of 31 m/d observed one day before the calving, which corresponds to evident accelerated signal shown in Figure 3d. In the glacier velocity field results, the average displacement of bedrock in an off-glacier region was used as an accuracy measure to assess uncertainty of the ice speeds [21]. The uncertainty of ice velocity for six-days internal was approximately 4.2 m (0.69 m/d), and the measurement error of ice velocity between 24 July and 25 was 2.52 m for the one-day internal, as shown in Figure 4. Additionally, the speed of the upstream region at one-day internal showed less than other dates in Figure 3d due to the measurement error limited by the capacity of feature tracking algorithm extracting small displacement. In general, the accuracy of velocity is reliable to analyze the changes of time series at the terminus calving region within considerable accuracy range.
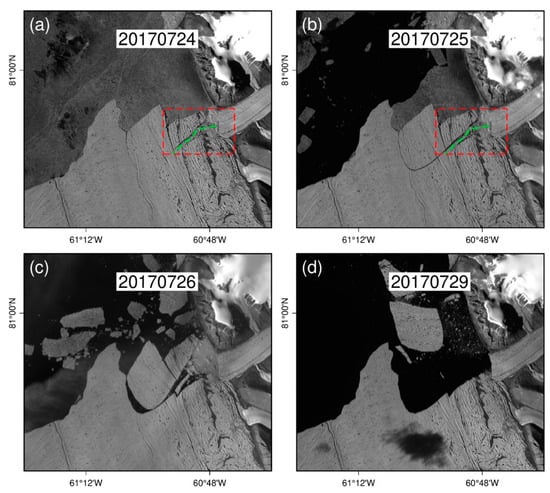
Figure 2.
The sequence of Sentinel-2 NIR-band images showing the Petermann Glacier terminus collapse event in 2017. (a) The fracture of the terminus region occurring; (b) the fracture of the terminus region widening; (c) the frontal collapse event that occurred on 26 July 2017; (d) iceberg drift after collapse. The red polygon region shows the shear zone and the green line denotes the bending deformed ice.
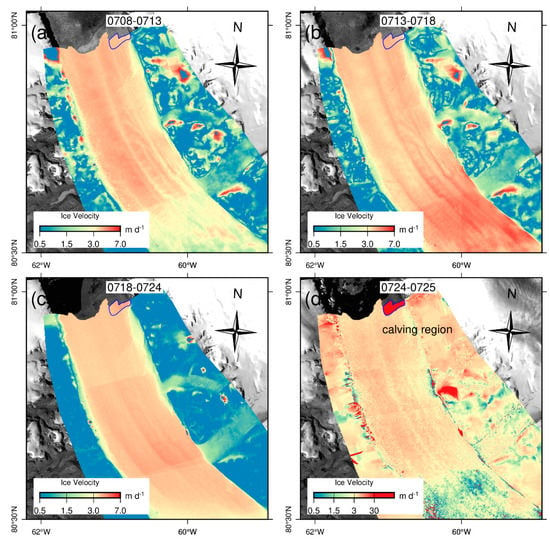
Figure 3.
Surface daily velocity field of the Petermann glacier in four periods of July 2017, prior to the frontal collapse. (a) The daily velocity field from 08 July to 13 July in 2017; (b) the daily velocity field from 13 July to 18 July in 2017; (c) the daily velocity field from 18 July to 24 July in 2017; and (d) the daily velocity field from 24 July to 25 July in 2017.
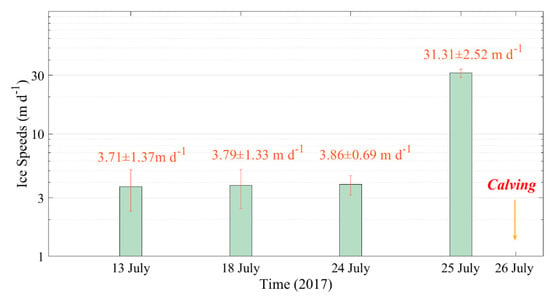
Figure 4.
The time series of Petermann Glacier’s velocity, the blue polygon in Figure 3, during July 2017, prior to the calving event. Additionally, the red error bar represents the velocity accuracy evaluation.
Widening of the fracture of the terminus region in the outlet glacier was accompanied by an abrupt increase of the scalar flow rates. Although we cannot directly capture the subpixel change due to the restriction of the resolution (10 m) of the remote sensing image shown in Figure 2b, we could monitor the significant increase—by about 10 times—of the speeds in Figure 3d. Pre-collapse velocity served as a kinematic precursor to enlargement of the crack before glacier calving occurrence. In addition, the tributary glacier feeds and drains from the perpendicular direction and pushes the joint region of the main glacier’s terminus, leading to a deformed shear zone which weakens the outlet glacier surface structure with continuing evolution of the rift, and afterwards the calving will occur sooner or later. The analysis for the calving cause from inflow of a tributary is discussed in Section 5.1.
4.2. Damage and Stress Analysis
We used analytical stress and damage solution in July 2017 to assess diagnostic fracture stability and to analyze the calving process. Figure 5a illustrates transverse stress distribution that stretches across the flow line forming in a transverse extension zone with large crevasses. The longitudinal stress showed crevasses in an ice divergence zone where opening rift existed in Figure 5b. Splashing crevasses developed a shearing zone in Figure 5c with adjacent tributary glacier terminate. Local stress fields promoted crevasse opening and enhanced ice flow near the shear margin, leading to a relative rotation of the flow in the convergence zone. Additionally, the middle part in the crevasse, marked green line in Figure 2a, was bended convex upward shape with respect to local flow in red rectangle region of Figure 2a,b. In general, crevasses are typically parallel to the least tensile principal stress axes and normal to the most tensile principal strain rate axes in the horizontal plane [52]. We computed the axes of the principal stress by using the surface stress to compare with the orientation of the crevasses on glacier terminate position in Figure 5d. On the connected point with tributary glacier terminate, high shear stress showed unbalanced force from different direction ice movements producing vulnerable region in Figure 5c. However, we did not find the obvious velocity change from crevasses region during the period of 18 July to 24 July in Figure 3c until the day of 25 July despite of remarkable signals on stress from high longitudinal and transverse stress values in Figure 5. The stress characteristics serves as preconditioning factor describing the fracture instability.
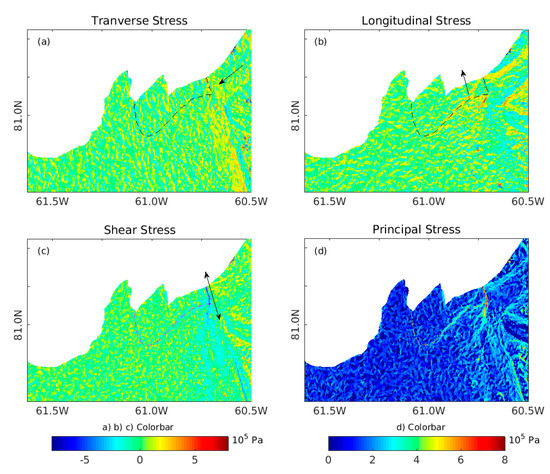
Figure 5.
Ice stress condition distribution at the glacier’s terminus corresponding to the period of Figure 3c (average daily stress from 18 July to 24 July in 2017) before the calving event. (a) The transverse stress, (b) the longitudinal stress, (c) the shear stress and (d) the first principle stress.
An evident sign was seen that the gradually increased effective stress series exerted within the front of glacier during July 2017 in Figure 6. The weakness of structural integrity was mainly distributed at zone of fracture which have consistently yielded an effective stress field. The magnitude of effective stress ranged from 300–800 kPa in the shear zone. As long as weakened ice shelf stepped into an unstable state of rheology in Figure 6, unstable regime controlled by the plastic rheology of crevasse may reduce ice tongue strength under the increased effective stress burden. The spatial-temporal changes of effective stress present the instantaneous effect to destroyed crevasse. One day prior to collapse, pressure on the tongue reached the ultimate threshold in Figure 6d; glacier strength was not sufficient to carry more effective stress, hence the calving event.
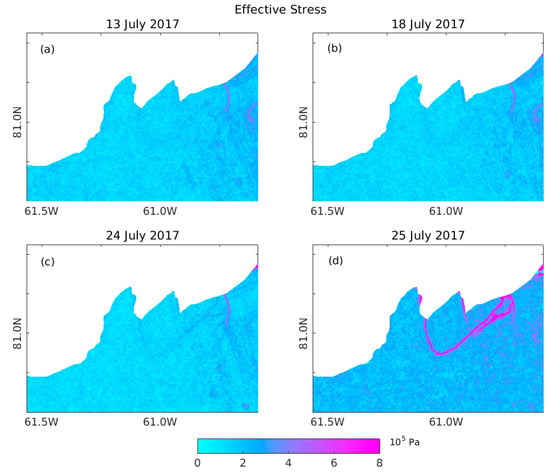
Figure 6.
The effective stress distribution evolution for the Petermann Glacier ice tongue in four stages in July of 2017, prior to the calving day. (a–d) respectively represent mean effective stress fields from the corresponding periods.
An example of this preconditioning can be seen in the interaction of these damaged shear zones with the existing fractures perpendicular to flow in the center of the PG’s ice tongue. To quantify how ice-shelf stress affects fracture stability, we constructed a fracture stability damage diagram referring to the Equations (2) and (3). The increasing damage scalar series of ice tongue before calving gradually weaken and impair the glacier integrity in Figure 7, which could not offer enough buttressing at the glacier’s terminus. In days prior to collapse, there was obvious damage region in the crevasse which reached the threshold (0.5), even the completed damaged state. A highly damaged region means the crevasse has been penetrated, which could not forbear an occurrence of caving soon afterwards. When these rifts connect with the damaged shear zone, the ice front is no longer stabilized due to the structural weakening, resulting in large calving events. The high effective stress and damages in frontal region shows that an underlying and vulnerable condition for this type of glacier flow instability was reaching an ultimate disintegration.
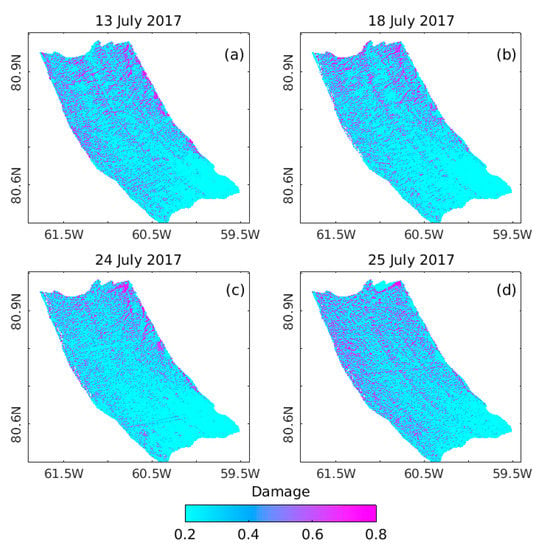
Figure 7.
The damage scalar series of the Petermann Glacier on the days in July 2017, prior to the calving. (a–d) respectively represent mean damage scalar from the corresponding periods.
4.3. The Backscatter Coefficients of the Landfast Sea Ice
We calibrated the backscatter calculation based on SAR images to quantify the freeze and thaw state, which provided a representative condition estimate [53] and reflected the toughness of the landfast sea ice. Additionally, the sea-ice extent adjoint to ice front has declined dramatically summer ice extent in recent days by delineating the extent of sea ice in fjord. Backscatter value of Sentinel1 GRD data serves as an index for thaw-melt state of sea ice and ice mélange. The landfast sea ice transformed into open water and break up in Figure 8 when the backscatter coefficient decreased to −28 from 17 July to 26 July (calving day) accompanied by sea ice extent declining in Figure 9.
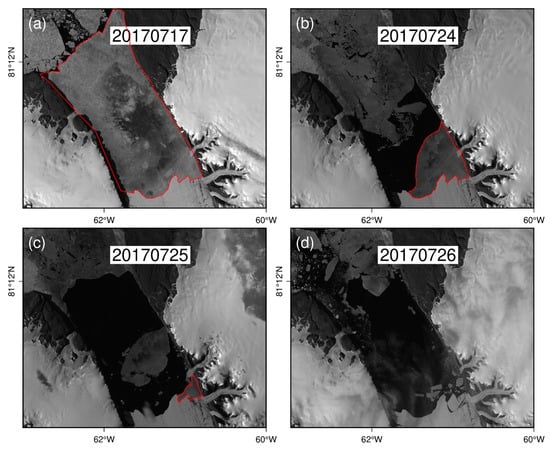
Figure 8.
The outline of landfast sea-ice images of Landsat 8 in the Petermann glacier fjord in July of 2017. The red polygon region denotes the extent of landfast sea ice in (a–c). (d) The landfast sea ice has completely disappeared.
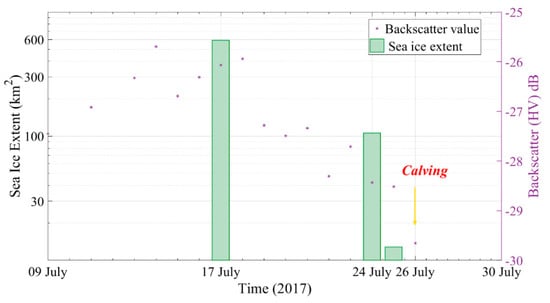
Figure 9.
The evolution of sea-ice extent and backscatter of the surrounding sea ice of the ice front during July 2017 prior to calving events (26 July 2017).
The Google Earth Engine Platform has provided the data products so we only use it to make time series analysis of backscatter to quality the rigidity varieties of sea ice and ice mélange. The results show that reduction in stiffness of the ice mélange since stepped into melt season, and sea ice transformed into open water as soon as calving day (26 July 2017), which was attributed to losing the buttressing effect of sea ice and ice mélange. To fully understand the spatial and temporal variability of sea-ice rigidity, we inspected 16 Sentinel-1 images acquired throughout the high melt period between 9 July and 26 July. The weakening of multiyear landfast sea ice evolved with fjord condition and glacier terminus and followed by the frontal collapse event that occurred there in 2017. Additionally, the breakup of sea ice located close to the ice front was synchronous with frontal collapse event and had an influence on glacier terminus instability. Abundant sea ice filled in fjord consolidates and fastens to the terminate in early melt season. The following time the sea-ice extent declined from 589.75 in 17 July to 12.81 in 25 July in Figure 8. Landfast sea-ice minimum extent occur nearly coincident in time with observed collapse velocity maxima. The resulting changes in buttressing of sea ice lost leads to a sudden increase in effective stress that propagated the instability through the frontal calving region in only a few days. The weakening of sea ice directly accelerated ice flow immediately and the concretely calving mechanism about sea ice was found in Section 5.2.
4.4. The Evolution of Melt Pond Extent
The onset of surface melt typically occurs on the earliest summer melt recorded in mid-June. The produced meltwater started to fill crevasses in the suture damage zone, which formed many water-filled crevasses or saturated crevasses on floating ice. The extent of melt ponds on the floating ice reached the peak about 30 coverage in late June/early July at high melt period and lasted for nearly one month until the calving occurred in Figure 10. The multi melt water on the floating ice runoff by the river which have filled and infiltrated surface crevasse on ice shear zone. In melt season, the observed velocity delayed the change of meltwater generation and the multi melt pond existed before the frontal collapse. How abundant meltwater has impact on glacier instability was described in discussion in Section 5.3.
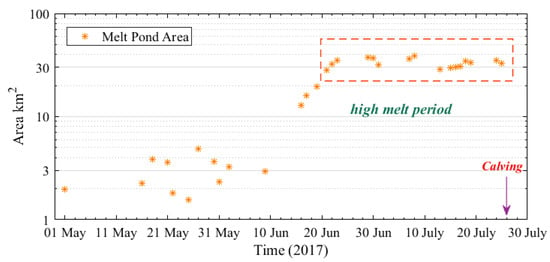
Figure 10.
The time series of the Petermann glacier melt ponds’ area in the floating ice region prior to the calving event of July 2017.
5. Discussion
5.1. Tributary Glacier Shear
The tributary glacier shows confluences and extrudes in the shear zone in Figure 2a,b, which deformed the curving arch, resulting in pushing ice terminate disintegration. The left side of icebergs from the tributary glacier developed one band of ice bend existing in front of the fracture, and it suffered from high lateral shear stress (Figure 2a,b and Figure 5c). The right side of the trunk glacier denotes a developing shear margin with the initiation of weakening ice strength. Glacier confluence and erosion developed the vulnerable region with high damage zone in Figure 7. With melt season coming, the glacier terminate region was vulnerable to tributary glacier mass-wasting deposition, which resulted in the fracture expanding. The shear margin in Figure 2 suffered high maximum principal stress and developed multiple crevasses and damaged ice areas [50].
The advection of tributary glacier fed and supplied the trunk glacier in step with aggravating the development of a vulnerable zone and ice tongue disintegration [21]. The discharged ice volume from tributary glacier inflow filled in the fracture to intensify the evolution of the crevasse in heavily damaged areas in Figure 2. Consequently, ice calving may be associated with glacial erosion and inflow from a tributary glacier. The tributary glacier fed in ice tongue and served as a preconditioning factor through the process of outer-margin fracture amplification. The iceberg movement trajectory indicated a relative rotation of the flow towards the northwest under the effect of tributary and trunk glaciers in Figure 2c. The tributary inflow has an impact on stress balance in the convergence zone and triggers calving.
5.2. The Weakening of Sea Ice
The calving event of PG in 2017 was attributed to the breakup of sea ice at the ice tongue termination. It has been shown that landfast sea ice can protect the ice tongue from fracture and delay calving events. The backscatter serves as an indicator of sea-ice condition to detect the evolution of sea-ice rigidity in Figure 9. The water reflected the low backscatter values due to the high dielectric constant, and with the temperature of the sea warming, ice mélange and sea ice melt volume started to increase. The warming sea water weakened the rigidity of sea ice responding to the decline of the observed backscatter parameter seen in Figure 9. The warming sea water destabilized with a frontal collapse signature on the terminus surrounded by stagnant regions easily visible in satellite images in Figure 8. In particular, the ocean temperature increased by 0.1 °C since 2017 below 450 m on the Petermann floating ice shelf (Figure 11)—the improved basal melt rate thinned the frontal ice shelf [54]. Ocean warming makes landfast sea ice vulnerable, and the reduced buttressing enhances the potential for calving. Quantifying and analyzing sea ice condition will enhance the ability of understanding the mechanism of ice front retreat. The weakening of landfast ice becomes the most proximal cause for the onset of ice disintegration.
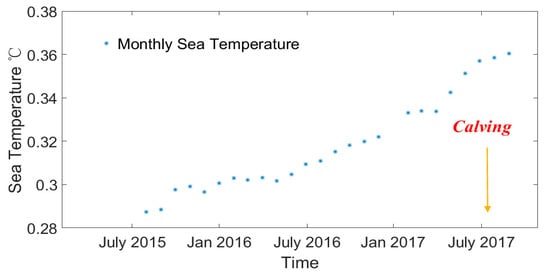
Figure 11.
Monthly series of ocean temperature below 450 m at the Petermann ice shelf from 2015 to 2017 at position (59.9671 W, 80.5804 N) from Andreas Muenchow.
5.3. Meltwater Infiltrating Crevasses
Many melt ponds decrease the albedo of the glacier tongue, which suffers the risk of potential glacial collapse [55]. The presence of englacial liquid water can weaken ice, and it is plausible that surface melt at the suture zone could percolate into the ice, weaken shear margins, and allow the ice tongue to speed up as a result of reduced rigidity [17,18]. The storage capacity and estimated water depths of these crevasses are large enough to induce hydro-fracturing if there is sufficient meltwater supply. The afflux from rivers and melt ponds into water-filled crevasses may triggered hydro-fracturing [32]. The coincident coordinated drainage occurs during the peak in meltwater production, which means that lake drainage events occurred during a high melt period [56,57].
Generally, ice speeds along flow lines gradually increases as the melt season progresses, particularly within the shear margins in grounded ice. However, on floating ice, surface meltwater may also influence ice calving by percolating through crevasse and hydrofracture drainage, weakening the ice shelf shear margins [18]. Certainly, the complex process and feedback between calving and floating ice hydrology-driven forcing may need to be examined. Our efforts focused on the evolution of melt pond area that shows a short-term increase in surface velocity correlated with an ice terminate disintegration. In addition, the observation demonstrated that the time at which there is a maximal area of melt ponds is preceded by the moment when ice flow reaches peak values; some time is spent in the high melt period to destabilize the fractures and penetrate crevasses. Additionally, the meltwater infiltrating crevasses may not accelerate ice flow immediately, so it cannot directly induce an instantaneous ice calving event. Therefore, the surface meltwater has a potential impact on glacier terminus stability, due to hydrofracturing under a warmer and continued high melt season, which eventually drive ice calving.
6. Conclusions
This paper quantified high spatial-temporal ice flow speeds, sea ice backscatter and melt-water ponds with multi-source remote sensing datasets and calculated the stress and damage of a floating ice tongue using a numerical ice flow model, to understand the precursors and causes for a calving event that occurred in July 2017 at the Petermann Glacier, northern Greenland. The weakening of landfast sea ice reduces the buttressing force for the glacier terminus as its extent declines, which most directly leads to calving. Additionally, tributary glacier extrusion and shear also play roles in destabilizing the frontal shear zone. In addition, multiple melt ponds evolve to fill in fractures, which may induce the hydrofracturing and weaken the floating ice structure as a precondition of triggering subsequent frontal collapse. In total, we infer that weakening sea ice, shearing due to inflow from the tributary glacier and meltwater in crevasses may all have led to this calving event. The joint use of dense remote sensing observations and numerical ice-flow models for a quick ice-flow system will deepen our understanding of the hydrological and kinematic precursors of frontal collapse in Greenland ice shelves and its response to climate change.
Supplementary Materials
The following are available online at https://www.mdpi.com/2072-4292/13/4/591/s1, Table S1–S4: satellite images list. Table S1: Ice Velocity retrieved from Sentinel-2 satellite images; Table S2: Melt Pond calculation of Sentinel2 images from Google Earth Engine; Table S3: Sea Ice Extent retrieved from Landsat-8 satellite images; Table S4: Backscatter retrieved from Sentinel1 images from Google Earth Engine.
Author Contributions
The idea of this research was conceived by D.L. and L.J.; methodology, D.L., L.J., and R.H.; experimental data was processed and analyzed by D.L.; writing—original draft, D.L. and R.H.; writing—review and editing, L.J. All authors have read and agreed to the published version of the manuscript.
Funding
This research was funded by the National Key R&D Program of China (grant number 2018YFC1406102 and 2017YFA0603103), the Strategic Priority Research Program of the Chinese Academy of Sciences (grant number XDA19070104) and the Key Research Program of Frontier Sciences, CAS (grant number QYZDB-SSW-DQC027 and QYZDJ-SSW-DQC042).
Informed Consent Statement
Informed consent was obtained from all subjects involved in the study.
Data Availability Statement
All the results and data generated during the study, i.e., ice velocity, stress, etc., can be accessed by request from the first author (lidaan@asch.whigg.ac.cn).
Acknowledgments
The authors would like to thank the ESA for providing free Sentinel-2 images (https://scihub.copernicus.eu/dhus), Landsat 8, the Google Earth Engine Platform and the ISSM model in JPL offered; and thanks goes to Sebastien Leprince for providing the COSI-Corr software package. We also thank the two anonymous reviewers for providing feedback and suggestions that significantly improved the paper.
Conflicts of Interest
The authors declare no conflict of interest.
References
- Bondzio, J.H.; Morlighem, M.; Seroussi, H.; Kleiner, T.; Rückamp, M.; Mouginot, J.; Moon, T.; Larour, E.Y.; Humbert, A. The mechanisms behind Jakobshavn Isbrae’s acceleration and mass loss: A 3-D thermomechanical model study. Geophys. Res. Lett. 2017, 44, 6252–6260. [Google Scholar] [CrossRef]
- Benn, D.I.; Cowton, T.; Todd, J.; Luckman, A. Glacier calving in Greenland. Curr. Clim. Chang. Rep. 2017, 3, 282–290. [Google Scholar] [CrossRef]
- Rignot, E.; Kanagaratnam, P.J.S. Changes in the velocity structure of the Greenland Ice Sheet. Science 2006, 311, 986–990. [Google Scholar] [CrossRef]
- Bevan, S.; Luckman, A.; Murray, T.J.C. Glacier dynamics over the last quarter of a century at Helheim, Kangerdlugssuaq and 14 other major Greenland outlet glaciers. Cryosphere 2012, 6, 923–937. [Google Scholar] [CrossRef]
- Jensen, T.S.; Box, J.E.; Hvidberg, C.S. A sensitivity study of annual area change for Greenland ice sheet marine terminating outlet glaciers: 1999–2013. J. Glaciol. 2016, 62, 72–81. [Google Scholar] [CrossRef][Green Version]
- Bondzio, J.H.; Seroussi, H.; Morlighem, M.; Kleiner, T.; Rückamp, M.; Humbert, A.; Larour, E.Y. Modelling calving front dynamics using a level-set method: Application to Jakobshavn Isbræ, West Greenland. Cryosphere 2016, 10, 497–510. [Google Scholar] [CrossRef]
- Podrasky, D.; Truffer, M.; Lüthi, M.; Fahnestock, M. Quantifying velocity response to ocean tides and calving near the terminus of Jakobshavn Isbræ, Greenland. J. Glaciol. 2014, 60, 609–621. [Google Scholar] [CrossRef]
- Cowton, T.; Sole, A.; Nienow, P.; Slater, D.; Wilton, D.; Hanna, E. Controls on the transport of oceanic heat to Kangerdlugssuaq Glacier, East Greenland. J. Glaciol. 2016, 62, 1167–1180. [Google Scholar] [CrossRef]
- Miles, V.V.; Miles, M.W.; Johannessen, O.M. Satellite archives reveal abrupt changes in behavior of Helheim Glacier, southeast Greenland. J. Glaciol. 2016, 62, 137–146. [Google Scholar] [CrossRef]
- Khan, S.A.; Kjeldsen, K.K.; Kjær, K.H.; Bevan, S.; Luckman, A.; Aschwanden, A.; Bjork, A.; Korsgaard, N.J.; Box, J.E.; van den Broeke, M.J.T.C. Glacier dynamics at Helheim and Kangerdlugssuaq glaciers, southeast Greenland, since the Little Ice Age. Cryosphere 2014, 8, 1497–1507. [Google Scholar] [CrossRef]
- Holland, D.M.; Thomas, R.H.; De Young, B.; Ribergaard, M.H.; Lyberth, B. Acceleration of Jakobshavn Isbrae triggered by warm subsurface ocean waters. Nat. Geosci. 2008, 1, 659–664. [Google Scholar] [CrossRef]
- Straneo, F.; Heimbach, P. North Atlantic warming and the retreat of Greenland’s outlet glaciers. Nature 2013, 504, 36–43. [Google Scholar] [CrossRef] [PubMed]
- Moon, T.; Joughin, I. Changes in ice front position on Greenland’s outlet glaciers from 1992 to 2007. J. Geophys. Res. Earth Surf. 2008, 113, F02022. [Google Scholar] [CrossRef]
- Amundson, J.M.; Fahnestock, M.; Truffer, M.; Brown, J.; Lüthi, M.P.; Motyka, R.J. Ice mélange dynamics and implications for terminus stability, Jakobshavn Isbræ, Greenland. J. Geophys. Res. Earth Surf. 2010, 115, F01005. [Google Scholar] [CrossRef]
- Reeh, N.; Thomsen, H.H.; Higgins, A.K.; Weidick, A. Sea ice and the stability of north and northeast Greenland floating glaciers. Ann. Glaciol. 2001, 33, 474–480. [Google Scholar] [CrossRef]
- Shroyer, E.L.; Padman, L.; Samelson, R.M.; Münchow, A.; Stearns, L.A. Seasonal control of Petermann Gletscher ice-shelf melt by the ocean’s response to sea-ice cover in Nares Strait. J. Glaciol. 2017, 63, 324–330. [Google Scholar] [CrossRef]
- Rathmann, N.M.; Hvidberg, C.S.; Solgaard, A.M.; Grinsted, A.; Gudmundsson, G.H.; Langen, P.L.; Nielsen, K.P.; Kusk, A. Highly temporally resolved response to seasonal surface melt of the Zachariae and 79N outlet glaciers in northeast Greenland. Geophys. Res. Lett. 2017, 44, 9805–9814. [Google Scholar] [CrossRef]
- Robel, A.A.; Banwell, A.F. A Speed Limit on Ice Shelf Collapse Through Hydrofracture. Geophys. Res. Lett. 2019, 46, 12092–12100. [Google Scholar] [CrossRef]
- Greene, C.A.; Young, D.A.; Gwyther, D.E.; Galton-Fenzi, B.K.; Blankenship, D.D. Seasonal dynamics of Totten Ice Shelf controlled by sea ice buttressing. Cryosphere 2018, 12, 2869–2882. [Google Scholar] [CrossRef]
- Khazendar, A.; Rignot, E.; Larour, E. Acceleration and spatial rheology of Larsen C Ice Shelf, Antarctic Peninsula. Geophys. Res. Lett. 2011, 38, L09502. [Google Scholar] [CrossRef]
- Nuth, C.; Gilbert, A.; Köhler, A.; McNabb, R.; Schellenberger, T.; Sevestre, H.; Weidle, C.; Girod, L.; Luckman, A.; Kääb, A. Dynamic vulnerability revealed in the collapse of an Arctic tidewater glacier. Sci. Rep. 2019, 9, 5541. [Google Scholar] [CrossRef]
- Kehrl, L.M.; Joughin, I.; Shean, D.E.; Floricioiu, D.; Krieger, L. Seasonal and interannual variabilities in terminus position, glacier velocity, and surface elevation at Helheim and Kangerlussuaq Glaciers from 2008 to 2016. J. Geophys. Res. Earth Surf. 2017, 122, 1635–1652. [Google Scholar] [CrossRef]
- Williamson, A.G.; Banwell, A.F.; Willis, I.C.; Arnold, N.S. Dual-satellite (Sentinel-2 and Landsat 8) remote sensing of supraglacial lakes in Greenland. Cryosphere 2018, 12, 3045–3065. [Google Scholar] [CrossRef]
- Pope, A. Reproducibly estimating and evaluating supraglacial lake depth with Landsat 8 and other multispectral sensors. Earth Space Sci. 2016, 3, 176–188. [Google Scholar] [CrossRef]
- Chudley, T.R.; Christoffersen, P.; Doyle, S.H.; Bougamont, M.; Schoonman, C.M.; Hubbard, B.; James, M.R. Supraglacial lake drainage at a fast-flowing Greenlandic outlet glacier. Proc. Natl. Acad. Sci. USA 2019, 116, 25468–25477. [Google Scholar] [CrossRef] [PubMed]
- Kingslake, J.; Ely, J.C.; Das, I.; Bell, R.E. Widespread movement of meltwater onto and across Antarctic ice shelves. Nature 2017, 544, 349–352. [Google Scholar] [CrossRef] [PubMed]
- Howell, S.E.L.; Small, D.; Rohner, C.; Mahmud, M.S.; Yackel, J.J.; Brady, M. Estimating melt onset over Arctic sea ice from time series multi-sensor Sentinel-1 and RADARSAT-2 backscatter. Remote Sens. Environ. 2019, 229, 48–59. [Google Scholar] [CrossRef]
- Dammann, D.O.; Eriksson, L.E.B.; Mahoney, A.R.; Eicken, H.; Meyer, F.J. Mapping pan-Arctic landfast sea ice stability using Sentinel-1 interferometry. Cryosphere 2019, 13, 557–577. [Google Scholar] [CrossRef]
- Joughin, I.; Smith, B.E.; Howat, I.M.; Scambos, T.; Moon, T. Greenland flow variability from ice-sheet-wide velocity mapping. J. Glaciol. 2010, 56, 415–430. [Google Scholar] [CrossRef]
- Fahnestock, M.; Scambos, T.; Moon, T.; Gardner, A.; Haran, T.; Klinger, M. Rapid large-area mapping of ice flow using Landsat 8. Remote Sens. Environ. 2016, 185, 84–94. [Google Scholar] [CrossRef]
- Joughin, I.A.N.; Smith, B.E.; Howat, I.M. A complete map of Greenland ice velocity derived from satellite data collected over 20 years. J. Glaciol. 2017, 64, 1–11. [Google Scholar] [CrossRef]
- Banwell, A.F.; MacAyeal, D.R.; Sergienko, O.V. Breakup of the Larsen B Ice Shelf triggered by chain reaction drainage of supraglacial lakes. Geophys. Res. Lett. 2013, 40, 5872–5876. [Google Scholar] [CrossRef]
- Leeson, A.A.; Forster, E.; Rice, A.; Gourmelen, N.; Wessem, J.M. Evolution of Supraglacial Lakes on the Larsen B Ice Shelf in the Decades Before it Collapsed. Geophys. Res. Lett. 2020, 47. [Google Scholar] [CrossRef]
- Berthier, E.; Vadon, H.; Baratoux, D.; Arnaud, Y.; Vincent, C.; Feigl, K.; Remy, F.; Legresy, B. Surface motion of mountain glaciers derived from satellite optical imagery. Remote. Sens. Environ. 2005, 95, 14–28. [Google Scholar] [CrossRef]
- Altena, B.; Kääb, A. Weekly Glacier Flow Estimation from Dense Satellite Time Series Using Adapted Optical Flow Technology. Front. Earth Sci. 2017, 5, 53. [Google Scholar] [CrossRef]
- Münchow, A.; Padman, L.; Fricker, H.A. Interannual changes of the floating ice shelf of Petermann Gletscher, North Greenland, from 2000 to 2012. J. Glaciol. 2014, 60, 489–499. [Google Scholar] [CrossRef]
- Nick, F.M.; Luckman, A.; Vieli, A.; Van Der Veen, C.J.; Van As, D.; Van De Wal, R.S.W.; Pattyn, F.; Hubbard, A.L.; Floricioiu, D. The response of Petermann Glacier, Greenland, to large calving events, and its future stability in the context of atmospheric and oceanic warming. J. Glaciol. 2017, 58, 229–239. [Google Scholar] [CrossRef]
- Rückamp, M.; Neckel, N.; Berger, S.; Humbert, A.; Helm, V. Calving Induced Speedup of Petermann Glacier. J. Geophys. Res. Earth Surf. 2019, 124, 216–228. [Google Scholar] [CrossRef]
- Hill, E.A.; Gudmundsson, G.H.; Carr, J.R.; Stokes, C.R. Velocity response of Petermann Glacier, northwest Greenland, to past and future calving events. Cryosphere 2018, 12, 3907–3921. [Google Scholar] [CrossRef]
- Tiampo, K.; Sykes, J.; Hansen, J.S.S.; Berthier, E.; Welty, E.; Leopold, M.; Loso, M.; Jacquemart, M. What drives large-scale glacier detachments? Insights from Flat Creek glacier, St. Elias Mountains, Alaska. Geology 2020, 48, 703–707. [Google Scholar] [CrossRef]
- Rignot, E.; Steffen, K. Channelized bottom melting and stability of floating ice shelves. Geophys. Res. Lett. 2008, 35, L02503. [Google Scholar] [CrossRef]
- Holland, P.R.; Jenkins, A.; Holland, D.M. The response of ice shelf basal melting to variations in ocean temperature. J. Clim. 2008, 21, 2558–2572. [Google Scholar] [CrossRef]
- Leprince, S.; Ayoub, F.; Klinger, Y.; Avouac, J.-P. Co-registration of optically sensed images and correlation (COSI-Corr): An operational methodology for ground deformation measurements. In Proceedings of the 2007 IEEE International Geoscience and Remote Sensing Symposium, Barcelona, Spain, 23–28 July 2007; pp. 1943–1946. [Google Scholar]
- Mouginot, J.; Scheuchl, B.; Rignot, E. Mapping of Ice Motion in Antarctica Using Synthetic-Aperture Radar Data. Remote Sens. 2012, 4, 2753–2767. [Google Scholar] [CrossRef]
- Lüttig, C.; Neckel, N.; Humbert, A. A Combined Approach for Filtering Ice Surface Velocity Fields Derived from Remote Sensing Methods. Remote Sens. 2017, 9, 1062. [Google Scholar] [CrossRef]
- Bolch, T.; Pieczonka, T.; Benn, D.I. Multi-decadal mass loss of glaciers in the Everest area (Nepal Himalaya) derived from stereo imagery. Cryosphere 2011, 5, 349–358. [Google Scholar] [CrossRef]
- Kang, Y.; Smith, L.C. Supraglacial Streams on the Greenland Ice Sheet delineated From Combined Spectral–Shape Information in High-Resolution Satellite Imagery. IEEE Geosci. Remote Sens. Lett. 2013, 10, 801–805. [Google Scholar] [CrossRef]
- Borstad, C.; Khazendar, A.; Scheuchl, B.; Morlighem, M.; Larour, E.; Rignot, E. A constitutive framework for predicting weakening and reduced buttressing of ice shelves based on observations of the progressive deterioration of the remnant Larsen B Ice Shelf. Geophys. Res. Lett. 2016, 43, 2027–2035. [Google Scholar] [CrossRef]
- Cuffey, K.M.; Paterson, W.S.B. The Physics of Glaciers; Academic Press: New York, NY, USA, 2010. [Google Scholar]
- De Rydt, J.; Gudmundsson, G.H.; Nagler, T.; Wuite, J.; King, E.C. Recent rift formation and impact on the structural integrity of the Brunt Ice Shelf, East Antarctica. Cryosphere 2018, 12, 505–520. [Google Scholar] [CrossRef]
- Morlighem, M.; Williams, C.N.; Rignot, E.; An, L.; Arndt, J.E.; Bamber, J.L.; Catania, G.; Chauché, N.; Dowdeswell, J.A.; Dorschel, B.; et al. BedMachine v3: Complete bed topography and ocean bathymetry mapping of Greenland from multibeam echo sounding combined with mass conservation. Geophys. Res. Lett. 2017, 44, 11051–11061. [Google Scholar] [CrossRef]
- Harper, J.T.; Humphrey, N.; Pfeffer, W.T. Crevasse patterns and the strain-rate tensor: A high-resolution comparison. J. Glaciol. 1998, 44, 68–76. [Google Scholar] [CrossRef]
- Scharien, R.K.; Segal, R.; Nasonova, S.; Nandan, V.; Howell, S.E.L.; Haas, C. Winter Sentinel-1 Backscatter as a Predictor of Spring Arctic Sea Ice Melt Pond Fraction. Geophys. Res. Lett. 2017, 44, 12262–212270. [Google Scholar] [CrossRef]
- Washam, P.; Nicholls, K.W.; Muhow, A.; Padman, L. Summer surface melt thins Petermann Gletscher Ice Shelf by enhancing channelized basal melt. J. Glaciol. 2019, 65, 662–674. [Google Scholar] [CrossRef] [PubMed]
- Buzzard, S.; Feltham, D.; Flocco, D. Modelling the fate of surface melt on the Larsen C Ice Shelf. Cryosphere 2018, 12, 3565–3575. [Google Scholar] [CrossRef]
- Cavanagh, J.P.; Lampkin, D.J.; Moon, T. Seasonal Variability in Regional Ice Flow Due to Meltwater Injection into the Shear Margins of Jakobshavn Isbr. J. Geophys. Res. Earth Surf. 2017, 122, 2488–2505. [Google Scholar] [CrossRef]
- Christoffersen, P.; Bougamont, M.; Hubbard, A.; Doyle, S.H.; Grigsby, S.; Pettersson, R. Cascading lake drainage on the Greenland Ice Sheet triggered by tensile shock and fracture. Nat. Commun. 2018, 9, 1064. [Google Scholar] [CrossRef]
Publisher’s Note: MDPI stays neutral with regard to jurisdictional claims in published maps and institutional affiliations. |
© 2021 by the authors. Licensee MDPI, Basel, Switzerland. This article is an open access article distributed under the terms and conditions of the Creative Commons Attribution (CC BY) license (http://creativecommons.org/licenses/by/4.0/).