Use of Sentinel-1 Multi-Configuration and Multi-Temporal Series for Monitoring Parameters of Winter Wheat
Abstract
1. Introduction
2. Study Site and Database Description
2.1. Study Site Description
2.2. Biophysical Parameters
2.3. Sentinel-1 Data
3. Data Analysis
3.1. Temporal Evolution of the Wheat Parameters over All Fields (2016)
3.2. Temporal Evolution of the Backscattering Signals Acquired at Two Polarizations (VV and VH) and Two Orbits (30 and 132) over All Fields
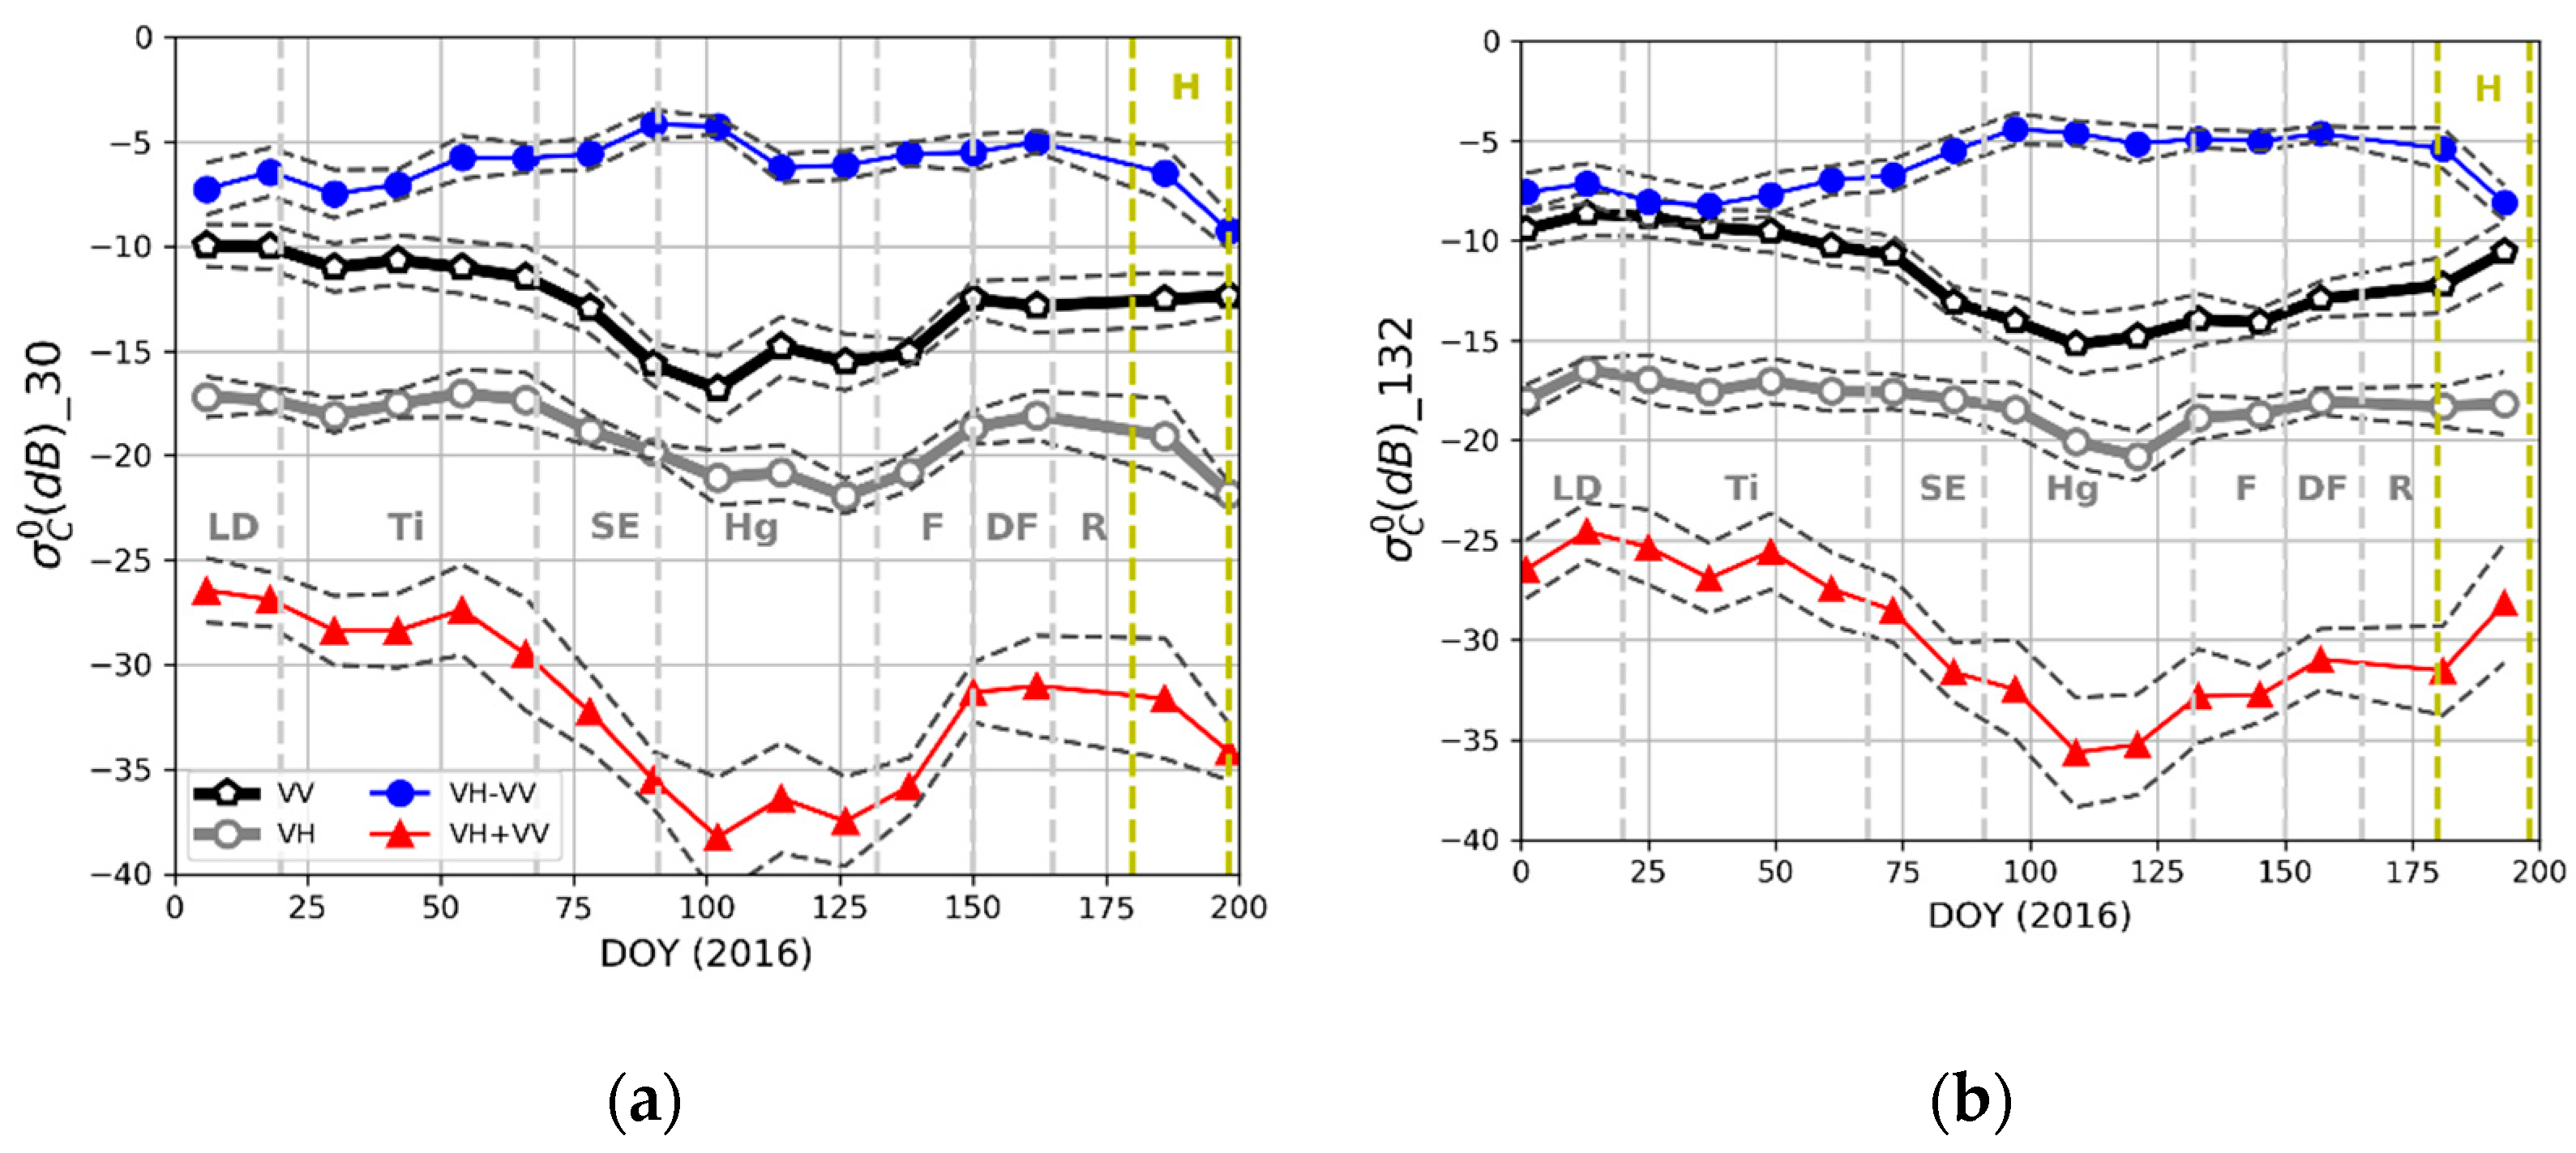
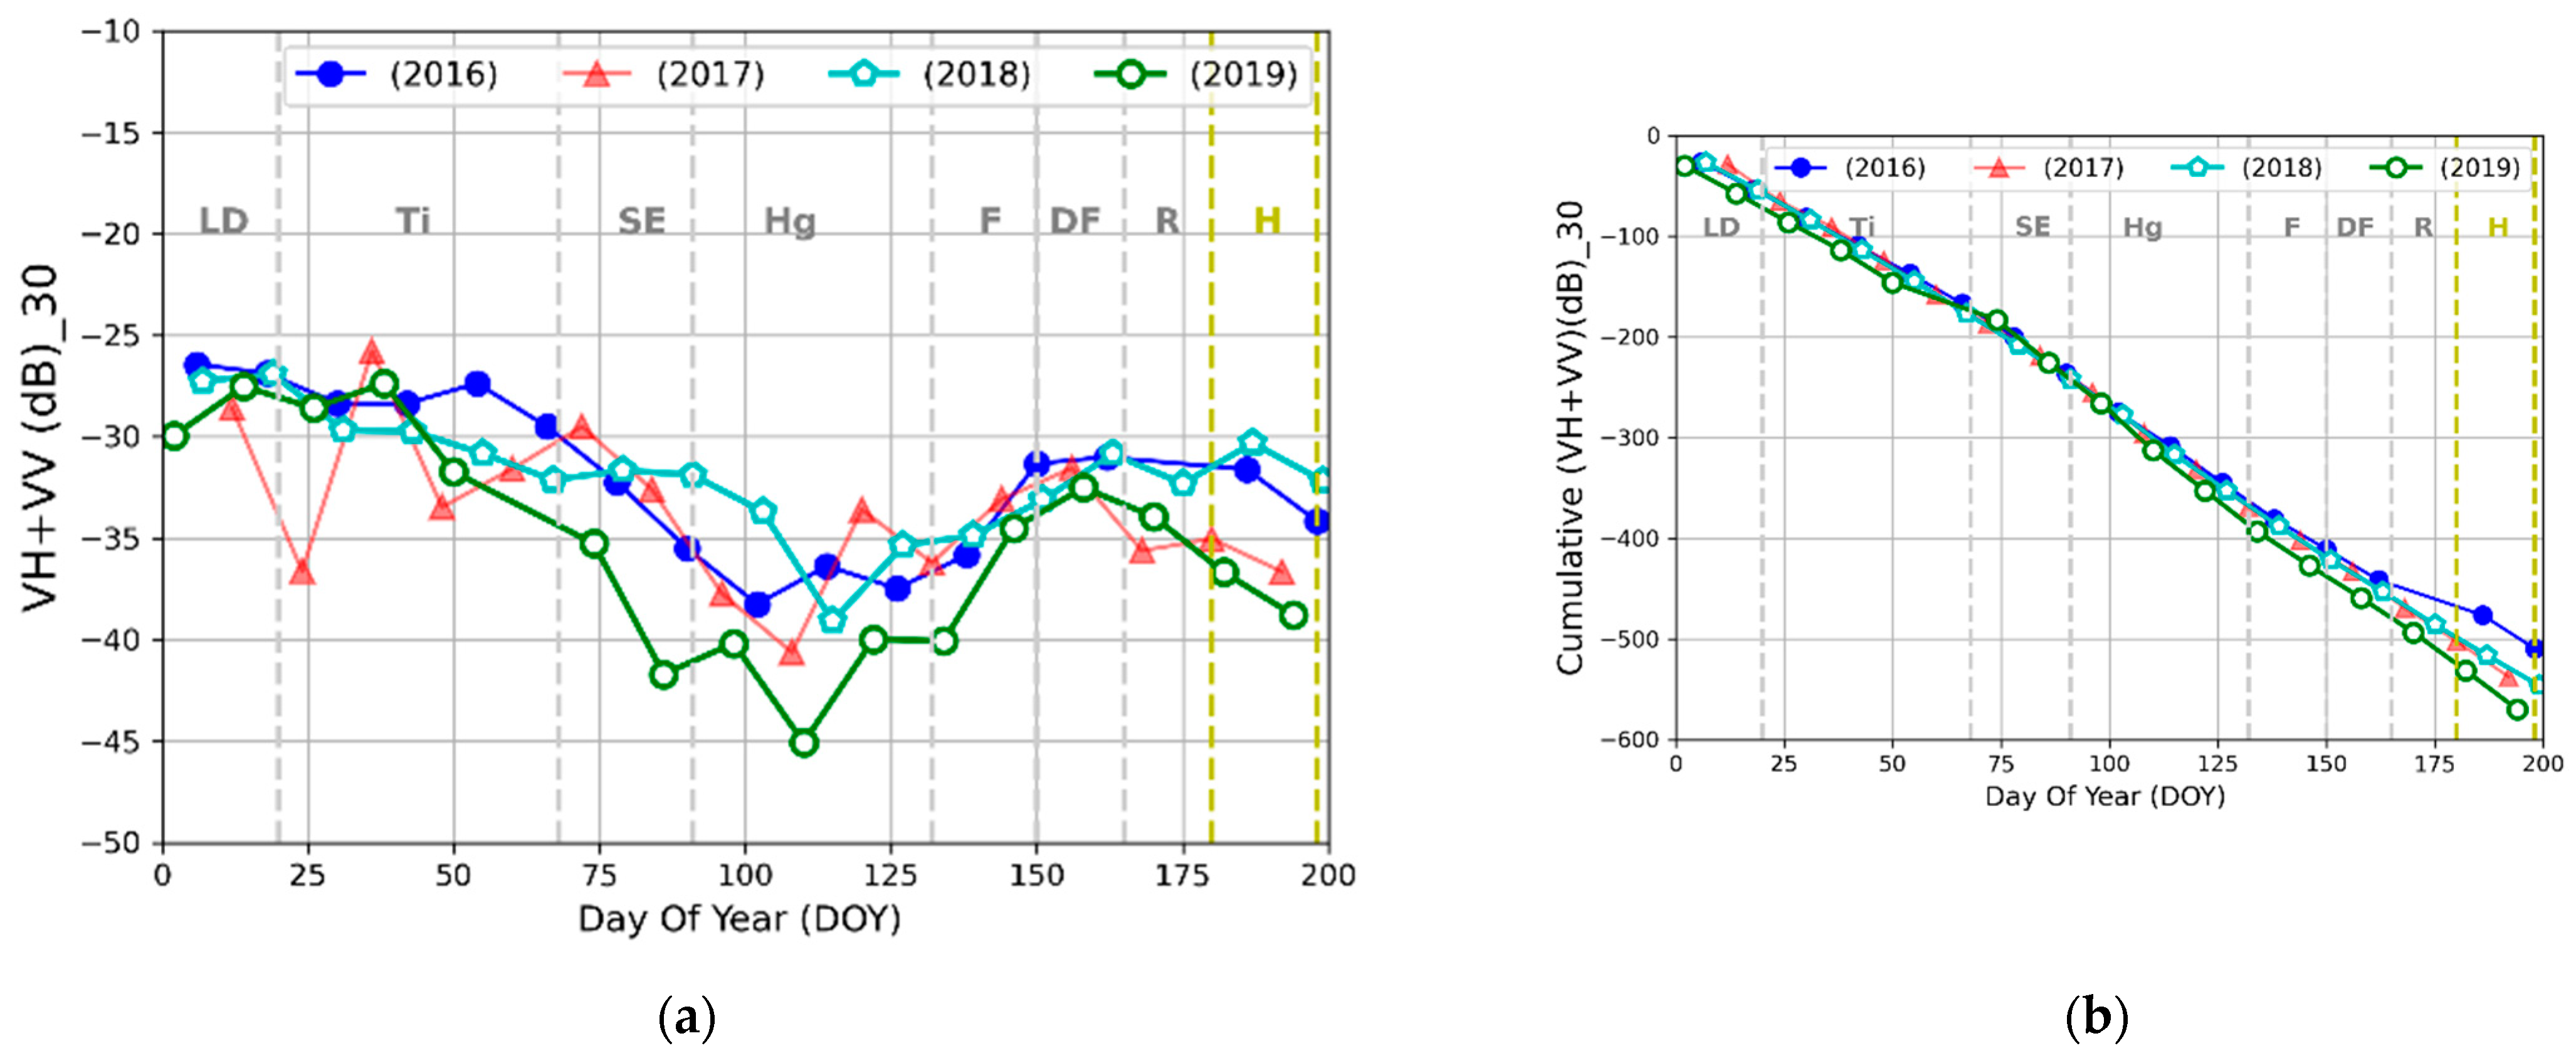
- During LD to Ti (approximatively until the DOY = 53), the backscattering coefficients show only a few variations whatever the polarization. At these stages, the crop height does not exceed 20 cm for all fields and the total S-1 backscattering signals is dominated by the contribution of bare soil between the crop rows [8,15,16].
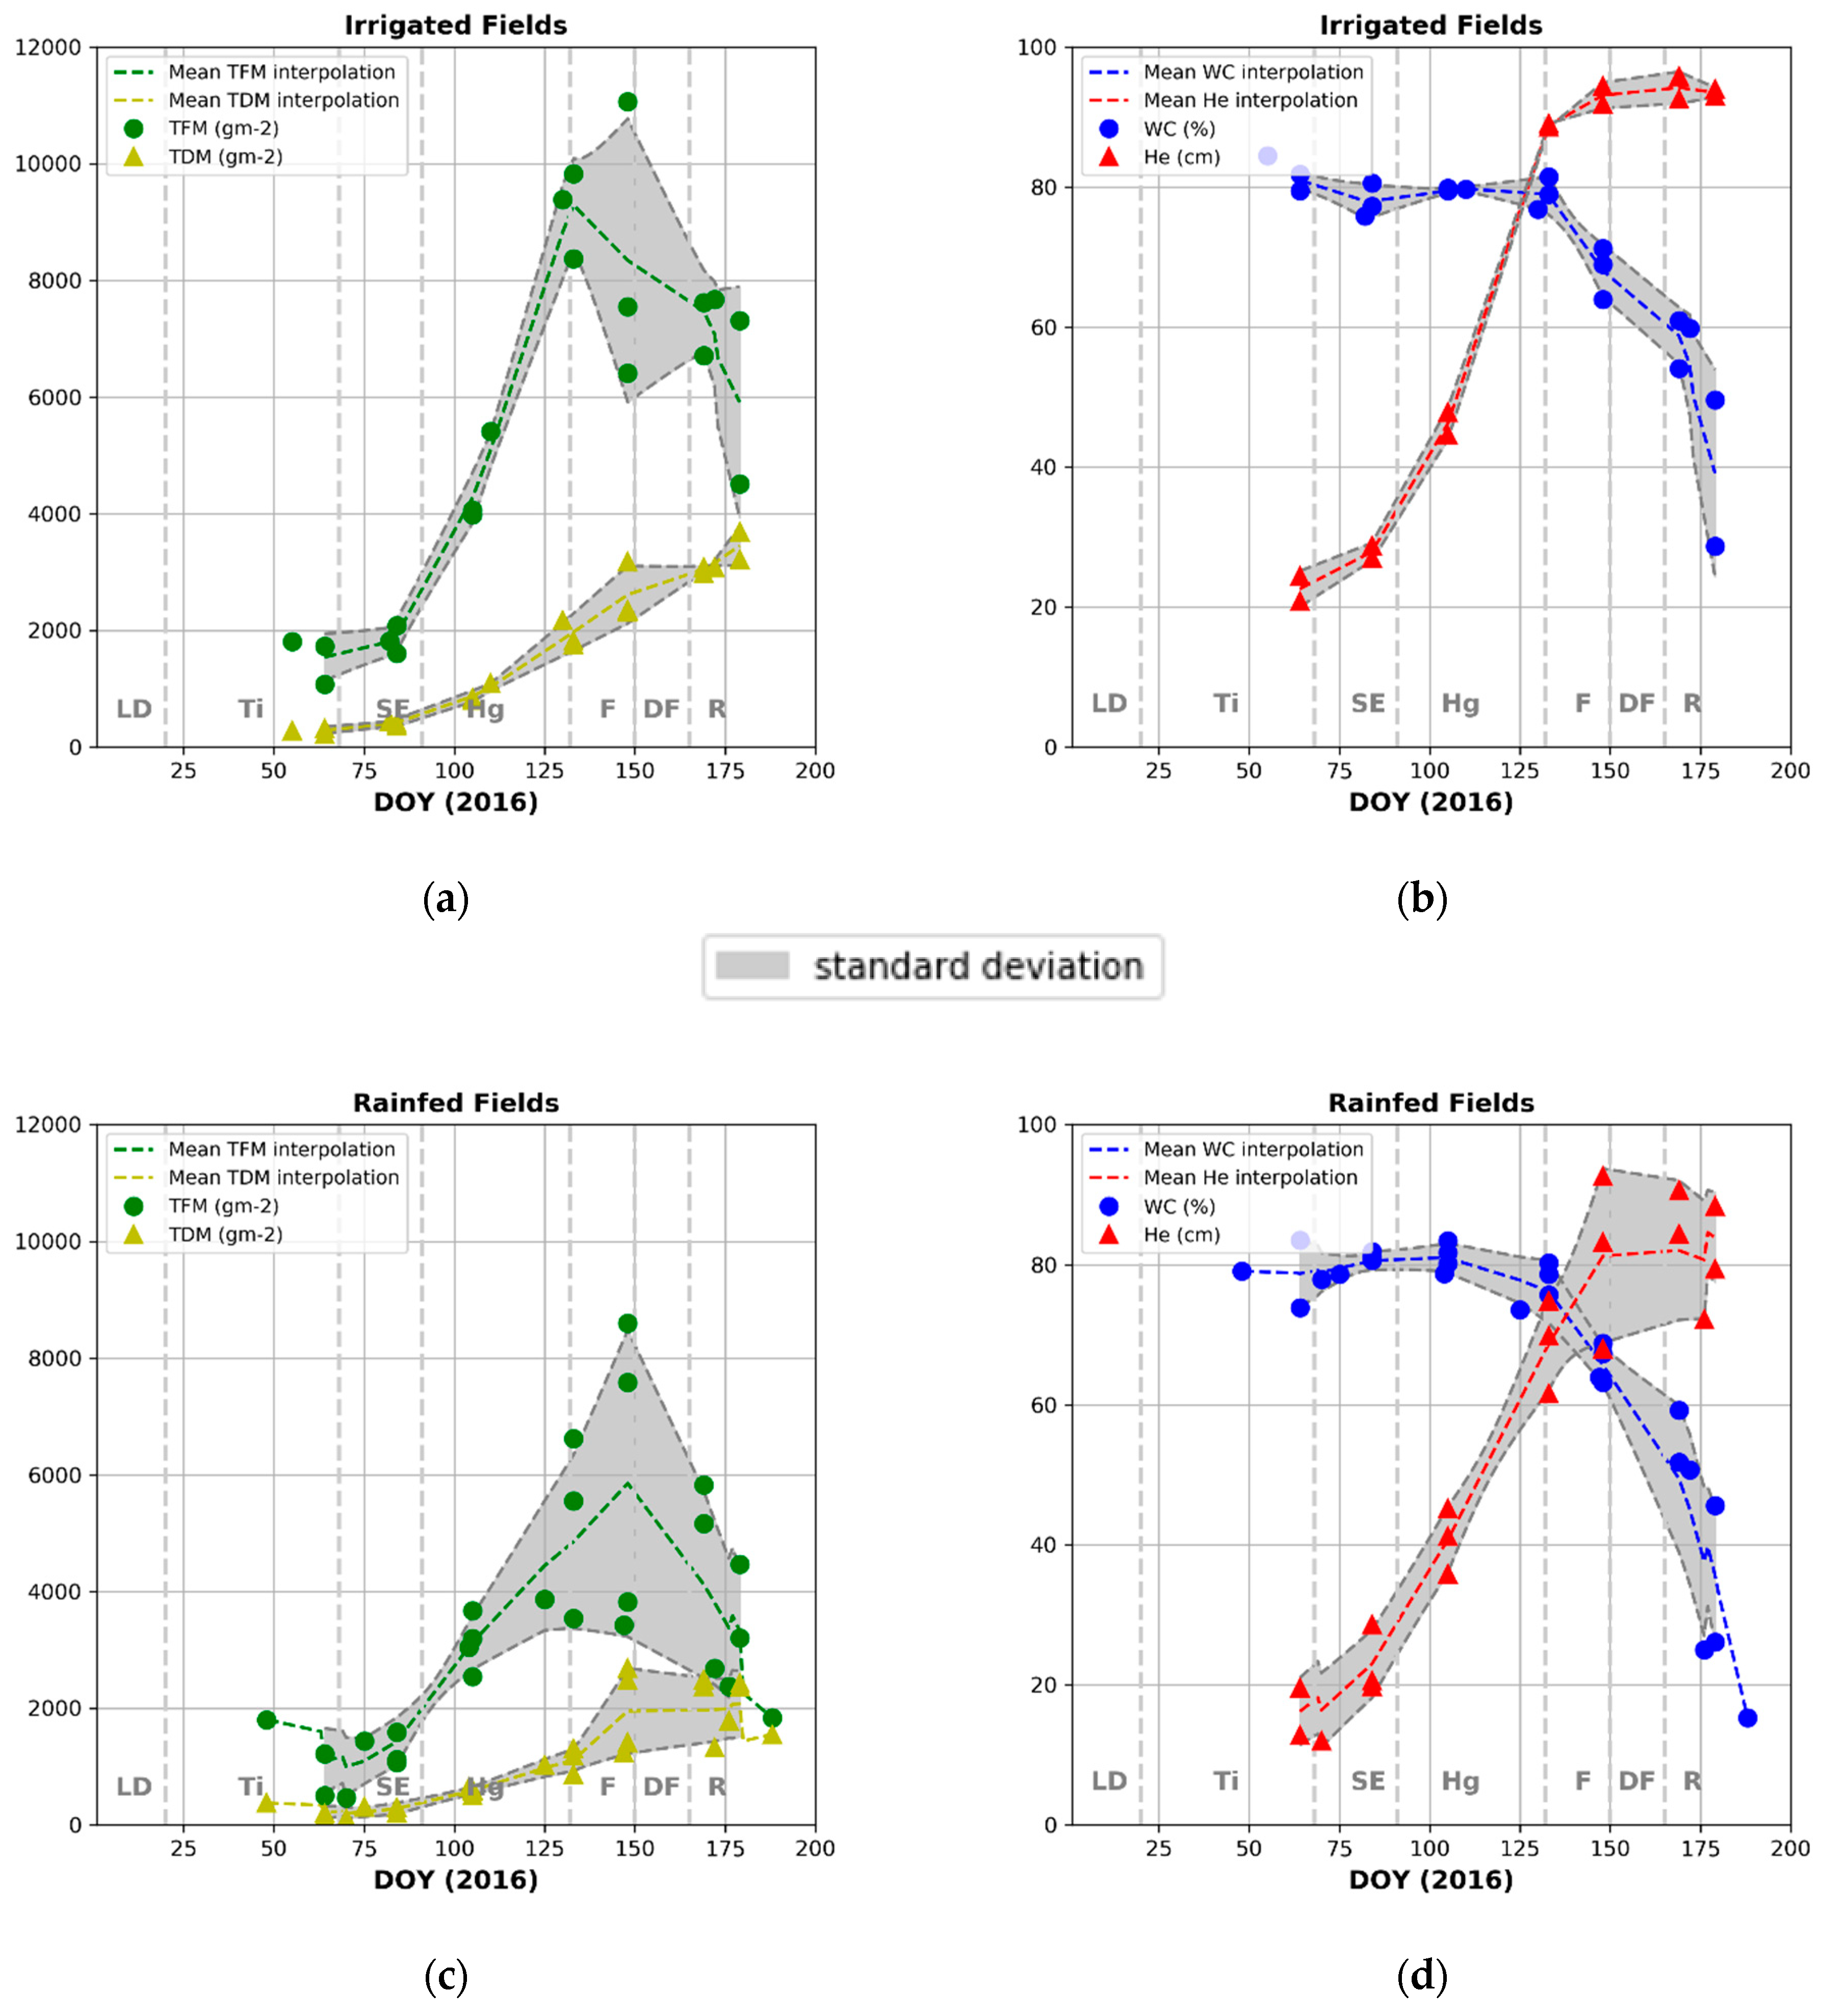
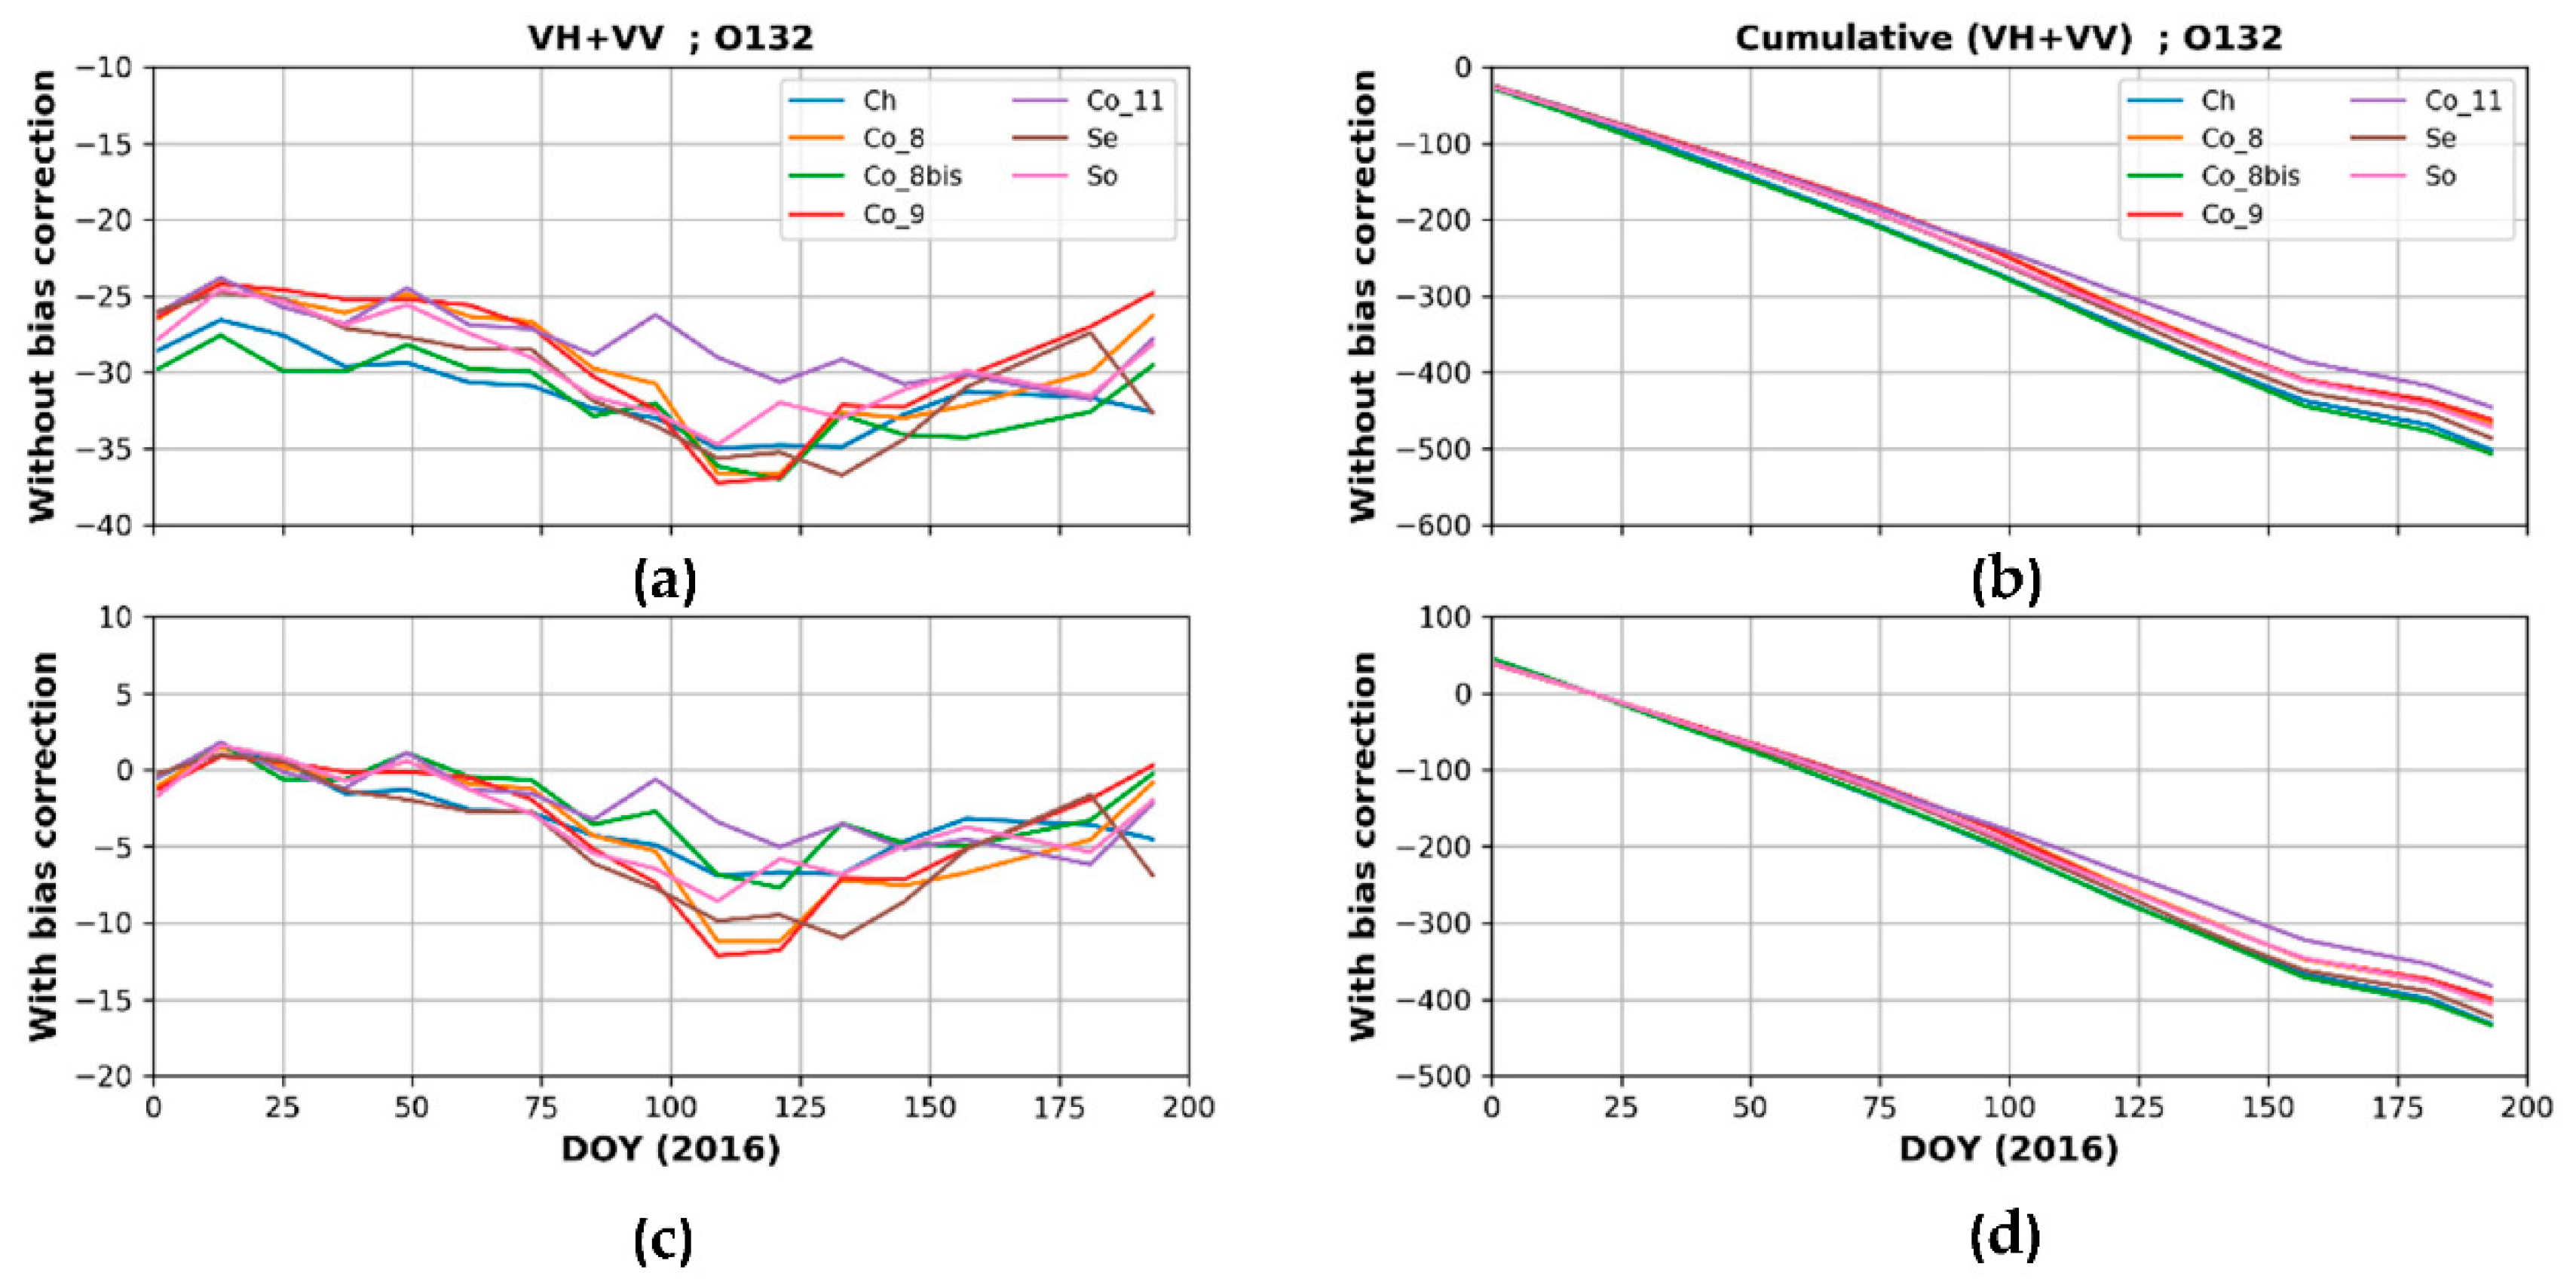
- During stem elongation (SE) to Hg stages (from DOY 53 to 125), VH, VV and VV + VH values linearly decrease with a dynamic of approximately 5 dB for VV and 3 dB for VH at orbit 132 and of 5.3 dB for both VV and VH at orbit 30. By contrast, VH − VV slightly increases during SE (about 2.5 dB). During this period, the soil contribution becomes negligible inducing an increase of the volume scattering mechanisms, which could be justified by the rise in TFM values over all wheat fields (Figure 5). According to Mattia et al. [11] and El Hajj et al. [17], the decrease in SAR signals is due to the high absorption of the incident SAR wave produced by the vertical stems and leaves associated with weak direct ground scattering. This absorption is more pronounced on the VV + VH signal (about 10 dB). Brown et al. [14] and Mercier et al. [7], demonstrated that for a very well developed wheat cover, backscatters at VV polarization were more influenced by wheat growth than VH, especially at a high incidence angle. These results are confirmed with the increase of VH − VV in time. Our result also showed that this difference is attenuated when the incidence angle decreases (orbit 30).
- Finally, from 50 days before H, the backscattering coefficients increase by approximately 2.2 dB and 3.5 dB for both VV and VH at 132 and 30 orbits, respectively, as observed in [15,20,24]. From the end of June, the backscattering is less absorbed by the vegetation due to the vegetation drying (Figure 5; [19]). The SAR signal penetrates more into the vegetation layer and is more affected by the soil moisture variations. This phenomenon is much more important for VV + VH whereas the signal VH − VV is quite stable until harvest.
4. Methodology
5. Results
5.1. Statistical Performances Combining Two Orbits (Scenario A)
5.2. Impact of the Orbit Pass (Scenario B)
5.3. Impact of Irrigation (Scenario C)
5.4. Impact of Phenological Periods (Scenario D)
6. Discussion
6.1. Impact of the Orbit Pass (Scenario B) and Irrigation (Scenario C)
6.2. Impact of Phenological Periods (Scenario D)
7. Conclusions
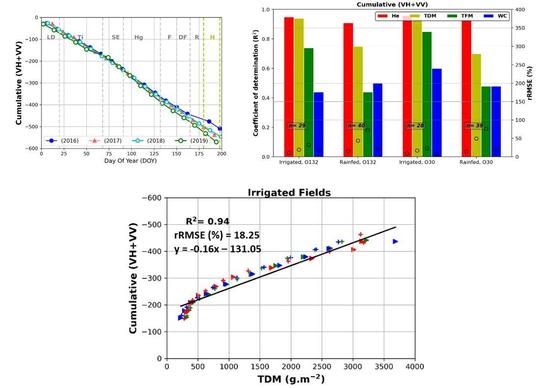
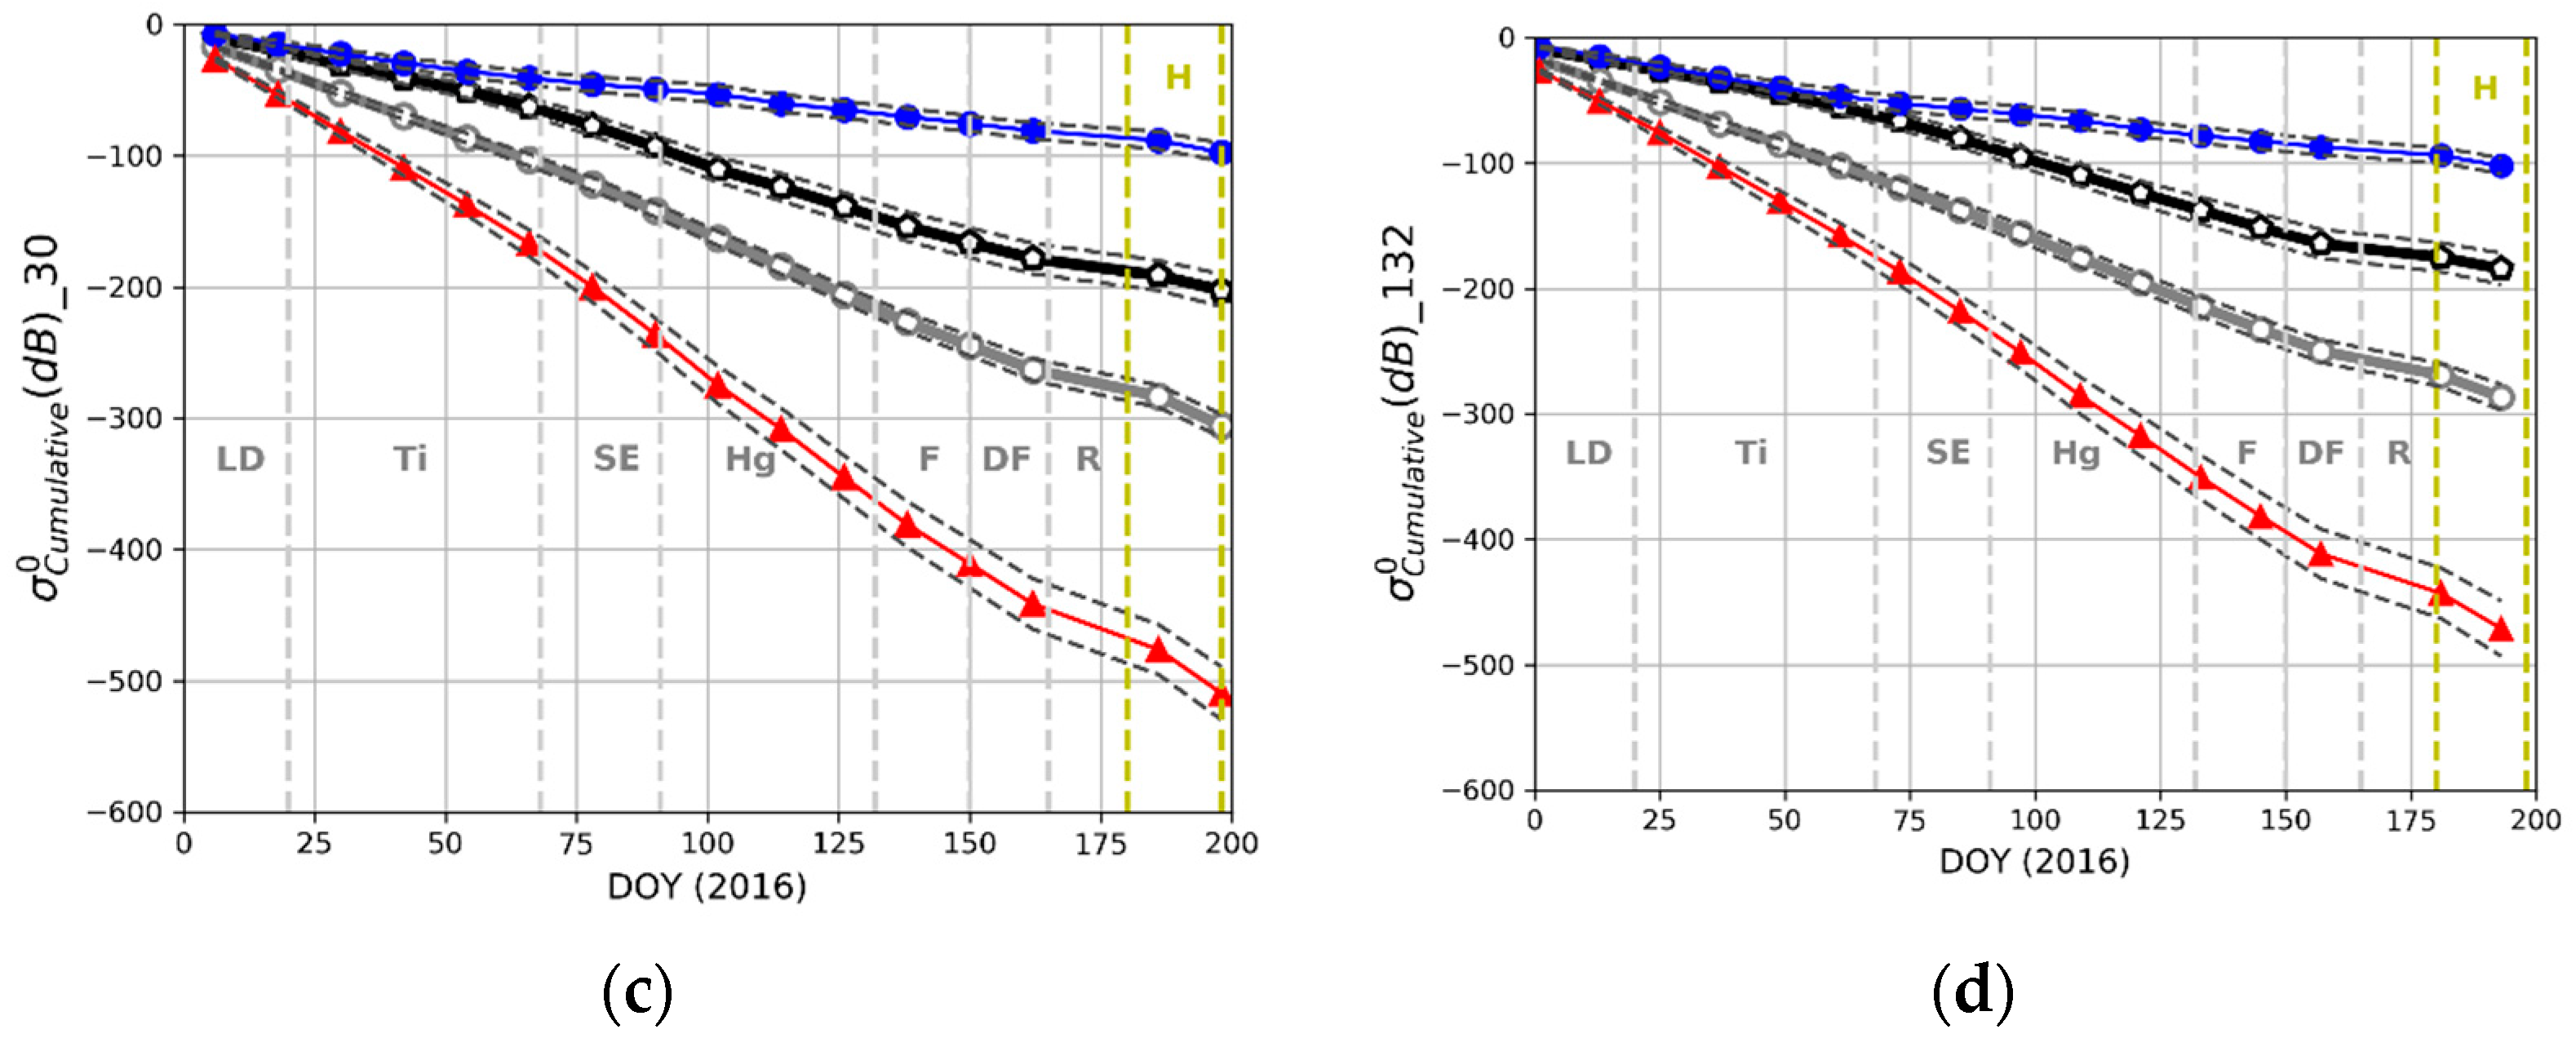
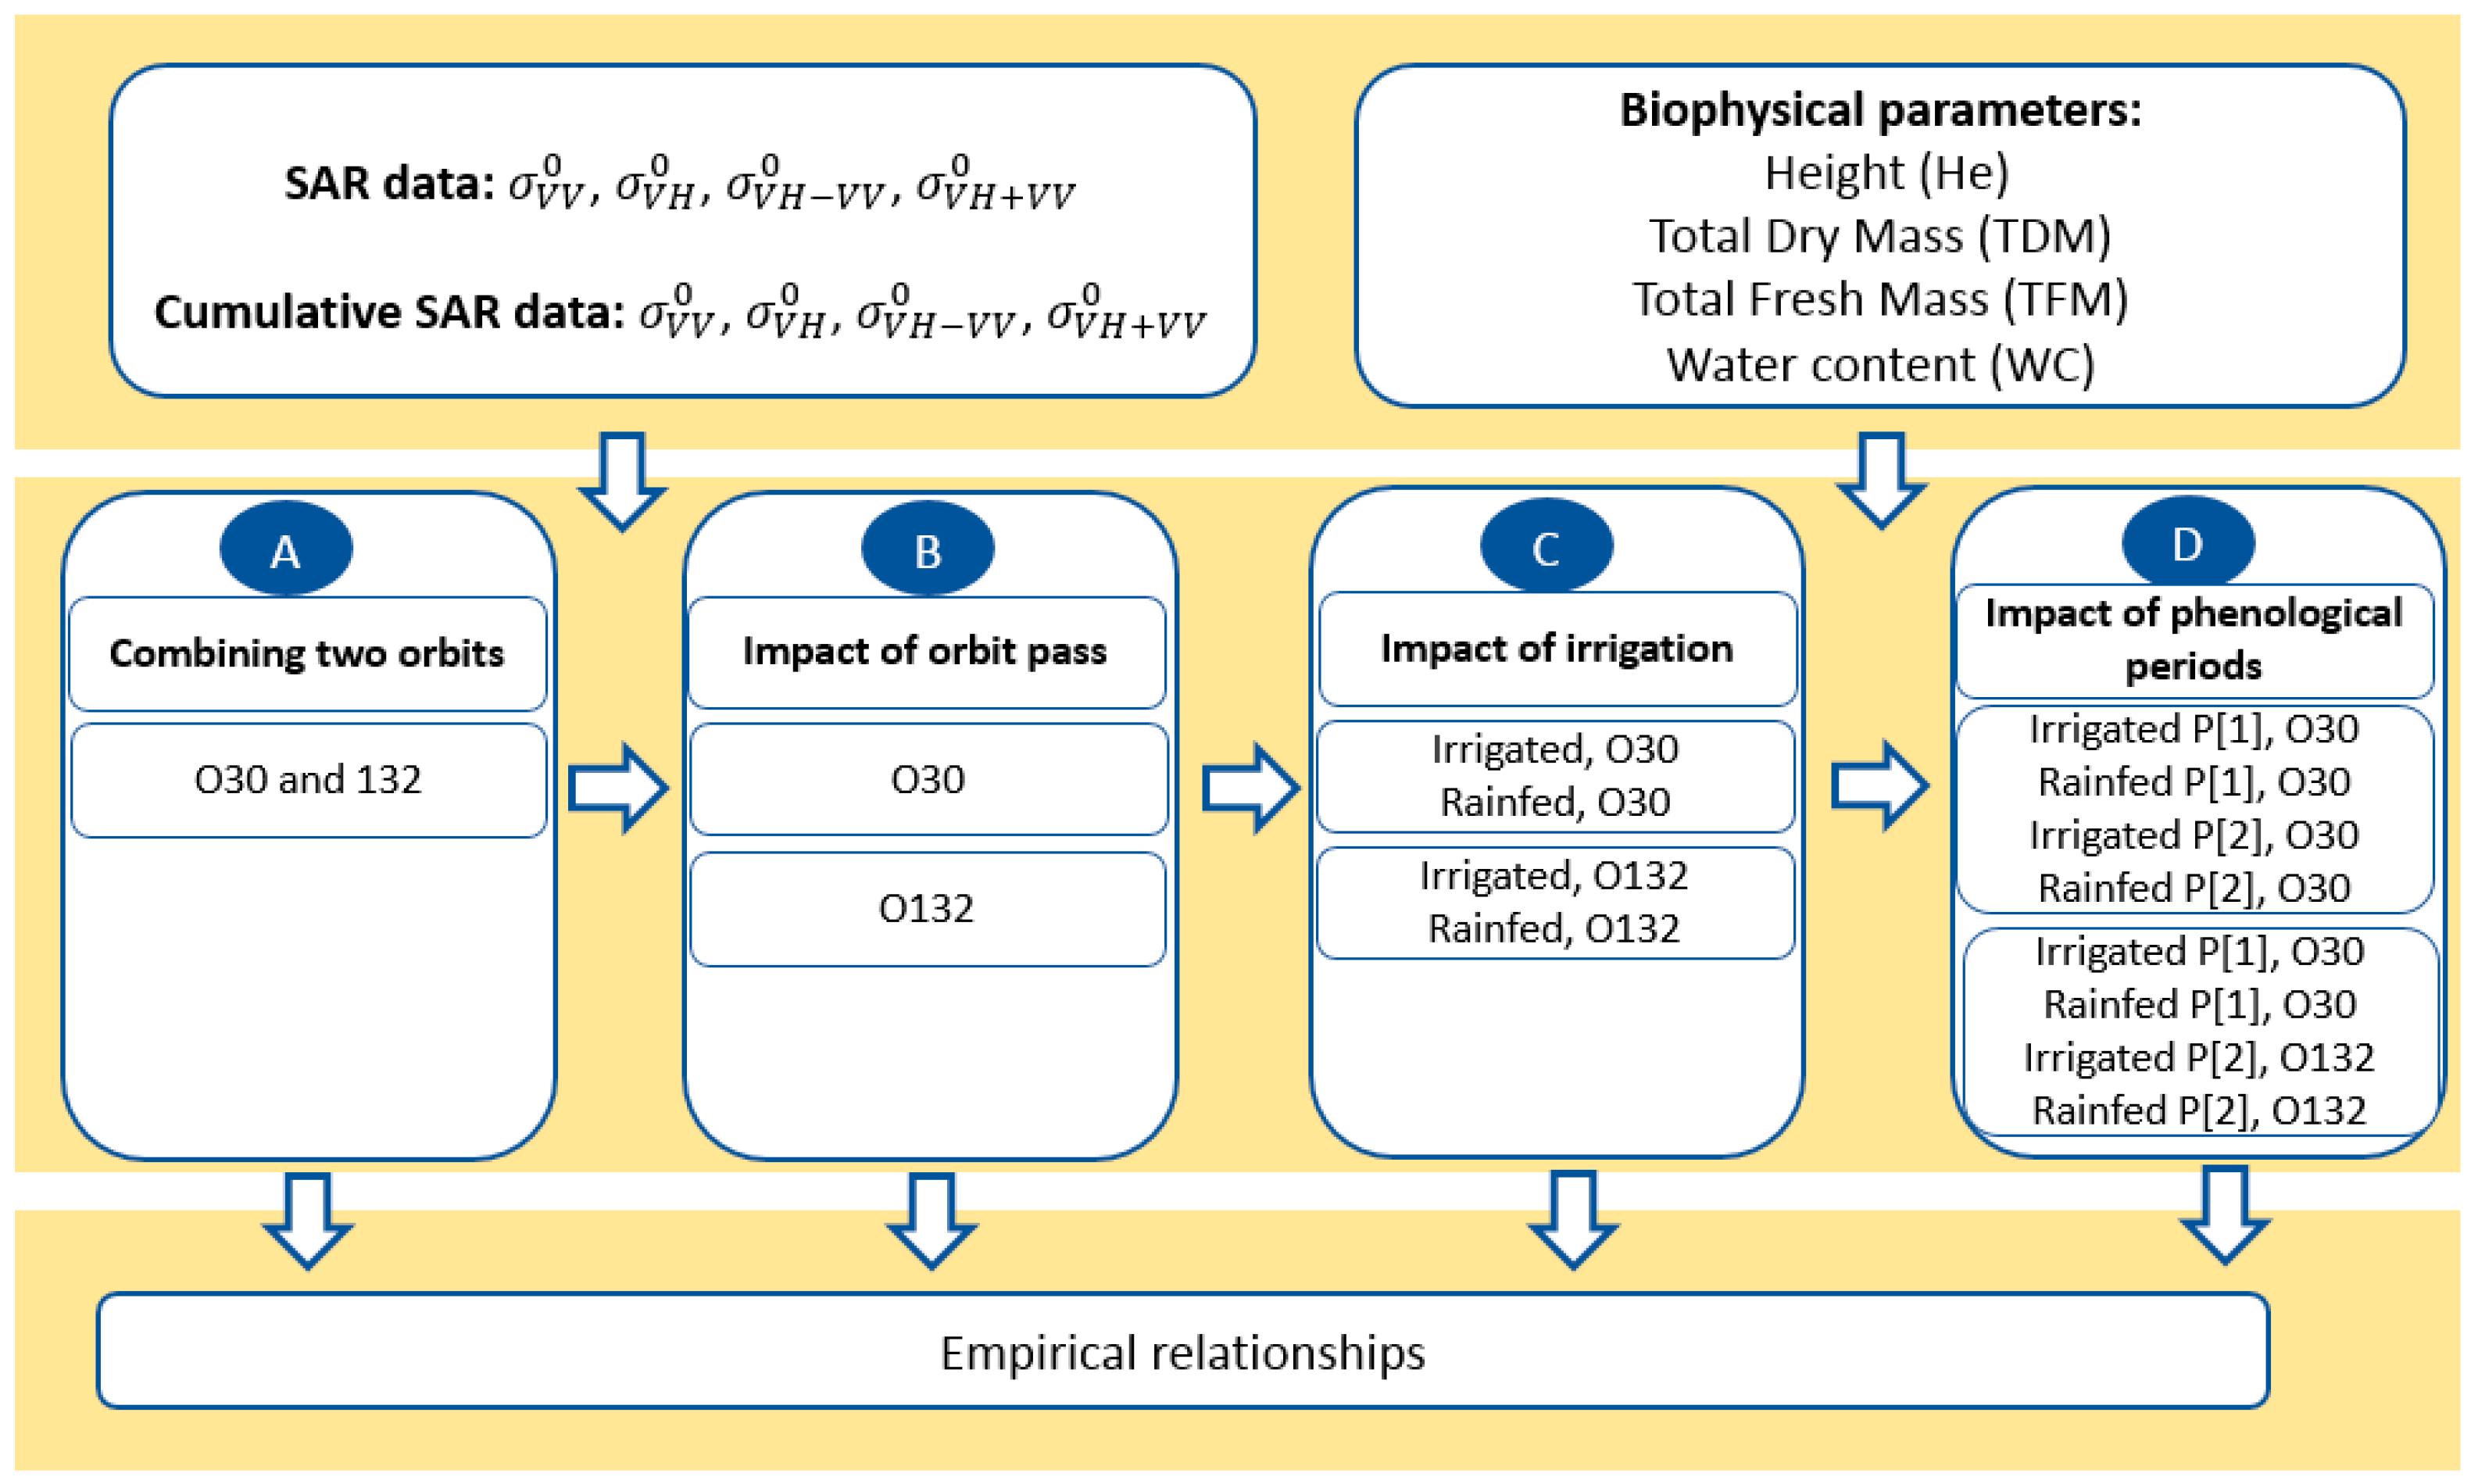
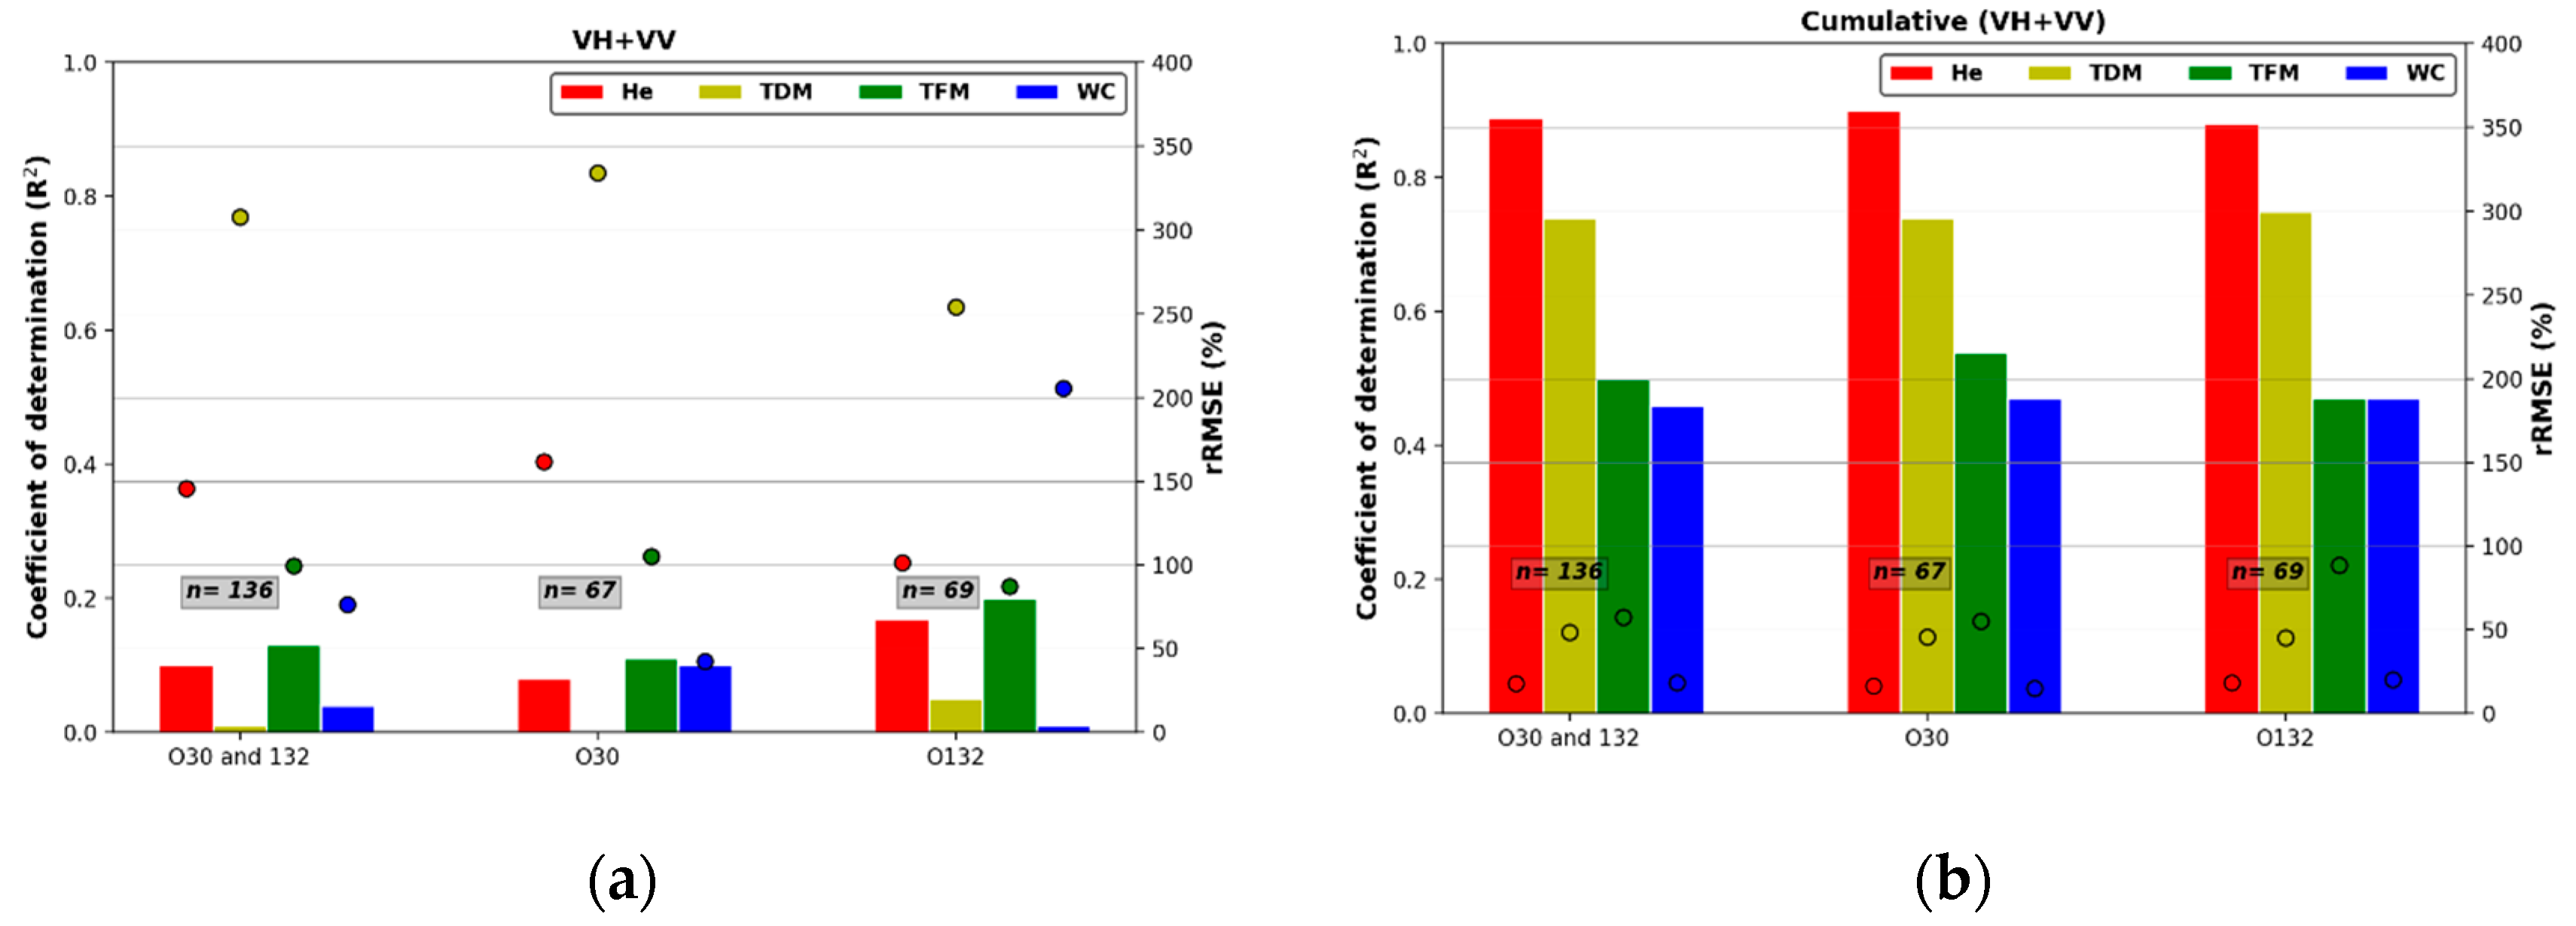
- Scenario A demonstrated that among all the evaluated radar backscatters (VV, VH, VH − VV and VH + VV), the highest correlations are obtained using the sum of VH and VV backscatters or their cumulative values. The cumulative VH + VV index is more correlated with all crop parameters (0.46 < R² < 0.89), than non-cumulative backscatters (0.01 < R² < 0.13), regardless of their agricultural practices, vegetative periods and even by combining all S-1 data orbits (30 and 132) all along the crop-growing period.
- The second scenario (B) highlighted the weak influence of the orbit pass (incidence angle) on the crop parameters retrieval all along the crop cycle whatever the considered backscatters.
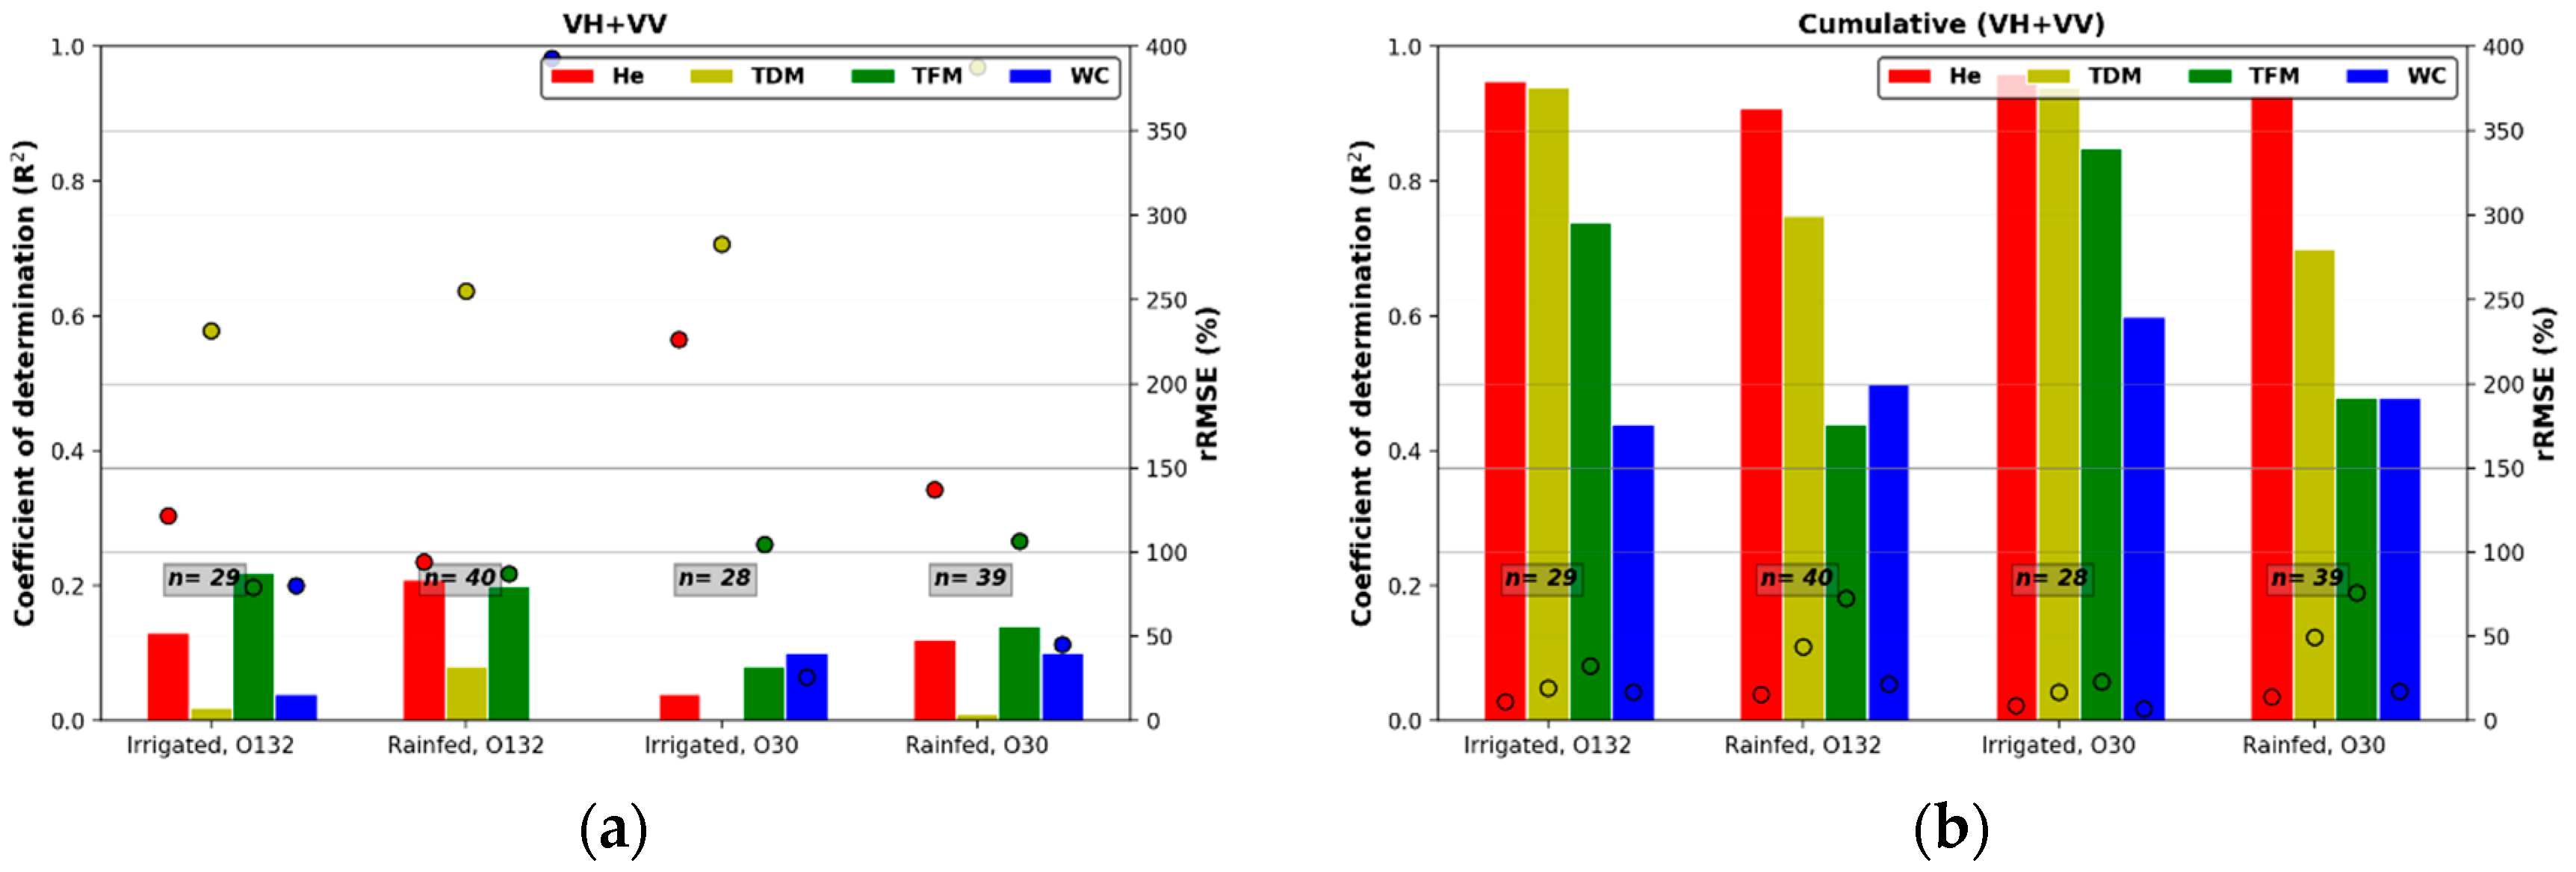
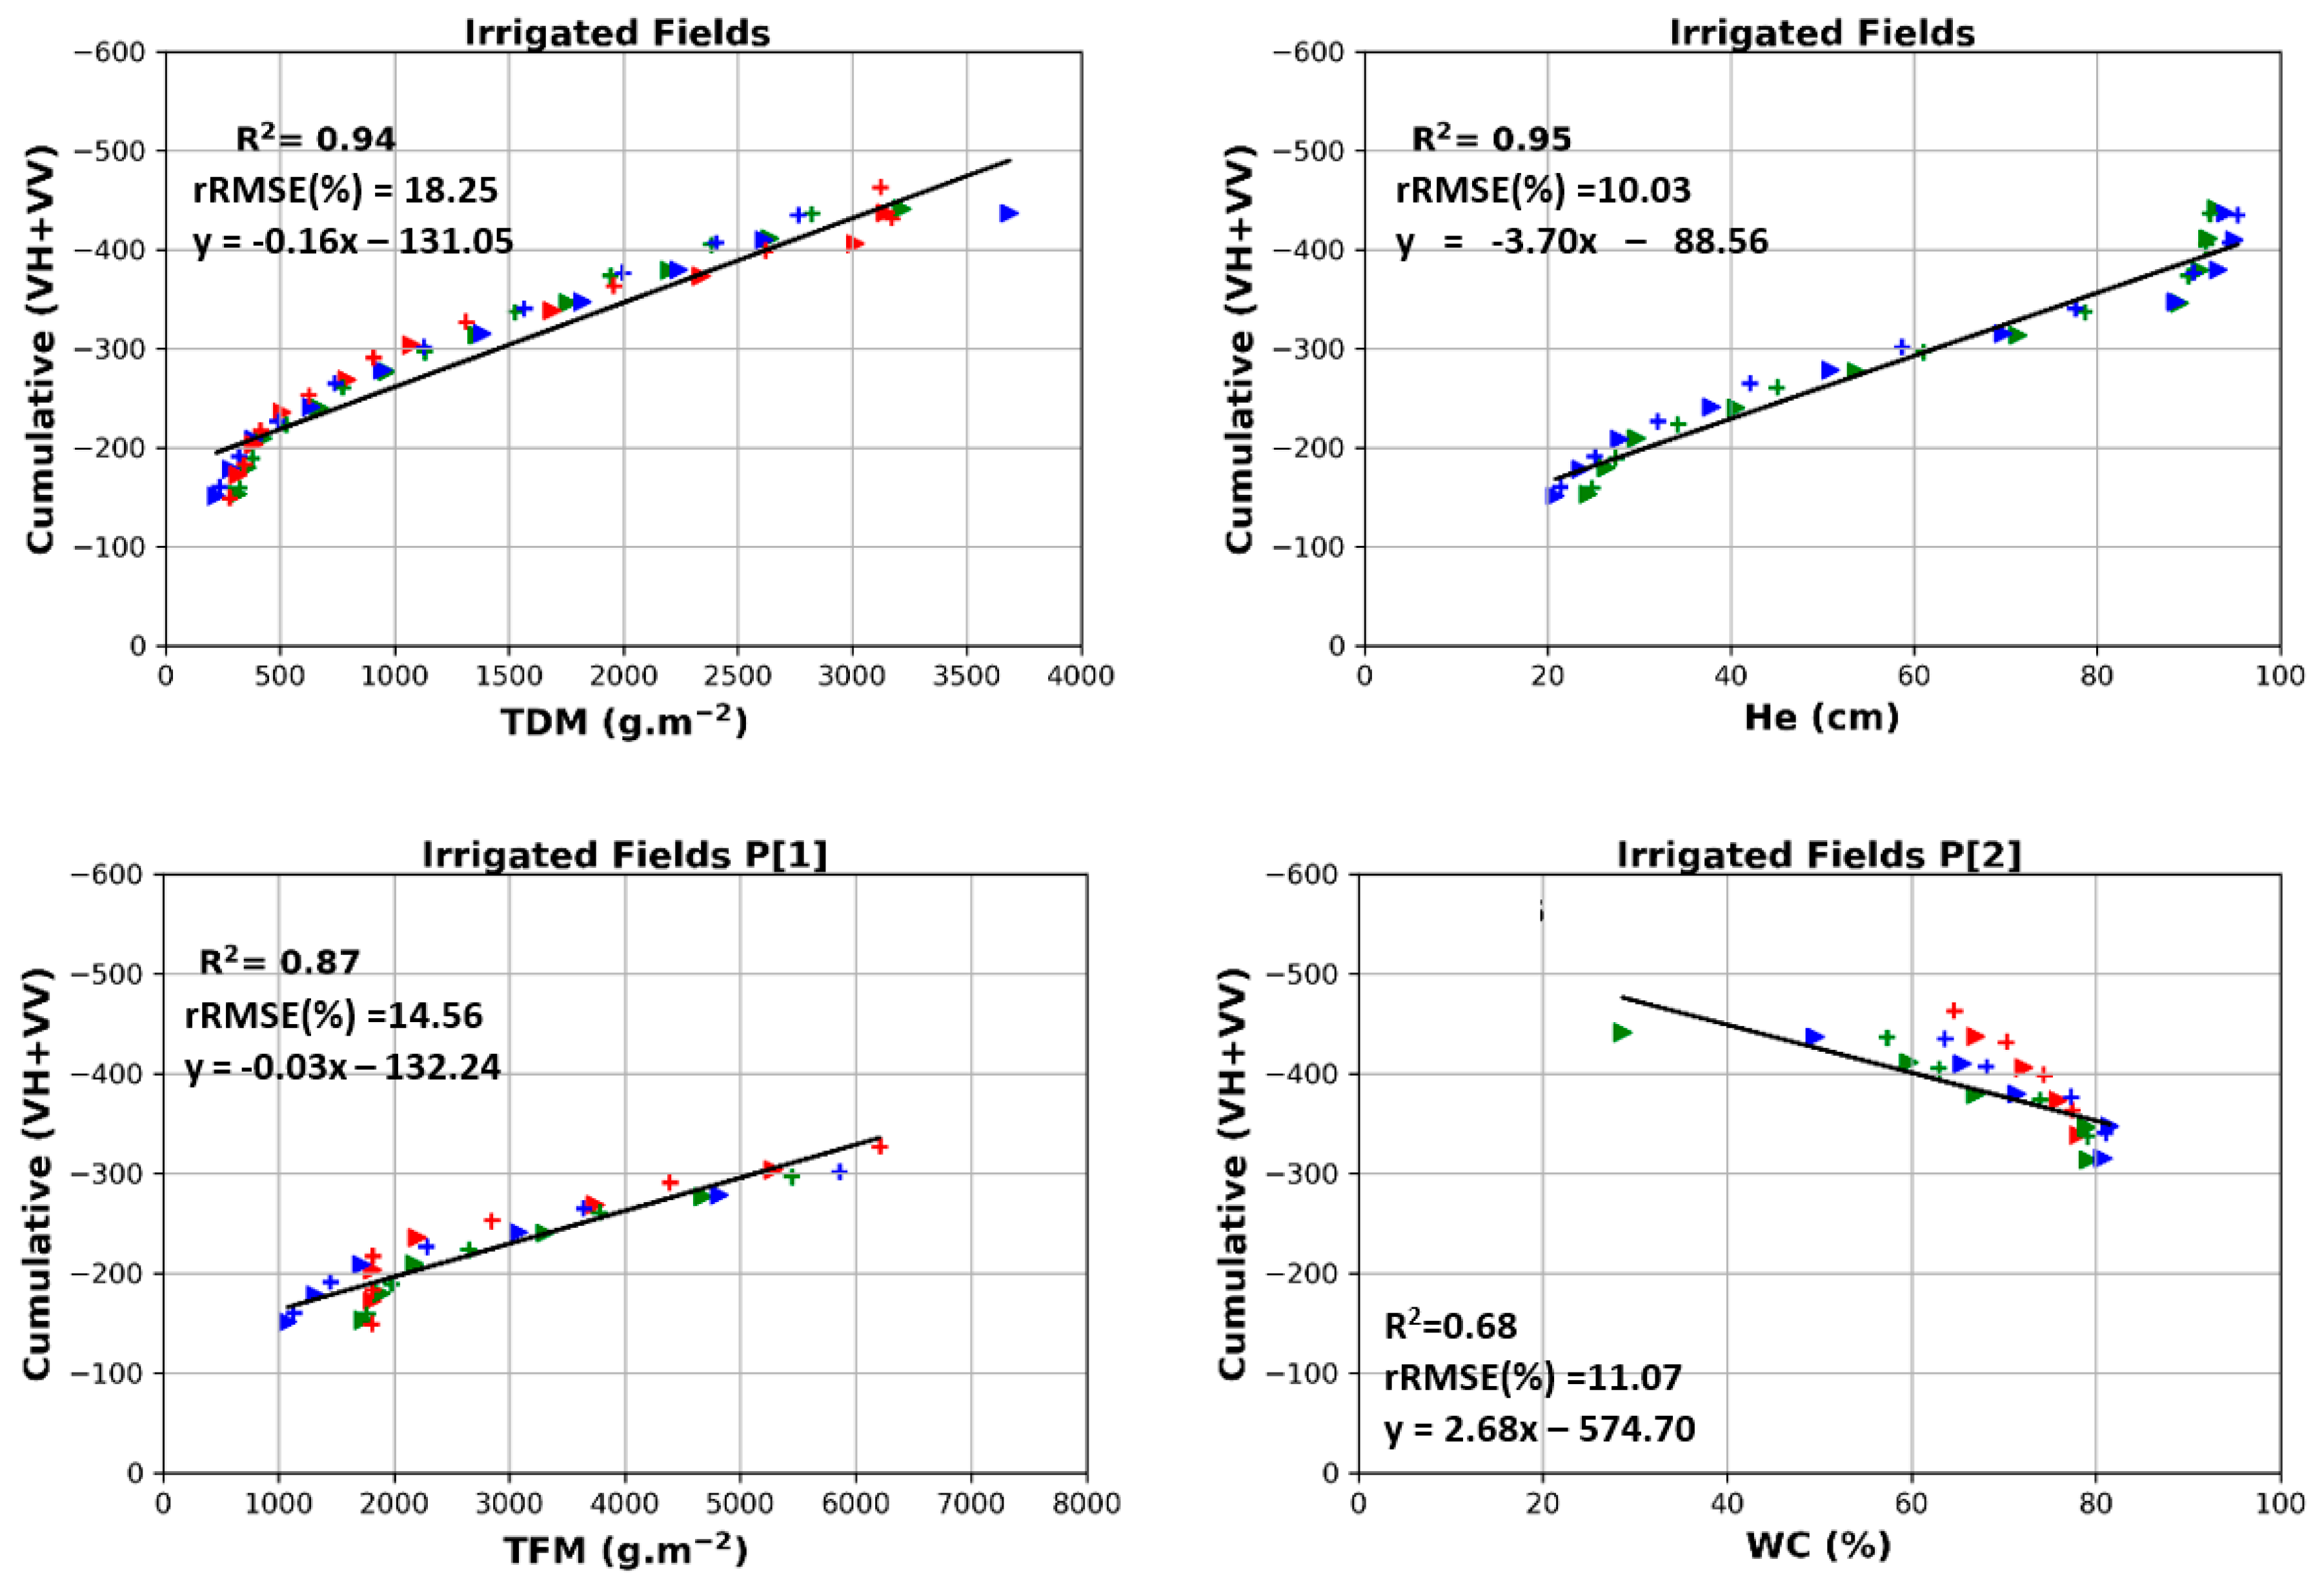
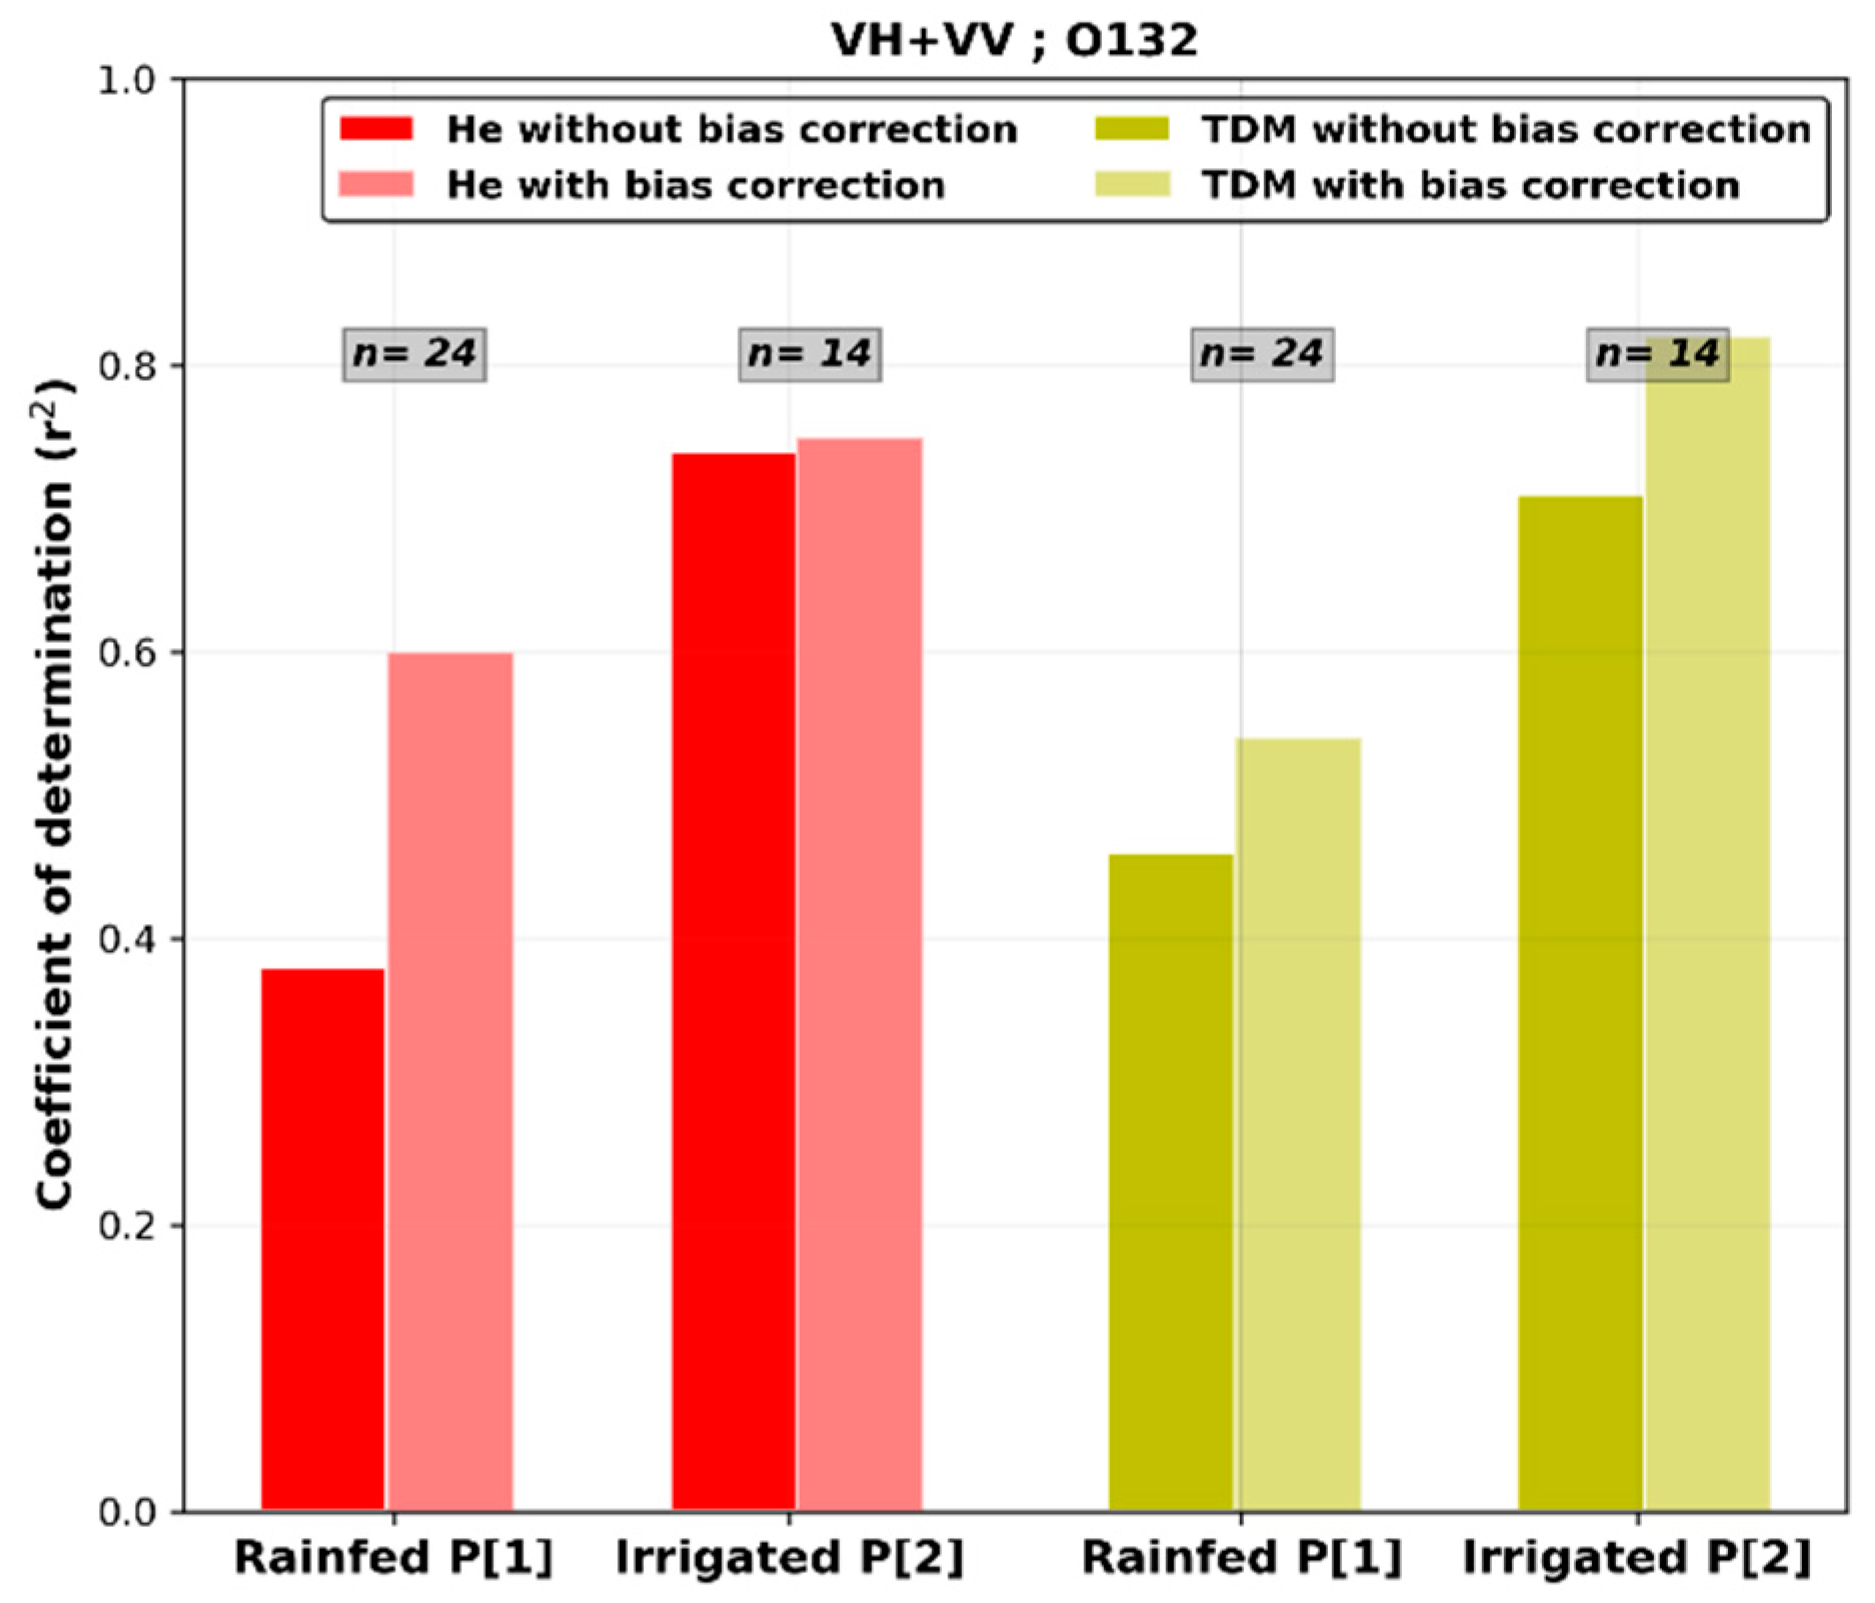
- The impact of irrigation is particularly visible on scenario C. Whereas the performance are not significantly affected from the previous scenarios (A or B) considering VH + VV backscatters, strong relationships are obtained between cumulative values of VH + VV and two biophysical parameters (TDM and He) (R2 > 0.92 and rRMSE < 20%) whatever the orbit pass.
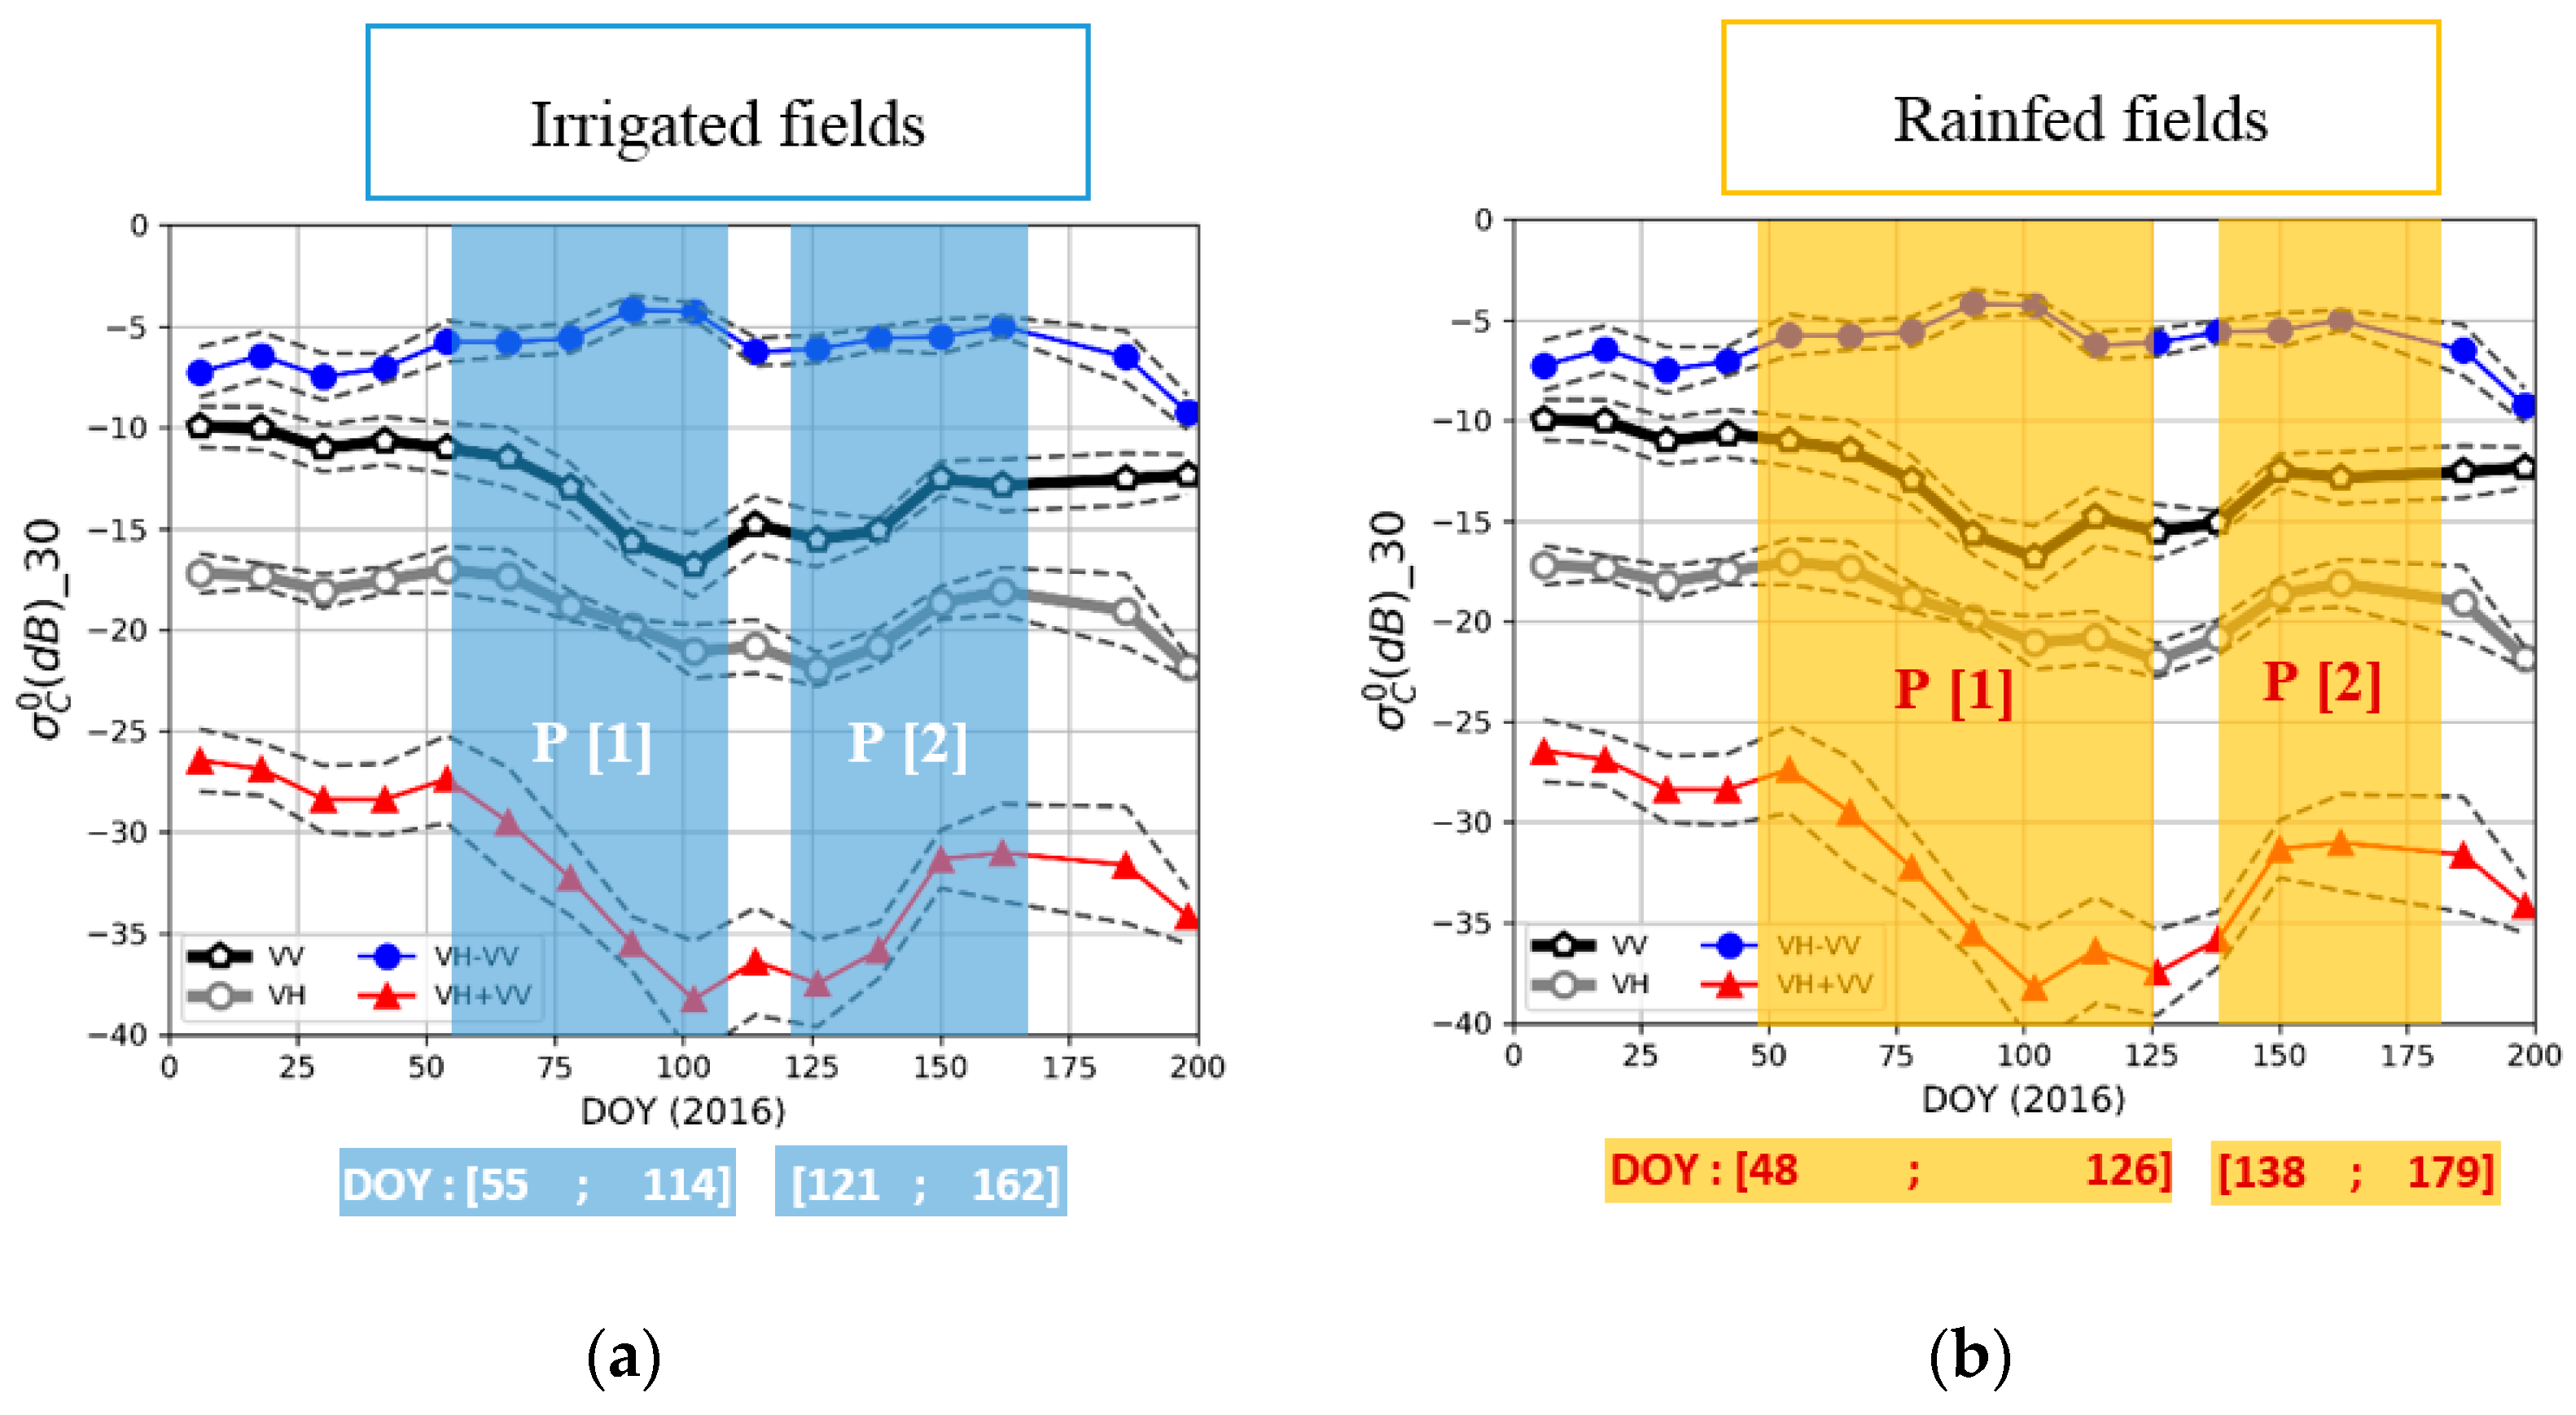
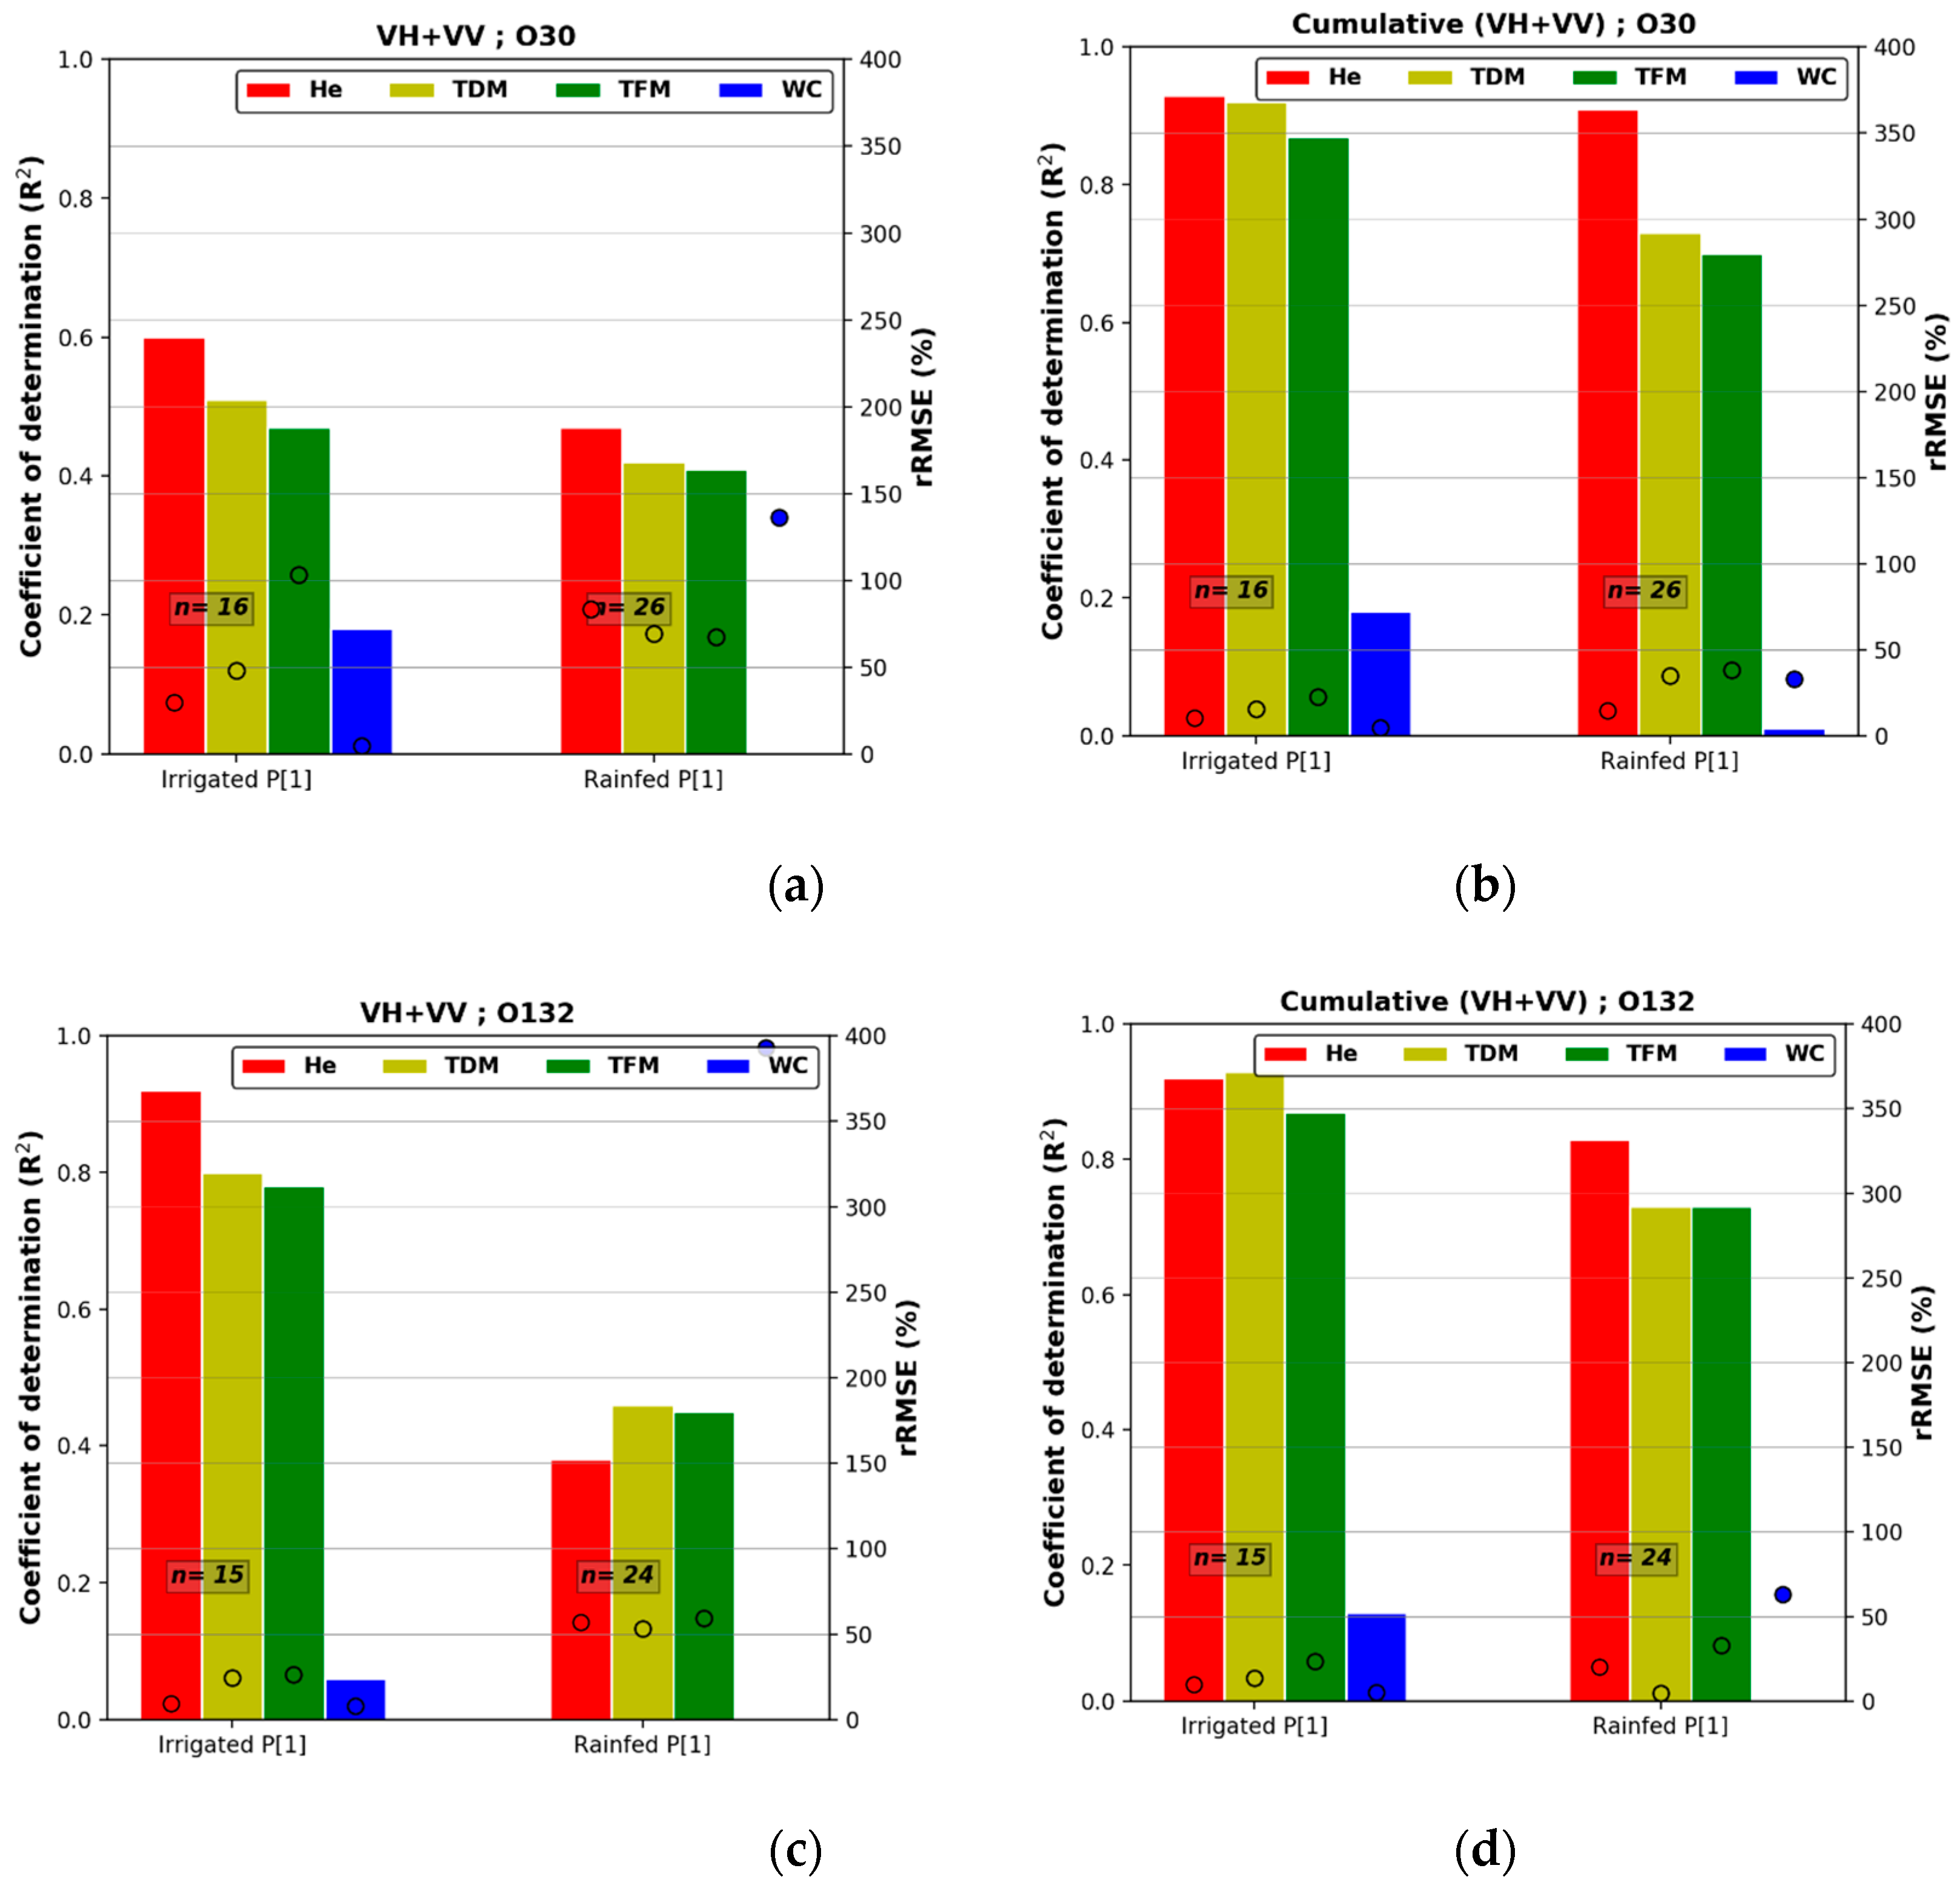
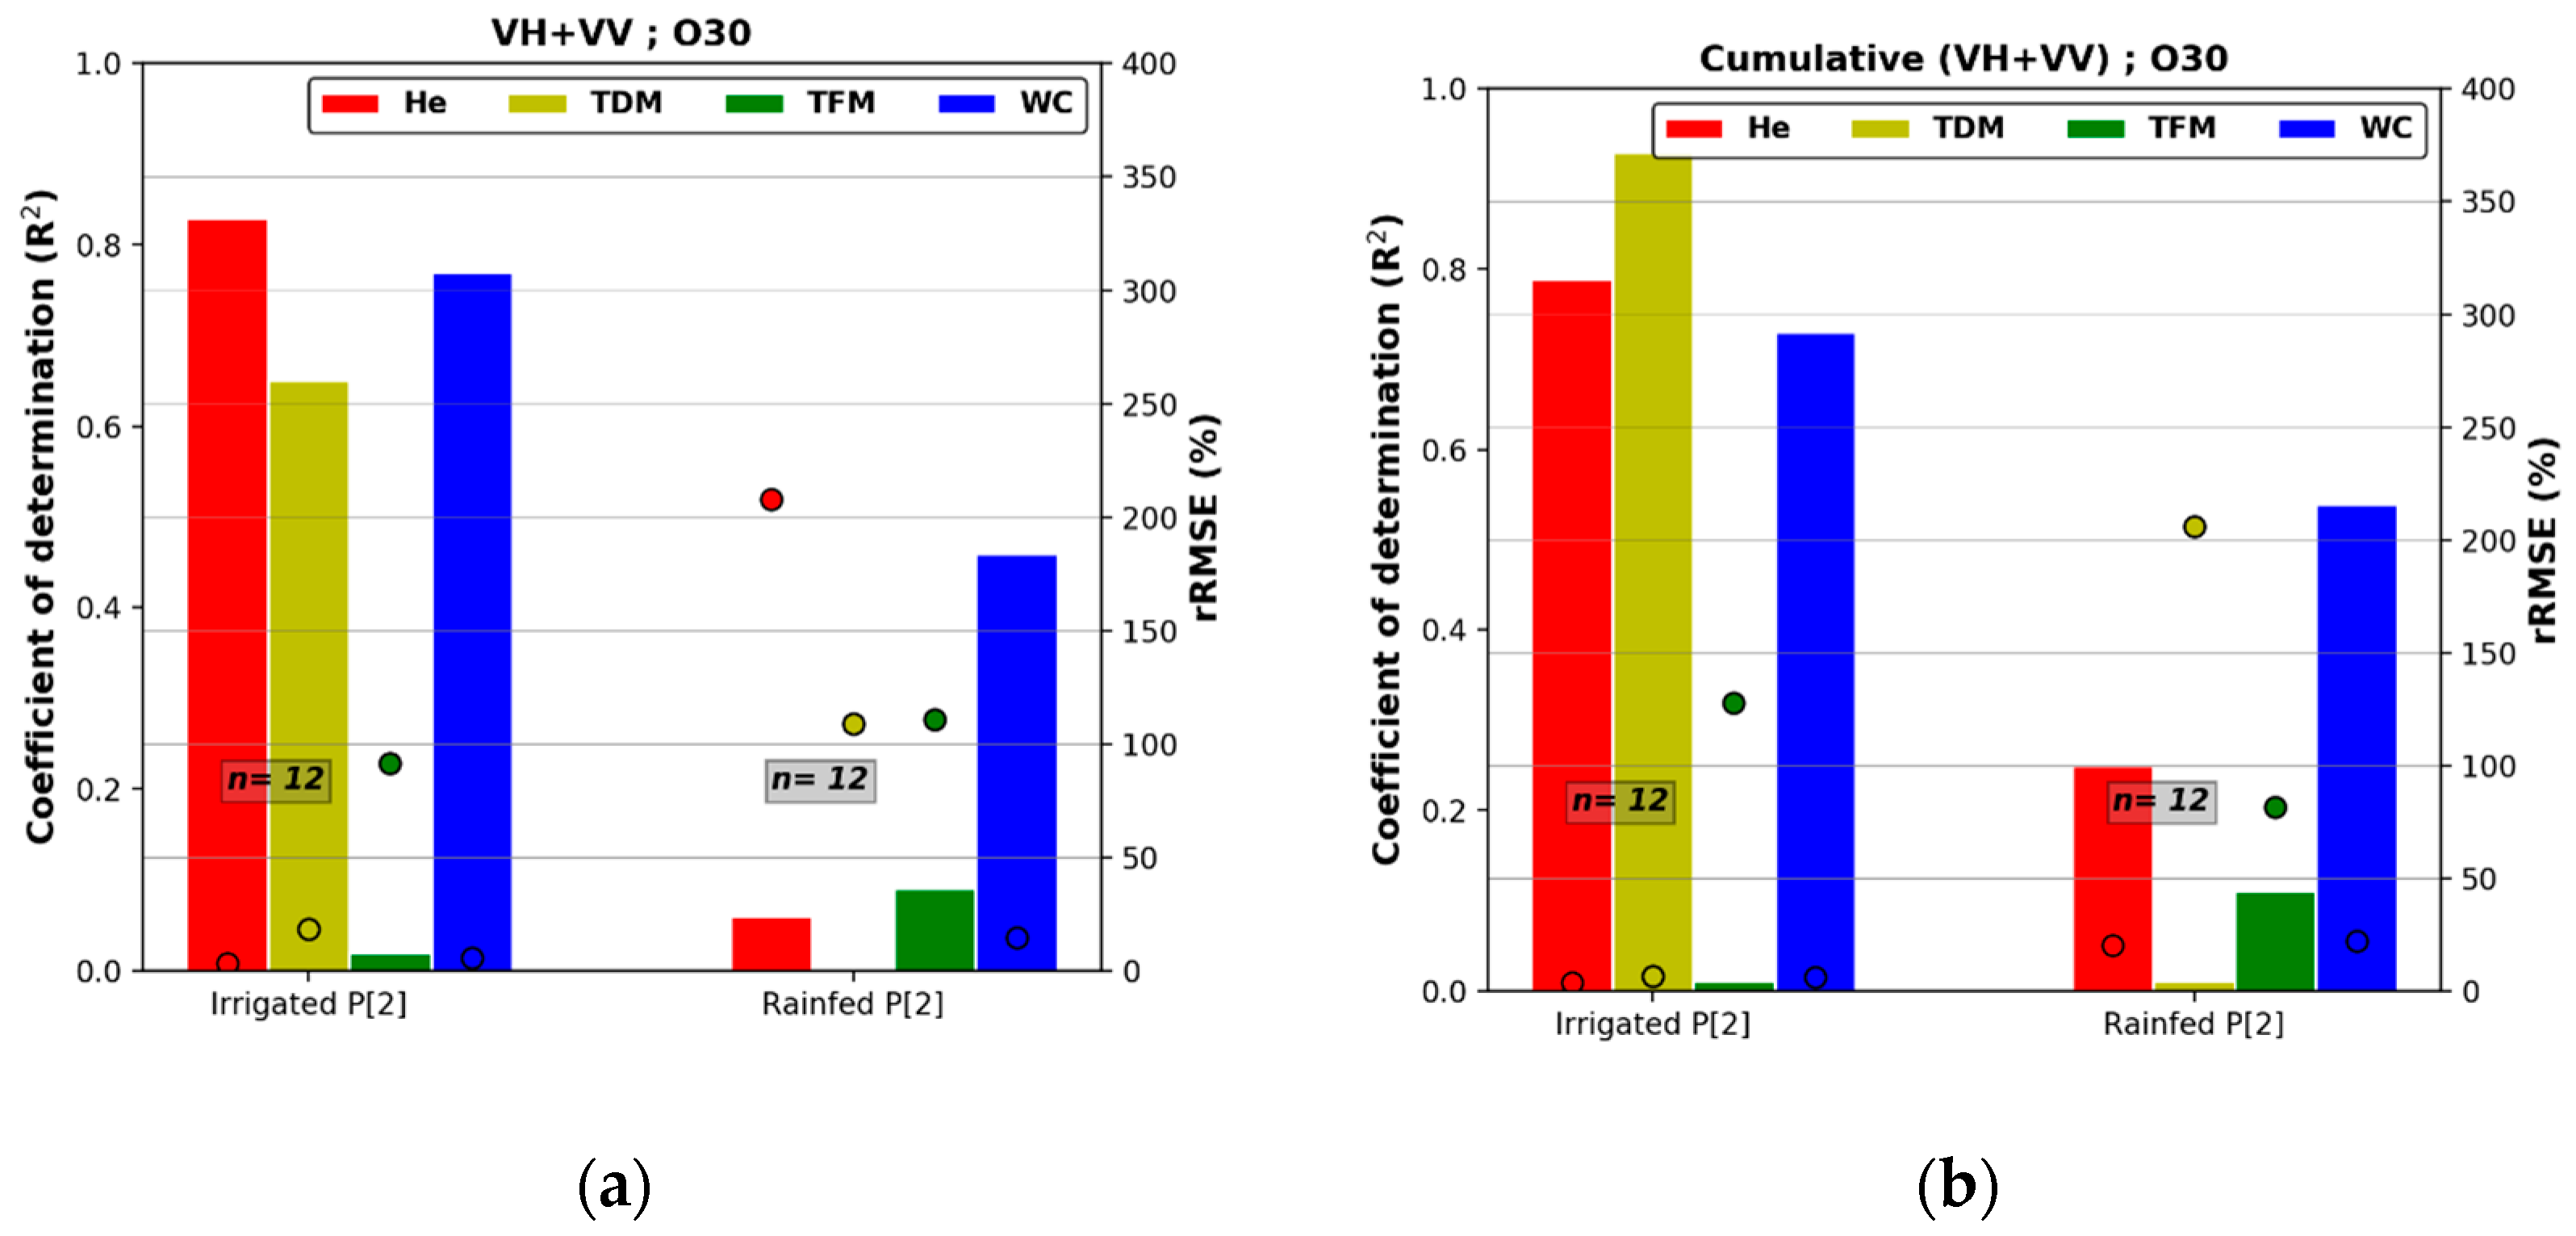
- The importance of considering two vegetative periods is shown in scenario D. This is the only scenario where non-cumulated backscatters are significantly correlated with in situ wheat parameters. During the first period (growing period), the highest dynamic sensitivities (R2 > 0.8 and rRMSE < 30%) were observed with (He, TDM and TFM) over irrigated fields for the orbit 132 (with an average incidence angle of 43.4°). The results obtained during the second vegetative period allowed us to estimate He, TDM and WC over irrigated fields with high correlation (R² > 0.7), using data acquired in the orbit 30 (with an average incidence angle of 33.6°). Regarding cumulative index, we also note the relevant effect of considering the vegetative period. The best sensitivities of the cumulative (VH + VV) index and the He, TDM and TFM were obtained during the first vegetative period with R2 > 0.78 and 0.7 for irrigated and rainfed fields, respectively. For WC, the best correlations were obtained for the second period (when vegetation starts drying from flowering) with R2 > 0.6 and 0.5 for irrigated and rainfed fields, respectively. Whatever the considered parameters, the relative errors were low and ranged from 6.2% to 23%.
Author Contributions
Funding
Acknowledgments
Conflicts of Interest
References
- France: Heavy Spring Rains and Summer Drought Negatively Affect 2018/19 Crops. Available online: https://ipad.fas.usda.gov/highlights/2018/09/france/index.pdf (accessed on 18 November 2020).
- Liu, C.; Chen, Z.; Shao, Y.; Chen, J.; Hasi, T.; Pan, H. Research advances of SAR remote sensing for agriculture applications: A review. J. Integr. Agric. 2019, 18, 506–525. [Google Scholar] [CrossRef]
- Betbeder, J.; Fieuzal, R.; Philippets, Y.; Ferro-Famil, L.; Baup, F. Estimation of Crop Parameters using Multi-Temporal Optical and Radar Polarimetric Satellite Data; Remote Sensing for Agriculture, Ecosystems, and Hydrology XVII; International Society for Optics and Photonics: Toulouse, France, 2015; Volume 9637, p. 9637. [Google Scholar]
- Baghdadi, N.; Zribi, M. Land Surface Remote Sensing in Agriculture and Forest; ISTE Press-Elsevier: London, UK, 2017; 496p. [Google Scholar]
- Baup, F.; Ameline, M.; Fieuzal, R.; Frappart, F.; Corgne, S.; Berthoumieu, J.-F. Temporal Evolution of Corn Mass Production Based on Agro-Meteorological Modelling Controlled by Satellite Optical and SAR Images. Remote Sens. 2019, 11, 1978. [Google Scholar] [CrossRef]
- Mercier, A.; Betbeder, J.; Baudry, J.; Le Roux, V.; Spicher, F.; Lacoux, J.; Roger, D.; Hubert-Moy, L. Evaluation of Sentinel-1 & 2 time series for predicting wheat and rapeseed phenological stages. ISPRS J. Photogramm. Remote Sens. 2020, 163, 231–256. [Google Scholar] [CrossRef]
- Mercier, A.; Betbeder, J.; Rapinel, S.; Jegou, N.; Baudry, J.; Hubert-Moy, L. Evaluation of Sentinel-1 and -2 time series for estimating LAI and biomass of wheat and rapeseed crop types. J. Appl. Remote Sens. 2020, 14, 1. [Google Scholar] [CrossRef]
- Cookmartin, G.; Saich, P.; Quegan, S.; Cordey, R.; Burgess-Allen, P.; Sowter, A. Modeling microwave interactions with crops and comparison with ERS-2 SAR observations. IEEE Trans. Geosci. Remote Sens. 2000, 38, 658–670. [Google Scholar] [CrossRef]
- Baghdadi, N.; Boyer, N.; Todoroff, P.; El Hajj, M.; Bégué, A. Potential of SAR sensors TerraSAR-X, ASAR/ENVISAT and PALSAR/ALOS for monitoring sugarcane crops on Reunion Island. Remote Sens. Environ. 2009, 113, 1724–1738. [Google Scholar] [CrossRef]
- Gorrab, A.; Zribi, M.; Baghdadi, N.; Mougenot, B.; Fanise, P.; Chabaane, Z. Retrieval of Both Soil Moisture and Texture Using TerraSAR-X Images. Remote Sens. 2015, 7, 10098–10116. [Google Scholar] [CrossRef]
- Mattia, F.; Toan, T.L.; Picard, G.; Posa, F.I.; D’Alessio, A.; Notarnicola, C.; Gatti, A.M.; Rinaldi, M.; Satalino, G.; Pasquariello, G. Multitemporal C-Band Radar Measurements on Wheat Fields. IEEE Trans. Geosci. Remote Sens. 2003, 41, 10. [Google Scholar] [CrossRef]
- Steele-Dunne, S.C.; McNairn, H.; Monsivais-Huertero, A.; Judge, J.; Liu, P.-W.; Papathanassiou, K. Radar Remote Sensing of Agricultural Canopies: A Review. IEEE J. Sel. Top. Appl. Earth Obs. Remote Sens. 2017, 10, 2249–2273. [Google Scholar] [CrossRef]
- Song, Y.; Wang, J. Mapping Winter Wheat Planting Area and Monitoring Its Phenology Using Sentinel-1 Backscatter Time Series. Remote Sens. 2019, 11, 449. [Google Scholar] [CrossRef]
- Brown, S.C.M.; Quegan, S.; Morrison, K.; Bennett, J.C.; Cookmartin, G. High-Resolution Measurements of Scattering in Wheat Canopies—Implications for Crop Parameter Retrieval. IEEE Trans. Geosci. Remote Sens. 2003, 41, 10. [Google Scholar] [CrossRef]
- Fieuzal, R.; Baup, F.; Marais-Sicre, C. Monitoring Wheat and Rapeseed by Using Synchronous Optical and Radar Satellite Data—From Temporal Signatures to Crop Parameters Estimation. ARS 2013, 02, 162–180. [Google Scholar] [CrossRef]
- Veloso, A.; Mermoz, S.; Bouvet, A.; Le Toan, T.; Planells, M.; Dejoux, J.-F.; Ceschia, E. Understanding the temporal behavior of crops using Sentinel-1 and Sentinel-2-like data for agricultural applications. Remote Sens. Environ. 2017, 199, 415–426. [Google Scholar] [CrossRef]
- El Hajj, M.; Baghdadi, N.; Bazzi, H.; Zribi, M. Penetration Analysis of SAR Signals in the C and L Bands for Wheat, Maize, and Grasslands. Remote Sens. 2018, 11, 31. [Google Scholar] [CrossRef]
- Vreugdenhil, M.; Wagner, W.; Bauer-Marschallinger, B.; Pfeil, I.; Teubner, I.; Rüdiger, C.; Strauss, P. Sensitivity of Sentinel-1 Backscatter to Vegetation Dynamics: An Austrian Case Study. Remote Sens. 2018, 10, 1396. [Google Scholar] [CrossRef]
- Ameline, M.; Fieuzal, R.; Betbeder, J.; Berthoumieu, J.-F.; Baup, F. Estimation of Corn Yield by Assimilating SAR and Optical Time Series Into a Simplified Agro-Meteorological Model: From Diagnostic to Forecast. IEEE J. Sel. Top. Appl. Earth Obs. Remote Sens. 2018, 11, 4747–4760. [Google Scholar] [CrossRef]
- Schlund, M. Sentinel-1 time series data for monitoring the phenology of winter wheat. Remote Sens. Environ. 2020, 246, 111814. [Google Scholar] [CrossRef]
- Nasirzadehdizaji, R.; Sanli, F.B.; Abdikan, S.; Cakir, Z.; Sekertekin, A.; Ustuner, M. Sensitivity Analysis of Multi-Temporal Sentinel-1 SAR Parameters to Crop Height and Canopy Coverage. Appl. Sci. 2019, 9, 655. [Google Scholar] [CrossRef]
- Mandal, D.; Kumar, V.; Bhattacharya, A.; Rao, Y.S.; McNairn, H. Crop Biophysical Parameters Estimation with a Multi-Target Inversion Scheme using the Sentinel-1 SAR Data. In Proceedings of the IGARSS 2018–2018 IEEE International Geoscience and Remote Sensing Symposium, Valencia, Spain, 22–27 July 2018; pp. 6611–6614. [Google Scholar]
- Lancashire, P.D.; Bleiholder, H.; Boom, T.V.D.; Langelüddeke, P.; Stauss, R.; Weber, E.; Witzenberger, A. A uniform decimal code for growth stages of crops and weeds. Ann Appl. Biol. 1991, 119, 561–601. [Google Scholar] [CrossRef]
- Homayouni, S.; McNairn, H.; Hosseini, M.; Jiao, X.; Powers, J. Quad and compact multitemporal C-band PolSAR observations for crop characterization and monitoring. Int. J. Appl. Earth Obs. Geoinf. 2019, 74, 78–87. [Google Scholar] [CrossRef]
- Balenzano, A.; Mattia, F.; Satalino, G.; Davidson, M.W.J. Dense Temporal Series of C- and L-band SAR Data for Soil Moisture Retrieval Over Agricultural Crops. IEEE J. Sel. Top. Appl. Earth Obs. Remote Sens. 2011, 4, 439–450. [Google Scholar] [CrossRef]
- Pageot, Y.; Baup, F.; Inglada, J.; Baghdadi, N.; Demarez, V. Detection of Irrigated and Rainfed Crops in Temperate Areas Using Sentinel-1 and Sentinel-2 Time Series. Remote Sens. 2020, 12, 3044. [Google Scholar] [CrossRef]
- Nasrallah, A.; Baghdadi, N.; Hajj, M.E.; Darwish, T.; Belhouchette, H.; Faour, G.; Darwich, S.; Mhawej, M. Sentinel-1 data for winter wheat phenology monitoring and mapping. Remote Sens. 2019, 11, 2228. [Google Scholar] [CrossRef]
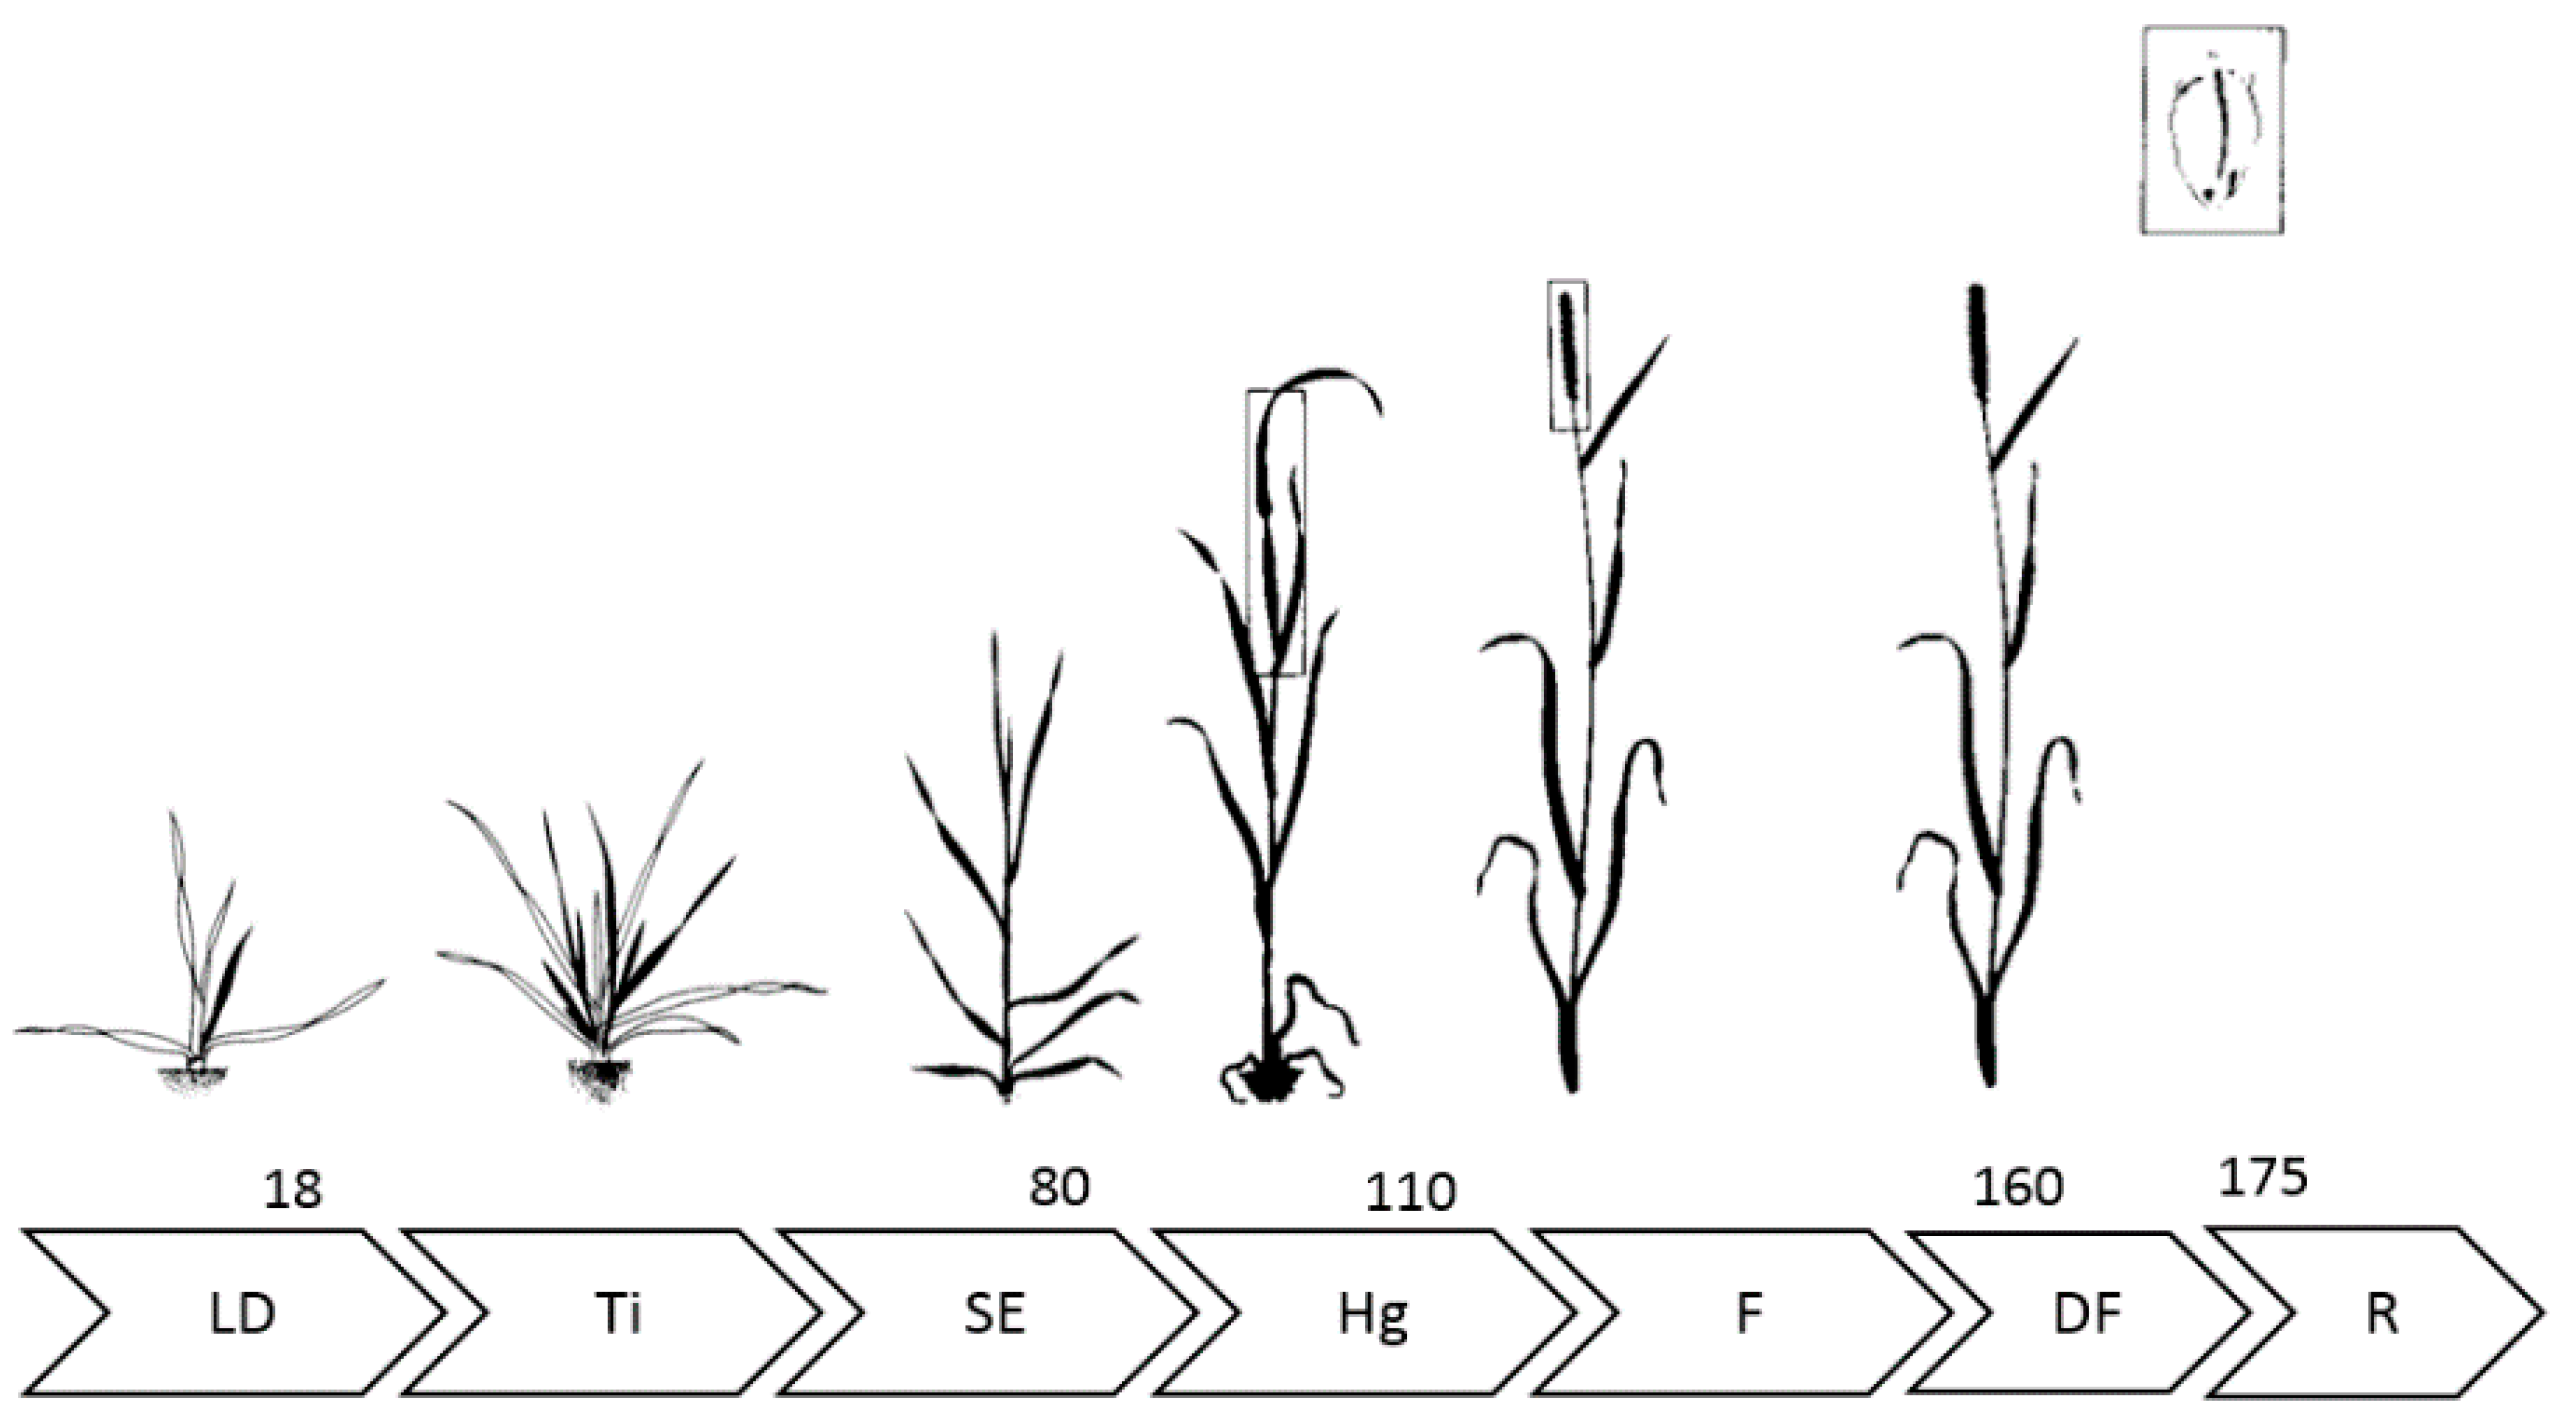



| Principal Phenological Stage | Symbols Used in the Paper |
|---|---|
| Leaf development | LD |
| Tillering | Ti |
| Stem elongation | SE |
| Heading | Hg |
| Flowering (anthesis) | F |
| Development of fruit | DF |
| Ripening | R |
| Harvest: farming practice | H |
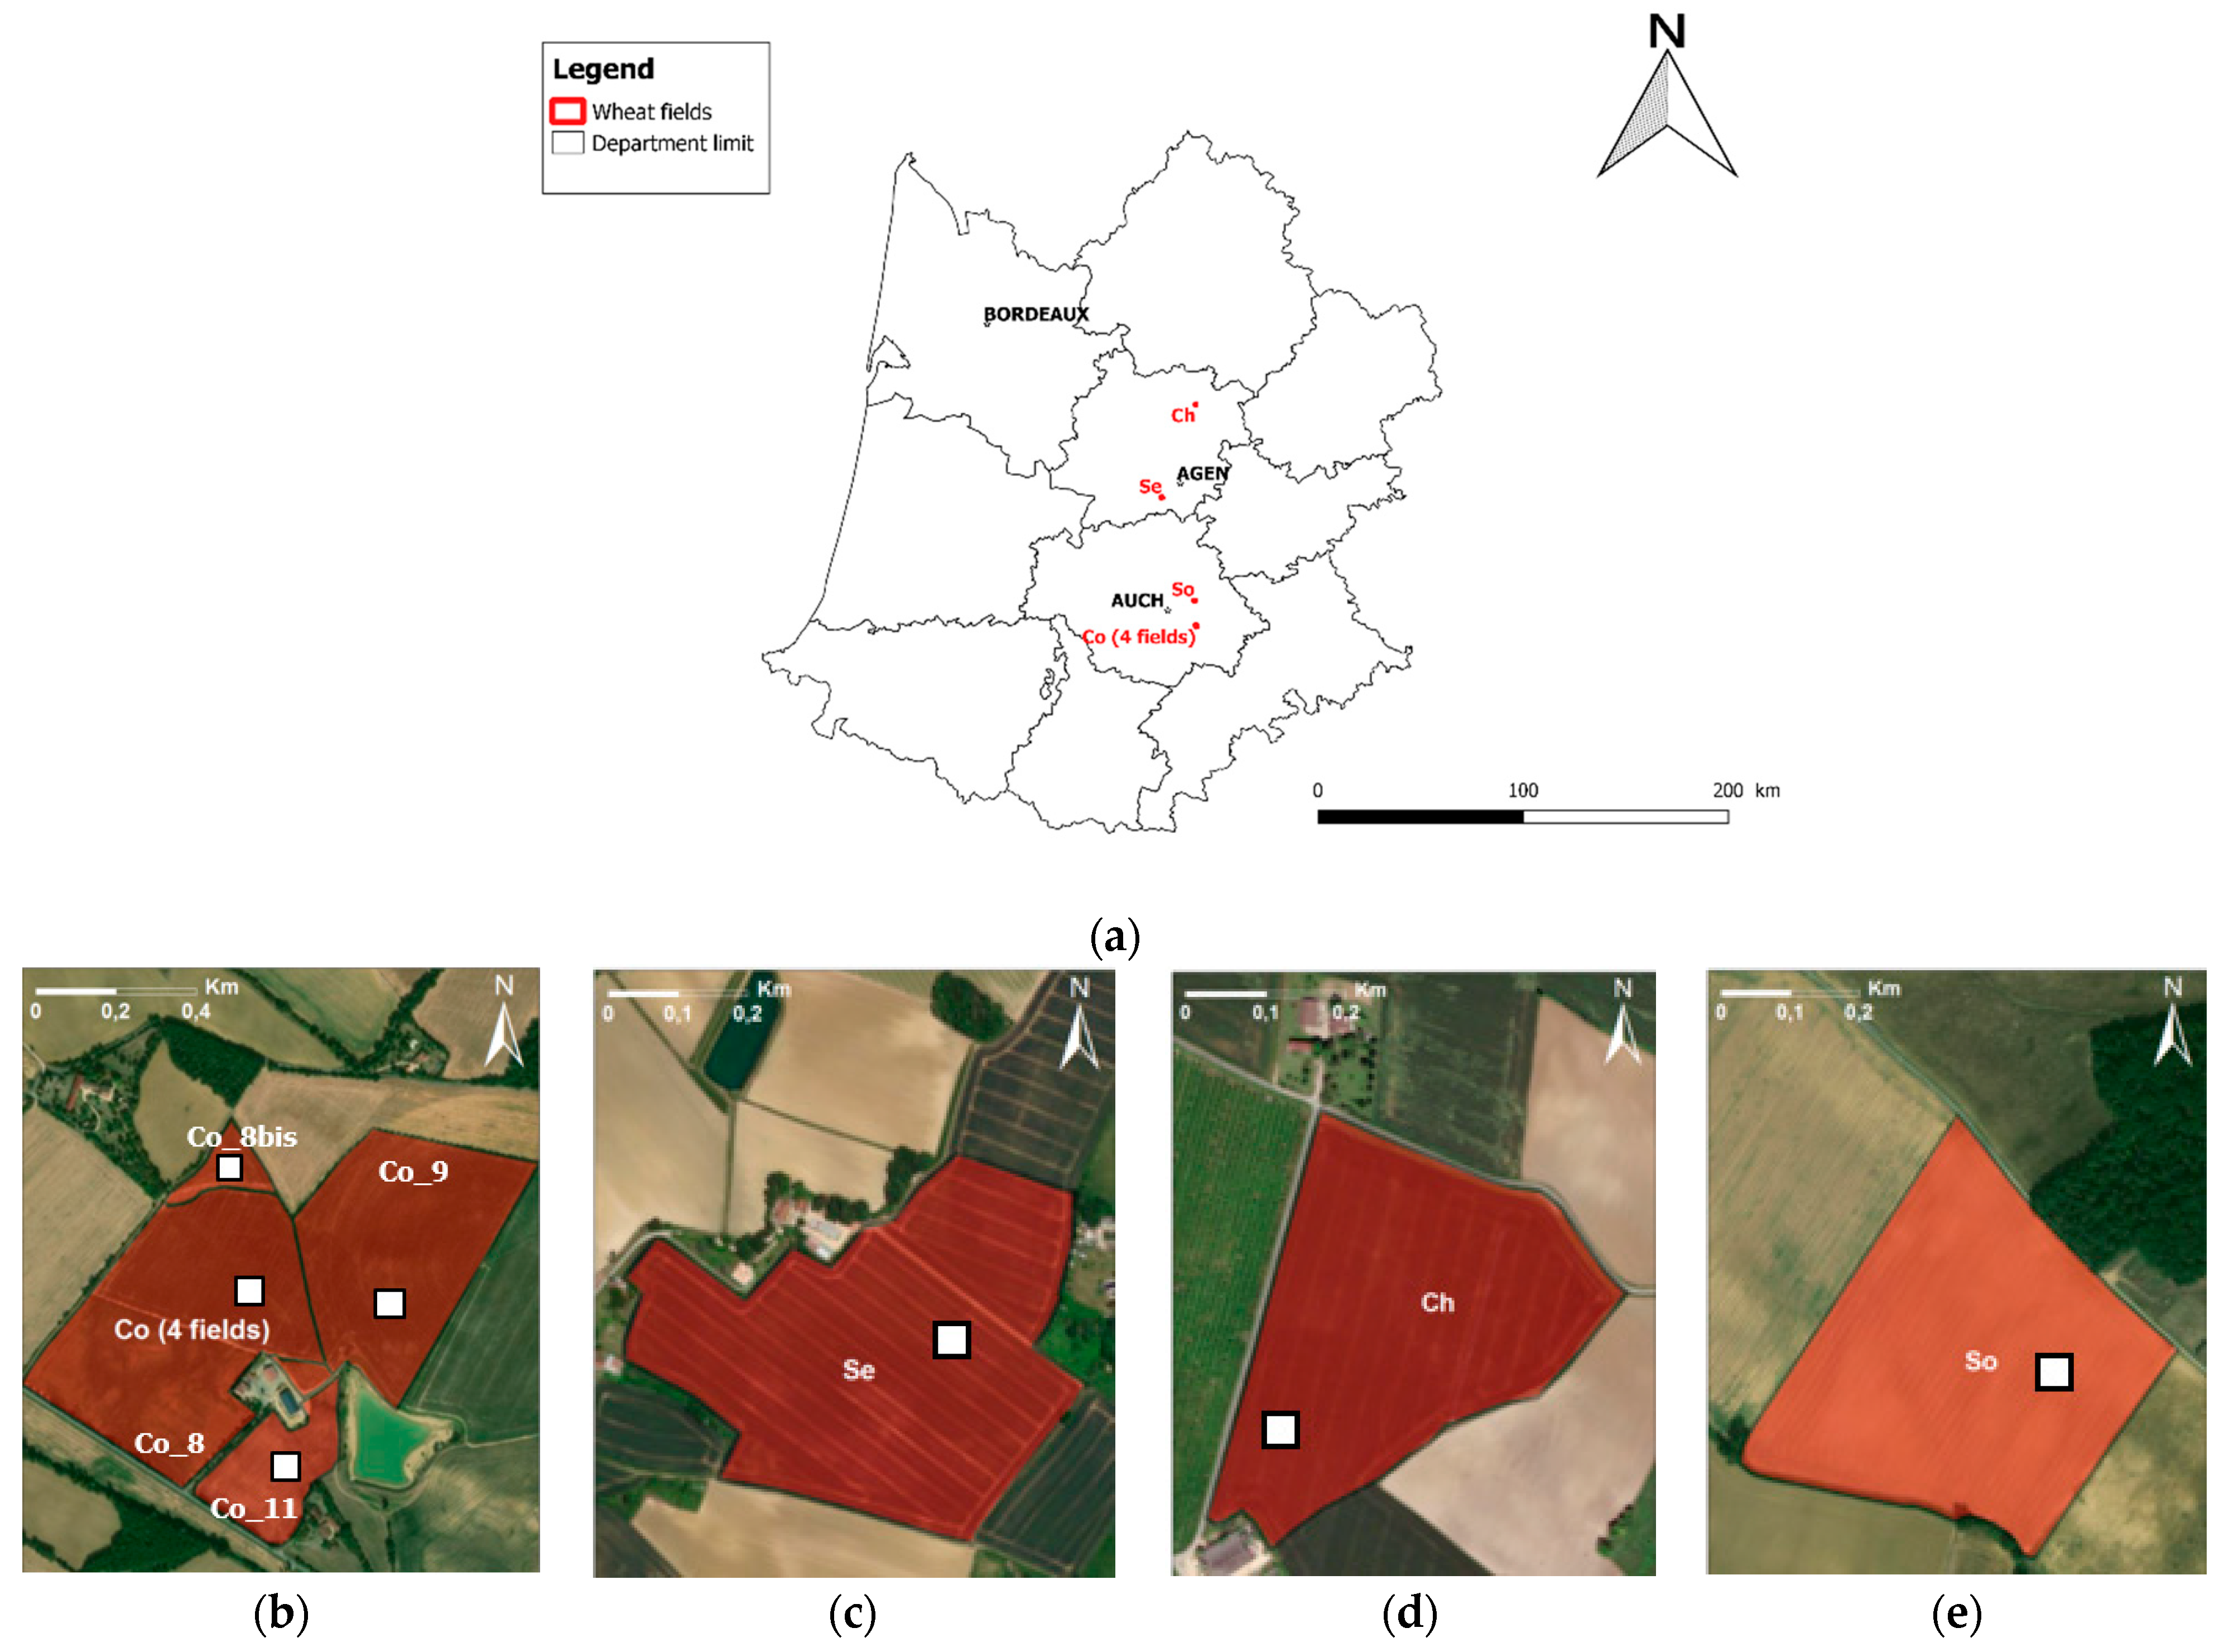
| ID_PARC | Culture | IRRIGATION | Date of Sampling [First DOY–End DOY] | Surface (ha) |
|---|---|---|---|---|
| So | Soft wheat | N | [64,84,105,133,148,176] | 10.9 |
| Se | Soft wheat | N | [48,75,104,125,147,172,188] | 11.5 |
| Ch | Soft wheat | Y | [55,82,110,130,148,172] | 7.6 |
| Co_8 | Durum wheat | Y | [64,84,105,133,148,169,179] | 16.9 |
| Co_8bis | Durum wheat | N | [70,84,105,133,148,169,179] | 1.8 |
| Co_9 | Durum wheat | Y | [64,84,105,133,148,169,179] | 12.9 |
| Co_11 | Soft wheat | N | [64,84,105,133,148,169,179] | 4.1 |
| Frequency | 5.405 GHz (C-band) | |
| Instrument mode | Interferometric Wide Swath (IW) | |
| Product type | Ground Range Detected (GRD) | |
| Spatial resolution (range, azimuth) | About 20 × 22 m2 depending on IW subswath | |
| Equivalent number of look (ENL) | 4.4 | |
| Temporal resolution | 12 days | |
| Polarization | Dual (VV and VH) | |
| Swath | 250 km | |
| Relative orbit | 30 | 132 |
| Pass direction | ASCENDING | ASCENDING |
| Mean Incidence angle (°) | 33.6° | 43.4° |
| Acquisition Time (UTC) | 17:55 | 17:47 |
| He (cm) | TDM (g·m−2) | TFM (g·m−2) | WC (%) |
|---|---|---|---|
| VV | VV | VV | VV |
| 0.13 | 0.02 | 0.15 | 0.04 |
| VH | VH | VH | VH |
| 0.06 | 0.00 | 0.09 | 0.04 |
| VH + VV | VH + VV | VH + VV | VH + VV |
| 0.10 | 0.01 | 0.13 | 0.04 |
| VH − VV | VH − VV | VH − VV | VH − VV |
| 0.11 | 0.04 | 0.08 | 0.01 |
| Cumulative(VV) | Cumulative(VV) | Cumulative(VV) | Cumulative(VV) |
| 0.88 | 0.73 | 0.51 | 0.43 |
| Cumulative(VH) | Cumulative(VH) | Cumulative(VH) | Cumulative(VH) |
| 0.88 | 0.74 | 0.49 | 0.47 |
| Cumulative(VH + VV) | Cumulative(VH + VV) | Cumulative(VH + VV) | Cumulative(VH + VV) |
| 0.89 | 0.74 | 0.50 | 0.46 |
| Cumulative(VH − VV) | Cumulative(VH − VV) | Cumulative(VH − VV) | Cumulative(VH − VV) |
| 0.61 | 0.55 | 0.32 | 0.41 |
| He (cm) | TDM (g·m−2) | TFM (g·m−2) | WC (%) | ||||||
|---|---|---|---|---|---|---|---|---|---|
| O30 | n | VH + VV | VH − VV | VH + VV | VH − VV | VH − VV | VH − VV | VH + VV | VH − VV |
| Irrigated P [1] | 16 | 0.60 | 0.10 | 0.51 | 0.00 | 0.47 | 0.00 | 0.18 | 0.07 |
| Rainfed P [1] | 26 | 0.47 | 0.01 | 0.42 | 0.02 | 0.41 | 0.01 | 0.00 | 0.13 |
| Irrigated P [2] | 12 | 0.83 | 0.02 | 0.65 | 0.02 | 0.02 | 0.51 | 0.77 | 0.12 |
| Rainfed P [2] | 12 | 0.06 | 0.36 | 0.17 | 0.00 | 0.09 | 0.00 | 0.46 | 0.01 |
| O132 | n | VH + VV | VH − VV | VH + VV | VH − VV | VH + VV | VH − VV | VH + VV | VH − VV |
| Irrigated P [1] | 15 | 0.92 | 0.69 | 0.80 | 0.65 | 0.78 | 0.59 | 0.06 | 0.23 |
| Rainfed P [1] | 24 | 0.38 | 0.15 | 0.46 | 0.13 | 0.45 | 0.19 | 0.00 | 0.21 |
| Irrigated P [2] | 14 | 0.74 | 0.17 | 0.71 | 0.01 | 0.01 | 0.12 | 0.49 | 0.12 |
| Rainfed P [2] | 16 | 0.43 | 0.10 | 0.00 | 0.06 | 0.05 | 0.10 | 0.13 | 0.12 |
Publisher’s Note: MDPI stays neutral with regard to jurisdictional claims in published maps and institutional affiliations. |
© 2021 by the authors. Licensee MDPI, Basel, Switzerland. This article is an open access article distributed under the terms and conditions of the Creative Commons Attribution (CC BY) license (http://creativecommons.org/licenses/by/4.0/).
Share and Cite
Gorrab, A.; Ameline, M.; Albergel, C.; Baup, F. Use of Sentinel-1 Multi-Configuration and Multi-Temporal Series for Monitoring Parameters of Winter Wheat. Remote Sens. 2021, 13, 553. https://doi.org/10.3390/rs13040553
Gorrab A, Ameline M, Albergel C, Baup F. Use of Sentinel-1 Multi-Configuration and Multi-Temporal Series for Monitoring Parameters of Winter Wheat. Remote Sensing. 2021; 13(4):553. https://doi.org/10.3390/rs13040553
Chicago/Turabian StyleGorrab, Azza, Maël Ameline, Clément Albergel, and Frédéric Baup. 2021. "Use of Sentinel-1 Multi-Configuration and Multi-Temporal Series for Monitoring Parameters of Winter Wheat" Remote Sensing 13, no. 4: 553. https://doi.org/10.3390/rs13040553
APA StyleGorrab, A., Ameline, M., Albergel, C., & Baup, F. (2021). Use of Sentinel-1 Multi-Configuration and Multi-Temporal Series for Monitoring Parameters of Winter Wheat. Remote Sensing, 13(4), 553. https://doi.org/10.3390/rs13040553


