1. Introduction
Thanks to the development of computer vision and digital modeling techniques, heritage information systems are today increasingly exploited. Virtual repositories allow a more effective control over the organization, collection and storage of the diverse and heterogeneous data produced within built heritage studies. The available information produced in the framework of architectural heritage studies can today be referred directly to a three-dimensional (3D) representation of the study object. This allows several tasks to be accomplished, including the mapping of materials and degradation states [
1,
2,
3,
4], the depiction of frescoed surfaces [
5], morphological and historical analyses [
6,
7] and the detection of areas needing recovery measures [
8,
9].
Heritage documentation and dissemination activities, such as on-site observations, analysis and intervention can be interrelated within a digital environment, allowing multitemporal and multilayered management of the available information [
10,
11].
Once the digital replica of the existing architecture is created, in fact, the representation can be enriched with knowledge-related information. The process of (i) the selection of a location/region over the virtual model, and (ii) the addition of a meaningful tag to a spatial element is called annotation. This tag can be related to structured, semi-structured or unstructured data [
12,
13].
Thanks to the annotation mechanism, the pure geometric information of a digital 3D model can be associated with external data, i.e., to descriptors related to heritage conservation and dissemination activities. The construction of smart objects, where the geometric representation is enriched via the addition of this semantic tag, is also a key issue in the implementation of modern Heritage-Building Information Modeling (H-BIM) platforms [
1,
14].
Previous studies [
15,
16,
17] have shown the potentialities of exploiting reality-based models derived from metric surveys for the creation of such digital 3D repositories. These models, acquired as outputs of laser scanning and photogrammetric techniques, allow the reproduction of real scenes in virtual 3D environments and can provide a reference for the construction of intelligible representations [
18]. However, the outputs of such techniques, in the form of point clouds, are raw data that do not contain semantic information. Indeed, the reconstruction of enriched information models starting from 3D unstructured data derived from surveys is still a largely manual, time-consuming and error-prone process [
17,
19,
20].
More automated procedures for the interpretation and semantic annotation of reality-based heritage models are thus demanded, while also considering the construction of H-BIM environments. In this regard, machine learning (ML) and deep learning (DL) methods, although lacking support for cleaning and filtering operations over heritage point clouds, provide interesting tools for the organization of semantic information within formerly unstructured point clouds. The association of semantic and geometric values through ML and DL techniques could effectively simplify 3D data interpretation, speeding up the management and understanding of 3D survey outputs.
Aim of the Paper
This paper aims to propose a semiautomatic approach to the transition from unstructured point clouds, derived from surveying, to Heritage-Building Information Models. Previous works [
21,
22,
23,
24] demonstrated the performance of methods derived from artificial intelligence for the semantic segmentation of heritage point clouds, but they have not thoroughly analyzed the shift from semantically annotated data to a parametric information model, typical of an H-BIM environment. In tackling this issue, the proposed approach is based on:
- (i)
A semantic segmentation via machine learning:
An ML model is trained in order to automatically structure and classify 3D survey data. An annotated point cloud, where different classes of typological elements are labelled, is attained at the end of the process.
- (ii)
A scan-to-BIM reconstruction:
The annotated point cloud is then used to reconstruct parametric geometries that can be managed in H-BIM platforms.
Figure 1 displays a flow chart of the proposed approach. At first, a machine learning supervised classification method is run: a Random Forest (RF) algorithm [
25] is used to label, within heritage point clouds, recurring architectural elements, based on geometric, radiometric and intensity features identified on the dense point cloud. The labelled point cloud then becomes a reference for the reconstruction of parametric elements within an H-BIM environment.
The proposed method allows a direct connection and an immediate exchange of information between reality-based models derived from survey and parametric models built for H-BIM platforms.
An informative continuum is created between the two different representation systems, owing to the subdivision of the model into classes of typological elements: the geometric and radiometric precision of the reality-based model is flanked by the ease of management and the semantic representation of information levels that is typical of H-BIM environments.
The insertion, updating and retrieval of additional knowledge-related data are then possible by directly shifting to the parametric representation of the building information model.
The approach is tested on the laser scanned point clouds of the Pisa Charterhouse, in Italy; an emblematic case study in which the extension of the complex itself requires:
- -
Processing of a large amount of relevant data.
- -
Coordinated management of research results.
- -
Standardized syntax and representation, also in view of future data updates.
2. State of the Art
To date, the third dimension as a means of representation is increasingly exploited. The availability of 3D surveying techniques and novel data capture methodologies has radically changed the approach that conservators, researchers, architects and engineers use in the documentation and description of cultural heritage.
2.1. 3D Data Acquisition Methods
Active and passive sensors are today widely used for the acquisition of dense point clouds and textured meshes of heritage monuments and sites, and their use motivates the increasing request for digital heritage documentation at diverse resolutions and scales [
26,
27,
28].
Laser scanning systems are based on optical sensors that directly provide range data by the emission of a laser pulse beam. They can be static or mobile acquisition techniques, and they can be used on terrestrial or airborne platforms. The former are called terrestrial laser scanning (TLS), and the latter generally known as LiDAR (Light Detection and Ranging, or preferably airborne laser scanning) [
29].
TLS captures the surrounding environment by measuring two angles—zenith and azimuth—and a distance. The position of each surveyed point is recorded in polar coordinates and transferred to cartesian coordinates through data processing software. Each scan location produces a survey of everything that is visible within the range of the scanner.
Many TLS instruments are also equipped with a camera that detects color information for each 3D point [
27]; although such systems exploit high-dynamic range imaging algorithms for the acquisition of color data, their performance is far from comparable to professional reflex cameras. Nevertheless, the radiometric value can gain in importance when automatic identification and recognition of objects within the raw unstructured data is sought, e.g., in view of classification tasks [
29].
Furthermore, passive sensors use visible light or radiation to acquire data.
Photogrammetry is among the most widely used techniques. It exploits a set of two-dimensional images of an object, properly captured, to reconstruct its 3D shape. This discipline has evolved from its original use as early as the beginning of the 20th century, owing to the introduction of digital photography and to the novel integration of the classical principles of photogrammetry with the algorithms of computer vision [
26]. Structure-from-Motion photogrammetry and dense image matching have in fact automated image-based 3D modeling techniques, making photogrammetry a versatile and cost-effective solution for the 3D documentation of existing buildings. Incremental and interoperative processes exploiting multimodal acquisitions are currently under exploration [
16,
30].
2.2. From Unstructured Point Clouds to H-BIM Models
For both photogrammetry and laser scanning, the most common output is a point cloud, i.e., a set of points in three-dimensional space defined by their coordinates and composing a 3D representation of the scanned object. A typical representation of this raw data is in the form of a matrix, in which the number of lines corresponds to the number of points observed, and the columns contain geometric data (e.g., x, y, z coordinates) associated with each observation. Further information, e.g., on RGB colors, scan intensity, normals, curvature, roughness, etc., can also be associated with each point by storing it in additional columns of the point cloud’s matrix. This type of information remains connected to the single point in the cloud. It is devoid of meaningful references to the object that is represented; in other words, this data is non-structured and the represented elements (a wall, a floor, a column, etc.) are not distinct from each other in the source file.
Such a representation, while being geometrically correct and representing a reliable replica of reality, is not suitable for further analysis needed in the digital model. In 3D information systems aimed at heritage documentation, in fact, the information is added on solid geometries and well-defined components of the existing object. It is thus necessary to transform a point-based representation into a parametric (semantic) model.
For this reason, the so-called scan-to-BIM techniques, which seek to reconstruct a semantically rich 3D model starting from the raw and disordered data acquired from the surveying, have become increasingly common in recent years. As previously shown [
31], a more effective and appropriate scan-to-BIM strategy should take into account the three processes of data collection, segmentation and H-BIM reconstruction. In building information models of cultural heritage, known as heritage or historical BIMs [
32,
33,
34], each represented element becomes a smart element and can contain different levels of meaningful information.
As a general rule, scan-to-BIM techniques can be grouped according to their respective level of automation.
Manual methods involve the reconstruction of objects on the point cloud by means of visual recognition and subsequent manual tracing of geometries. These methods were originally introduced by Murphy et al. [
33,
34,
35] and are now widespread and largely consolidated, as confirmed by the extensive available literature already reviewed by Tang et al. and Volk et al. [
17,
20], and more recently by López et al. [
36]. However, as pointed out in references [
19,
20,
37], such reverse engineering processes demand a considerable investment of time and resources. They involve the presence of an expert operator who has followed the survey and who has skills in point cloud processing, and who is thus able to swiftly identify, isolate and then manually reconstruct each class of elements. Such manual procedures, in addition to being time-consuming and cumbersome, may lead to too subjective choices.
Semiautomated methods aim at speeding up the reconstruction phase, with the fastest and generalized procedures for geometry recognition and/or subsequent modeling starting from raw 3D data:
In the geometry recognition phase, a set of simple geometric primitives that closely correspond to the underlying shape can be mapped over a 3D point cloud, by making use of fitting algorithms [
38,
39]. Available software for point cloud processing, e.g., CloudCompare, an open source 3D visualization and computation software from Daniel Girardeau (
http://www.cloudcompare.org/), are equipped with tools for primitive fitting, but they do not produce parametric objects that can be integrated directly into BIM platforms. Macher et al. [
19] partially filled this gap by introducing a conversion step, i.e., by enabling the reconstruction of walls and slabs of the indoors of existing buildings as BIM-readable objects starting from point clouds. They exploit the open-source software FreeCAD in order to convert building entities from imported data into the Industry Foundation Classes (IFC) format, an open file format specification compatible with BIM management software. Shah et al. [
40] proposed a framework for the fitting of primitives with computer-aided design (CAD) models, applicable to the assembling of mechanical parts in industrial production. Region-growing and boundary detection algorithms [
41] can also be applied to identify primitive geometries with plane development.
Beyond manual tracing and practices of the identification of primitives, more complex architectural components can be reconstructed by procedural modeling techniques to create libraries of heritage buildings’ elements. López et al. [
42], based on the amount and type of details required to represent each architectural element, distinguished between regular shapes and irregular, organic surfaces. The first ones are modelled by using pre-packaged BIM families, while the second ones are constructed from scratch and inserted in a library of historic buildings that can be used in future works.
Indeed, complex geometries require the identification of a shape grammar, intended as the group of shape rules that are applied step-by-step to generate each architectural component. The reconstruction of such components requires one to imagine and reconstruct a suitable set of editable parameters that can be modified each time in order to adjust the built geometry to the 3D survey data.
The interactive shape editing procedure by Capone and Lanzara [
43], for instance, based on Rhino and Grasshopper tools, allowed the generation of libraries of domes’ shapes. Similarly, Baik [
44] described historic houses by providing a collection of architectural objects directly in the BIM environment, while Rodríguez-Moreno et al. [
45] choose different modeling approaches according to the complexity of the architectural elements represented.
In yet other cases, procedural modeling is aimed at simplifying and converting the model into a 3D mesh through surface reconstruction algorithms [
15], especially in view of executing structural simulations via finite element analysis [
46,
47].
As for the semiautomated reconstruction of 3D primitive shapes, however, specific plugins can also be found as directly implemented in typical BIM software, e.g., Autodesk Revit, Archicad: Scan-to-BIM, FARO, PointSense and Edgewise, to mention a few, which allow the reconstruction of planar (walls and slabs) or cylindrical (columns and pipes) elements with standardized dimensions. On the other hand, the process of reconstructing geometric primitives is complex when dealing with cultural heritage datasets, as it requires identification of simple geometric elements starting from 3D data with formal and morphological complexities, representing façades, monuments, external and internal environments of historical buildings. For this reason, even before the process of primitive fitting begins, a semantic segmentation of the original 3D survey data is helpful in order to isolate each class of primitive geometries to be reshaped in 3D. This means structuring and organizing heritage point cloud data by acting on the two-fold process of:
2.3. Automating Semantic Segmentation via Machine Learning
ML and DL are emerging in the architectural heritage domain as the preferred media for the automation of the semantic segmentation process. They are derived from artificial intelligence studies and allow computers to make predictions based on sample data.
ML exploits mathematical algorithms to parse a set of data (3D points) with given features and learn from that data how to classify new and unseen observations. DL is a subset of ML that organizes multiple layers of information to generate an artificial neural network, which directly learns the features itself and makes predictions on new data.
In supervised machine learning, the predictive model is trained based on a set of input data that maps a set of points to an annotated class (a “response” value). For 3D heritage data, the semantic segmentation is in the form of a classification problem: labelled data are used to make predictions in a non-continuous way, meaning that the output variable takes class labels.
In point cloud classification problems, the input dataset is constituted by a set of features, computed for each 3D point and a response value, i.e., the class label. This dataset, known as a training set, is a dataset of examples used to train the classifier.
Once the model is trained, predictions can be made for the classification of new and unseen data: based on the computed features sets, the response value, i.e., the annotated class, can be predicted for the newly entered points.
To date, the use of machine learning algorithms for the classification of heritage point clouds is confined to a limited number of applications [
49]. Grilli et al. [
22,
50] transferred the classification techniques that exploit geometric covariance features to the realm of cultural heritage, previously restricted solely to the geospatial sphere for the semantic segmentation of urban scenes [
51,
52]. They investigated the effectiveness of geometric features in training an RF classifier and explored the correlation between such features and the dimensions of main architectural elements.
Similarly, Bassier et al. [
53] used Support Vector Machines (SVM), i.e., supervised learning methods that exploit hyperplanes to perform multiclass learning. With SVM algorithms, they segmented floors, ceilings, roofs, beams and walls in a group of existing buildings, including regular houses, castles and churches. Foreseeing the construction of training datasets for machine learning applications on heritage objects, Murtiyoso and Grussenmeyer [
54] presented a series of functions and algorithms for point cloud segmentation, in the form of a toolbox named M_HERACLES.
Furthermore, DL approaches perform end-to-end learning, in which the annotated sets themselves provide the input and both the features and the classification are learned directly as part of the training process.
The application of deep learning classification methods to 3D structures started from the introduction of PointNet [
55] and its later extension PointNet++ [
56], deep neural networks capable of calculating three-dimensional geometric data of simple shapes. The application of PointNet++ to heritage point clouds has been previously explored in [
57]. Pierdicca et al. [
58] tested PointNet and PointNet++ with an improved dynamic graph convolutional neural network and assessed both methods on 11 labeled point clouds representing indoor and outdoor scenes of heritage architectures of different historical periods.
Considering the comparison of the performance of the ML and DL classifiers for large scale 3D heritage semantic segmentation, Matrone et al. [
58] state that there is no winning solution, since the segmentation results are alternatively better depending on the case to be studied. Nevertheless, deep learning systems need large amounts of annotated datasets to classify new observations, and the current unavailability of this kind of information in the heritage domain is a limitation to their application in this field.
The ArCH dataset, presented in [
23], is a first attempt to reorder and archive multiple sets of annotated point clouds to provide large training datasets of heritage objects.
The above-mentioned studies all indicate, to a greater or lesser extent, how the use of ML and DL techniques in 3D heritage data can facilitate the scan-to-BIM reconstruction by semantically separating elements in point clouds as a prior step to the modeling in a BIM environment.
However, to the authors’ knowledge, no research has to date focused on the difficulties of switching from the annotated point cloud to an H-BIM model. The purpose of this article is to analyze this still-uncertain and unclear transition by exploring the operational challenges of a scan-to-BIM via an ML model.
3. Materials
To assess the performance of the methodology, the Pisa Charterhouse, in Italy, was chosen as the main test area. The complex is a former Carthusian monastery that was founded in 1366 and underwent considerable extensions and enlargements during the 17th and the 18th century. Since the 1970s, a large part of the complex has been turned into a national museum (the National Museum of the Monumental Charterhouse of Calci), while the western side is property of the University of Pisa and houses its Natural History Museum.
The whole complex presents the repetition of building types that can be ascribed to the practices and uses of the monks who inhabited it, devoted to the principles of strictness, meditation and contemplation: among these are, e.g., the cloisters surrounded by the austere cells, a church and a refectory.
Since 2018, the whole complex has been the subject of an extensive surveying campaign promoted by the University of Pisa, preceding the operations of recovery and conservation.
The architectural survey of the Charterhouse, requiring the integration of different survey methodologies (e.g., laser scanning, ground-based or aerial photogrammetry, indoor and outdoor UAV (Unmanned Aerial Vehicles) surveys alongside traditional topographic surveys), served as a fundamental support for further documentation activities and analyses performed on the different areas of the complex, as previously illustrated in Croce et al. [
16].
The Grand-Ducal Cloister, located in the southern area of the Carthusian monastery, provides a representative case study as it is an internal courtyard surrounded by columns and arches that combines a set of recurring geometries, various materials and architectural details. Its original layout structure dates to the 14th century, but many of the transformations that endow the cloister with its current shape were designed in the first half of the 17th century by architect Matteo Nigetti, inspired by the rules of the construction and the proportions defined in the sixth book of the treatise “The Idea of the Universal Architecture” by Vincenzo Scamozzi [
59].
The Grand-Ducal Cloister dataset consists of about 8 million points, acquired with the Leica ScanStation C10: a time-of-flight terrestrial laser scanner. For each detected point, together with the x, y and z coordinates, the instrument provides color (RGB values) and intensity information (
Figure 2).
The work process devised, aimed at the generation of the H-BIM model from semantic data, begins with a vast data capture phase, relying on the integration of TLS and UAV-based photogrammetry [
16]. The latter is performed with a DJI FC6310 camera.
During the survey, several scans are performed by TLS, and are framed in a single reference system with the so-called registration procedure. The process may take place in distinct steps, either directly in the data acquisition phase through the insertion of artificial targets or cloud constraints, or in the processing phase, by exploiting the overlapping zones of the point clouds to align [
60].
In the laser scanner output, each point is also associated with the intensity data of the returned laser pulse that are a function of the power of the received backscattered echo signal. This measure varies according to the laser scanner system, to the weather and light conditions and to the physical characteristics of the reflective surface [
61,
62,
63,
64]. Moreover, a camera installed on the instrument acquires images so as to provide for each detected 3D point a radiometric value, given in RGB (red, green, blue) format.
UAV-based photogrammetry [
16] and laser scanning techniques are integrated for the production of a dense point cloud. The surveyed surfaces are indeed returned in 3D through a point-based representation: each 3D point contains descriptors of position (x, y, z coordinates), orientation (normals) and color (RGB values). The point cloud of the Grand-Ducal Cloister, as raw data that do not contain any information on the hierarchy or structure of the represented objects, serves as input.
Thereafter, a working process based on the semantic segmentation and modeling method, described in the Materials and Methods sections, was implemented. The original point cloud was subsampled, preserving a minimum space between points of 0.009 m.
4. Methods
Our approach was aimed at constructing, in a semiautomated way, an H-BIM model starting from unstructured 3D survey data. It applies to historical buildings in which architectural elements and recurring forms are recognized and codified: buildings with variable dimensions and data of construction, but in which repeated shapes and styles can be found, based on established proportions, profiles and details. Besides monuments of classical architecture where architectural orders are identifiable, the principle is also applicable, for instance, to Renaissance and neoclassical buildings, cloisters, and façades with repeated typological elements such as columns, arches, openings and vaults.
The methodology mainly relies on two procedures, related to the applications of machine learning and scan-to-BIM processes, respectively. The first one is aimed at obtaining an annotated point cloud, which provides a basis for the construction of an H-BIM model (the second one).
4.1. Semantic Segmentation via Machine Learning
In the proposed methodology, the raw 3D point cloud is assumed as input data. The purpose of this first part of the workflow is to recognize (i.e., annotate) certain typological elements in a small portion of the unstructured 3D dataset, and to automatically propagate the information provided, in terms of distinction into classes of elements, to the remaining parts of the 3D point cloud which were not previously annotated.
At the end of the process, the whole dataset is semantically segmented, i.e., each 3D point is recognized as part of a specific label, so that recurring architectural typologies are well distinguished, recognizable and isolated.
This semantic segmentation procedure involves the application of a supervised ML algorithm and is broken down into the following steps:
- (i)
Neighborhood selection and feature extraction;
- (ii)
Feature selection;
- (iii)
Manual annotation on a reduced portion of the dataset (training set), to identify classes of elements;
- (iv)
Automated propagation of the class labels to the whole dataset via a RF classifier, and accuracy evaluation;
- (v)
Annotated 3D point cloud.
The procedure is in line with the workflow illustrated by [
28,
65,
66] for 3D scene interpretation, and by [
22,
48] for its former applications to the heritage domain.
At first, a set of features is extracted in a chosen local neighborhood of each 3D point. These features are either related to the mutual position of the points in the 3D space (geometric features), to their color (RGB values) or laser scanning intensity information (i).
Classes of recurring architectural components are identified on the training set, then a multiscale classification using an RF classifier enables one to iteratively select the most relevant features and perform the classification process by considering a subset of features each time. Steps (ii) and (iii) are thus strictly interrelated. Subsequently, the model constructed by training the RF classifier is applied to the remaining part of the 3D point cloud to label the classes of typological elements in the part of the dataset not yet annotated. The accuracy of the classifier is indeed assessed (iv). The semantic segmentation via the ML phase concludes with the annotated point cloud of the entire dataset.
For the ML framework, the choice to train an RF classifier is in continuity with the first applications of such supervised learning algorithms to the heritage domain [
22,
48]. The RF is an ensemble method: it creates multiple decorrelated decision trees, resulting in a forest of trees, and then combines the output class of each individual learner, selecting the best solution by means of a performance score. The parameters to be chosen to train an RF classifier are the number of trees
and the number of features
[
67]. The RF is chosen because:
Its combination of learning models increases classification accuracy, averaging noisy and unbiased models.
It requires a smaller amount of annotated data for learning, compared to other ML algorithms. Furthermore, as specified in
Section 2.3, the training dataset is not large enough to train a neural network.
It presents estimates for features’ importance: the less significant variables can be removed so that the model is trained on a subset of features, greatly reducing the time for learning and increasing predictive accuracy.
For the creation and application of the RF classifier, the Machine Learning Toolbox, implemented in MATLAB is used. The feature extraction is done via CloudCompare.
4.1.1. Feature Extraction and Selection
Geometric features, RGB values and laser scanner intensity are considered for the classification task. Among them, geometric features enclose the mutual geometric relations between each 3D point of the cloud and the other points that are its nearest neighbors. These features are derived from the eigenvalues λ1, λ2, λ3 of the covariance matrix, computed within a local neighborhood of the 3D point. The covariance matrix, also referred to in literature as a 3D structure tensor [
68,
69], is given by:
Let
be a point of the Euclidean space,
) be a spherical local neighborhood of point
, whose radius is
, and
a point belonging to
). Referring to
, the elements of the covariance matrix are given by:
where the sum of
) is extended to the
points
of the cloud belonging to
).
is the
i-th component of
(in x, y and z dimensions), and
is the mean of all observations in the
i dimension.
The covariance matrix (1) is a symmetric matrix. The non-negative eigenvalues of the matrix, ordered according to λ1 ≥ λ2 ≥ λ3, correspond to an orthogonal system of eigenvectors
and are leveraged to calculate the eight 3D shape features displayed in
Table 1, for each 3D point.
More specifically, linearity (4), planarity (5) and sphericity (6) are dimensionality parameters, as they express the probability of each 3D point to be labeled as 1D (linear), 2D (planar) or 3D (volume) structures, respectively [
52,
70]. Omnivariance (7) and eigenentropy (8) are a measure of the order/disorder of points within the chosen local 3D neighborhood [
71].
Other descriptors, such as surface variation (9), sum of eigenvalues (10), anisotropy (11) and verticality (12), can be calculated in a chosen local neighborhood—the last one depending on the eigenvector of the covariance matrix.
4.1.2. Random Forest Classifier and Evaluation of the Trained Model
To evaluate the performance of the classifier, we refer to the confusion matrix, which provides a measure of the number of correct and incorrect predictions, class by class.
The rows of the confusion matrix display the true, manually annotated, classes, while the columns display the predicted ones.
Precision, recall, overall accuracy, and F-measure, derived from the confusion matrix, are commonly used parameters in the assessment of ML models. They are expressed as follows:
where
TP are True Positives (correctly classified instances of the dataset),
TN True Negatives,
FP False Positives and
FN False Negatives, obtained from the confusion matrix.
4.2. Scan-to-BIM
In the scan-to-BIM operational framework, the semantically segmented 3D point cloud, achieved at the end of the process illustrated in
Section 4.1, constituted the input data.
The 3D model was reconstructed by taking as a reference a point cloud that, when imported into a BIM environment, appears divided into classes of architectural elements. For each class, an ideal parametric shape was identified, reconstructed, and subsequently propagated to all elements that belong to the same category. Operationally, this was accomplished in the following steps:
- (i)
Extraction of single classes of architectural components from the annotated point cloud;
- (ii)
Creation of libraries of ideal parametric shapes, broken down by each class;
- (iii)
Reconstruction of parametric components and export to IFC (BIM-readable and interchangeable) format.
Autodesk Revit was chosen as the main BIM software to test the 3D reconstruction and model enrichment because of its extensive use and application.
At stage (i), the classes of architectural components, segmented after application of the RF classifier, were singularly imported into Revit. Distinct sets were created to bundle and group the 3D points that belonged to the same class.
In other words, each class was isolated as a single point cloud, and hence treated as a stand-alone project containing a certain number of observations (3D points). It is noticeable that the spatial reference to the global point cloud was retained, as the points’ x, y and z coordinates were again referred to the original reference system.
The independent records were indexed via Recap software and then merged into a single point cloud project file in RCP format that can be recognized by and imported into Autodesk Revit. The visibility and graphics of each single class of elements at this stage could be controlled by alternatively showing or hiding the related record.
For each of the identified classes, parametric reference models were reconstructed by introducing libraries of typological elements. In the most popular BIM modeling software, these libraries are known as families.
Two different situations may occur in step (ii):
In the most trivial cases, typological elements can be attributed to simple geometric primitives, e.g., cylinders to describe columns or pipes, flat objects to describe walls, roof pitches and floors. The classic approach to the reconstruction of these simple elements is primitive model fitting.
In the general case, the construction of the parametric element takes places through the modeling of its ideal geometry, derived from constructive and proportional rules as defined in architectural treatises. The representative element of a class is modeled in Autodesk Revit as a parametric adaptive component.
As for the first case, the primitive fitting methods are aimed at associating (fitting) a sample of data points to a geometric primitive shape. A widespread algorithm to solve the primitive fitting problem is the random sample consensus (RANSAC) [
71]. It randomly selects several point samples and fits a candidate primitive shape for each one. It then verifies each parametrized geometry against all points and chooses the shape that includes the highest number of data points.
Yang et al. [
72] leveraged this algorithm to model the connections of steel structural components starting from laser scanned data. For each 3D shape, they stored the detected parameters and later reconstructed each geometry by considering its related parameter using Autodesk Revit’s visual programming tool, Dynamo. Hong et al. [
73] and Jung et al. [
74] used the RANSAC algorithm to derive vertical wall planes in the point cloud and then extract, with a tracing grid, the 2D floor boundaries as a reference for the construction of parametric shapes in the BIM environment.
Similarly, Thomson and Boehm [
75] performed detection of horizontal and vertical planes with the Point Cloud Library implementation of RANSAC as a requisite for boundary tracing to ease the reconstruction of walls, floors and ceilings in IFC format. Other algorithms have been proposed for primitive fitting, such as the Hough Transform [
76] applied in [
77,
78], but the RANSAC algorithm has proven to perform better; as it demands less time and less computational effort, it is more robust and it provides results with a higher quality [
79].
In the present study, we leverage the RANSAC shape detection algorithm as proposed by Schnabel et al. [
80], with a hierarchically structured sampling strategy for candidate shape generation. This method decomposes the point cloud in a set of primitive shapes with associated point sets, it randomly samples minimal subsets of points to generate candidate shapes, and then outputs the best fit primitive by means of a probabilistic score function.
The interface to the automatic shape detection algorithm is accessible via qRansacSD, a CloudCompare plugin, and allows the selection of planes, spheres, cylinders, cones and tori as candidate shapes. For the proposed approach, the qRansacSD plugin allows the description of elements with mainly planar or cylindrical development; the output primitives are used as a reference for the reconstruction of the parametric geometries.
As for general cases dealing with more complex classes of typological elements, new parametric elements are created from scratch. For such elements, the parametric representation is conducted through the identification of a shape grammar, i.e., by making reference to architectural treatises and construction rules, and by modeling the ideal shapes via tools for profile extrusion, loft, revolution, sweep and blend.
A reference shape is created for each class (e.g., capital, vaults, windows), and then its geometry is propagated to all elements that present similar features at stage (iii). This is obtained by expanding the component families, created for the training set, to the other parts of the model with replica mechanisms. By acting on a set of defined control points, it is possible, where strictly required, to modify the element of the class in order to adapt its shape to the trend of the reality-based model.
The model obtained at the end of the process is presented in a BIM-readable and interchangeable format, and it can be enriched with meaningful and complementary information pertaining, for instance, to the work of analysis, recovery, restoration and conservation.
5. Results
The two steps of the proposed methodology, as illustrated in
Section 4, were tested on the representative case study of the Grand-Ducal Cloister of the Pisa Charterhouse, with promising results.
5.1. Semantic Segmentation via Machine Learning
The first step was the semantic segmentation of the 3D point cloud that was performed based on the five points illustrated in
Section 4.1.
A reduced area of the Grand-Ducal Cloister dataset, manually labeled, acted as a training set. The application of supervised ML allows, at the end of this process, the semantic point cloud to be obtained, with identified and labeled classes of architectural elements. A label was indeed assigned to the other points of the cloud, not manually annotated, based on their features. The overall procedure is illustrated in
Figure 3.
5.1.1. Neighborhood Selection and Feature Extraction
The combination of geometric, radiometric and intensity features, as illustrated in
Section 4.1.1, was taken into account to perform the classification.
For the Grand-Ducal Cloister dataset, the geometric features (Equations (1)–(9)) were sorted according to three different local neighborhood radii of 0.2, 0.4 and 0.6 m, respectively.
This choice was driven by considerations made on the recurrent dimensions of the elements found in the dataset, relating, e.g., to the thickness of certain architectural moldings and to the radii and diameters of the columns. In any case, lower values of the neighborhood radius provide better performance in describing finer details, while higher values apply a sort of smoothing filter [
38].
Some of the extracted geometric features are illustrated in
Figure 4. In this way, the point cloud could be represented as a matrix of n points in which geometric features, RGB values and intensity were associated with each observation (
Figure 5). The last column of the matrix corresponds to the annotated label, the value that is known for the training set and that is to be predicted for the “non-annotated” test dataset.
5.1.2. Feature Selection and Manual Annotation of the Training Set
The seventeen classes identified for the Grand-Ducal Cloister dataset are displayed in
Figure 6. They are labeled on a reduced portion of the point cloud that is considered to exhaustively describe all architectural shapes present.
The assignment of the different classes reproduces the architectural decomposition illustrated by Scamozzi in the 17th century treatise [
59], whose layout inspired the constructor of the cloister.
The classes are manually labelled for the training set, i.e., a reduced area of the overall point cloud of almost 600,000 points. As such, the point cloud matrix structure, as displayed in
Figure 5, was obtained for the training set. The response value, that corresponds to the labelled class, was known for this subset of points. At this stage, a predictor importance estimate was run on the Grand-Ducal Cloister dataset in order to select the covariance features that are most relevant for the classification and iteratively remove the least relevant ones. The feature selection step reduced data dimensionality, allowing the selection of a subset of predictors that suitably described the given response values.
This step provided insight into the data: the deletion of less important features significantly reduced the training time and improved the overall performance of the predictive model.
Due to the great variation in the levels of predictors and the high dimensions of the training dataset, statistical curvature tests [
81] were chosen to evaluate the importance scores of each feature (
Figure 7).
At the end of the process, the number of input covariance features was reduced to 9, in order of predictor importance: verticality (0.2), verticality (0.4), verticality (0.6), surface variation (0.2), sphericity (0.2), anisotropy (0.2), surface variation (0.6), omnivariance (0.2) and surface variation (0.4).
From this result, many considerations can be inferred: verticality and surface variation (with ϱ = 0.2, 0.4 or 0.6) are the most relevant features. Verticality permits a clear distinction between elements of the dataset that are mostly horizontal (floors, ground) or vertical (columns, walls), while surface variation is suitable in describing the curvature of some elements, such as vaults and arcs.
Omnivariance (0.2) allows the recognition of architectural details and, similarly, anisotropy (0.2) is valuable for depicting finer elements with horizontal development, e.g., the windowsill and the under-roof moldings.
5.1.3. Random Forest Classifier and Validation Results
After the manual annotation of the training set, a Random Forest model was constructed considering the 9 selected geometric features as predictors. In addition, RGB values, laser scanning intensity and the Z coordinate (providing the height information) were alternatively used, considering . Five different combinations were studied for the training of the RF classifier:
Geometric features;
Geometric features + Z;
Geometric features + Z + RGB values;
Geometric features + Z + Intensity;
Geometric features + Z + RGB values + Intensity, in order to evaluate the most successful one in making predictions.
For each classifier, a k-fold cross validation technique [
63] was used for the model assessment: the original known dataset was partitioned into a k number of folds (in our case, k = 5), and at each round a subset of points was used to train the algorithm and the remaining data to evaluate its performance. In other words, at each step of the learning process, a model was trained with out-of-fold observations and then tested with in-fold observations. Finally, the error was averaged over all folds, and the predictive accuracy of the classifier was assessed. This method had the advantage that all the points of the manually annotated part of the point cloud were used for both learning and validation purposes, and each observation was used at least once for validation.
The k-fold cross validation protects against overfitting and provides a sound indication of the accuracy of the final model. The procedure was repeated for the five combinations of features, respectively, thus obtaining a predictive accuracy of each classifier. The relative comparison of the results allowed the selection of the most appropriate of the five feature combinations to be used for the purpose of classification.
For the Grand-Ducal Cloister dataset, the comparison of the average values of precision, recall, overall accuracy and F-measure computed for the five combinations proved that combination n. 2 (geometric features + Z) provided the best result (bold values in
Table 2). It has to be noted that this is a relative comparison, attained in the training set of
Figure 8 after a 5-fold cross validation.
For the two most successful combinations, n. 2 and n. 3, precision, recall and F-measure, broken down by each class, are displayed in
Table 3. In the last row, the average metrics are reported.
The RF model trained on the two combinations is applied to the remaining part of the dataset, not previously annotated, in order to obtain the classification results for the whole point cloud (
Figure 8,
Figure 9 and
Figure 10). The output of combination n. 2 is reported in
Figure 9.
Considering this output, it can be noted that the RF model correctly predicted the points that belong to the columns of the first order, the plane façade, the roof, the floor and the ground; these are all elements whose geometric shape can be recognized, having mainly plane or cylindrical development (
Figure 8a).
Conversely, RGB parameters become particularly relevant for the recognition of peeled or deteriorated plaster parts or frescoed areas, as in the case of the buttress shafts, the window frames or the arches of the ground floor (
Figure 8b).
Figure 8c illustrates a comparison of the resulting annotated point cloud for the two combinations. Dark brown spots stand for instances that are classified differently from one method to another.
Based on the considerations above, a subset of points was selected over the test set to be classified based on combination n. 3 rather than combination n. 2 (
Figure 11a).
In such a manner, the two combinations were merged in order to obtain the overall, properly labelled point cloud.
Figure 11b displays the annotated point cloud, attained as the output of the ML workflow.
5.2. Scan-to-BIM
The scan-to-BIM procedure, in its three declinations as illustrated in
Section 4.2, is applied to the annotated 3D point cloud. In this second phase, indeed, the 3D data, once semantically segmented, is exploited to provide a more automated reconstruction of the building information model. A diagram of the overall workflow is illustrated in
Figure 12.
5.2.1. Extraction of Single Classes of Architectural Components
The approach proposed in
Section 4 to the semantic segmentation of heritage data enables the handling of multiple description layers corresponding to each class of typological elements identified over the 3D point cloud.
The first stage of the scan-to-BIM process consisted of loading the point cloud, partitioned and annotated within the BIM environment, while retaining the subdivision of points into classes of typological and recurring elements. For this purpose, a distinct record was created for every set of points that fell under the same category.
The 3D points of the Grand-Ducal Cloister dataset were assembled based on the class to which they belong, on the basis of the subdivision into the 17 labels proposed in
Section 5.1.2.
Operationally, this step was performed in MATLAB through encoding language: each instance of the point cloud was split into distinct records based on the “response value” array, sorted after application of the RF classifier (
Figure 13).
The records related to each class can be read and opened using the most common 3D visualization and graphics schemes, such as the e57 file format, a compact and widespread format for the storage of point clouds. However, they cannot be opened directly in Autodesk Revit.
A conversion step was necessary at this stage: in order to create a file that could be imported into Autodesk Revit and that also contained all the labeled objects, Autodesk Recap software was used (
Figure 14a). Each record was stored as a single scan object and then connected together in a single point cloud project file, provided in RCP format, that could be opened and visualized in Autodesk Revit or any other BIM software.
Once imported into Autodesk Revit, the point cloud preserved the division of the different classes created; in other words, it was a labeled object.
The segmentation of the survey dataset based on classes of typological elements had considerable advantages in the modeling stages within the BIM environment:
By appropriately editing the visibility settings in the various views, it was possible to isolate—or, conversely, hide—some classes of elements rather than others, boosting the reconstruction process.
By moving across different zones of the point cloud, the class to which they belong was displayed directly.
This boosts the selection of labels and makes it easier, for example, to isolate a single class for shape reconstruction operations (
Figure 14b).
A single class can be alternatively selected on the overall point cloud, or rather, isolated, by overriding its visibility and graphic display parameters in Autodesk Revit (
Figure 15).
5.2.2. Libraries of Ideal Parametric Shapes
The training set with its related classes of typological elements provides a fundamental benchmark for the construction of ideal geometries and their successive propagation to the other parts of the model.
In trivial cases, the element classes are attributable to simple geometric primitives, such as planes or cylinders. For these elements, the process of reconstruction of the parametric model and export to IFC format takes place a priori, as it precedes the import into the BIM platform.
For the description of façade walls, column shafts and floors, i.e., elements with mainly planar or cylindrical development, primitive fitting algorithms were leveraged in order to retrieve the parameters that describe the basic shape. The reconstruction of the 3D geometry was carried out via the RANSAC algorithm with its extensions, included in the built-in option of CloudCompare software qRansacSD. At first, the sought-for type of primitive was indicated. Then, a minimum value of support points (samples) for primitive detection was assigned: this is a user-defined parameter that depends on the density of points in each class. Similarly, other parameters, such as the maximum distance to primitive, the sampling resolution, the maximum normal deviation and the overlooking probability [
63], are adjusted each time to produce a meaningful arrangement of the geometries.
For the case study, the classes for which such procedure applied were: roof (label 1), façade wall (label 2), column shaft (label 7), floor (label 12), buttress shaft (label 14), base (label 16) and ground (label 17), respectively. Examples of the recognition of the elements of planes are shown in
Figure 16.
For these classes, the parameters that allow the univocal description of each ideal geometry can be retrieved; for instance, orientations and normal for planes, radius and height for cylinders. These parameters allow one to reconstruct more intuitively such shapes in the BIM environment.
On the other hand, the most general case applies to the classes of elements that are not ascribable to elementary primitives. In this situation, which occurs, e.g., for the vaults or for the columns’ capitals and bases, an ideal conceptual shape is reconstructed according to geometrical formulas, proportions and shape grammar.
At first, the parameters allowing the description of the elements of a class were identified with reference to constructive and proportionality rules outlined in the architectural treatises. Subsequently, a target class was selected from the training set. In Revit, a new component family was created (
Figure 17). For such complex and case-specific classes of architectural components, in fact, there are no preset classes of elements, by default, within the BIM environment. New families were generated, and the name of each family corresponded to the respective class identified over the reality-based model.
The modeling phase took place directly in the BIM environment: a reference 2D plane was set, and the base profiles were drawn, taking into account construction and proportionality rules. Later, by making use of the sweep, blend, extrusion and revolution functions applied on the bidimensional profiles, the 3D parametric shape was obtained, which was a set of ideal geometries and a mathematical representation of the real object created from shape grammar.
Once defined for the training set, the parametric representation could be expanded and copied, i.e., propagated, to other parts of the model where the same label appears. Some of the 17 identified labels are illustrated in
Figure 17 over the parametric model. The original point cloud is also visible.
5.2.3. H-BIM Model and Export to IFC Format
Once the reference geometry was obtained for each class, its shape could be extended to the other elements of the annotated point cloud that were classified as falling under the same label.
For the case study, the extension of the procedure illustrated in
Section 4.2 to all 17 classes allowed the parametric model of
Figure 18 to be obtained as a result.
Each created parametric family was represented in IFC format (
Figure 19). In the Revit environment, the representation held the semantic link with its corresponding reality-based model.
6. Discussion
The methodological approach was tested on the emblematic case study of the Pisa Charterhouse, according to the two distinct phases of the proposed workflow: a first part concerning the semantic segmentation of the 3D point cloud aimed at recognizing and propagating recurrent architectural elements, and a second part in which, starting from the classification so obtained, an H-BIM model was reconstructed.
This second part of the workflow, dealing with the modeling of parametric geometries, was considerably expedited by the ML segmentation process, since in that way the preparatory work for the construction of building information models was made more efficient by distinguishing typological and recurring elements, which were suitably annotated on the original point cloud.
In fact, on one hand, elementary geometries (e.g., walls, slabs, columns) can be more intuitively reconstructed through primitive fitting processes; on the other hand, more complex geometries (e.g., capitals, bases, vaults) are iteratively isolated and reconstructed in the H-BIM environment, displaying only the relevant classes concerning the parts of the whole assembly.
Allowing a selective display or identification of each architectural component, the proposed procedure permits a more straightforward and more intuitive visualization of the different classes, resulting in a parametric reconstruction of any geometry, even extremely complicated cases.
Moreover, a continuous correspondence between the survey data and the H-BIM model is achieved by adopting the same class denominations in both the semantically segmented cloud and the parametric model. It must be stressed that correspondence is both geometric (in terms of available 3D data that is visualized) and semantic (in terms of the name given to each class).
Owing to the fact that each identified class of architectural components is coherently represented in the reality-based model as well as in the parametric model, the interoperability and the exchange of information between the two different representation systems are duly assured. Consequently, the creation of an intrinsic connection between parametric and reality-based model is a noticeable feature of the proposed methodology.
By preserving the distinction into classes, a semantic link between the 3D point cloud and the H-BIM model is created. It must be underlined that the connection is preserved when switching to different BIM programs, owing to the interoperability of the IFC format for the sharing and managing of parametric models.
Information can either be associated with a single element or to a family (class) of elements, and it can be very general, e.g., concerning materials, time of construction, intervention measures, etc., or be localized within limited parts of the model, e.g., describing localized damage or degradation phenomena, or peeled or deteriorated zones [
10].
Inter alia, the proposed procedure allows, in particular:
To access, to amend and to systematically update knowledge-related information, and therefore to enrich the reconstructed H-BIM model. In fact, following the logic of digital information models, semantic annotations associated with both parametric and reality-based representations can be further improved, such as in the example of
Figure 20, by means of historical documentation, management reports, and so on.
To create disparity maps, highlighting the deviations between the ideal model and the real model and their evolution over the time. In that way, differences between individual elements belonging to the same class can be suitably detected, revealing, for example, degradation phenomena and losses of material.
The capability of the procedure to transfer information from parametric to reality-based models and vice versa can be suitably applied also to exchange data among collaborative platforms for the annotation of point-based models, such as Aïoli (
http://www.aioli.cloud/) [
10,
12,
82,
83].
7. Conclusions
The proposed pipeline for the semiautomated transition from raw 3D survey data to the semantically rich H-BIM representation can be applied by conservators, engineers, architects and restorers to update, retrieve and archive the available heritage information within a shared digital information system, preserving the connection between reality-based and parametric models.
Based on a semantic segmentation process, the methodology applies to buildings and historical assets, in which classes of recurring typological elements can be recognized by relying on constructive rules and/or building proportions.
The semantic information is transferred and propagated to elements of the heritage asset that present similar characteristics and that can be categorized within the same typological class. For this reason, the search for intrinsic geometric, radiometric or intensity features of the original point cloud is a fundamental step in the definition of the approach (
Figure 21 and
Figure 22).
A preliminary procedure for semantic segmentation of heritage data, carried out via ML algorithms, streamlines the reconstruction of H-BIM models. The raw representation derived from surveying is in fact enriched with semantic annotations, which are preserved even when the modeling in the H-BIM environment is performed.
The Grand-Ducal Cloister dataset, embodying the typological structure of the cloister, is considered a pilot case study whereby the proposed methodology was tested; the results are promising and suggest a possible applicability of the proposed workflow to further and even more complex datasets characterized by the repetition of recurring archetypal forms. For the improvement of scan-to-BIM semantic model capabilities, the method will be extended, for instance, to other case studies, and also to different buildings and architectural types built in different historical periods, with different materials, and that are in a more or less critical state of conservation.
It must be remarked that the process of semantic segmentation via ML requires manual annotation of the different classes of architectural elements on a reduced area of the 3D point cloud, implying, at least in the first phases of the process, the intervention of an expert operator able to manage the training set by properly choosing the most relevant features and annotating the point cloud. Nevertheless, at a second stage, the reconstruction of the H-BIM model can be fulfilled by less skilled operators, as it would be leveraging an already semantically annotated point cloud. In other words, from a certain point on, the required skill of the operator can be significantly minor.
In addition, by using a semantically annotated point cloud, the scan-to-BIM process is significantly improved, and the reconstruction of the parametric geometries is greatly simplified and automated, since the proposed method allows the isolation of certain portions of the model, facilitating the reconstruction and the propagation of elementary or complicated architectural parts.
It has to be noted that the feature selection and the definition of the training model based on a manually annotated area can be initially very cumbersome, but this difficulty is largely unavoidable due to the complexity of heritage structures and the extent of information commonly required. However, it is expected that the application of DL models would streamline this semantic segmentation phase when the availability of annotated benchmark datasets increases, thus consolidating the method and allowing its extension to a broader variety of case studies, including very complex and large structures.
At present, a general algorithm implementing all the steps of the proposed methodology is not yet available, therefore several software programs and tools have been combined, each one specialized to perform a specific task. Despite that complication, the procedure itself has been validated, demonstrating that the process can be generally applied.
The promising results of the proposed methodology undoubtedly suggest forthcoming development of the research, aimed at the creation of an algorithm as consistent as possible that minimizes the use of different software. Although not trivial, the creation of a coherent algorithm, which could significantly improve the method, thus making it more appropriate for practical applications, will be the subject of future studies.
However, interesting conclusions can already be drawn on the innovative aspects of the proposed approach:
The application of ML approaches for the classification of 3D heritage data as a preliminary step towards a more automated construction of H-BIM models;
A more effective management of 3D data, with insertion of semantic and meaningful tags in both reality-based and parametric representation models;
Acceleration of the semantic annotation process, as once the training set is annotated and the RF classifier is trained, the application of the trained model to non-annotated parts takes on average between 15 and 20 min;
Automation in the transition from point-based to parametric representation;
Time-reduction of the scan-to-BIM process, through the import of an annotated yet semantically segmented point cloud;
The creation of a semantic bridge between reality-based and parametric models.
As a future work, some aspects will be further investigated and developed:
Streamlining of the procedure with the creation of a single development environment that does not require the transition between different software, and that can be tested by non-skilled operators even in the semantic segmentation phase;
Investigations on a multi-level semantic segmentation, in such a way that components can be hierarchically classified depending on the desired scales of representation and levels of detail;
Surveys on the interrelation and dependency between the selected features and the labelled dataset type to speed up selection of feature subsets;
Extension of the work to other case studies to demonstrate the applicability of the proposed approach to other heritage objects, for example, belonging to a different time or architectural style. This also implies exploring the relationship between the most relevant features and the proportions of some elements of the dataset;
Studies on the connection between represented classes and domain ontologies, to make 3D reality-based and parametric data even more accessible, traceable and reusable by users and applications in the cultural heritage field;
Enrichment of existing benchmarks of heritage annotated data with insertion of this study to allow a more suitable application of DL algorithms, as already envisaged in [
23]. This would boost the development of automatic classification solutions at a larger scale.
Author Contributions
Conceptualization, V.C., G.C., L.D.L., K.J., A.P., P.V.; data curation, V.C., G.C., A.P.; funding acquisition, G.C., L.D.L., A.P., P.V.; investigation, V.C.; methodology, V.C.; project administration, G.C., L.D.L., A.P., P.V.; supervision, V.C., G.C., L.D.L., K.J., A.P., P.V.; validation, V.C.; visualization, V.C.; writing—original draft, V.C.; writing—review and editing, V.C., G.C., L.D.L., K.J., A.P., P.V. The work is the result of a collaboration between the Department of Civil and Environmental Engineering of the University of Florence, the Department of Civil and Industrial Engineering of the University of Pisa (Italy), the MAP Laboratory of the Centre National de la Recherche Scientifique (CNRS, Marseille, France) and the LISPEN Laboratory in Aix-en-Provence (France). It was carried out in the framework of a PhD joint tutelage agreement. All authors have read and agreed to the published version of the manuscript.
Funding
The research is part of a PhD project funded by POR FSE TOSCANA 2014/2020 (Tuscany Region). It is also funded by Università Italo-Francese, Vinci2019 fellowship to Valeria Croce, to foster research collaborations between Italian and French laboratories (Chapter II—Mobility Contributions for PhD thesis developed in co-tutelle).
Acknowledgments
The authors are grateful to all researchers and collaborators involved in the project “Studi conoscitivi e ricerche per la conservazione e la valorizzazione del Complesso della Certosa di Calci e dei suoi Poli Museali” (Cognitive studies and research aimed at the conservation and enhancement of the Calci Charterhouse Complex and its Museum Poles), funded by the University of Pisa and aimed at the restoration and conservation of the Pisa Charterhouse. Special thanks goes to Marco Giorgio Bevilacqua, coordinator of the technical committee for the Charterhouse Project. We also thank the Université Franco-Italienne for providing external funding for the development of the PhD program.
Conflicts of Interest
The authors declare no conflict of interest. The funders had no role in the design of the study; in the collection, analyses, or interpretation of data; in the writing of the manuscript, or in the decision to publish the results.
List of Abbreviations
The following abbreviations are used in the manuscript:
| BIM | Building Information Modeling |
| CAD | Computer Aided Design |
| DL | Deep Learning |
| FN | False Negatives |
| FP | False Positives |
| H-BIM | Heritage-Building Information Modeling |
| IFC | Industry Foundation Classes |
| LiDAR | Light Detection and Ranging |
| ML | Machine Learning |
| RANSAC | Random Sample and Consensus |
| RF | Random Forest |
| RGB | Red, Green and Blue |
| SLAM | Simultaneous Localization and Mapping |
| SVM | Support Vector Machine |
| TN | True Negatives |
| TP | True Positives |
| 3D | Three-dimensional |
References
- Bacci, G.; Bertolini, F.; Bevilacqua, M.G.; Caroti, G.; Martínez-Espejo Zaragoza, I.; Martino, M.; Piemonte, A. HBIM Methodologies for the Architectural Restoration. The Case of the Ex-Church of San Quirico All’Olivo in Lucca, Tuscany. Int. Arch. Photogramm. Remote Sens. Spat. Inf. Sci. 2019, XLII-2/W11, 121–126. [Google Scholar] [CrossRef]
- Roussel, R.; Bagnéris, M.; De Luca, L.; Bomblet, P. A Digital Diagnosis for the “autumn” Statue (Marseille, France): Photogrammetry, Digital Cartography and Construction of a Thesaurus. Int. Arch. Photogramm. Remote Sens. Spat. Inf. Sci. 2019, XLII-2/W15, 1039–1046. [Google Scholar] [CrossRef]
- Chiabrando, F.; Lo Turco, M.; Rinaudo, F. Modeling the Decay in a HBIM Starting from 3D Point Clouds. A Followed Approach for Cultural Heritage Knowledge. Int. Arch. Photogramm. Remote Sens. Spat. Inf. Sci. 2017, XLII-2/W5, 605–612. [Google Scholar] [CrossRef]
- Lo Turco, M.; Mattone, M.; Rinaudo, F. Metric Survey and BIM Technologies to Record Decay Conditions. Int. Arch. Photogramm. Remote Sens. Spat. Inf. Sci. 2017, XLII-5/W1, 261–268. [Google Scholar] [CrossRef]
- Robleda-Prieto, G.; Caroti, G.; Martínez-Espejo Zaragoza, I.; Piemonte, A. Computational Vision in UV-Mapping of Textured Meshes Coming from Photogrammetric Recovery: Unwrapping Frescoed Vaults. Int. Arch. Photogramm. Remote Sens. Spat. Inf. Sci. 2016, XLI-B5, 391–398. [Google Scholar] [CrossRef]
- Oreni, D.; Brumana, R.; Della Torre, S.; Banfi, F. Survey, HBIM and Conservation Plan of a Monumental Building Damaged by Earthquake. Int. Arch. Photogramm. Remote Sens. Spat. Inf. Sci. 2017, XLII-5/W1, 337–342. [Google Scholar] [CrossRef]
- Stefani, C.; Luca, L.D.; Veron, P.; Florenzano, M. Modeling Buildings Historical Evolutions. In Proceedings of the Focus K3D conference on Semantic 3D Media and Content, Méditerranée, France, 11–12 February 2010. [Google Scholar]
- Apollonio, F.I. The Production of 3D Digital Archives and the Methodologies for Digitally Supporting Research in Architectural and Urban Cultural Heritage. In Digital Research and Education in Architectural Heritage; Münster, S., Friedrichs, K., Niebling, F., Seidel-Grzesińska, A., Eds.; Communications in Computer and Information Science; Springer International Publishing: Cham, Switzerland, 2018; Volume 817, pp. 139–158. ISBN 978-3-319-76991-2. [Google Scholar]
- Apollonio, F.I.; Basilissi, V.; Callieri, M.; Dellepiane, M.; Gaiani, M.; Ponchio, F.; Rizzo, F.; Rubino, A.R.; Scopigno, R.; Sobra’, G. A 3D-Centered Information System for the Documentation of a Complex Restoration Intervention. J. Cult. Herit. 2018, 29, 89–99. [Google Scholar] [CrossRef]
- Croce, V.; Caroti, G.; De Luca, L.; Piemonte, A.; Véron, P. Semantic Annotations on Heritage Models: 2D/3D Approaches and Future Research Challenges. Int. Arch. Photogramm. Remote Sens. Spat. Inf. Sci. 2020, XLIII-B2-2020, 829–836. [Google Scholar] [CrossRef]
- Bevilacqua, M.G.; Caroti, G.; Piemonte, A.; Ruschi, P.; Tenchini, L. 3D Survey Techniques for the Architectural Restoration: The Case of St. Agata in Pisa. Int. Arch. Photogramm. Remote Sens. Spat. Inf. Sci. 2017, XLII-5/W1, 441–447. [Google Scholar] [CrossRef]
- Manuel, A.; Véron, P.; Luca, L.D. 2D/3D Semantic Annotation of Spatialized Images for the Documentation and Analysis of Cultural Heritage. Eurographics Workshop Graph. Cult. Herit. 2016, 4. [Google Scholar] [CrossRef]
- Andrews, P.; Zaihrayeu, I.; Pane, J. A Classification of Semantic Annotation Systems. Semant. Web 2012, 3, 223–248. [Google Scholar] [CrossRef]
- Bruno, N.; Roncella, R. HBIM for Conservation: A New Proposal for Information Modeling. Remote Sens. 2019, 11, 1751. [Google Scholar] [CrossRef]
- Andriasyan, M.; Moyano, J.; Nieto-Julián, J.E.; Antón, D. From Point Cloud Data to Building Information Modelling: An Automatic Parametric Workflow for Heritage. Remote Sens. 2020, 12, 1094. [Google Scholar] [CrossRef]
- Croce, V.; Caroti, G.; Piemonte, A.; Bevilacqua, M.G. Geomatics for Cultural Heritage conservation: Integrated survey and 3D modeling. In Proceedings of the IMEKO TC4 International Conference on Metrology for Archaeology and Cultural Heritage, MetroArchaeo, Florence, Italy, 4–6 December 2019; pp. 271–276. [Google Scholar]
- Tang, P.; Huber, D.; Akinci, B.; Lipman, R.; Lytle, A. Automatic Reconstruction of As-Built Building Information Models from Laser-Scanned Point Clouds: A Review of Related Techniques. Autom. Constr. 2010, 19, 829–843. [Google Scholar] [CrossRef]
- De Luca, L. Methods, Formalisms and Tools for the Semantic-Based Surveying and Representation of Architectural Heritage. Appl. Geomat. 2011, 6, 115–139. [Google Scholar] [CrossRef]
- Macher, H.; Landes, T.; Grussenmeyer, P. From Point Clouds to Building Information Models: 3D Semi-Automatic Reconstruction of Indoors of Existing Buildings. Appl. Sci. 2017, 7, 1030. [Google Scholar] [CrossRef]
- Volk, R.; Stengel, J.; Schultmann, F. Building Information Modeling (BIM) for Existing Buildings—Literature Review and Future Needs. Autom. Constr. 2014, 38, 109–127. [Google Scholar] [CrossRef]
- Grilli, E.; Remondino, F. Classification of 3D Digital Heritage. Remote Sens. 2019, 11, 847. [Google Scholar] [CrossRef]
- Grilli, E.; Özdemir, E.; Remondino, F. Application of Machine and Deep Learning Strategies for the Classification of Heritage Point Clouds. Int. Arch. Photogramm. Remote Sens. Spat. Inf. Sci. 2019, XLII-4/W18, 447–454. [Google Scholar] [CrossRef]
- Matrone, F.; Lingua, A.; Pierdicca, R.; Malinverni, E.S.; Paolanti, M.; Grilli, E.; Remondino, F.; Murtiyoso, A.; Landes, T. A Benchmark for Large-Scale Heritage Point Cloud Semantic Segmentation. Int. Arch. Photogramm. Remote Sens. Spat. Inf. Sci. 2020, XLIII-B2-2020, 1419–1426. [Google Scholar] [CrossRef]
- Pierdicca, R.; Paolanti, M.; Matrone, F.; Martini, M.; Morbidoni, C.; Malinverni, E.S.; Frontoni, E.; Lingua, A.M. Point Cloud Semantic Segmentation Using a Deep Learning Framework for Cultural Heritage. Remote Sens. 2020, 12, 1005. [Google Scholar] [CrossRef]
- Breiman, L. Ramdom Forests. Mach. Learn. 2001, 45, 5–32. [Google Scholar] [CrossRef]
- Remondino, F.; Georgopoulos, A.; Gonzalez-Aguilera, D.; Agrafiotis, P. Latest Developments in Reality-Based 3D Surveying and Modelling, 1st ed.; MDPI AG Publisher: Basel, Switzerland, 2018; ISBN 978-3-03842-685-1. [Google Scholar]
- Bevilacqua, M.G.; Caroti, G.; Piemonte, A.; Terranova, A.A. Digital Technology and Mechatronic Systems for the Architectural 3D Metric Survey. In Mechatronics for Cultural Heritage and Civil Engineering; Ottaviano, E., Pelliccio, A., Gattulli, V., Eds.; Intelligent Systems, Control and Automation: Science and Engineering; Springer International Publishing: Cham, Switzerland, 2018; Volume 92, pp. 161–180. ISBN 978-3-319-68645-5. [Google Scholar]
- Weinmann, M. Reconstruction and Analysis of 3D Scenes; Springer International Publishing: Cham, Switzerland, 2016; ISBN 978-3-319-29244-1. [Google Scholar]
- Remondino, F. Heritage Recording and 3D Modeling with Photogrammetry and 3D Scanning. Remote Sens. 2011, 3, 1104–1138. [Google Scholar] [CrossRef]
- Pamart, A.; Morlet, F.; de Luca, L. A Fully Automated Incremental Photogrammetric Processing Dedicated for Collaborative Remote-Computing Workflow. Int. Arch. Photogramm. Remote Sens. Spat. Inf. Sci. 2019, XLII-2/W9, 565–571. [Google Scholar] [CrossRef]
- Hichri, N.; Stefani, C.; De Luca, L.; Veron, P.; Hamon, G. From Point Cloud to BIM: A Survey of Existing Approaches. Int. Arch. Photogramm. Remote Sens. Spat. Inf. Sci. 2013, XL-5/W2, 343–348. [Google Scholar] [CrossRef]
- Bruno, S.; Musicco, A.; Fatiguso, F.; Dell’Osso, G.R. The Role of 4D Historic Building Information Modelling and Management in the Analysis of Constructive Evolution and Decay Condition within the Refurbishment Process. Int. J. Archit. Herit. 2019, 1, 1–17. [Google Scholar] [CrossRef]
- Dore, C.; Murphy, M. Current State of the Art Historic Building Information Modeling. Int. Arch. Photogramm. Remote Sens. Spat. Inf. Sci. 2017, XLII–2, 185–192. [Google Scholar] [CrossRef]
- Murphy, M.; McGovern, E.; Pavia, S. Historic Building Information Modelling—Adding Intelligence to Laser and Image Based Surveys of European Classical Architecture. ISPRS J. Photogramm. Remote Sens. 2013, 76, 89–102. [Google Scholar] [CrossRef]
- Murphy, M.; McGovern, E.; Pavia, S. Historic building information modelling (HBIM). Struct. Surv. 2009, 27, 311–327. [Google Scholar] [CrossRef]
- López, F.; Lerones, P.; Llamas, J.; Gómez-García-Bermejo, J.; Zalama, E. A Review of Heritage Building Information Modeling (H-BIM). MTI 2018, 2, 21. [Google Scholar] [CrossRef]
- Pocobelli, D.P.; Boehm, J.; Bryan, P.; Still, J.; Grau-Bové, J. Building Information Modeling for Monitoring and Simulation Data in Heritage Buildings. Int. Arch. Photogramm. Remote Sens. Spat. Inf. Sci. 2018, XLII–2, 909–916. [Google Scholar] [CrossRef]
- Kaiser, A.; Ybanez Zepeda, J.A.; Boubekeur, T. A Survey of Simple Geometric Primitives Detection Methods for Captured 3D Data. Comput. Graph. Forum 2019, 38, 167–196. [Google Scholar] [CrossRef]
- Tulsiani, S.; Su, H.; Guibas, L.J.; Efros, A.A.; Malik, J. Learning Shape Abstractions by Assembling Volumetric Primitives. arXiv 2018, arXiv:1612.00404. [Google Scholar]
- Shah, G.A.; Polette, A.; Pernot, J.-P.; Giannini, F.; Monti, M. Simulated Annealing-Based Fitting of CAD Models to Point Clouds of Mechanical Parts’ Assemblies. Eng. Comput. 2020, in press. [Google Scholar] [CrossRef]
- Wang, C.; Cho, Y.K.; Kim, C. Automatic BIM Component Extraction from Point Clouds of Existing Buildings for Sustainability Applications. Autom. Constr. 2015, 56, 13. [Google Scholar] [CrossRef]
- López, F.J.; Lerones, P.M.; Llamas, J.; Gómez-García-Bermejo, J.; Zalama, E. A Framework for Using Point Cloud Data of Heritage Buildings toward Geometry Modeling in a BIM Context: A Case Study on Santa Maria La Real De Mave Church. Int. J. Archit. Herit. 2017, 3816, 1–22. [Google Scholar] [CrossRef]
- Capone, M.; Lanzara, E. Scan-to-BIM vs. 3D Ideal Modela HBIM: Parametric Tools to Study Domes Geometry. Int. Arch. Photogramm. Remote Sens. Spat. Inf. Sci. 2019, XLII-2/W9, 219–226. [Google Scholar] [CrossRef]
- Baik, A. From Point Cloud to Jeddah Heritage BIM Nasif Historical House—Case Study. Digit. Appl. Archaeol. Cult. Herit. 2017, 4, 1–18. [Google Scholar] [CrossRef]
- Rodríguez-Moreno, C.; Reinoso-Gordo, J.F.; Rivas-López, E.; Gómez-Blanco, A.; Ariza-López, F.J.; Ariza-López, I. From Point Cloud to BIM: An Integrated Workflow for Documentation, Research and Modelling of Architectural Heritage. Surv. Rev. 2018, 50, 212–231. [Google Scholar] [CrossRef]
- Pepe, M.; Costantino, D.; Restuccia Garofalo, A. An Efficient Pipeline to Obtain 3D Model for HBIM and Structural Analysis Purposes from 3D Point Clouds. Appl. Sci. 2020, 10, 1235. [Google Scholar] [CrossRef]
- Barazzetti, L.; Banfi, F.; Brumana, R.; Gusmeroli, G.; Previtali, M.; Schiantarelli, G. Cloud-to-BIM-to-FEM: Structural Simulation with Accurate Historic BIM from Laser Scans. Simul. Model. Pract. Theory 2015, 57, 71–87. [Google Scholar] [CrossRef]
- Grilli, E.; Menna, F.; Remondino, F. A Review of Point Clouds Segmentation and Classification Algorithms. Int. Arch. Photogramm. Remote Sens. Spat. Inf. Sci. 2017, XLII-2/W3, 339–344. [Google Scholar] [CrossRef]
- Fiorucci, M.; Khoroshiltseva, M.; Pontil, M.; Traviglia, A.; Del Bue, A.; James, S. Machine Learning for Cultural Heritage: A Survey. Pattern Recognit. Lett. 2020, 133, 102–108. [Google Scholar] [CrossRef]
- Grilli, E.; Farella, E.M.; Torresani, A.; Remondino, F. Geometric Features Analysis for the Classification of Cultural Heritage Point Clouds. Int. Arch. Photogramm. Remote Sens. Spat. Inf. Sci. 2019, XLII-2/W15, 541–548. [Google Scholar] [CrossRef]
- Özdemir, E.; Remondino, F.; Golkar, A. Aerial Point Cloud Classification with Deep Learning and Machine Learning Algorithms. Int. Arch. Photogramm. Remote Sens. Spat. Inf. Sci. 2019, XLII-4/W18, 843–849. [Google Scholar] [CrossRef]
- Weinmann, M.; Jutzi, B.; Hinz, S.; Mallet, C. Semantic Point Cloud Interpretation Based on Optimal Neighborhoods, Relevant Features and Efficient Classifiers. ISPRS J. Photogramm. Remote Sens. 2015, 105, 286–304. [Google Scholar] [CrossRef]
- Bassier, M.; Klein, R.; Van Genechten, B.; Vergauwen, M. IFCwall Reconstruction from Unstructured Point Clouds. ISPRS Ann. Photogramm. Remote Sens. Spat. Inf. Sci. 2018, IV–2, 33–39. [Google Scholar] [CrossRef]
- Murtiyoso, A.; Grussenmeyer, P. Point Cloud Segmentation and Semantic Annotation Aided by GIS Data for Heritage Complexes. Int. Arch. Photogramm. Remote Sens. Spat. Inf. Sci. 2019, XLII-2/W9, 523–528. [Google Scholar] [CrossRef]
- Qi, C.R.; Su, H.; Mo, K.; Guibas, L.J. PointNet: Deep Learning on Point Sets for 3D Classification and Segmentation. arXiv 2017, arXiv:1612.00593. [Google Scholar]
- Qi, C.R.; Yi, L.; Su, H.; Guibas, L.J. PointNet++: Deep Hierarchical Feature Learning on Point Sets in a Metric Space. arXiv 2019, arXiv:1706.02413. [Google Scholar]
- Malinverni, E.S.; Pierdicca, R.; Paolanti, M.; Martini, M.; Morbidoni, C.; Matrone, F.; Lingua, A. Deep Learning for Semantic Segmentation of 3D Point Cloud. Int. Arch. Photogramm. Remote Sens. Spat. Inf. Sci. 2019, XLII-2/W15, 735–742. [Google Scholar] [CrossRef]
- Matrone, F.; Grilli, E.; Martini, M.; Paolanti, M.; Pierdicca, R.; Remondino, F. Comparing Machine and Deep Learning Methods for Large 3D Heritage Semantic Segmentation. IJGI 2020, 9, 535. [Google Scholar] [CrossRef]
- Scamozzi, V. L’idea Dell’architettura Universale; Per Girolamo Albrizzi: Venezia, Italy, 1615. [Google Scholar]
- Remondino, F.; Rizzi, A. Reality-Based 3D Documentation of Natural and Cultural Heritage Sites—Techniques, Problems, and Examples. Appl. Geomat. 2010, 2, 85–100. [Google Scholar] [CrossRef]
- Tan, K.; Cheng, X. Distance Effect Correction on TLS Intensity Data Using Naturally Homogeneous Targets. IEEE Geosci. Remote Sens. Lett. 2020, 17, 499–503. [Google Scholar] [CrossRef]
- Bolkas, D. Terrestrial Laser Scanner Intensity Correction for the Incidence Angle Effect on Surfaces with Different Colours and Sheens. Int. J. Remote Sens. 2019, 40, 7169–7189. [Google Scholar] [CrossRef]
- Xu, T.; Xu, L.; Yang, B.; Li, X.; Yao, J. Terrestrial Laser Scanning Intensity Correction by Piecewise Fitting and Overlap-Driven Adjustment. Remote Sens. 2017, 9, 1090. [Google Scholar] [CrossRef]
- Kashani, A.; Olsen, M.; Parrish, C.; Wilson, N. A Review of LIDAR Radiometric Processing: From Ad Hoc Intensity Correction to Rigorous Radiometric Calibration. Sensors 2015, 15, 28099–28128. [Google Scholar] [CrossRef]
- Hackel, T.; Wegner, J.D.; Savinov, N.; Ladicky, L.; Schindler, K.; Pollefeys, M. Large-Scale Supervised Learning For 3D Point Cloud Labeling: Semantic3d.Net. Photogramm. Eng. Remote Sens. 2018, 84, 297–308. [Google Scholar] [CrossRef]
- Hackel, T.; Wegner, J.D.; Schindler, K. Fast Semantic Segmentation of 3D Point Clouds with Strongly Varying Density. 8. Int. Arch. Photogramm. Remote Sens. Spat. Inf. Sci. 2016, 3, 177–184. [Google Scholar]
- Ni, H.; Lin, X.; Zhang, J. Classification of ALS Point Cloud with Improved Point Cloud Segmentation and Random Forests. Remote Sens. 2017, 9, 288. [Google Scholar] [CrossRef]
- Rodriguez-Gonzalvez, P.; Rodriguez-Martin, M. Weld Bead Detection Based on 3D Geometric Features and Machine Learning Approaches. IEEE Access 2019, 7, 14714–14727. [Google Scholar] [CrossRef]
- Hackel, T.; Wegner, J.D.; Schindler, K. Contour Detection in Unstructured 3D Point Clouds. In Proceedings of the 2016 IEEE Conference on Computer Vision and Pattern Recognition (CVPR), Las Vegas, NV, USA, 27–30 June 2016; pp. 1610–1618. [Google Scholar]
- Weinmann, M.; Jutzi, B.; Mallet, C. Feature Relevance Assessment for the Semantic Interpretation of 3D Point Cloud Data. ISPRS Ann. Photogramm. Remote Sens. Spat. Inf. Sci. 2013, II-5/W2, 313–318. [Google Scholar] [CrossRef]
- Fischler, M.A.; Bolles, R.C. Random Sample Consensus: A Paradigm for Model Fitting with Applications to Image Analysis and Automated Cartography. Commun. ACM 1981, 24, 381–395. [Google Scholar] [CrossRef]
- Yang, L.; Cheng, J.C.P.; Wang, Q. Semi-Automated Generation of Parametric BIM for Steel Structures Based on Terrestrial Laser Scanning Data. Autom. Constr. 2020, 112, 103037. [Google Scholar] [CrossRef]
- Hong, S.; Jung, J.; Kim, S.; Cho, H.; Lee, J.; Heo, J. Semi-Automated Approach to Indoor Mapping for 3D as-Built Building Information Modeling. Comput. Environ. Urban Syst. 2015, 51, 34–46. [Google Scholar] [CrossRef]
- Jung, J.; Hong, S.; Jeong, S.; Kim, S.; Cho, H.; Hong, S.; Heo, J. Productive Modeling for Development of As-Built BIM of Existing Indoor Structures. Autom. Constr. 2014, 42, 68–77. [Google Scholar] [CrossRef]
- Thomson, C.; Boehm, J. Automatic Geometry Generation from Point Clouds for BIM. Remote Sens. 2015, 7, 11753–11775. [Google Scholar] [CrossRef]
- Hough, P.V.C. Method and Means for Recognizing Complex Patterns. U.S. Patent 3069654, 18 December 1962. [Google Scholar]
- Díaz-Vilariño, L.; Conde, B.; Lagüela, S.; Lorenzo, H. Automatic Detection and Segmentation of Columns in As-Built Buildings from Point Clouds. Remote Sens. 2015, 7, 15651–15667. [Google Scholar] [CrossRef]
- Bosché, F.; Ahmed, M.; Turkan, Y.; Haas, C.T.; Haas, R. The Value of Integrating Scan-to-BIM and Scan-vs-BIM Techniques for Construction Monitoring Using Laser Scanning and BIM: The Case of Cylindrical MEP Components. Autom. Constr. 2015, 49, 201–213. [Google Scholar] [CrossRef]
- Tarsha-Kurdi, F.; Landes, T.; Grussenmeyer, P. Hough-Transform and Extended RANSAC Algorithms for Automatic Detection of 3D Building Roof Planes from Lidar Data. IAPRS 2007, 36, 407–412. [Google Scholar]
- Schnabel, R.; Wahl, R.; Klein, R. Efficient RANSAC for Point-Cloud Shape Detection. Comput. Graph. Forum 2007, 26, 214–226. [Google Scholar] [CrossRef]
- Loh, W.-Y.; Shih, Y.-S. Split Selection Methods for Classification Trees. Stat. Sin. 1997, 7, 815–840. [Google Scholar]
- Manuel, A.; Véron, P.; De Luca, L. 2D/3D semantic annotation of spatialized images for the documentation and analysis of cultural heritage. In Proceedings of the 14th Eurographics Workshop on Graphics and Cultural Heritage, Genova, Italy, 5–7 October 2016; pp. 101–104. [Google Scholar]
- Manuel, A.; M’Dahri, A.A.; Abergel, V.; Rozar, F.; De Luca, L. A Semi-Automatic 2D/3D Annotation Framework for the Geometric Analysis of Heritage Artefacts. In Proceedings of the 2018 3rd Digital Heritage International Congress, Digital Heritage 2018, San Francisco, CA, USA, 26–30 October 2018; pp. 1–7. [Google Scholar]
Figure 1.
General overview of the proposed approach.
Figure 1.
General overview of the proposed approach.
Figure 2.
RGB (a) and intensity (b) values for the 3D point cloud of the Grand-Ducal Cloister dataset. The red line of figure (a) displays the area of integration with the UAV survey.
Figure 2.
RGB (a) and intensity (b) values for the 3D point cloud of the Grand-Ducal Cloister dataset. The red line of figure (a) displays the area of integration with the UAV survey.
Figure 3.
General workflow of the supervised machine learning framework.
Figure 3.
General workflow of the supervised machine learning framework.
Figure 4.
Examples of 3D shape features computed for the case study.
Figure 4.
Examples of 3D shape features computed for the case study.
Figure 5.
Structure of the 3D point cloud matrix. is the total number of detected points, is the number of geometric features and is the radius of the local neighborhood.
Figure 5.
Structure of the 3D point cloud matrix. is the total number of detected points, is the number of geometric features and is the radius of the local neighborhood.
Figure 6.
Manually annotated labels for the Grand-Ducal Cloister dataset 3D point cloud.
Figure 6.
Manually annotated labels for the Grand-Ducal Cloister dataset 3D point cloud.
Figure 7.
Predictor importance estimate.
Figure 7.
Predictor importance estimate.
Figure 8.
Annotated point cloud for combinations n. 2 (a) and n. 3 (b) and comparison of the two outputs (c).
Figure 8.
Annotated point cloud for combinations n. 2 (a) and n. 3 (b) and comparison of the two outputs (c).
Figure 9.
Confusion matrix for combination n. 2.
Figure 9.
Confusion matrix for combination n. 2.
Figure 10.
Confusion matrix for combination n. 3.
Figure 10.
Confusion matrix for combination n. 3.
Figure 11.
Selection of a subset of points to classify according to combination n. 3 rather than combination n. 2 (a) and resulting annotated point cloud (b).
Figure 11.
Selection of a subset of points to classify according to combination n. 3 rather than combination n. 2 (a) and resulting annotated point cloud (b).
Figure 12.
Scan-to-BIM process workflow. RANSAC—Random sample consensus.
Figure 12.
Scan-to-BIM process workflow. RANSAC—Random sample consensus.
Figure 13.
Extraction of single classes of architectural components.
Figure 13.
Extraction of single classes of architectural components.
Figure 14.
Label 7—Column shaft imported into Recap upfront (a) and later selected on the overall point cloud in Revit (b).
Figure 14.
Label 7—Column shaft imported into Recap upfront (a) and later selected on the overall point cloud in Revit (b).
Figure 15.
Label 5—Vault selected on the overall point cloud (a), then isolated (b) by acting on the visibility and graphic override parameters in Revit (c).
Figure 15.
Label 5—Vault selected on the overall point cloud (a), then isolated (b) by acting on the visibility and graphic override parameters in Revit (c).
Figure 16.
Selection of a single class (a), primitive fitting and shape detection (b), parametric object reconstruction and export to IFC format (c).
Figure 16.
Selection of a single class (a), primitive fitting and shape detection (b), parametric object reconstruction and export to IFC format (c).
Figure 17.
Reconstruction of parametric shapes in the general case, based on architectural treatises and constructive rules: column capital (a), column base (b), vaults (c).
Figure 17.
Reconstruction of parametric shapes in the general case, based on architectural treatises and constructive rules: column capital (a), column base (b), vaults (c).
Figure 18.
Two views of the parametric model obtained in Revit.
Figure 18.
Two views of the parametric model obtained in Revit.
Figure 19.
Examples of classes of parametric shapes displayed over the parametric model: Class 6—Column capital (a); Class 11—Window (b); Class 15—Buttress capital (c). The original point cloud is also shown over the H-BIM model.
Figure 19.
Examples of classes of parametric shapes displayed over the parametric model: Class 6—Column capital (a); Class 11—Window (b); Class 15—Buttress capital (c). The original point cloud is also shown over the H-BIM model.
Figure 20.
Insertion of further localized information on the parametric model.
Figure 20.
Insertion of further localized information on the parametric model.
Figure 21.
Visual correspondence between annotated point cloud (a) and reconstructed H-BIM model (b) in terms of semantic segmentation.
Figure 21.
Visual correspondence between annotated point cloud (a) and reconstructed H-BIM model (b) in terms of semantic segmentation.
Figure 22.
Point cloud displayed over the reconstructed parametric model.
Figure 22.
Point cloud displayed over the reconstructed parametric model.
Table 1.
Geometric features considered [
66].
Table 1.
Geometric features considered [
66].
| Feature Name | Expression |
|---|
| Linearity | | (4) |
| Planarity | | (5) |
| Sphericity | | (6) |
| Omnivariance | | (7) |
| Eigenentropy | | (8) |
| Surface variation | | (9) |
| Sum of eigenvalues | | (10) |
| Anisotropy | | (11) |
| Verticality | | (12) |
Table 2.
Comparison of recall, precision, F-measure and overall accuracy for the 5 feature combinations after 5-fold cross validation. The x sign indicates the features chosen per each combination.
Table 2.
Comparison of recall, precision, F-measure and overall accuracy for the 5 feature combinations after 5-fold cross validation. The x sign indicates the features chosen per each combination.
| Combination n. | Geometric Features | Z-Coordinate | RGB | Intensity | Avg. Precision | Avg.
Recall | Avg. Overall Accuracy | Avg.
F-Measure |
|---|
| 1 | x | - | - | - | 97.83% | 98.14% | 99.20% | 97.98% |
|
2
|
x
|
x
|
-
|
-
|
98.73%
|
98.90%
|
99.50%
|
98.81%
|
| 3 | x | x | x | - | 98.56% | 98.79% | 99.40% | 98.68% |
| 4 | x | x | - | x | 98.54% | 98.77% | 99.40% | 98.65% |
| 5 | x | x | x | x | 98.47% | 98.47% | 99.40% | 98.61% |
Table 3.
Precision, recall and F-measure broken down by each class for combinations n. 2 and n. 3.
Table 3.
Precision, recall and F-measure broken down by each class for combinations n. 2 and n. 3.
| Classes | Combination n. 2
Geometric Features + Z | Combination n.3
Geometric Features + Z + RGB |
|---|
| | | Precision | Recall | F-Measure | Precision | Recall | F-Measure |
|---|
| 1—Roof | | 99.04% | 99.33% | 99.18% | 99.01% | 99.15% | 99.08% |
| 2—Roof moldings | | 99.45% | 99.18% | 99.31% | 99.28% | 99.14% | 99.21% |
| 3—Façade | | 99.75% | 99.60% | 99.67% | 99.72% | 99.56% | 99.64% |
| 4—Arch 1st floor | | 96.88% | 98.10% | 97.49% | 96.51% | 97.80% | 97.15% |
| 5—Vaults | | 99.50% | 99.73% | 99.62% | 99.50% | 99.74% | 99.62% |
| 6—Column capital | | 97.76% | 98.33% | 98.05% | 97.46% | 97.88% | 97.67% |
| 7—Column shaft | | 99.97% | 99.97% | 99.97% | 99.94% | 99.94% | 99.94% |
| 8—Column base | | 98.75% | 99.35% | 99.05% | 98.19% | 99.09% | 98.64% |
| 9—Sill | | 99.54% | 99.15% | 99.34% | 99.37% | 99.17% | 99.27% |
| 10—Window frame | | 95.05% | 95.04% | 95.04% | 94.52% | 95.50% | 95.01% |
| 11—Window | | 98.04% | 97.98% | 98.01% | 98.15% | 97.71% | 97.93% |
| 12—Pavement | | 99.94% | 99.92% | 99.93% | 99.93% | 99.91% | 99.92% |
| 13—Arch ground floor | | 98.68% | 98.70% | 98.69% | 98.54% | 98.10% | 98.32% |
| 14—Buttress shaft | | 99.80% | 99.85% | 99.82% | 99.76% | 99.88% | 99.82% |
| 15—Buttress capital | | 97.43% | 97.91% | 97.67% | 97.24% | 98.09% | 97.66% |
| 16—Base | | 98.97% | 99.29% | 99.13% | 98.68% | 99.03% | 98.85% |
| 17—Ground | | 99.89% | 99.87% | 99.88% | 99.86% | 99.81% | 99.83% |
| Average values | | 98.73% | 98.90% | 98.81% | 98.57% | 98.79% | 98.68% |
| Publisher’s Note: MDPI stays neutral with regard to jurisdictional claims in published maps and institutional affiliations. |
© 2021 by the authors. Licensee MDPI, Basel, Switzerland. This article is an open access article distributed under the terms and conditions of the Creative Commons Attribution (CC BY) license (http://creativecommons.org/licenses/by/4.0/).


 ,
, 


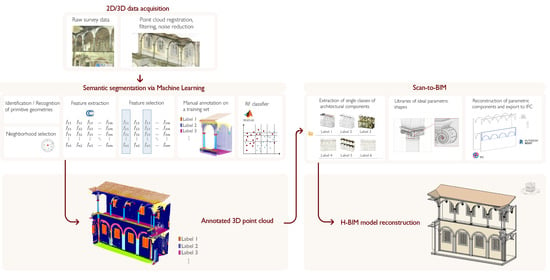


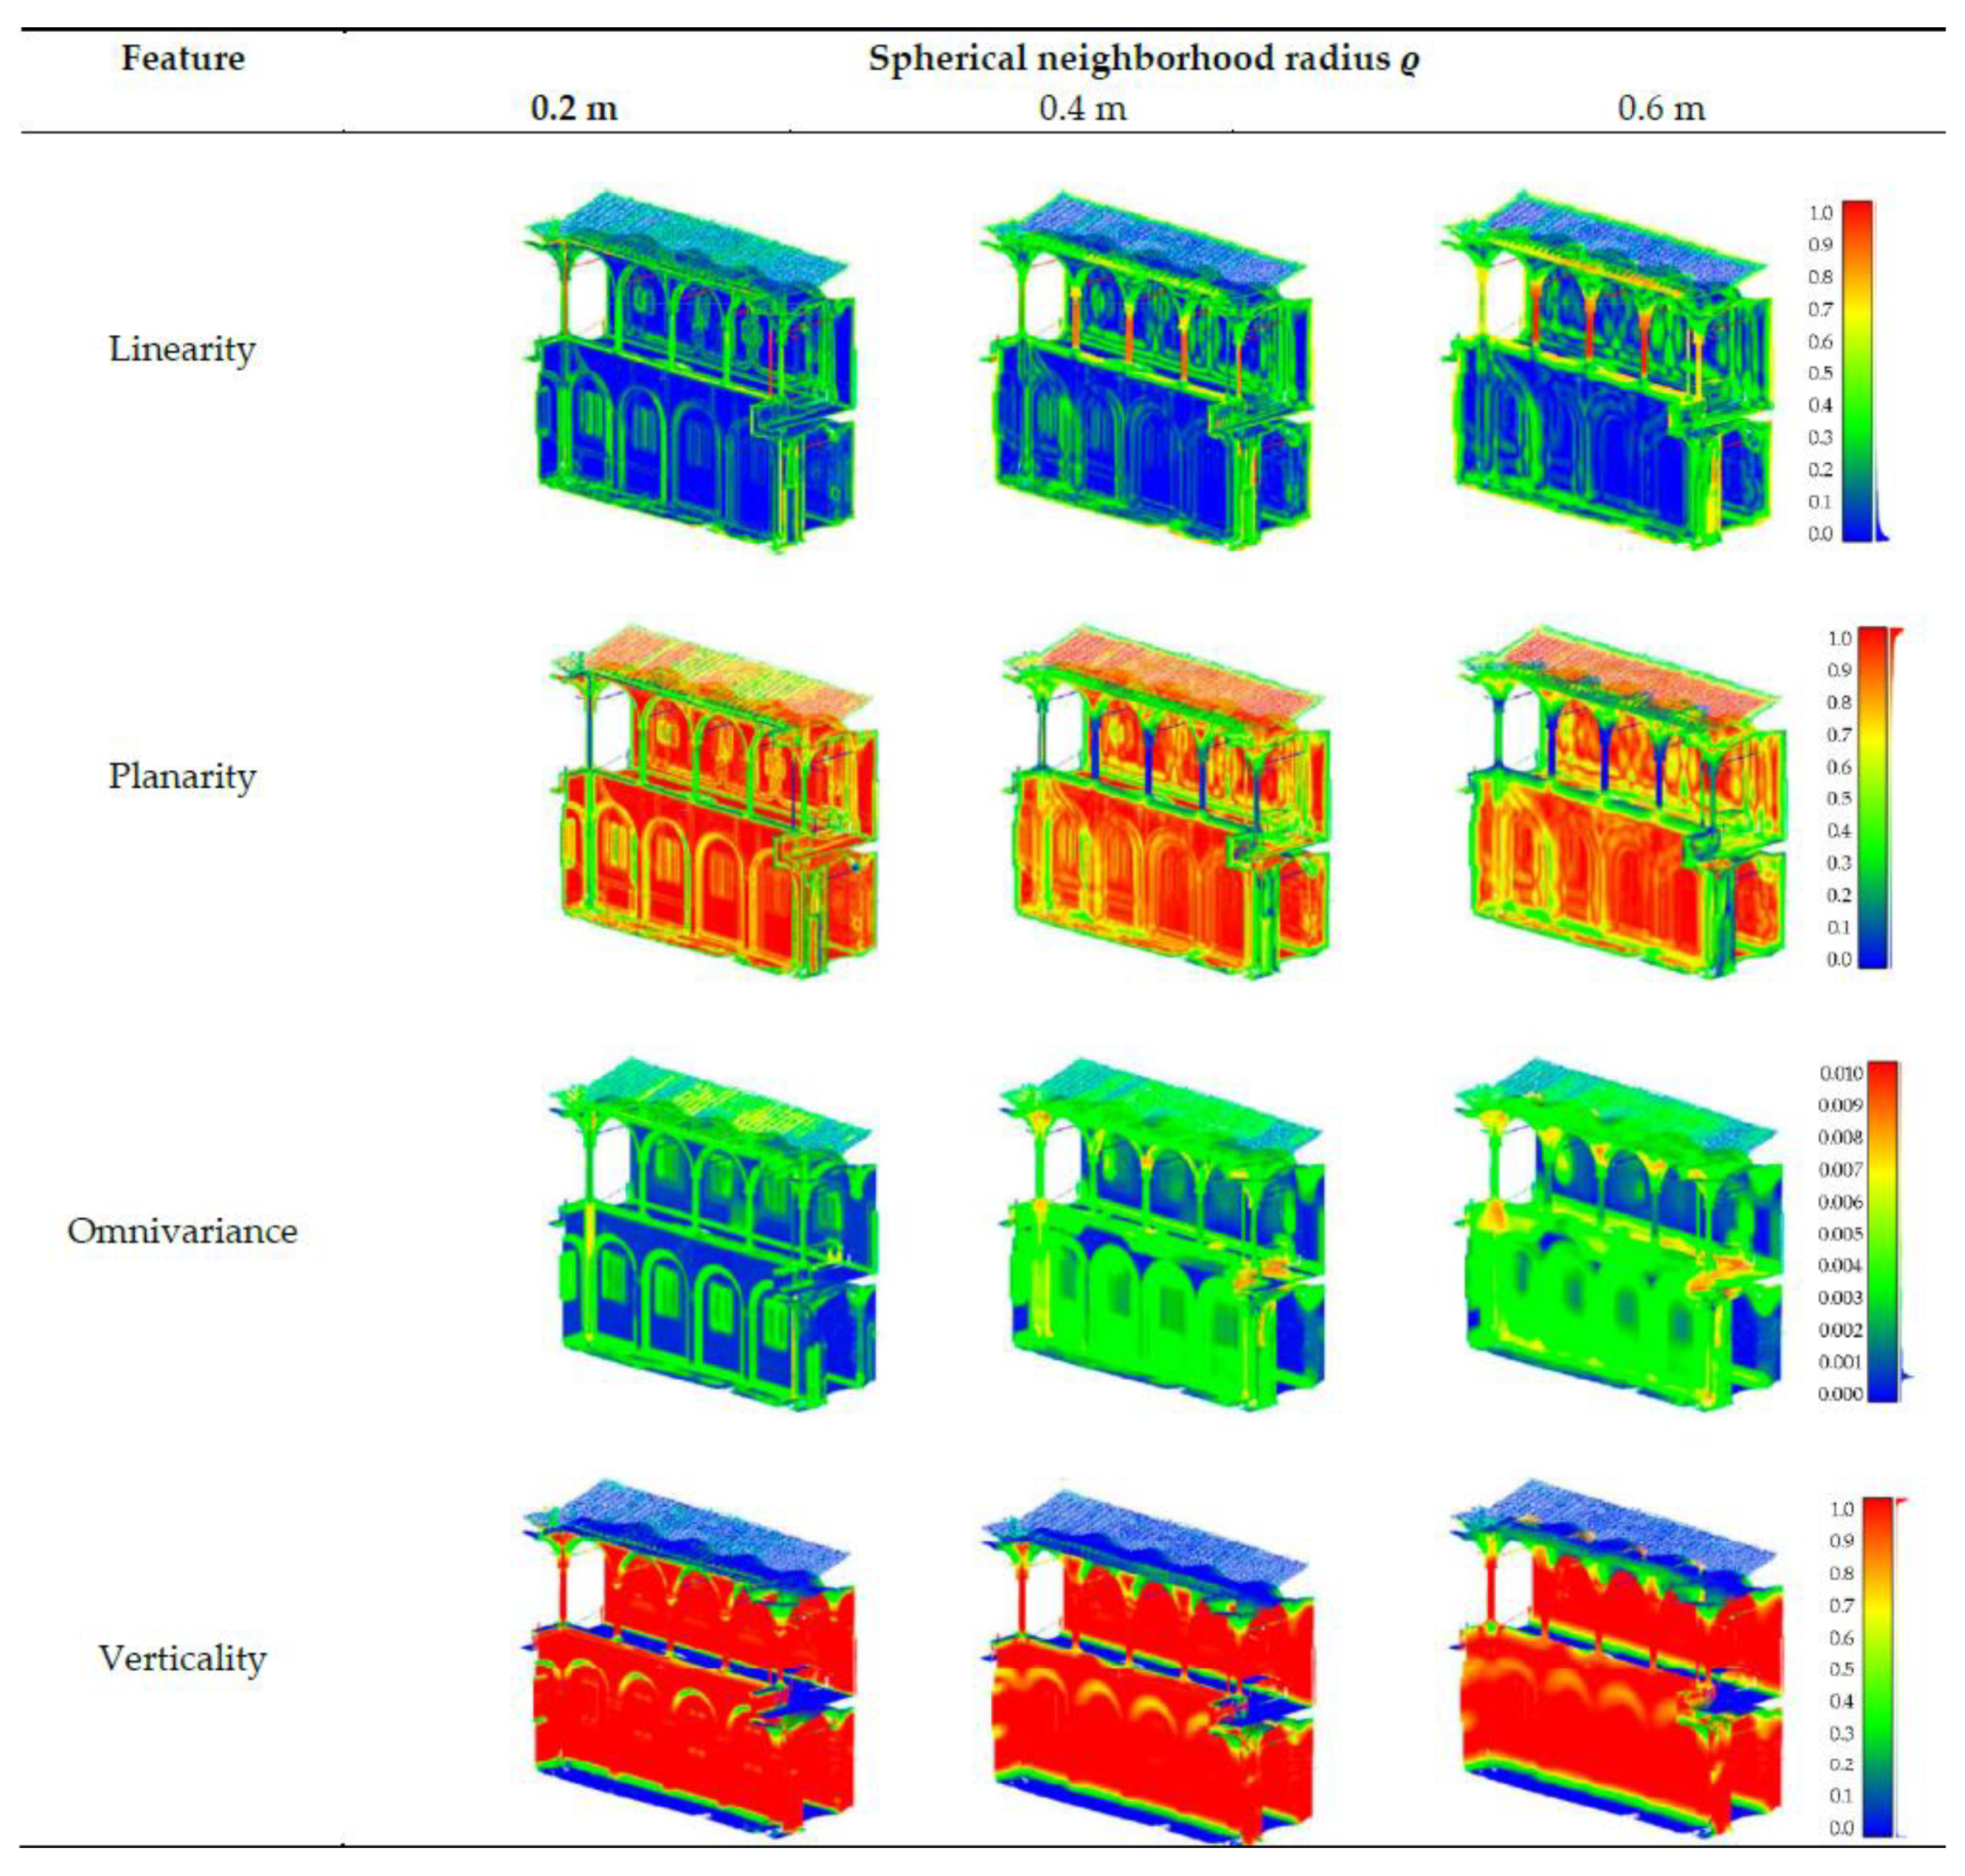
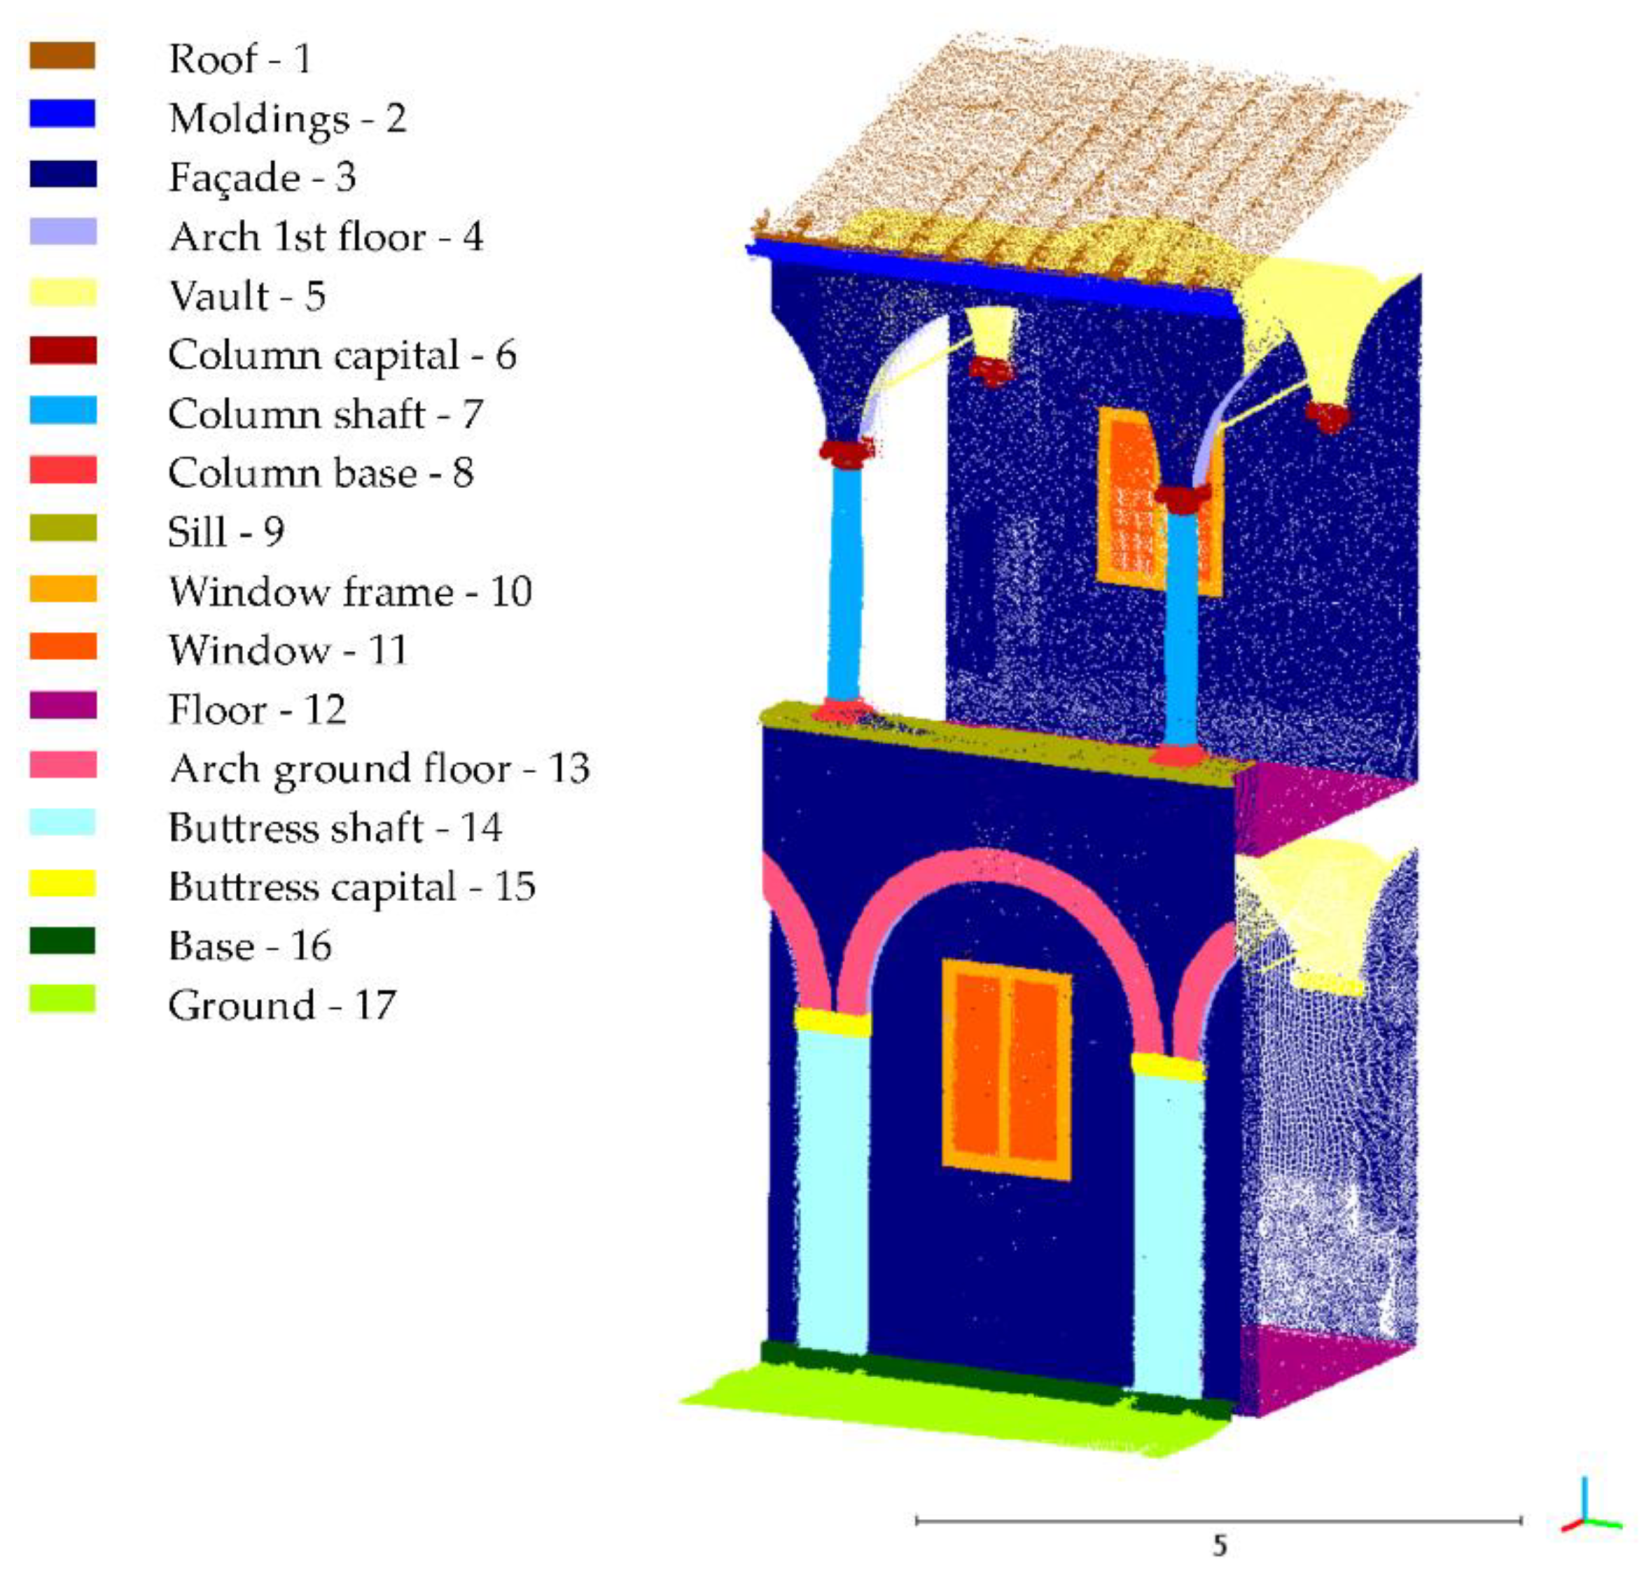
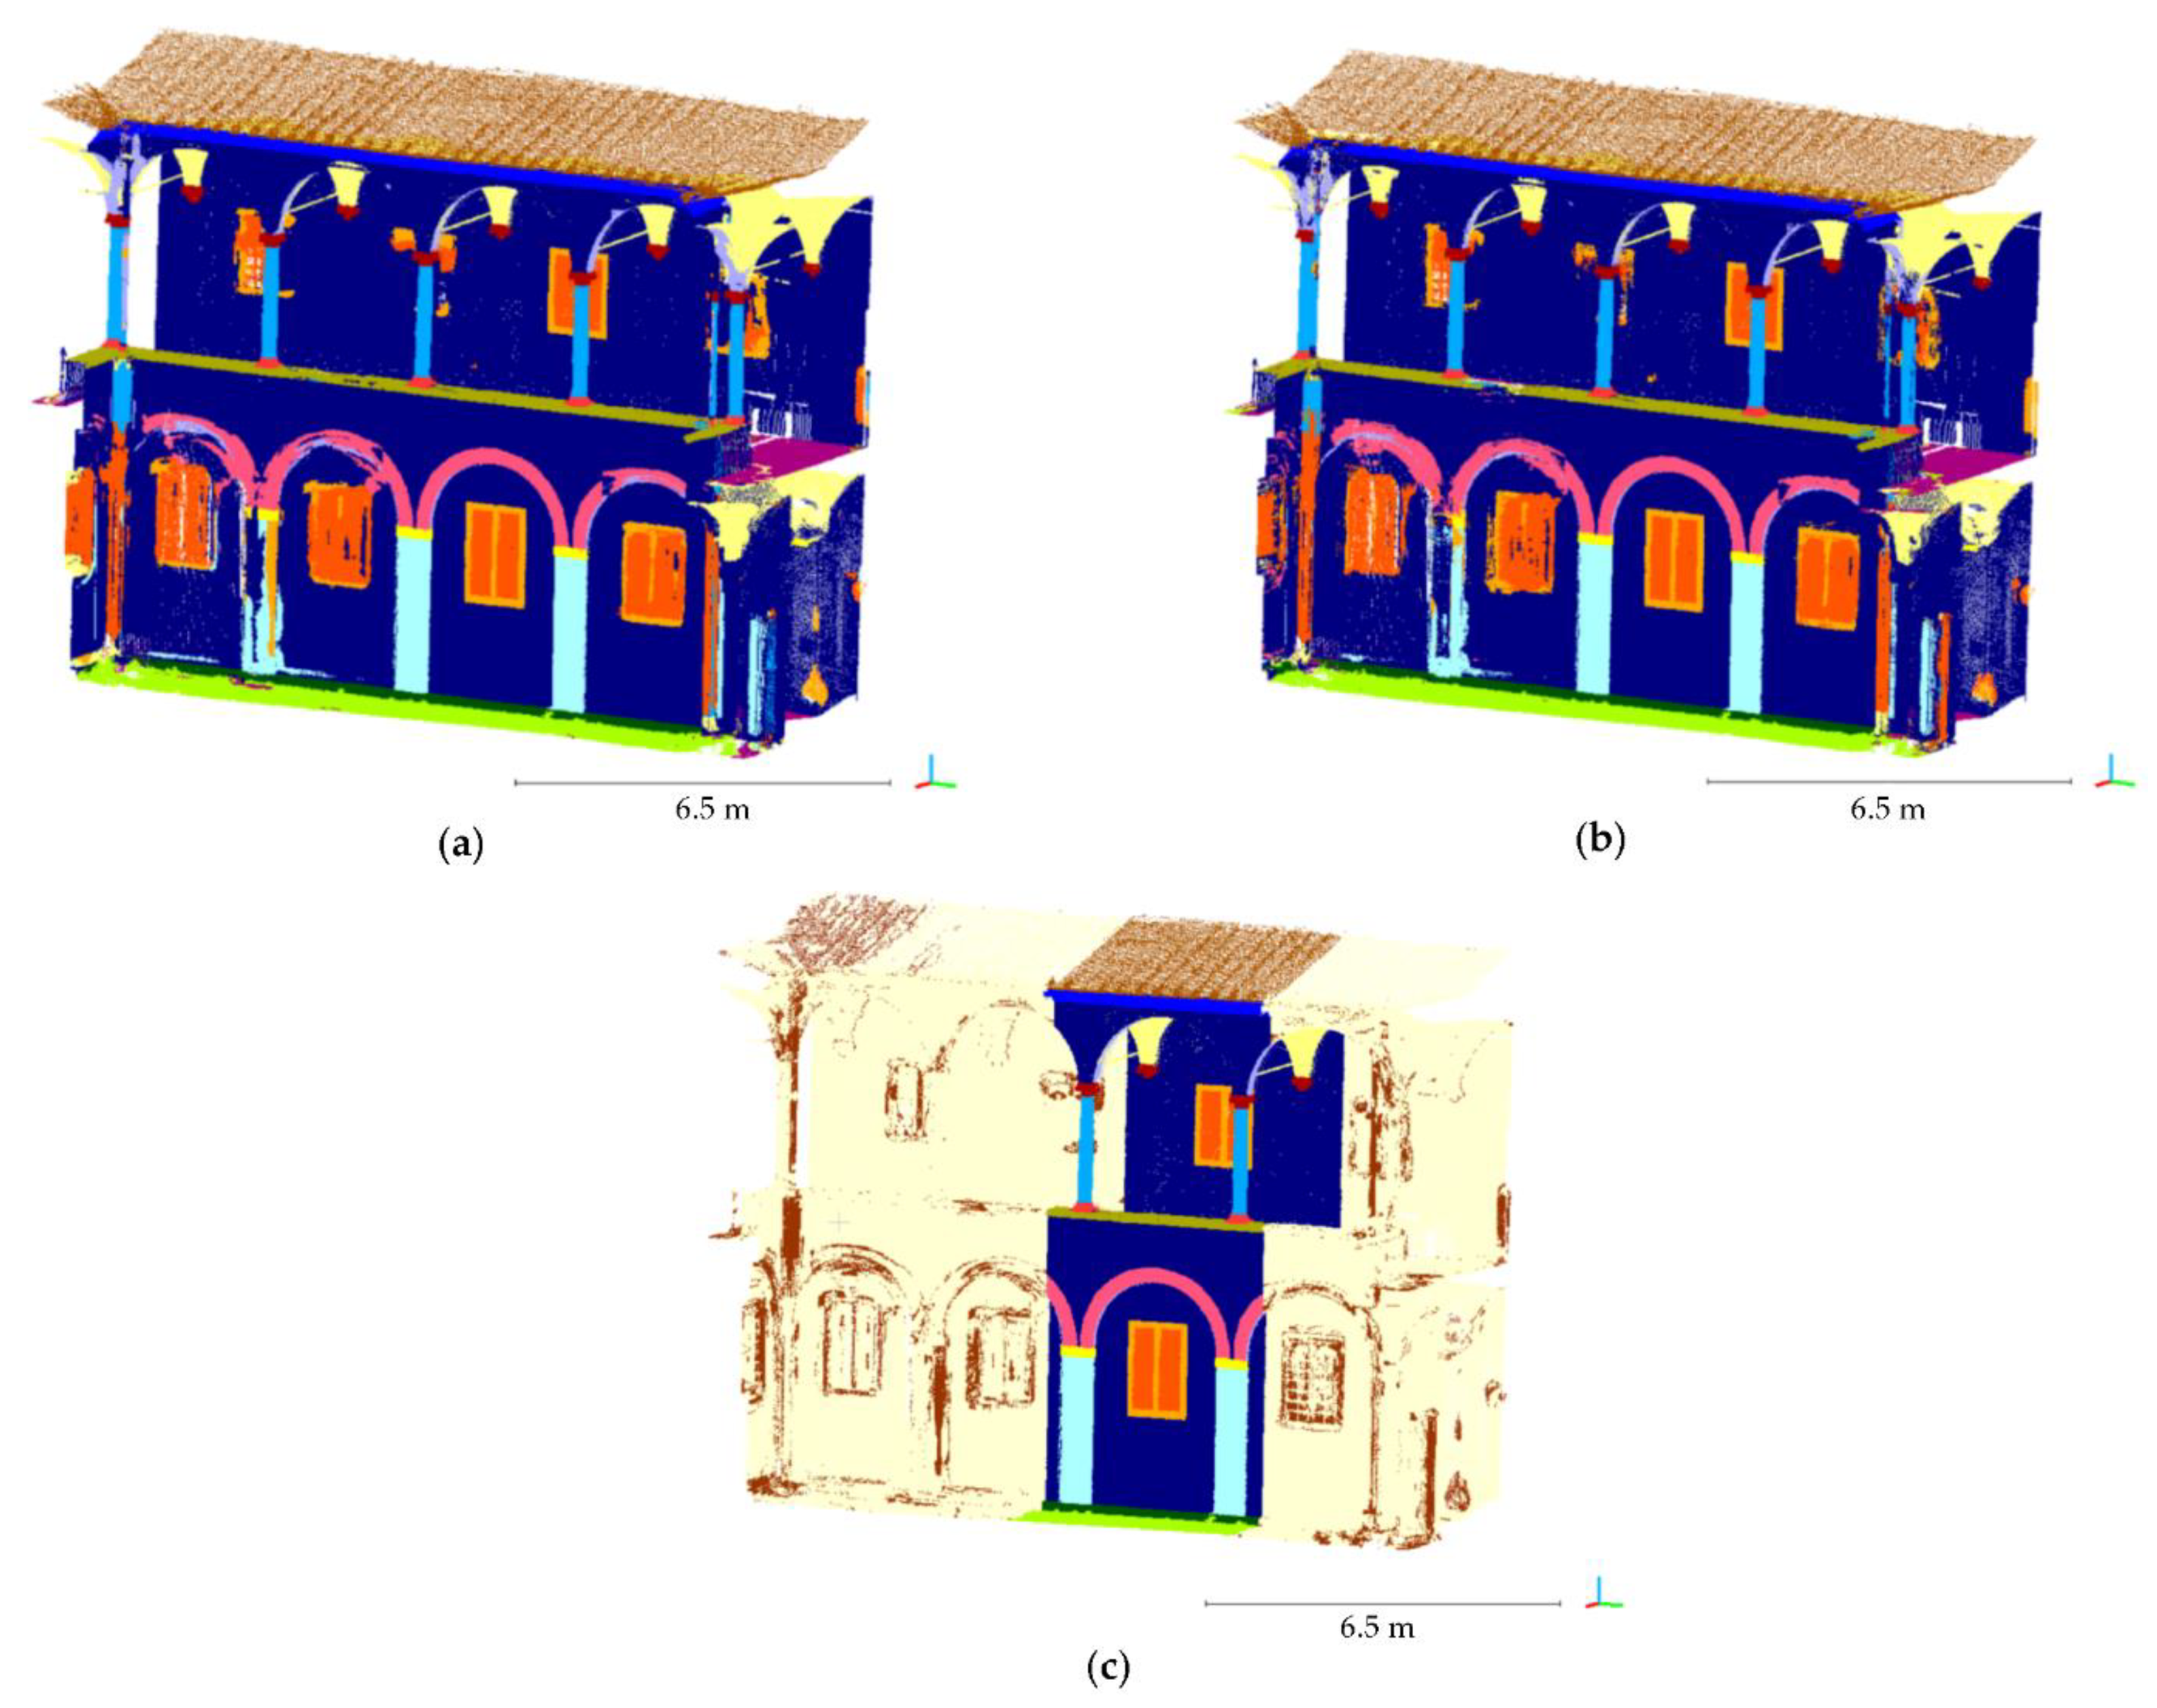
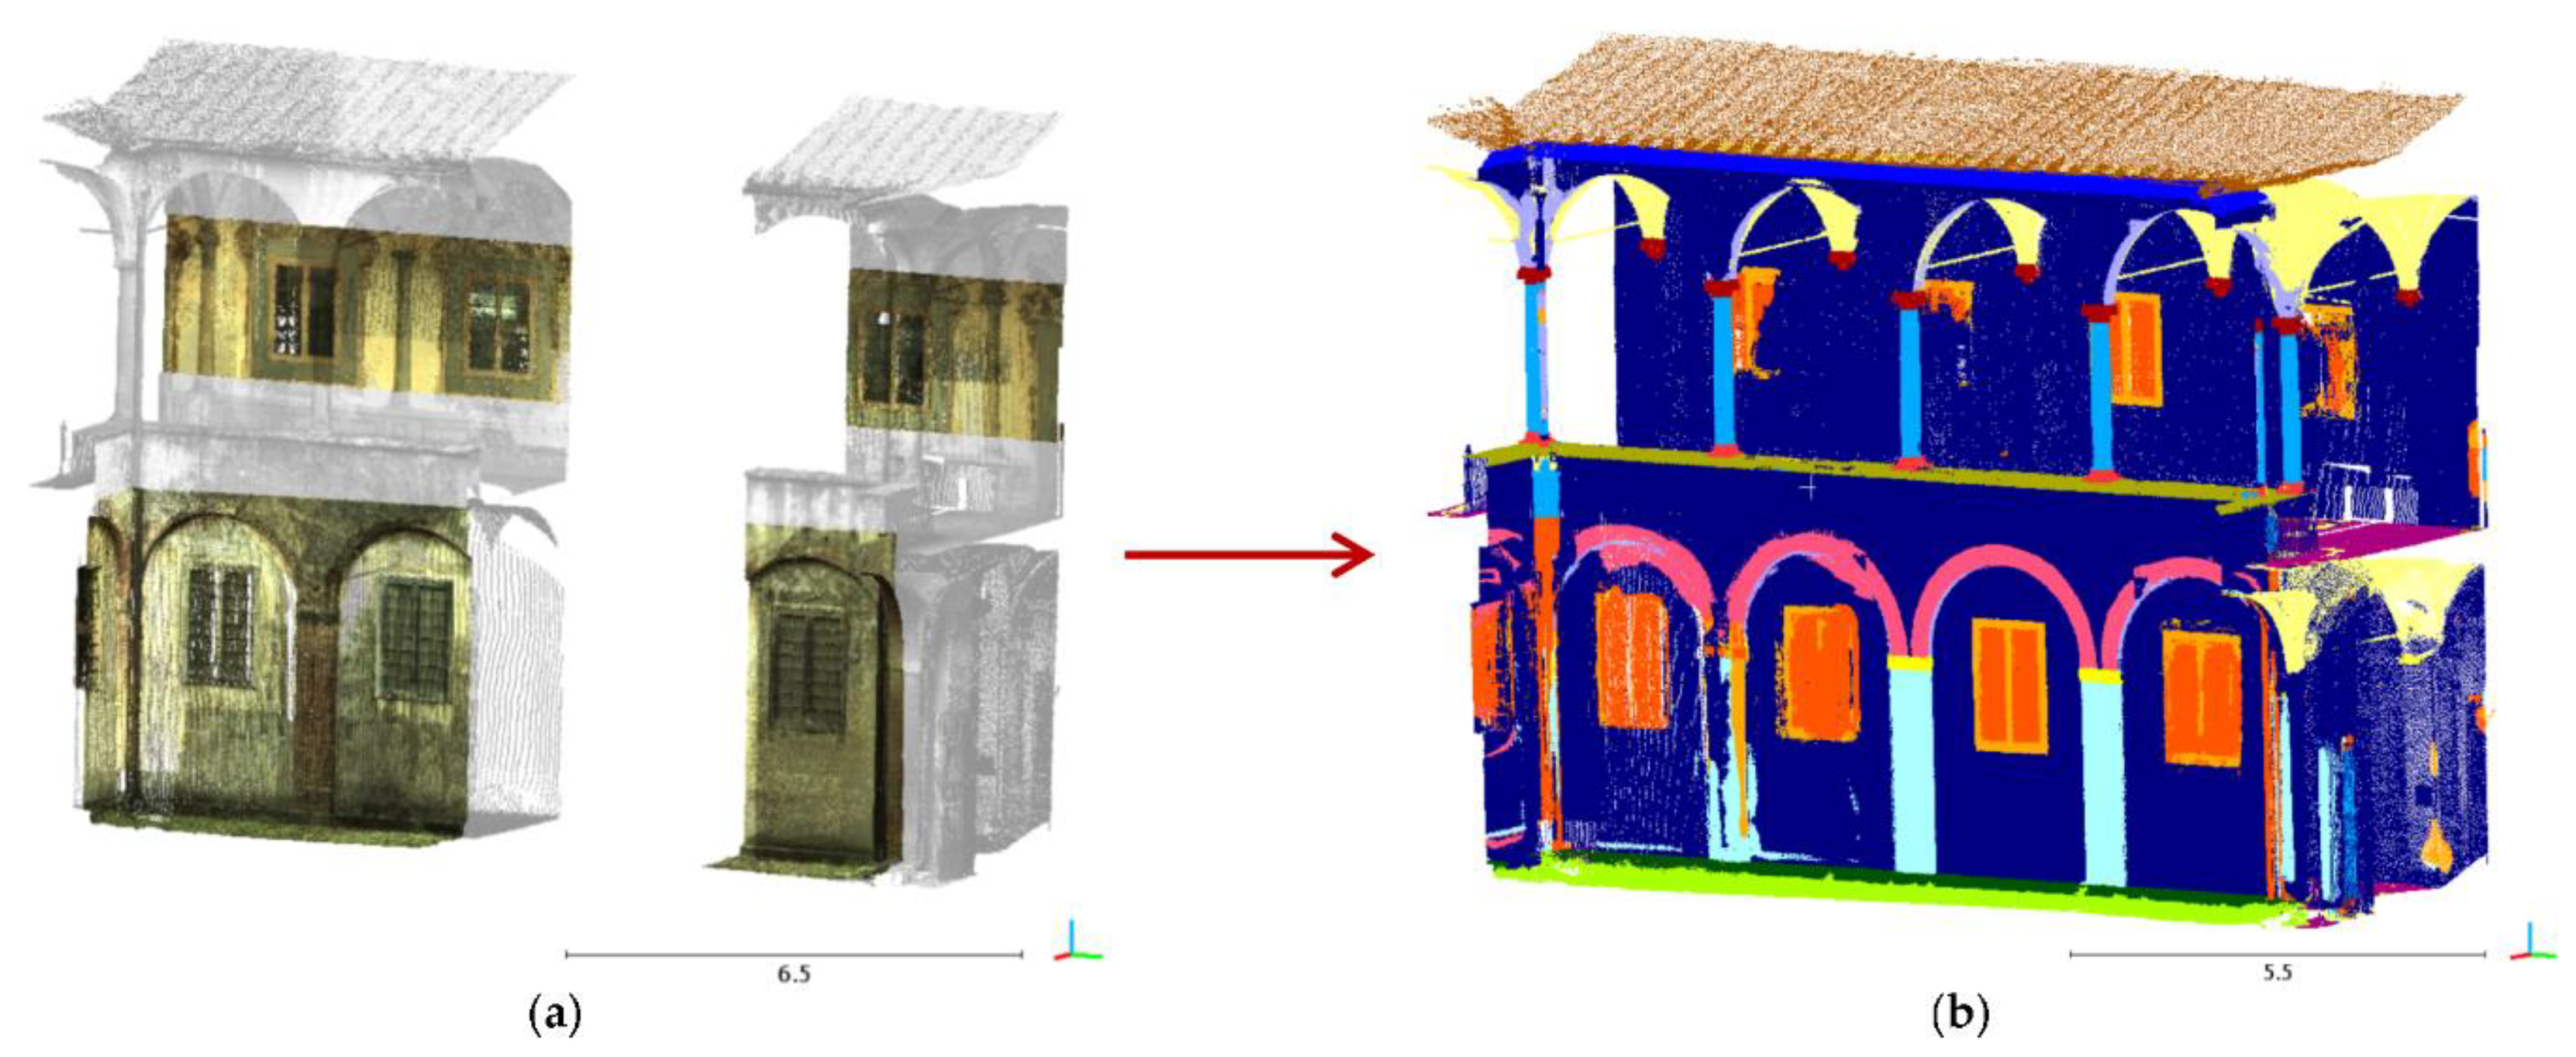
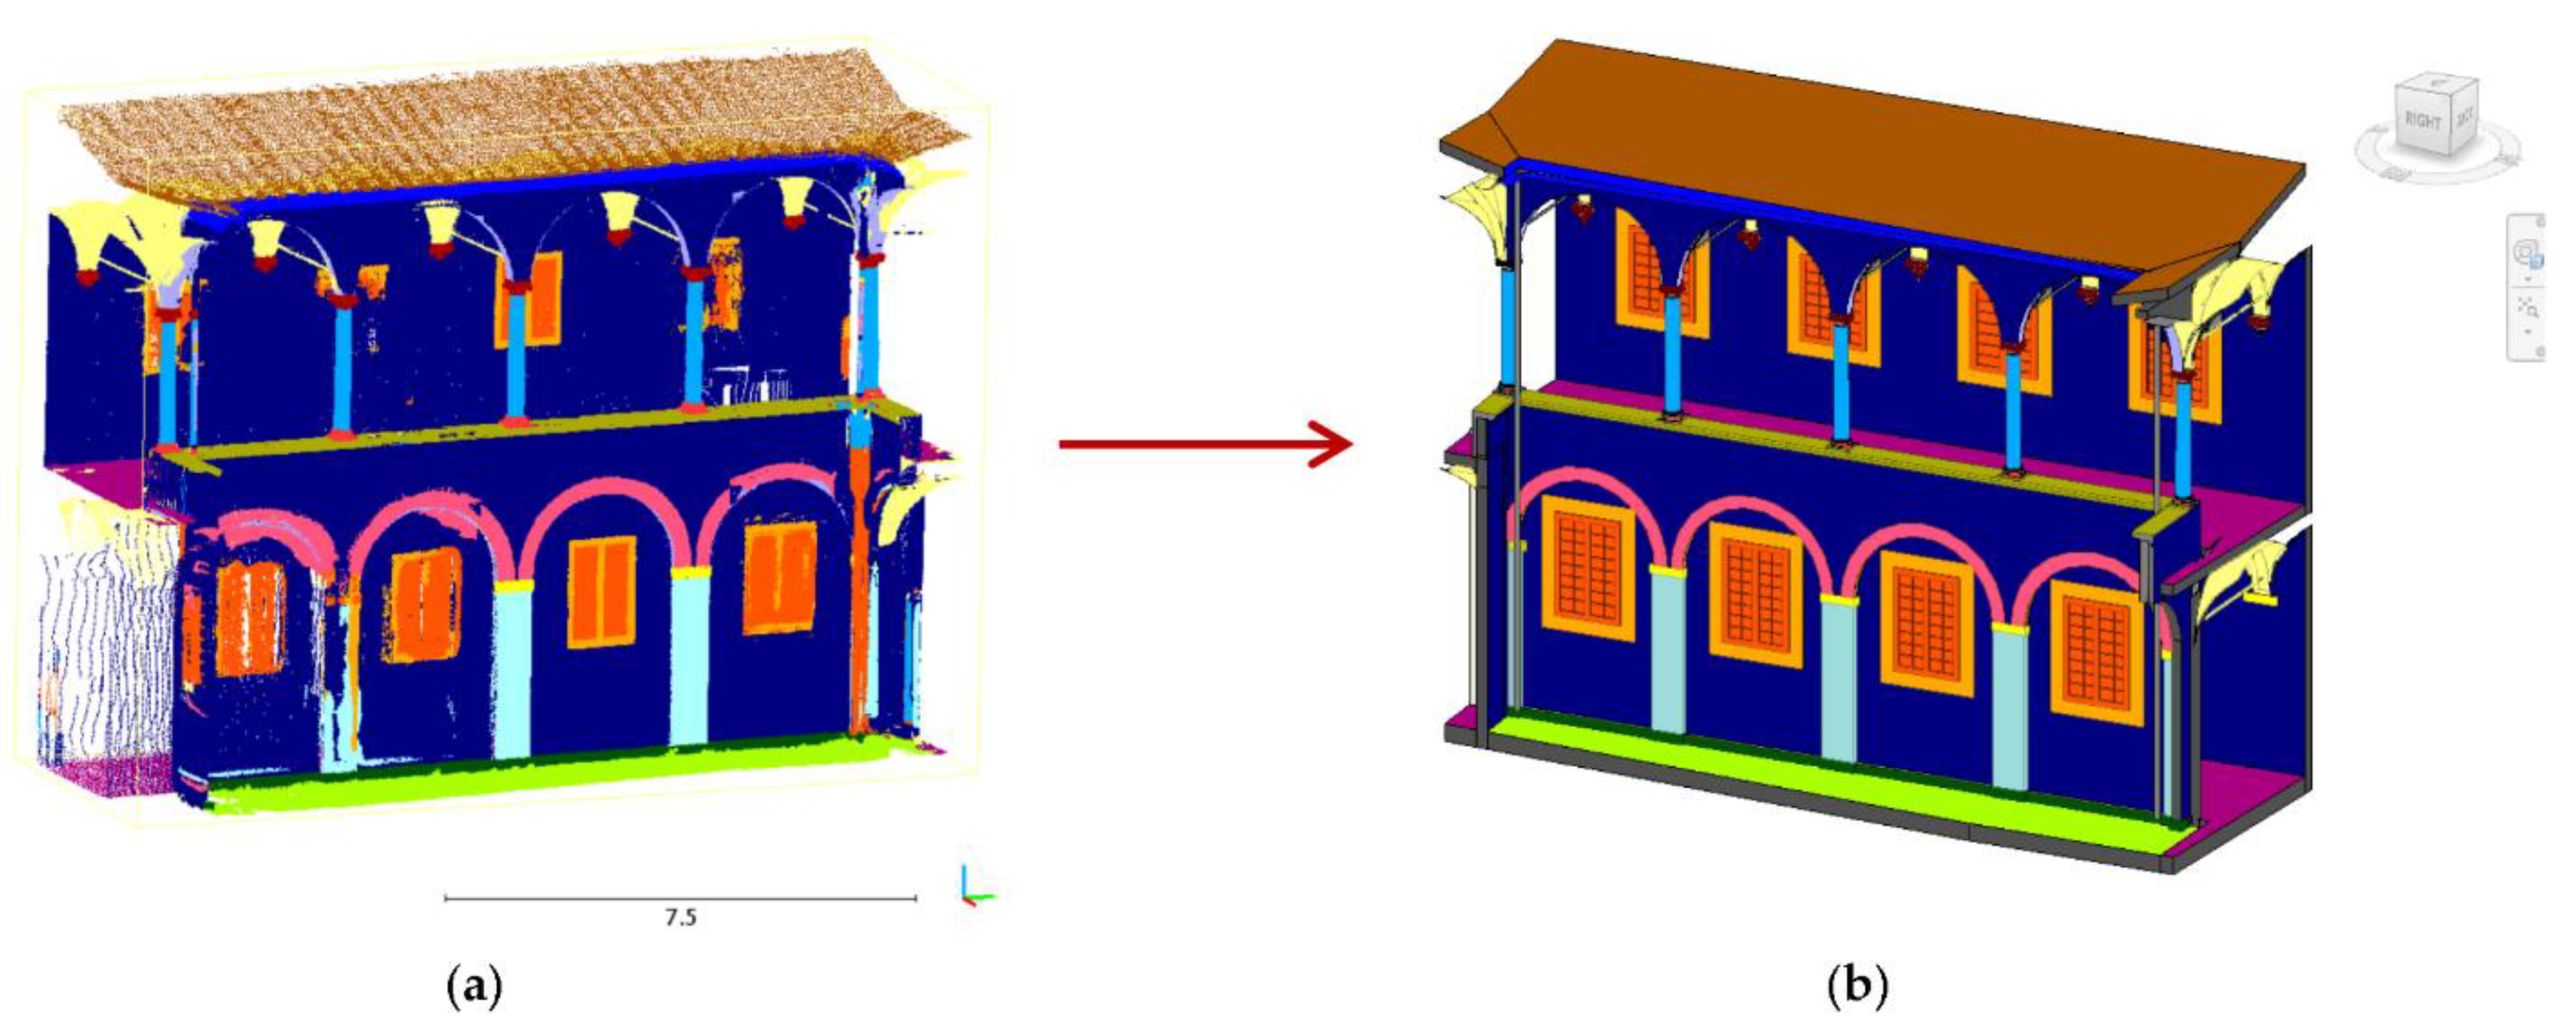