Abstract
Low-cost and fast surveying approaches are increasingly being deployed in several domains, including in the field of built heritage documentation. In parallel with mobile mapping systems, uncrewed aerial systems, and simultaneous location and mapping systems, 360° cameras and spherical photogrammetry are research topics attracting significant interest for this kind of application. Although several instruments and techniques can be considered to be consolidated approaches in the documentation processes, the research presented in this manuscript is focused on a series of tests and analyses using 360° cameras for the 3D metric documentation of a complex environment, applied to the case study of a XVIII century belltower in Piemonte region (north-west Italy). Both data acquisition and data processing phases were thoroughly investigated and several processing strategies were planned, carried out, and evaluated. Data derived from consolidated 3D mapping approaches were used as a ground reference to validate the results derived from the spherical photogrammetry approach. The outcomes of this research confirmed, under specific conditions and with a proper setup, the possibility of using 360° images in a Structure from Motion pipeline to meet the expected accuracies of typical architectural large-scale drawings.
1. Introduction
The documentation of built heritage and, in general, of cultural heritage, is a complex process that poses a series of issues and that has specific rules and requirements [1,2,3]. Each heritage asset has its own specific features and, depending on its state of conservation and the knowledge process status, the documentation project is characterized by a tailored structure and organization. The documentation of a heritage asset is, or at least should always be, the first phase of the knowledge process, and thus it is crucial to take into account several aspects that contribute and influence its survey. The first aspect to consider relates to the final expected accuracy of the derived metric products and their level of detail, which also depends on the specific goal of the subsequent analyses carried out by different research areas with different expertise [4,5].
Furthermore, time and cost are two other factors that highly influence the design of a documentation project (not only in the built heritage field). Resources and time available both in the field and in the post-processing, analysis, and interpretation phases have a significant impact on the overall design of the heritage documentation [6].
Considering the requirements of the multi- and inter-disciplinary approach that is most often required for a complete knowledge process, the design of the survey output products should be carefully considered and evaluated a priori, with a two-fold goal: (i) to maximize the engagement of all of the experts involved in the knowledge process and (ii) to ensure the required information will be embedded in the survey output products [7,8].
Finally, a crucial step in the documentation process of built heritage is connected with its dissemination, which can be fostered by highly informative survey products [9,10].
It is thus crucial to consider the aforementioned aspects when choosing the techniques and the instruments to be deployed in the field when designing the documentation process of a heritage asset.
Fast surveying approaches have raised new interest in the operators working in the field of heritage documentation and their adoption has widely grown in recent years due to their flexibility, ease of deployment, and low cost.
All of these elements are even more important if the object to be documented is represented by a complex environment, such as the one used as the case study in this research. This paper focuses on the experience of documenting a complex architectural heritage asset, exploiting experimental approaches together with more consolidated practices (that serve as a ground reference to validate the proposed methodology), i.e., traditional topographic techniques, terrestrial laser scanner (TLS), uncrewed aerial systems (UAS), 360° cameras, and spherical photogrammetry (SP), and a handheld scanner based on simultaneous localization and mapping (SLAM) algorithms.
UAS and TLS are currently considered to be consolidated and widespread methods, and a rich literature is available on their use for heritage documentation. For a review on the state of the art in the use of UAS for the documentation of archaeological heritage, it is possible to refer to [11], whereas wider analyses on the use of UAS for cultural heritage documentation are reported in [12,13] and in [14], where ultra-light UAS are tested for the documentation of both archaeological and architectural sites. In [15], the combination of UAS photogrammetry and TLS is tested and evaluated for the documentation of an heritage site; this is also presented in [16]. Further information concerning the use of TLS for the documentation of cultural heritage can be found in [17,18].
By comparison, SP and SLAM systems for heritage documentation, despite representing a research topic of high interest, are two approaches that still present open issues and need to be further investigated and validated. Experiences on the use of spherical cameras for the documentation of cultural heritage can be found in [19,20,21], and tests and analyses on the deployment of SLAM systems are presented in [22,23,24,25]. The advantages and disadvantages of these techniques are clearly described in the cited references, highlighting the possibility of an integrated multi-sensor approach for built heritage surveying.
Among these different sensors and techniques, the focus of the research reported in the following sections is the use of 360° cameras and SP, which can be considered a less consolidated approach among those currently adopted for cultural heritage documentation.
360° Cameras and Spherical Photogrammetry
Two approaches can be followed for the photogrammetric use of spherical images:
- The one mainly developed by the Università Politecnica delle Marche under the direction of Prof Gabriele Fangi and commonly defined as multi-image spherical photogrammetry, panoramic spherical photogrammetry, or spherical photogrammetry.
- The evolution of the first approach due to the developments of Structure from Motion (SfM) algorithms.
The first approach is well described in the literature [26,27,28,29] and the development of this methodology was mainly related to the idea of exploiting the advantages of spherical images: low-cost, rapid, and complete coverage of the acquired imagery. This method can be described as an analytical approach for the processing of spherical images in an equirectangular projection and its workflow is well described and summarized in [28].
Due to the development of SfM algorithms, 360° images gained new popularity in recent years and became a research topic that has been well exploited by several authors [30,31,32,33,34,35], who investigated the different issues associated with using this type of image in a SfM-based workflow.
In this manuscript, the latter approach is referred to as spherical photogrammetry.
2. Materials and Methods
2.1. Case Study
The municipality of Montanaro (Figure 1) is located 30 km northwest of Turin (Piemonte region, Italy) and hosts the Santa Marta belltower, a valuable built heritage asset designed by Bernardo Antonio Vittone, and built between 1769 and 1772.
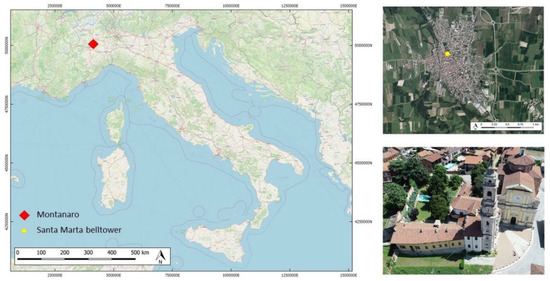
Figure 1.
Montanaro location in Italy (OSM basemap, © OpenStreetMap contributors), location of Santa Marta belltower in Montanaro, and an aerial view of the belltower.
The main peculiarity of these complex of buildings is that they represent a unique built heritage designed by a single architect, Bernardo Antonio Vittone. These structures are built around the belltower, the fulcrum of the composition, and are the town hall, the brotherhood of S. Marta, and the parish church. The project of Vittone well represents the ideal integration between the secular community and the sacred space in an XVIII century municipality [36]. The belltower is approximately 48 m high; it becomes slender in the progression toward the top and has a peculiar internal spiral stairway made of stone.
2.2. Data Acquisition
2.2.1. Topographic Network and Control Points
Following the consolidated operative practice, the first operation in the field was the creation and measurement of a network of vertices to properly define a reference system supporting the subsequent phases of data acquisition, processing, and metric control. The height of the tower, the proximity of surrounding buildings, and the limited availability of locations that granted good satellite visibility were all elements that influenced the design and setup of the topographic network. Five vertices were materialized in the square in front of the tower and three in intermediate floors (also allowing the measurement of indoor ground control points). Due to the conformation of the urban area near the tower, it was possible to adopt a Global Navigation Satellite System (GNSS) static technique only for two vertices in front of the tower, whereas each of the five vertices were measured with a total station. Nevertheless, to georeference the network to the ETRF2000 UTM Zone 32N cartographic system, the GNSS data measured in the field were combined with the observations from the network of Continuously Operating Reference Stations (CORS), allowing a more robust and precise computation of the vertices’ coordinates. To complete this operation, the data from the CORS of the interregional positioning service SPIN3 of Piemonte, Lombardia, and Valle d’Aosta [37] were used. Specifically, the permanent stations of Torino, Crescentino, and Cuorgnè were employed.
A representation of the topographic network is shown in Figure 2b, together with the position of the CORS used to compute the coordinates of the two vertices measured by the GNSS in the field, Figure 2a.
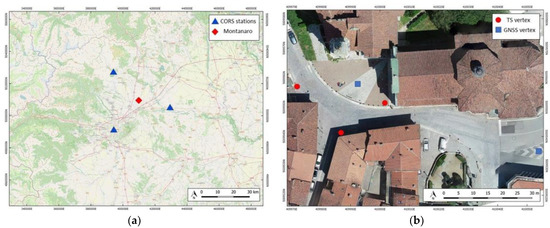
Figure 2.
Position of three CORS of the SPIN3 GNSS network (a) used to georeference the topographic network established in Montanaro (b), where two out of the five vertices were also acquired with GNSS static technique.
The second phase of fieldwork was the positioning/selection and measuring of several ground control points to be used for the subsequent data processing and data validation phases. Ground control points were represented both by an artificial paper coded target positioned directly on the wall’s surface or by readily identifiable natural features. These were measured on both the exterior and interior part of the belltower to ensure a good connection between indoor and outdoor, and to grant good metric control of the indoor data acquisitions.
A total of 99 ground control points with centimetric accuracy were measured with traditional topographic techniques by means of single side shots from a total station: 67 points outdoor and 32 points indoor (the spatial distribution of ground control points is shown in Figure 3). For the topographic survey, two Geomax Zenith 35 GNSS receivers and a Leica Viva MS total station were used.
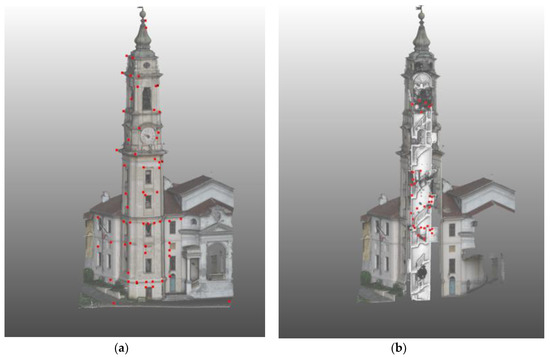
Figure 3.
Position of ground control points (red squares) represented on two 3D views of the Montanaro belltower. A total of 99 control points were measured: 67 on the exterior of the tower (a) and 32 indoor (b).
2.2.2. Uncrewed Aerial Systems (UAS)
The UAS acquisition performed in Montanaro was previously described and analyzed in another published work [38]. For the purposes of this research, these data were used to integrate and partially validate the other datasets, and for the sake of completeness and easy reference a short description of their acquisition and processing is reported hereafter. Data derived from the UAS acquisition were crucial to verify the congruence and accurate connection between the indoor and outdoor datasets, particularly on the belltower windows.
A DJI Phantom 4 Pro was used for the acquisition [39] (mechanical shutter camera equipped with a 1” CMOS 20 MP sensor, multi-frequency, and multi-constellation GNSS receiver) and, due to the urban conformation and the type of acquisitions to be completed, the flights were manually executed. For each façade, images were acquired starting from the ground and moving to the top of the tower, and an average object-sensor distance of 5 m was maintained. Both nadiral (optical axis perpendicular with respect to the façade average plane) and oblique (optical axis at 45° with respect to the façade) images were acquired for each façade. The same acquisition scheme (Figure 4) was replicated for each of the four edges of the belltower; a total number of 543 images were captured with an expected GSD of 3 mm.
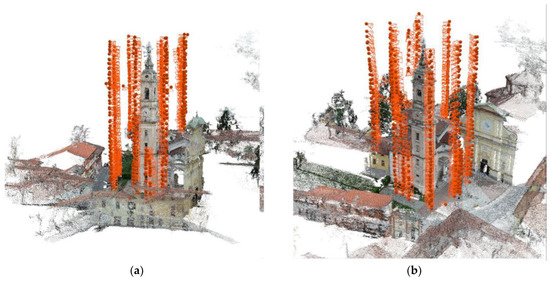
Figure 4.
UAS acquisition scheme for the Santa Marta belltower, south view (a) and west view (b). Camera positions are represented by the orange spheres.
2.2.3. Terrestrial Laser Scanner (TLS)
Acquisitions with TLS were used as a ground reference for the other datasets and were not designed as a complete survey of the belltower, because it would have been highly time consuming due to the conformation of the environment. A Faro Focus3D X 330 TLS was used (the main specifications are reported in Table 1), and scans were acquired in two different fieldwork phases.

Table 1.
Faro Focus3D main technical specifications.
The first TLS acquisitions covered the exterior part of the belltower, including several scans of the ground floor, whereas the second acquisition covered the interior of the belltower.
During the first campaign, eleven scans were acquired (Figure 5a); in the second campaign, seven scans were acquired (Figure 5b).
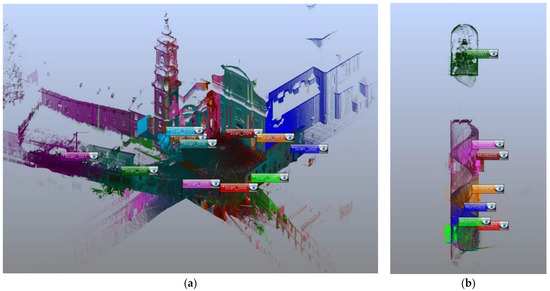
Figure 5.
TLS acquisitions (in different colors). The first campaign covered the outdoor of the belltower (a) while the second campaign covered the indoor (b).
2.2.4. Simultaneously Localization and Mapping (SLAM)
During the fieldwork, other range-based acquisitions were performed with a ZEB Revo RT [40,41]. Despite representing a relatively new technology and not being as consolidated as TLS, this system has proven to be suitable for heritage documentation, at least at some representational scales [22,42,43]. Mobile mapping systems (MMS) and, more specifically, those based on SLAM algorithms, have been a popular topic in geomatics research in recent years. Data collected in the field with the ZEB Revo RT were validated in previous research [38] and were fundamental, together with the UAS data, for the delivery of the 2D architectural drawings supporting the restoration projects of the belltower. They were used in this work as a fast-surveying approach comparable to the SP methodology in terms of acquisition time; in this scenario, one of the specific objectives of this research was to evaluate if they are also comparable in terms of accuracy and completeness of information.
Four acquisitions with this system were thus carried out, following closed paths as suggested by the SLAM data acquisition best practices [44]. The limited interior size of the tower and the narrow space available for the operator (limiting the movements) were particularly challenging, not only for the SLAM acquisitions, but also for those using the 360° cameras. The main specifications of the SLAM system are reported in Table 2, and an example of one of the acquisitions is shown in Figure 6.
Table 2.
Geoslam Zeb REVO RT main technical specifications.
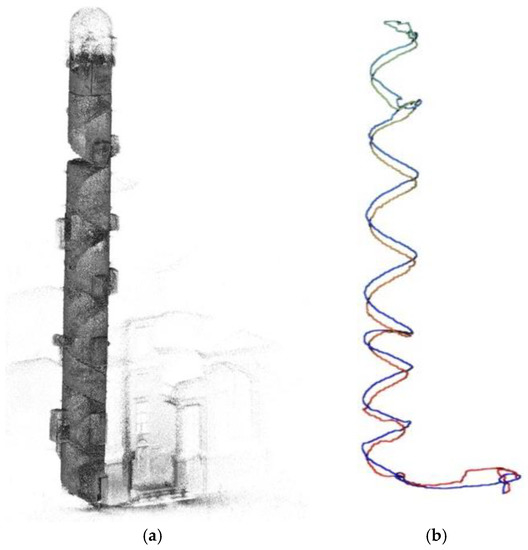
Figure 6.
Example Zeb REVO RT acquisition. The raw point cloud (a) and the paths followed during the survey operations (b).
2.2.5. 360° CAMERAS
Two different 360° cameras were used for acquiring images of the Montanaro belltower: the GoPro Fusion and the Kandao Qoocam 8k (Figure 7); the main specifications of the two devices are reported in Table 3.
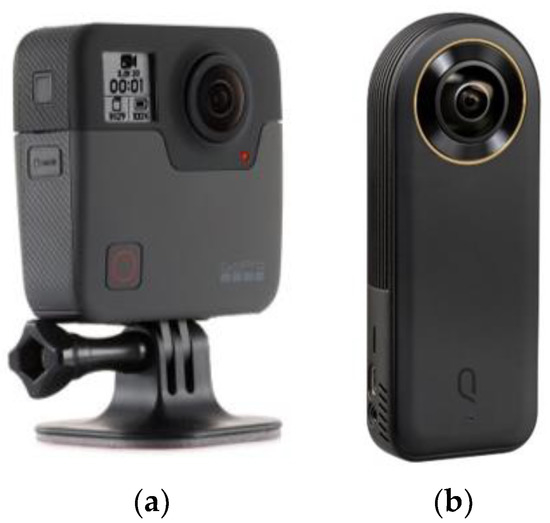
Figure 7.
The two 360° cameras used in this work: the GoPro Fusion (a) and the Kandao Qoocam 8K (b).
Table 3.
GoPro Fusion and Kandao Qoocam 8K main technical specifications.
Data acquisition with a 360° camera is generally easier compared to traditional CRP (close range photogrammetry) approaches based on a frame camera; nevertheless, it is also important to carefully design the acquisition strategy for this kind of sensors As reported in [45], three main strategies can be adopted to acquire 360° images for SP processing: (i) still images, (ii) time lapse, and (iii) video. In the Montanaro experience it was decided to adopt the third strategy based on the acquisition of videos. The video strategy was chosen because it was the fastest approach and the acquisition strategy with the best time–cost balance. For each of the two cameras, videos were recorded at the highest available resolutions: 5.2 K (30 fps) for the GoPro Fusion and 8 K (30 fps) for the Kandao Qoocam 8 K. The camera was mounted on a single pole support and held at around 40–50 cm above the operator’s head; this configuration allowed the presence of the operator in the FoV (Field of View) of the cameras to be reduced. It was also important that the operator continuously controlled the overall environment with respect to the camera position during the acquisition to avoid collisions with other elements; this was particularly critical for the Montanaro indoor acquisitions. The interior conformation of the tower and the narrow spaces of the spiral stairway thus posed a series of issues during the acquisitions, especially in the upper part of the building. In this portion of the structure, which hosts the mechanism of the four clocks of the belltower and connects the lower part with the bell chamber, the space for the operator to move is reduced and only a small trapdoor connects the two sections of the tower. Thus, the distance between the camera and walls was reduced, and moving across the trapdoor also required the operator to reduce his distance with respect to the camera. Moreover, this area is characterized by poor lighting due to the lack of windows. All of these aspects had a strong impact in the acquisition and processing phases, as discussed further below.
The two videos were acquired following a roundtrip walk starting from the square in front of the belltower, entering the tower, walking the helicoidal stairway up to the bell chamber, and then returning via the same path (Figure 8). Each video has a duration of around 7 min and a file size (after the stitching phase) of 30 GB for the GoPro and 13 GB for the Kandao.
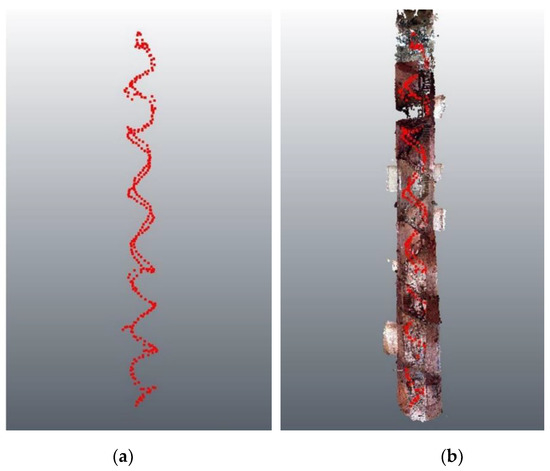
Figure 8.
Example of the acquisition scheme adopted with the 360° cameras. Red dots indicate the single camera positions, corresponding to the extracted frames. Camera positions are shown in (a) and camera position overlayed with the generated point cloud in (b).
The difference in terms of file sizes between the videos is due to the different video formats used by the two video stitching applications. Video of the Qoocam 8 K were saved using a compressed “.mp4” format and thus, despite having a higher resolution, they were smaller than the Fusion videos that were saved in a “.mov” format.
3. Data Processing
The information reported in the following paragraphs is mainly dedicated to the processing of the spherical images adopting SfM approaches, and represents the central topic of this manuscript. However, for the sake of completeness, some notes on the processing steps followed for the other datasets involved in the validation of the SP approach are also reported.
3.1. UAS
Data acquired by means of UAS were processed following the standard SfM pipeline using the commercial solution Agisoft Metashape (v. 1.7.2). The processing was previously described in [38] and the main results are reported in Table 4.
Table 4.
UAS flight processing main results.
The design of the acquisition, which followed the best practices for this kind of survey, led to high-resolution 3D models (Figure 9). The data derived from the UAS survey were used, as previously reported, for the construction of 2D architectural drawings (plans, facades, and sections) useful for documenting all the belltower. Furthermore, they were exploited to evaluate the metric and geometric quality of the other datasets.
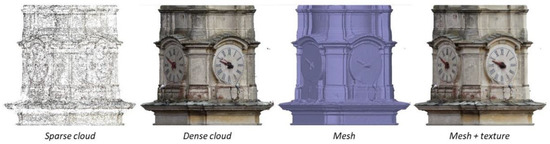
Figure 9.
Example of the high level of detail of the UAS dataset.
3.2. TLS
Regarding the TLS dataset, the Faro Scene software was used for the data processing of the scans. For the purposes of this research, only the indoor scans were considered, whereas, as previously reported, the UAS dataset was used as a ground reference for the exterior part of the tower. For six of the seven indoor scans, the processing was divided in a two-step approach: the scans were preliminary co-registered by performing a rough manual registration optimized using an Iterative Closest Point algorithm (ICP). In the second step, the registered scans were georeferenced using the available ground control points. By comparison, the scan acquired in the bell chamber did not have a sufficient overlap with the other scans and therefore it was processed with a single step approach using the ground control points for georeferencing the scans. The quality of the registration of the indoor dataset is reported in Table 5.
Table 5.
Indoor scan processing main results.
3.3. SLAM
The first step of the processing dedicated to the data acquired with the Geoslam ZEB Revo RT consisted of an optimization of the four point clouds, before the second phase aimed at georeferencing the data in the common reference system. The data processing phase was carried out using the dedicated software solution (Geoslam Hub), following the standard workflow with a limited intervention from the operator.
The four scans were first roughly manually aligned and then processed with the merge function of the Geoslam software. Using this option, it is possible to align all the scans in the same local reference system, and a second optimization of the scans is also performed. This function allows correction of gross or drift errors of the raw scans that are not always visible by means of a qualitative evaluation of the data. Acquiring a redundant number of scans with a high degree of overlap, particularly in complex environments such as that of the belltower, represents a good strategy to fully exploit the merge function, optimize each point cloud, and obtain a complete model of the surveyed object.
The final phase of the SLAM processing is represented by the georeferencing of the data. This phase was completed using the LiDAR dataset as a ground reference. After a first coarse registration of the two datasets, an ICP registration was performed using the CloudCompare software and adopting the LiDAR data as the blocked reference. The RMSe (root mean square error) achieved after this operation presents a mean value of 0.04 m, in line with the expected precision of the instrument [22].
3.4. Spherical Cameras
Before moving to the photogrammetric processing of 360° images, it is important to analyze the raw data of the two cameras. The GoPro Fusion is equipped with two micro sd cards, one for each sensor, where two different videos for each acquisition are stored independently. The Kandao Qoocam 8K has an internal memory and can be equipped only with a single sd card: a single video is recorded for each acquisition embedding two different tracks, one for each sensor. To work with the single video acquired by the Qoocam, it is thus necessary to undertake further preprocessing to split the two video tracks into two separated files. This task was completed with a command line script of the opensource solution FFmpeg [46].
3.4.1. The Stitching Phase
The first choice when dealing with the photogrammetric processing of data collected with a spherical camera is whether to proceed with the stitching phase.
Image, or video, stitching is the technique that allows combining multiple singular images or video frames into a mosaicked virtual image or video. The main revolution in the processing of image stitching is related to the work of Szeliski and Shum [47] at the end of the 1990s, which was further developed in the following years [48,49,50,51]. The stitching phase can be automatically performed by adopting several software solutions, both commercial and open-source. However, in recent years, commercially available 360° cameras are provided with their own dedicated software solution for the stitching phase. This is also the case of GoPro Fusion and Kandao Qoocam 8K, which are provided with, respectively, GoPro Fusion Studio and Qoocam Studio. It should be noted that, in general, these dedicated software solutions are limited in terms of customization, and that few options are available during the stitching. This reduces the possibility to cope with the most common issues during the stitching, i.e., the parallax effect, different exposure times among images, and the ghosting effect.
For the purposes of this research, it was decided to test both approaches, i.e., working with the data derived from the single 360° sensors and with the stitched 360° videos (processed in their own dedicated software solution at the maximum available resolution).
3.4.2. Frames Extraction and Processing Strategies
To further proceed with the processing phase, before adopting the standard SfM approach, it is necessary to extract single frames from the videos (both spherical and not stitched). This phase clearly has an impact on the data processing [52,53,54], especially in terms of number of images and overlapping. The interval adopted for frame extraction, i.e., the number of frames to be skipped, is linked to several aspects: original video frame-rate/quality, operator moving speed during the acquisition, illumination, desired overlap between images, scene conformation, etc.
The videos recorded with both the GoPro and the Kandao had a framerate of 30 fps and, for the purposes of this research, three different frame extraction intervals were tested and analyzed, according to previous experience [45,55,56] and taking the characteristics of the Montanaro belltower into account: FPS = 0.5 (skipping 14 frames), FPS = 1 (skipping 29 frames), and FPS = 2 (skipping 59 frames).
Finally, combining the frame step extraction with the stitching phase, five different processing strategies were adopted and tested for each of the two 360° cameras tested in this research: three using spherical images after the stitching phase and two using the data derived from the single sensors. An example of the extracted frames is showed in Figure 10.
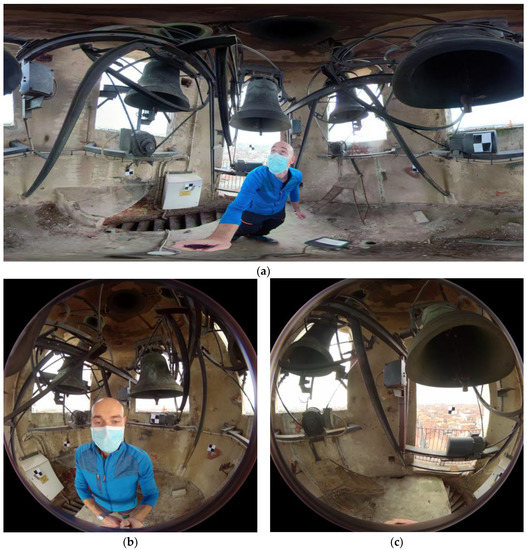
Figure 10.
An example of the frames extracted from the 360° acquisitions. A stitched image from the GoPro Fusion (a) and two images extracted from the single camera of the Kandao Qoocam (b,c).
During the development of the different processing strategies, it was decided to adopt a self-calibration approach for the estimation of the interior orientation (I.O.) parameters of the adopted cameras. This choice was based on the experience gained in previous research works [55,56] and also because it was consistent with the aim of the fast-surveying approach of this research. Research related to the issues connected with the I.O. phase of this kind of sensor is under development and will likely lead to an enhancement of the achieved results.
In more detail, the five approaches for each of the two cameras (GP stands for GoPro and QC stands for Qoocam) have the following main characteristics:
- GP1 and QC1. Stitched video, FPS = 1, round-trip acquisition (round trip)
- GP2 and QC2. Stitched video, FPS = 1, one-way acquisition (1W)
- GP3 and QC3. Stitched video, FPS = 0.5, round-trip acquisition (round trip)
- GP4 and QC4. Single video extracted from each camera, FPS = 1, round-trip acquisition (round trip)
- GP5 and QC5. Single video extracted from each camera, FPS = 2, round-trip acquisition (round trip)
4. Results
The data derived from the different strategies adopted for the processing of the two spherical datasets was carefully analyzed and validated under different perspectives, and detailed considerations are reported in the following sections. First, both a qualitative analysis of the completeness in the reconstruction of the overall belltower and a quantitative analysis on the metrical accuracy based on the overall RMSe on GCPS and CPs were carried out.
A second group of analyses is focused on the comparison between distances derived by total station measurements and the same distances extracted from the different 3D models generated by the five processing strategies.
Finally, the accuracy of the geometrical reconstruction provided by the different 360 approaches was also evaluated and validated by means of the extraction of planar and cross sections from the different models and their comparison with the data provided by the ground reference (UAS, TLS, and SLAM). The different datasets used as ground reference are characterized by similar positional accuracies (a few centimeters), as detailed in the processing results of each technique: they can therefore be exploited for validation purposes.
4.1. Completeness, Metric Quality, and Geometric Reconstruction of the SP Approach
A first qualitative analysis was carried out on the completeness of the reconstruction provided by the different approaches. The completeness of the reconstruction of the belltower is mainly related to the phases of image matching, tie point (TP) extraction, and camera position estimation. The most critical point in this phase is represented by the area that connects the bell chamber with the remainder of the structure by means of a trapdoor, which is a narrow area with low light conditions, and therefore critical for the extraction of TPs and image correlation. Figure 11 shows a graphical representation of the different level of completeness provided by the different tested approaches, and Table 6 shows that the levels of completeness are also linked with the number of points generated in the densification phase of the SfM processing.
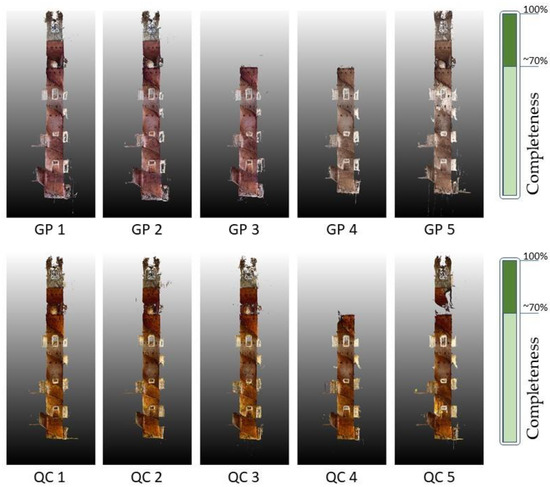
Figure 11.
Qualitative analysis of the completeness of the point cloud derived from the different approaches.
Table 6.
Completeness of the different 360° strategies and number of points after the densification (high quality).
It should be noted that seven of the ten datasets were able to provide a complete reconstruction of the belltower. For the GoPro, the two datasets that failed in the reconstruction were the GP3 (0.5 fps, stitched, round trip) and the GP4 (1 fps, single camera, round trip). For both of these datasets, the main issue was probably related to an insufficient number of images in relation to the chosen approach. GP3 used stitched images; however, extracting one frame every 60 frames is probably not enough to ensure a reasonable overlap between the images in the upper part of the tower. By comparison, GP4 uses single images extracted from each of the two sensors embedded in the camera; in this case, the number of frames extracted is also probably not sufficient to derive a correct correlation between images in the upper part of the tower. For the Qoocam, the situation was similar; however only the single camera dataset (QC4) failed in delivering a complete reconstruction of the tower. The fact that the 360° dataset (QC3) in this case performed better than that of the GoPro is probably simply related to the higher resolution of the camera itself.
Other interesting observations can be made concerning the number of 3D points generated during the densification phase in the different processing approaches (Table 6). For the 360° strategy, the number of points generated adopting a round trip or stitched approach in the case of 1 frame every 30 frames is almost the same for both cameras. The higher resolution of data collected from the Qoocam is also clearly visible in the higher number of points generated for each approach.
The metric validation of the proposed approaches was carried out in different steps: on the RMSe achieved for both GCPs and CPs after the processing of the different strategies; considering some 3D distances between ground control points measured in the field and the same distances extracted from the 3D models generated adopting the different approaches; and, finally, in the 2D sections extracted from the different point clouds. The RMSe on both GCPs and CPs for the different approaches is reported in Table 7. The different number of GCPs and CPs used in the different projects is related to the completeness of the SfM process in the reconstruction of the belltower; some of the points used as ground control points are located in the area that was not reconstructed by some of the tested approaches.
Table 7.
Accuracy validation on RMSe of GCPs and CPs adopting different approaches.
In general terms, the Qoocam performed better than the GoPro, with an RMSe value that is lower for each of the different approaches, and particularly for the 0.5 and 1 fps. As for the image matching phase, this is related to the higher resolution of the Kandao camera, which produces images having, in general, higher quality in terms of sharpness and overall quality.
For both the cameras, the single-sensor approaches (4 and 5) were the most successful if considering the overall RMSe on GCPs and CPs. Almost all the approaches meet the requirements of a 1:200 nominal map scale and the errors are comparable to those achieved during the processing of the ZEB REVO RT dataset.
However, considering only the RMSe as a parameter to evaluate the overall metric accuracy of the processing may be misleading and further analyses were performed.
The second analysis compared 3D distances derived from the 3D coordinates of the ground control points and the same distances derived from the point clouds achieved by the different photogrammetric processing approaches, to focus on the relative precision rather than on the absolute accuracy.
A total of four distances were considered and their position is shown in Figure 12, and the values are reported in Table 8.
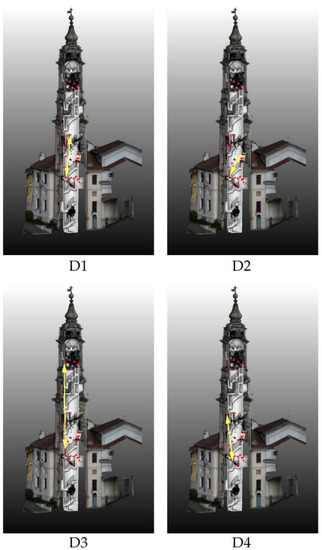
Figure 12.
Graphical representation of the four 3D distances considered to evaluate the accuracy of the photogrammetric processing.
Table 8.
Computed values of the 4 distances for the different processing approaches compared to the related measurements in the field. The difference between the value measured in the field and the one extracted from the photogrammetric processing is reported in brackets. Missing values are due to the incomplete reconstruction for some approaches.
The distance differences are in the range of a few centimeters, in line with the results achieved for the RMSe.
However, it should be considered that due to the conformation of the belltower and the organization of the survey, ground control points are not present in every section of the buildings and not homogenously distributed. This configuration can lead to some errors in the overall evaluation of the accuracy of the different processing; thus, another analysis was completed through the extraction of cross and planar sections. The sections were extracted using the PointCab software by generating a thin section from the different point clouds derived from the 360° dataset. Moreover, three other point clouds were used as a ground reference: the LiDAR, the UAS, and the SLAM point clouds.
Each of the sections were generated by adopting the same set of parameters and were then imported into AutoCAD to be transformed into 2D polylines. The different polylines were then compared to assess any possible discrepancies that were not evident from the previous analyses. Furthermore, it was also possible to evaluate the ability of the different datasets to reconstruct the geometry of the belltower in comparison with the more consolidated techniques. Three horizontal sections (Appendix A—Figure A1, Figure A2, Figure A3) were extracted at different heights, covering both areas where GCPs were measured in the field and where they were not present. Finally, a vertical cross section of the whole belltower was extracted (Appendix A—Figure A4 and Figure A5). An example of a horizontal section is shown in Figure 13.
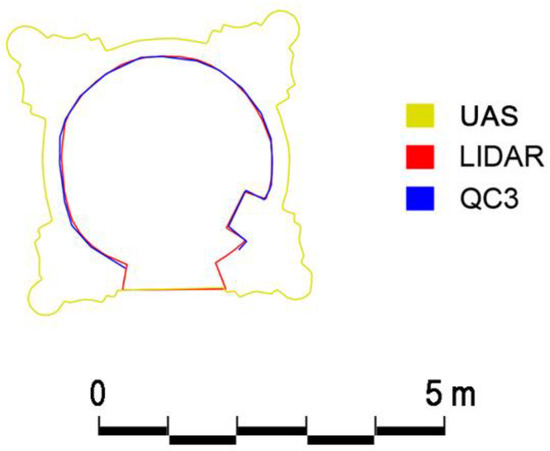
Figure 13.
Examples of sections extracted from the different point clouds. All the sections extracted are reported in Appendix A.
These sections were crucial to underline some issues in the overall photogrammetric processing of the 360° images that were not evident when analyzing other parameters, such as the RMSe on ground control points or 3D distances. It is clear that some major misalignments or drift errors can occur in the areas without ground control points. This is especially visible in the processing approaches 1, 2, and 3, which were based on the use of 360° stitched images and, also in this case, with a better performance of the Qoocam thanks to its higher resolution.
In general, approaches 4 and 5, which were based on the use of the single images derived from each sensor, present a lower deviation compared with that of the 360° approach.
It can be observed that each of the five approaches leads to a good performance (in terms of geometrical reconstruction) where ground control points are present to assist the SfM processing.
4.2. Processing Time
Despite the availability of powerful desktop computer and the enhancements of SfM algorithms and software, processing time remains a crucial issue in the overall photogrammetric pipeline. A comparison between the processing time of the different strategies tested is reported in Table 9.
Table 9.
Processing time of the different strategies.
In general, processing the Qoocam 8K dataset requires more time due to the higher resolution of the images extracted from the videos.
By comparison, the behavior of the five different strategies has the same trend both for the Fusion and the Qoocam. Concerning the three 360° approaches (1, 2, and 3), it is possible to reduce the number of images, and thus the processing time, by adopting two different solutions: using only the one-way acquisition (2) or doubling the step for frame extraction (3). The two strategies that use the data of the single cameras (4 and 5) require more time, in general, compared with the 360° approaches. Nevertheless, these considerations were relatively predictable and need to be related to the other results reported in this section for a comprehensive assessment.
5. Discussion and Conclusions
The research presented in this manuscript focused on evaluating the possibility of using the data acquired by two different 360° cameras to document a complex heritage asset, the Santa Marta belltower. Starting from the experience gained in previous research, different implications connected with the development of an SfM pipeline were considered and analyzed from different perspectives, including the acquisition phase, the processing phase, and the generation and use of different added-value products. The same acquisition scheme was followed for the two 360° cameras tested in this research (GoPro Fusion and Kandao Qoocam), and the different characteristics and performances of the two systems were carefully evaluated and reviewed. Five different processing strategies were set up and tested for each 360° camera, based on stitched images or raw data, in which video frames with different time intervals were extracted, and both one-way and roundtrip acquisition paths were adopted.
The metric accuracy of the proposed approaches was evaluated considering different features: the RMSe on GCPs and CPs, the comparison of 3D distances, and finally the extraction of several planar and cross sections by means of 2D polylines. Although analyses of RMSe and 3D distances reported good results, the extraction of planar and cross sections was crucial to identify biases in the 3D models that were generated by the different strategies. These biases were not visible in the other analyses and thus the generation of 2D sections was fundamental to assess the performances of the different approaches.
In general terms, approaches based on single cameras (4 and 5) were the best in terms of 3D metric accuracy and the level of detail of the 3D model. Nevertheless, they suffered in terms of point cloud completeness and were the most demanding in terms of processing time.
On the contrary, approaches based on stitched images (1, 2, and 3), in general, performed slightly worse in terms of the 3D positional accuracy, but slightly better in terms of completeness of the model, and clearly better concerning the processing time.
If only the RMSe values on GCPs and CPs are considered (Table 7), together with the deviation between the 3D distances calculated from the total station measurements and those extracted from the models generated with the different processing approaches (Table 8), it is possible to state that the data derived following each of the five approaches for both the cameras met the accuracy requirements of a nominal map scale in the range from 1:200 to 1:300.
Nevertheless, also considering the information derived from the analyses of 2D sections extracted from the different 3D models (Appendix A), the impact of the availability and spatial distribution of GCPs on the accuracy consistency of the 3D models is evident.
In the area covered by GCPs, the deviation between the reference models (UAS, LiDAR, and SLAM) was in the order of few centimeters, whereas they were not present in the order of dozens of centimeters. This issue is particularly evident in the z-axis of the reference system (which corresponds to the development in the height of the tower and the direction followed during the acquisition), and is probably related to the complexity of the surveyed environment (narrow spaces with low lighting), which affects the phases of image matching, camera position estimation, and tie point extraction.
This assessment regarding the fulfilment of the accuracies for a nominal map scale of 1:200/1:300 is thus true only if GCPs are available and if their spatial distribution covers the whole surveyed area, at least in case of complex assets such as that of the Santa Marta belltower. Moreover, it must be stressed that local discrepancies are not easily detected using only standard positional accuracy metrics (such as RMSe on GCPs and CPs).
Therefore, it is possible to state that data acquired from 360° cameras (both stitched and single images) can be successfully used as a fast-surveying technique to derive 3D models and added-value products fitting the classical architectural representational scales.
These data can not only be used to derive traditional products such as 2D architectural drawings, but have also an intrinsic added value as 360° data: their immersive component can be used to derive virtual tours or to support the operator in the interpretation phase after the data processing. They can thus be used in the phases of 2D drawing or as a support in the generation of HBIM models, enriching the parametric information database.
Finally, a number of issues remain under investigation and will be further examined in the near future, such as the possibility of combining the 360° images/videos with the generated 3D models in a virtual environment to better manage and share the data collected in the field. The data processing phases can be further extended and refined, by testing different GCPs configurations (including different test sites with different characteristics), and focusing on the estimation of I.O. parameters both for the 360° images and the single images. This issue was partially considered in this research, by adopting strategies derived from past experiences, particularly for the single camera processing [56], and requires further research, as recently demonstrated in [57].
Further tests are currently ongoing at the same test site to assess the suitability of new low-cost devices for fast surveying purposes, i.e., the lidar sensor available on the Apple iPad Pro and the Apple iPhone Pro 12. The sensors mentioned above and the related applications exploit both SLAM and photogrammetric algorithms to derive 3D point clouds. They can therefore be synergistically integrated with 360° cameras to enhance the positional accuracy and the completeness of the 3D models, especially in complex environments.
Author Contributions
The overall methodological approach of the paper and the experimental framework were jointly defined by the three authors: L.T.L.; F.C. and F.G.T. as well as the acquisition phase on the field. The processing and the development of the experimental set up was developed by L.T.L. as well as the writing of the draft. The manuscript was then revised and edited by all the three authors together. Conceptualization, L.T.L., F.C. and F.G.T.; Methodology, L.T.L., F.C. and F.G.T.; Supervision, F.C. and F.G.T.; Validation, L.T.L., F.C. and F.G.T.; Writing—original draft, L.T.L.; Writing—review & editing, F.C. and F.G.T. All authors have read and agreed to the published version of the manuscript.
Funding
This research has been partially funded by a research contract between Politecnico di Torino—DAD and Comune di Montanaro (Scientific Coordinator: Prof. Francesco Novelli) and the funding for basic research of Politecnico di Torino.
Acknowledgments
The authors would like to acknowledge the Montanaro Municipality for its availability and support in all the fieldwork phases; Francesco Novelli for the historical notes on the belltower; Giacomo Patrucco and Stefano Perri for the support in the acquisition phases in the field.
Conflicts of Interest
The authors declare no conflict of interest.
Appendix A

Figure A1.
Horizontal section A-A’. This section was extracted in an area of the model where no GCPs were present. Sections extracted from the model generated from the GoPro are reported in the left column, whereas those extracted from the Qoocam are in the right column. Data from UAV and ZEB Revo are used as the ground reference.

Figure A2.
Horizontal section B-B’. This section was extracted in an area of the model where GCPs were present. Sections extracted from the model generated from the GoPro are reported in the left column, whereas those extracted from the Qoocam in the right column. Data from UAV and LiDAR are used as the ground reference.

Figure A3.
Horizontal section C-C’. This section was extracted in an area of the model where GCPs were present. Sections extracted from the model generated from the GoPro are reported in the left column, whereas those extracted from the Qoocam in the right column. Data from UAV and LiDAR are used as the ground reference.

Figure A4.
Vertical section D-D’ extracted from the model generated from the GoPro. This section was extracted along the height of the tower, including both areas with and without GCPs. On the right, magnifications of specific areas of interest. Data from UAV and ZEB Revo are used as the ground reference.

Figure A5.
Vertical section D-D’ extracted from the model generated from the Qoocam. This section was extracted along the height of the tower, including both areas with and without GCPs. On the right, magnifications of specific areas of interest. Data from UAV and ZEB Revo are used as the ground reference.
References
- Patias, P. Cultural Heritage Documentation, International Summer School “Digital Recording and 3D Modeling”, Aghios Nikolaos, Crete, Greece, 24–29 April 2006. 2006. Available online: https://www.semanticscholar.org/paper/Cultural-Heritage-Documentation%3A-Lecture-Notes%2C-and-Patias/f87e8e6a340c477b4826320a81565768b3547721 (accessed on 30 August 2021).
- Letellier, R.; Schmid, W.; LeBlanc, F.; Eppich, R.; Cabbi, A. The Getty Conservation Institute. Recording, Documentation, and Information Management for the Conservation of Heritage Places Guiding Principles; Donhead Publishing: Shaftesbury, UK, 2011; ISBN 1317742931. [Google Scholar]
- 3D Recording, Documentation and Management of Cultural Heritage; Remondino, F., Stylianidis, E., Eds.; Whittles Publishing: Dunbeath, UK, 2016; ISBN 9781849951685. [Google Scholar]
- Georgopoulos, A. Data Acquisition for the Geometric Documentation of Cultural Heritage. In Mixed Reality and Gamification for Cultural Heritage; Springer: Berlin/Heidelberg, Germany, 2017; pp. 29–73. [Google Scholar]
- D’Ayala, D.; Smars, P. Minimum Requirements for Metric Use of Non-Metric Photographic Documentation; University of Bath: Bath, UK, 2003; Available online: https://www.researchgate.net/publication/321758681_Minimum_requirement_for_metric_use_of_non-metric_photographic_documentation_Report_for_English_Heritage (accessed on 30 August 2021).
- Tobiasz, A.; Markiewicz, J.; Lapinski, S.; Nikel, J.; Kot, P.; Muradov, M. Review of Methods for Documentation, Management, and Sustainability of Cultural Heritage. Case Study: Museum of King Jan III’s Palace at Wilanów. Sustainability 2019, 11, 7046. [Google Scholar] [CrossRef]
- Yang, X.; Grussenmeyer, P.; Koehl, M.; Macher, H.; Murtiyoso, A.; Landes, T. Review of built heritage modelling: Integration of HBIM and other information techniques. J. Cult. Herit. 2020, 46, 350–360. [Google Scholar] [CrossRef]
- Georgopoulos, A. Contemporary Digital Technologies at the Service of Cultural Heritage. In Heritage Preservation: A Computational Approach; Springer: Singapore, 2018; pp. 1–20. ISBN 9789811072215. [Google Scholar]
- Caciora, T.; Herman, G.V.; Ilieş, A.; Baias, Ş.; Ilieş, D.C.; Josan, I.; Hodor, N. The use of virtual reality to promote sustainable tourism: A case study of wooden churches historical monuments from Romania. Remote Sens. 2021, 13, 1758. [Google Scholar] [CrossRef]
- Derudas, P.; Dell’Unto, N.; Callieri, M.; Apel, J. Sharing Archaeological Knowledge: The Interactive Reporting System. J. Field Archaeol. 2021, 46, 303–315. [Google Scholar] [CrossRef]
- Adamopoulos, E.; Rinaudo, F. UAS-Based Archaeological Remote Sensing: Review, Meta-Analysis and State-of-the-Art. Drones 2020, 4, 46. [Google Scholar] [CrossRef]
- Georgopoulos, A.; Oikonomou, C.; Adamopoulos, E.; Stathopoulou, E.K. Evaluating unmanned aerial platforms for cultural heritage large scale mapping. ISPRS Int. Arch. Photogramm. Remote Sens. Spat. Inf. Sci. 2016, XLI-B5, 355–362. [Google Scholar] [CrossRef]
- Sestras, P.; Roșca, S.; Bilașco, Ștefan; Naș, S.; Buru, S.M.; Kovacs, L.; Spalević, V.; Sestras, A.F. Feasibility Assessments Using Unmanned Aerial Vehicle Technology in Heritage Buildings: Rehabilitation-Restoration, Spatial Analysis and Tourism Potential Analysis. Sensors 2020, 20, 2054. [Google Scholar] [CrossRef] [PubMed]
- Adami, A.; Fregonese, L.; Gallo, M.; Helder, J.; Pepe, M.; Treccani, D. Ultra Light Uav Systems for the Metrical Documentation of Cultural Heritage: Applications for Architecture and Archaeology. ISPRS Int. Arch. Photogramm. Remote Sens. Spat. Inf. Sci. 2019, XLII-2/W17, 21. [Google Scholar] [CrossRef]
- Hoon, Y.J.; Hong, S. Three-dimensional digital documentation of cultural heritage site based on the convergence of terrestrial laser scanning and unmanned aerial vehicle photogrammetry. ISPRS Int. J. Geo-Inf. 2019, 8, 53. [Google Scholar] [CrossRef]
- Bitelli, G.; Dellapasqua, M.; Girelli, V.A.; Sanchini, E.; Tini, M.A. 3D Geomatics techniques for an integrated approach to cultural heritage knowledge: The case of san michele in acerboli’s church in santarcangelo di romagna. In Proceedings of the International Archives of the Photogrammetry, Remote Sensing and Spatial Information Sciences—ISPRS Archives, Florence, Italy, 22–24 May 2017; Volume 42, pp. 291–296. [Google Scholar]
- Pritchard, D.; Sperner, J.; Hoepner, S.; Tenschert, R. Terrestrial laser scanning for heritage conservation: The Cologne Cathedral documentation project. In Proceedings of the ISPRS Annals of the Photogrammetry, Remote Sensing and Spatial Information Sciences, Ottawa, Canada, 28 August–1 September 2017; Volume 4, pp. 213–220. [Google Scholar]
- Corso, J.; Roca, J.; Buill, F. Geometric Analysis on Stone Façades with Terrestrial Laser Scanner Technology. Geosciences 2017, 7, 103. [Google Scholar] [CrossRef]
- Gottardi, C.; Guerra, F. Spherical images for cultural heritage: Survey and documentation with the NIKON KM360. In Proceedings of the International Archives of the Photogrammetry, Remote Sensing and Spatial Information Sciences—ISPRS Archives, Riva del Garda, Riva del Garda, Italy, 4–7 June 2018; Volume 42, pp. 385–390. [Google Scholar]
- Murtiyoso, A.; Grussenmeyer, P.; Suwardhi, D. Technical Considerations in Low-Cost Heritage Documentation. In Proceedings of the 6th International Workshop LowCost 3D—Sensors, Algorithms, Applications, Strasbourg, France, 2–3 December 2019. [Google Scholar] [CrossRef]
- Mandelli, A.; Fassi, F.; Perfetti, L.; Polari, C. Testing different survey techniques to model architectonic narrow spaces. In Proceedings of the International Archives of the Photogrammetry, Remote Sensing and Spatial Information Sciences—ISPRS Archives, Ottawa, ON, Canada, 28 August–1 September 2017; Volume 42, pp. 505–511. [Google Scholar]
- Sammartano, G.; Spanò, A. Point clouds by SLAM-based mobile mapping systems: Accuracy and geometric content validation in multisensor survey and stand-alone acquisition. Appl. Geomat. 2018, 10, 317–339. [Google Scholar] [CrossRef]
- Tucci, G.; Visintini, D.; Bonora, V.; Parisi, E. Examination of Indoor Mobile Mapping Systems in a Diversified Internal/External Test Field. Appl. Sci. 2018, 8, 401. [Google Scholar] [CrossRef]
- Rodríguez-Gonzálvez, P.; Fernández-Palacios, B.J.; Muñoz-Nieto, A.L.; Arias-Sanchez, P.; Gonzalez-Aguilera, D. Mobile LiDAR system: New possibilities for the documentation and dissemination of large cultural heritage sites. Remote Sens. 2017, 9, 189. [Google Scholar] [CrossRef]
- Di Filippo, A.; Sánchez-Aparicio, L.J.; Barba, S.; Martín-Jiménez, J.A.; Mora, R.; Aguilera, D.G. Use of a Wearable Mobile Laser System in Seamless Indoor 3D Mapping of a Complex Historical Site. Remote Sens. 2018, 10, 1897. [Google Scholar] [CrossRef]
- Barazzetti, L.; Fangi, G.; Remondino, F.; Scaioni, M. Automation in Multi-Image Spherical Photogrammetry for 3D Architectural Reconstructions. Vast 2010, 2312. [Google Scholar] [CrossRef]
- Fangi, G. The Multi-image spherical Panoramas as a tool for Architectural Survey. In Cipa Heritage Documentation: Best Practices and Applications; CIPA: Valencia, Spain, 2007. [Google Scholar]
- Fangi, G. Towards an easier orientation for spherical photogrammetry. Int. Arch. Photogramm. Remote Sens. Spat. Inf. Sci. ISPRS Arch. 2015, 40, 279–283. [Google Scholar] [CrossRef]
- Fangi, G.; Nardinocchi, C. Photogrammetric processing of spherical panoramas. Photogramm. Rec. 2013, 28, 293–311. [Google Scholar] [CrossRef]
- Abate, D.; Toschi, I.; Sturdy-Colls, C.; Remondino, F. A low-cost panoramic camera for the 3D documentation of contaminated crime scenes. Int. Arch. Photogramm. Remote Sens. Spat. Inf. Sci. ISPRS Arch. 2017, 42, 1–8. [Google Scholar] [CrossRef]
- Barazzetti, L.; Previtali, M.; Roncoroni, F. Can we use low-cost 360 degree cameras to create accurate 3D models? Int. Arch. Photogramm. Remote. Sens. Spat. Inf. Sci. 2018, 42, 69–75. [Google Scholar] [CrossRef]
- Fangi, G.; Pierdicca, R.; Sturari, M.; Malinverni, E.S. Improving spherical photogrammetry using 360° OMNI-Cameras: Use cases and new applications. Int. Arch. Photogramm. Remote. Sens. Spat. Inf. Sci. ISPRS Arch. 2018, 42, 331–337. [Google Scholar] [CrossRef]
- Kwiatek, K.; Tokarczyk, R. Immersive photogrammetry in 3D modelling. Geomat. Environ. Eng. 2015, 9, 51. [Google Scholar] [CrossRef][Green Version]
- Kwiatek, K.; Tokarczyk, R. Photogrammetric applications of immersive video cameras. ISPRS Ann. Photogramm. Remote. Sens. Spat. Inf. Sci. 2014, 2, 211–218. [Google Scholar] [CrossRef]
- Pagani, A.; Stricke, D. Structure from motion using full sphericalpanoramic cameras. 2011 IEEE Int. Conf. Comput. Vis. Work. 2011, 375–382. [Google Scholar] [CrossRef]
- Battaglio, M. L’ultimo Vittone. Il Campanile di Montanaro Nuovi Rilievi e Fonti d’Archivio; Editrice Litoart: Torino, Italy,, 2000. [Google Scholar]
- SPIN3 GNSS—Servizio di Posizionamento Interregionale GNSS di Regione Piemonte, Regione Lombardia e Regione Autonoma Valle d’Aosta. Available online: https://www.spingnss.it/spiderweb/frmIndex.aspx (accessed on 4 May 2021).
- Teppati Losè, L.; Chiabrando, F.; Novelli, F.; Patrucco, G.; Perri, S. Documentation of A Complex Cultural Heritage Asset with Integrated Geomatic Survey: The Montanaro Bell Tower. In Proceedings of the ARQUEOLÓGICA 2.0—9th International Congress & 3rd GEORES—GEOmatics and pREServation, Valencia, Spain, 26–28 April 2021. [Google Scholar]
- DJI Phantom 4 PRO. Available online: https://www.dji.com/it/phantom-4-pro/info#specs (accessed on 7 May 2020).
- Geoslam Zeb Revo, R.T. Available online: https://geoslam.com/solutions/zeb-revo-rt/ (accessed on 6 July 2021).
- Matoušková, E.; Pavelka, K.; Smolík, T.; Pavelka, K. Earthen Jewish Architecture of Southern Morocco: Documentation of Unfired Brick Synagogues and Mellahs in the Drâa-Tafilalet Region. Appl. Sci. 2021, 11, 1712. [Google Scholar] [CrossRef]
- Otero, R.; Lagüela, S.; Garrido, I.; Arias, P. Mobile indoor mapping technologies: A review. Autom. Constr. 2020, 120, 103399. [Google Scholar] [CrossRef]
- Barba, S.; Ferreyra, C.; Cotella, V.A.; di Filippo, A.; Amalfitano , S. A SLAM Integrated Approach for Digital Heritage Documentation. In Culture and Computing. Interactive Cultural Heritage and Arts. HCII 2021. Lecture Notes in Computer Science; Rauterberg, M., Ed.; Springer: Cham, Switzerland, 2021; Volume 12794. [Google Scholar] [CrossRef]
- Riisgaard, S.; Blas, M.R. SLAM for Dummies. Mass. Inst. Oftechnology Proj. 2004, 22, 1–127. [Google Scholar]
- Teppati Losè, L.; Spanò, A.; Anguissola, A. Geomatics Advanced Testings Flanking Archaeological Research: A Noteworthy Area in the Northern Necropolis of Hierapolis of Frigia (TK), In Proceedings of the ARQUEOLÓGICA 2. 0—9th International Congress & 3rd GEORES—GEOmatics and pREServation, Valencia, Spain, 26–28 April 2021. [Google Scholar]
- FFmpeg. Available online: https://www.ffmpeg.org/ (accessed on 8 May 2021).
- Szeliski, R.; Shum, H.-Y. Creating Full View Panoramic Image Mosaics and Environment Maps. In Proceedings of the 24th Annual Conference on Computer Graphics and Interactive Techniques—SIGGRAPH ’97; ACM Press: New York, NY, USA, 1997; pp. 251–258. [Google Scholar]
- Brown, M.; Lowe, D. Automatic Panoramic Stitching Using Invariant Features. Int. J. Comput. Vis. 2007, 74, 59–73. [Google Scholar] [CrossRef]
- Herrmann, C.; Wang, C.; Strong Bowen, R.; Keyder, E.; Krainin, M.; Liu, C.; Zabih, R. Robust image stitching with multiple registrations. In Proceedings of the The European Conference on Computer Vision (ECCV), Munich, Germany, 8–14 September 2018. [Google Scholar]
- Suman, S.; Rastogi, U.; Tiwari, R. Image Stitching Algorithms-A Review. 2016; Volume 1. [Google Scholar]
- Szeliski, R. Image Alignment and Stitching: A Tutorial. Comput. Graph. Vis. 2006, 2, 1–104. [Google Scholar] [CrossRef]
- Delis, P.; Zacharek, M.; Wierzbicki, D.; Grochala, A. Point cloud derived from video frames: Accuracy assessment in relation to terrestrial laser scanning and digital cameradata. Int. Arch. Photogramm. Remote Sens. Spat. Inf. Sci. ISPRS Arch. 2017, 42, 217–223. [Google Scholar] [CrossRef]
- Teo, T. Video-based point cloud generation using multiple action cameras. Int. Arch. Photogramm. Remote Sens. Spat. Inf. Sci. ISPRS Arch. 2015, 40, 55–60. [Google Scholar] [CrossRef]
- Sun, Z.; Zhang, Y. Accuracy Evaluation of Videogrammetry Using a Low-Cost Spherical Camera for Narrow Architectural Heritage: An Observational Study with Variable Baselines and Blur Filters. Sensors 2019, 19, 496. [Google Scholar] [CrossRef] [PubMed]
- Teppati Losè, L. Geomatics support to the metric documentation of the archaeological heritage: Tests and validations on the use of low-cost, rapid, image-based sensors and systems. Ph.D. Thesis, DAD-Politecnico di Torino, Torino, Italy, 2019. [Google Scholar]
- Teppati Losè, L.; Chiabrando, F.; Spanò, A. Preliminary evaluation of a commercial 360 multi-camera RIG for photogrammetric purposes. Int. Arch. Photogramm. Remote. Sens. Spat. Inf. Sci. ISPRS Arch. 2018, 42, 1113–1120. [Google Scholar] [CrossRef]
- Castanheiro, L.F.; Tommaselli, A.M.G.; Campos, M.B.; Berveglieri, A. Adaptive Weighting of Image Observations for Self-Calibration with Fisheye Images. ISPRS Ann. Photogramm. Remote Sens. Spat. Inf. Sci. 2021, 87. [Google Scholar] [CrossRef]
Publisher’s Note: MDPI stays neutral with regard to jurisdictional claims in published maps and institutional affiliations. |
© 2021 by the authors. Licensee MDPI, Basel, Switzerland. This article is an open access article distributed under the terms and conditions of the Creative Commons Attribution (CC BY) license (https://creativecommons.org/licenses/by/4.0/).