Modelling Accessibility to Urban Green Areas Using Open Earth Observations Data: A Novel Approach to Support the Urban SDG in Four European Cities

 ,
, 
 and
and
Abstract
1. Introduction
2. Material and Methods
2.1. Review of Current Research and Developments on Assessing Urban Green Spaces
Main Findings on State-of-the-Art Research and Development on Assessing Urban Green Space
- Complexity and difficulty in calculating this indicator.
- Definition and availability of data sources ensuring international data comparability.
- Availability of data sources with ownership information (public vs. private).
- Integration of the above geospatial data sources with typically very different properties, quality and uses.
- Difficulty in delineating built-up areas and open space for public use.
- Information on public vs. private areas is a big challenge. Contributing countries have no figures for this indicator. Some countries may rely on a rich set of cadastral information and tax data, the complexity of urban land use prevents accurate classification of some areas in binary categories of public vs. non-public space.
- Identification of urban footprint.
- Integration of satellite EO data with statistical information in production workflows is challenging.
- Use of EO data for statistical production is evolving, but applications are mainly case-based and yet somewhat experimental.
- Spatially disaggregated data are not widely adopted because the associated cost for generating data using traditional methods remains significant, technical capacity and skills on geospatial analysis is still lacking in many countries and due to difficulties to adopt new practices.
2.2. Proposal for and Implementation of a New Method
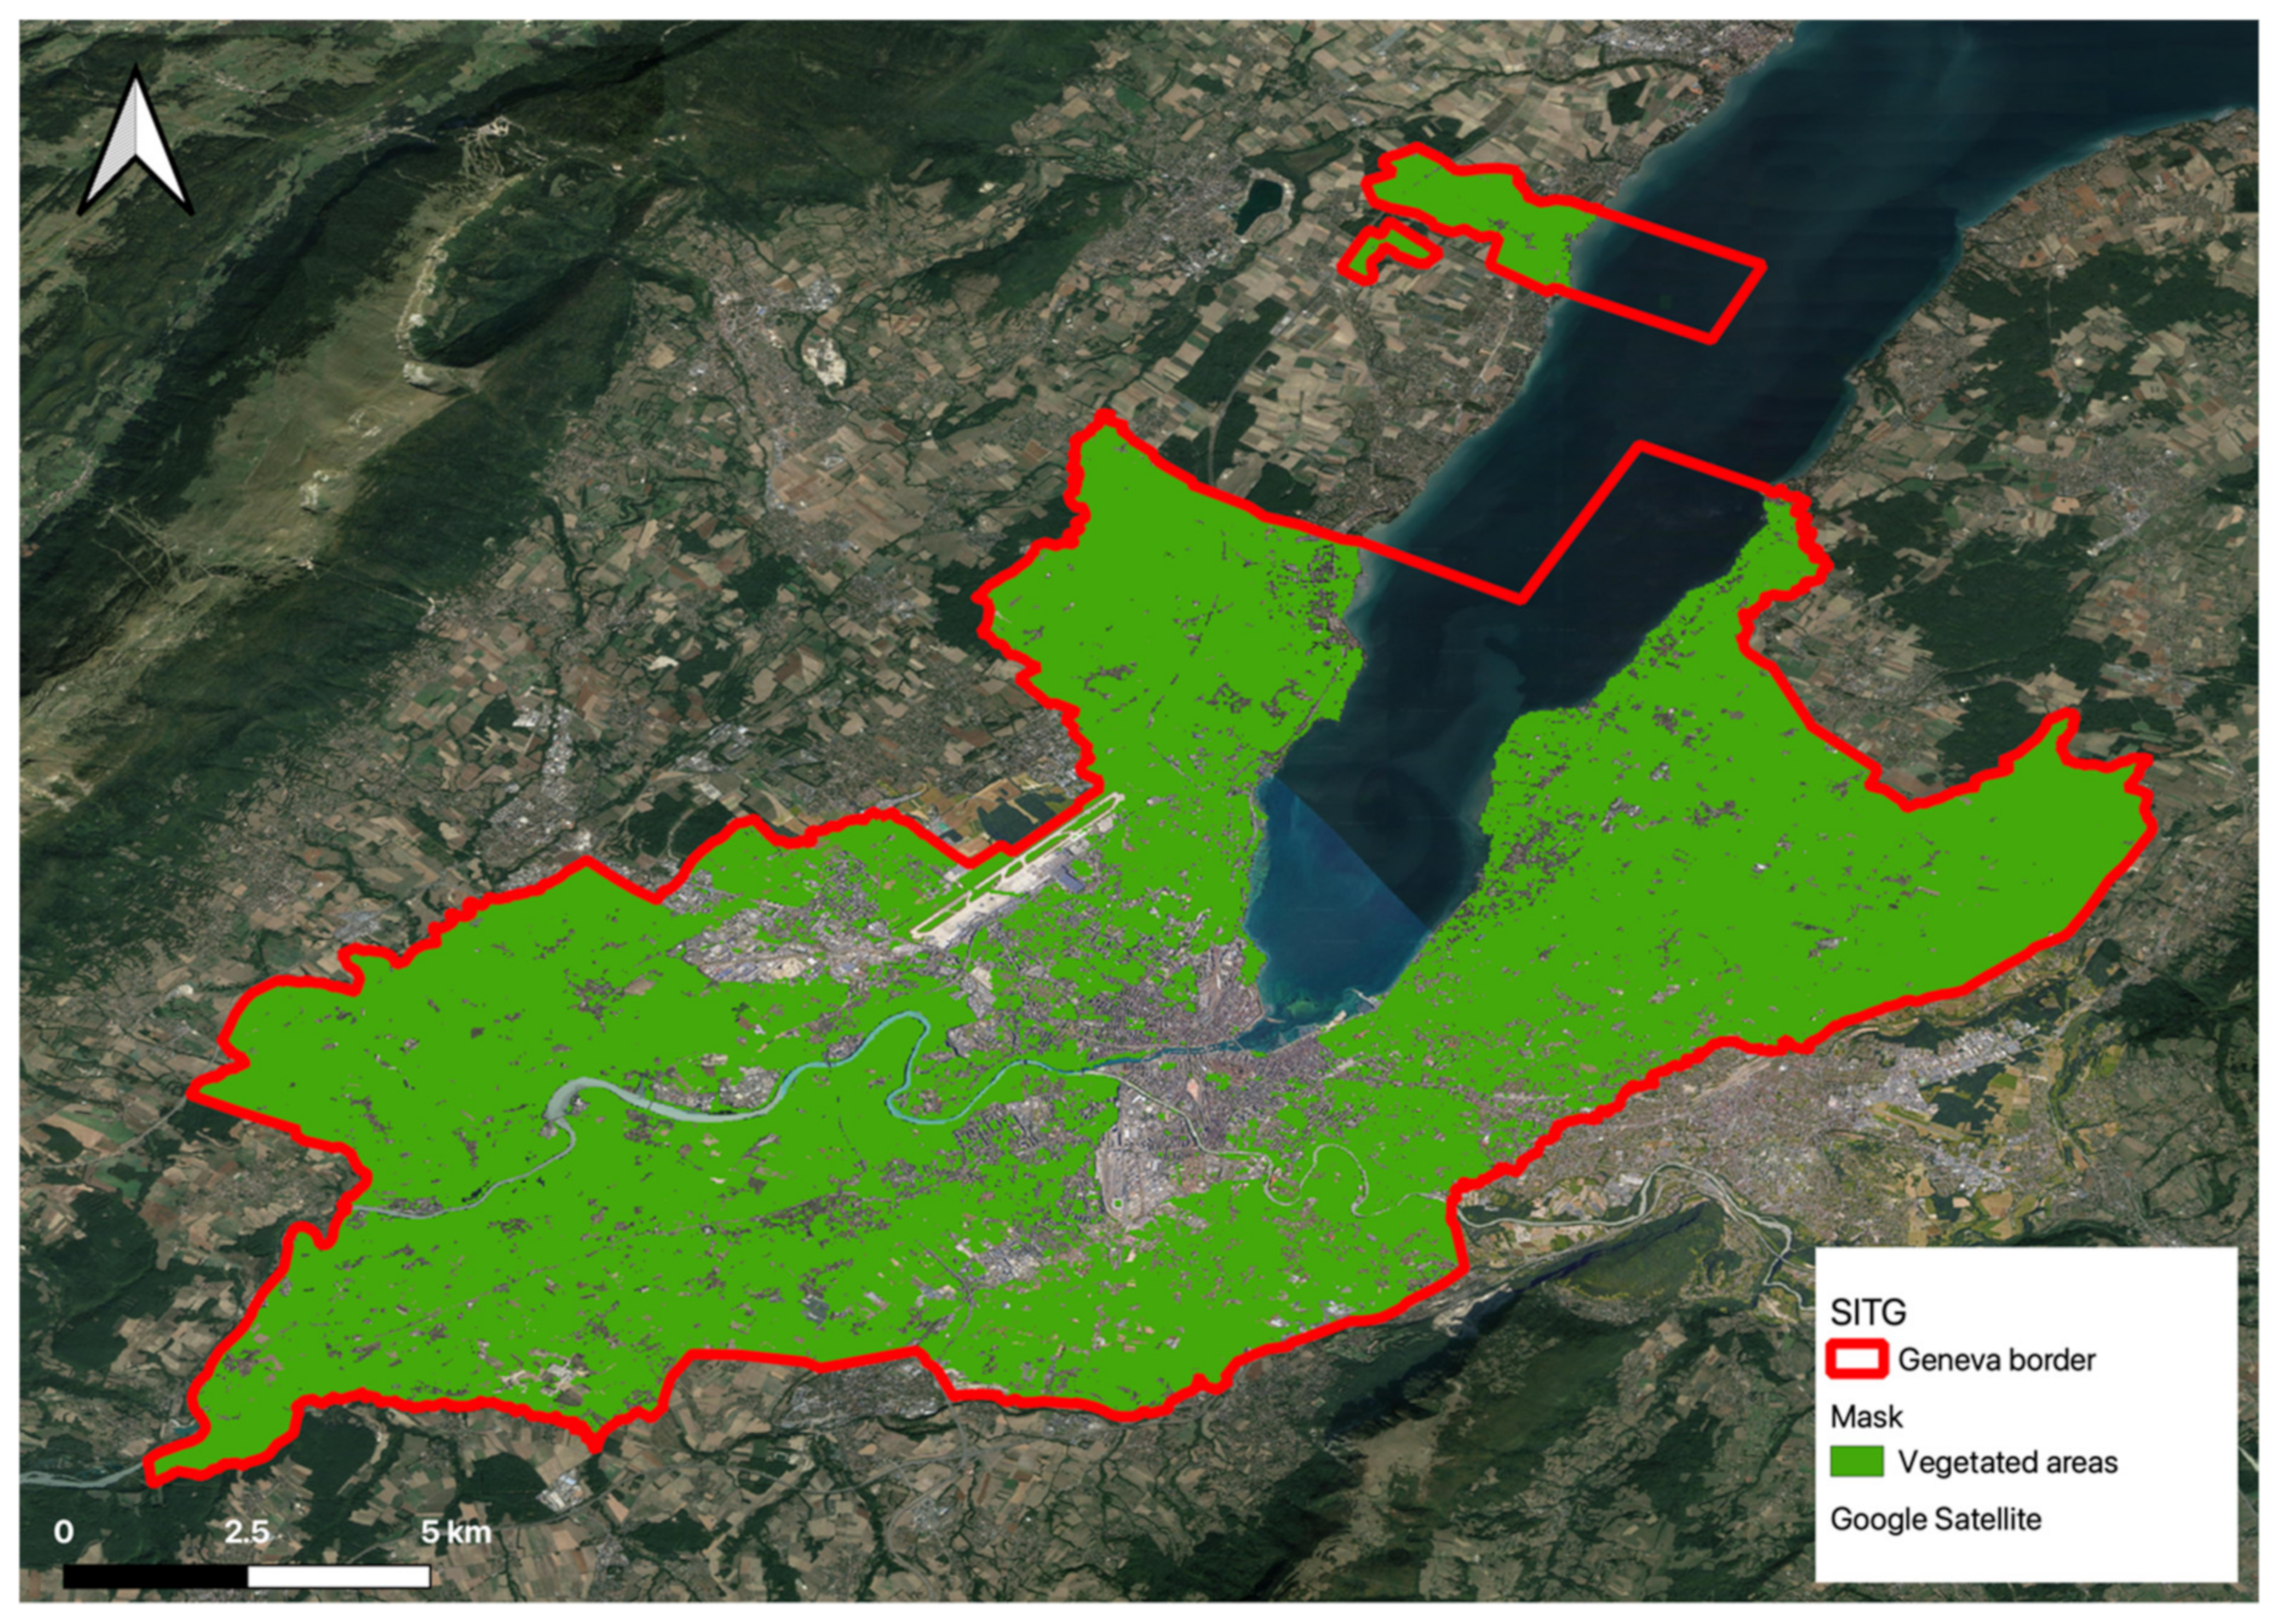
- Generate a maximum NDVI dataset (April–August) over the urban areas.
- Delimit built-up area of the city.
- Create a mask of public vs. private areas using a mix of solutions (e.g., cadaster, Volunteered geographic information (VGI)).
- Overlay the mask with the NDVI dataset to identify only vegetated and public areas. This gives an estimation of the total public green space.
- Model the physical accessibility of the population to the nearest public green space, and compute accessibility coverage.
2.2.1. Compute Maximum NDVI Time-Series Using Sentinel-2 Data to Get Vegetated Areas
2.2.2. Delimitation of the Built-Up Area/City
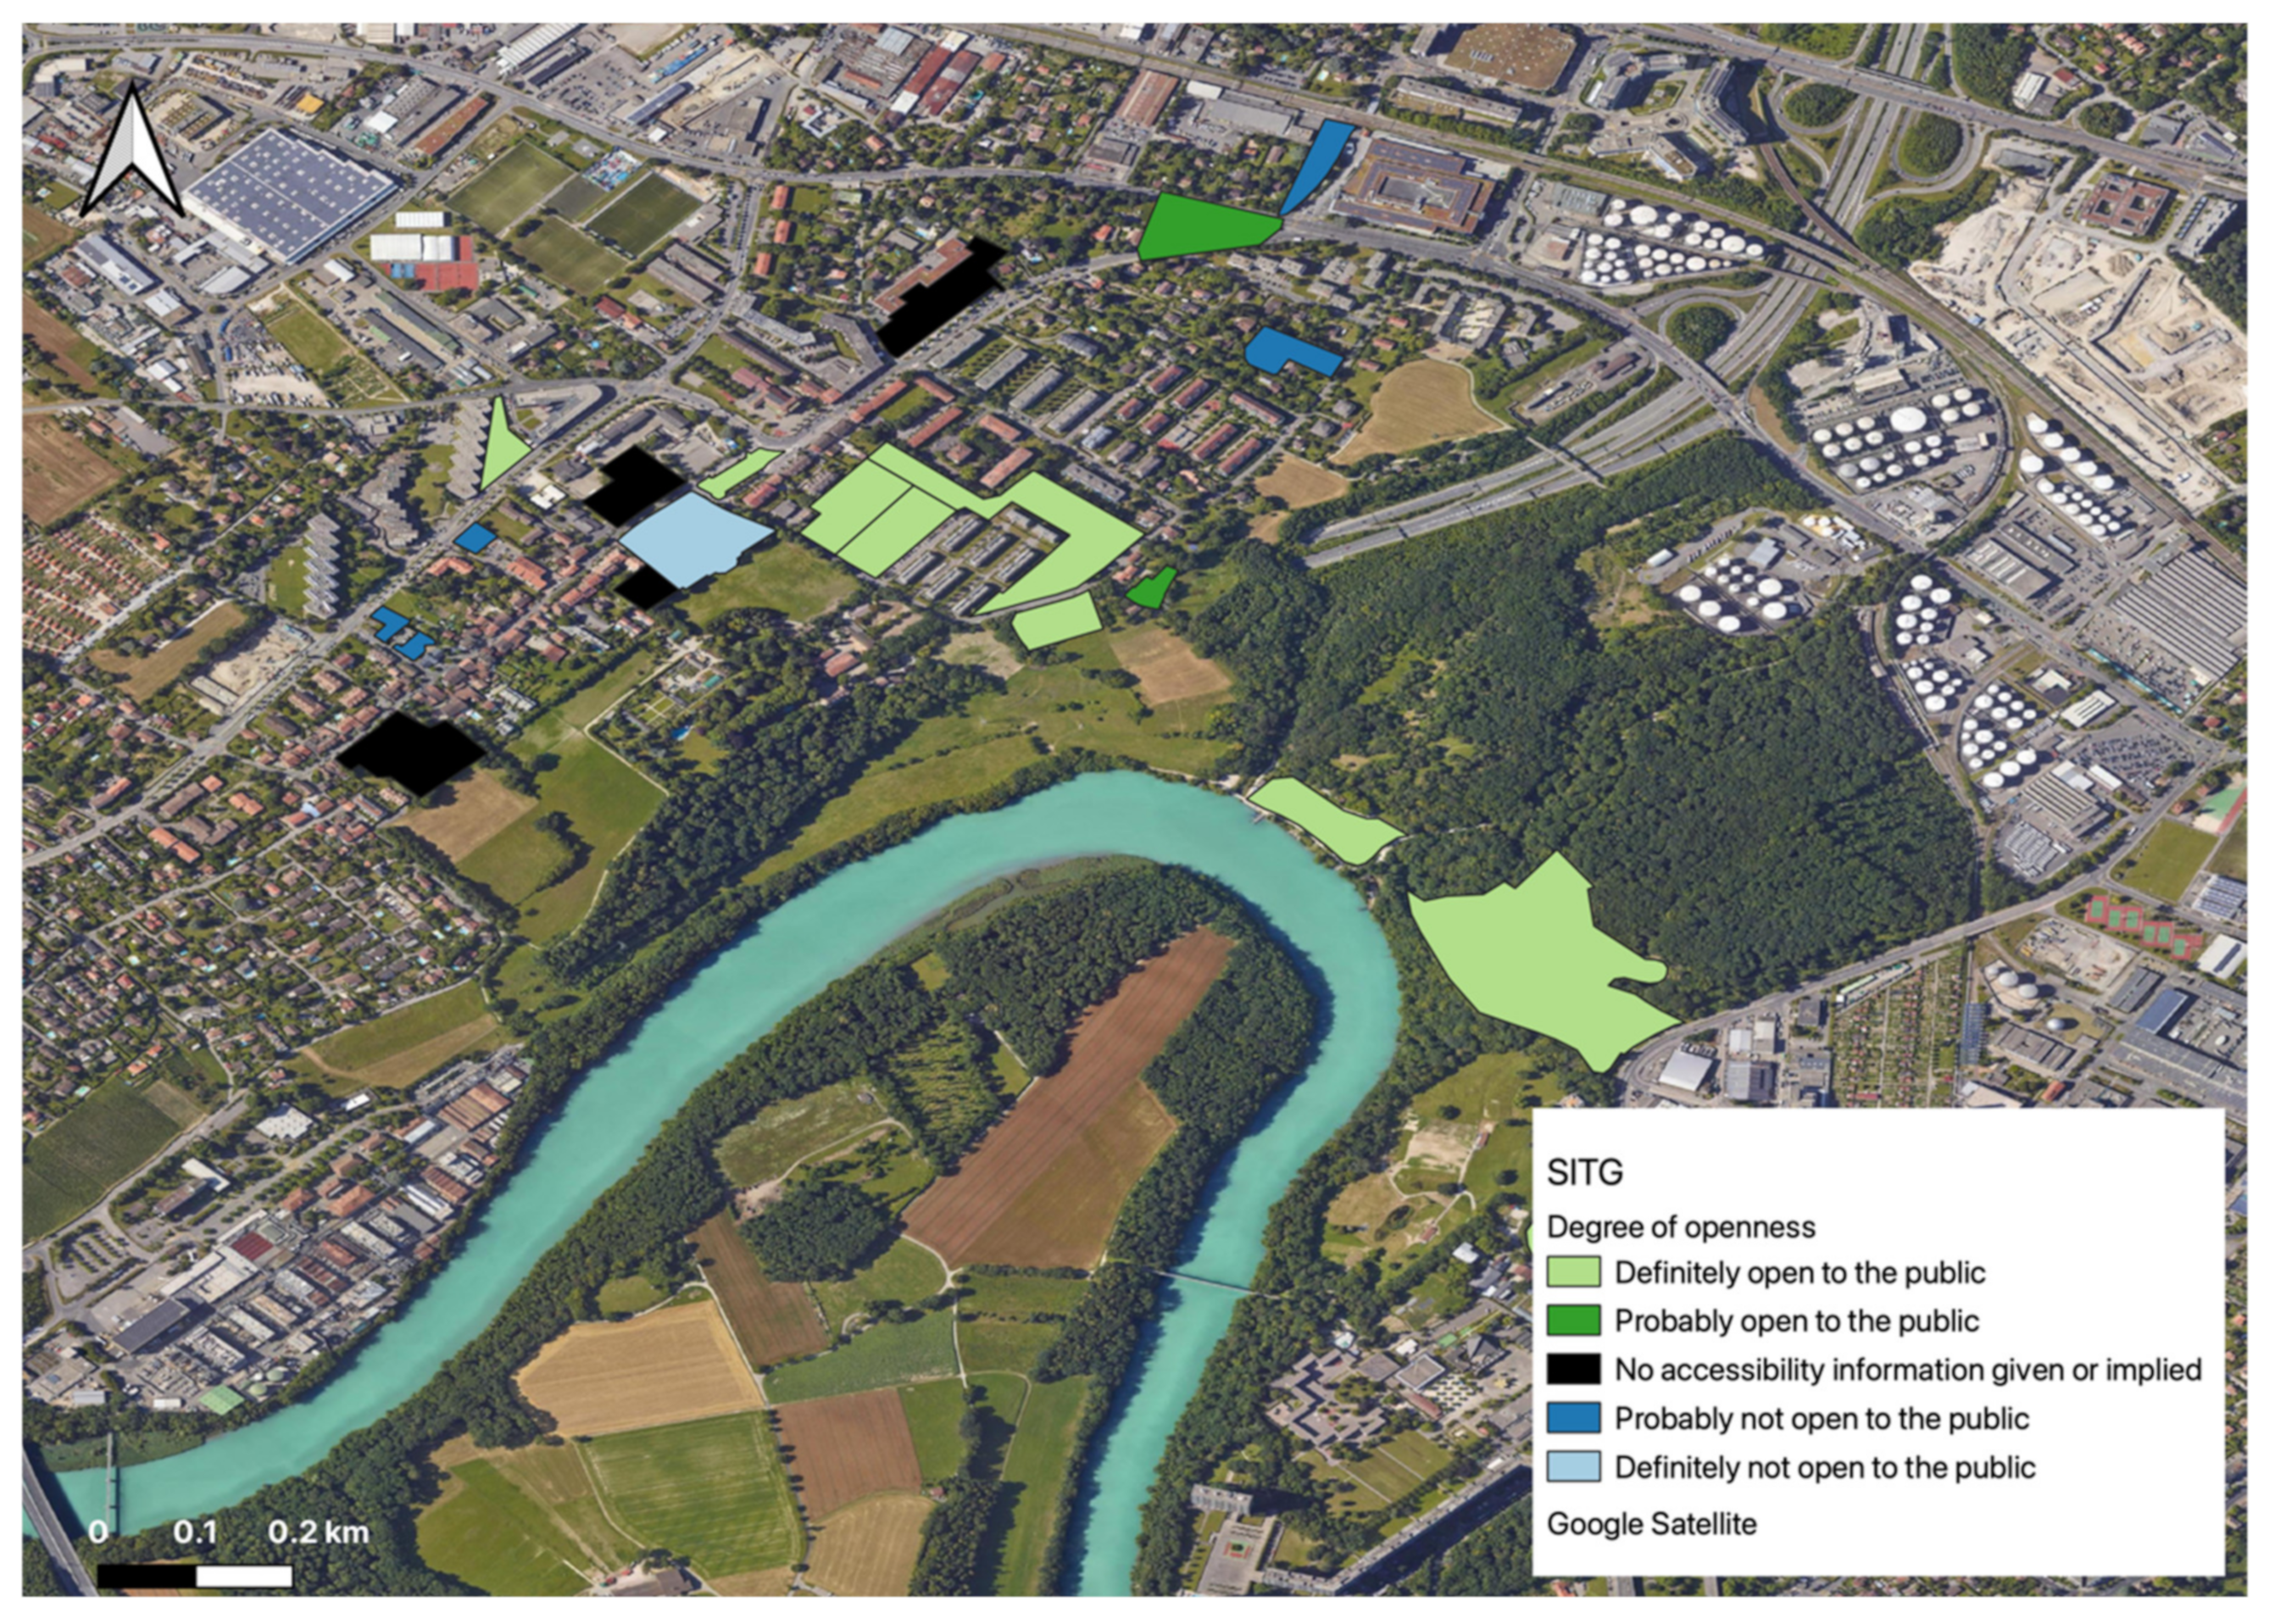
2.2.3. Creation of a Public/Private Mask
- Definitely open to the public although a fee may be required (Light green).
- Probably open to the public (Dark green).
- No accessibility information given or implied (Black).
- Probably not open to the public (Dark blue).
- Definitely not open to the public (Light blue).
- The tag combination is illegal or discouraged (land use = wood or a village green area that is tagged as being private, for example) (Red).
2.2.4. Overlay and Clip Mask with NDVI
2.2.5. Model Physical Accessibility and Coverage of Urban Green Areas
- Accessibility analysis: Compute the traveling time surface, informing the time needed to reach the nearest urban green space.
- Zonal Statistics: Obtain the accessibility coverage for each geographical division.
2.3. A Short Comparison of OSM and Cadaster Data
3. Results
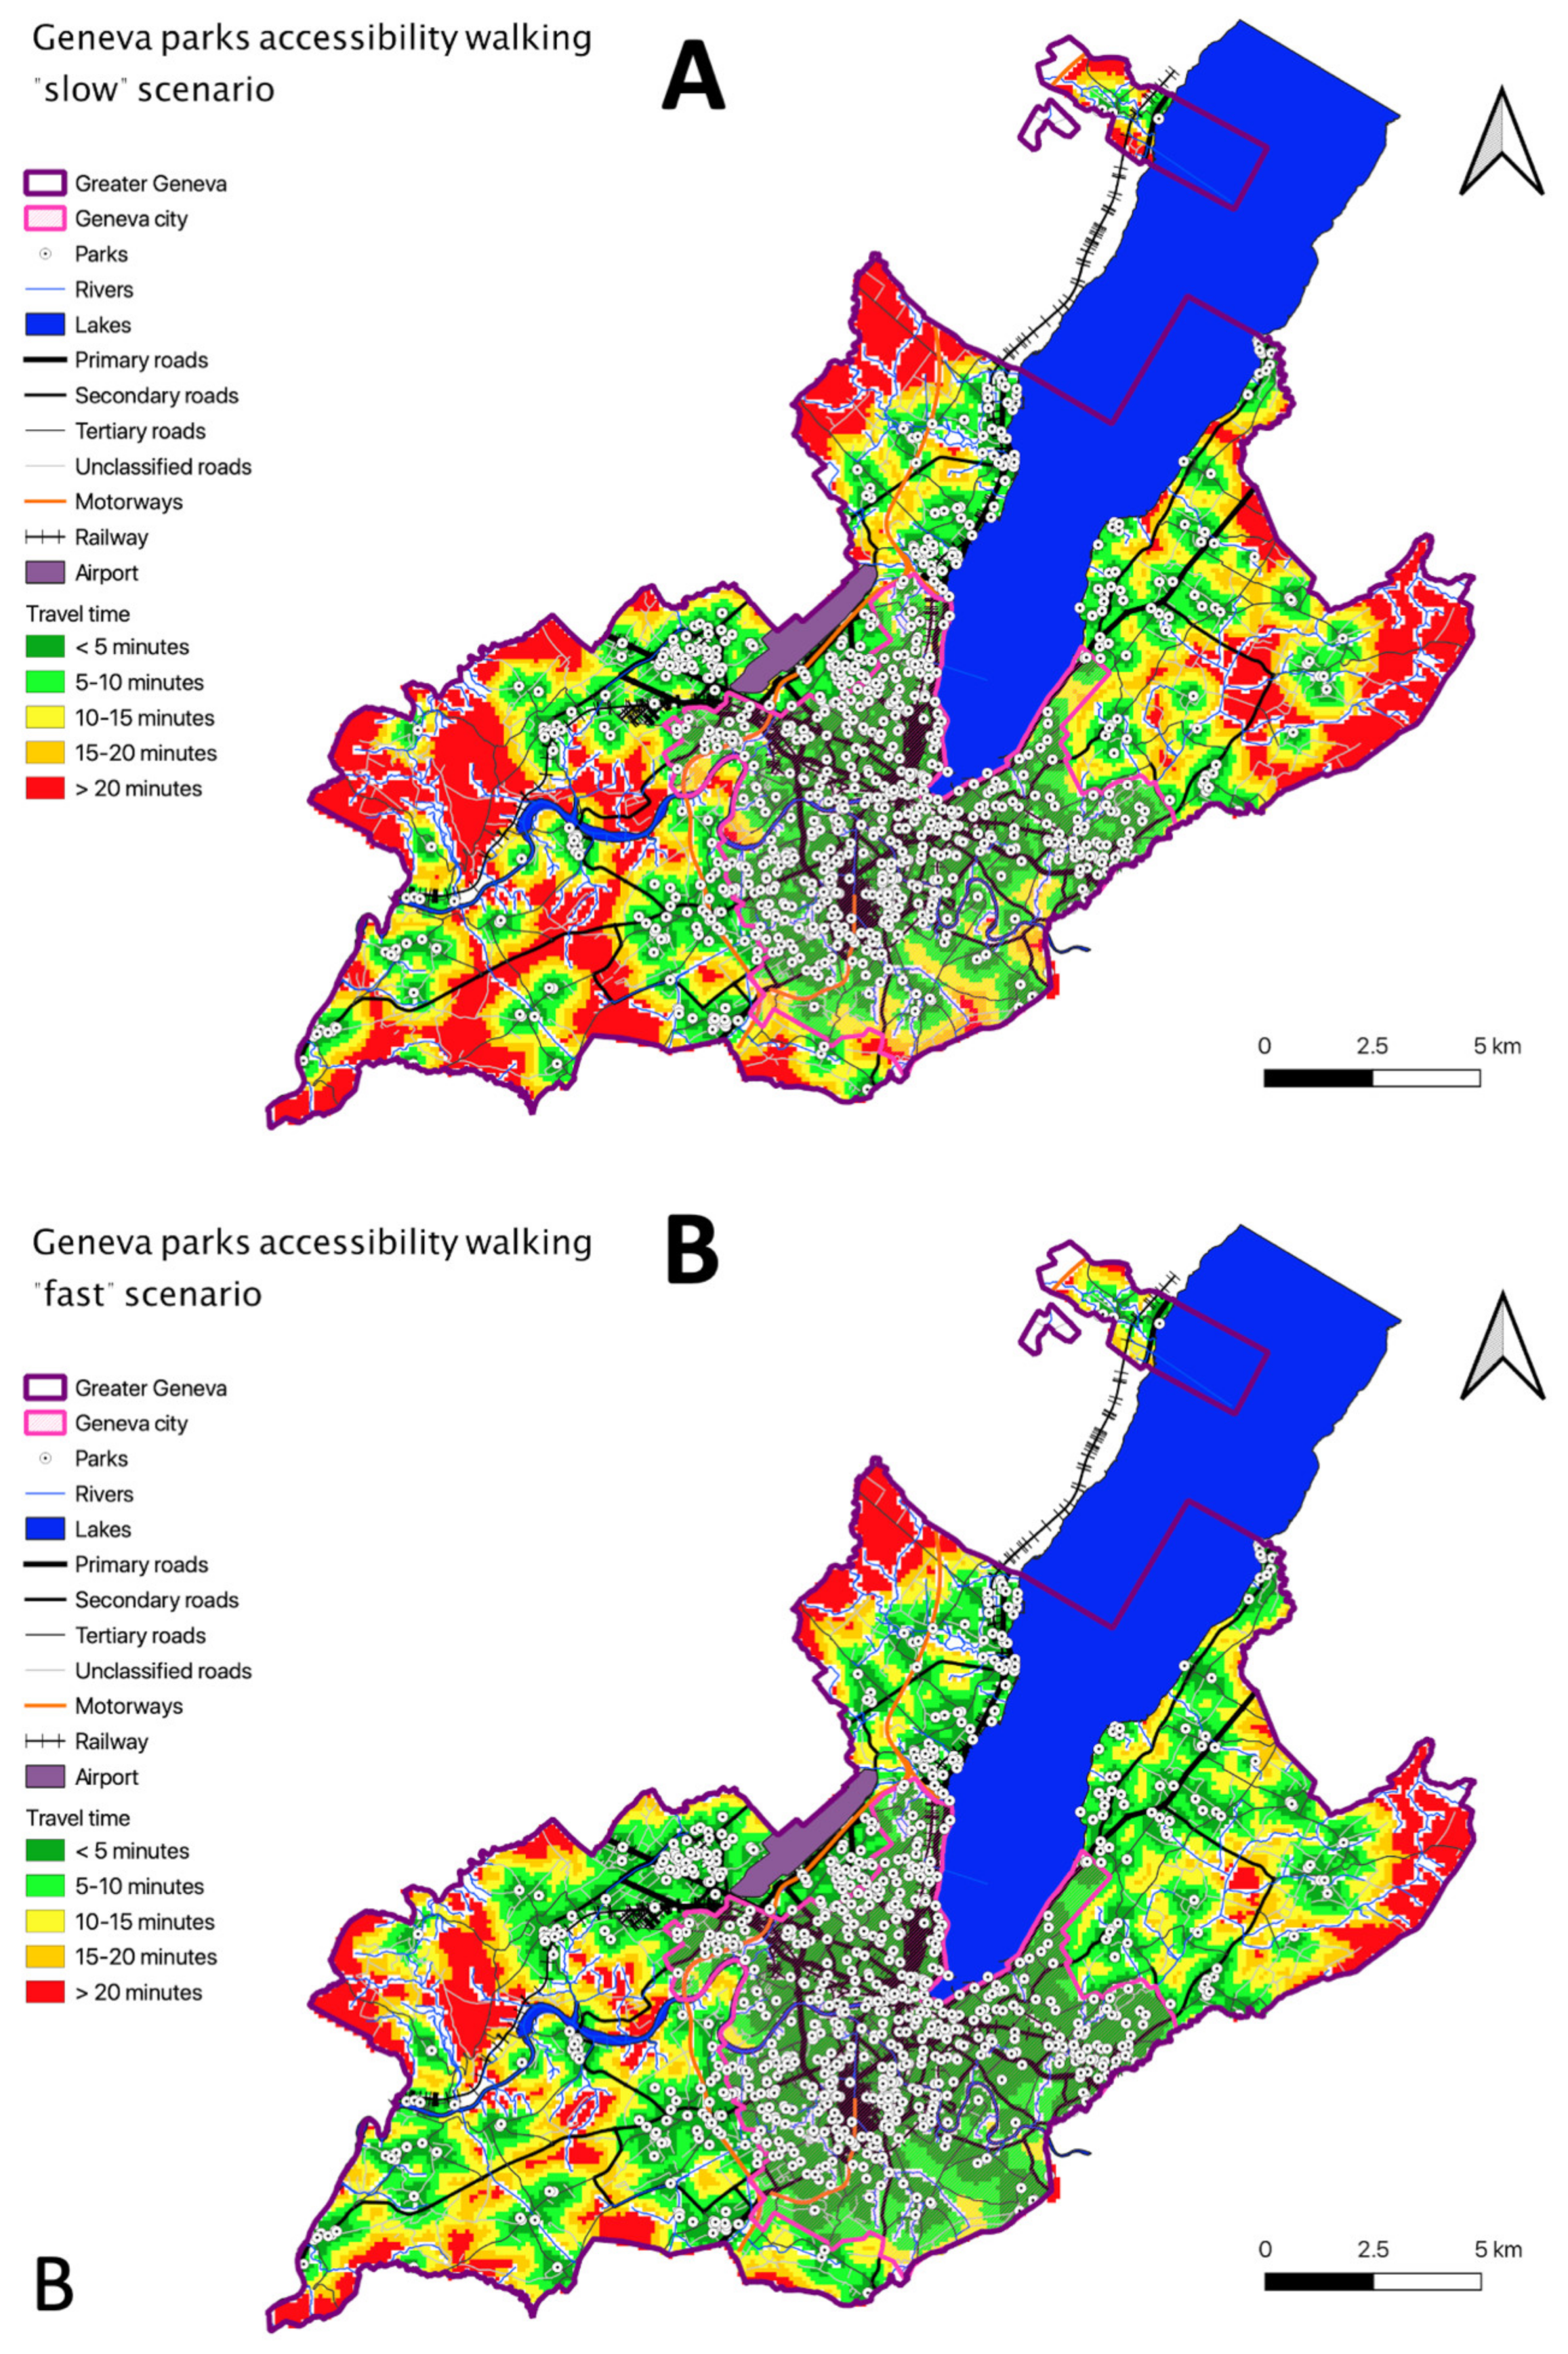
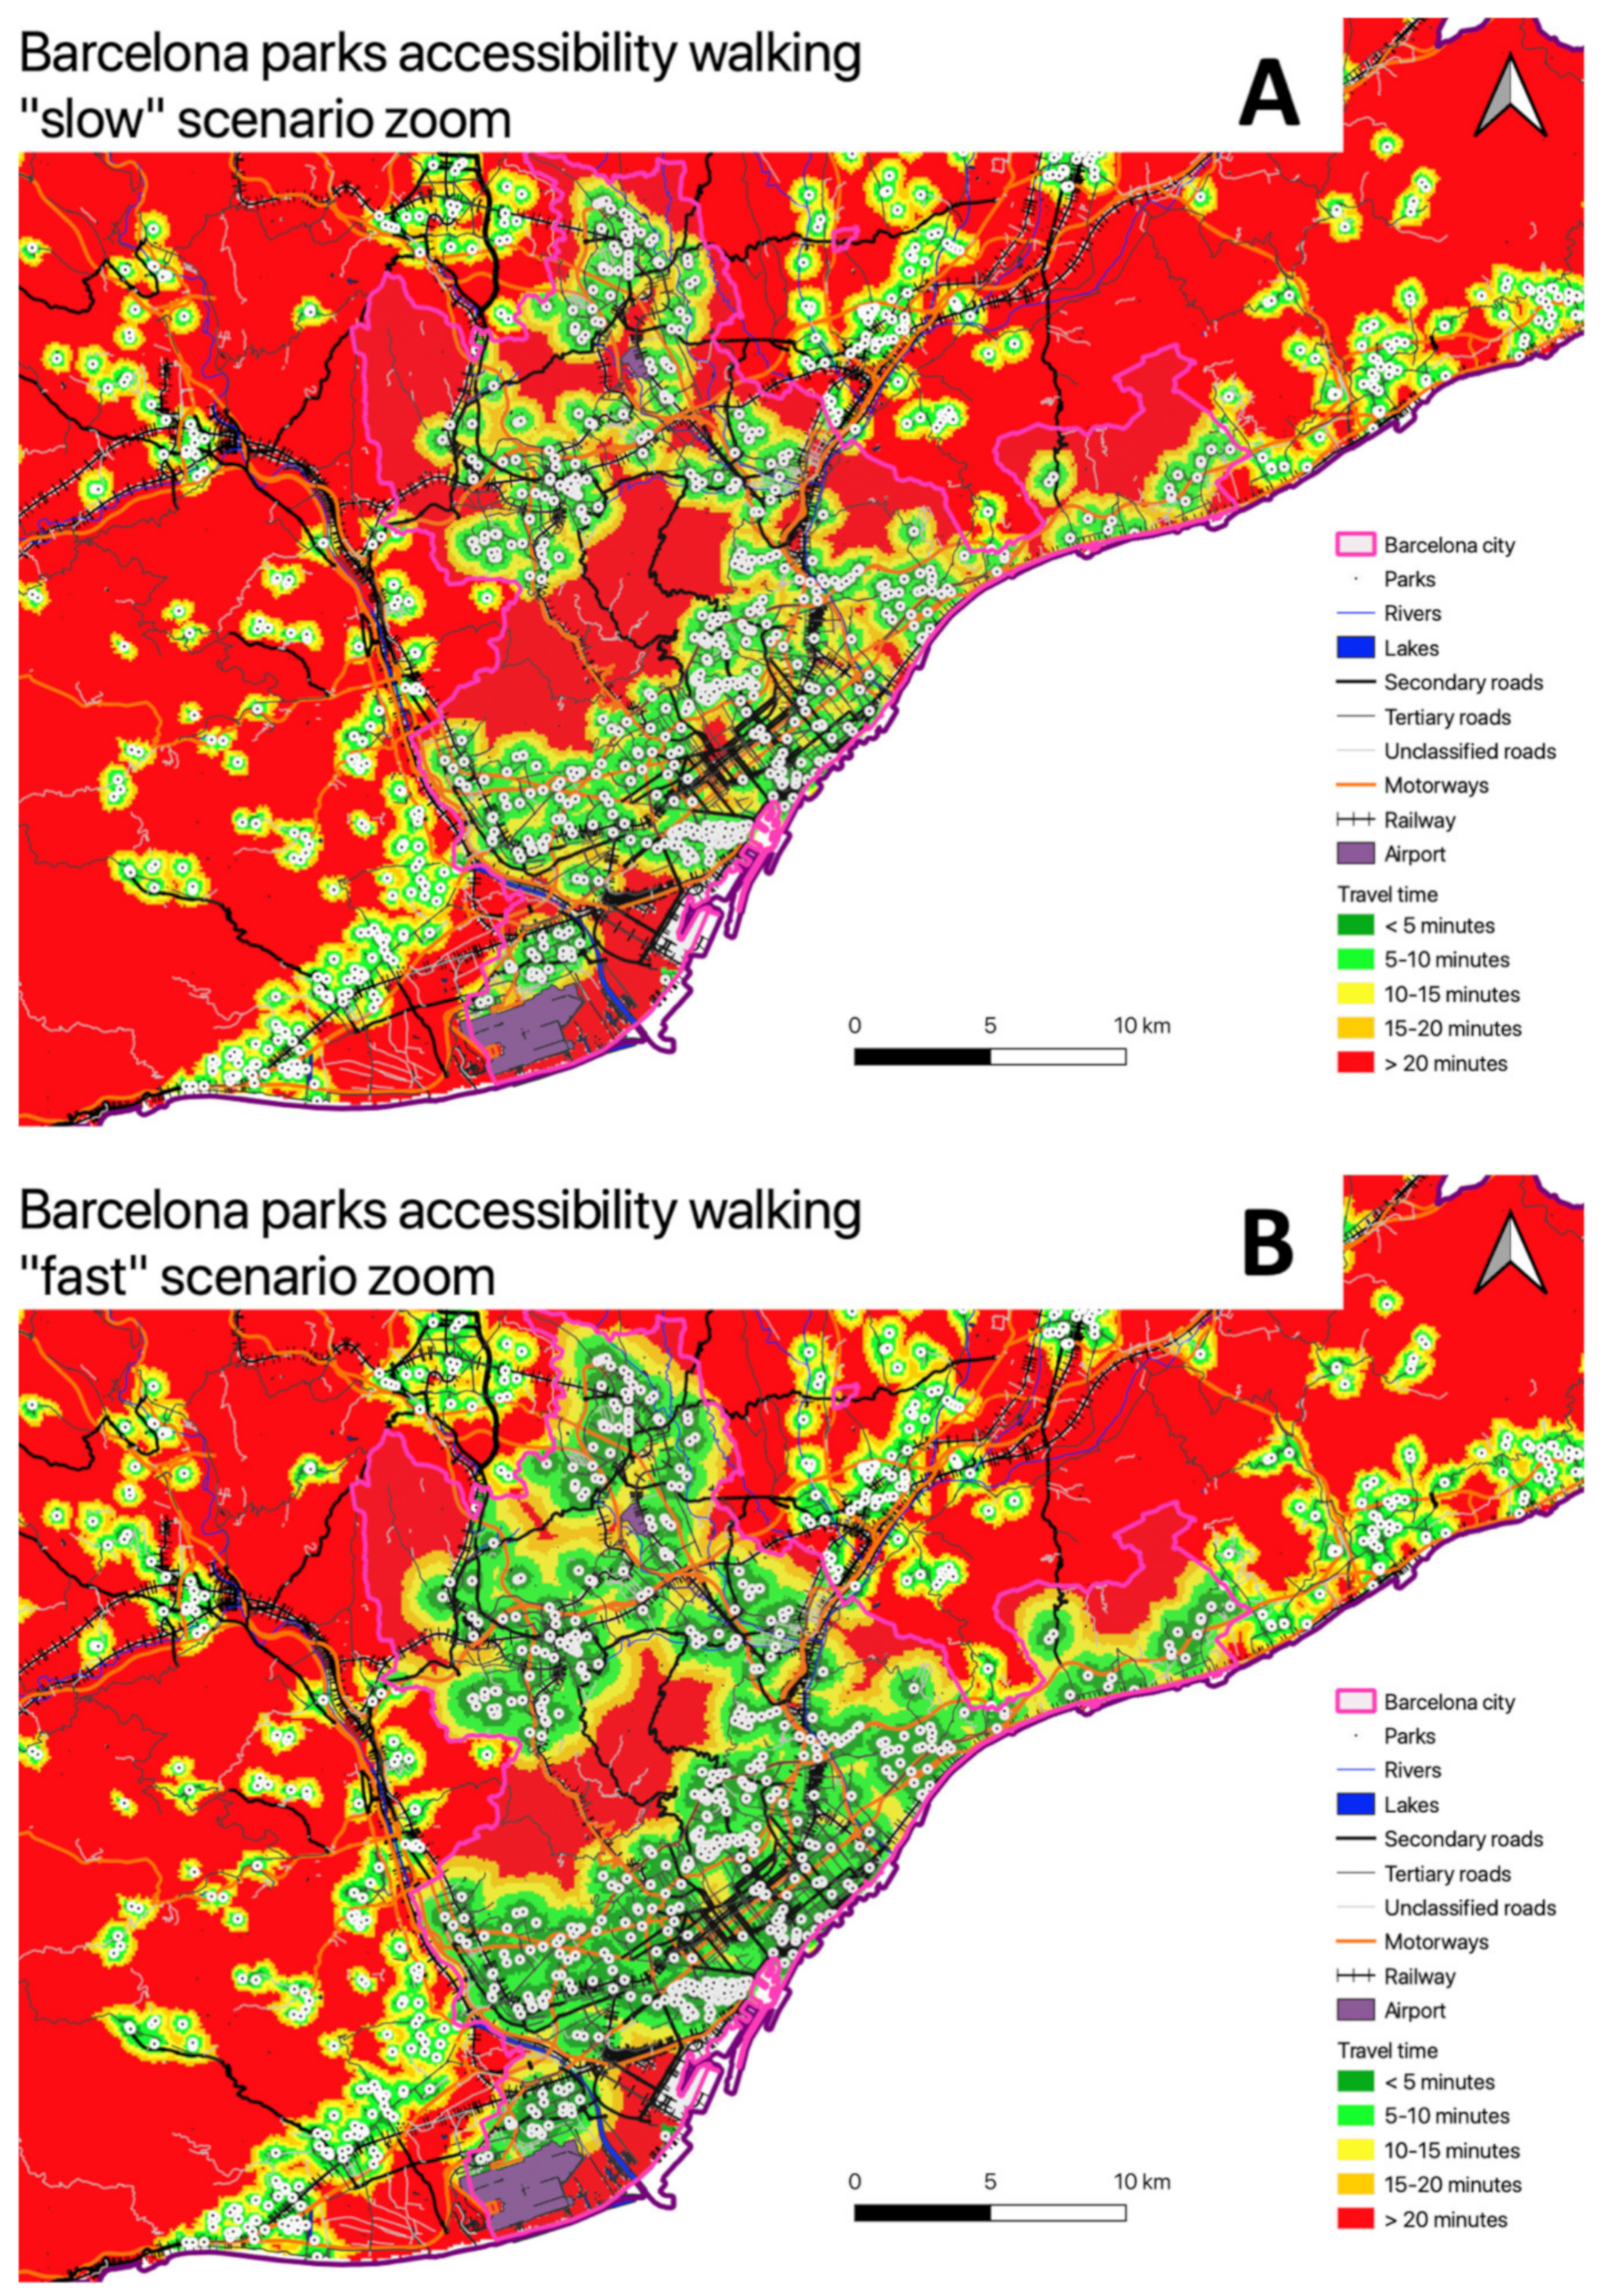
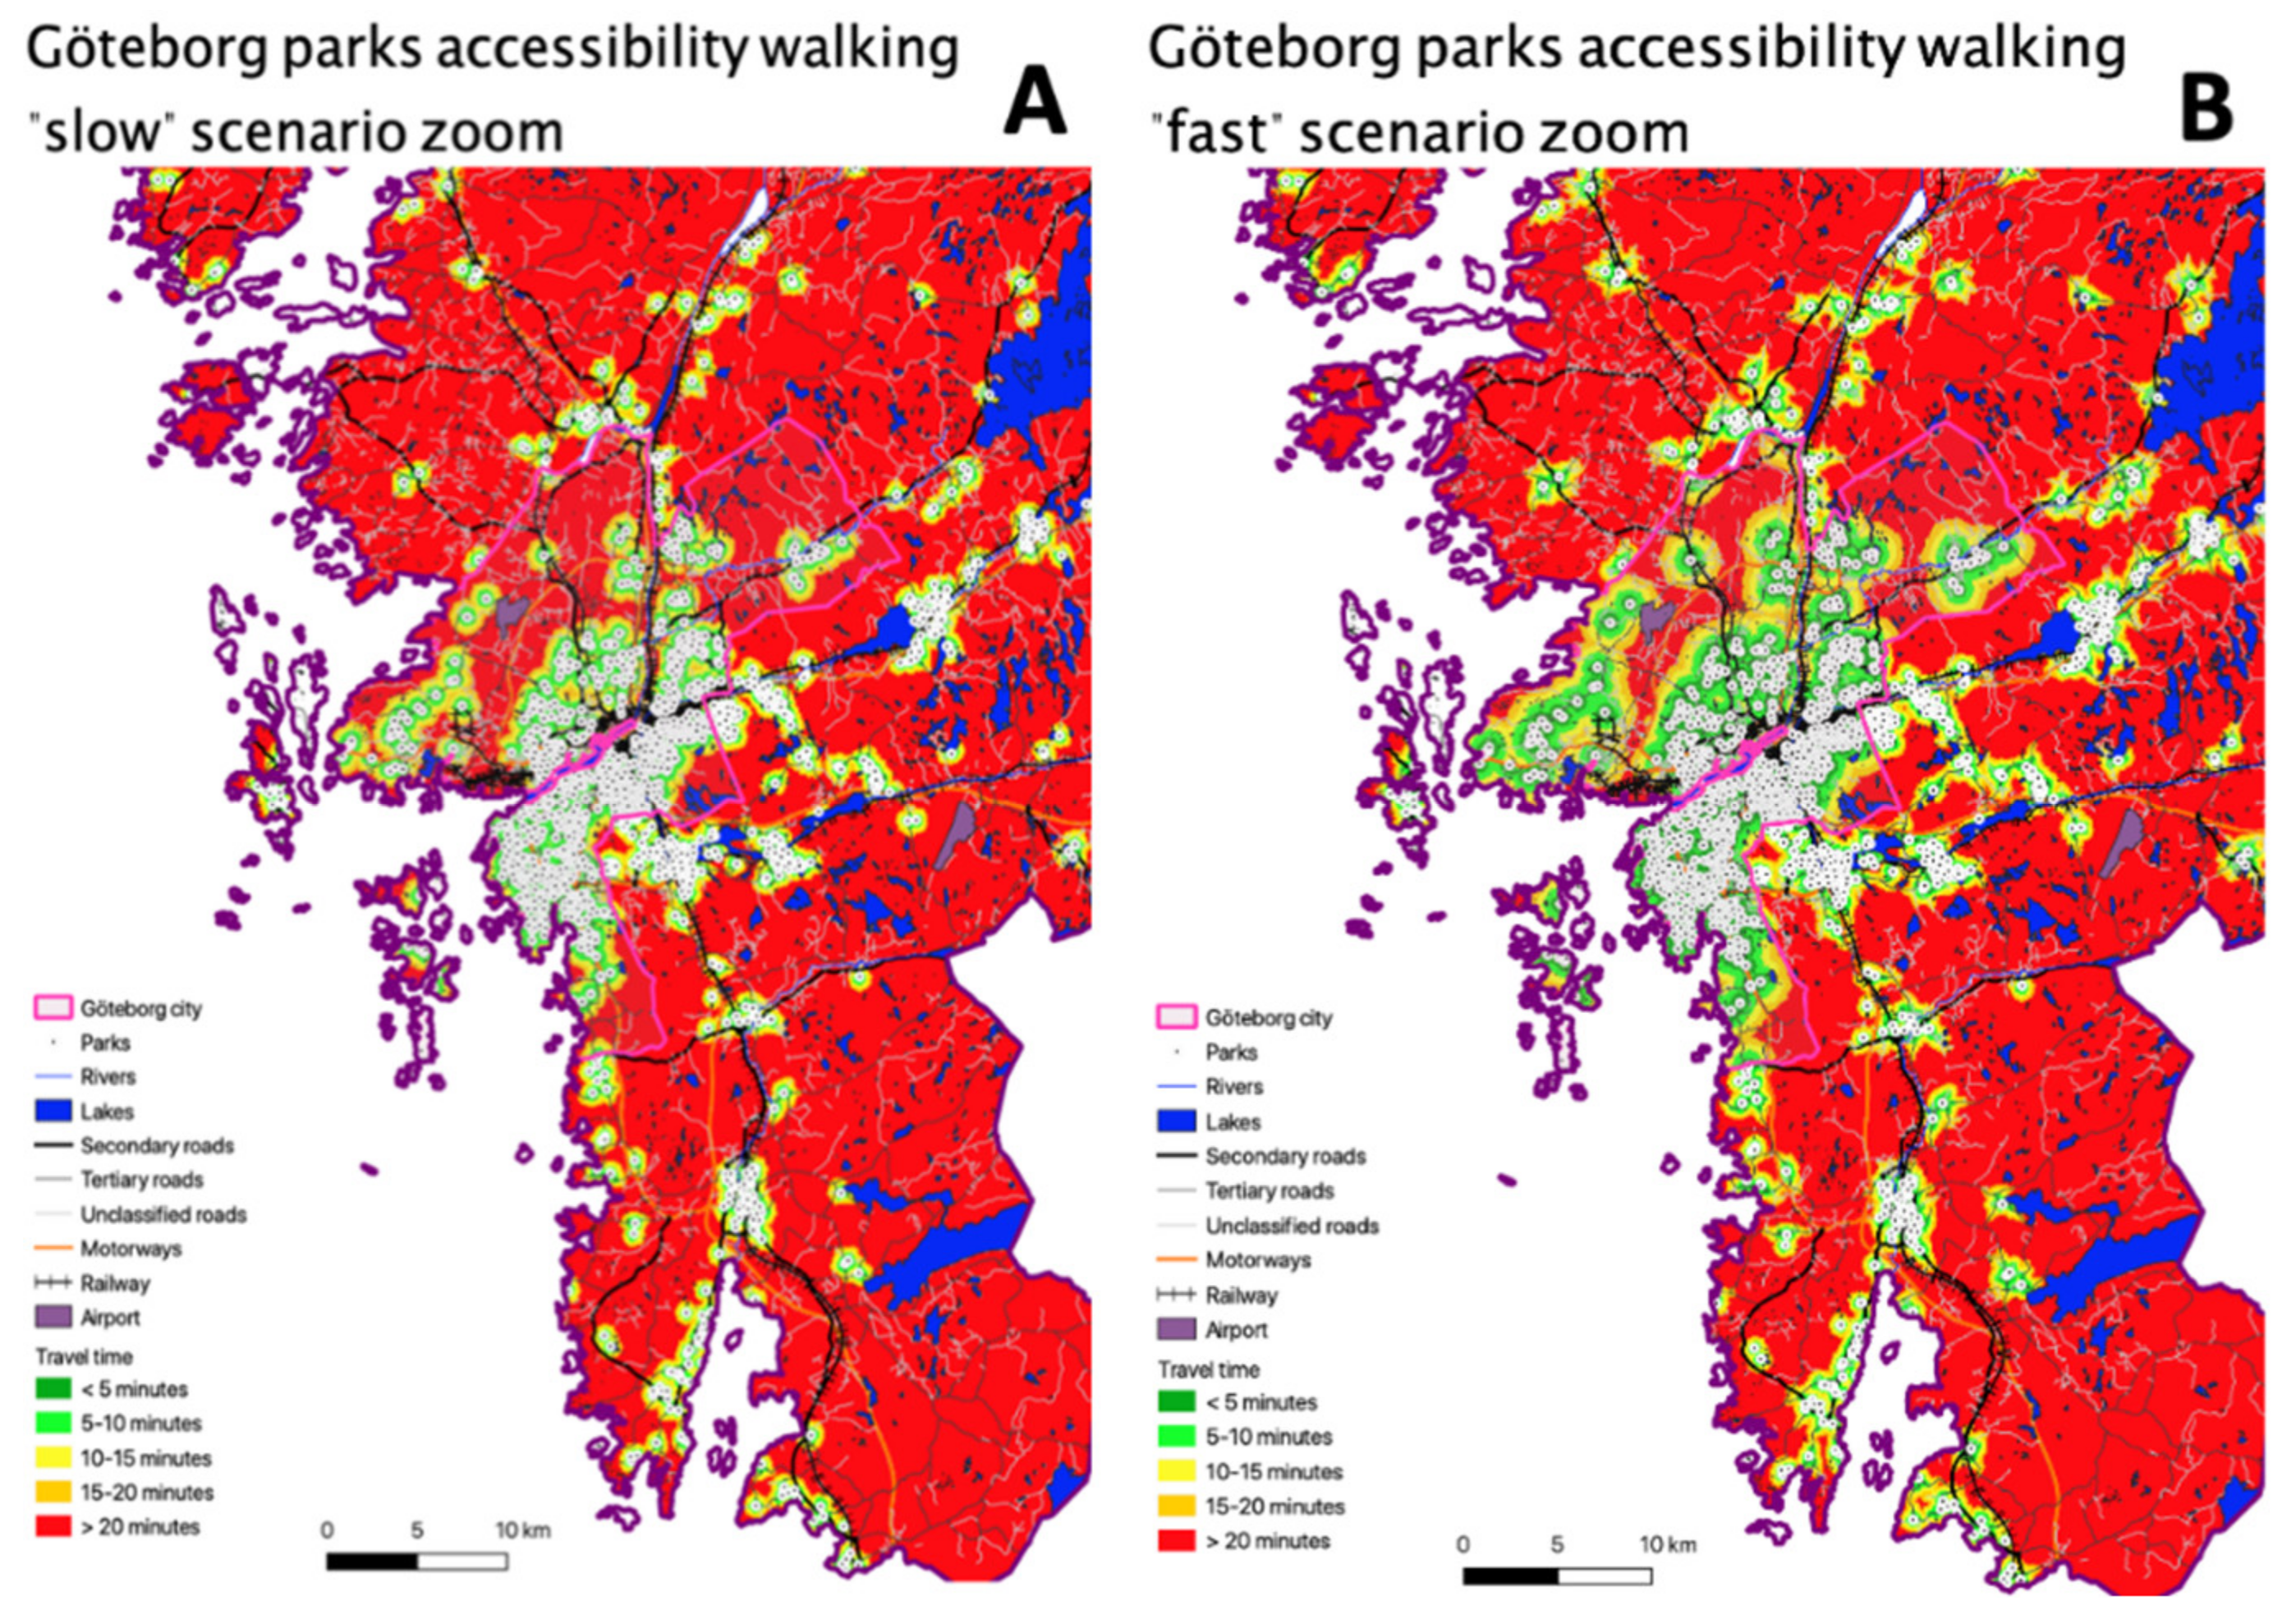
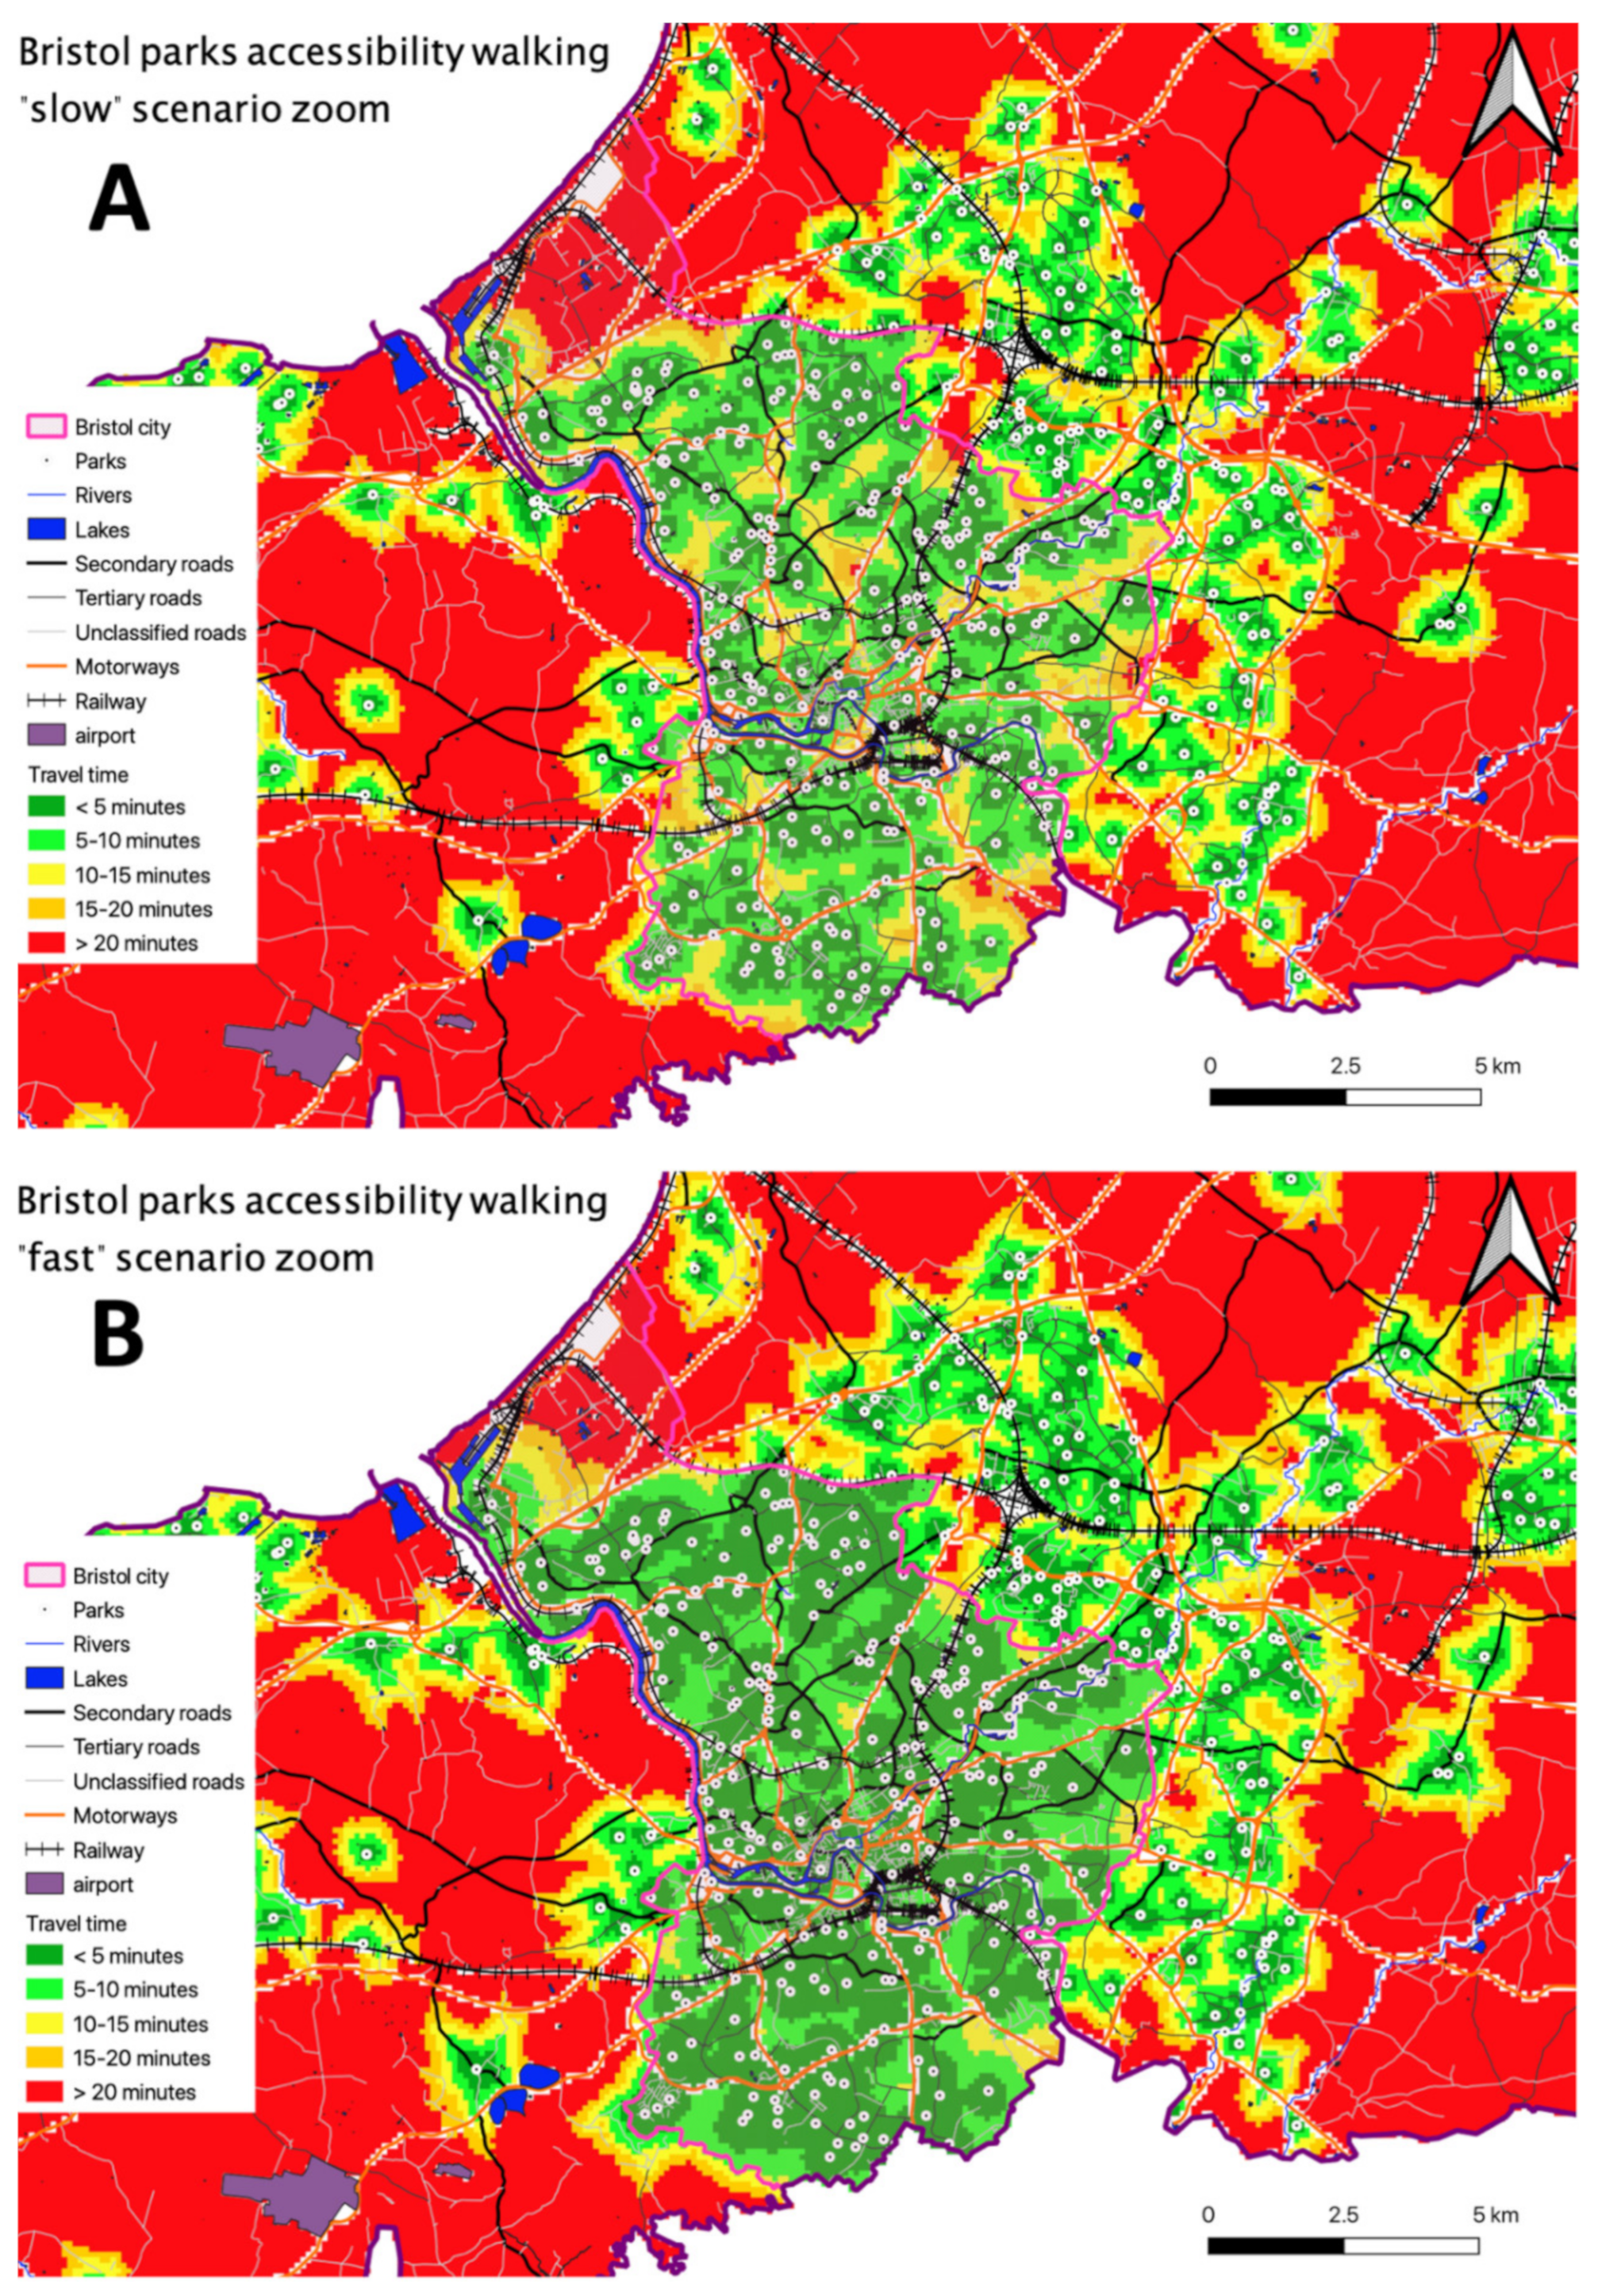
- Scenario “Fast”:
- 5 km/h walking in town and on roads/footpaths.
- 2 km/h walking in rural areas off-road.
- Scenario “slow”:
- 3 km/h walking in town and on roads/footpaths.
- 2 km/h walking in rural areas off-road.
3.1. Accessibility Maps
3.2. Accessibility Statistics
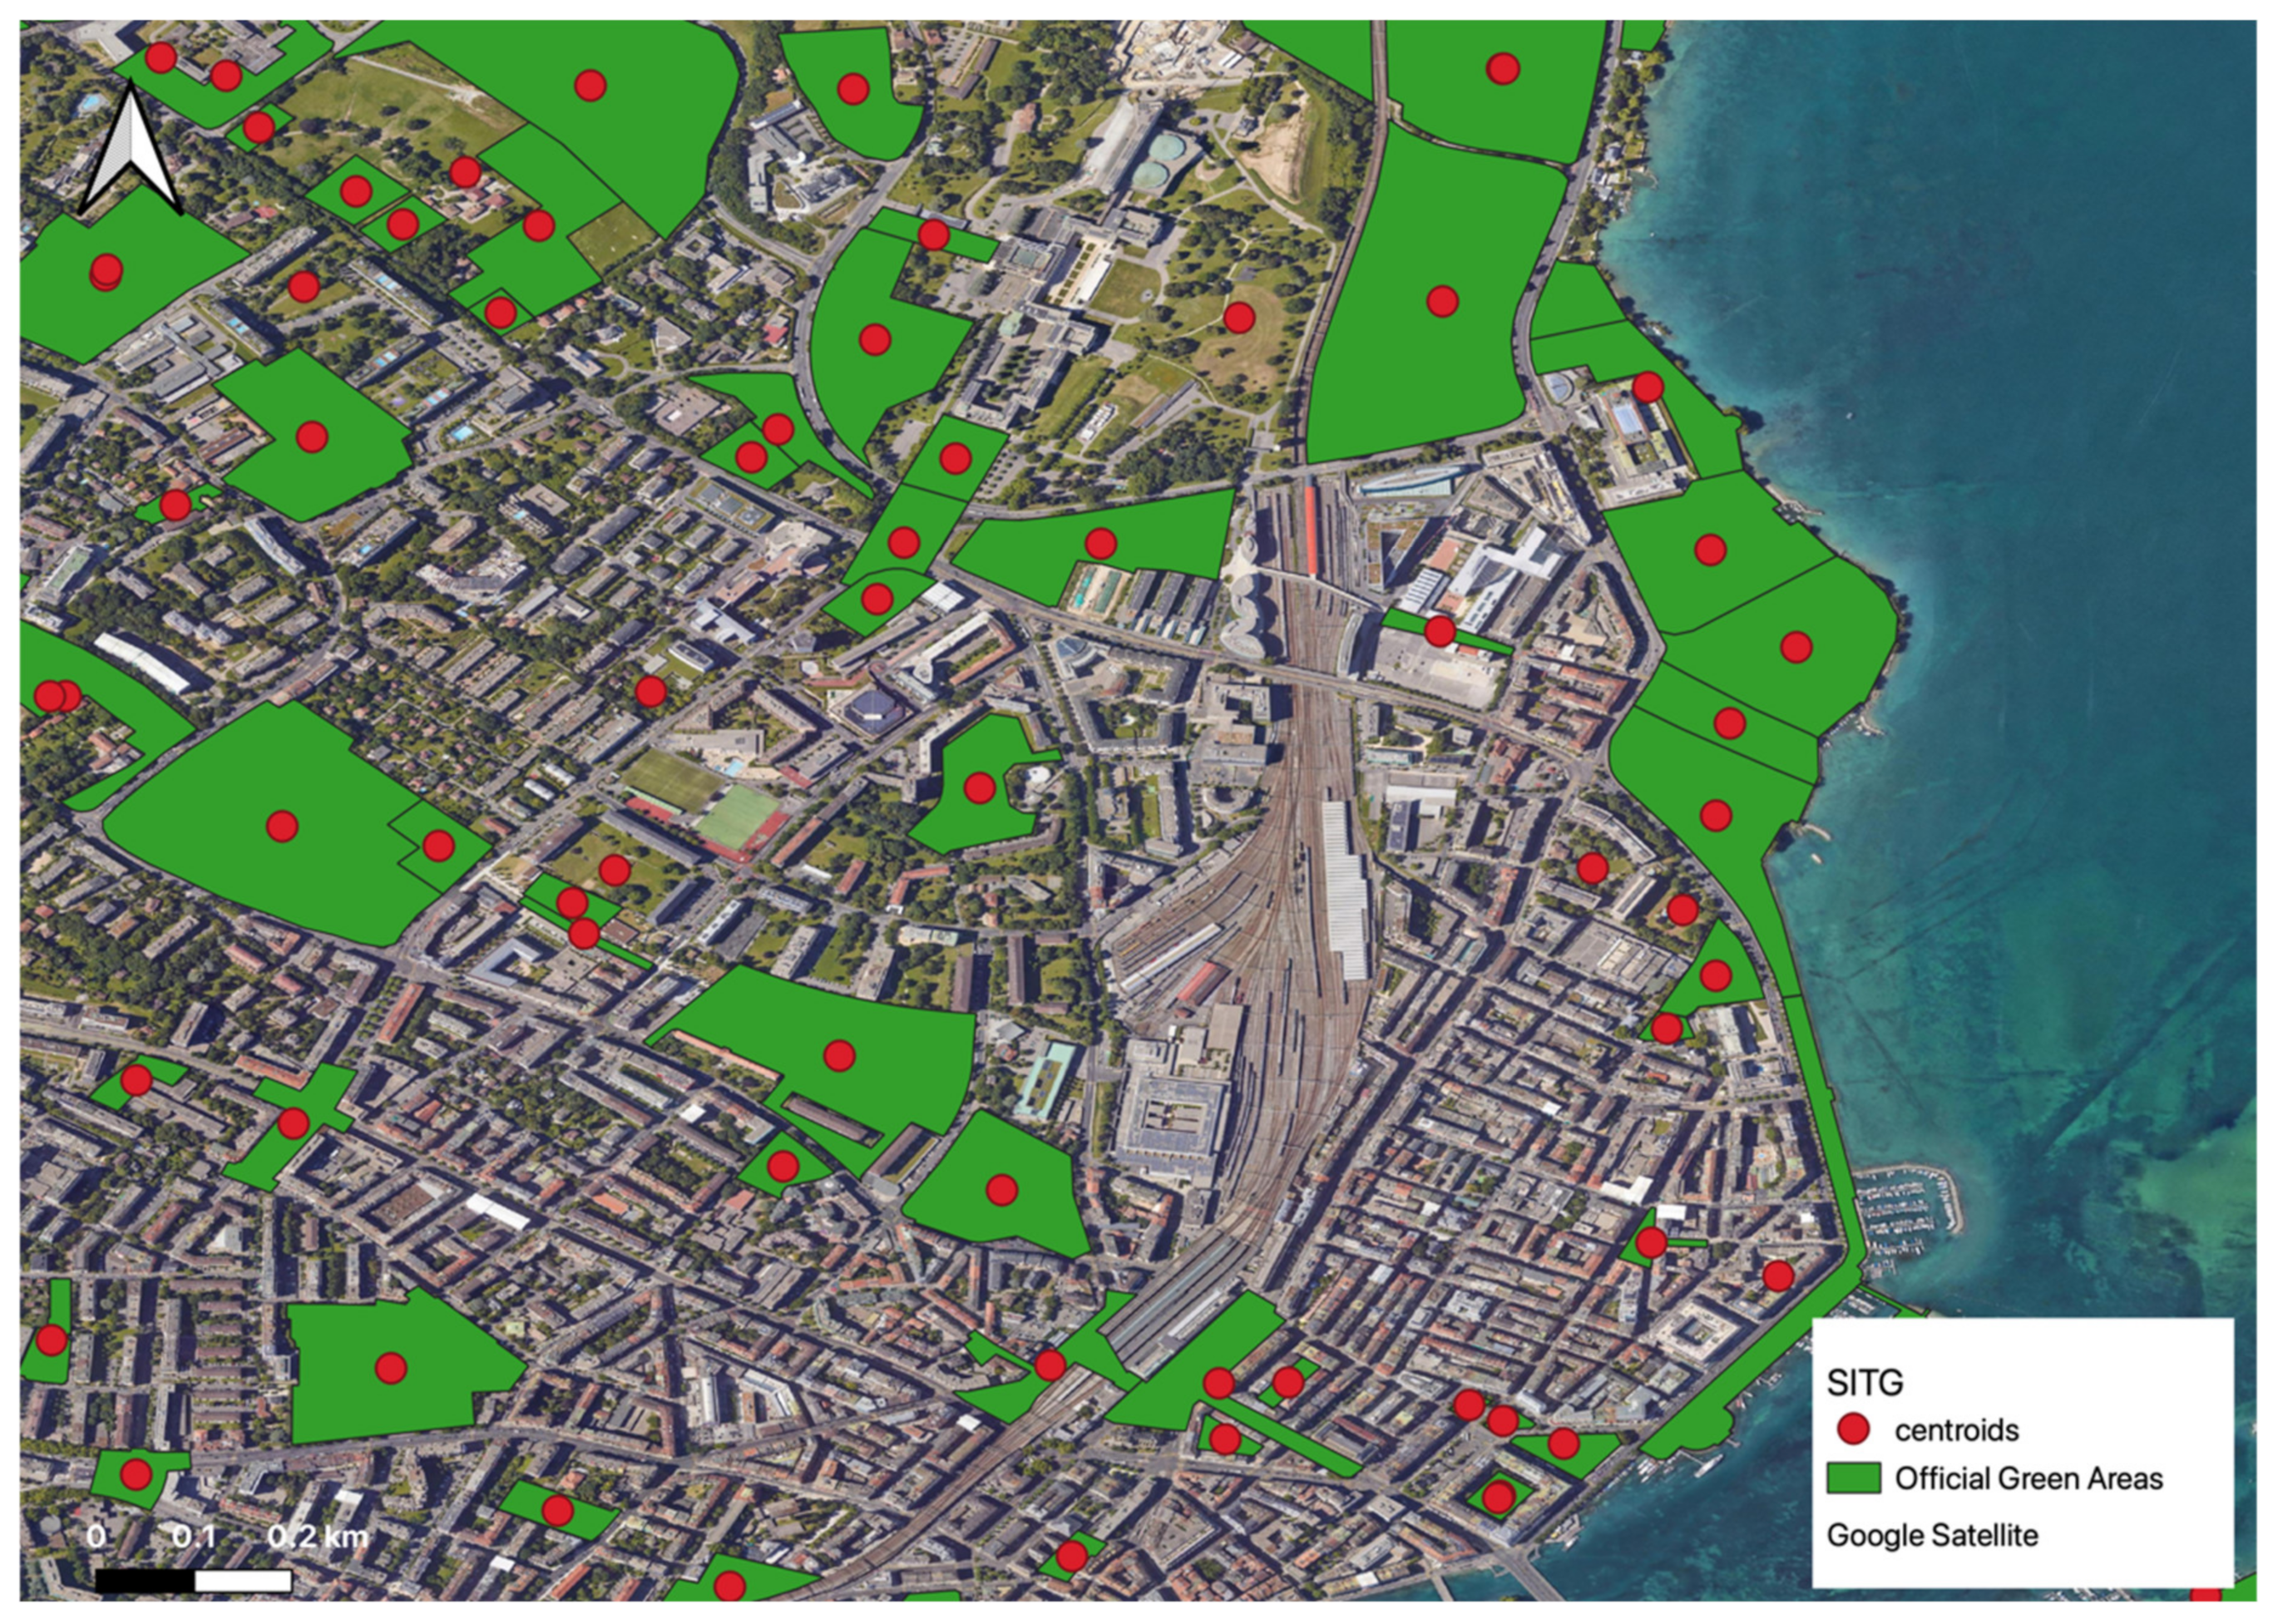
3.3. Comparing the Centroid-Based Approach with Large Park Entrance
3.4. Testing the New Worldpop “Constrained” Data
4. Discussion
4.1. Benefits
4.2. Limitations
- (1)
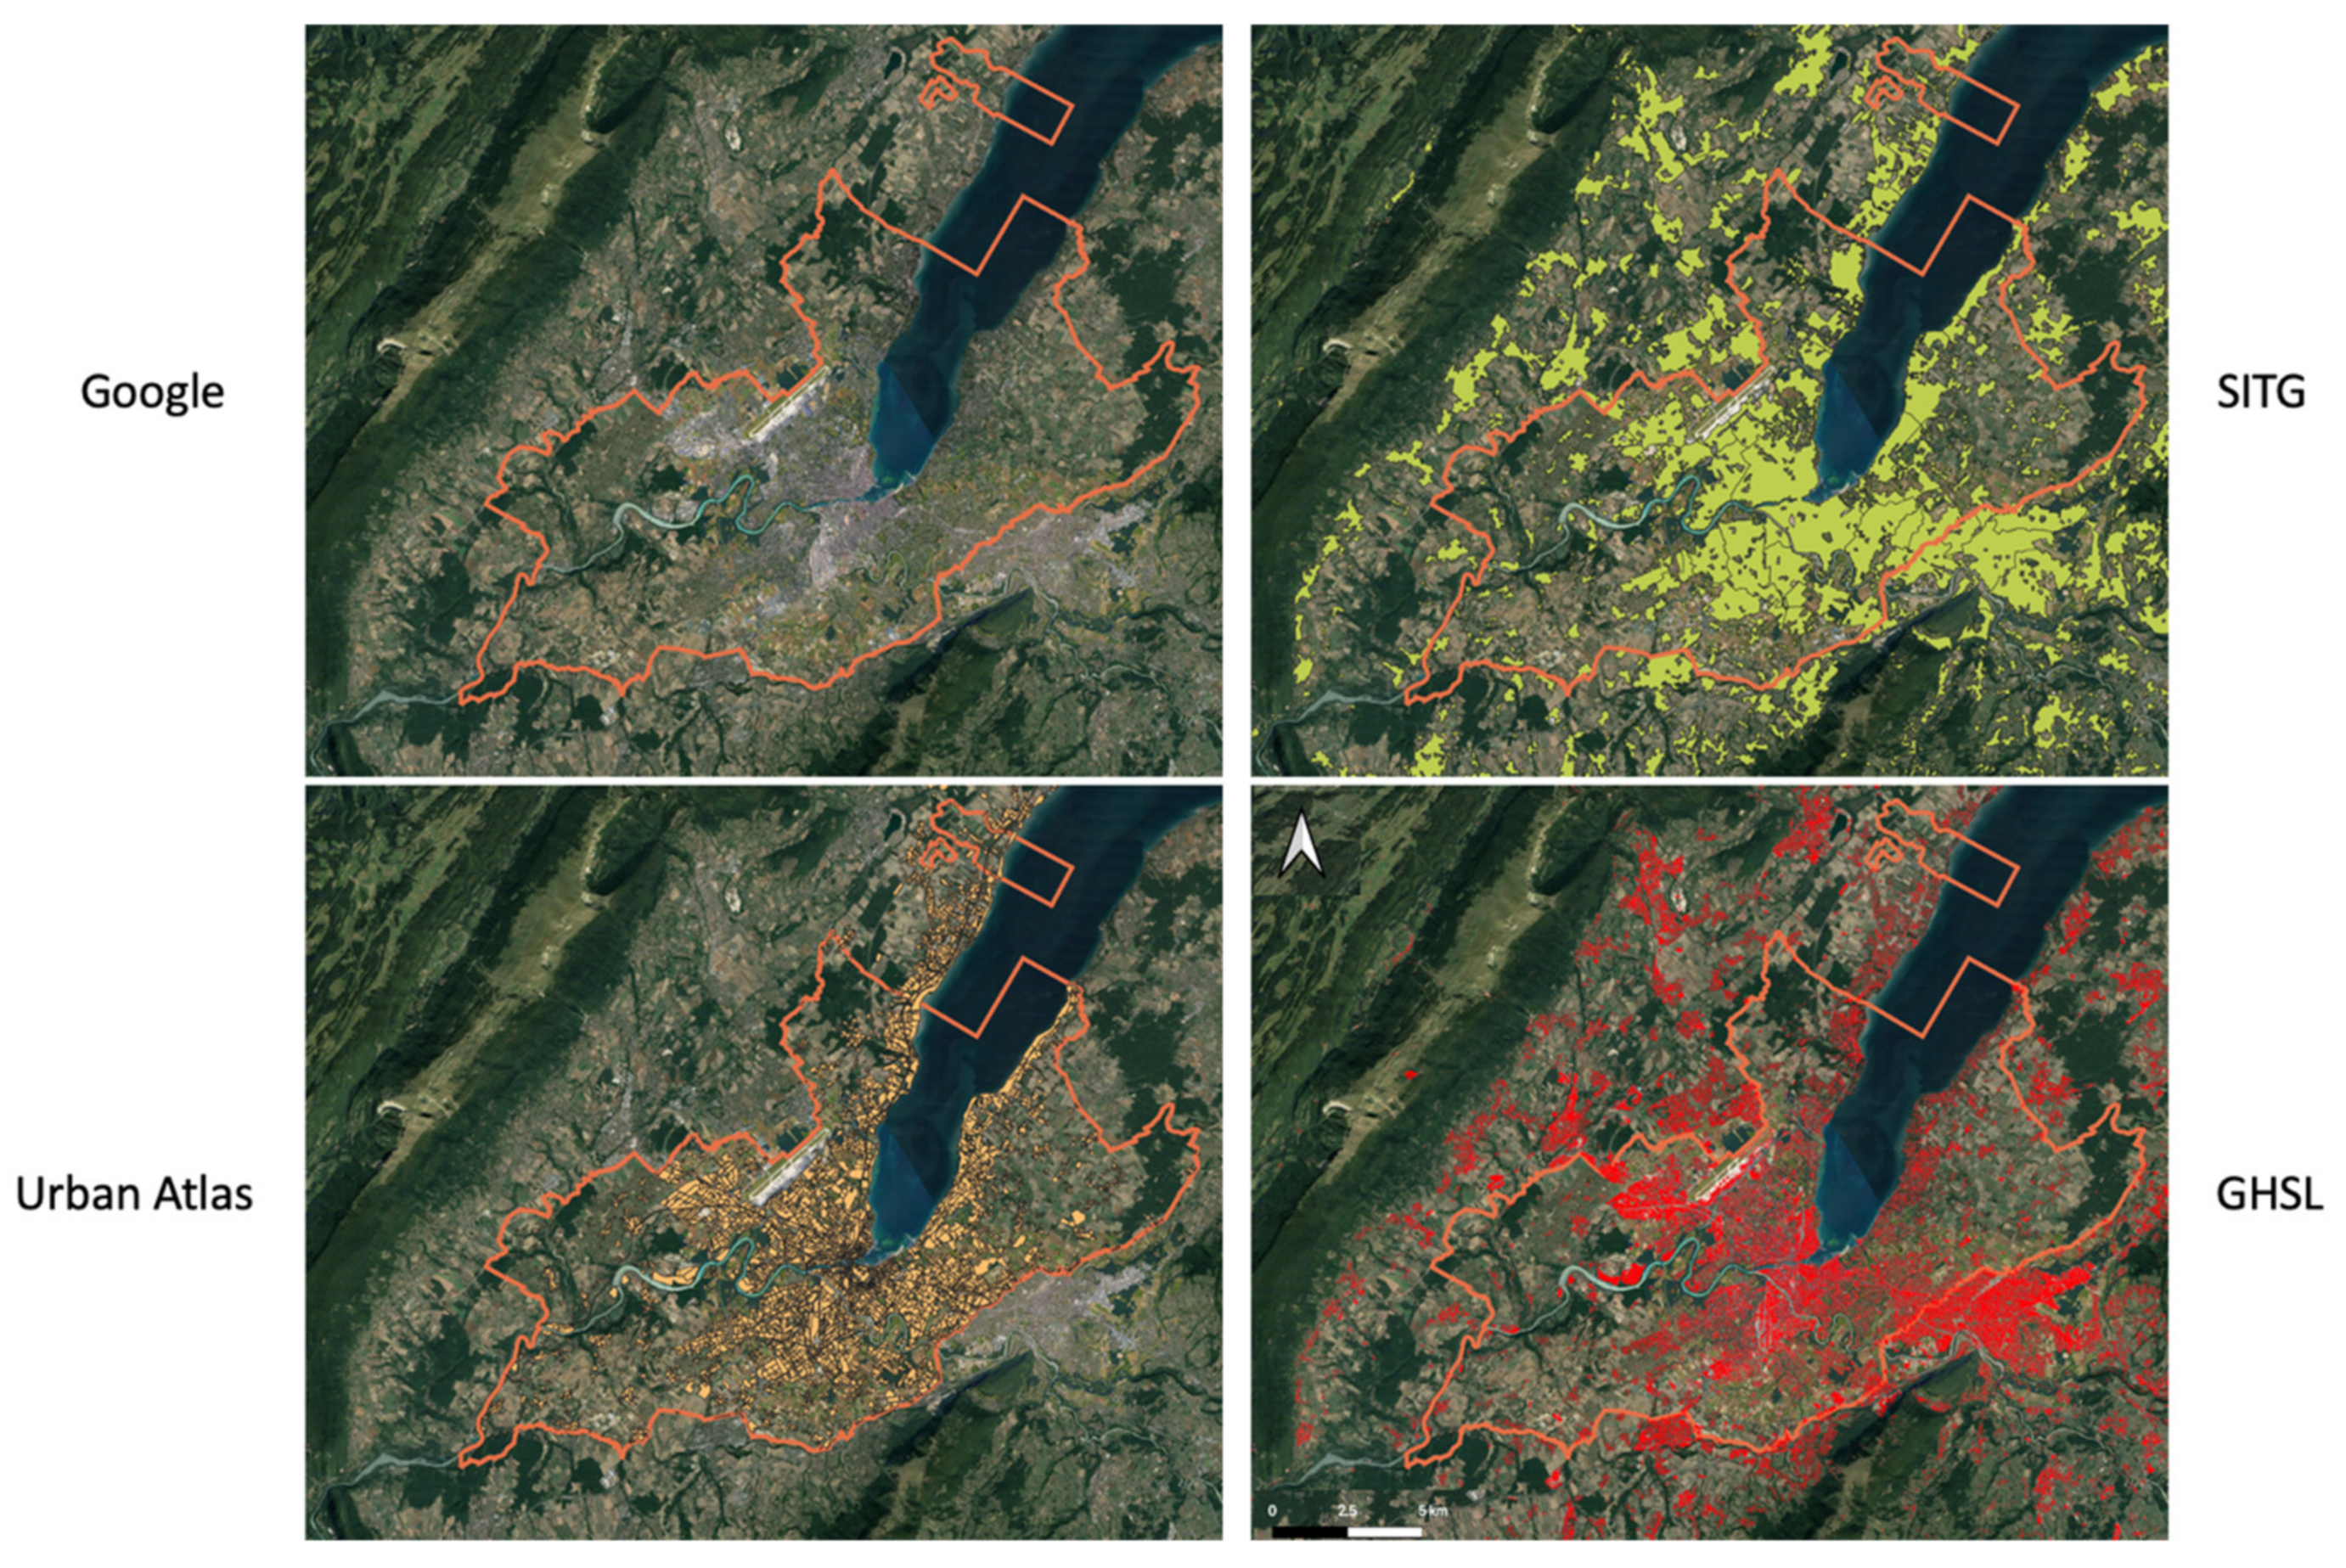
- For a potential scaling-up of the methodology at the global level, and specifically for the identification of built-up areas, the GHSL dataset should be considered instead of Urban Atlas, which covers only Europe. This is important for having a consistent approach to extract built-up areas and to allow comparison between countries/regions.
- (2)
- A key element for measuring this indicator is the identification of private/public spaces. Alternative data sources such as OSM have proved to be a valuable resource in cases where an official land cadaster is not freely available (or at least at an acceptable cost). Purchasing cadaster data from the cities whose green space accessibility needs to be modelled can be expensive and become a major barrier to an effective monitoring of this indicator. Yet, cadaster data would still be required in cases where information of the private/public nature of the parks in OSM is very incomplete.
- (3)
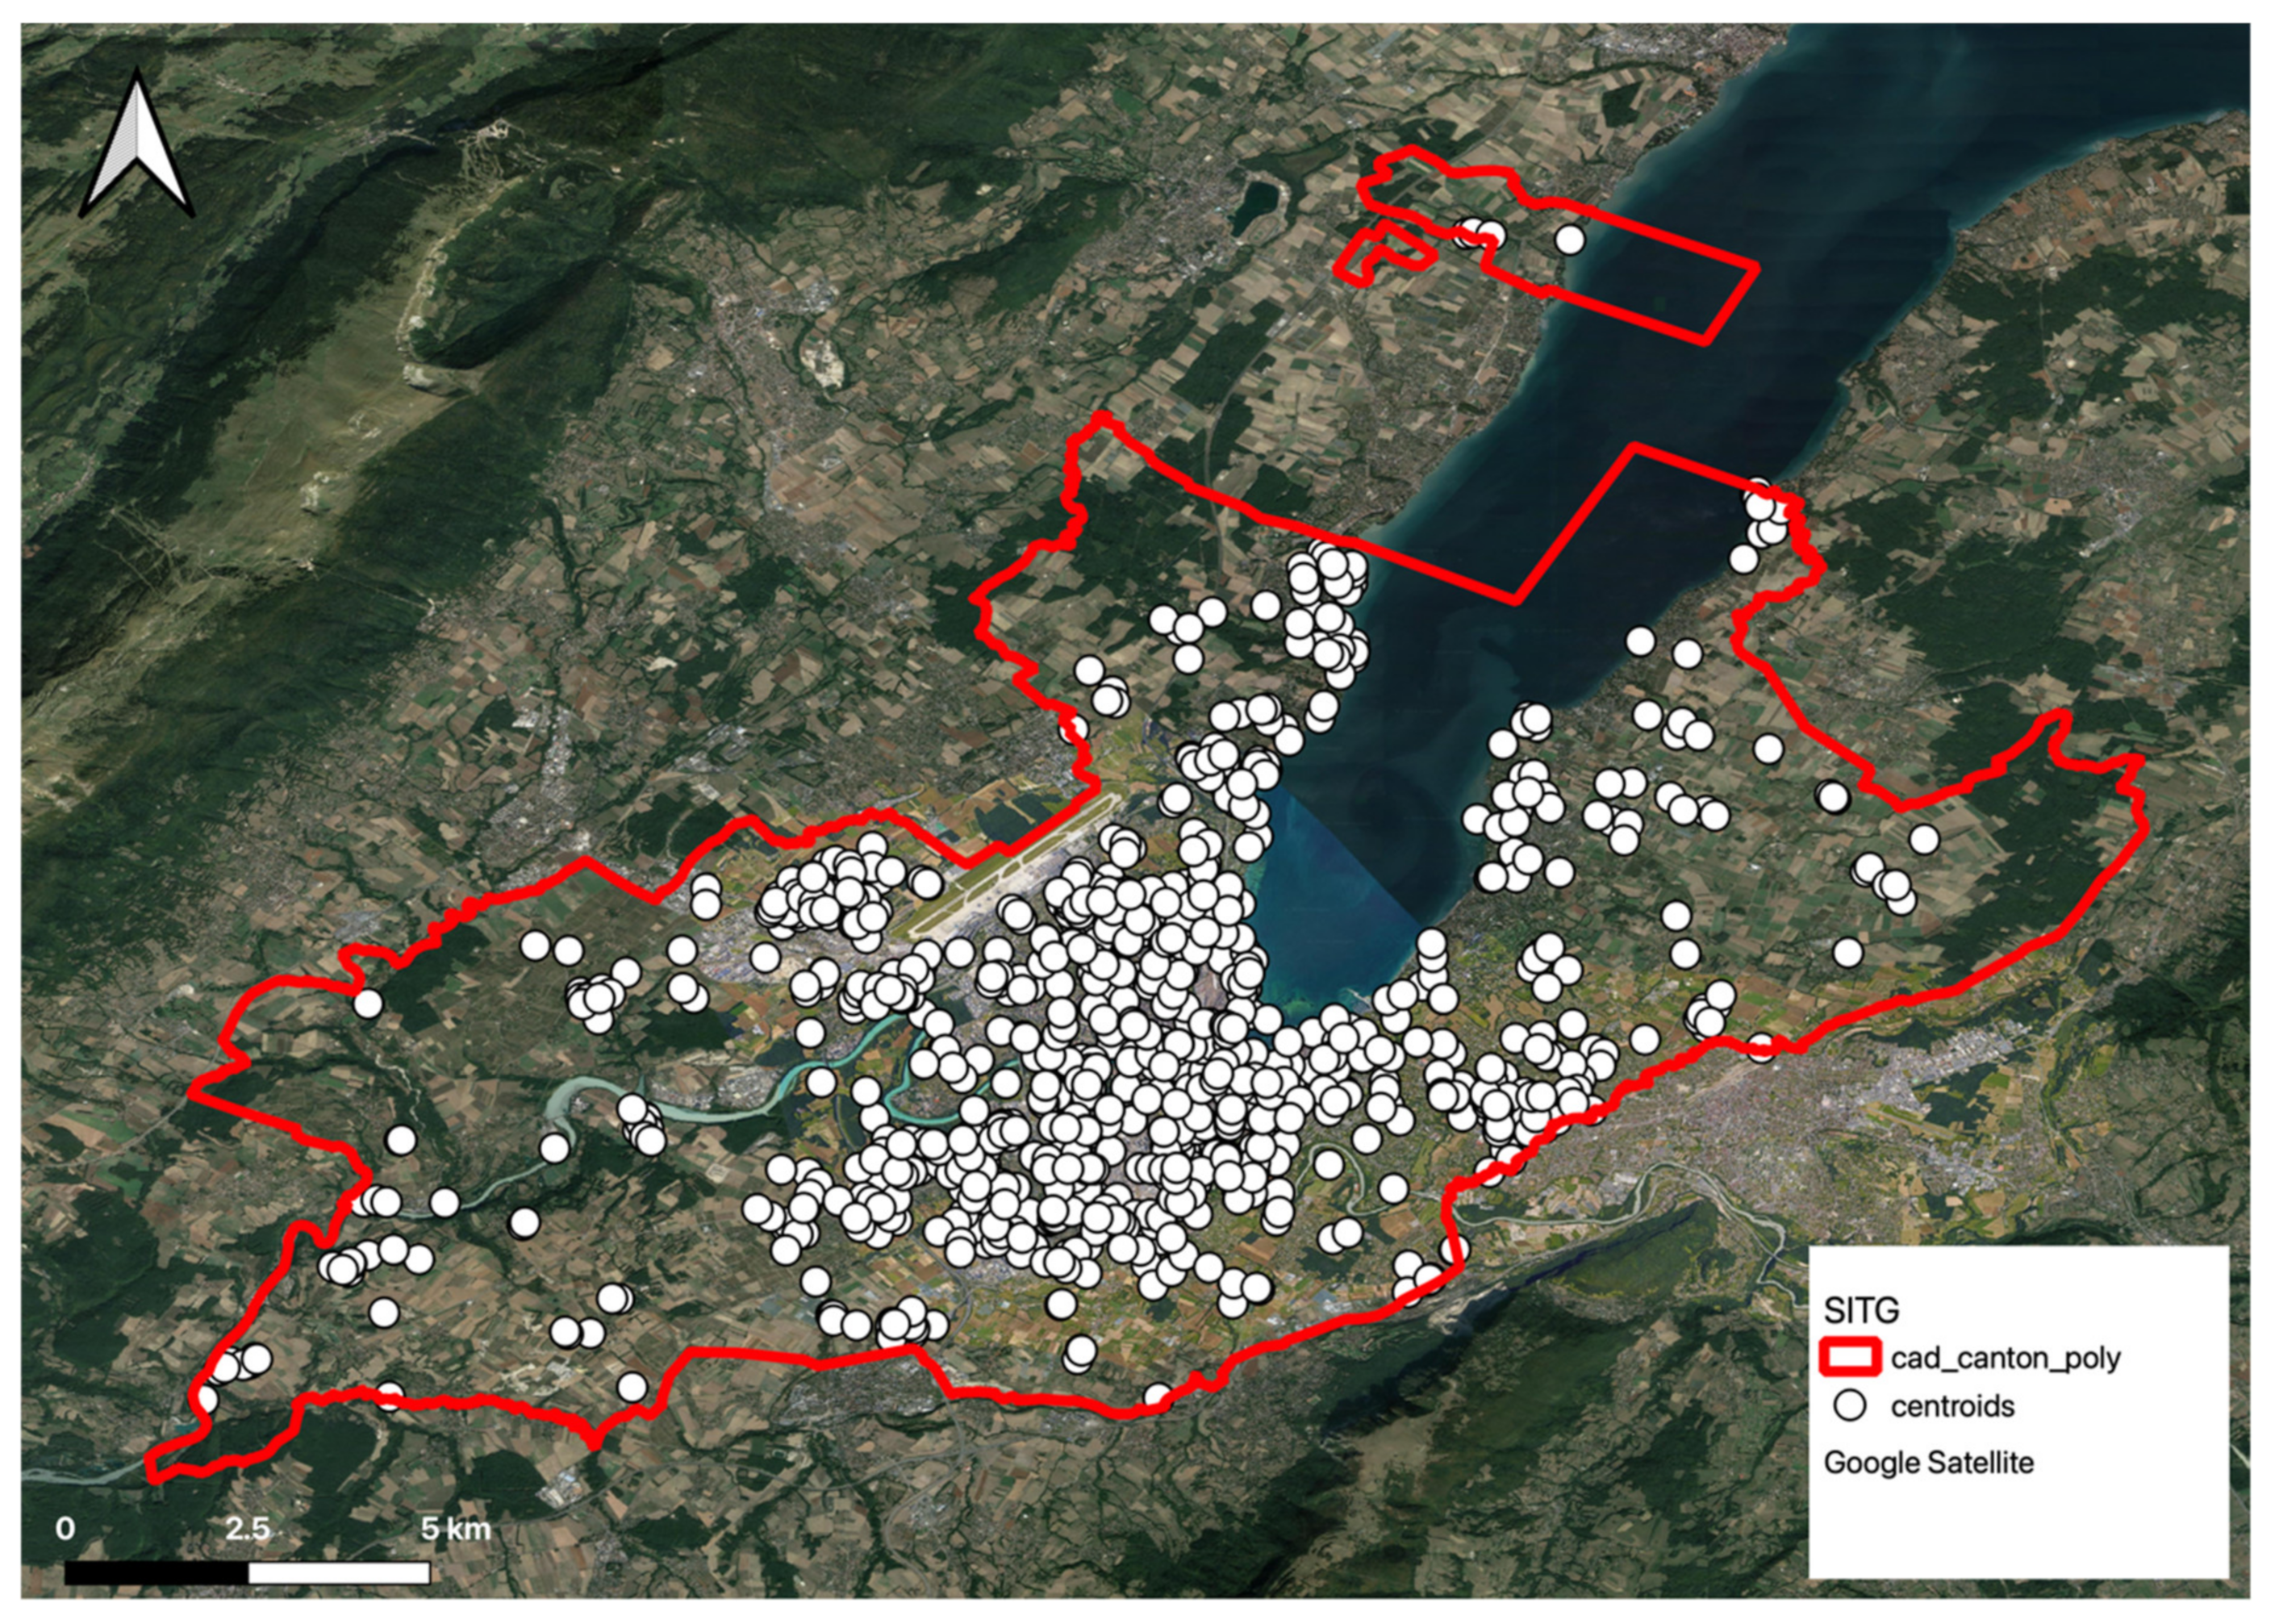
- Working with the centroids of green spaces can be a valid approach for a first approximation, but it can have an impact on the estimation of accessibility, especially if we consider short traveling time (e.g., 5 min) towards large urban green areas. In that case, it would be interesting to have information on the location(s) of parks’ entrances to provide an enhanced view on accessibility but noting that dedicated entrances may imply fences around the park that should also be considered. For the large parks that can be entered from everywhere, with no restrictive entry point, a least-cost path algorithm considering polygons instead of points for the target areas may be preferred. More work is needed to better understand the impacts of alternative accessibility algorithms given various park configurations.
- (4)
- Our accessibility modelling requires various input raster datasets. We used mostly global datasets whose resolution is typically 100 m or more, which could be considered too coarse to adequately model barriers to movement in some cities. To get more accurate physical accessibility estimates at higher spatial resolution, national datasets should be considered.
- (5)
- The travel scenario (modes and speeds on various roads and off-road), as well as barriers to movements, can have specificities in the different cities considered, depending on country-specific and city-specific policies (e.g., soft mobility). More work is needed to understand to which extent a single baseline travel model could be used for sets of cities (e.g., European cities), or if city-specific constraints should always be considered.
- (6)
- An assumption of the least-cost path approach is that the population always reaches the closest area in terms of travel time. But, by-passing the nearest area to reach one further away could be a reality for a subset of the population. For example, where kid-friendly and playground infrastructures are needed, this target population may have a limited choice of green areas to access. Stratifying the analyses by considering alternative target populations could be possible if sufficient information on the park infrastructures is available.
- (7)
- Our presented methodology that aims to be in line with the SDG indicators framework only considered cities. A valuable addition in the future would be to also consider rural areas and take into consideration objects such as forests, vineyards, riverbanks, etc., that are also vegetated areas in or around which people like to walk. For these particular areas, the population is generally willing to travel for a longer time and distance (by car, bike or public transport), and then walk. Such behaviours/cases can also be adequately modelled using AccessMod, that can combine several modes of transport in a single analysis.
4.3. Perspectives
- The methodology could be tested on other cities/countries in different socio-economic-environmental contexts (e.g., megacities, developing countries) and in cities that have existing data we can validate results against.
- We only considered walking in the travel scenarios. Other types of scenarios of movement, such as bike, public transport or car, could be considered to inform about additional accessibility patterns.
- Comparisons could be done with alternative scenarios such as the one provided by UN-Habitat that proposes to use 400 m walking distance along the road network as delineation of the catchment area. In that specific case, 400 m at a walking speed of 5 km/h corresponds to a travel time of 4.8 min, which more or less corresponds to the computed 5 min distance we used. However, results could be different depending on how one treats off-road movements, and the configuration of barriers to movements in the cities considered.
- Explore the use of freely and openly available cadaster to identify public/private space.
- With the current implementation, green areas smaller than 10 × 10 m could not be identified. A possible solution is to use satellites that can provide higher spatial resolution images such as WorldView or Pleiades sensors.
- The current methodology used the Urban Core layer (from the Urban Atlas 2018) to delimit cities. This was selected for replicability concerns, ensuring that the methodology can be replicated in any European city. However, local data can be even more precise and/or have a different city delimitation. Such data could be easily used to re-compute the zonal statistics on the share of the population that has access to urban green areas.
- For the potential scaling-up of the methodology at a global level, the GHSL dataset should be considered instead of Urban Atlas (that only covers Europe) for the identification of built-up areas. This is important in order to have a consistent approach to extract built-up area and to allow comparison between countries/regions.
- We used the GEE platform to process Sentinel-2 data. However, in the EU context, it would have been preferable to use EU resources such as the Copernicus DIAS platforms. Nevertheless, there is an associated cost for using DIAS and currently, the business model is not yet entirely clear and processing costs should be carefully assessed. To ensure reliable estimations, the use of Sentinel-2 is recommended to reduce biases and uncertainties.
- The validation process is an important step that should be properly handled. Citizen science approaches complemented with the use of aerial and/or on-the-ground imagery can be used to validate the identification of green areas as well as identifying private and public space from LUCAS database pictures [77,78]. It could help to build a tool able to efficiently and accurately classify and differentiate private green space from public green space. This can be a valuable addition, when land parcel data is not available (thus, without ownership information). Validation should also ideally be performed on travel behaviour and travel speeds through population surveys and citizen science approaches, which are yet to be developed and made available at the appropriate scale.
- To complement the private/public mask and further identify public green areas, valuable alternatives exist such as using patterns of mobile phone data (e.g., number and pattern over time of mobile phone users in green spaces) to detect if space is accessible to the public or not. Alternatively, pictures from public databases with geo coordinates (Flickr, Mapillary) [79] or public information on green spaces (e.g., in Hamburg, Germany) [80] are also additional useful sources of information when available. This can help to estimate visitation rates and can potentially help to understand which elements of urban green areas attract people.
- Artificial intelligence, and particularly Machine Learning (ML) techniques, can also be a valuable option to complement the differentiation of private green space from public green space [81,82], if land parcel data (without ownership information) is not available. Such an approach has been tested in the UK to map urban green spaces (such as residential gardens, steps, patios and paths) [83]. In this regard, it would be interesting to test this against the LUCAS database to understand if it can be a reliable source of information for classifying/identifying private green areas.
- Automatising our full workflow could be possible, especially if OSM data are used. Workflow using R could automatically download the appropriate dataset, prepare the data for ingestion in AccessMod (or other libraries), run it and output the appropriate maps and statistics.
- Considering the use of the WorldPop “constrained” dataset may improve the realism of the spatial distribution of the population.
- An issue that warrants further consideration is how to deal with forest areas/cropland/grassland in the periphery of urban areas. Indeed, rural parts might have large, vegetated areas that can be publicly accessible and therefore represent important areas for leisure.
5. Conclusions
Supplementary Materials
Author Contributions
Funding
Data Availability Statement
Acknowledgments
Conflicts of Interest
References
- Melchiorri, M.; Pesaresi, M.; Florczyk, A.J.; Corbane, C.; Kemper, T. Principles and applications of the global human settlement layer as baseline for the land use efficiency indicator—SDG 11.3.1. ISPRS Int. J. Geo-Inf. 2019, 8, 96. [Google Scholar] [CrossRef]
- Pafi, M.; Siragusa, A.; Ferri, S.; Halkia, M. Measuring the accessibility of urban green areas. In A Comparison of the Green ESM With Other Datasets in Four European Cities; Publications Office of the European Union: Luxembourg, 2016. [Google Scholar]
- UN-Habitat. Report of the Tenth Session of the World Urban Forum; UN-Habitat: Nairobi, Kenya, 2020; p. 220. [Google Scholar]
- Valentina, A.; Maria, A.R.; Carmelo, A.; Davide, A.; Ricardo, R.B.; Filipe, B.E.S.; Peter, B.; Paolo, B.; Flavio, B.; Ioris, B. The Future of Cities: Opportunities, Challenges and the Way Forward; Seville Site; Joint Research Centre: Brussels, Belgium, 2019. [Google Scholar]
- Wellmann, T.; Haase, D.; Knapp, S.; Salbach, C.; Selsam, P.; Lausch, A. Urban land use intensity assessment: The potential of spatio-temporal spectral traits with remote sensing. Ecol. Indic. 2018, 85, 190–203. [Google Scholar] [CrossRef]
- Bagan, H.; Borjigin, H.; Yamagata, Y. Assessing nighttime lights for mapping the urban areas of 50 cities across the globe. Environ. Plan. B Urban Anal. City Sci. 2018. [Google Scholar] [CrossRef]
- Gret-Regamey, A.; Celio, E.; Klein, T.M.; Hayek, U.W. Understanding ecosystem services trade-offs with Interactive procedural modeling for sustainable urban planning. Landsc. Urban Plan. 2013, 109, 107–116. [Google Scholar] [CrossRef]
- Klopp, J.M.; Petretta, D.L. The urban sustainable development goal: Indicators, complexity and the politics of measuring cities. Cities 2017, 63, 92–97. [Google Scholar] [CrossRef]
- Allocated, L.; Core, C. Streets as Public Spaces and Drivers of Urban Prosperity. Urban Prosperity. 2013, p. 108. Available online: https://unhabitat.org/streets-as-public-spaces-and-drivers-of-urban-prosperity (accessed on 13 January 2021).
- Corbane, C.; Pesaresi, M.; Kemper, T.; Politis, P.; Florczyk, A.J.; Syrris, V.; Melchiorri, M.; Sabo, F.; Soille, P. Automated global delineation of human settlements from 40 years of landsat satellite data archives. Big Earth Data 2019, 3, 140–169. [Google Scholar] [CrossRef]
- Simon, D.; Arfvidsson, H.; Anand, G.; Bazaz, A.; Fenna, G.; Foster, K.; Jain, G.; Hansson, S.; Evans, L.M.; Moodley, N.; et al. Developing and testing the urban sustainable development goal’s targets and indicators–A five-city study. Environ. Urban 2016, 28, 49–63. [Google Scholar] [CrossRef]
- United Nations. Transforming Our World: The 2030 Agenda for Sustainable Development; UN: New York, NY, USA, 2015; p. 41. [Google Scholar]
- United States. Indicator 11.7.1: Average Share of the Built-Up Area of Cities That Is Open Space for Public Use for All, by Sex, Age and Persons with Disabilities; Eurostat: Luxembourg, 2018.
- Kaika, M. ‘Don’t call me resilient again!’: The new urban agenda as immunology or what happens when communities refuse to be vaccinated with ‘smart cities’ and indicators. Environ. Urban 2017, 29, 89–102. [Google Scholar] [CrossRef]
- Koch, F.; Krellenberg, K. How to contextualize SDG 11? Looking at indicators for sustainable urban development in Germany. ISPRS Int. J. Geo-Inf. 2018, 7, 464. [Google Scholar] [CrossRef]
- Eurostat SDG 11. Sustainable Cities and Communities: Make Cities and Human Settlements Inclusive, Safe, Resilient and Sustainable. Available online: https://sdgs.un.org/goals/goal11 (accessed on 13 January 2021).
- UN GGIM: Europe Working Group B; Cetl, V. The Territorial Dimension in SDG Indicators: Geospatial Data Analysis and Its Integration with Statistical Data; UN-GGIM: Lisboa, Portugal, 2019; ISBN 9978-989-25-0485-8. [Google Scholar]
- Calderón-Contreras, R.; Quiroz-Rosas, L.E. Analysing scale, quality and diversity of green infrastructure and the provision of urban ecosystem services: A case from Mexico City. Ecosyst. Serv. 2017, 23, 127–137. [Google Scholar] [CrossRef]
- Grêt-Regamey, A.; Altwegg, J.; Sirén, E.A.; van Strien, M.J.; Weibel, B. Integrating ecosystem services into spatial planning—A Spatial decision support tool. Landsc. Urban Plan. 2017, 165, 206–219. [Google Scholar] [CrossRef]
- Schlaepfer, M.A.; Guinaudeau, B.P.; Martin, P.; Wyler, N. Quantifying the contributions of native and non-native trees to a city’s biodiversity and ecosystem services. Urban For. Urban Green. 2020, 56, 126861. [Google Scholar] [CrossRef]
- Maimaitiyiming, M.; Ghulam, A.; Tiyip, T.; Pla, F.; Latorre-Carmona, P.; Halik, Ü.; Sawut, M.; Caetano, M. Effects of green Space spatial pattern on land surface temperature: Implications for sustainable urban planning and climate change adaptation. ISPRS J. Photogramm. Remote Sens. 2014, 89, 59–66. [Google Scholar] [CrossRef]
- Sahakian, M.; Anantharaman, M.; di Giulio, A.; Saloma, C.; Zhang, D.; Khanna, R.; Narasimalu, S.; Favis, A.; Alfiler, C.; Narayanan, S.; et al. Green public spaces in the cities of South and Southeast Asia. JPS 2020, 5. [Google Scholar] [CrossRef]
- Corban, C.; Florczyk, A.; Freire, S.; Kemper, T.; Ehrlich, D.; Siragusa, A.; Pesaresi, M. Atlas of the Human Planet 2017: Global Exposure to Natural Hazards; Publications Office of the European Union: Luxembourg, 2017. [Google Scholar]
- Maes, J.; Zulian, G.; Günther, S.; Thijssen, M.; Raynal, J. Enhancing Resilience of Urban Ecosystems through Green Infrastructure (EnRoute); Publications Office of the European Union: Luxembourg, 2019. [Google Scholar]
- Corbane, C.; Martino, P.; Panagiotis, P.; Aneta, F.J.; Michele, M.; Sergio, F.; Marcello, S.; Daniele, E.; Gustavo, N.; Thomas, K. The grey-green divide: Multi-temporal analysis of greenness across 10,000 urban centres derived from the global human settlement layer (GHSL). Int. J. Dig. Earth 2020, 13, 101–118. [Google Scholar] [CrossRef]
- Prakash, M.; Ramage, S.; Kavvada, A.; Goodman, S. Open Earth observations for sustainable urban development. Remote Sens. 2020, 12, 1646. [Google Scholar] [CrossRef]
- Vallecillo, S.; Polce, C.; Barbosa, A.; Perpiña Castillo, C.; Vandecasteele, I.; Rusch, G.M.; Maes, J. Spatial alternatives for green infrastructure planning across the EU: An ecosystem service perspective. Landsc. Urban Plan. 2018, 174, 41–54. [Google Scholar] [CrossRef]
- Aguilar, R.; Kuffer, M. Cloud computation using high-resolution images for improving the SDG indicator on open spaces. Remote Sens. 2020, 12, 1144. [Google Scholar] [CrossRef]
- Anderson, K.; Ryan, B.; Sonntag, W.; Kavvada, A.; Friedl, L. Earth observation in service of the 2030 Agenda for sustainable development. Geo-Spat. Inf. Sci. 2017, 20, 77–96. [Google Scholar] [CrossRef]
- Kavvada, A.; Metternicht, G.; Kerblat, F.; Mudau, N.; Haldorson, M.; Laldaparsad, S.; Friedl, L.; Held, A.; Chuvieco, E. Towards delivering on the sustainable development goals using Earth observations. Remote Sens. Environ. 2020, 247, 111930. [Google Scholar] [CrossRef]
- Wellmann, T.; Lausch, A.; Andersson, E.; Knapp, S.; Cortinovis, C.; Jache, J.; Scheuer, S.; Kremer, P.; Mascarenhas, A.; Kraemer, R.; et al. Remote sensing in urban planning: Contributions towards ecologically sound policies? Landsc. Urban Plan. 2020, 204, 103921. [Google Scholar] [CrossRef]
- Pullin, A.S.; Stewart, G.B. Guidelines for systematic review in conservation and environmental management. Conserv. Biol. 2006, 20, 1647–1656. [Google Scholar] [CrossRef]
- Collaboration for Environmental Evidence Guidelines for Systematic Review in Environmental Management. 2013. Available online: http://www.environmentalevidence.org/guidelines-group (accessed on 13 January 2021).
- Plummer, R.; de Loë, R.; Armitage, D. A Systematic review of water vulnerability assessment tools. Water Resour. Manag. 2012, 26, 4327–4346. [Google Scholar] [CrossRef]
- Cetin, M. Using GIS Analysis to assess urban green space in terms of accessibility: Case study in Kutahya. Int. J. Sustain. Dev. World Ecol. 2015, 22, 420–424. [Google Scholar] [CrossRef]
- Chang, Q.; Li, X.; Huang, X.; Wu, J. A GIS-based green infrastructure planning for sustainable urban land use and spatial development. Proc. Environ. Sci. 2012, 12, 491–498. [Google Scholar] [CrossRef]
- Van Herzele, A.; Wiedemann, T. A monitoring tool for the provision of accessible and attractive urban green spaces. Landsc. Urban Plan. 2003, 63, 109–126. [Google Scholar] [CrossRef]
- De Ridder, K.; Adamec, V.; Bañuelos, A.; Bruse, M.; Bürger, M.; Damsgaard, O.; Dufek, J.; Hirsch, J.; Lefebre, F.; Pérez-Lacorzana, J.M.; et al. An integrated methodology to assess the benefits of urban green space. Sci. Total Environ. 2004, 334–335, 489–497. [Google Scholar] [CrossRef] [PubMed]
- Zhou, X.; Wang, Y.-C. Spatial–temporal dynamics of urban green space in response to rapid urbanization and greening policies. Landsc. Urban Plan. 2011, 100, 268–277. [Google Scholar] [CrossRef]
- Rafiee, R.; Salman Mahiny, A.; Khorasani, N. Assessment of changes in urban green spaces of Mashad city using satellite data. Int. J. Appl. Earth Obs. Geoinf. 2009, 11, 431–438. [Google Scholar] [CrossRef]
- Du, H.; Cai, W.; Xu, Y.; Wang, Z.; Wang, Y.; Cai, Y. Quantifying the cool island effects of urban green spaces using remote sensing data. Urban For. Urban Green. 2017, 27, 24–31. [Google Scholar] [CrossRef]
- Shin, D.; Lee, K. Use of remote sensing and geographical information systems to estimate green space surface-temperature change as a result of urban expansion. Landsc. Ecol. Eng. 2005, 1, 169–176. [Google Scholar] [CrossRef]
- Yang, Y.; Wu, T.; Wang, S.; Li, J.; Muhanmmad, F. The NDVI-CV method for mapping evergreen trees in complex urban areas using reconstructed landsat 8 time-series data. Forests 2019, 10, 139. [Google Scholar] [CrossRef]
- Annerstedt van den Bosch, M.; Mudu, P.; Uscila, V.; Barrdahl, M.; Kulinkina, A.; Staatsen, B.; Swart, W.; Kruize, H.; Zurlyte, I.; Egorov, A.I. Development of an urban green space indicator and the public health rationale. Scand. J. Public Health 2016, 44, 159–167. [Google Scholar] [CrossRef] [PubMed]
- Wang, J.; Banzhaf, E. Derive an understanding of green infrastructure for the quality of life in cities by means of integrated RS mapping tools. In Proceedings of the 2017 Joint Urban Remote Sensing Event (JURSE), Dubai, UAE, 6–8 March 2017; pp. 1–4. [Google Scholar]
- Gupta, K.; Kumar, P.; Pathan, S.K.; Sharma, K.P. Urban neighborhood green index–A measure of green spaces in urban areas. Landsc. Urban Plan. 2012, 105, 325–335. [Google Scholar] [CrossRef]
- Grădinaru, S.R.; Iojă, C.I.; Pătru-Stupariu, I.; Hersperger, A.M. Are spatial planning objectives reflected in the evolution of urban landscape patterns? A framework for the evaluation of spatial planning outcomes. Sustainability 2017, 9, 1279. [Google Scholar] [CrossRef]
- Seto, K.C.; Güneralp, B.; Hutyra, L.R. Global forecasts of urban expansion to 2030 and direct impacts on biodiversity and carbon pools. Proc. Natl. Acad. Sci. USA 2012, 109, 16083–16088. [Google Scholar] [CrossRef]
- Lwin, K.K.; Murayama, Y. Modelling of urban green space walkability: Eco-friendly walk score calculator. Comp. Environ. Urban Syst. 2011, 35, 408–420. [Google Scholar] [CrossRef]
- Dai, D. Racial/ethnic and socioeconomic disparities in urban green space accessibility: Where to intervene? Landsc. Urban Plan. 2011, 102, 234–244. [Google Scholar] [CrossRef]
- Texier, M.L.; Schiel, K.; Caruso, G. The provision of urban green space and its accessibility: Spatial data effects in Brussels. PLoS ONE 2018, 13, e0204684. [Google Scholar] [CrossRef]
- Shekhar, S.; Kumar, S. Assessing the quality of urban environment through urban neighbourhood green index. In Proceedings of the ISPRS TC VIII International Symposium on “Operational Remote Sensing Applications: Opportunities, Progress and Challenges”, Hyderabad, India, 9–12 December 2014. [Google Scholar]
- Corbett, J.; Mellouli, S. Winning the SDG battle in cities: How an integrated information ecosystem can contribute to the achievement of the 2030 sustainable development goals. Inf. Syst. J. 2017, 27, 427–461. [Google Scholar] [CrossRef]
- Jaeger, A.; Zusman, E.; Nakano, R.; Nagano, A.; Dedicatoria, R.M.; Asakawa, K. Filling Environmental Data Gaps for SDG 11: A Survey of Japanese and Philippines Cities with Recommendations; Atlantis Press: Amsterdam, The Netherlands, 2019. [Google Scholar]
- Wendling, L.A.; Huovila, A.; zu Castell-Rüdenhausen, M.; Hukkalainen, M.; Airaksinen, M. Benchmarking nature-based solution and smart city assessment schemes against the sustainable development goal indicator framework. Front. Environ. Sci. 2018, 6. [Google Scholar] [CrossRef]
- Poleman, H. A Walk to the Park?-Assessing Access to Green Urban Areas in Europe’s Cities; European Commission: Brussels, Belgium, 2016. [Google Scholar]
- Florczyk, A.J.; Ferri, S.; Syrris, V.; Kemper, T.; Halkia, M.; Soille, P.; Pesaresi, M. A new European settlement map from optical remotely sensed data. IEEE J. Sel. Top. Appl. Earth Obs. Remote Sens. 2016, 9, 1978–1992. [Google Scholar] [CrossRef]
- European Settlement Map—Copernicus Land Monitoring Service. Available online: https://land.copernicus.eu/pan-european/GHSL/european-settlement-map (accessed on 14 January 2021).
- d’Andrimont, R.; Verhegghen, A.; Meroni, M.; Lemoine, G.; Strobl, P.; Eiselt, B.; Yordanov, M.; Martinez-Sanchez, L.; van der Velde, M. LUCAS copernicus 2018: Earth observation relevant in-situ data on land cover throughout the European Union. Earth Syst. Sci. Data Discuss. 2020, 1–19. [Google Scholar] [CrossRef]
- Addabbo, P.; Focareta, M.; Marcuccio, S.; Votto, C.; Ullo, S.L. Contribution of sentinel-2 data for applications in vegetation monitoring. ACTA IMEKO 2016, 5, 44–54. [Google Scholar] [CrossRef]
- Drusch, M.; Del Bello, U.; Carlier, S.; Colin, O.; Fernandez, V.; Gascon, F.; Hoersch, B.; Isola, C.; Laberinti, P.; Martimort, P.; et al. Sentinel-2: ESA’s optical high-resolution mission for GMES operational services. Remote Sens. Environ. 2012, 120, 25–36. [Google Scholar] [CrossRef]
- Gorelick, N.; Hancher, M.; Dixon, M.; Ilyushchenko, S.; Thau, D.; Moore, R. Google Earth engine: Planetary-scale geospatial analysis for everyone. Remote Sens. Environ. 2017, 202, 18–27. [Google Scholar] [CrossRef]
- Amani, M.; Ghorbanian, A.; Ahmadi, S.A.; Kakooei, M.; Moghimi, A.; Mirmazloumi, S.M.; Alizadeh Moghaddam, S.H.; Mahdavi, S.; Ghahremanloo, M.; Parsian, S.; et al. Google Earth engine cloud computing platform for remote sensing big data applications: A comprehensive review. IEEE J. Sel. Top. Appl. Earth Obs. Remote Sens. 2020. [Google Scholar] [CrossRef]
- Huang, S.; Tang, L.; Hupy, J.P.; Wang, Y.; Shao, G. A commentary review on the use of normalized difference vegetation Index (NDVI) in the era of popular remote sensing. J. For. Res. 2020. [Google Scholar] [CrossRef]
- Montero, E.; Van Wolvelaer, J.; Garzón, A. The European Urban Atlas. In Land Use and Land Cover Mapping in Europe: Practices & Trends. Remote Sensing and Digital Image Processing; Manakos, I., Braun, M., Eds.; Springer Netherlands: Dordrecht, The Netherlands, 2014; pp. 115–124. ISBN 978-94-007-7969-3. [Google Scholar]
- Urban Atlas—Copernicus Land Monitoring Service. Available online: https://land.copernicus.eu/local/urban-atlas (accessed on 14 January 2021).
- Corbane, C.; Pesaresi, M.; Politis, P.; Syrris, V.; Florczyk, A.J.; Soille, P.; Maffenini, L.; Burger, A.; Vasilev, V.; Rodriguez, D.; et al. Big Earth data analytics on sentinel-1 and landsat imagery in support to global human settlements mapping. Big Earth Data 2017, 1, 118–144. [Google Scholar] [CrossRef]
- Global Human Settlement–Home–European Commission. Available online: https://ghsl.jrc.ec.europa.eu/ (accessed on 14 January 2021).
- SITG | Le Territoire Genevois à La Carte. Available online: https://ge.ch/sitg/ (accessed on 14 January 2021).
- Grippa, T.; Georganos, S.; Zarougui, S.; Bognounou, P.; Diboulo, E.; Forget, Y.; Lennert, M.; Vanhuysse, S.; Mboga, N.; Wolff, E. Mapping urban land use at street block level using openstreetmap, remote sensing data, and spatial metrics. ISPRS Int. J. Geo-Inf. 2018, 7, 246. [Google Scholar] [CrossRef]
- AccessMod 5 | Modelling Physical Accessibility to Health Care. Available online: https://www.accessmod.org (accessed on 14 January 2021).
- Ray, N.; Ebener, S. AccessMod 3.0: Computing geographic coverage and accessibility to health care services using anisotropic movement of patients. Int. J. Health Geogr. 2008, 7, 63. [Google Scholar] [CrossRef] [PubMed]
- WorldPop: Mapping Populations. Available online: https://www.worldpop.org/methods/populations (accessed on 14 January 2021).
- Tatem, A.J. WorldPop, open data for spatial demography. Sci. Data 2017, 4, 1–4. [Google Scholar] [CrossRef]
- WorldPop: Top-Down Estimating Modelling. Available online: https://www.worldpop.org/methods/top_down_constrained_vs_unconstrained (accessed on 14 January 2021).
- European Commission. The DIAS: User-Friendly Access to Copernicus Data and Information; European Commission: Luxembourg, 2018. [Google Scholar]
- Leibovici, D.G.; Williams, J.; Rosser, J.F.; Hodges, C.; Chapman, C.; Higgins, C.; Jackson, M.J. Earth observation for citizen science validation, or citizen science for Earth observation validation? The role of quality assurance of volunteered observations. Data 2017, 2, 35. [Google Scholar] [CrossRef]
- Laso Bayas, J.C.; See, L.; Bartl, H.; Sturn, T.; Karner, M.; Fraisl, D.; Moorthy, I.; Busch, M.; van der Velde, M.; Fritz, S. Crowdsourcing LUCAS: Citizens generating reference land cover and land use data with a mobile app. Land 2020, 9, 446. [Google Scholar] [CrossRef]
- Wood, S.A.; Guerry, A.D.; Silver, J.M.; Lacayo, M. Using social media to quantify nature-based tourism and recreation. Sci. Rep. 2013, 3, 2976. [Google Scholar] [CrossRef]
- Geo-Online. Available online: https://geoportal-hamburg.de/geo-online/?mdid=63A9A629-C051-4876-B18B-C535016F0B8A (accessed on 14 January 2021).
- Kranjčić, N.; Medak, D.; Župan, R.; Rezo, M. Machine learning methods for classification of the green infrastructure in city areas. ISPRS Int. J. Geo-Inf. 2019, 8, 463. [Google Scholar] [CrossRef]
- Moreno-Armendáriz, M.A.; Calvo, H.; Duchanoy, C.A.; López-Juárez, A.P.; Vargas-Monroy, I.A.; Suarez-Castañon, M.S. Deep green diagnostics: Urban green space analysis using deep learning and drone images. Sensors 2019, 19, 5287. [Google Scholar] [CrossRef]
- Green Spaces in Residential Gardens. Available online: https://datasciencecampus.ons.gov.uk/projects/green-spaces-in-residential-gardens/ (accessed on 14 January 2021).
- GEO Work Programme. Available online: https://earthobservations.org/geoss_wp.php (accessed on 14 January 2021).
- Nativi, S.; Santoro, M.; Giuliani, G.; Mazzetti, P. Towards a knowledge base to support global change policy goals. Int. J. Dig. Earth 2019, 13, 188–216. [Google Scholar] [CrossRef]


| Access Rights | |
|---|---|
| Category | Tags |
| Non-public areas | Access = no/private/official/military/agricultural/forestry/destination/restricted/delivery |
| Public areas | Access = yes/permissive/public |
| Unknown access status | Access = unknown |
| Fee | |
| Free access | Fee = no |
| Access available on payment of a fee | Fee = yes |
| Access is sometime free and sometimes for a fee | Fee = interval, unknown |
| Greenspace | |
| Tourism | ‘Tourism’ = camp_site |
| Amenity | ‘Amenity’ = grave_yard |
| Leisure | ‘Leisure’ = garden, nature_reserve, park, pitch, golf_course, common, dog_park |
| Land use | ‘Landuse’ = forest, grass, meadow, orchard, greenfield, vineyard, recreation_ground, village_green, cemetery |
| Natural | ‘Natural’ = scrub, fell, grassland, heath, wood, moor |
| Raster Data | URL |
|---|---|
| Digital Elevation Model (Shuttle Radar Topography Mission (SRTM)) | https://srtm.csi.cgiar.org/srtmdata/ |
| Population grid (WorldPop or Center for International Earth Science Information Network (CIESIN)/Facebook) | https://data.humdata.org/organization/facebook?groups=che&q=&ext_page_size=25 https://www.worldpop.org/project/categories?id=3 |
| Land cover (CORINE) | https://land.copernicus.eu |
| Vector Data | URL or OSM tag(s) |
| Roads (OpenStreetMap) | Highway = motorway, trunk, primary, secondary, tertiary, residential, unclassified |
| Rivers (OpenStreetMap) | Waterway = river |
| Lakes (OpenStreetMap) | Natural = water |
| Other barriers (airport, railways) (OpenStreetMap) | Railway = rail; aeroway = aerodrome |
| Centroids (urban green areas) | Provided by Section 2.2.4 |
| Administrative boundaries (Urban Atlas) | https://land.copernicus.eu/local/urban-atlas |
| Additional Data | Description |
| Travel scenario file | Used to inform the model on the modes and speeds of travel for the population willing to reach the nearest green public space. In this study, we only consider walking as the means of transport, and therefore do not consider other means such as car, bike, or public transportation. |
| Geneva | Barcelona | Goteborg | Bristol | |||||
|---|---|---|---|---|---|---|---|---|
| Walking Time | Slow | Fast | Slow | Fast | Slow | Fast | Slow | Fast |
| 5 min | 29.39 | 16.54 | 78.72 | 58.74 | 52.91 | 33.86 | 73.66 | 47.53 |
| 10 min | 14.35 | 11.43 | 50.29 | 26.61 | 29.09 | 19.32 | 36.94 | 14.62 |
| 15 min | 11.79 | 10.74 | 31.21 | 15.05 | 20.94 | 14.08 | 17.32 | 11.3 |
| Geneva | Barcelona | Goteborg | Bristol | |||||
|---|---|---|---|---|---|---|---|---|
| Walking Time | Slow | Fast | Slow | Fast | Slow | Fast | Slow | Fast |
| 5 min | 29.24 | 16.28 | 78.59 | 58.55 | 52.66 | 33.48 | 73.76 | 47.54 |
| 10 min | 14.12 | 11.3 | 50.12 | 26.45 | 28.73 | 19.09 | 36.94 | 14.64 |
| 15 min | 11.66 | 10.67 | 31.06 | 14.92 | 20.67 | 13.92 | 17.3 | 11.31 |
| Geneva Original | Geneva Shifted | |||
|---|---|---|---|---|
| Walking Time | Slow | Fast | Slow | Fast |
| 5 min | 5.06 | 14.14 | 5.77 | 13.83 |
| 10 min | 19.1 | 37.67 | 18.89 | 36.74 |
| 15 min | 34.38 | 48.34 | 33.36 | 47.85 |
Publisher’s Note: MDPI stays neutral with regard to jurisdictional claims in published maps and institutional affiliations. |
© 2021 by the authors. Licensee MDPI, Basel, Switzerland. This article is an open access article distributed under the terms and conditions of the Creative Commons Attribution (CC BY) license (http://creativecommons.org/licenses/by/4.0/).
Share and Cite
Giuliani, G.; Petri, E.; Interwies, E.; Vysna, V.; Guigoz, Y.; Ray, N.; Dickie, I. Modelling Accessibility to Urban Green Areas Using Open Earth Observations Data: A Novel Approach to Support the Urban SDG in Four European Cities. Remote Sens. 2021, 13, 422. https://doi.org/10.3390/rs13030422
Giuliani G, Petri E, Interwies E, Vysna V, Guigoz Y, Ray N, Dickie I. Modelling Accessibility to Urban Green Areas Using Open Earth Observations Data: A Novel Approach to Support the Urban SDG in Four European Cities. Remote Sensing. 2021; 13(3):422. https://doi.org/10.3390/rs13030422
Chicago/Turabian StyleGiuliani, Gregory, Ekkehard Petri, Eduard Interwies, Veronika Vysna, Yaniss Guigoz, Nicolas Ray, and Ian Dickie. 2021. "Modelling Accessibility to Urban Green Areas Using Open Earth Observations Data: A Novel Approach to Support the Urban SDG in Four European Cities" Remote Sensing 13, no. 3: 422. https://doi.org/10.3390/rs13030422
APA StyleGiuliani, G., Petri, E., Interwies, E., Vysna, V., Guigoz, Y., Ray, N., & Dickie, I. (2021). Modelling Accessibility to Urban Green Areas Using Open Earth Observations Data: A Novel Approach to Support the Urban SDG in Four European Cities. Remote Sensing, 13(3), 422. https://doi.org/10.3390/rs13030422