Abstract
Over the last few decades, we witnessed a revolution in acquiring very high resolution and accurate geo-information. One of the reasons was the advances in photonics and LiDAR, which had a remarkable impact in applications requiring information with high accuracy and/or elevated completeness, such as flood modelling, forestry, construction, and mining. Also, miniaturization within electronics played an important role as it allowed smaller and lighter aerial cameras and LiDAR systems to be carried by unmanned aerial vehicles (UAV). While the use of aerial imagery acquired with UAV is becoming a standard procedure in geo-information extraction for several applications, the use of LiDAR for this purpose is still in its infancy. In several countries, companies have started to commercialize products derived from LiDAR data acquired using a UAV but not always with the necessary expertise and experience. The LIDAR-derived products’ price has become very attractive, but their quality must meet the contracted specifications. Few studies have reported on the quality of outsourced LiDAR data acquired with UAV and the problems that need to be handled during production. There can be significant differences between the planning and execution of a commercial project and a research field campaign, particularly concerning the size of the surveyed area, the volume of the acquired data, and the strip processing. This work addresses the quality control of LiDAR UAV data through outsourcing to develop a modelling-based flood forecast and alert system. The contracted company used the Phoenix Scout-16 from Phoenix LiDAR Systems, carrying a Velodyne VLP-16 and mounted on a DJI Matrice 600 PRO Hexacopter for an area of 560 ha along a flood-prone area of the Águeda River in Central Portugal.
1. Introduction
Acquisition of geo-information using UAV (Unmanned Aerial Vehicles) is becoming a common procedure. The use of images acquired by UAV and processed with software originating from computer vision technologies, such as Structure from Motion and Multi-view Stereo, is now widespread in a range of fields. Examples are archaeology [1], agriculture [2], forestry [3], construction [4], mining [5], and large-scale cartographic production [6]. The accuracy of the derived information such as the DTM (Digital Terrain Model) may be in the order of a few cm, not only depending on the platform used, the quality of the aerial camera and the navigation system and the flight set-up (for example, the use of ground control points), but also on the characteristics of the terrain. In densely vegetated areas or terrains with a low texture, such as beaches, the derived information’s accuracy will be less acceptable. In such cases, the use of LiDAR (Light Detection and Ranging) systems mounted on UAV has been proposed.
In several countries such as France, Norway, and The Netherlands, governmental agencies and large private companies have been using LiDAR systems onboard aircraft routinely, for example, to produce DTM, forest inventories, or to survey power transportation lines. Nonetheless, LiDAR data acquisition using aircraft continues to be rather costly and unaffordable for many governmental and commercial applications.
The development of laser scanning sensors by the automotive industry (for collision avoidance), as well as the development of accurate and lightweight IMU (Inertial Measurement Unit) and GNSS (Global Navigation Satellite System) receivers, fostered the still relatively recent development of commercial ultralight LiDAR systems mounted on UAV. Since 2014, companies like Trimble Inc. 935 Stewart Drive Sunnyvale, California 94085, USA (with APX-15), SBG Systems Avenue Eiffel 78420 Carrières-sur-Seine France (with the Eclipse series), and NovAtel Inc. Hexagon Calgary Campus 10921 14th Street NE, Calgary, Alberta, Canada T3K 2L5 (with STIM300 and the SPAN series) have been developing innovative solutions for the precise positioning of UAV by integrating a double-frequency GNSS receiver with a new generation of tactical-grade MEMS IMU that weighs less than 100 g [7]. Among the LiDAR systems currently commercialized for use with UAV, the low-cost ones (even if costly compared to photogrammetric systems for UAV) rely significantly on post-processing software to deliver satisfactory results [8]. As existing geo-information companies are entering the market, driven by the increasing use of LiDAR data from UAV as shown by several published works (e.g., References [9,10,11,12,13,14,15,16]), we can still expect some lack of expertise and experience that justifies the need for explicit procedures to inspect the quality of the delivered products. Therefore, this study presents and discusses the problems that the end-user may encounter concerning the quality of outsourced UAV LiDAR data acquisition as well as possible solutions. It is based on a case in which LiDAR data were acquired with the Scout Fenix Lidar Systems mounted on a DJI Matrice 600 PRO HexaKopter for model input data gathering for flood alerts and forecasting.
2. Materials and Methods
2.1. Study Area
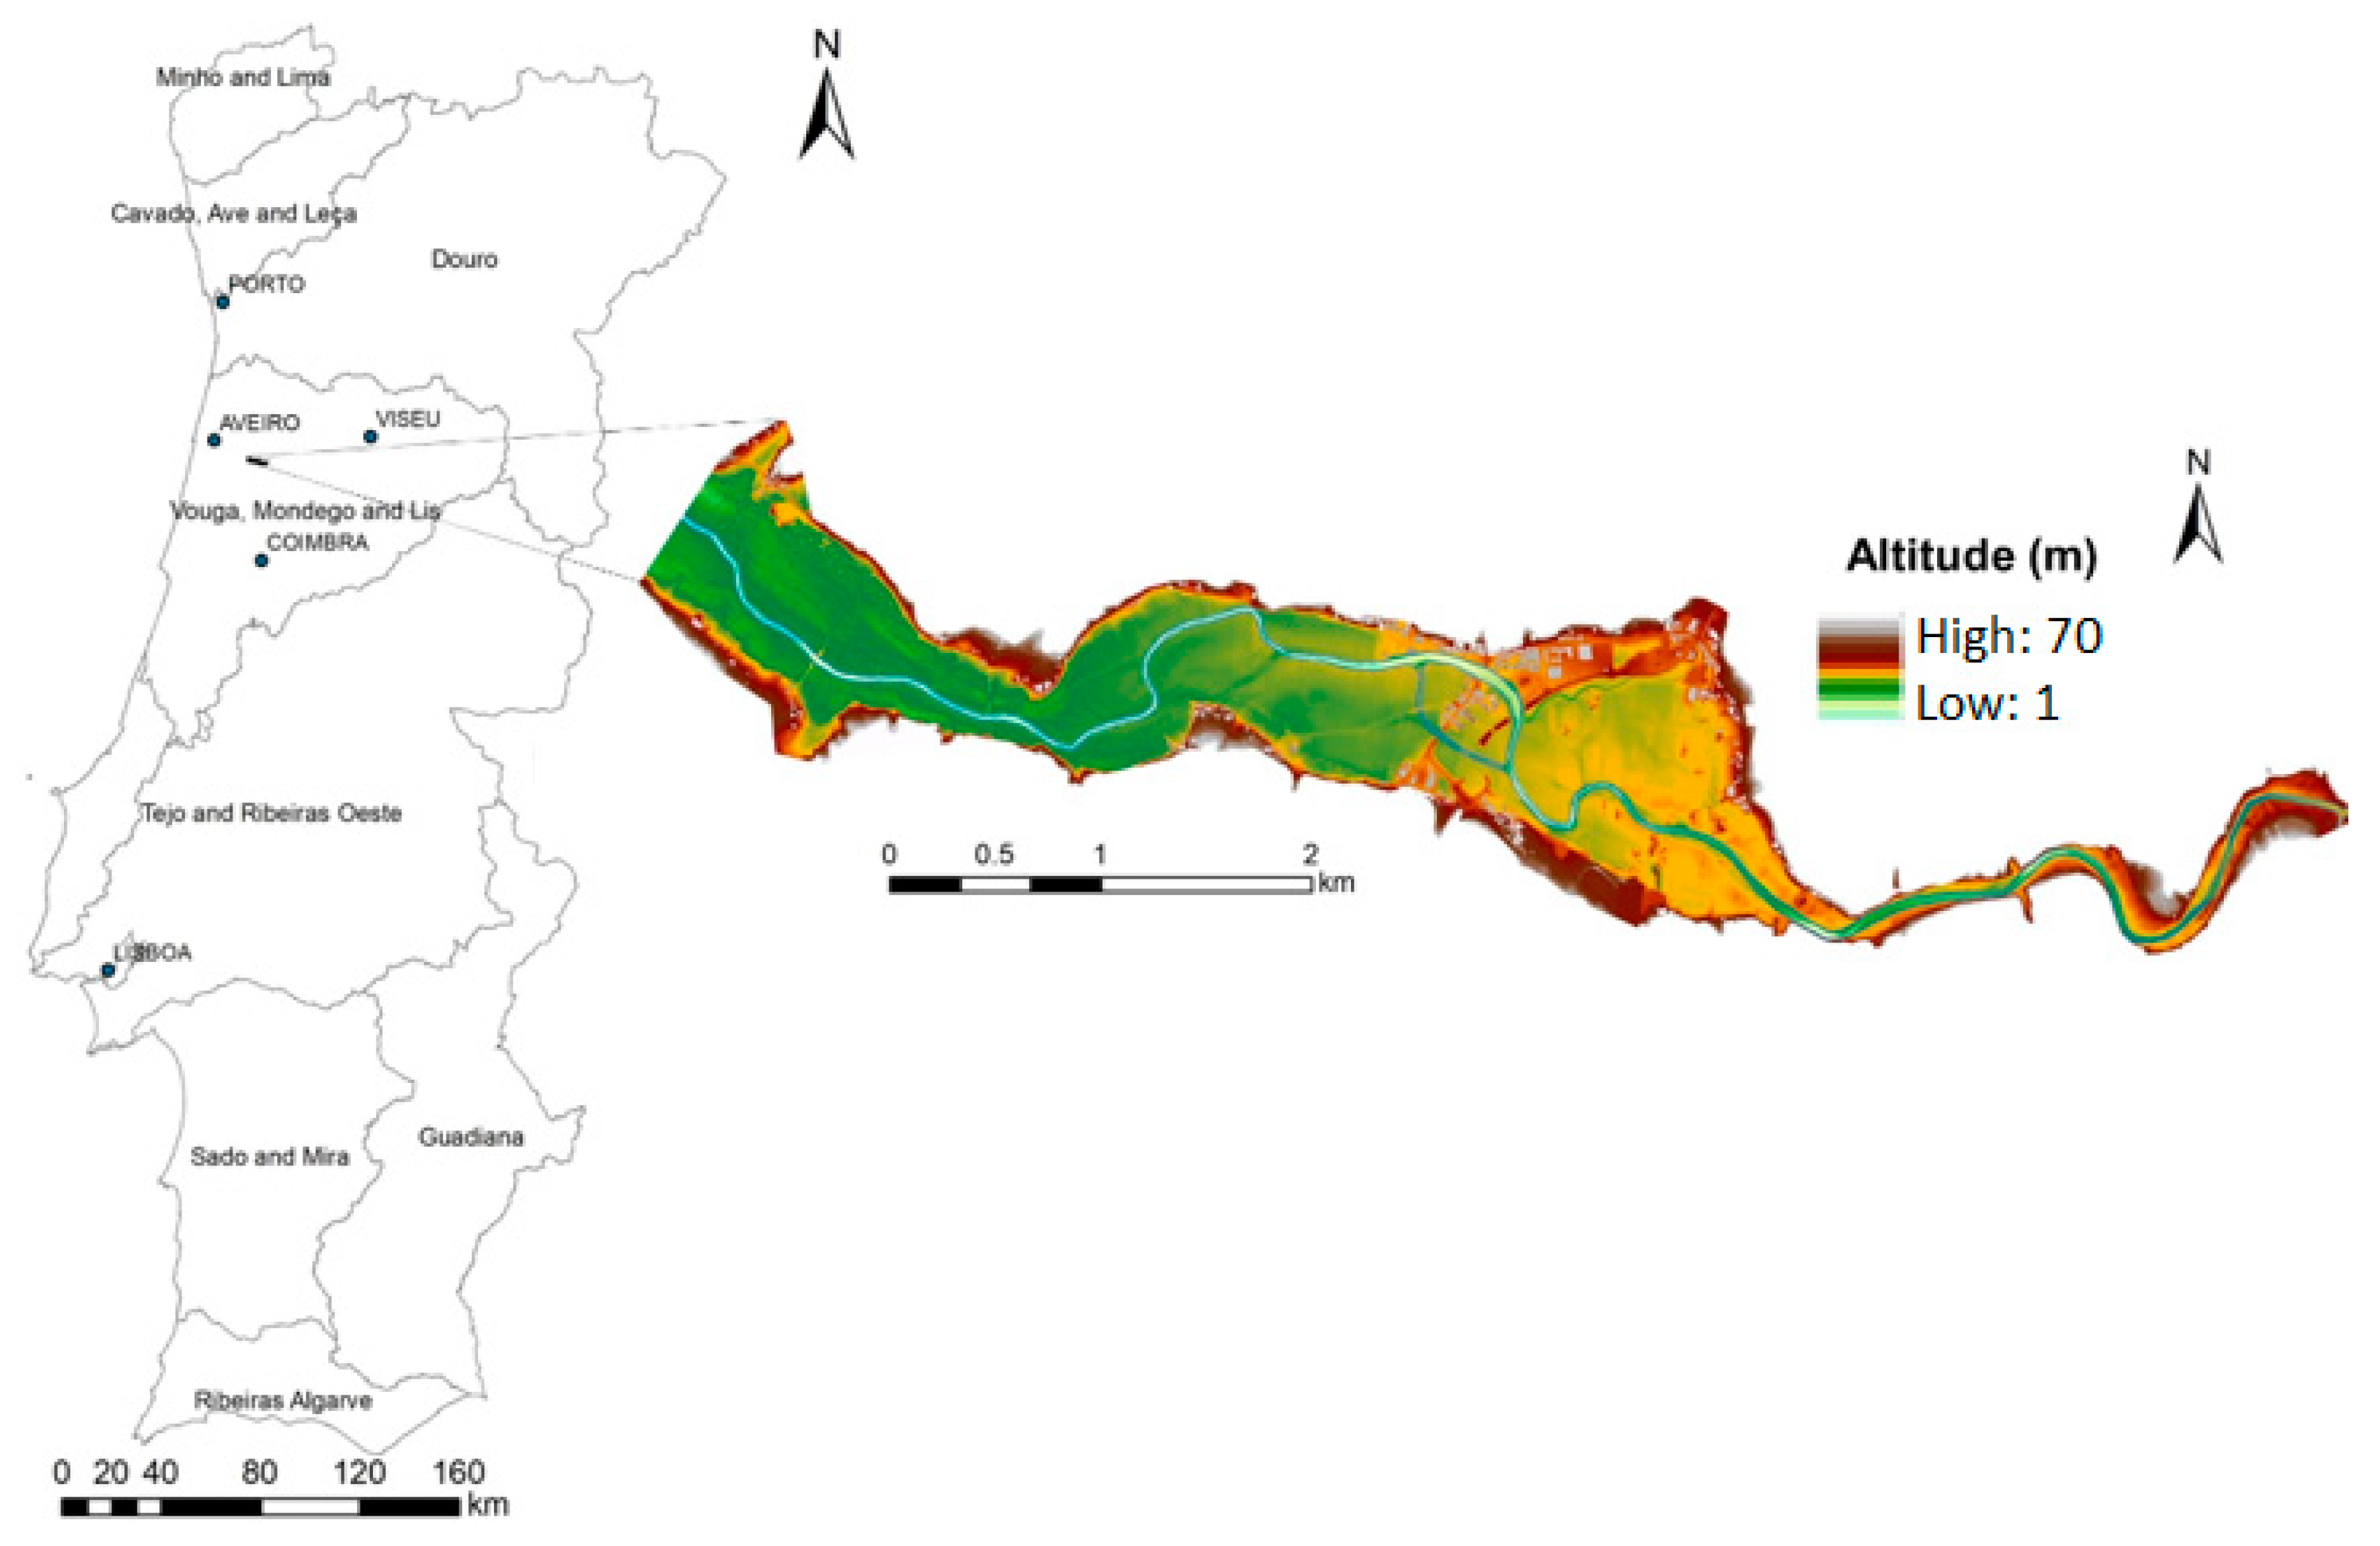
The study area is situated in the river basin of Vouga (Centre Region of Portugal) where flooding frequently occurs. It has around 560 ha and is crossed by the Águeda River for 9.8 km (Figure 1).
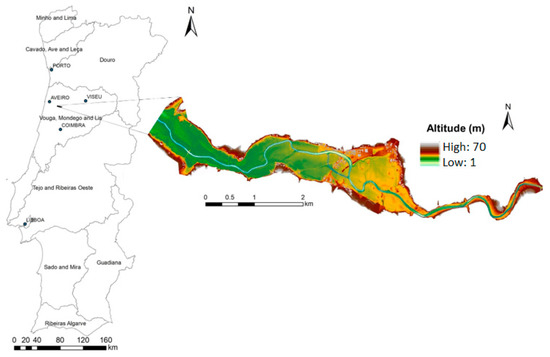
Figure 1.
Location and Digital Terrain Model (DTM) of the study area.
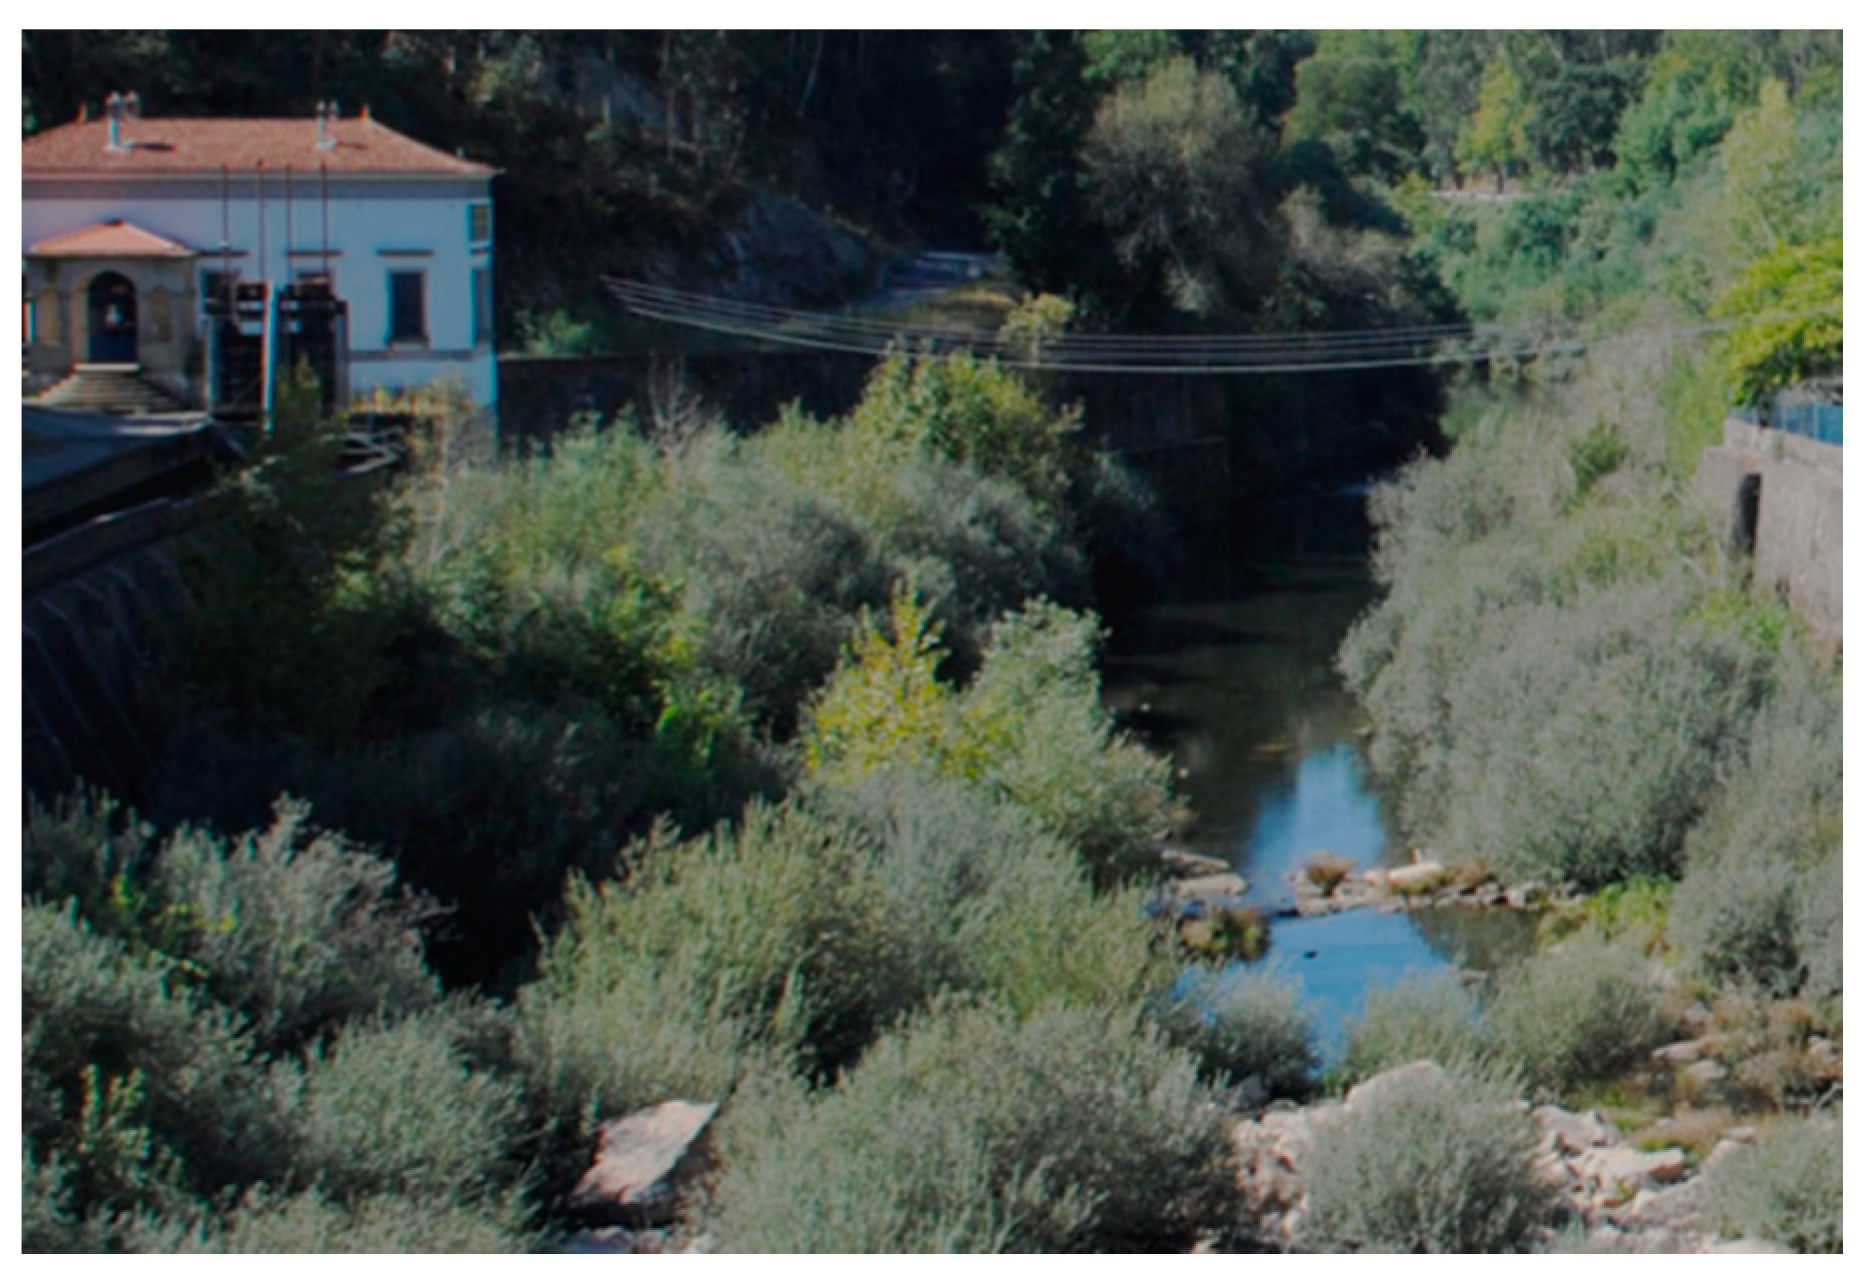
The river is mainly surrounded by agricultural fields bordering hillslopes that are typically steep, with angles of 16–25% and >25% in 9 and 14% of the area. The river margins have riparian vegetation with an elevated density, consisting of trees such as the alder, elm, oak, chestnut, and shrubs such as elderberries, holly, laurel, black alder, heather, and gorse (Figure 2). The elevation of the study area varies from 1 to 70 m (Figure 1).
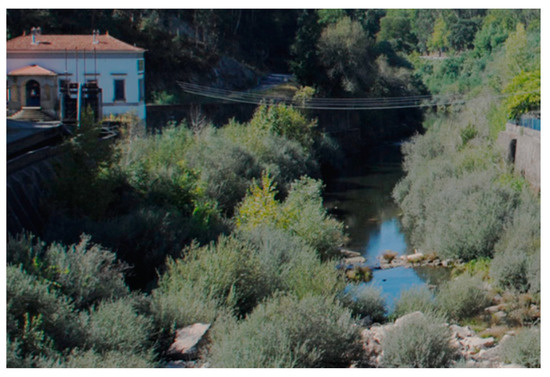
Figure 2.
Illustration of the typical vegetation along the riverbanks. www.life-agueda.uevora.pt/vegetacao-habitats.php.
2.2. LiDAR Data
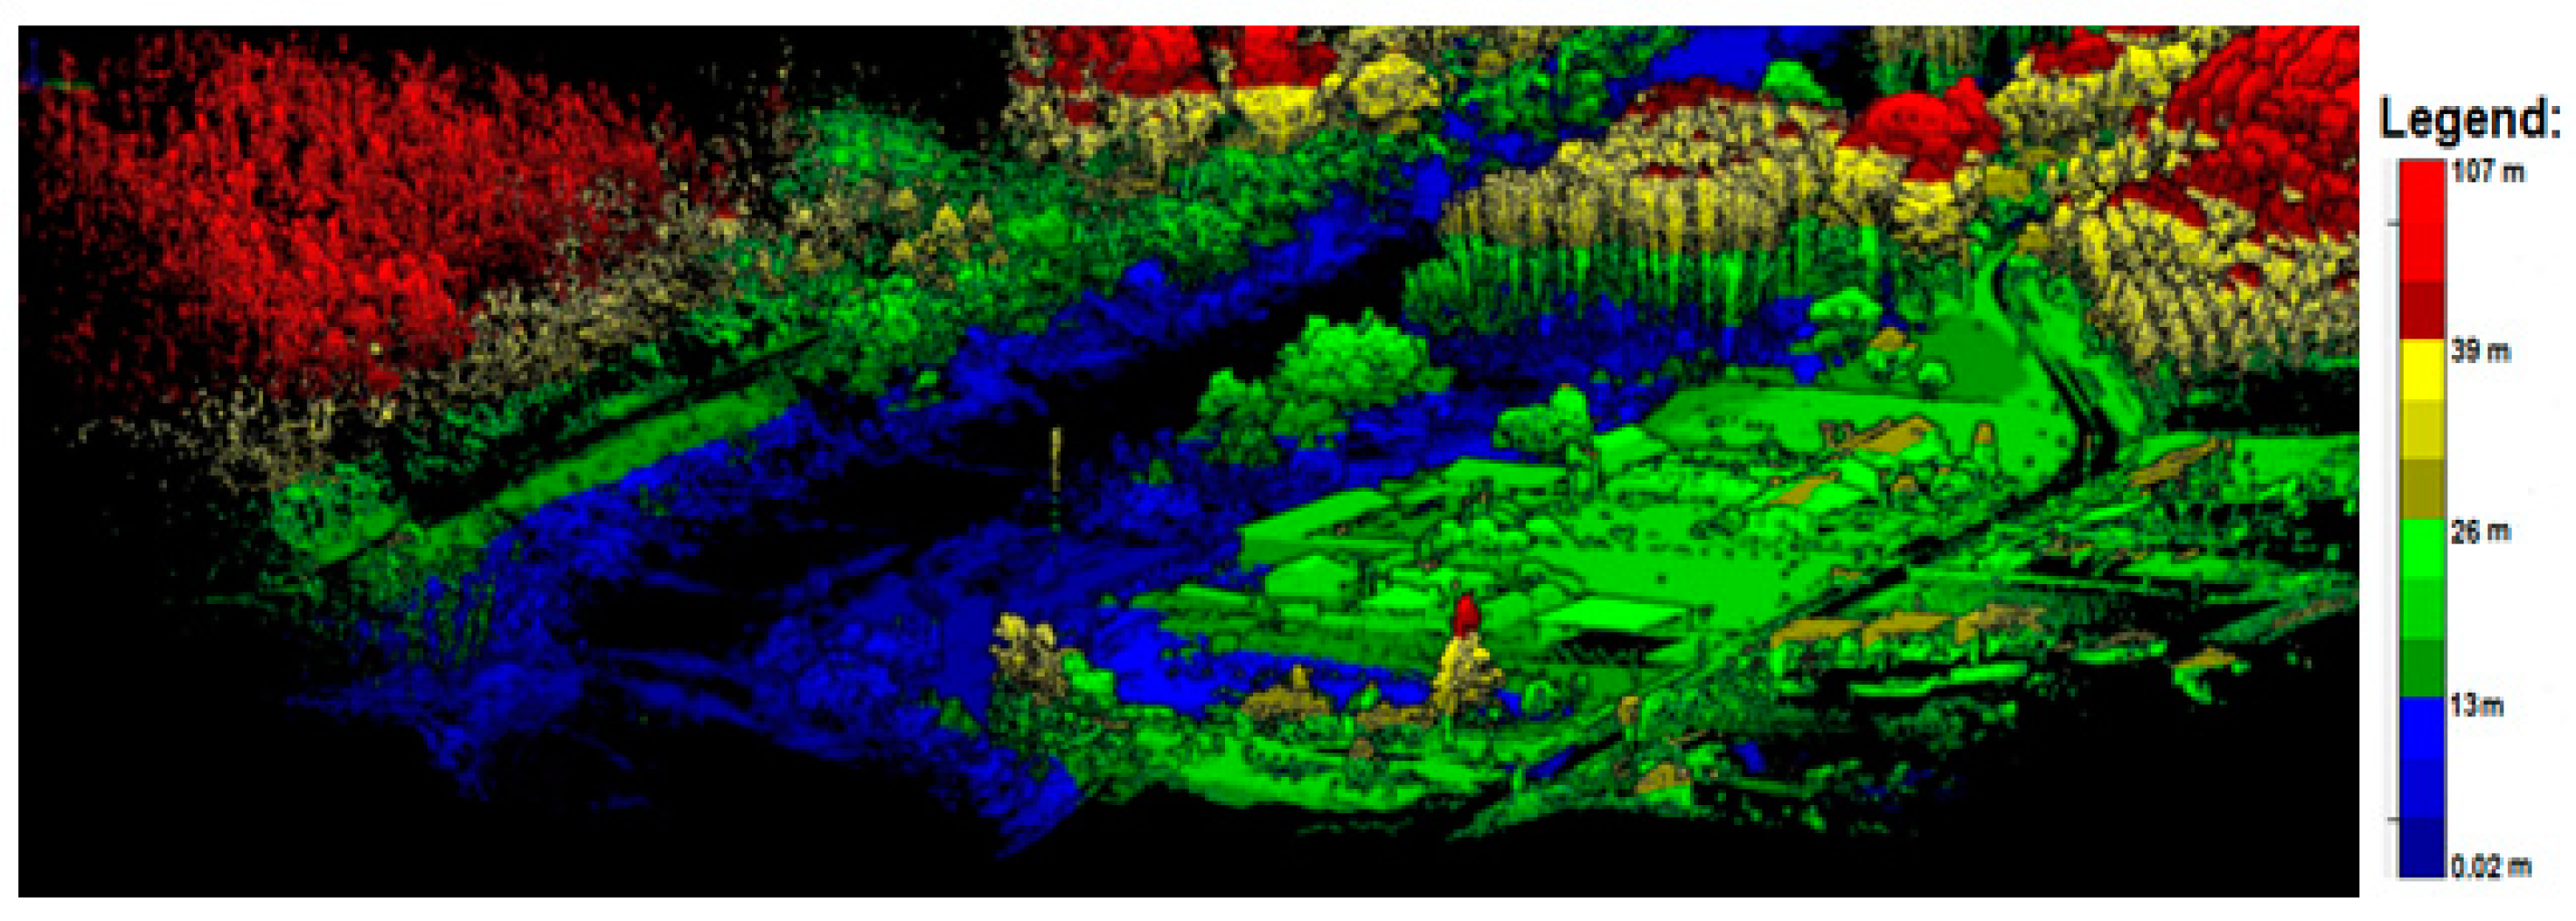
The outsourced LiDAR data acquisition was carried out between 22 and 25 January 2018, and it involved 42 flights at a mean flying height of 50 m (Figure 3). In areas where tall trees, high voltage electric power lines, and constructions occurred, the mean flying height ranged between 55 and 70 m. The mean velocity of the UAV was 5 m/s, which allowed capturing, in mean 180 points/m2, a total of 1,569,829,680 points. A small part of this point cloud is illustrated in Figure 4.

Figure 3.
Flight lines of the 42 flights.
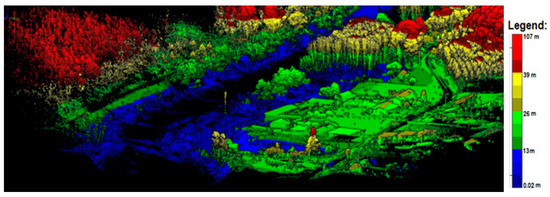
Figure 4.
A part of the point cloud, coloured by the height value.
Processing of the LiDAR data was also outsourced and done with the software LiDARMill of Phoenix LiDAR Systems. This software starts data processing by combining the IMU and GNSS data to generate smooth and accurate flight trajectories. It then automatically detects and eliminates turns and calibration patterns. Finally, it geo-references the data, minimizes offsets from multiple flight lines, and exports the aligned data in LAS format. Geo-referencing to the projection system PT-TM06 ETRS89 and the Altimetric Datum of Cascais was done using the PPK (Post-Processing Kinematic) method and involved a total of 25 GNSS base stations and the closest RNEP (Rede Nacional de Estações Permanentes) station (AGUE).
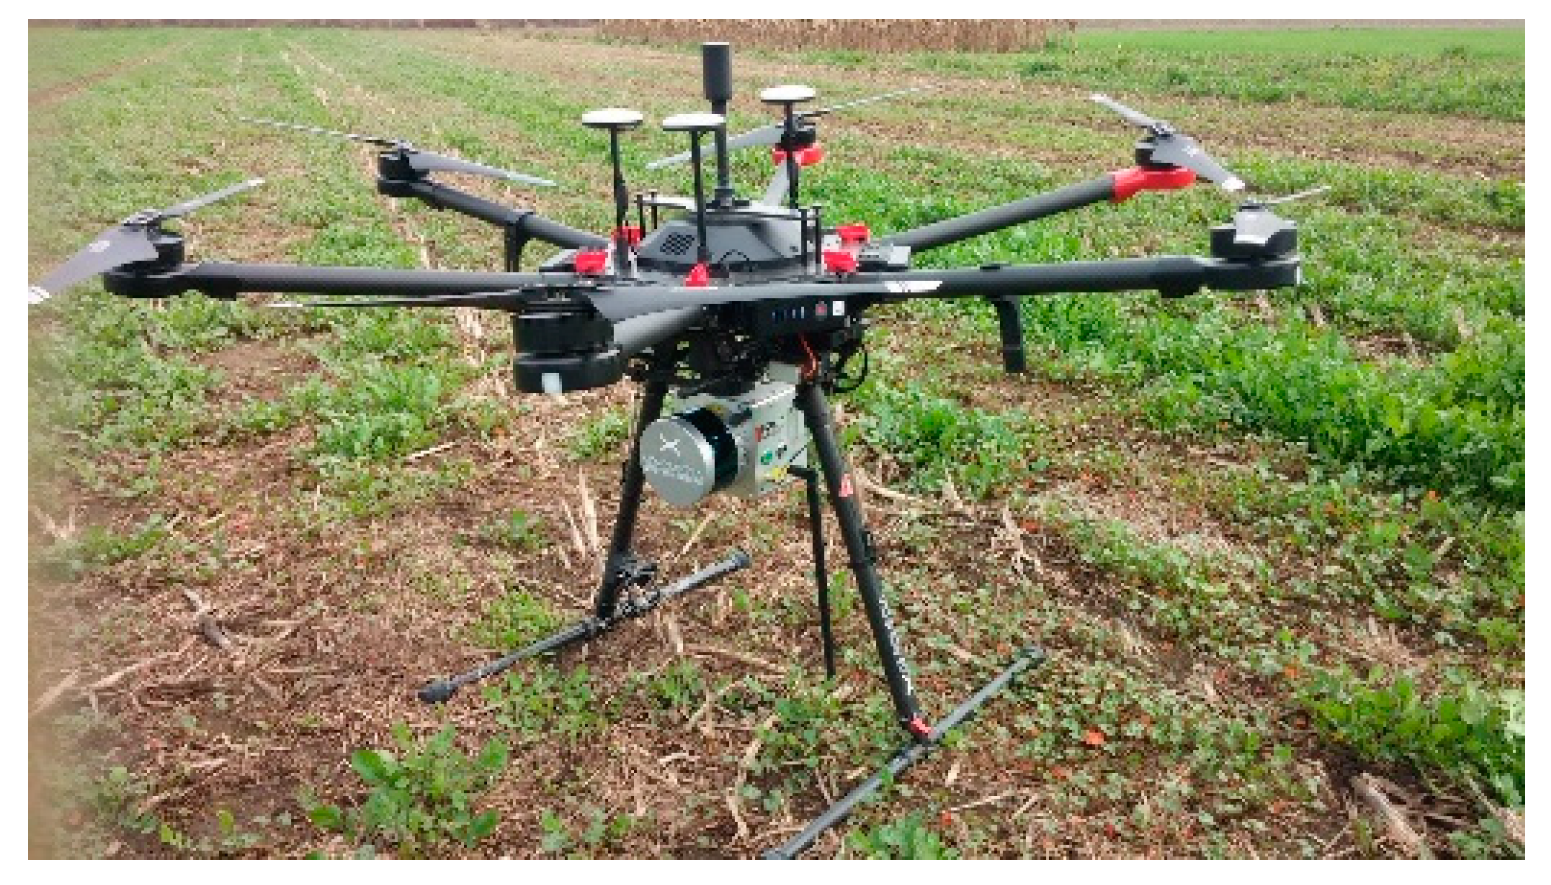
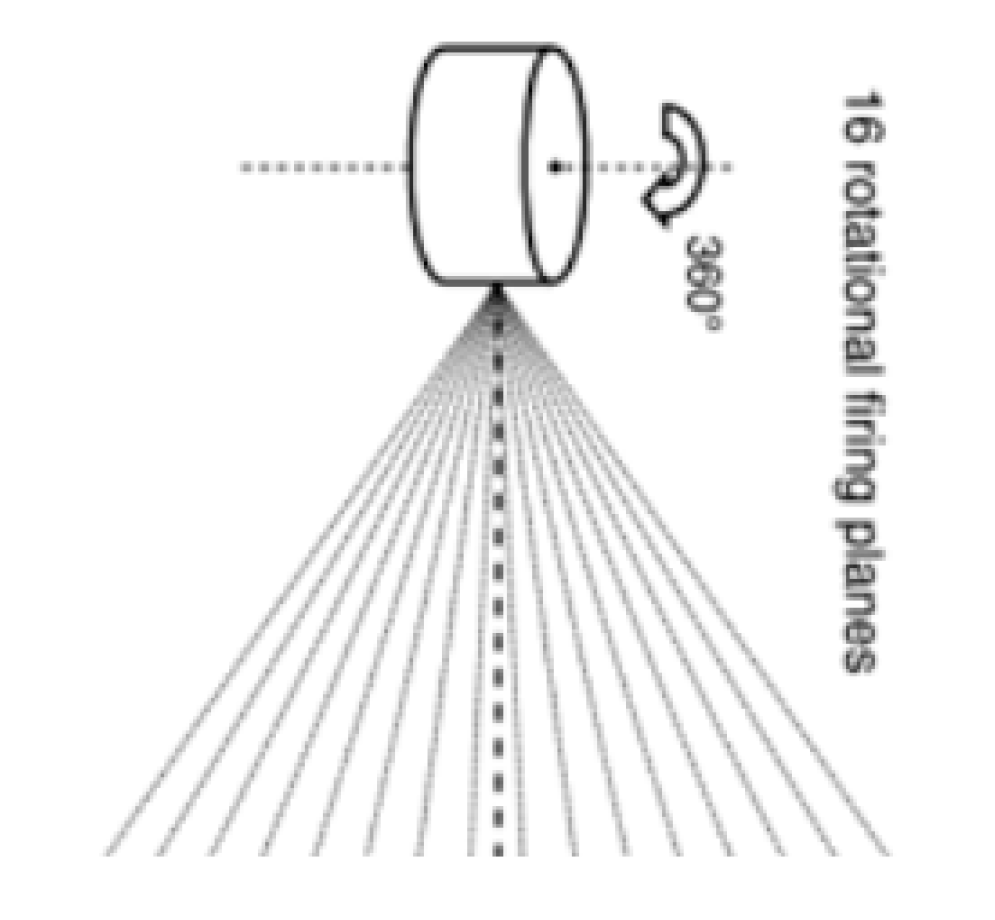
The system utilized to acquire the LiDAR data consisted of the UAV DJI Matrice 600 Pro Hexacopter, the Scout-16 LiDAR system with a Velodyne VLP-16 laser scanner (see Table 1 for technical specifications), the IMU OEM-ADIS16488 and three NovAtel OEM6 GNSS antennas (Figure 5). The Velodyne VPL-16 scanner is a multichannel scanner that irradiates 16 laser beams with an equally spaced angular division of two degrees in the front and rear concerning the flight direction and scans 360° in the direction perpendicular to that of the flight to obtain the data (Figure 6). The 16 laser beams with their different incident angles are expected to improve the ground acquisition rate, especially in densely forested areas [17].

Table 1.
Technical specifications of the LiDAR system used in this study [18].
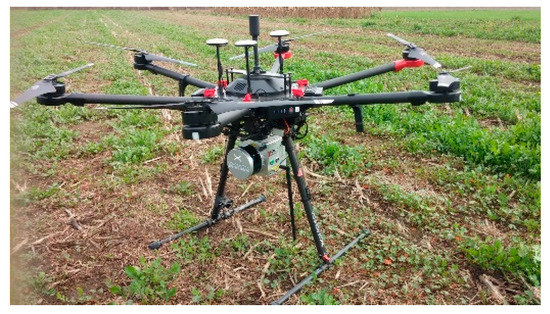
Figure 5.
The LiDAR data acquisition system used in this study.
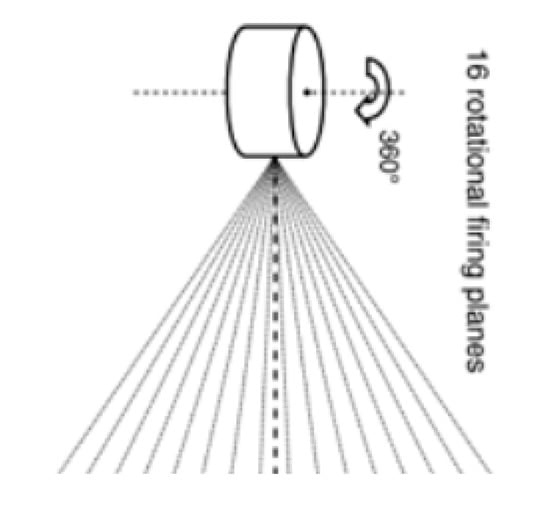
Figure 6.
Scheme of the Velodyne VLP-16 sensor.
2.3. Resources
The hardware used to analyze the LiDAR point cloud was a portable workstation with a processor i7-7820HQ CPU @ 2.90 GHz and 32 GB of RAM. The software was TerraScan of the Finnish Company Terrasolid.
The coordinates of the ground control points were measured with the geodetic GNSS receiver Trimble R4 that, in RTK (Real-Time Kinematic) mode, achieves, according to the manufacturer, centimetre-level positioning accuracy.
2.4. Methodology
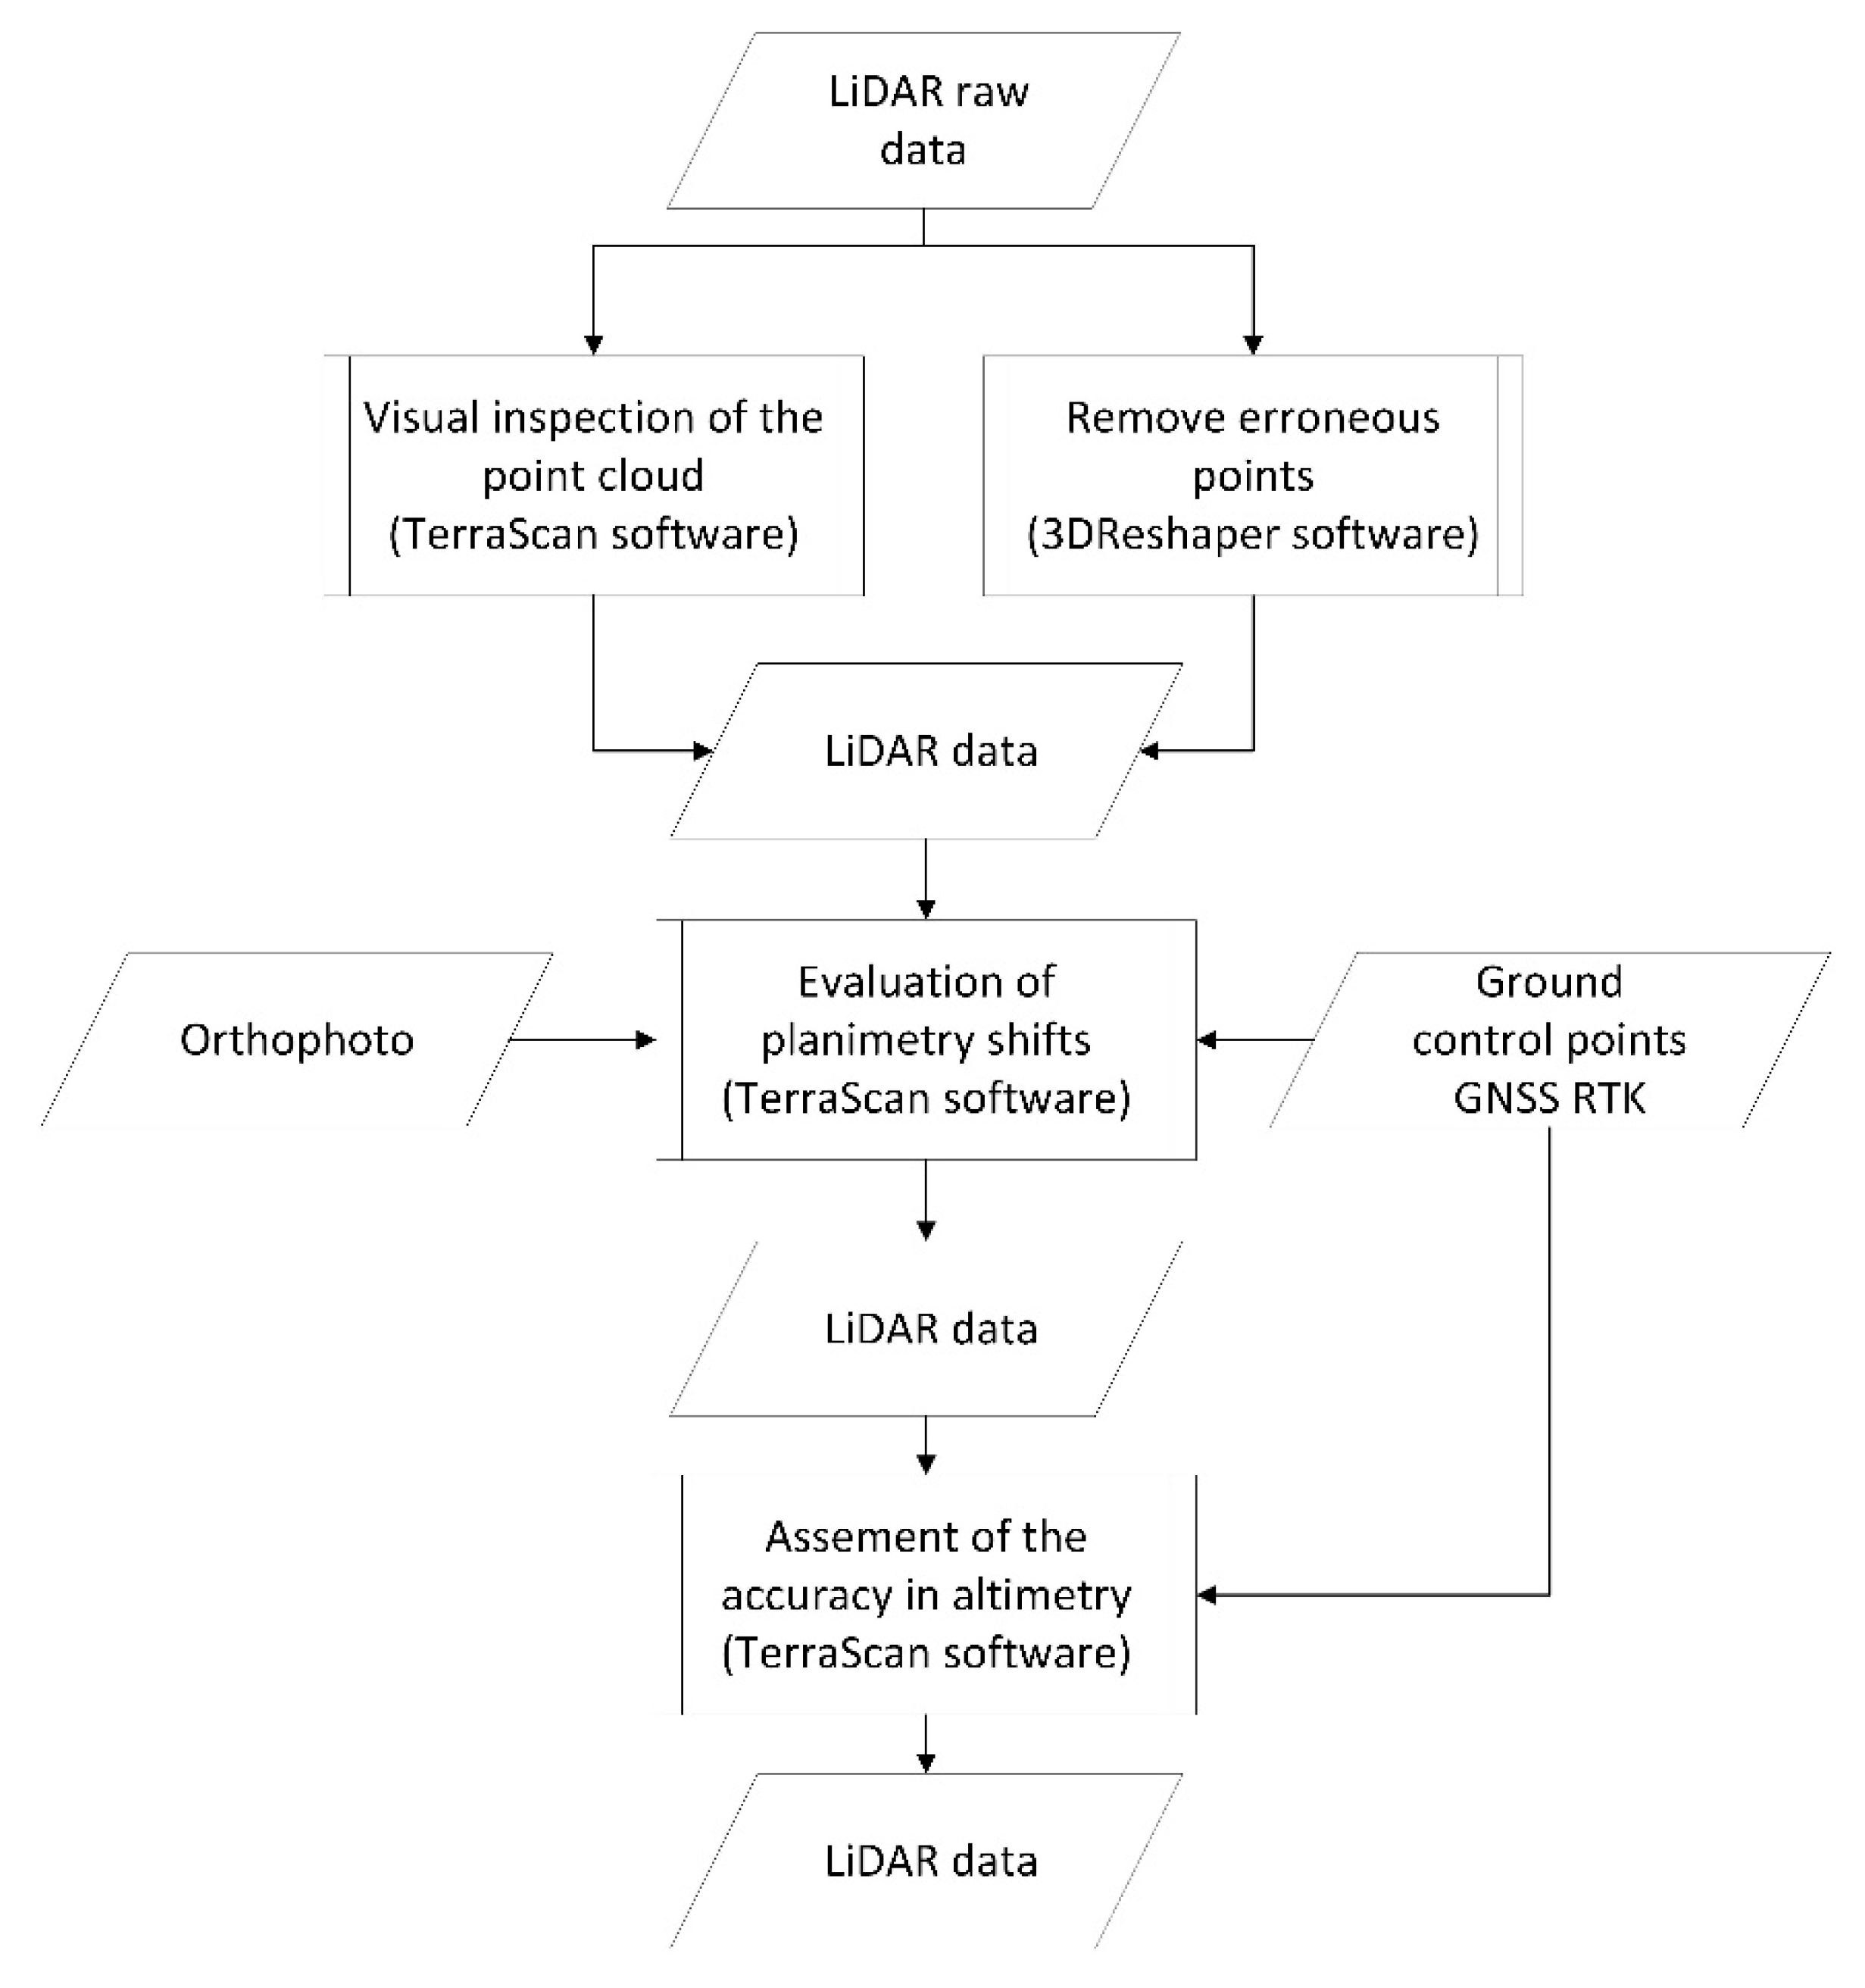
This study developed a methodology for quality control of UAV-based LiDAR data acquired and processed through outsourcing. This methodology comprises a set of three procedures as described below and illustrated in Figure 7.
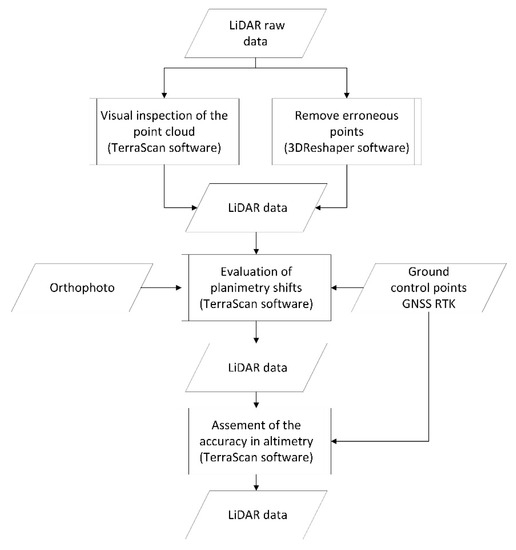
Figure 7.
Methodology flowchart.
The first procedure consists of the point cloud’s visual inspection to find erroneous points and to check the penetration of the LiDAR beam and the scanning density. Since the volume of data to handle is, in general, very large, dedicated software and hardware (see Section 2.3) have to be used.
Erroneous points are easy to detect because they stand out due to their altitude or intensity value (close to zero). They usually result from spurious reflections by airborne particles. The erroneous points amounted to about 45% of the total number of points in the cloud; thus, the contracted company was requested to eliminate them. This was done with the 3DReshaper software package.
Penetration of the LiDAR beam in vegetated areas is also worth visualizing before acceptance of the data delivered. This visual assessment is somewhat subjective but is nonetheless helpful for overall control of the data quality. Based on LiDAR data acquisition characteristics with a UAV, namely high pulse frequency, low flying height and speed, and use of several laser beams, it is expected a high penetration rate in vegetated areas. This property plays a vital role during the filtering process because it allows the discrimination between terrain and non-terrain points, increasing filtering reliability and the accuracy of derived products such as the DTM.
The mean point density is computed by the software (see Section 2.3), but it is advisable to quickly inspect the point cloud density in places crucial for the application.
The second procedure is essential and involves verifying if the data present shifts in planimetry. Such shifts will affect the accuracy in altimetry, especially where the terrain is steep or not smooth. They can be detected by comparing points on overlapping strips and quantified utilizing the X and Y coordinates of conspicuous features on flat surfaces that, preferably, are spread across the entire study area. This requirement may be challenging, particularly in densely vegetated areas.
The X and Y coordinates are measured in two different ways: by using prominent features in an orthophoto produced with high accuracy, and well-identified ground control points. The latter’s coordinates have to be measured with a precise instrument as a geodetic GNSS in the RTK mode (see Section 2.3).
The quantification of the shift is not a straightforward process because the orthophoto features and those on the terrain do not have a direct correspondence in the point cloud. The shifts can be estimated by fitting linear segments to the points in the cloud that are considered to represent the feature. The distance between corresponding points of the two features is then measured manually using the software.
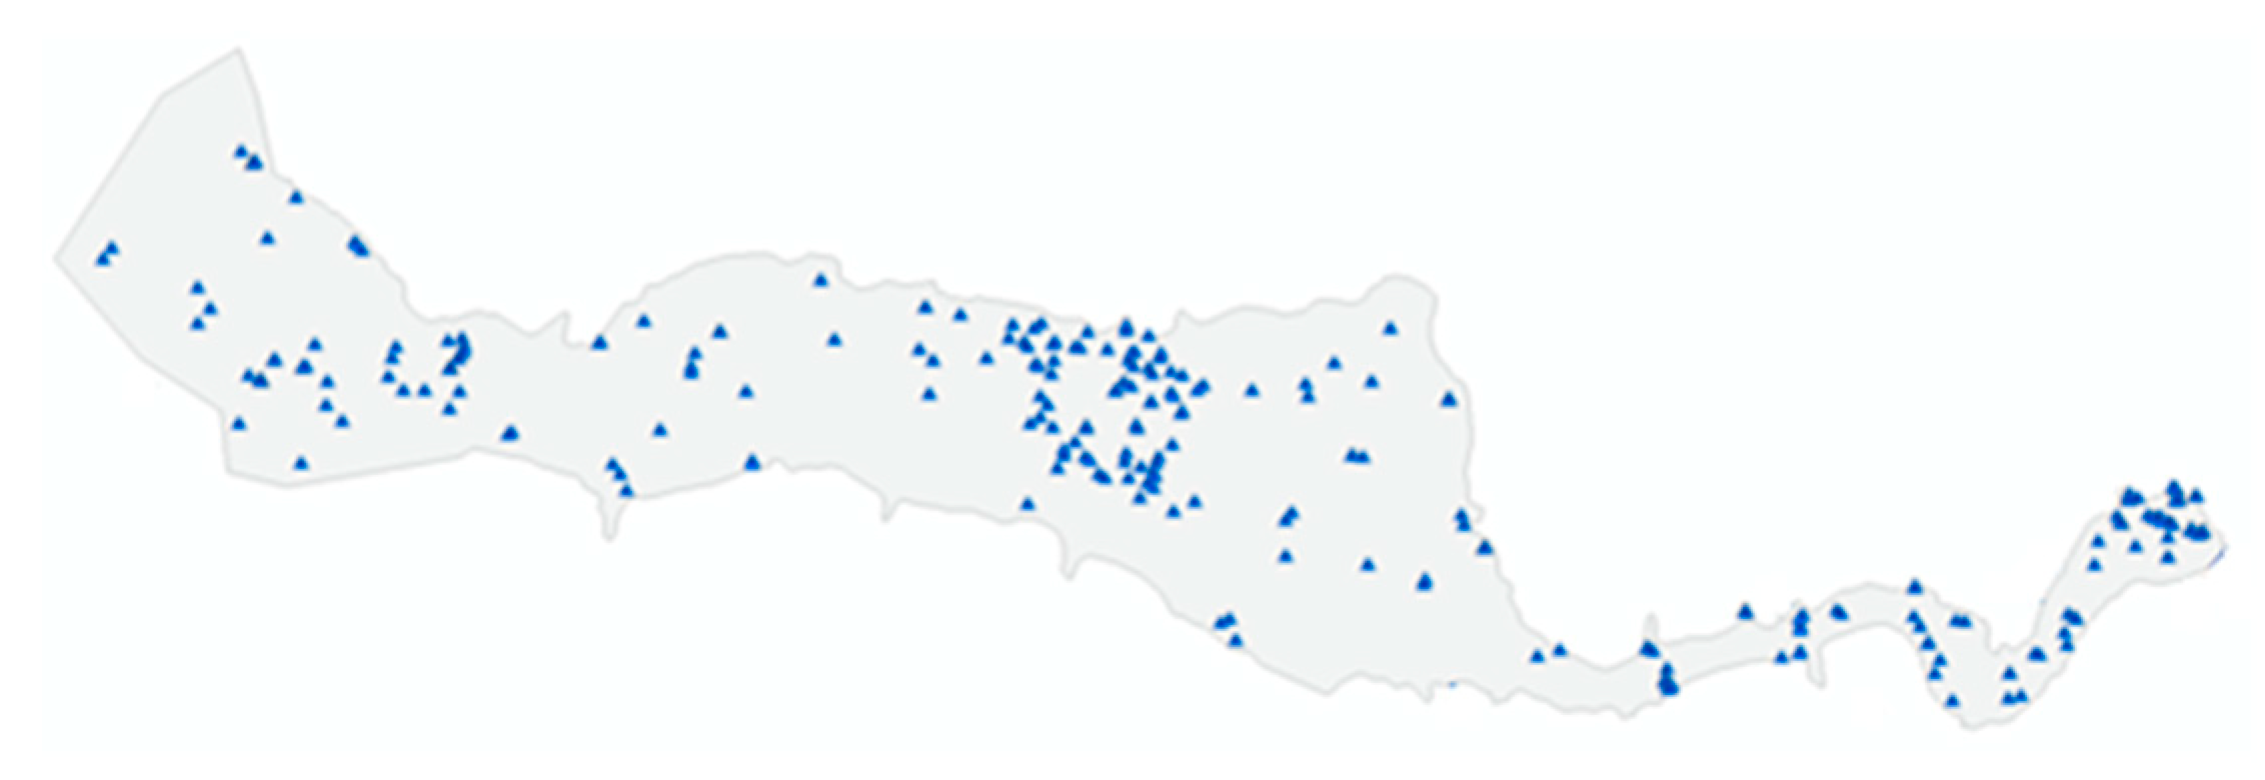
The third procedure concerns the assessment of the accuracy in altimetry. To this end, the RMSE in Z was computed using 277 ground control points (0.5 points/ha) selected employing stratified random sampling over the study area (Figure 8). The stratified random sampling method was selected to have representative features of all the areas such as the breaklines, prominent points, points on flat areas with and without vegetation, on roads, on river margins with and without vegetation, and slopes with and without vegetation. Furthermore, for areas, such as Águeda downtown, where for studying flood purposes, the DTM has to be most precise, more control points were surveyed than other less relevant areas, such as fields.
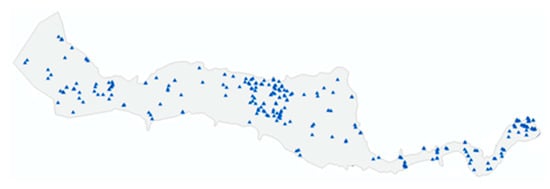
Figure 8.
Ground control points used for the assessment of the accuracy in altimetry.
The residuals in Z were obtained using the software TerraScan by which the Z values for the X and Y locations of the ground control points were interpolated using the triangle facets made with the three closest points in the cloud. The RMSE (Root Mean Square Error) in Z for each of the areas and other statistics, as the mean of residuals and maximum and minimum residuals, were then computed.
The point cloud was first filtered to remove obstacles such as buildings, cars, and vegetation, thereby avoiding erroneous interpolation when using points located other than on the terrain surface. Filtering based on the Axelsson filter [19], implemented in TerraScan, was used. Points in the point cloud are classified as either ground or non-ground using a progressive TIN densification algorithm. This algorithm begins by constructing a sparse TIN with the lowest point within a specified size neighbourhood. The TIN is densified by adding points of the set of unclassified points, and that satisfy specific criteria. The criteria concern the vertical distance between the candidate point and a triangle plane, and the angle between the candidate point, its projection on the triangle plane, and the closest vertex. An additional criterium can be used to control the maximum terrain slope allowed at each triangle of the TIN surface. These four values are compared against thresholds. The densifying of the TIN stops when no more unclassified points satisfy the criteria or if a specified ground point density is achieved. As there are several parameters involved, it may be needed to repeat filtering in wrongly filtered locations. This is relevant mainly when too many points are removed, or points have been classified wrongly as ground, like points on roofs with a size bigger than the neighbourhood size selected to carry out the filtering.
3. Results
By visually inspecting the delivered point cloud, 45% of the points were found to be erroneous and, therefore, had to be removed. These points had either negative altitudes values and/or intensity values near to zero. A firmware problem explained many erroneous points, but others resulted from spurious reflections generally in the atmosphere. After cleaning the point cloud, the company delivered a new one. However, the return number, either the strongest (by light energy) or the second, associated with each point in the cloud, was lost. The company claimed this to be a limitation of the software they used (see Section 2.4) and did not offer any solution.
An example of erroneous points is illustrated in Figure 9a, whereas Figure 9b shows the respective clean point cloud. With a point density per m2 of 97.14, the clean point cloud is made of 713,777,230 points that occupy 19 GB of disk space.

Figure 9.
Erroneous points (a) and the clean point cloud (b).
The penetration of the LiDAR beams in areas with vegetation was considered to be acceptable. Figure 10 shows a profile of the point cloud in an area with vegetation.

Figure 10.
Penetration of the laser beams in areas with vegetation.
During the day before the data were acquired, rainfall contributed to gaps in the point cloud, for there were several puddles, mainly in the agriculture fields along the riverbanks. These, together with the resulting muddy soil in the next days, created conditions for the laser sensor beams not to reflect. The point cloud visual analysis also showed that on roads paved with asphalt or stones, the point cloud’s density is reduced by about 30%, as exemplified in Figure 11a,b. Figure 11b also illustrates a situation of almost no reflection within a football field covered with synthetic grass. The reduction of the point density on these structures may be explained by the roads’ backscattering properties and the synthetic grass material. In [20], it is shown that the typical reflectivity of asphalt with pebbles is 17%, for a laser wavelength of 900 nm.

Figure 11.
Point cloud along (a) roads paved with asphalt and stone; (b) football field with synthetic grass and roads paved with asphalt.
Figure 12 shows an unusual situation in which three roofs of small sheds covered with the same material, zinc painted in dark green, reflect the laser beams differently. While the middle roof with tiles oriented in a direction close to that of the swiping reflects some laser beams, the other two, with the tiles oriented in a perpendicular direction, reflect much less.

Figure 12.
Point cloud on top of three zinc roofs. The yellow lines on top of the roofs represent the orientation of the tiles.
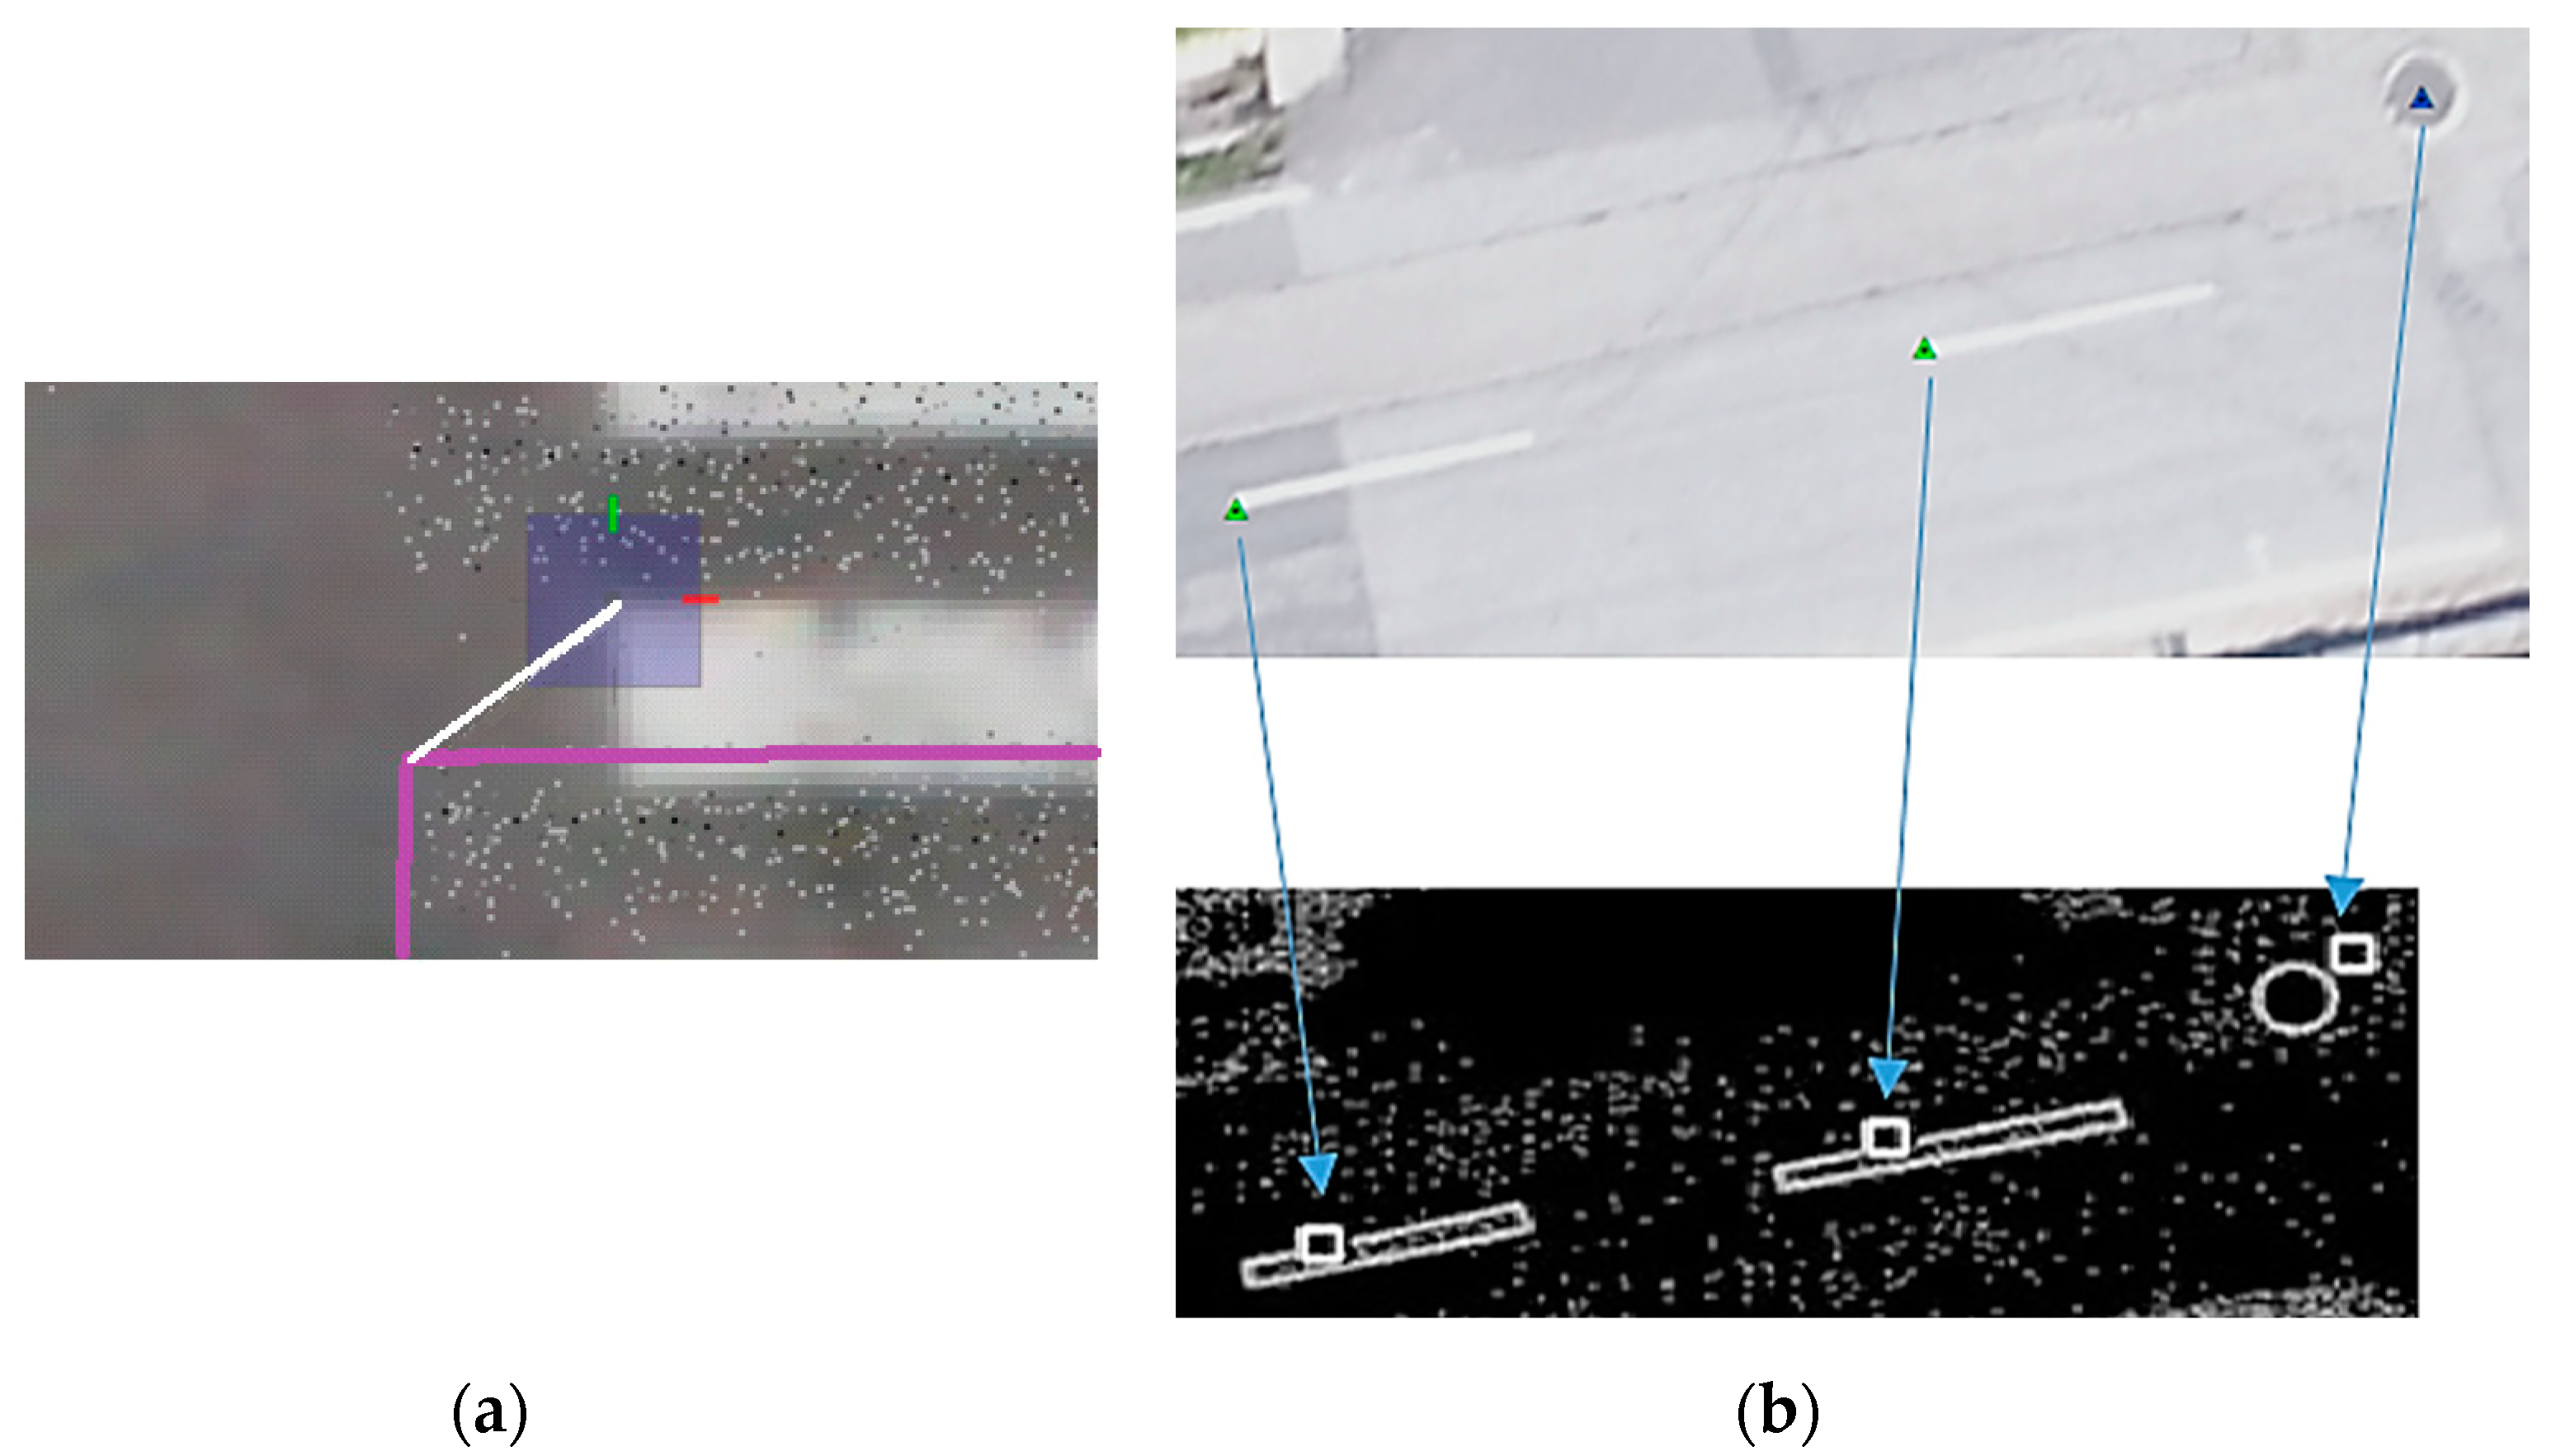
Using TerraScan, the visual analysis of profiles collected on portions of the point cloud and the point cloud itself permitted the detection of shifts in planimetry. The shifts were either relative, i.e., among neighbouring strips (Figure 13) and/or absolute, i.e., concerning the locations of ground control points (Figure 14). The latter was estimated by using prominent features on an orthophoto produced with 5 cm accuracy in XY (Figure 14a) [21] and well-identified ground control points (Figure 14b) measured with a geodetic GNSS and the RTK mode (see Section 2.3). The procedure described in Section 2.4 was used to quantify the planimetric shift. The value of the planimetric shift encountered using features from the orthophoto and control points was in the order of 50 cm in X and Y.

Figure 13.
The shift in planimetry among neighbouring strips.
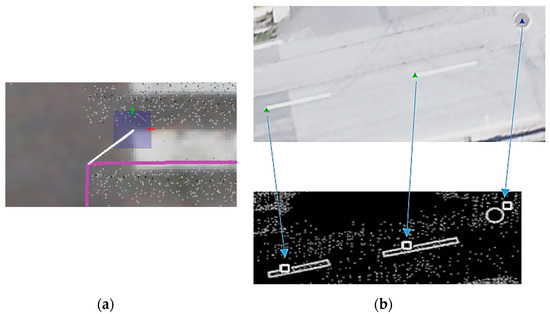
Figure 14.
Shift in planimetry when using prominent points on an orthophoto (a) and the coordinates of ground control points (b). The arrows in (b) show the ground control points’ projection, indicated by the green triangles, into the point cloud, indicated by the white square.
The planimetric shift’s impact on the altimetric accuracy is assessed using two areas, of around 100 ha each, with very different topography: one with gentle terrain and the other with steep slopes (>16%). This altimetry assessment was carried out using the coordinates of ground control points, 85 points for the smooth area and 10 points for the other (this difference in the number of the control points is because they were collected for other purposes). The ground control points were measured with the geodetic receiver (see Section 2.3) and the RTK mode. The closest station (AGUE) of the RNEP (Rede Nacional de Estações Permanentes) is used to this end.
The RMSE in Z, as well as the mean, minimum and maximum residuals, were computed. As also mentioned in Section 2.4, the residuals in Z were obtained using the software TerraScan that creates a triangle from the closest three points in the cloud around a ground control point location to interpolate the corresponding Z value. On average, the separation of the points in the triangle facets was about 8 cm. It should be noticed that with this method, the accuracy assessment in altimetry is not done by first producing a TIN (Triangular Irregular Network), as habitually. Instead, the triangle facets are constructed on demand when computing the Z residuals for each control point. In this way, point thinning methods, usually required when the cloud includes millions of points, are avoided. The results listed in Table 2 show what appears to be an 8 cm negative systematic error resulting from the planimetric shift. This value is only indicative, as the selected areas are relatively small.

Table 2.
RMSE in altimetry and other statistics.
The results indicated that data quality should be improved. After consulting the company, it was realized that they did not perform strip adjustment. Therefore, the company reprocessed the data with strip adjustment without using ground control points. The shifts in planimetry were reduced to around 15 cm. They were distributed in every direction, without showing a systematic pattern. Figure 15 illustrates the improved situation when considered that illustrated in Figure 14.
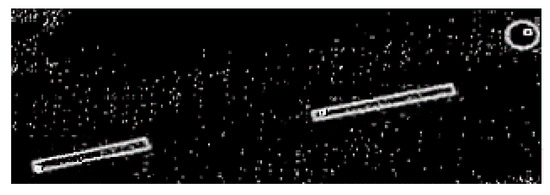
Figure 15.
Planimetric shifts after strip adjustment.
After the data was reprocessed, the final accuracy in altimetry was assessed for throughout the entire study area using 277 ground control points and the same method as described in Section 2.4. Table 3 lists the obtained RMSE and other related quality indicators. It should be noticed that the filtering process (Section 2.4) might have a significant impact on the final accuracy. Incorrect filtering of the point cloud may remove too many terrain points and/or leave non-terrain points, leading to inaccurate Z estimates. Nevertheless, the obtained RMSE of 15 cm is similar to that obtained in Reference [22] and better than that estimated in Reference [23]. If strip adjustment were executed with ground control points, this figure would be reduced, as stated in Reference [17], where it was shown that altimetric accuracy was reduced from 10 to 4 cm (in an area of 0.02 km2, nine ground control points were used). For applications demanding very high accuracy, the company Phoenix Systems recommends the use of ground control points well distributed within the surveyed area amounting to 10 in 1 km2. This amount of ground control points not only increases the price of the LiDAR data acquisition by a UAV but is also impractical in situations of densely forested or inaccessible areas. Nonetheless, that amount of ground control points does not appear to be founded in scientific considerations. This aspect needs to be further investigated.

Table 3.
Final RMSE in altimetry and other statistics for the study area.
4. Final Considerations
LiDAR point clouds acquired using a UAV through outsourcing may not have the expected quality. In our case study, the LiDAR data quality raised some issues that were not inherent to the LiDAR system but reflected flaws in the quality of the delivered service. This may have resulted from the service provider’s lack of experience and expertise. The provider’s production chain did not appear to be well established so that the quality of the point cloud and the derived products meet the contracted specifications.
The biggest problem was a planimetric shift of 50 cm in some parts of the point cloud, which resulted from the fact that no strip adjustment was carried out. Without meticulous inspection of the LiDAR point cloud, this shift would deteriorate the quality of derived information, such as a DTM, with large errors. Reprocessing of the point cloud with strip adjustment without using ground control points resulted in a substantial improvement of the planimetric shift to a value in the order of 15 cm.
The obtained accuracy in altimetry was 15 cm for RMSE, which agrees with the standards for the production of the DTM at large scales. In places with vegetation, the altimetric accuracy is superior to that obtained with UAV photogrammetry using a consumer-grade camera, which is due to the laser beam’s capacity to penetrate the vegetation.
LiDAR data acquisition with a UAV allows point clouds with very high density. This characteristic, together with LiDAR’s capacity to penetrate vegetation, increase the robustness and reliability of filtering procedures and, ultimately, contributes to a DTM with high accuracy [24]. Such very high-density point clouds are also useful to derive accurate information as, for example, 3D land cover maps needed for hydrodynamic modelling to simulate flood extent estimation or accurate tree variables in case of forest inventory.
In our case, data acquisition with a LiDAR system mounted on a UAV was about four times cheaper than the acquisition of LiDAR data with comparable quality using an aircraft (18 versus 71 €/ha). When the intention is to purchase only the point cloud from UAV-based LiDAR systems, careful considerations need to be given to selecting the processing software, not only concerning its costs but also its functionality for data filtering and DTM production. Of course, the same applies when LiDAR data is acquired by aircraft.
An aspect that equally requires special attention when LiDAR data processing is to be done in-house concerns the huge amount of data involved. In this case, the filtering of the point cloud and the production of a DTM took around one week of computer processing. This may seem acceptable in itself, given the size of the surveyed area (560 ha) and the point cloud density (100 points/m2).
Author Contributions
Conceptualization, L.G.P., P.F. and S.M.; methodology, L.G.P., C.M. and J.M.; software, C.M. and J.M.; validation, L.G.P., P.F. and S.M.; formal analysis, L.G.P. and C.M.; writing—original draft preparation L.G.P. and C.M.; writing—review and editing, P.F., S.M., and F.M.; funding acquisition, L.G.P., P.F., S.M. and F.M. All authors have read and agreed to the published version of the manuscript.
Funding
This work was funded by the Operational Programme of the Centre Region, in its FEDER component, in the ambit of the project Centro-01-0145-FEDER-023566.
Data Availability Statement
Data supporting reported results can be found in www.ffas.web.ua.pt.
Acknowledgments
The publication of this work was supported by the project Centro de Investigação em Ciências Geo-Espaciais, reference UIDB/00190/2020, funded by COMPETE 2020 and FCT, Portugal.
Conflicts of Interest
The authors declare no conflict of interest.
References
- Nikolakopoulos, K.G.; Soura, K.; Koukouvelas, I.K.; Argyropoulos, N.G. UAV vs classical aerial photogrammetry for archaeological studies. J. Archaeol. Sci. Rep. 2017, 14, 758–773. [Google Scholar] [CrossRef]
- Norasma, C.Y.N.; A Fadzilah, M.; Roslin, N.A.; Zanariah, Z.W.N.; Tarmidi, Z.; Candra, F.S. Unmanned Aerial Vehicle Applications In Agriculture. In Proceedings of the IOP Conference Series: Materials Science and Engineering, Bangkok, Thailand, 17–19 May 2019; Volume 506, p. 012063. [Google Scholar]
- Iglhaut, J.; Cabo, C.; Puliti, S.; Piermattei, L.; O’Connor, J.; Rosette, J. Structure from Motion Photogrammetry in Forestry: A Review. Curr. For. Rep. 2019, 5, 155–168. [Google Scholar] [CrossRef]
- Zhexiong, S.Z.S. Real-Time 3D Reconstruction on Construction Site Using Visual SLAM and UAV. In Proceedings of the Construction Research Congress 2018, New Orleans, LA, USA, 2–4 April 2018; pp. 305–315. [Google Scholar]
- Ren, H.; Zhao, Y.; Xiao, W.; Hu, Z. A review of UAV monitoring in mining areas: Current status and future perspectives. Int. J. Coal Sci. Technol. 2019, 6, 320–333. [Google Scholar] [CrossRef]
- Ruzgienė, B.; Berteška, T.; Gečyte, S.; Jakubauskienė, E.; Aksamitauskas, V.Č. The surface modelling based on UAV Photogrammetry and qualitative estimation. Measurement 2015, 73, 619–627. [Google Scholar] [CrossRef]
- Pilarska, M.; Ostrowski, W.; Bakuła, K.; Górski, K.; Kurczyński, Z. The Potential of Light Laser Scanners Developed for Unmanned Aerial Vehicles—The Review and Accuracy. ISPRS Int. Arch. Photogramm. Remote. Sens. Spat. Inf. Sci. 2016, 87–95. [Google Scholar] [CrossRef]
- Bakuła, K.; Salach, A.; Wziątek, D.Z.; Ostrowski, W.; Górski, K.; Kurczyński, Z. Evaluation of the accuracy of lidar data acquired using a UAS for levee monitoring: Preliminary results. Int. J. Remote Sens. 2017, 38, 2921–2937. [Google Scholar] [CrossRef]
- Torresan, C.; Berton, A.; Carotenuto, F.; Di Gennaro, S.F.; Gioli, B.; Matese, A.; Miglietta, F.; Vagnoli, C.; Zaldei, A.; Wallace, L. Forestry applications of UAVs in Europe: A review. Int. J. Remote Sens. 2017, 38, 2427–2447. [Google Scholar] [CrossRef]
- Brede, B.; Lau, A.; Bartholomeus, H.; Kooistra, L. Comparing RIEGL RiCOPTER UAV LiDAR Derived Canopy Height and DBH with Terrestrial LiDAR. Sensors 2017, 17, 2371. [Google Scholar] [CrossRef] [PubMed]
- Yan, W.; Guan, H.; Cao, L.; Yu, Y.; Gao, S.; Lu, J. An Automated Hierarchical Approach for Three-Dimensional Segmentation of Single Trees Using UAV LiDAR Data. Remote Sens. 2018, 10, 1999. [Google Scholar] [CrossRef]
- Villanueva, J.E.; Iglesias, L.; Montiel, J.P. DEM Generation from Fixed-Wing UAV Imaging and LiDAR-Derived Ground Control Points for Flood Estimations. Sensors 2019, 19, 3205. [Google Scholar] [CrossRef] [PubMed]
- Prata, G.A.; Broadbent, E.N.; De Almeida, D.R.A.; Peter, J.S.; Drake, J.; Medley, P.; Corte, A.P.D.; Vogel, J.G.; Sharma, A.; Silva, C.A.; et al. Single-Pass UAV-Borne GatorEye LiDAR Sampling as a Rapid Assessment Method for Surveying Forest Structure. Remote Sens. 2020, 12, 4111. [Google Scholar] [CrossRef]
- Viedma, O.; De Almeida, D.R.A.; Moreno, J.M. Postfire Tree Structure from High-Resolution LiDAR and RBR Sentinel 2A Fire Severity Metrics in a Pinus halepensis-Dominated Burned Stand. Remote Sens. 2020, 12, 3554. [Google Scholar] [CrossRef]
- Xu, J.-X.; Ma, J.; Tang, Y.-N.; Wu, W.-X.; Shao, J.-H.; Wu, W.-B.; Wei, S.-Y.; Liu, Y.; Wang, Y.-C.; Guo, H.-Q. Estimation of Sugarcane Yield Using a Machine Learning Approach Based on UAV-LiDAR Data. Remote Sens. 2020, 12, 2823. [Google Scholar] [CrossRef]
- Wang, G.; Li, P.; Li, Z.; Ding, D.; Qiao, L.; Xu, J.; Li, G.; Wang, H. Coastal Dam Inundation Assessment for the Yellow River Delta: Measurements, Analysis and Scenario. Remote Sens. 2020, 12, 3658. [Google Scholar] [CrossRef]
- Nakano, K.S.H.; Omori, K.; Hayakawa, K.; Kurodai, M. On a fundamental evaluation of a UAV equipped with a multichannel laser scanner. In Proceedings of the International Archives of the Photogrammetry, Remote Sensing and Spatial Information Sciences. ISPRS TC II Mid-term Symposium “Towards Photogrammetry 2020”, Riva del Garda, Italy, 4–7 June 2020; pp. 753–758. [Google Scholar]
- Phoenix LiDAR Systems. SCOUT-16. Available online: https://www.phoenixlidar.com/wp-content/uploads/2020/06/PLS-SCOUT-16-Spec-Sheet_2020.pdf (accessed on 15 July 2020).
- Axelsson, P.E. DEM generation from laser scanner data using adaptive TIN models. Int. Arch. Photogramm. Remote Sens. 2000, 33, 110–117. [Google Scholar]
- Wehr, A.; Lohr, U. Airborne laser scanning—An introduction and overview. ISPRS J. Photogramm. Remote Sens. 1999, 54, 68–82. [Google Scholar] [CrossRef]
- Mayer, C.; Pereira, L.G.; Kersten, T.P. A Comprehensive Workflow to Process UAV Images for the Efficient Production of Accurate Geo-information. In Proceedings of the IX National Conference on Cartography and Geodesy, Lisbon, Portugal, 25–26 October 2018; pp. 11–13. [Google Scholar]
- Salach, A.; Bakuła, K.; Pilarska, M.; Ostrowski, W.; Górski, K.; Kurczyński, Z. Accuracy Assessment of Point Clouds from LiDAR and Dense Image Matching Acquired Using the UAV Platform for DTM Creation. ISPRS Int. J. Geo-Inf. 2018, 7, 342. [Google Scholar] [CrossRef]
- Fuad, N.A.; Ismail, Z.; Majid, Z.; Darwin, N.; Ariff, M.F.M.; Idris, K.M.; Yusoff, A.R. Accuracy evaluation of digital terrain model based on different flying altitudes and conditional of terrain using UAV LiDAR technology. In Proceedings of the IOP Conference Series: Earth and Environmental Science, Paris, France, 7–9 February 2018; Volume 169, p. 012100. [Google Scholar]
- Gonçalves, G.; Pereira, L.G. A Thorough Accuracy Estimation of DTM Produced From Airborne Full-Waveform Laser Scanning Data of Unmanaged Eucalypt Plantations. IEEE Trans. Geosci. Remote Sens. 2012, 50, 3256–3266. [Google Scholar] [CrossRef]
Publisher’s Note: MDPI stays neutral with regard to jurisdictional claims in published maps and institutional affiliations. |
© 2021 by the authors. Licensee MDPI, Basel, Switzerland. This article is an open access article distributed under the terms and conditions of the Creative Commons Attribution (CC BY) license (http://creativecommons.org/licenses/by/4.0/).

