Article

Climatology of Cloud Phase, Cloud Radiative Effects and Precipitation Properties over the Tibetan Plateau

1
Key Laboratory for Semi-Arid Climate Change of the Ministry of Education, College of Atmospheric Sciences, Lanzhou University, Lanzhou 730000, China
2
Department of Atmospheric and Oceanic Sciences & Institute of Atmospheric Sciences, Fudan University, Shanghai 200000, China
3
State Key Laboratory of Remote Sensing Science, Institute of Remote Sensing and Digital Earth, Chinese Academy of Sciences, Beijing 100000, China
4
Inner Mongolia Institute of Meteorological Sciences, Inner Mongolia Provincial Meteorological Bureau, Hohhot 010000, China
*
Author to whom correspondence should be addressed.
Remote Sens. 2021, 13(3), 363; https://doi.org/10.3390/rs13030363
Submission received: 3 December 2020 / Revised: 11 January 2021 / Accepted: 18 January 2021 / Published: 21 January 2021
(This article belongs to the Special Issue Active and Passive Remote Sensing of Aerosols and Clouds)

Abstract

:
Current passive sensors fail to accurately identify cloud phase, thus largely limiting the quantification of radiative contributions and precipitation of different cloud phases over the Tibet Plateau (TP), especially for the mixed-phase and supercooled water clouds. By combining the 4 years of (January 2007–December 2010) cloud phase (2B-CLDCLASS-LIDAR), radiative fluxes (2B-FLXHR-LIDAR), and precipitation (2C-PRECIP-COLUMN) products from CloudSat, this study systematically quantifies the radiative contribution of cloud phases and precipitation over the TP. Statistical results indicate that the ice cloud frequently occurs during the cold season, while mixed-phase cloud fraction is more frequent during the warm season. In addition, liquid clouds exhibit a weak seasonal variation, and the relative cloud fraction is very low, but supercooled water cloud has a larger cloud distribution (the value reaches about 0.24) than those of warm water clouds in the eastern part of the TP during the warm season. Within the atmosphere, the ice cloud has the largest radiative contribution during the cold season, the mixed-phase cloud is the second most important cloud phase for the cloud radiative contribution during the warm season, and supercooled water clouds’ contribution is particularly important during the cold season. In particular, the precipitation frequency over the TP is mainly dominated by the ice and mixed-phase clouds and is larger over the southeastern part of the TP during the warm season.

Graphical Abstract

1. Introduction

Cloud cover plays an important role in climatic systems, having a significant effect on the radiation budget and corresponding water cycles [1,2,3,4]. It is therefore crucial to understand the main characteristics and physical processes of clouds, such as various macro-physical effects (e.g., cloud fraction (CF), cloud thickness) and microphysical properties (e.g., cloud droplet number concentration, particle size, phase), as well as the complicated dynamical [5,6] and microphysical processes [7]. However, due to an incomplete understanding of physical processes, processes related to clouds have been poorly represented in climate and weather models [8]; this lack of research has been identified as the greatest source of uncertainty in climate predictions driven by climate models [9,10].
Previous investigations on cloud properties have focused on the cloud phase, a key cloud parameter. The cloud radiative effect and precipitation properties have resulted in findings which vary due to cloud phase changes [11,12,13,14,15]. Clouds are composed entirely of ice when temperatures are below −40 °C, or liquid particles when temperatures are above 0 °C (freezing temperature) [16,17]. In addition, the cloud may be composed of a combination of pure ice, liquid particles, or both (that is, mixed-phase) under this temperature range (−40–0 °C) [7,18,19,20,21,22,23,24]. In particular, the liquid water cloud is considered a supercooled water cloud under a temperature lower than 0 °C [25]. As there are differences between liquid and ice particles in refractive indices, sizes, concentration, and shapes [26,27], clouds have a distinct radiative effect depending on their phases [28,29,30]. For example, a low-level water cloud (e.g., stratocumulus) can exert a strong negative net radiative effect at the surface [31,32]. In contrast, the thin cirrus causes a positive radiative effect of about 2 W/m2 at the surface and atmosphere, especially in the central Pacific Tropics [33,34,35]. For the mixed-phase cloud, cloud radiative effect (CRE) is closely associated with ice-liquid partitioning [36]. In addition, observation-based studies have concluded that precipitation driven by warm water clouds is mainly distributed over tropical oceans [14]. It is therefore crucial for climate models to reasonably represent cloud phase partitioning to reduce uncertainty in climate predictions caused by the cloud phase. Furthermore, it is necessary for climate models to accurately evaluate contributions of different cloud thermodynamic phases to the radiation budget and precipitation processes. However, current climate models lack a level of detail in the simulations of mixed-phase and supercooled water clouds [37,38]. Consequently, their impacts on the climate system have not been well quantified at global or regional scales [22]. In particular, most climate models oversimplify cloud phase partitioning as a function of temperature, resulting in substantial biases in CRE models [19,39].
In this study, we focus on the Tibet Plateau (TP), also known as the “Asian water tower”, an area that has experienced significant climate change over the past decades [40,41]. Across this region, significant climate warming has already been observed with glacier melting, the expansion of glacier-fed lake areas, and permafrost degradation [42,43]. Previous studies have indicated that the obvious climate change over the TP region is related to not only an increase in human activities and greenhouse gas emissions, but also to cloud radiation feedback [44,45,46]. For example, based on 6-hourly weather observations of 71 stations over the TP during 1961–2003, Duan and Wu [47] found that climate warming over the TP is possibly affected by changes in total cloud cover. Liu et al. [45] also concluded that the interaction between clouds and radiation is a primary factor in the warming of the TP. Yan et al. [48] also identified an evident seasonal variation in the cloud distribution over the TP, recording a bimodal structure from June to August, mainly due to the strong development of deep convection during the summer. The cloud-top height of deep convective clouds over the TP exhibited daily changes, leading to periodic changes in precipitation over the TP [49]. In addition, previous studies have pointed out that changes in the concentration of atmospheric aerosols and ozone may affect regional cloud and precipitation properties [50,51]. Based on model simulation, MacIntosh et al. [51] showed that changes in tropospheric and stratospheric ozone can influence the cloud cover and precipitation responses via altering the radiative forcing at the top of the atmosphere. Recent field campaigns have also been devoted to studying the cloud–aerosol–radiation interactions [52,53]. For example, the observations of aerosols above clouds and their interactions (ORACLES) project is focus on the biomass burning aerosol impact on the subtropical stratocumulus of the Southeast Atlantic Ocean [52]. Additionally, the Antarctic Circumnavigation Expedition: Pre-industrial aerosol climate effect (ACE-SPACE) project combined in situ measurements, satellite observation and models to investigate the aerosol–cloud–radiation interactions over the Southern Ocean [53]. Given a limited observation, however, few studies have focused on the cloud phase and its role in regulating the cloud radiative effect and precipitation feature over the TP region, and should be further addressed to accurately predict the future changes of TP climate.
To overcome the limitations of passive sensors in identifying cloud phase, this study uses the unique advantage of space-based lidar and radar: cloud-aerosol lidar with orthogonal polarization (CALIOP) and cloud profiling radar (CPR) [54], to evaluate the impacts of the cloud phase over the TP. In particular, we investigated how radiative contributions and precipitation frequency vary with cloud phase over the TP by combining the cloud phase (2B-CLDCLASS-LIDAR and ECMWF-AUX), radiative fluxes (2B-FLXHR-LIDAR), and precipitation (2C-PRECIP-COLUMN) products from CALIPSO and CloudSat. This paper is organized as follows: In Section 2, all the datasets, methods, and definitions of the cloud phase and CRE are briefly described. Section 3.1 provides distributions of the cloud fraction, CRE, cloud optical depth of different cloud phases over the TP. Section 3.2 describes their radiative contributions over the TP. Section 3.3 further discusses the corresponding net heating rate profiles, and Section 3.4 precipitation frequency over the TP. Lastly, the discussion and conclusions are given in Section 4 and Section 5, respectively.

2. Materials and Methods

2.1. CALIOP Instrumentation Aboard CALIPSO

Space-borne lidar CALIOP incorporated on CALIPSO operates at two wavelengths (532 nm and 1064 nm) is sensitive to optically thin hydrometeor layers and aerosol layers [55,56,57]. As combining radar and lidar measurements may improve cloud parameter simulations (e.g., CF) in atmospheric models, it is conducive to reducing the uncertainties in weather forecasts and climate predictions [58,59].

2.2. The CPR Instrument Aboard CloudSat

As CloudSat CPR operated at 94 GHz, can penetrate the optically thick cloud layer, it is capable of observing vertical structures and measuring the vertical distribution of liquid water and ice water content within clouds [60,61]. It is worth noting that CloudSat’s CPR cannot always profile optically thick clouds due to attenuation effects [62,63,64]. In addition, CloudSat products have a blind zone over the lowest atmospheric altitudes (c.750 m), leading to unexpected uncertainty in low-level clouds [65]. Further information relating satellites investigated in this study is presented in Table 1.

2.3. Satellite Products and Reanalysis Dataset

The 2B-CLDCLASS-LIDAR cloud classification product that utilizes the combination of lidar backscatter and radar reflectivity has the capability of classifying the types and phases of clouds (e.g., ice, liquid, and mixed-phase). The flag in the ‘‘CloudPhase’’ parameter of this product provides the information related to the cloud phases, i.e., “1” represents an ice cloud, “2” represents a mixed-phase cloud, and “3” represents a water cloud. In particular, this study further collocated the temperature profiles from the ECMWF-AUX product [66], which is an intermediate dataset that consists of the ancillary ECMWF state variables interpolated across each CloudSat CPR bin, to group the liquid phase clouds into warm water clouds and supercooled-water clouds based on whether cloud top temperatures are higher or lower than the threshold temperature (0 °C) [25]. Note that the super-cooled water cloud in the mixed-phase is not considered. Based on the cloud phase products, Matus and L’Ecuyer [30] quantified the cloud radiative effects for the ice, water, and mixed-phase clouds at a global scale. In addition to this product, the 2B-FLXHR-LIDAR product is also used in our study. By employing a broadband, two-stream, plane-parallel doubling-adding radiative transfer model [67], this product uses cloud and aerosol properties retrieved from CloudSat and CALIPSO as inputs to provide us with calculated radiative fluxes at the surface (SFC), top of the atmosphere (TOA), cloud optical depth, and atmospheric heating rate profiles [68]. Combining the CRE parameters (TOACRE and BOACRE in this product) and cloud phase information obtained from 2B-CLDCLASS-LIDAR, this study quantified the radiative contributions of different cloud phases to the total cloud radiative effect. There have been related studies on the uncertainty of cloud radiative effect and cloud heating rate, and by using collocated SW and LW flux observations from the Clouds and the Earth’s Radiant Energy System (CERES), the 2B-FLXHR-LIDAR product is evaluated. Henderson et al. [69] pointed out that the global mean outgoing longwave radiation and outgoing shortwave radiation estimated from the collocated CERES observations and 2B-FLXHR-LIDAR calculations agree within 5 and 4 Wm−2, respectively, and root-mean-square differences are 16 and 6 Wm−2 on monthly/5° scales. The cloud radiative effect is usually defined as the radiative flux differences between clear-sky and all of the possible sky conditions at a given location (e.g., TOA) [30]. Here, it is noteworthy that the radiative contribution of each cloud phase is calculated only for single-layer clouds. Given two or more cloud layers existing simultaneously in the same location but at different atmospheric layers, it needs to be considered as a multilayered cloud (MLC) system [70,71]. Thus, this study accounted for the radiative contributions for five different cloud types: Single-layer ice clouds, single-layer warm water clouds, single-layer supercooled water clouds, single-layer mixed-phase clouds, and multilayered clouds. In addition to these products, we also use the precipitation parameter “Precip_flag” in the 2C-PRECIP-COLUMN dataset [72], to further quantify the precipitation frequency for different cloud phases over the TP. Particularly, flags 1 (rain possible), 2 (rain probable), and 3 (rain certain) in Precip_flag were considered to determine precipitation frequency in this study [73,74,75,76]. Other information is shown in Table 2.

2.4. Methodology

Here, the new version of 4 years (January 2007–December 2010) of joint products (e.g., 2C-PRECIP-COLUMN, 2B-CLDCLASS-LIDAR, and 2B-FLXHR-LIDAR) of CloudSat and CALIPSO are collected to perform our analysis. The vertical and horizontal resolutions of these products are 240 m and 1.1 km, respectively. In addition, the differences in cloud properties between warm (May to September) and cold (November to March) seasons were investigated in this study. Seasons were classified based on the work of Huang et al. [77], indicating that semi-arid areas have a rapid temperature increase during the cold season. As the TP is characterized by arid and semi-arid areas, rapid temperature increases are closely related to cold and warm seasons.
The relative cloud fraction (RCF) of different cloud phases can be obtained as:
R C F = N c p N
where, RCF shows the relative cloud fraction of different cloud phases, and N is number of cloudy profiles. Ncp are the number of cloud phase profiles. In particular, the RCF of a multilayered cloud is the ratio of the number of multilayered cloud profiles to the number of cloudy profiles.
In this study, the averaged cloud radiative effect (CRE) in a given grid box or region was calculated as:
C R E = 1 N ( i = 1 N C R E i )
where C R E i is the cloud radiative effect for the ith sample profile, and N is the number of sample profiles.
Cloud fractions under single-layer ( C F s ) or multi-layer ( C F m ) conditions can be obtained as:
C F s = N s ( N + M )
C F m = N m ( N + M )
where, N and M are numbers of cloudy-sky and clear-sky profiles, respectively. Ns and Nm are the cloud phase samples of single-layer cloud and multi-layer cloud profiles, respectively. These two formulas are applicable to four different cloud phases (e.g., ice cloud). In particular, the cloud fraction of multilayered clouds is the ratio of the number of multilayered cloud profiles to the number of all-sky profiles.
Then, the radiative contribution ( C o n t i ) for a given cloud type i in a given grid box or region may be derived from Equation (2):
C o n t i = ( | C R E i | ( i = 1 5 | C R E i | ) ) × 100
where C R E i represents the averaged cloud radiative effect caused by a given cloud type (e.g., single-layer warm water cloud).
In addition, the CH, which is the averaged net radiative heating rate in a given region, is expressed as follows:
C H = ( ( i = 1 N H R c l o u d i ) N ( j = 1 M H R c l e a r j ) M ) × C F
Here, H R c l o u d i and H R c l e a r j are the ith and jth net radiative heating rate profiles for cloudy-sky and clear-sky conditions, respectively. N and M are numbers of cloudy-sky and clear-sky profiles, respectively. C F = N ( N + M ) represents the total cloud fraction in a given region. Thus, CH shows the weighted cloud net radiative heating rate profile.

3. Results

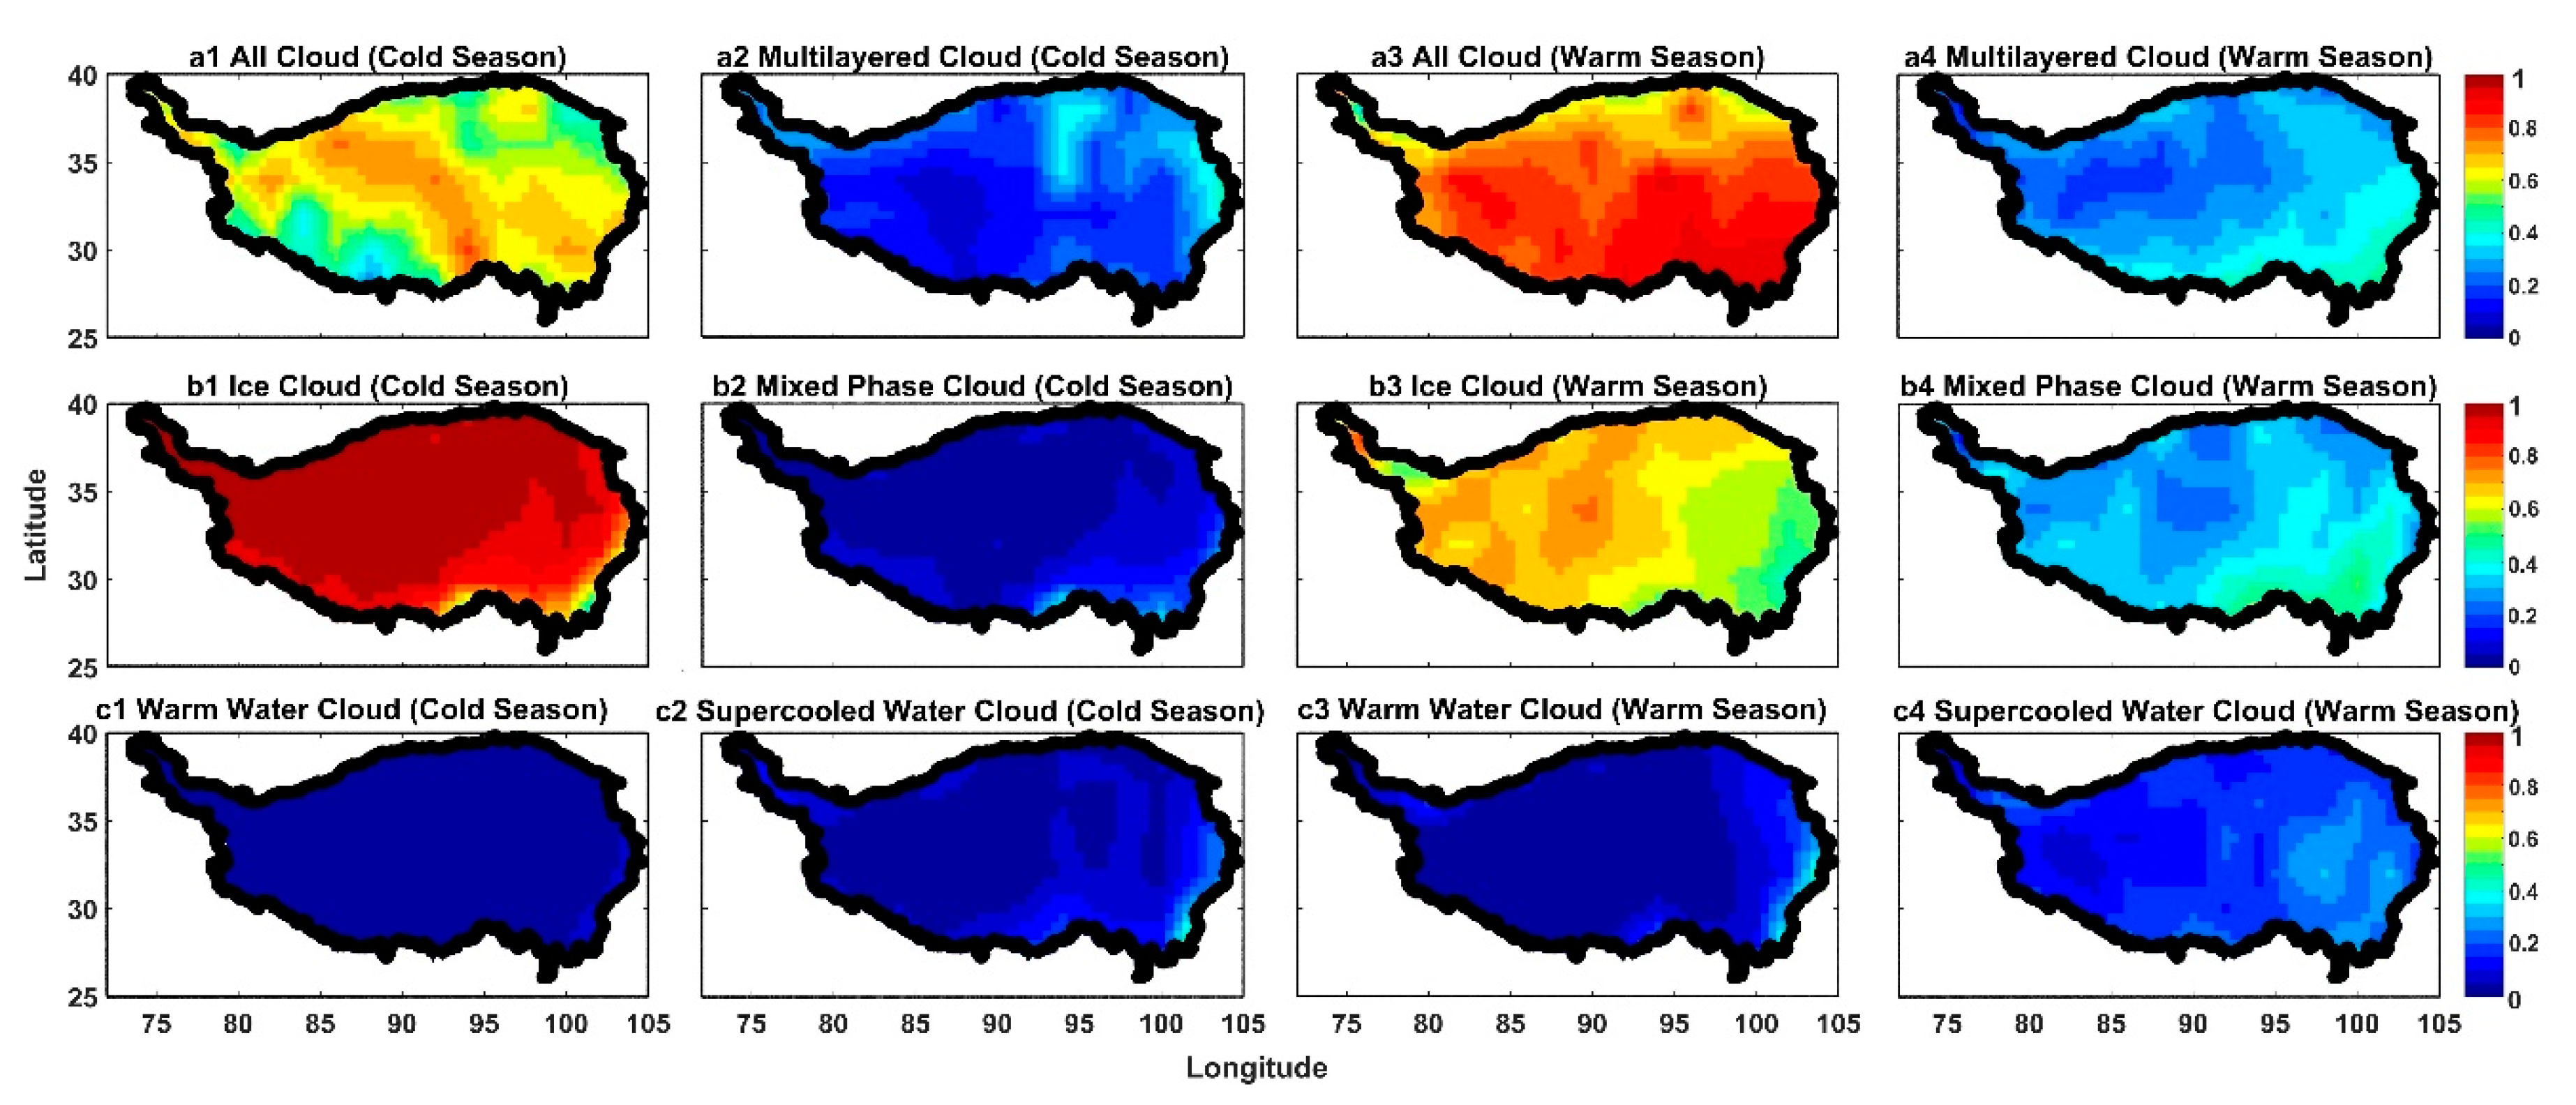
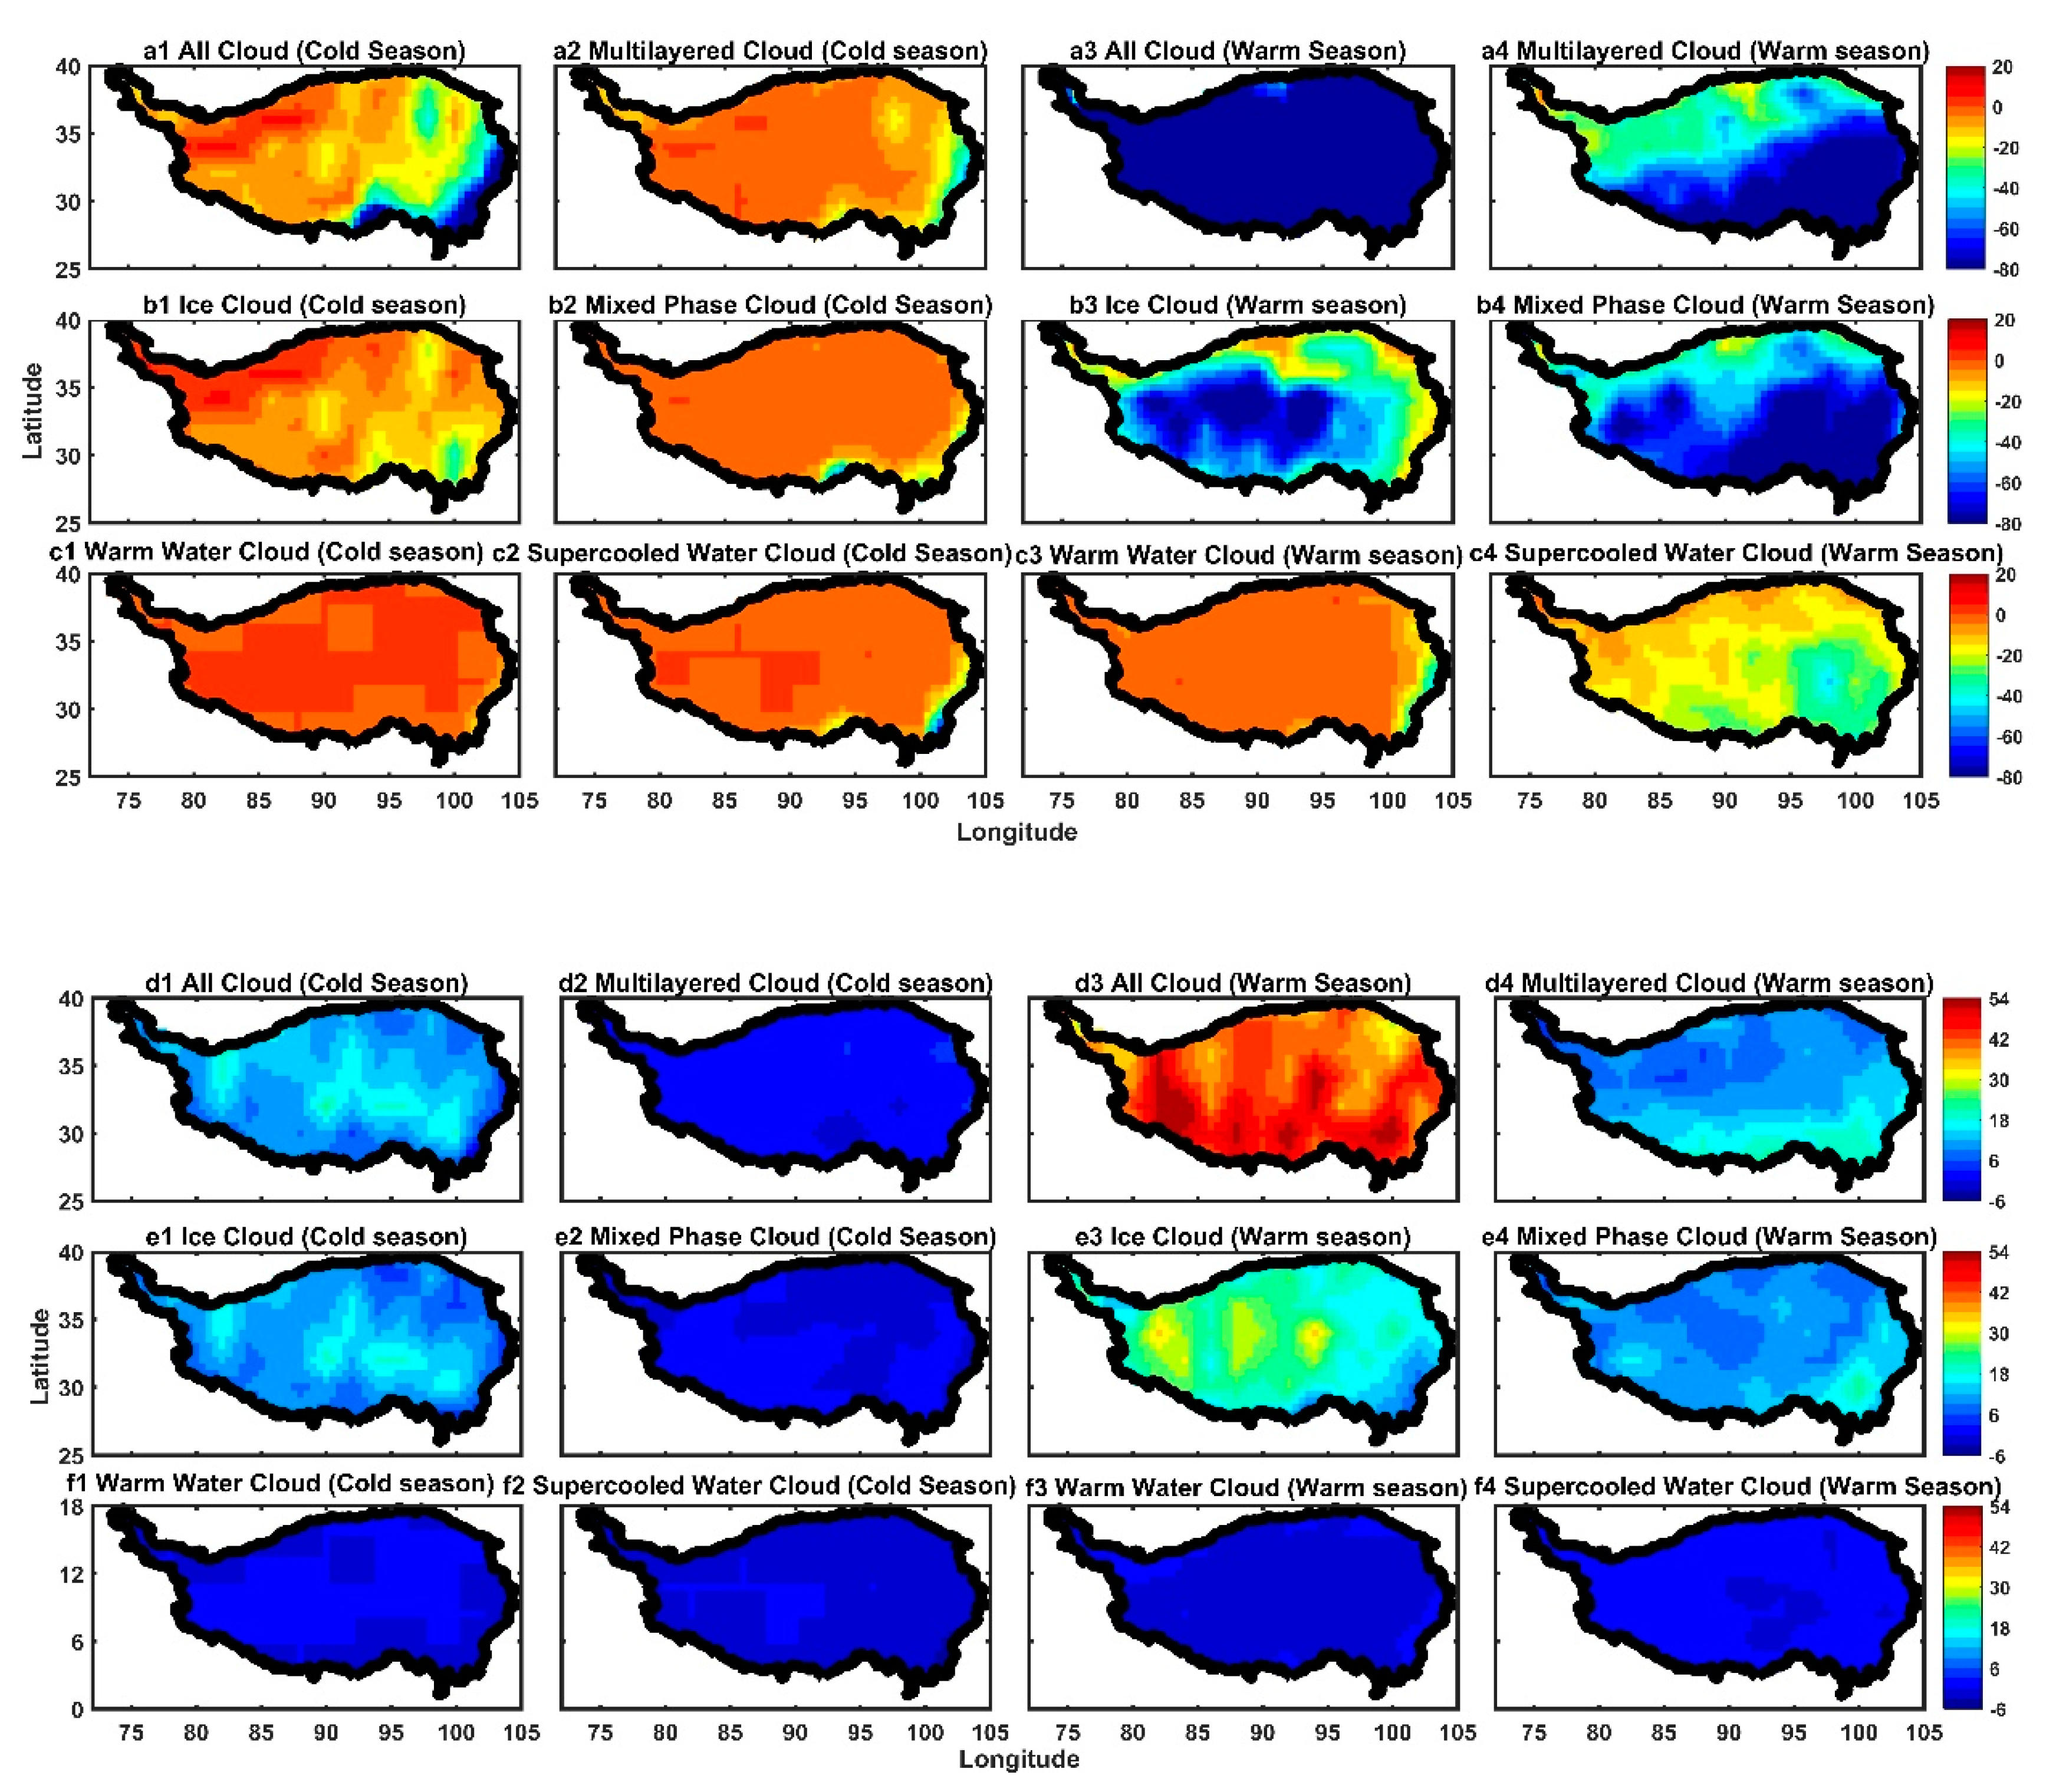
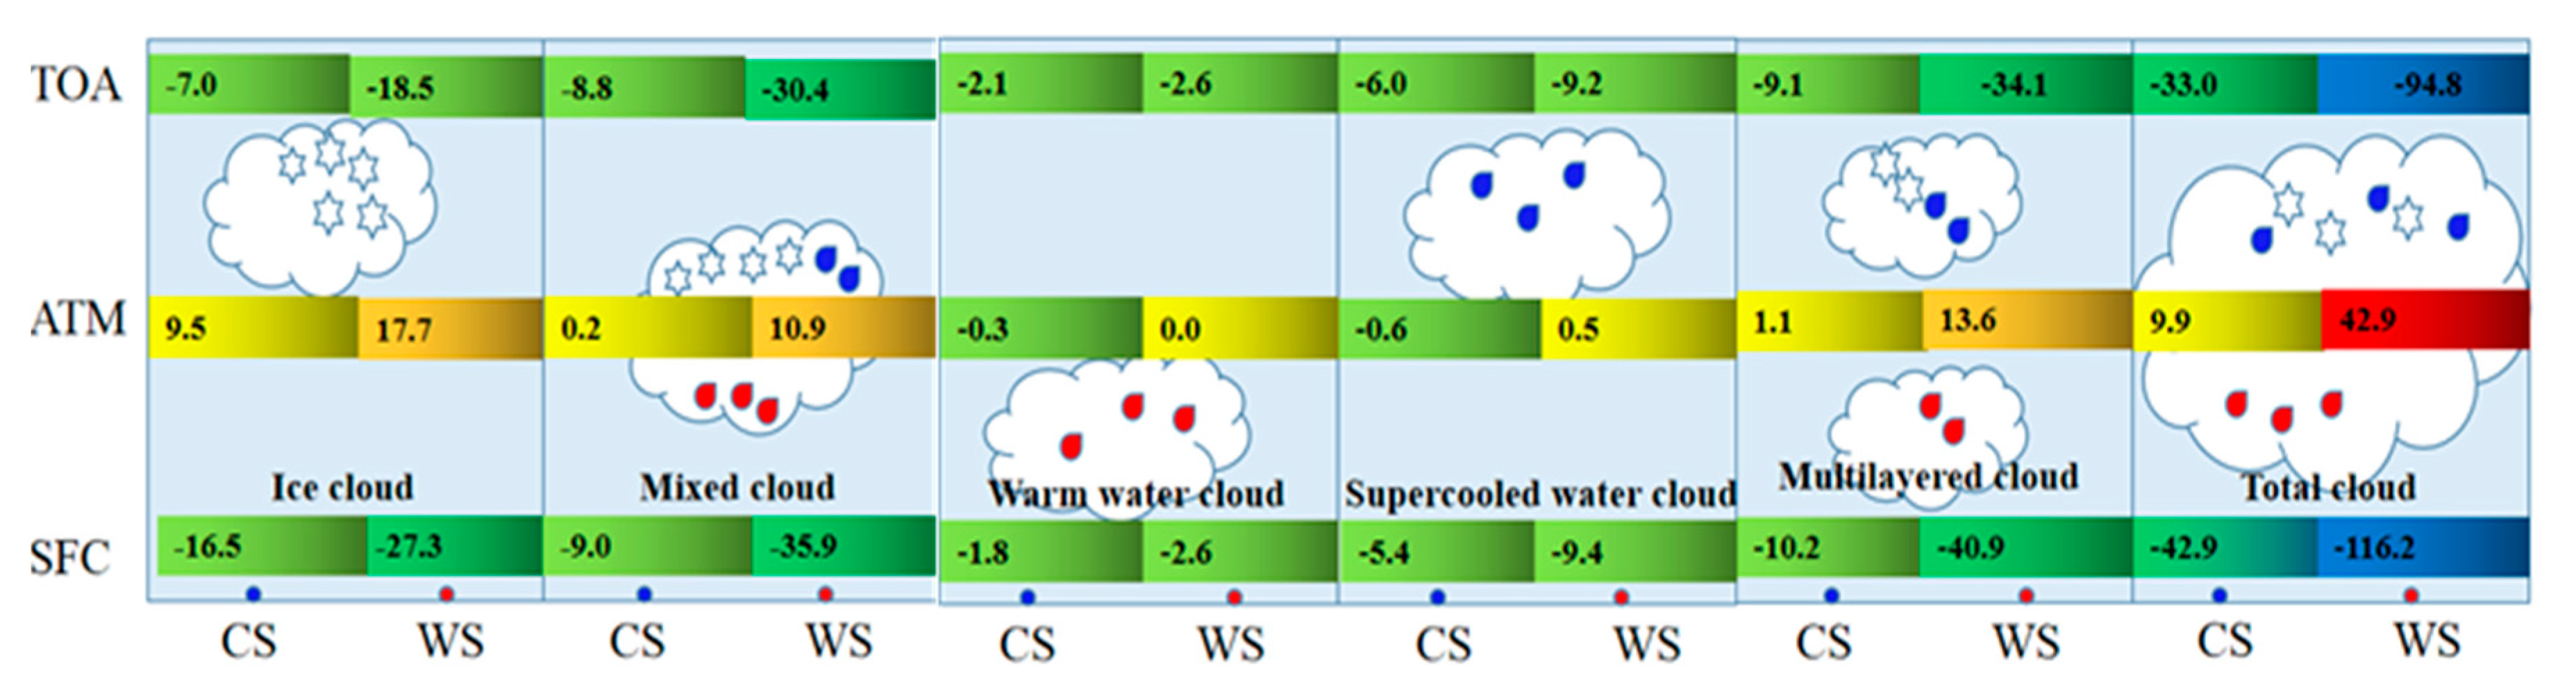
3.1. The CF and CRE of Different Cloud Phase over the TP

Total cloud fraction and RCF for ice clouds, mixed-phase clouds, warm water clouds, supercooled water clouds, and multilayered clouds during the cold and warm seasons over the TP are shown in Figure 1a–c. The total cloud fraction at a given grid-box is defined as the ratio of the number of cloudy profiles to the number of all sample profiles, while the RCF for each cloud phase is calculated based on the Equation (1). Our results indicated that total clouds occurred more frequently during the warm season than during the cold season, especially in the southeastern part of the TP (Figure 1(a1–a3)). A low value (approximately 36%) of total cloud fraction over the southwestern part of the TP appeared during the cold season (see Figure 1(a1)) [78]. Ice clouds (Figure 1(b1,b3)) were recorded to have a high RCF value (even >84%) during the cold season, being recorded over most regions of the TP; these clouds had considerable seasonal variability, except for the southeastern area of the TP. Compared with ice clouds, a relatively small value (<20%) and weak seasonal variation of the RCF of warm water clouds were found over the TP (Figure 1(c1,c3)).
Identifying supercooled water clouds or mixed-phase clouds from passive satellite sensors (e.g., MODIS) is challenging when multilayered clouds exist within the satellite observation field of view [79,80]. As CloudSat and CALIPSO have a vertically resolved ability, results indicated a weak seasonal variability in RCF of supercooled water clouds; RCF was still larger than those of warm water clouds, especially in the southeastern area of the TP during the warm season (Figure 1(c2,c4)). Due to weak satellite observation constraints, mixed-phase clouds (a significant atmospheric component) are poorly simulated in climate models [81]. With advanced observational active sensors, our results indicate that mixed-phase clouds are widely distributed during the warm season compared with those during the cold season (Figure 1(b2,b4)). In particular, mixed-phase clouds were mainly formulated at the southeastern area of the TP during the warm season when the RCF was approximately 50%. During the cold season, however, mixed-phase clouds recorded a relatively small RCF over the TP. Findings from our investigation also indicated that a large RCF for multilayered clouds during the warm season was distributed in the southeastern area of the TP, possibly being controlled by a strong ascending motion [71,82]. The sample of the cloud fraction of cloud phases is shown in Figure S1.
Furthermore, seasonal net cloud radiative effects (Figure 2(a1–f4)) corresponding to all clouds, each cloud phase, and multilayered clouds at the TOA (Figure 2(a1–c4)) and in the ATM (Figure 2(d1–f4)) over the TP were recorded. The cloud phases only refer to single-layer clouds, such as single-layer ice, warm water, mixed-phase, or supercooled water clouds. As the CRE at the SFC has a similar distribution with those at the TOA, it is not included in this study (see Figure S2). In addition, the CRE in the ATM is defined as the CRE difference between the TOA and the SFC. Total clouds at the TOA have a weak cooling effect (that is, a negative cloud radiative effect) over most regions of the TP during the cold season (from −10 Wm−2 to −30 Wm−2). Compared with the CRE during the cold season, the total cloud during the warm season exhibited a stronger cooling effect, especially over the southeastern part of the TP, where the CRE approximately reached −250 Wm−2. The CRE over the north part of the TP maintained a moderate cooling effect during the warm season, ranging from −60 Wm−2 to −170 Wm−2. Similar to the cloud fraction, the CRE of the ice cloud also showed evident seasonal variability. Ice clouds recorded a weak heating effect (around 6 Wm−2) over the northwestern part of the TP (Figure 2(b1)), and a moderate cooling effect in the southeastern part of the TP (<−30 Wm−2). However, during the warm season, a distinct cooling effect (exceed −50 Wm−2) appeared over most regions of the TP (see Figure 2(b3)). Although ice clouds tended to occur in the multilayered cloud system (MLS) [71], this study focused on the CRE of the single-layer cloud system. This finding may partly explain the reason that a stronger cooling effect of the ice cloud occurring during the warm season of the TP (Figure 2(b1,b3)) while the ice cloud occurred more frequently during the cold season, as all ice cloud samples (single-layer and multilayered ice clouds) were included in Figure 1(b1,b3). Moreover, the ice cloud optical depth, as well as the cloud fraction of single-layer ice cloud, also play a significant role [83,84]. As such, the ice cloud radiative effect depends largely on their optical and microphysical properties [84]. In Figure 2(b1), ice clouds have a weak heating effect over the northwestern part of the TP, while they have a moderate cooling effect in the southeastern part of the TP (about 0 - −30 Wm−2). Incorporating the ice cloud properties retrieved from CloudSat and CALIPSO into a radiative transfer model (termed libRadtran [83]), Hong et al. [83] also found that ice clouds have a global-averaged net warming effect (~5.1 ± 3.8 Wm−2) as their longwave warming effect (~21.8 ± 5.4 Wm−2) exceeding the shortwave cooling effect (~−16.7 ± 1.7 Wm−2). The net radiative effect of warming (or cooling) is still determined by the ice cloud optical depth (Figure 3).
In relation to mixed-phase clouds, previous studies have concluded that the CRE is highly dependent on ice-liquid partitioning [36]. However, due to technological limitations and complex physical processes, it is still difficult to accurately partition ice-liquid in the mixed-phase using passive sensors to provide reasonable outputs for global climate models [85,86]. Observation constraints from CloudSat and CALIPSO provide a unique opportunity to quantify the radiative effect of mixed-phase clouds at a global scale. For example, Matus and L’Ecuyer [30] found that mixed-phase clouds account for only one-tenth of the globally averaged total cloud fraction, but it exerts a global net CRE of −3.4 Wm−2 on annual average, and this effect is comparable with results of ice clouds or multilayered clouds. Over the TP, however, this study further indicated that the CRE of mixed-phase clouds play an important role more than those of other cloud phases during the warm season at the TOA. In addition, the CRE of the mixed-phase cloud showed apparent seasonal variability (Figure 2(b2,b4)), which may be caused by the variability in the frequency and optical depth varying with different seasons. During the warm season, the CRE of mixed-phase clouds reached up to −50 Wm−2 over most parts of the TP. During the cold season, however, the CRE of mixed-phase clouds became smaller with a range from −3 Wm−2 to 3 Wm−2. Although liquid water clouds usually widely occur in tropical/subtropical oceans and dominate total CRE in the regions [30], Figure 2(c1,c2) show that warm water clouds and supercooled water clouds over the TP had a similar CRE value and distributions during the cold season except for those at the southeastern boundary of the TP where there is a stronger cooling effect (>−13 Wm−2) by supercooled water clouds rather than warm water clouds at the TOA. Our results also recorded a difference in CRE values and distributions over the TP for warm water and supercooled water clouds during the warm season. In particular, supercooled water clouds showed a cooling effect over the southeastern part of the TP by −30 Wm−2, which is caused by a relatively larger occurrence frequency of the supercooled water cloud than those of the warm water cloud (see Figure 2(c2,c4)). To date, few studies have focused on the supercooled water clouds and their radiative effects. This study demonstrated that supercooled water clouds play a crucial role in regulating the radiative budget over the southeast part of the TP, especially during the warm season. For multilayered clouds, the seasonal variability in the CRE was similar to that in cloud fraction (Figure 2(a2,a4)).
CRE in the ATM represents the amount of radiative energy absorbed by the whole atmospheric column. From Figure 2(d1,d3), it is evident that total clouds during the warm season exerted a positive CRE that reached above 36 Wm−2 (Figure 2(d3)), indicating that the atmosphere is warming in the TP regions. On the contrary, the total clouds during the cold season showed a weak heating effect over most regions of the TP (Figure 2(d1)). In relation to different cloud phases, the single-layer ice and the mixed-phase clouds exhibited prominent heating effects during the warm season. For the liquid clouds, the cloud radiative effects in the atmosphere were relatively smaller, resulting in a weak cooling (or heating) effect in the TP. Compared with warm water clouds, the cooling effect of supercooled water clouds was stronger during the cold season, especially at the southeastern boundary of the TP (reached up to −3 Wm−2). Meanwhile, supercooled water clouds also may slightly heat the atmosphere over most of the region of the TP during the warm season. During the cold season, the CRE of multilayered clouds approximately reached −6 Wm−2, indicating a cooling effect in the atmosphere while reversely turning to a heating effect during the warm season (Figure 2(d4)).
Cloud optical depth results (Figure 3) indicated that ice clouds have a larger cloud optical depth in the southwestern area of the TP during the warm season, corresponding to a stronger cooling effect at the TOA. During the cold season, the cloud optical thickness reached approximately 4 in the southeastern area of TP, corresponding to a relatively stronger cooling effect than other regions. In particular, the sample size for calculating the cloud optical depth is the sample size of each cloud phase in a single-layer. By incorporating ice cloud properties retrieved from CloudSat and CALIPSO into a radiative transfer model (termed libRadtran [83]), Hong et al. [83] showed that radiative effects induced a transition from heating to cooling (or vice versa) at the turning point of the ice cloud optical depth threshold, indicating that ice cloud radiative effect is closely related to ice cloud optical depth. Warm water and supercooled water clouds also recorded similar results, thereby sufficiently illustrating the strong relationship between cloud optical depth and cloud radiative effects. In addition, Gordon et al. [87] showed that the cloud optical depth of the relatively cold low cloud shows a positive correlation with temperature, while the cloud optical depth of the relatively warm low cloud shows a negative correlation with temperature. The results of Figure 3 show that the optical depth of supercooled liquid water clouds during the warm season is greater than that of the cold season, while the optical depth of warm water clouds during the warm season is very small. This result is similar to the above. On the whole, the optical depth of water and ice clouds during the warm season is greater than that during the cold season [88,89].

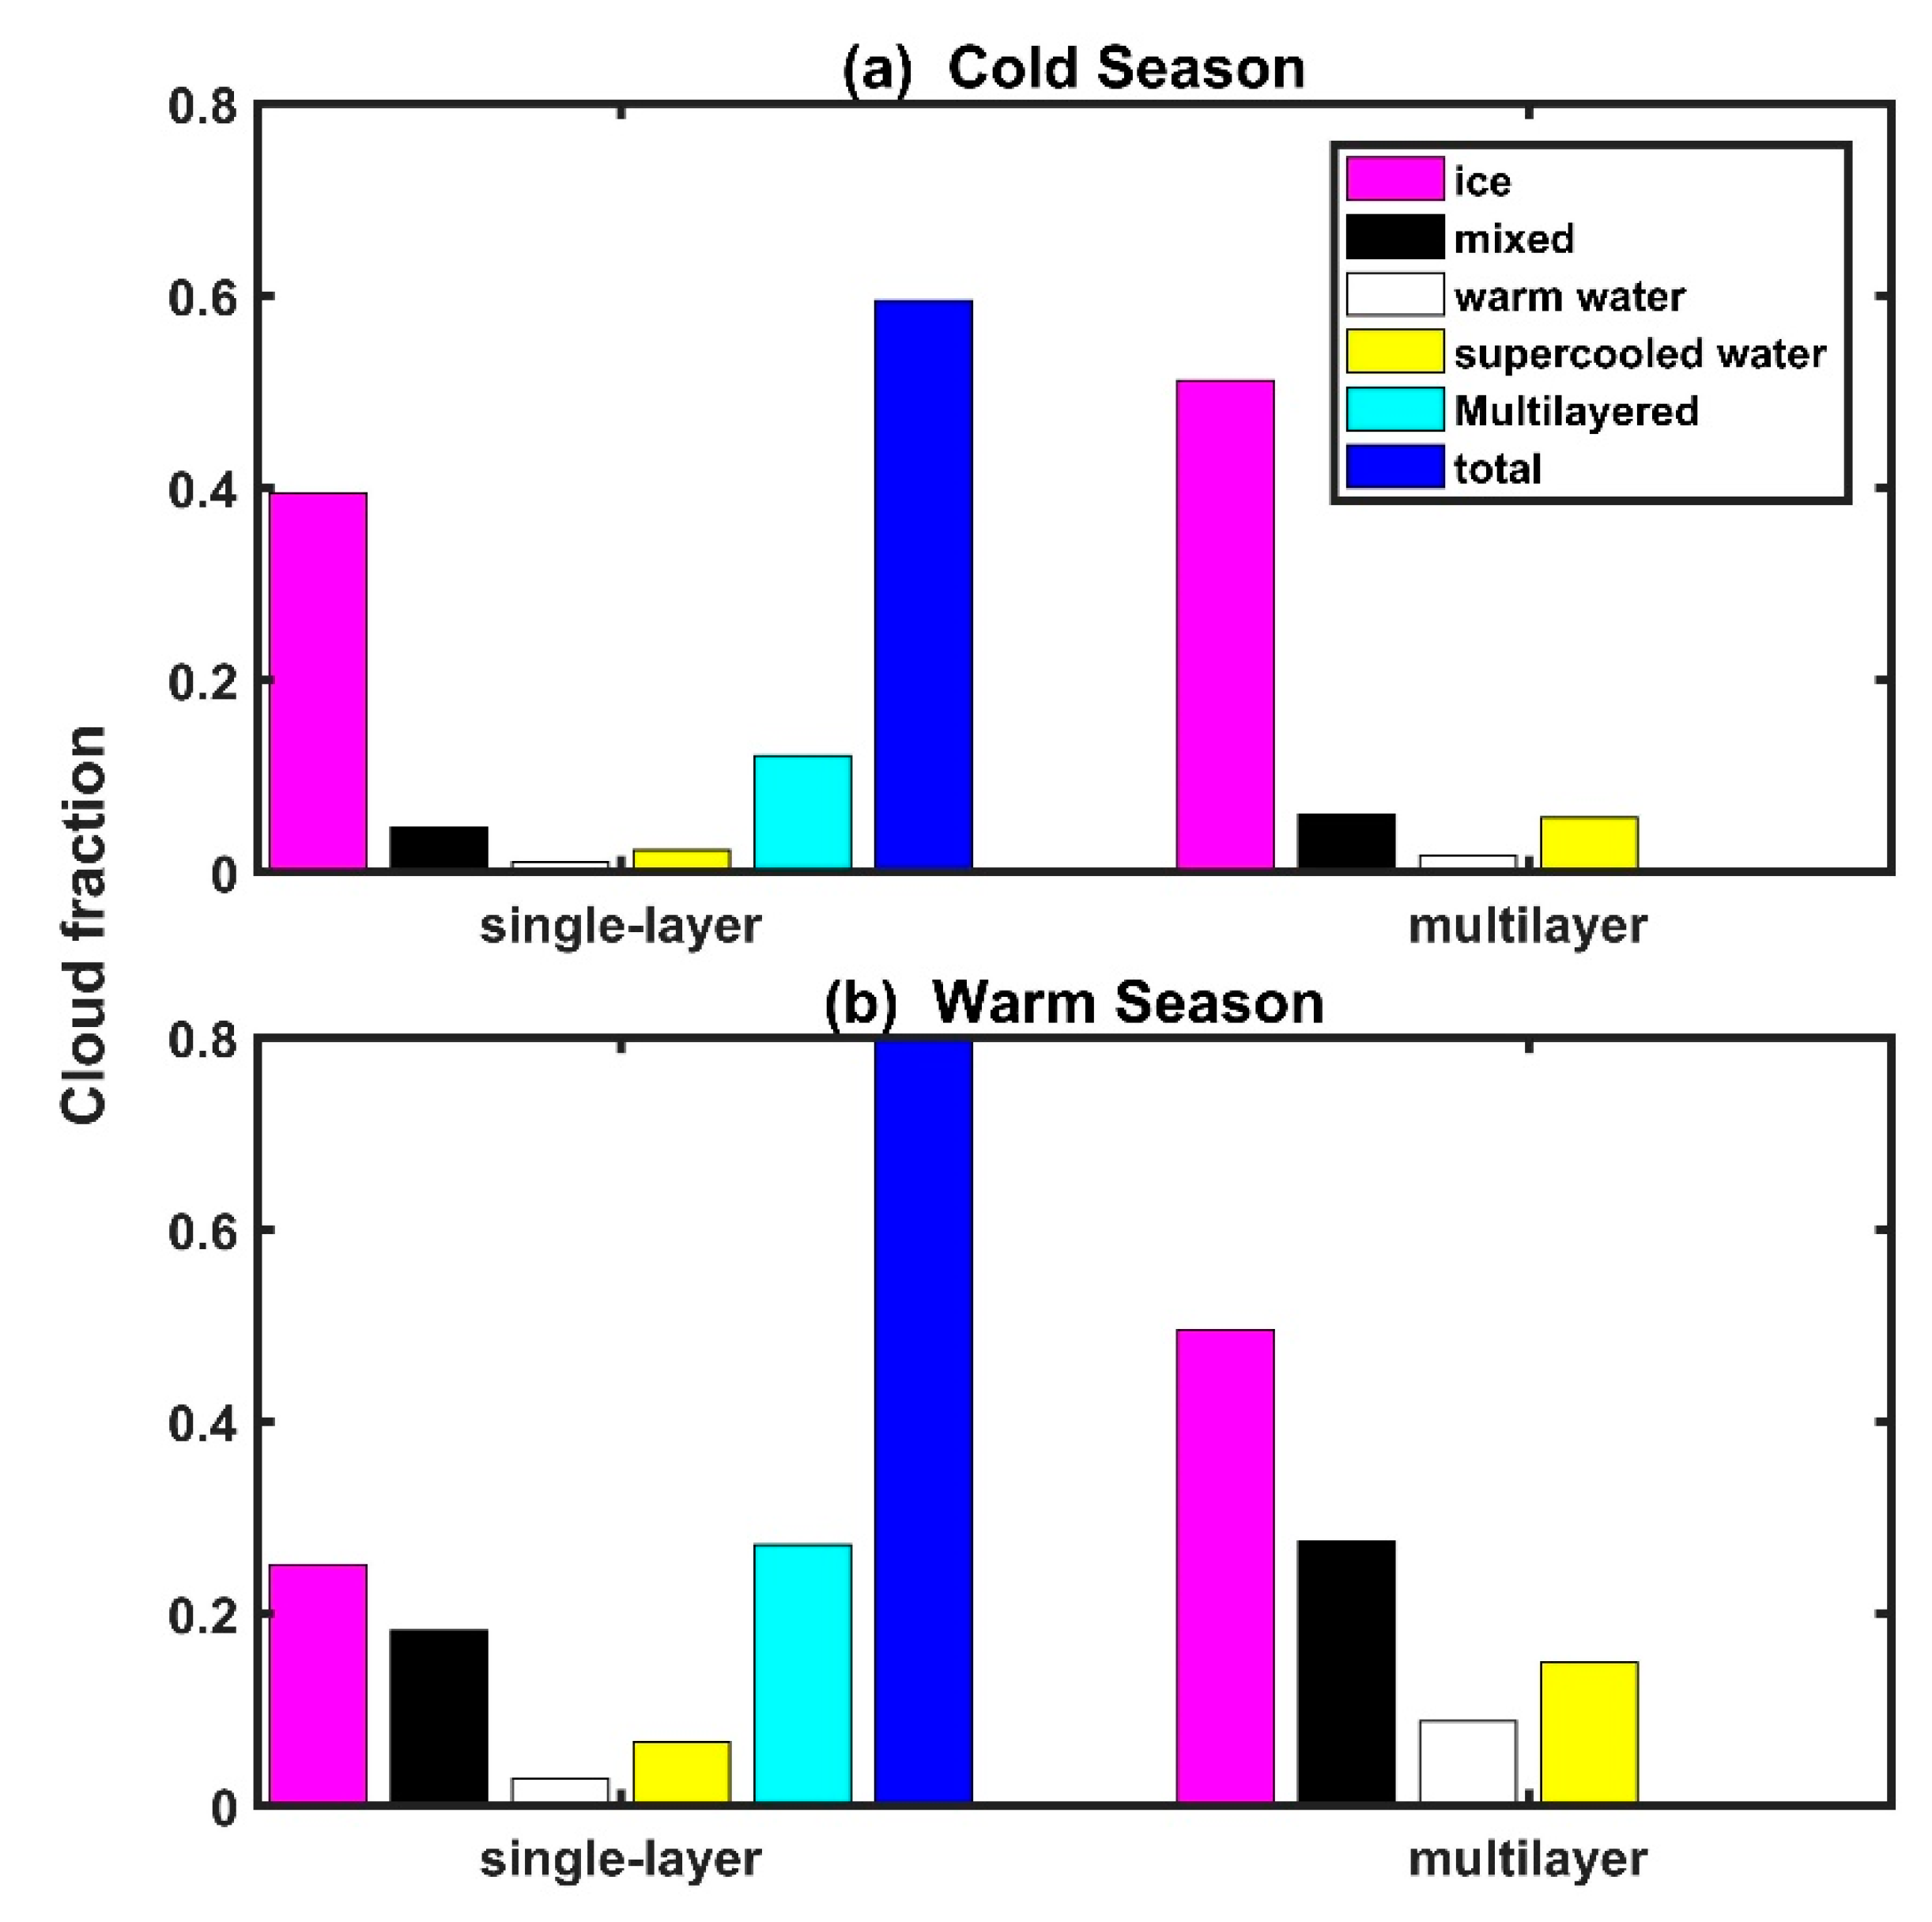
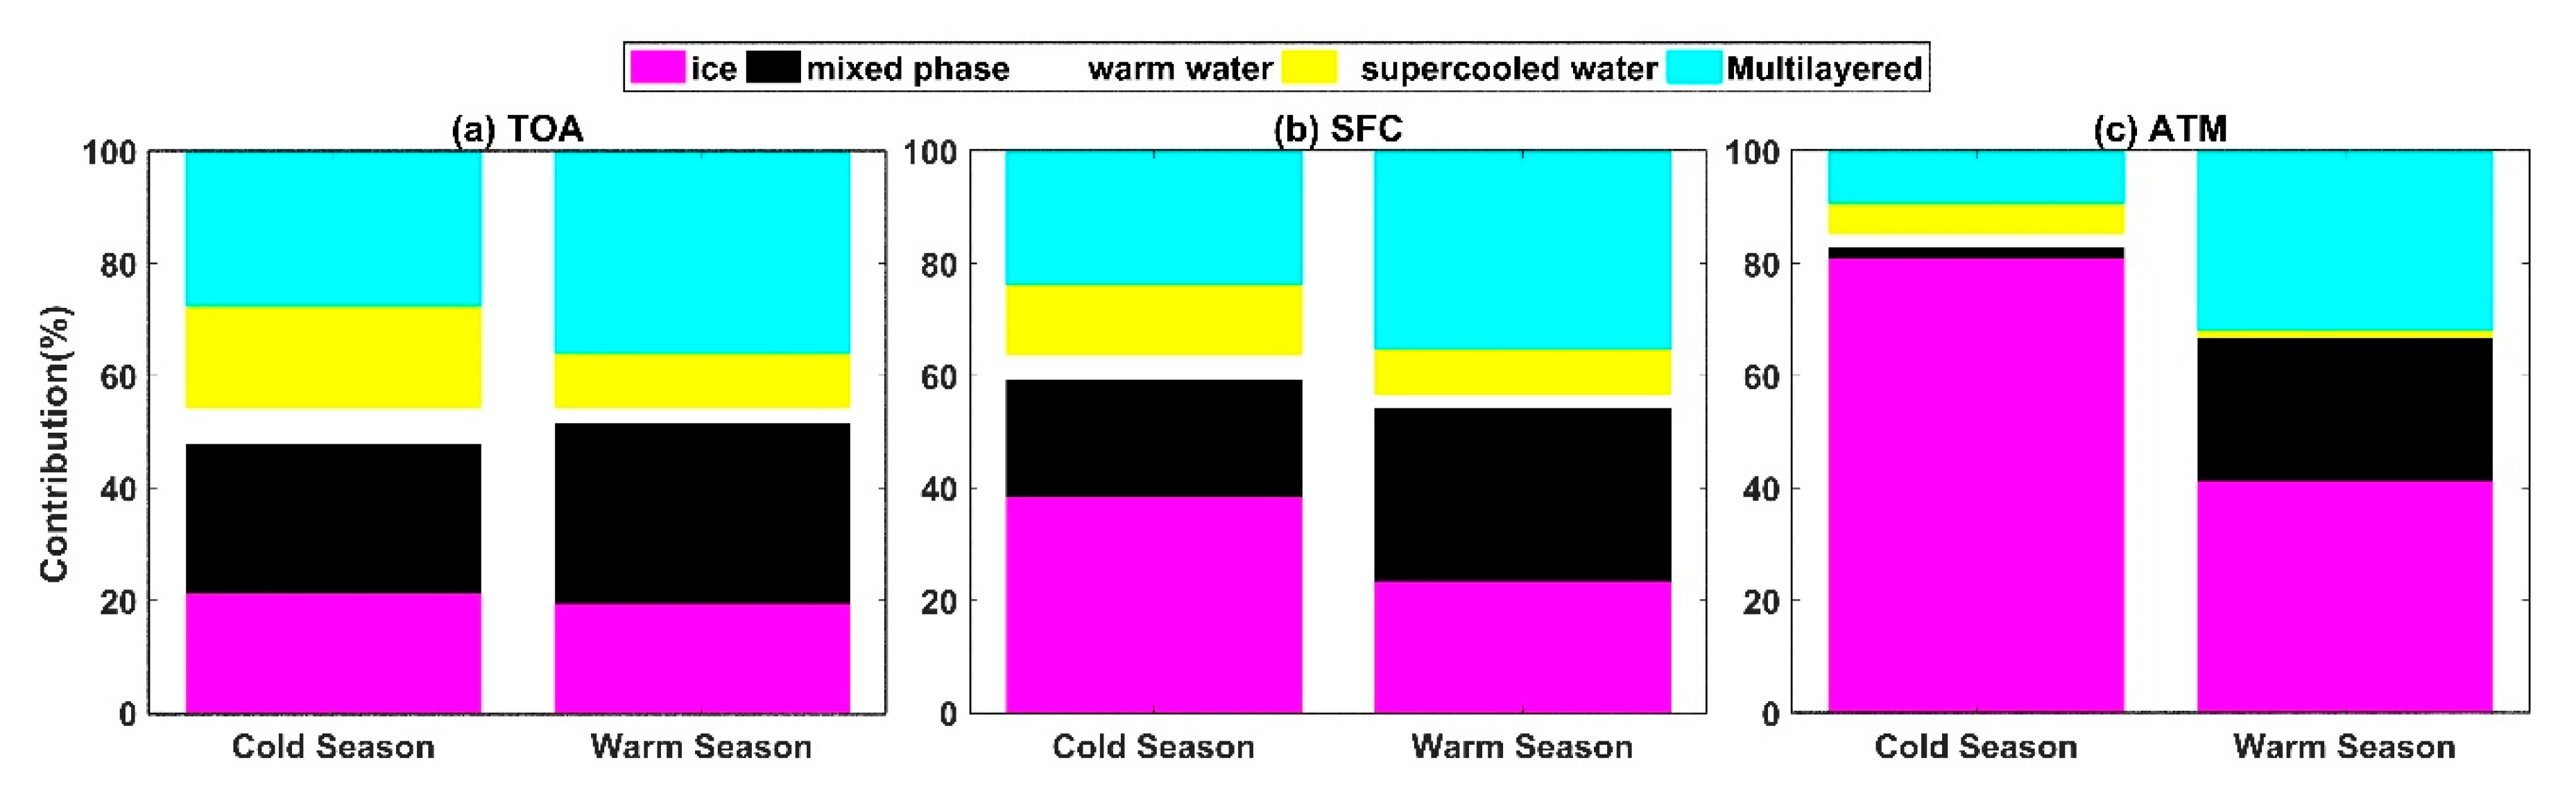
3.2. Regional Averaged Cloud Fraction and Radiative Contribution

Figure 4 shows the regionally averaged cloud fractions of the total and different cloud phases over the TP. As a comparison, the statistical results are presented during the cold and warm seasons. Here, the statistical results of the cloud fraction are represented by two different conditions (see Figure 4). In addition, cloud fractions of different cloud phases under the single-layer and multi-layer conditions in Figure 4 were based on the Equations (3) and (4), respectively. Note that in the case of a multi-layer cloud profile with multiple cloud phases, the different cloud phase profiles overlap. For example, if there are both ice clouds and mixed-phase clouds in a profile, we will add 1 to both ice cloud samples and mixed phase cloud samples. Thus, in the case of multi-layer condition, the sum of cloud fraction of different cloud phases may be larger than 1.
Our results indicate that fractions of total and multilayered clouds during the warm season were higher than those during the cold season (Figure 4). This finding is consistent with the results of Kukulies et al. [78], indicating that the occurrence frequencies of total cloud over the TP during the warm and cold seasons were nearly 80% and 60%, respectively. Among the cloud phases investigated in this study, ice cloud dominated total clouds during all seasons for both the single- and multi-layered cases. The single-layer mixed and liquid phase clouds exhibited a larger frequency occurrence during the warm season than during the cold season. In addition, a multilayered cloud system showed a tendency to frequently occur during the warm season since multilayered clouds may be induced by stronger upward air motions [82]; single-layered ice clouds frequently occur during the cold season, and they easily overlap with other cloud types during the warm season [71].
The fraction of the liquid water clouds also recoded a significant increase under multilayered cloud conditions during the warm season (Figure 4). Compared with single-layer conditions, it is also noteworthy that the proportions of liquid cloud and mixed-phase clouds are similar during all seasons under multilayered cloud conditions [78]. Furthermore, our result further demonstrates that the fraction of supercooled water clouds was higher than that of the warm water clouds over the TP.
A regional average of CRE under different cloud phases was calculated over the TOA, SFC, and ATM in the TP (Figure 5). Total clouds at both the TOA and the SFC exhibited a cooling effect, recording a trend of increase in the CRE with a change from the cold season to the warm season (refer to Figure S3 for detailed values of the CRE). The strongest cooling effect of the total cloud occurred during the warm season (WS), approximately −116.2 Wm−2 and −94.8 Wm−2 at the SFC and TOA, respectively. As shown in Figure 2, clouds during the warm season usually have a stronger impact on the radiative budget. Indeed, as highlighted in Figure 5, CRE of total clouds during the warm season was approximately triple or quadruple than that of the cold season. In addition, CRE of the multilayered cloud during the warm season was approximately quadruple that during the cold season, except for in the ATM.
Our results indicate that differences in the CRE between the cold and warm seasons in the ATM was evident. It is also found that warm water and supercooled water clouds during the cold season have a weak cooling effect in the ATM, approximately −0.3 Wm−2 and −0.6 Wm−2, respectively. However, clouds generally heat the ATM during the warm season. Results in Figure 5 indicate that the stronger cloud heating effect in the ATM during the warm season is mainly caused by the ice, mixed-phase, and multilayered clouds, whereas liquid clouds contribute less heating or cooling effects. Besides, the cloud cooling effects at the TOA and SFC for different cloud phases were higher during the warm season compared with that during the cold season.
Results for different cloud phases indicate that mixed-phase clouds have a stronger cooling effect at the TOA and SFC, with ice clouds possibly resulting in a stronger heating effect in the ATM. Although the cooling effect for the liquid clouds was relatively weak, supercooled water clouds recorded a stronger cooling effect in the TOA and SFC than that of the warm water cloud. Overall, our results indicate a considerable seasonal variability at the SFC compared with the TOA.
Results in Figure 6 further illustrate radiation contributions associated to different cloud phases to total cloud radiative effects based on Equation (2) (refer to Figure S4 for more details). At the TOA, multilayered clouds and mixed-phase clouds almost accounted for >50% of the contribution, especially during the warm season, whose contribution even exceeds 60% (68.1% max value). Compared with ice or liquid cloud phase, the mixed-phase cloud has a larger contribution during the warm season, resulting in a more crucial role in regulating the energy balance of the TP region. In addition, the radiation contribution of ice cloud was larger during the cold season than that during the warm season, especially in the ATM where its contribution peaked at 80%. Supercooled water clouds also recorded a considerable contribution at the TOA (18.2%) and SFC (12.5%) during the cold season, with the contribution even exceeds those results from the warm water clouds. This result indicates that supercooled water clouds play an important role in affecting the energy balance of the atmosphere.

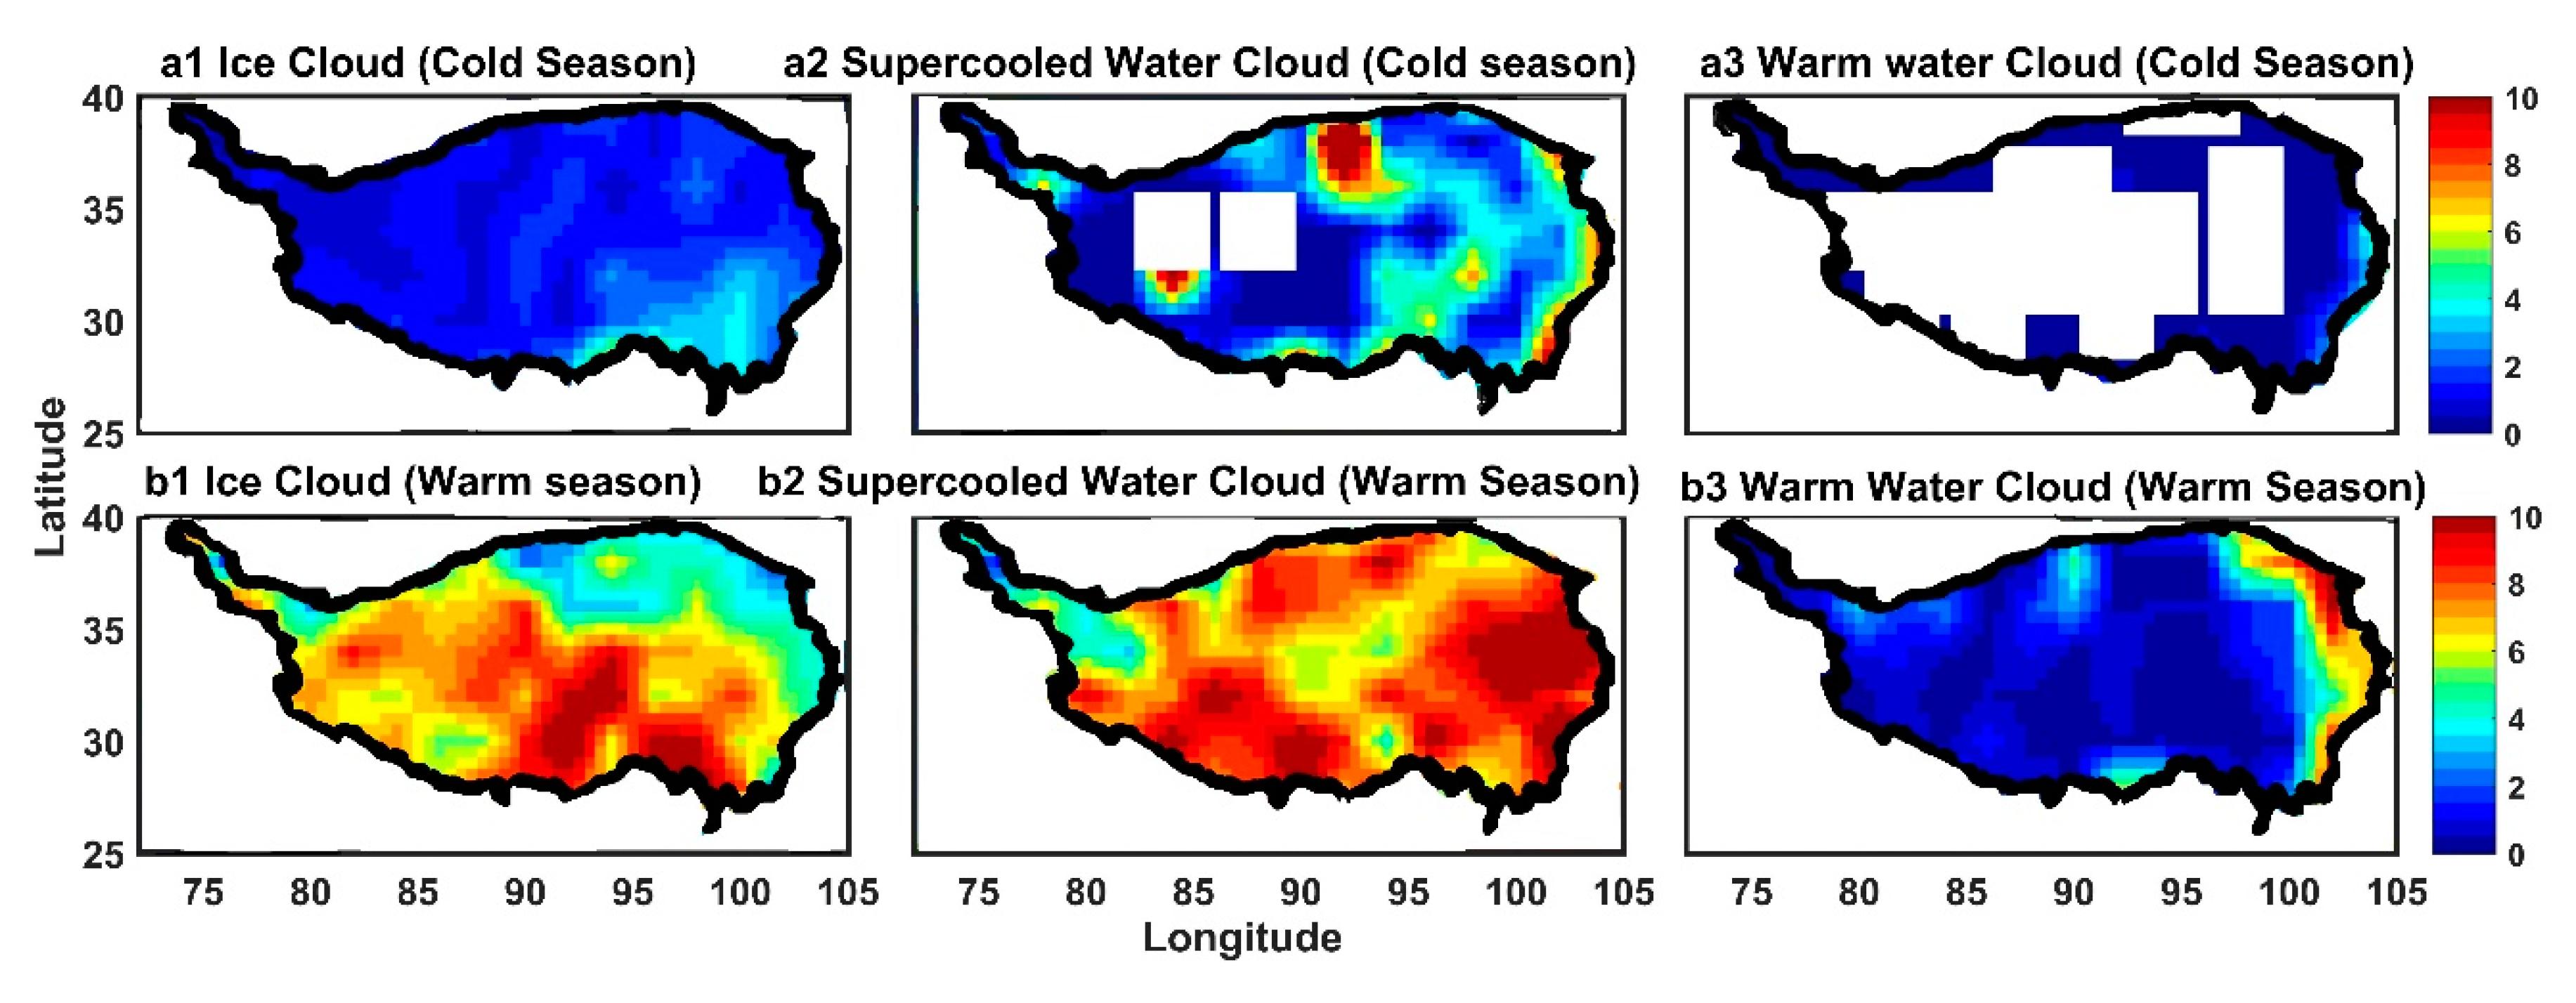
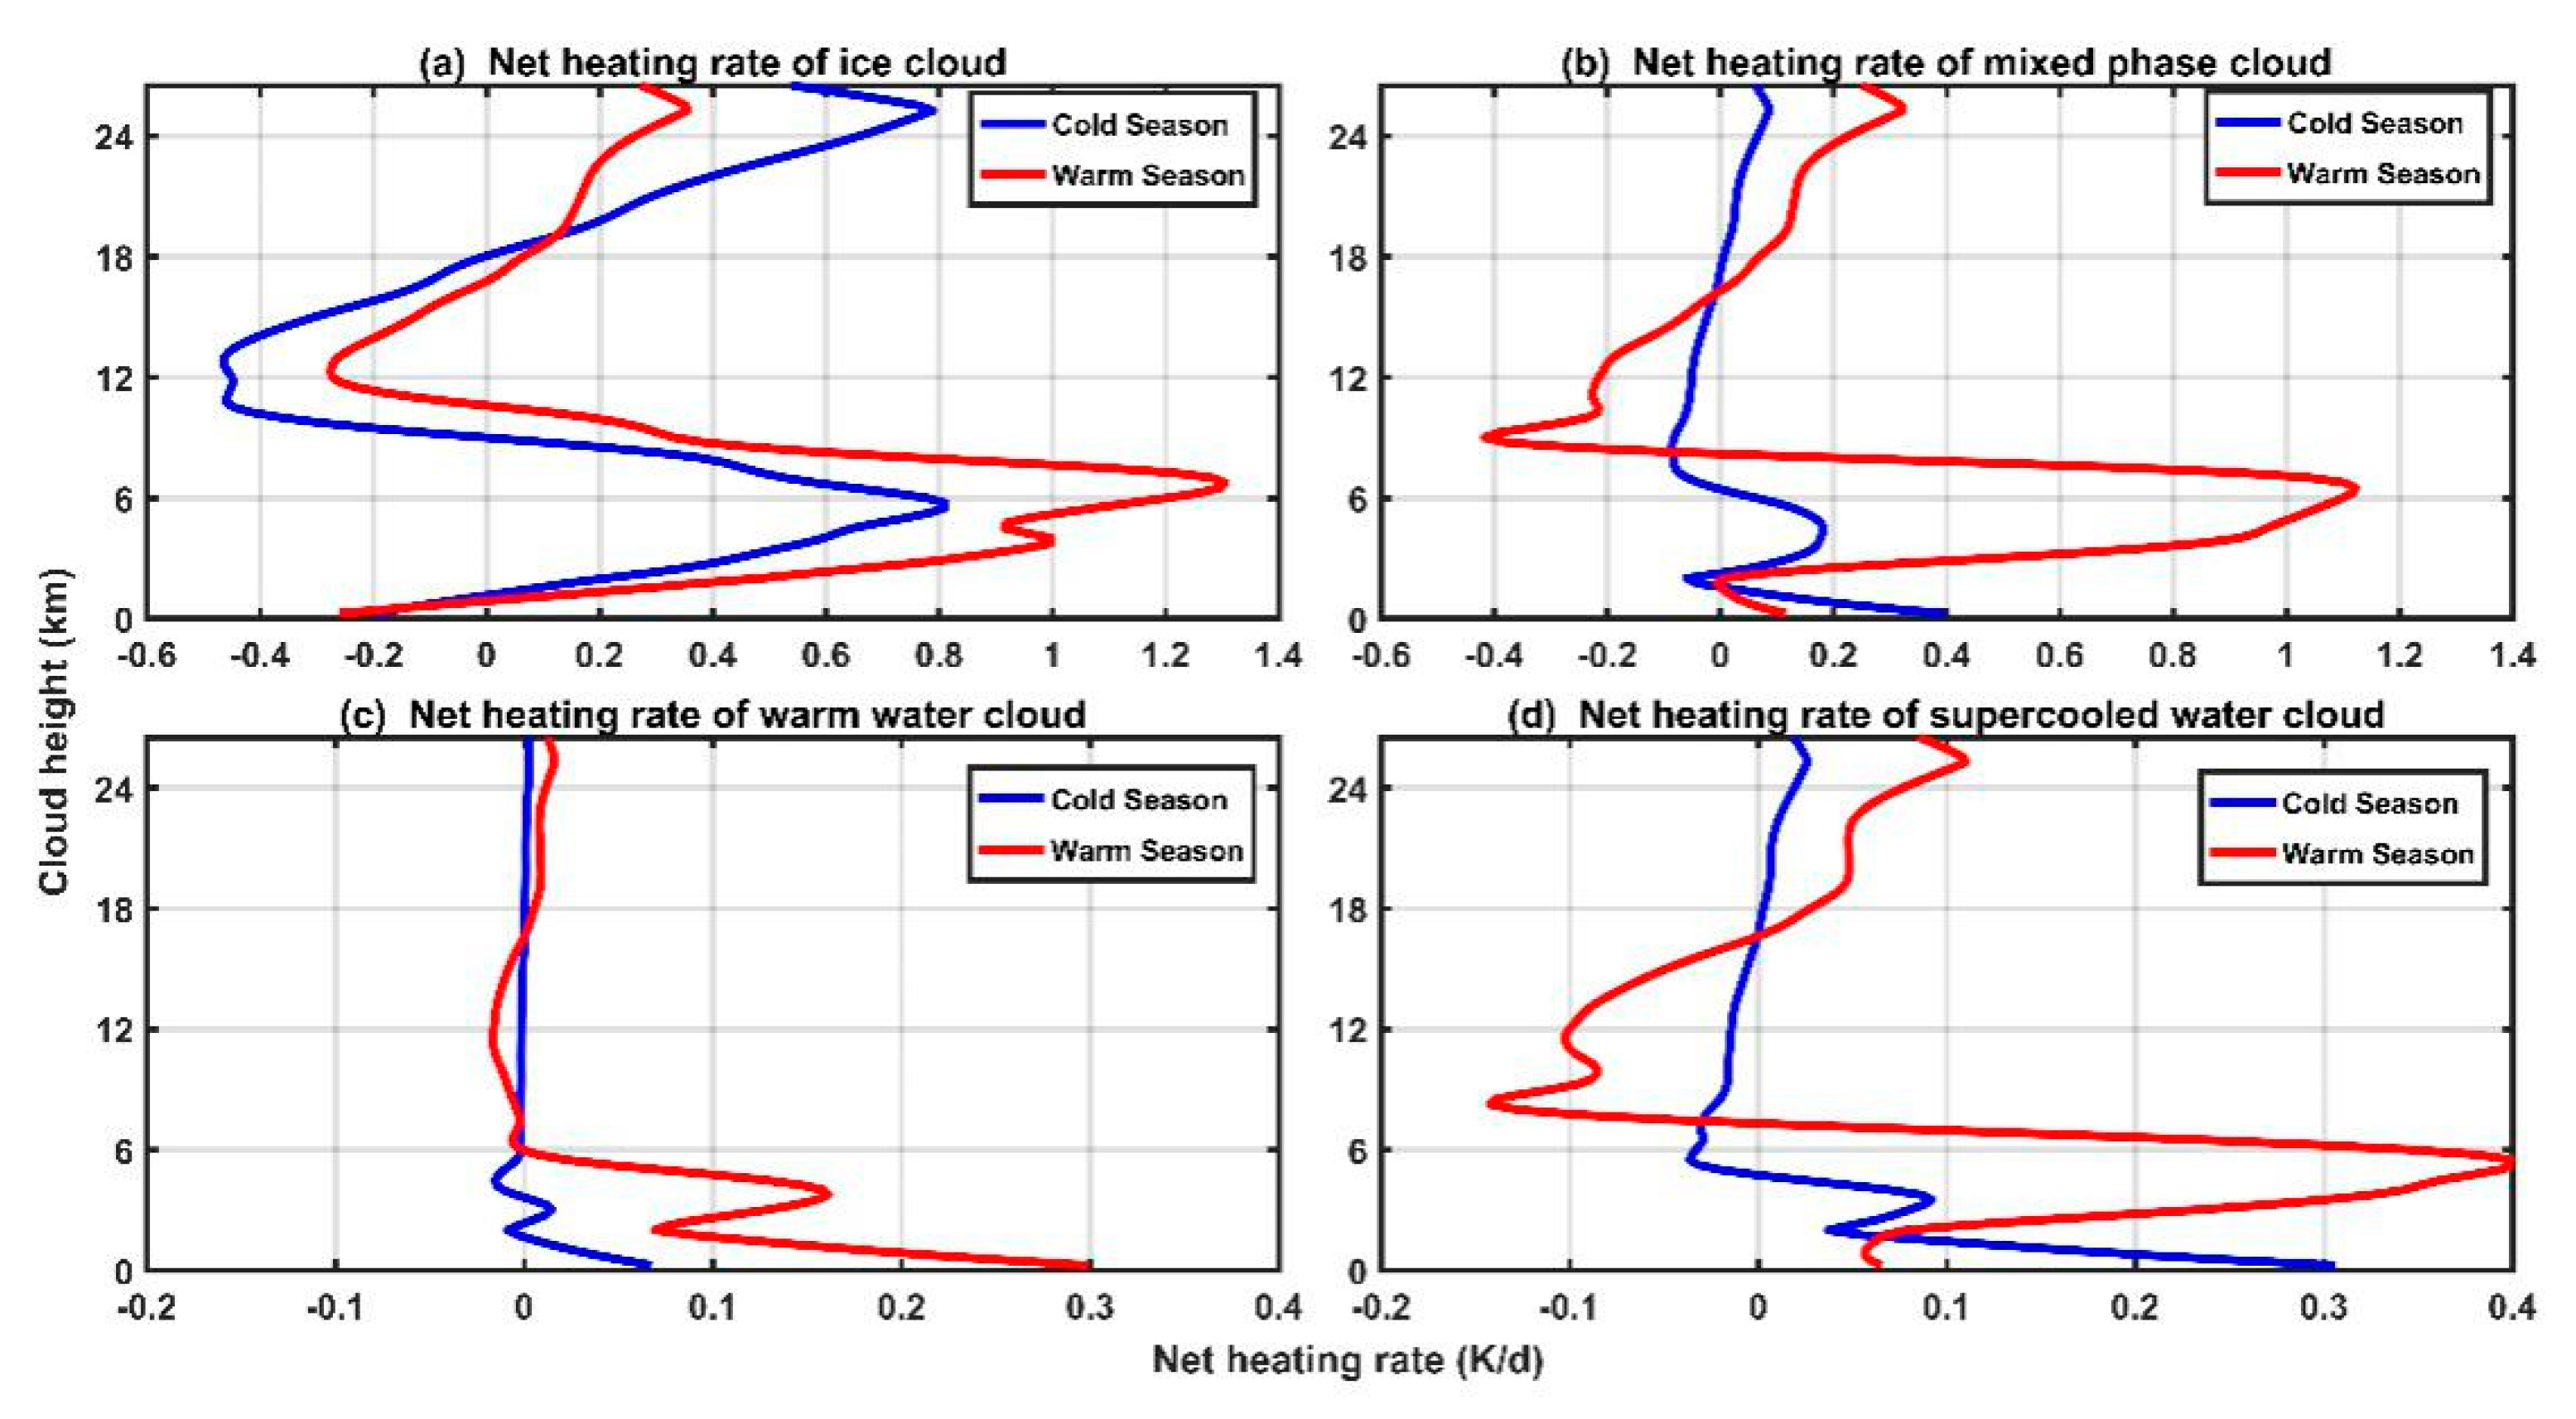
3.3. Heating Rate Profiles of the Cloud Phase over the TP

Previous investigations have focused on the cloud heating rate over the specific regions, cloud phases, or specific cloud types [90,91,92,93]. However, due to observation limitations, few studies have evaluated the heating rate for various cloud phases over the TP region. Vertical profiles for the net heating rate caused by the four single-layer cloud phases over different seasons are shown in Figure 7. As heating rates were obtained from the cloudy and clear sky by weighting the cloud fraction based on Equation (6), differences in heating rates represent the impact of different cloud phases on the temperature profile. Results for ice clouds indicated a strong heating effect at low- and high-level atmospheres (e.g., approximately 2–9 km and 18–24 km), attaining 1.3 K/day during the warm season. However, it was also shown (Figure 7a) that ice clouds located between 9–18 km above the TP had a strong cooling effect. Compared with the warm season, ice clouds during the cold season more easily cooled the atmosphere, and peak heating rates were approximately recorded at 12 km, attaining −0.5 K/day. Similar vertical distribution heating rates at about 30 °N for ice clouds were recorded by Dolinar et al. [94] using the 2C-ICE product over a four year period (2007 to 2010).
Results for single-layer mixed-phase clouds (Figure 7b) indicated that mixed-phase clouds recorded a relatively smaller heating rate compared with ice clouds. The relatively weaker heating effect (~1.1 K/day) corresponds to a smaller CRE within the atmosphere (Figure 5). Similar to ice clouds, mixed-phase clouds during the warm season also recorded a cooling tendency on the middle-level atmosphere (9–16 km), having a stronger effect (up to −0.4 K/day). On the contrary, the mixed-phase cloud heating rate during the cold season recorded a weak heating effect at low altitudes. Compared with the ice clouds and mixed-phase clouds, the heating rate of the liquid clouds was smaller at the high-level atmosphere due to lower occurrence frequencies. In addition, warm water clouds at low altitudes also recorded a very weak heating effect (<6 km), especially during the cold season (heating rate <0.1 K/day). Compared with warm water clouds, supercooled water clouds recorded a stronger heating effect with altitudes lower than 6km (~0.4 K/day), and a stronger cooling effect in the mid-level atmosphere (~−0.15 K/day) during the warm season. Overall, differences in the heating rate profiles between different cloud phases during different seasons were mainly controlled by the vertical distribution of the cloud phase and their microphysical, macrophysical, and optical properties. As the important components of mixed-phase clouds, altocumulus and altostratus, for example, have different cloud radiative effects and heating rates due to differences in the dominant cloud phases [95].
Contributions of different cloud phases to cloud net heating rate at different heights are shown in Figure 8 (as well as net heating rate contribution of multilayered clouds). Here, heating rate contribution, calculated using Equation (5), is similar to that of CRE. These results clearly show that the contribution for each cloud phase varies with height and season. Overall, ice clouds almost recorded the largest contribution among all cloud phases, notably exceeding 70% during the cold season. During the warm season, MLS dominated the heating rate for the majority of heights. By using the same dataset to quantify cloud radiative effects of the MLS, LÜ et al. [96] recorded that, by averaging global overlapped cloud layers, a tendency of heating low-level atmospheres more easily than single-layer cloud systems was recorded. However, the dominant contribution of MLS at in the low-level atmosphere was not identified, possibly being related to different overlap cloud types and overlap percentages over the TP region [71]. Overall, the contribution from mixed-phase clouds was larger during the warm season than during the cold season. The contribution of supercooled water clouds exceeded those of warm water cloud, being more important during the warm season.

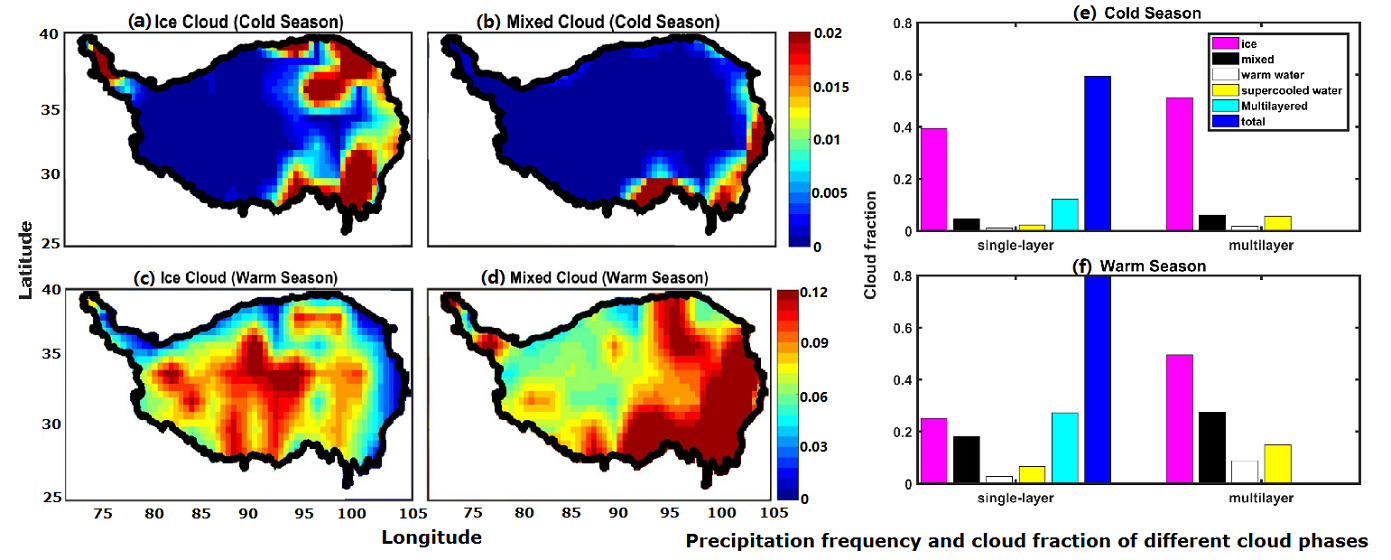
3.4. Precipitation Frequency of Cloud Phase over the TP

Different cloud phases have a different precipitation regimes characteristic at a global scale [15]. However, due to the observational limitations, few studies have focused on the effects of different cloud phases on the precipitation over the TP. This study further researched the precipitation frequency of different cloud phases over the TP during the cold and warm seasons. Based on the definition of the cloud phase precipitation produced by the bottom cloud phase [14], this study defined the precipitation frequency as the profile of a certain bottom cloud phase with precipitation divided by the cloudy-sky profiles. Figure 9 and Figure 10 illustrate that the ice and the mixed-phase clouds produced more precipitation, while the precipitation frequency produced by the liquid water clouds was very low, which is similar to the results of recent previous investigations [14,15].
During the cold season, the precipitation caused by the ice clouds mainly occurred in the northeastern (mainly concentrated in Qilian Mountains) and southeastern part of the TP (approximately 0.01–0.02) (Figure 9). In particular, precipitation from ice clouds also frequently occurred in the western tail of the TP. Kapnick et al. [97] showed that precipitation in Karakoram Mountain occurred mainly from December to May of the following year, which may be related to the high precipitation frequency from ice clouds in the western tail boundary of the TP. Compared with the cold season, the precipitation frequency of the ice cloud during the warm season occurred throughout the TP, while the peak precipitation (reached up to 0.12) occurred in the middle and west of the TP. The central area of the TP is mainly the Qiangtang Plateau where there are plateau lakes with the largest number of lakes in the world and the highest lake level. The Qiangtang Plateau also provides abundant water vapor conditions to trigger precipitable conditions in the summer, possibly being one reason why ice clouds in the central TP had a greater precipitation frequency during the warm season. Dong et al. [98] showed that summer precipitation in the southwestern area of the TP was mainly caused by convective storms in the Indian subcontinent, possibly being a significant factor for the distinct difference in precipitation from ice clouds between the cold and warm seasons of over the southwestern part of the TP. In particular, precipitation frequency was very high at the big bend of the Yarlung Zangbo River, possibly associated to a large volume of water vapor transported from the Bay of Bengal.
For the mixed-phase cloud (Figure 9(a2) and Figure 10(a2)), the mixed-phase cloud has a relatively smaller precipitation frequency compared with that of the ice cloud during the cold season. The large precipitation frequency of the mixed-phase cloud mainly occurred at the eastern boundary of the TP and the Yarlung Zangbo River, exceeding 0.02 during the cold season. During the warm season, the mixed-phase clouds dominantly occupied the precipitation over the eastern part of the TP, and the precipitation frequency was significantly greater than that of mixed-phase clouds during the cold season, exceeding 12%. We can see that the RCF of mixed phase clouds in Figure 1 also shows the distribution characteristics corresponding to its precipitation frequency. The warm-moist air convergence from the Indian Ocean is usually transported into the TP as a heat source during the summer, inducing deep convective cloud systems mainly in the eastern part of the TP [48,78,86]. Indeed, Yang et al. [99] also derived similar conclusions using precipitation and δ18O data. Different from the ice cloud, the precipitation frequency of the mixed-phase clouds in the west and middle part of the TP was less than the ice cloud’s precipitation frequency, which is about 0.06–0.09 during the warm season. Overall, the high-cloud precipitation over the TP was mainly caused by the ice cloud and mixed-phase clouds. Besides, the precipitation mainly occurred at the southeastern part of TP during the warm season [100].
It is also notable that seasonal variability of precipitation frequency is predominantly dominated by ice and mixed-phase clouds during the cold season. While precipitation frequency over the southeastern area of the TP was mainly dominated by mixed-phase clouds during the warm season. Precipitation frequency of ice clouds is mainly distributed in the middle part of the TP during the warm season. Compared with ice and mixed-phase clouds, the frequency of liquid clouds inducing precipitation was generally smaller over the TP due to a lower frequency. In addition, warm water and supercooled water clouds at the south-central border of the TP have a very lower precipitation frequency (<0.02), especially during the warm season.

4. Discussion

Based on the statistic results of Figure 1, we found that clouds are more distributed during the warm season than the cold season, and this finding may be due to a plentiful supply of moisture during the warm season [101]. In addition, based on long-term cloud records from NASA Clouds and CERES, Naud et al. [102] recorded a higher cloud fraction in the northern part of the TP in the winter and a lower cloud fraction in the summer, findings which are consistent with our results. Our results also indicated that cold rain caused by ice clouds dominated precipitation frequency over the TP during the cold season [14] (see Figure 9); Choi et al. [19] highlighted that an increase in the dust frequency during the cold season (e.g., winter and spring seasons) over mid-latitude regions of the Northern Hemisphere is derived from a decrease in the supercooled water cloud fraction that effectively glaciates supercooled water clouds by lifted dust aerosols. Additionally, based on the station observation data, an increase in dust and carbon contents (black, organic, and elements) have been detected during non-monsoon periods [103,104]. Spatial and seasonal distributions of mixed-phase clouds are closely related to those of deep convective clouds [105,106]. From the results of CRE and heating rate, we can see that cloud radiative effects and heating rates of cloud phases show different distribution characteristics, which is probably linked with aerosol loading and related dynamic processes [19]. Based on the observation dataset, due to low ice nuclei aerosol (e.g., dust) loading [7,19,21], there are more distributions of super-cooled water clouds over the Southern Ocean. By incorporating CERES–CloudSat–CALIPSO–MODIS (CCCM) datasets into a radiative transfer model, Bodas-Salcedo et al. [29] found that clouds with supercooled liquid tops contribute 27%–38% to the total reflected solar radiation over the Southern Ocean, whereas most climate models were not able to reproduce the importance of the supercooled water cloud on the radiative budget over the Southern Ocean. For the TP regions, the super-cooled water cloud is more than the warm water cloud, especially in the southeastern part of the TP. In addition, The spatial and seasonal variability in the cloud fraction over the TP (Figure 4) may be induced by water vapor and aerosol loading conditions [50,102]. Besides, more ice clouds during the cold season may be linked with atmospheric temperature and microphysical properties (e.g., ice nuclei aerosol) [21,102].
Our statistic results also showed that the precipitation frequency of ice and mixed-phase clouds is more than that of the water clouds (see Figure 9 and Figure 10). Heymsfield et al. [15] also demonstrated that ice clouds produce the largest proportion of precipitation, while warm water clouds produce the least precipitation on a global scale. In addition, precipitation over the Qilian Mountains during the cold season, which are located at the northeastern boundary of the TP, may be induced by the southward movement of the westerly belt. However, the precipitation on the northwest slope in the Qilian Mountains is mainly triggered by the water vapor from the westerly belt.

5. Conclusions

In order to understand the global energy budget and water cycles, it is important to fully understand temporal and spatial distributions of cloud phases and their corresponding radiation and precipitation properties. However, conventional passive sensors (e.g., MODIS) are not able to provide accurate cloud phase information and vertical profiles, especially for mixed-phase and supercooled water clouds [107]. Furthermore, current climate models lack partitioning skills and they are unable to simulate mixed-phase and supercooled water clouds, resulting in considerable outputs uncertainty [36,108]. In addition, few studies have evaluated the impact of different cloud phases on the Earth’s radiation budget and their precipitation frequencies at regional or global scales (e.g., TP). By using space-based lidar and radar (e.g., CALIOP and CPR) methods, we investigated the spatial distributions of various cloud phases, assessing their impacts on radiative contributions and precipitation frequencies over the TP. Although some statistical results agree well with those of previous studies, new insights are also gained. New insights are gained specifically for the TP.
This paper mainly show following results: Total cloud cover recorded a decreasing trend from the southeast to the northwest, possibly due to topographical characteristics across the TP [50]. In addition, our results also indicated that ice clouds frequently occurred during the cold season over the TP and the RCF was maximal (~0.84) among the cloud phases. RCFs of mixed-phase and supercooled water clouds were higher during the warm season. Our results also found that ice clouds have a larger radiative contribution during the cold season. It should be noted that liquid clouds have an atmospheric cooling effect during the cold season over the TP. Furthermore, our results demonstrated that heating rate profiles obtained from different cloud phases varied with different seasons. For example, ice clouds recorded a tendency to heat low- and high-level atmospheres during both cold and warm seasons, while warm water clouds heated the atmosphere near the surface. The heating effect of supercooled water clouds was not negligible during the warm season, especially over the low-level atmosphere. The cloud optical depth and cloud stability have a certain influence on the cloud phase. This study also examined the impacts of the cloud phases on precipitation frequency. The results showed that the precipitation frequency over the TP mainly occurred during the warm season and the precipitation occurrence was dominated by the ice and mixed-phase clouds. Maussion et al. [109] also concluded that precipitation occurred more frequently during summer. In addition, the precipitation dominated by the ice clouds was mainly concentrated in the central part of the TP, while the precipitation dominated by the mixed-phase clouds was mainly produced in the southeastern part of the TP during the warm season.
Previous studies have shown that cloud phase feedback causes more solar radiation to be reflected into space [86,110], with recent studies mainly focusing on the radiative effects of the ice, warm, and mixed-phase clouds [30]. However, our results indicated that supercooled water clouds have an important radiative impact over the TP. In particular, cloud phase partitioning in mixed-phase clouds requires further investigation to advance cloud phase parameterization schemes. It is therefore important to examine the effects of aerosols and dynamic factors on cloud phase changes, not only to accurately quantify cloud radiative impacts of various cloud phases, but to reduce biases of climate feedbacks [7,21,81].

Supplementary Materials

The following are available online at https://www.mdpi.com/2072-4292/13/3/363/s1, Figure S1: Four-year sample of cloud fraction of different cloud phases over the TP, Figure S2: Four-year CRE of different cloud phases over the TP, Figure S3: Four-year CRE of different cloud phases at TOA, ATM, and SFC over the TP, Figure S4: Four-year cloud radiation contribution of different cloud phases at TOA, ATM, and SFC over the TP.

Author Contributions

J.L. conceptualized the experiment and revised the whole manuscript. J.W. writing-draft, drew article graph, and analysis and interpretation of data. B.J. modified and checked the paper. G.W., H.L., M.Z., Y.Z. and Y.L. modified the paper. All authors have read and agreed to the published version of the manuscript.

Funding

The Strategic Priority Research Program of the Chinese Academy of Sciences (XDA2006010301), and the Innovative Research Groups of the National Science Foundation of China (41521004), and the National Key R&D Program of China (2016YFC0401003), and the National Science Fund for Excellent Young Scholars (42022037).

Data Availability Statement

Acknowledgments

This work was supported by the Strategic Priority Research Program of the Chinese Academy of Sciences (XDA2006010301), and the Innovative Research Groups of the National Science Foundation of China (41521004), and the National Key R&D Program of China (2016YFC0401003), and the National Science Fund for Excellent Young Scholars (42022037). We would like to thank the CloudSat science team for providing excellent and accessible data products that made this study possible. We are also grateful for the constructive comments from the editor and two anonymous reviewers to improve the quality of this paper.

Conflicts of Interest

The authors declare that they have no conflict of interest.

References

  1. Harrison, E.F.; Minnis, P.; Barkstrom, B.R.; Ramanathan, V.; Cess, R.D.; Gibson, G.G. Seasonal variation of cloud radiative forcing derived from the earth radiation budget experiment. J. Geophys. Res. Atmos. 1990, 95, 18687–18703. [Google Scholar] [CrossRef]
  2. Stephens, G.L. Cloud feedbacks in a climate system: A critical review. J. Clim. 2005, 18, 237–273. [Google Scholar] [CrossRef] [Green Version]
  3. Lolli, S.; Campbell, J.R.; Lewis, J.R.; Gu, Y.; Marquis, J.W.; Chew, B.N.; Liew, S.C.; Salinas, S.V.; Welton, E.J. Daytime top-of-the-atmosphere cirrus cloud radiative forcing properties at Singapore. J. Appl. Meteorol. Clim. 2017, 56, 1249–1257. [Google Scholar] [CrossRef] [Green Version]
  4. Min, M.; Wang, P.C.; Campbell, J.R.; Zong, X.M.; Li, Y. Midlatitude cirrus cloud radiative forcing over China. J. Geophys. Res. Atmos. 2010, 115, D20. [Google Scholar] [CrossRef] [Green Version]
  5. Klein, S.A.; Hartmann, D.L. The seasonal cycle of low stratiform clouds. J. Clim. 1993, 6, 1587–1606. [Google Scholar] [CrossRef] [Green Version]
  6. Myers, T.A.; Norris, J.R. Reducing the uncertainty in subtropical cloud feedback. Geophys. Res. Lett. 2016, 43, 2144–2148. [Google Scholar] [CrossRef]
  7. Li, J.; Lv, Q.; Zhang, M.; Wang, T.; Kawamoto, K.; Chen, S.; Zhang, B. Effects of atmospheric dynamics and aerosols on the fraction of supercooled water clouds. Atmos. Chem. Phys. 2017, 17, 1847–1863. [Google Scholar] [CrossRef] [Green Version]
  8. Zhang, M.H.; Lin, W.Y.; Klein, S.A.; Bacmeister, J.T.; Bony, S.; Cederwall, R.T.; Del Genio, A.D.; Hack, J.J.; Loeb, N.G.; Lohmann, U.; et al. Comparing clouds and 15 their seasonal variations in 10 atmospheric general circulation models with satellite measurements. J. Geophys. Res. Atmos. 2005, 110, D15S02. [Google Scholar]
  9. Cess, R.D.; Zhang, M.H.; Ingram, W.J.; Potter, G.L.; Alekseev, V.; Barker, H.W.; Cohen-Solal, E.; Colman, R.A.; Dazlich, D.A.; Del Genio, A.D.; et al. Cloud feedback in atmospheric general circulation models: An update. J. Geophys. Res. Atmos. 1996, 101, 12791–12794. [Google Scholar] [CrossRef] [Green Version]
  10. Boucher, O.; Randall, D.; Artaxo, P.; Bretherton, C.; Feingold, G.; Forster, P.; Kerminen, V.; Kondo, Y.; Liao, H.; Lohmann, U.; et al. Clouds and aerosols. In Climate Changes 2013: The Physical Science Basis; Contribution of Working Group 1 to the IPCC Fifth Assessment Report; Stocker, T.F., Qin, D., Plattner, G.K., Tignor, M., Allen, S.K., Boschung, J., Nauels, A., Xia, Y., Bex, V., Midgley, P.M., Eds.; Cambridge University Press: Cambridge, UK; New York, NY, USA, 2013; pp. 571–657. [Google Scholar]
  11. Fu, Q.; Liou, K.N. Parameterization of the radiative properties of cirrus clouds. J. Atmos. Sci. 1993, 50, 2008–2025. [Google Scholar] [CrossRef] [Green Version]
  12. Hu, Y.X.; Stamnes, K. An accurate parameterization of the radiative properties of water clouds suitable for use in climate models. J. Clim. 1993, 6, 728–742. [Google Scholar] [CrossRef] [Green Version]
  13. Deetz, K.; Vogel, H.; Haslett, S.; Knippertz, P.; Coe, H.; Vogel, B. Aerosol liquid water content in the moist southern West African monsoon layer and its radiative impact. Atmos. Chem. Phys. 2018, 18, 14271–14295. [Google Scholar] [CrossRef] [Green Version]
  14. Mülmenstädt, J.; Sourdeval, O.; Delanoë, J.; Quaas, J. Frequency of occurrence of rain from liquid-, mixed-, and ice-phase clouds derived from A-Train satellite retrievals. Geophys. Res. Lett. 2015, 42, 6502–6509. [Google Scholar] [CrossRef] [Green Version]
  15. Heymsfield, A.J.; Schmitt, C.; Chen, C.; Bansemer, A.; Gettelman, A.; Field, P.R.; Liu, C. Contributions of the liquid and ice phases to global surface precipitation: Observations and global climate modeling. J. Atmos. Sci. 2020, 77, 2629–2648. [Google Scholar] [CrossRef]
  16. Pruppacher, H.R.; Klett, J.D. Microphysics of clouds and precipitation. In Atmospheric and Oceanographic Sciences Library; Springer: Cham, Switzerland, 1997; Volume 18. [Google Scholar]
  17. Hong, Y.; Liu, G. The characteristics of ice cloud properties derived from CloudSat and CALIPSO measurements. J. Clim. 2015, 28, 3880–3901. [Google Scholar] [CrossRef]
  18. Shupe, M.D.; Daniel, J.S.; De Boer, G.; Eloranta, E.W.; Kollias, P.; Long, C.N.; Luke, E.P.; Turner, D.D.; Verlinde, J. A focus on mixed-phase clouds: The status of ground-based observational methods. Bull. Amer. Meteor. Soc. 2008, 89, 1549–1562. [Google Scholar] [CrossRef] [Green Version]
  19. Choi, Y.S.; Lindzen, R.S.; Kim, H.J. Space observations of cold-cloud phase change. Proc. Natl. Acad. Sci. USA 2010, 107, 11211–11216. [Google Scholar] [CrossRef] [Green Version]
  20. Morrison, H.; Zuidema, P.; Ackerman, A.S.; Avramov, A.; de Boer, G.; Fan, J.; Fridlind, A.M.; Hashino, T.; Harrington, J.Y.; Luo, Y.; et al. Intercomparison of cloud model simulations of Arctic mixed-phase boundary layer clouds observed during SHEBA/FIRE-ACE. J. Adv. Model. Earth. Syst. 2011, 3, M06003. [Google Scholar] [CrossRef]
  21. Tan, I.; Storelvmo, T.; Choi, Y.S. Spacebornelidar observations of the ice-nucleating potential of dust, polluted dust, and smoke aerosols in mixed-phase clouds. J. Geophys. Res. Atmos. 2014, 119, 6653–6665. [Google Scholar] [CrossRef]
  22. Cesana, G.; Storelvmo, T. Improving climate projections by understanding how cloud phase affects radiation. J. Geophys. Res. Atmos. 2017, 122, 4594–4599. [Google Scholar] [CrossRef]
  23. Pruppacher, H.R.; Klett, J.D.; Wang, P.K. Microphysics of clouds and precipitation. Aerosol. Sci. Tech. 1998, 28, 381–382. [Google Scholar] [CrossRef] [Green Version]
  24. Lohmann, U.; Henneberger, J.; Henneberg, O.; Fugal, J.P.; Bühl, J.; Kanji, Z.A. Persistence of orographic mixed-phase clouds. Geophys. Res. Lett. 2016, 43, 10512–10519. [Google Scholar] [CrossRef]
  25. Bodas-Salcedo, A.; Andrews, T.; Karmalkar, A.V.; Ringer, M.A. Cloud liquid water path and radiative feedbacks over the Southern Ocean. Geophys. Res. Lett. 2016, 43, 10938–10946. [Google Scholar] [CrossRef]
  26. Sun, Z.; Shine, K.P. Studies of the radiative properties of ice and mixed-phase clouds. Q. J. Roy. Meteor. Soc. 1994, 120, 111–137. [Google Scholar] [CrossRef]
  27. Shupe, M.D.; Matrosov, S.Y.; Uttal, T. Arctic mixed-phase cloud properties derived from surface-based sensors at SHEBA. J. Atmos. Sci. 2006, 63, 697–711. [Google Scholar] [CrossRef]
  28. Sun, Z.; Shine, K.P. Parameterization of ice cloud radiative properties and its application to the potential climatic importance of mixed-phase clouds. J. Clim. 1995, 8, 1874–1888. [Google Scholar] [CrossRef] [Green Version]
  29. Bodas-Salcedo, A.; Hill, P.G.; Furtado, K.; Williams, K.D.; Field, P.R.; Manners, J.C.; Hyder, P.; Kato, S. Large contribution of supercooled liquid clouds to the solar radiation budget of the Southern Ocean. J. Clim. 2016, 29, 4213–4228. [Google Scholar] [CrossRef] [Green Version]
  30. Matus, A.V.; L’Ecuyer, T.S. The role of cloud phase in Earth’s radiation budget. J. Geophys. Res. Atmos. 2017, 122, 2559–2578. [Google Scholar] [CrossRef]
  31. Stephens, G.L.; Greenwald, T.J. The Earth’s radiation budget and its relation to atmospheric hydrology: 2. Observations of cloud effects. J. Geophys. Res. Atmos. 1991, 96, 15325–15340. [Google Scholar] [CrossRef]
  32. Hartmann, D.L.; Ockert-Bell, M.E.; Michelsen, M.L. The effect of cloud type on Earth’s energy balance: Global analysis. J. Clim. 1992, 5, 1281–1304. [Google Scholar] [CrossRef] [Green Version]
  33. McFarquhar, G.M.; Heymsfield, A.J.; Spinhirne, J.; Hart, B. Thin and subvisual tropopause tropical cirrus: Observations and radiative impacts. J. Atmos. Sci. 2000, 57, 1841–1853. [Google Scholar] [CrossRef]
  34. Hang, Y.; L’Ecuyer, T.S.; Henderson, D.S.; Matus, A.V.; Wang, Z. Reassessing the effect of cloud type on Earth’s energy balance in the age of active spaceborne observations. Part II: Atmospheric heating. J. Clim. 2019, 32, 6219–6236. [Google Scholar] [CrossRef]
  35. L’Ecuyer, T.S.; Hang, Y.; Matus, A.V.; Wang, Z. Reassessing the effect of cloud type on Earth’s energy balance in the age of active spaceborne observations. Part I: Top-of-atmosphere and surface. J. Clim. 2019, 32, 6197–6217. [Google Scholar] [CrossRef] [Green Version]
  36. Komurcu, M.; Storelvmo, T.; Tan, I.; Lohmann, U.; Yun, Y.; Penner, J.E.; Wang, Y.; Liu, X.; Takemura, T. Intercomparison of the cloud water phase among global climate models. J. Geophys. Res. Atmos. 2014, 119, 3372–3400. [Google Scholar] [CrossRef] [Green Version]
  37. Cesana, G.; Kay, J.E.; Chepfer, H.; English, J.M.; De Boer, G. Ubiquitous low-level liquid-containing Arctic clouds: New observations and climate model constraints from CALIPSO-GOCCP. Geophys. Res. Lett. 2012, 39, L20804. [Google Scholar] [CrossRef] [Green Version]
  38. Forbes, R.M.; Ahlgrimm, M. On the representation of high-latitude boundary layer mixed-phase cloud in the ECMWF global model. Mon. Weather. Rev. 2014, 142, 3425–3445. [Google Scholar] [CrossRef]
  39. Storelvmo, T.; Kristjansson, J.E.; Lohmann, U. Aerosol influence on mixed-phase clouds in CAM-Oslo. J. Atmos. Sci. 2008, 65, 3214–3230. [Google Scholar] [CrossRef] [Green Version]
  40. Xu, X.; Lu, C.; Shi, X.; Gao, S. World water tower: An atmospheric perspective. Geophys. Res. Lett. 2008, 35, L20815. [Google Scholar] [CrossRef]
  41. Yao, T.; Thompson, L.; Yang, W.; Yu, W.; Gao, Y.; Guo, X.; Yang, X.; Duan, K.; Zhao, H.; Xu, B.; et al. Different glacier status with atmospheric circulations in Tibetan Plateau and surroundings. Nat. Clim. Change 2012, 2, 663–667. [Google Scholar] [CrossRef]
  42. Cheng, G.; Wu, T. Responses of permafrost to climate change and their environmental significance, Qinghai-Tibet Plateau. J. Geophys. Res. 2007, 112, F02S03. [Google Scholar] [CrossRef] [Green Version]
  43. Zhu, L.P.; Xie, M.P.; Wu, X.Y. Quantitative analysis of lake area variations and the influence factors from 1971 to 2004 in the Nam Co basin of the Tibetan Plateau. Chinese. Sci. Bull. 2010, 55, 1294–1303. [Google Scholar] [CrossRef]
  44. Chen, B.; Chao, W.C.; Liu, X. Enhanced climatic warming in the Tibetan Plateau due to doubling CO2: A model study. Clim. Dynam. 2003, 20, 401–413. [Google Scholar] [CrossRef]
  45. Liu, X.; Cheng, Z.; Yan, L.; Yin, Z.Y. Elevation dependency of recent and future minimum surface air temperature trends in the Tibetan Plateau and its surroundings. Glob. Planet. Change. 2009, 68, 164–174. [Google Scholar] [CrossRef]
  46. Yang, K.; Ding, B.; Qin, J.; Tang, W.; Lu, N.; Lin, C. Can aerosol loading explain the solar dimming over the Tibetan Plateau. Geophys. Res. Lett. 2012, 39, L20710. [Google Scholar] [CrossRef] [Green Version]
  47. Duan, A.; Wu, G. Change of cloud amount and the climate warming on the Tibetan Plateau. Geophys. Res. Lett. 2006, 33, L22704. [Google Scholar] [CrossRef]
  48. Yan, Y.; Liu, Y.; Lu, J. Cloud vertical structure, precipitation, and cloud radiative effects over Tibetan Plateau and its neighboring regions. J. Geophys. Res. 2016, 121, 5864–5877. [Google Scholar] [CrossRef] [Green Version]
  49. Chen, J.; Wu, X.; Yin, Y.; Huang, Q.; Xiao, H. Characteristics of cloud systems over the Tibetan Plateau and East China during Boreal Summer. J. Clim. 2017, 30, 3117–3137. [Google Scholar] [CrossRef]
  50. Zhang, X.; Peng, L.; Zheng, D.; Tao, J. Cloudiness variations over the Qinghai-Tibet Plateau during 1971–2004. J. Geogr. Sci. 2008, 18, 142–154. [Google Scholar] [CrossRef]
  51. MacIntosh, C.R.; Allan, R.P.; Baker, L.H.; Bellouin, N.; Collins, W.; Mousavi, Z.; Shine, K.P. Contrasting fast precipitation responses to tropospheric and stratospheric ozone forcing. Geophys. Res. Lett. 2016, 43, 1263–1271. [Google Scholar] [CrossRef] [Green Version]
  52. Redemann, J.; Wood, R.; Zuidema, P.; Doherty, S.J.; Luna, B.; LeBlanc, S.E.; Diamond, M.S.; Shinozuka, Y.; Chang, I.Y.; Ueyama, R.; et al. An overview of the ORACLES (ObseRvations of Aerosols above CLouds and their intEractionS) project: Aerosol-cloud-radiation interactions in the Southeast Atlantic basin. Atmos. Chem. Phys. Discuss. 2020, 1–82. [Google Scholar] [CrossRef]
  53. Schmale, J.; Baccarini, A.; Thurnherr, I.; Henning, S.; Efraim, A.; Regayre, L.; Bolas, C.; Hartmann, M.; Welti, A.; Lehtipalo, K.; et al. Overview of the antarctic circumnavigation expedition: Study of preindustrial-like aerosols and their climate effects (ace-space). Bull. Am. Meteorol. Soc. 2019, 100, 2260–2283. [Google Scholar] [CrossRef]
  54. Winker, D.M.; Vaughan, M.A.; Omar, A.; Hu, Y.; Powell, K.A.; Liu, Z.; Hunt, W.H.; Young, S.A. Overview of the CALIPSO mission and CALIOP data processing algorithms. J. Atmos. Ocean. Tech. 2009, 26, 2310–2323. [Google Scholar] [CrossRef]
  55. Winker, D.M.; Pelon, J.R.; McCormick, M.P. CALIPSO mission: Spaceborne lidar for observation of aerosols and clouds. In Lidar Remote Sensing for Industry and Environment Monitoring III; Singh, U.N., Itabe, T., Liu, Z., Eds.; International Society for Optics and Photonics: Bellingham, WA, USA, 2003; pp. 1–11. [Google Scholar]
  56. Vaughan, M.A.; Powell, K.A.; Winker, D.M.; Hostetler, C.A.; Kuehn, R.E.; Hunt, W.H.; Getzewich, B.J.; Young, S.A.; Liu, Z.Y.; McGill, M.J. Fully automated detection of cloud and aerosol layers in the CALIPSO lidar measurements. J. Atmos. Ocean. Tech. 2009, 26, 2034–2050. [Google Scholar] [CrossRef]
  57. Young, S.A.; Vaughan, M.A. The retrieval of profiles of particulate extinction from Cloud Aerosol Lidar Infrared Pathfinder Satellite Observations (CALIPSO) lidar data: Algorithm description. J. Atmos. Ocean. Tech. 2009, 26, 1105–1119. [Google Scholar] [CrossRef]
  58. Wang, Z.; Vane, D.; Stephens, G.; Reinke, D. CloudSat Project: Level 2 Combined Radar and Lidar Cloud Scenario Classification Product Process Description and Interface Control Document; Cooperative Institute for Research in the Atmosphere: Fort Collins, CO, USA, 2013. [Google Scholar]
  59. Li, J.; Lv, Q.; Jian, B.; Zhang, M.; Zhao, C.; Fu, Q.; Kawamoto, K.; Zhang, H. The impact of atmospheric stability and wind shear on vertical cloud overlap over the Tibetan Plateau. Atmos. Chem. Phys. 2018, 18, 7329–7343. [Google Scholar] [CrossRef] [Green Version]
  60. Stephens, G.L.; Vane, D.G.; Boain, R.J.; Mace, G.G.; Sassen, K.; Wang, Z.; Lllingworth, A.J.; Oconnor, E.J.; Rossow, W.B.; Durden, S.L.; et al. THE CLOUDSAT MISSION AND THE A-TRAIN a new dimension of space-based observations of clouds and precipitation. Bull. Amer. Meteor. Soc. 2002, 83, 1771–1790. [Google Scholar] [CrossRef] [Green Version]
  61. Stephens, G.L.; Vane, D.G.; Tanelli, S.; Im, E.; Durden, S.; Rokey, M.; Reinke, D.; Partain, P.; Mace, G.G.; Austin, R.; et al. CloudSat mission: Performance and early science after the first year of operation. J. Geophys. Res. Atmos. 2008, 113, D00A18. [Google Scholar] [CrossRef]
  62. Matrosov, S.Y. Potential for attenuation-based estimations of rainfall rate from CloudSat. Geophys. Res. Lett. 2007, 34, 5. [Google Scholar] [CrossRef] [Green Version]
  63. Matrosov, S.Y.; Battaglia, A.; Rodriguez, P. Effects of multiple scattering on attenuation-based retrievals of stratiform rainfall from CloudSat. J. Atmos. Ocean. Tech. 2008, 25, 2199–2208. [Google Scholar] [CrossRef]
  64. Matrosov, S.Y.; Battaglia, A. Influence of multiple scattering on CloudSat measurements in snow: A model study. Geophys. Res. Lett. 2009, 36, 12. [Google Scholar] [CrossRef] [Green Version]
  65. Tanelli, S.; Durden, S.L.; Im, E.; Pak, K.S.; Reinke, D.G.; Partain, P.; Haynes, J.M.; Marchand, R.T. CloudSat’s cloud profiling radar after two years in orbit: Performance, calibration, and processing. IEEE Trans. Geosci. Remote. 2008, 46, 3560–3573. [Google Scholar] [CrossRef]
  66. Partain, P. Cloudsat ECMWF-AUX Auxiliary Data Process Description and Interface Control Document; Cooperative Institute for Research in the Atmosphere, Colorado State University: Fort Collins, CO, USA, 2004. [Google Scholar]
  67. L’Ecuyer, T.S.; Wood, N.B.; Haladay, T.; Stephens, G.L.; Stackhouse, P.W. Impact of clouds on atmospheric heating based on the R04 CloudSat fluxes and heating rates data set. J. Geophys. Res. Atmos. 2008, 113, D00A15. [Google Scholar] [CrossRef] [Green Version]
  68. CloudSat Projec. Level 2B Fluxes and Heating Rates with Lidar [2B-FLXHR-LIDAR] Process Description and Interface Control Document; Deptartment of Atmospheric Science, Colorado State University: Fort Collins, CO, USA, 2020. [Google Scholar]
  69. Henderson, D.S.; L’Ecuyer, T.; Stephens, G.; Partain, P.; Sekiguchi, M. A multi-sensor perspective on the radiative impacts of clouds and aerosols. J. Appl. Meteorol. Climatol. 2013, 52, 853–871. [Google Scholar] [CrossRef]
  70. Tian, L.; Curry, J.A. Cloud overlap statistics. J. Geophys. Res. Atmos. 1989, 94, 9925–9935. [Google Scholar] [CrossRef]
  71. Li, J.; Huang, J.; Stamnes, K.; Wang, T.; Lv, Q.; Jin, H. A global survey of cloud overlap based on CALIPSO and CloudSat measurements. Atmos. Chem. Phys. 2015, 15, 519–536. [Google Scholar] [CrossRef] [Green Version]
  72. Haynes, J.M. CloudSat 2C-PRECIP-COLUMN Data Product Process Description and Interface Control Document; Deptartment of Atmospheric Science, Colorado State University: Fort Collins, CO, USA, 2018. [Google Scholar]
  73. Haynes, J.M.; L’Ecuyer, T.; Stephens, G.L.; Miller, S.D.; Mitrescu, C.; Wood, N.B.; Tanelli, S. Rainfall retrievals over the ocean with spaceborne high-frequency cloud radar. J. Geophys. Res. 2009, 114, D8. [Google Scholar]
  74. Wang, J.; Geerts, B. Identifying drizzle within marine stratus with W-band radar reflectivity. Atmos. Res. 2003, 69, 1–27. [Google Scholar] [CrossRef]
  75. Liu, Y.; Geerts, B.; Miller, M.; Daum, P.; McGraw, R. Threshold radar reflectivity for drizzling clouds. Geophys. Res. Lett. 2008, 35, 3. [Google Scholar] [CrossRef] [Green Version]
  76. Dzambo, A.M.; L’Ecuyer, T.; Sy, O.O.; Tanelli, S. The observed structure and precipitation characteristics of southeast Atlantic stratocumulus from airborne radar during ORACLES 2016–17. J. Appl. Meteorol. Clim. 2019, 58, 2197–2215. [Google Scholar] [CrossRef]
  77. Huang, J.; Guan, X.; Ji, F. Enhanced cold-season warming in semi-arid regions. Atmos. Chem. Phys. 2012, 12, 4627–4653. [Google Scholar] [CrossRef]
  78. Kukulies, J.; Chen, D.; Wang, M. Temporal and spatial variations of convection and precipitation over the Tibetan Plateau based on recent satellite observations. Part I: Cloud climatology derived from CloudSat and CALIPSO. Int. J. Climatol. 2019, 39, 5396–5412. [Google Scholar] [CrossRef] [Green Version]
  79. Morrison, A.E.; Siems, S.T.; Manton, M.J.; Nazarov, A. A modeling case study of mixed-phase clouds over the Southern Ocean and Tasmania. Mon. Weather. Rev. 2010, 138, 839–862. [Google Scholar] [CrossRef]
  80. Baum, B.A.; Menzel, W.P.; Frey, R.A.; Tobin, D.C.; Holz, R.E.; Ackerman, S.A.; Heidinger, A.K.; Yang, P. MODIS cloud-top property refinements for collection 6. J. Appl. Meteorol. Clim. 2012, 51, 1145–1163. [Google Scholar] [CrossRef]
  81. Tan, I.; Storelvmo, T.; Zelinka, M.D. Observational constraints on mixed-phase clouds imply higher climate sensitivity. Science 2016, 352, 224–227. [Google Scholar] [CrossRef] [PubMed] [Green Version]
  82. Yuan, T.; Oreopoulos, L. On the global character of overlap between low and high clouds. Geophys. Res. Lett. 2013, 40, 5320–5326. [Google Scholar] [CrossRef] [Green Version]
  83. Hong, Y.; Liu, G.; Li, J.L. Assessing the radiative effects of global ice clouds based on CloudSat and CALIPSO measurements. J. Clim. 2016, 29, 7651–7674. [Google Scholar] [CrossRef]
  84. Zhao, C.; Liu, L.; Wang, Q.; Qiu, Y.; Wang, W.; Wang, Y.; Fan, T. Toward understanding the properties of high ice clouds at the Naqu site on the Tibetan Plateau using ground-based active remote sensing measurements obtained during a short period in July 2014. J. Appl. Meteor. Climatol. 2016, 55, 2493–2507. [Google Scholar] [CrossRef]
  85. Tsushima, Y.; Emori, S.; Ogura, T.; Kimoto, M.; Webb, M.J.; Williams, K.D.; Ringer, M.A.; Soden, B.J.; Li, B.; Andronova, N. Importance of the mixed-phase cloud distribution in the control climate for assessing the response of clouds to carbon dioxide increase: A multi-model study. Clim. Dyn. 2006, 27, 113–126. [Google Scholar] [CrossRef] [Green Version]
  86. McCoy, D.T.; Hartmann, D.L.; Zelinka, M.D.; Ceppi, P.; Grosvenor, D.P. Mixed-phase cloud physics and Southern Ocean cloud feedback in climate models. J. Geophys. Res. Atmos. 2015, 120, 9539–9554. [Google Scholar] [CrossRef]
  87. Gordon, N.D.; Klein, S.A. Low-cloud optical depth feedback in climate models. J. Geophys. Res. Atmos. 2014, 119, 6052–6065. [Google Scholar] [CrossRef]
  88. Li, X.; Che, H.; Wang, H.; Xia, X.; Chen, Q.; Gui, K.; Zhao, H.; An, L.; Zheng, Y.; Sun, T.; et al. Spatial and temporal distribution of the cloud optical depth over China based on MODIS satellite data during 2003–2016. J. Environ. Sci. 2019, 80, 66–81. [Google Scholar] [CrossRef] [PubMed]
  89. Bao, S.; Letu, H.; Zhao, C.; Tana, G.; Shang, H.; Wang, T.; Chen, B.; Bao, Y.; He, J.; Wang, T.; et al. Spatiotemporal distributions of cloud parameters and their response to meteorological factors over the Tibetan Plateau during 2003–2015 based on MODIS data. Int. J. Climatol. 2019, 39, 532–543. [Google Scholar] [CrossRef] [Green Version]
  90. Comstock, J.M.; Ackerman, T.P.; Mace, G.G. Ground-based lidar and radar remote sensing of tropical cirrus clouds at Nauru Island: Cloud statistics and radiative impacts. J. Geophys. Res. Atmos. 2002, 107, AAC16. [Google Scholar] [CrossRef]
  91. Schumacher, C.; Ciesielski, P.E.; Zhang, M.H. Tropical cloud heating profiles: Analysis from KWAJEX. Mon. Weather Rev. 2008, 136, 4289–4300. [Google Scholar] [CrossRef]
  92. Powell, S.W.; Houze, R.A.; Kumar, A.; Mcfarlane, S.A. Comparison of simulated and observed continental tropical anvil clouds and their radiative heating profiles. J. Atmos. Sci. 2012, 69, 2662–2681. [Google Scholar] [CrossRef] [Green Version]
  93. Thorsen, T.J.; Fu, Q.; Comstock, J.M. Cloud effects on radiative heating rate profiles over Darwin using ARM and A-train radar/lidar observations. J. Geophys. Res. Atmos. 2013, 118, 5637–5654. [Google Scholar] [CrossRef]
  94. Dolinar, E.K.; Dong, X.; Xi, B.; Jiang, J.H.; Loeb, N.G.; Campbell, J.R.; Su, H. A global record of single-layered ice cloud properties and associated radiative heating rate profiles from an A-Train perspective. Clim. Dyn. 2019, 53, 3069–3088. [Google Scholar] [CrossRef]
  95. Sassen, K.; Khvorostyanov, V.I. Microphysical and radiative properties of mixed-phase altocumulus: A model evaluation of glaciation effects. Atmos. Res. 2007, 84, 390–398. [Google Scholar] [CrossRef]
  96. Lü, Q.Y.; Li, J.; Wang, T.; Huang, J. Cloud radiative forcing induced by layered clouds and associated impact on the atmospheric heating rate. J. Meteor. Res. 2015, 29, 779–792. [Google Scholar] [CrossRef]
  97. Kapnick, S.; Delworth, T.; Ashfaq, M.; Malyshev, S.; Milly, P.C.D. Snowfall less sensitive to warming in Karakoram than in Himalayas due to a unique seasonal cycle. Nat. Geosci. 2014, 7, 834–840. [Google Scholar] [CrossRef]
  98. Dong, W.; Lin, Y.; Wright, J.S.; Ming, Y.; Xie, Y.; Wang, B.; Luo, Y.; Huang, W.Y.; Huang, J.B.; Wang, L.; et al. Summer rainfall over the southwestern Tibetan Plateau controlled by deep convection over the Indian subcontinent. Nat. Commun. 2016, 7, 1–9. [Google Scholar] [CrossRef]
  99. Yang, M.; Yao, T.; Wang, H.; Gou, X.; Tian, L. Estimating the criterion for determining water vapour sources of summer precipitation on the northern Tibetan Plateau. Hydrol. Process. 2005, 20, 505–513. [Google Scholar] [CrossRef]
  100. Yan, Y.F.; Liu, Y.M. Vertical structures of convective and stratiform clouds in boreal summer over the Tibetan Plateau and its neighboring regions. Adv. Atmos. Sci. 2019, 36, 1089–1102. [Google Scholar] [CrossRef]
  101. Wu, G.X.; He, B.; Duan, A.M.; Liu, Y.M.; Yu, W. Formation and variation of the atmospheric heat source over the Tibetan Plateau and its climate effects. Adv. Atmos. Sci. 2017, 34, 1169–1184. [Google Scholar] [CrossRef]
  102. Naud, C.M.; Rangwala, I.; Xu, M.; Miller, J.R. A satellite view of the radiative impact of clouds on surface downward fluxes in the Tibetan Plateau. J. Appl. Meteorol. Clim. 2015, 54, 479–493. [Google Scholar] [CrossRef]
  103. Cong, Z.; Kang, S.; Wang, Z.P.; Liu, B.; Wan, X.; Wang, Z.; Gao, S.; Fu, P. Carbonaceous aerosols on the south edge of the Tibetan Plateau: Concentrations, seasonality and sources. Atmos. Chem. Phys. 2015, 14, 25051–25082. [Google Scholar] [CrossRef] [Green Version]
  104. Li, C.L.; Yan, F.P.; Kang, S.C.; Chen, P.F.; Han, X.W.; Hu, Z.F.; Zhang, G.S.; Hong, Y.; Gao, S.P.; Qu, B.; et al. Re-evaluating black carbon in the Himalayas and the Tibetan Plateau: Concentrations and deposition. Atmos. Chem. Phys. 2017, 17, 11899–11912. [Google Scholar] [CrossRef] [Green Version]
  105. Qie, X.; Wu, X.; Yuan, T.; Bian, J.; Lu, D. Comprehensive pattern of deep convective systems over the Tibetan Plateau-South Asian Monsoon region based on TRMM Data. J. Clim. 2014, 27, 6612–6626. [Google Scholar] [CrossRef]
  106. Kukulies, J.; Chen, D.; Wang, M. Temporal and spatial variations of convection, clouds, and precipitation over the Tibetan Plateau from recent satellite observations. Part II: Precipitation climatology derived from global precipitation measurement mission. Int. J. Climatol. 2020, 40, 4858–4875. [Google Scholar] [CrossRef]
  107. Hu, Y.X.; Rodier, S.; Xu, K.M.; Sun, W.B.; Huang, J.P.; Lin, B.; Zhai, P.W.; Josset, D. Occurrence, liquid water content, and fraction of supercooled water clouds from combined CALIOP/IIR/MODIS measurements. J. Geophys. Res. Atmos. 2010, 115, D00H34. [Google Scholar] [CrossRef]
  108. Cesana, G.; Waliser, D.E.; Jiang, X.; Li, J.L.F. Multimodel evaluation of cloud phase transition using satellite and reanalysis data. J. Geophys. Res. Atmos. 2015, 120, 7871–7892. [Google Scholar] [CrossRef]
  109. Maussion, F.; Scherer, D.; Mölg, T.; Collier, E.; Curio, J.; Finkelnburg, R. Precipitation seasonality and variability over the Tibetan Plateau as resolved by the high Asia Reanalysis. J. Clim. 2014, 27, 1910–1927. [Google Scholar] [CrossRef] [Green Version]
  110. McCoy, D.T.; Hartmann, D.L.; Grosvenor, D.P. Observed Southern Ocean cloud properties and shortwave reflection. Part 2: Phase changes and low cloud feedback. J. Clim. 2014, 27, 8858–8868. [Google Scholar] [CrossRef]
Figure 1. Four-year total cloud fraction and relative cloud fraction (RCF) of different cloud phases over the Tibet Plateau (TP). The spatial resolution is a 0.5° × 0.5°grid (the two columns on the left represent the cold season, and the two columns on the right represent the warm season). a1 and a3 represent the total cloud fraction in the cold and warm seasons, respectively. Others represent the RCF of different cloud phases. Here, each cloud phase is a single-layer plus multiple layers; for example, the ice cloud is the total ice cloud.
Remotesensing 13 00363 g001
Figure 2. Four-year cloud radiative effect (CRE) (Wm−2) of different cloud phases over the TP. (a1c4) represent the top of the atmosphere (TOA); (d1f4) represent the ATM. The spatial resolution is a 0.5° × 0.5° grid (The two columns on the left represent the cold season and the two columns on the right represent the warm season. Here, ice clouds, liquid clouds, and mixed-phase clouds refer to the case of the single-layer clouds).
Remotesensing 13 00363 g002
Figure 3. Four-year short-wave cloud optical depth of four different cloud phases over the TP. (a1a3) represent the cold season; (b1b3) represent the warm season. The spatial resolution is a 0.5° × 0.5° grid (Here, ice clouds, liquid clouds refer to the case of the single-layer clouds. Part of the data for water clouds during the cold season is missing).
Remotesensing 13 00363 g003
Figure 4. Four-year cloud fraction of different cloud phases over the TP (The first four columns represent the ice cloud, the mixed-phase cloud, the warm water cloud, and the supercooled water cloud, respectively, and represent only a single-layer, while the last four columns represent multi-layer condition. And the multilayer condition further classifies the multilayered clouds into four different cloud phases if the multilayered clouds include the given cloud phases. In addition, the left column has total clouds and multilayered clouds, (a) represents the cold season, and (b) represents the warm season).
Remotesensing 13 00363 g004
Figure 5. Four-year CRE (Wm−2) of ice clouds, mixed-phase cloud, supercooled water clouds, warm water clouds, multilayered clouds, and total clouds at the TOA, ATM, and SFC over the TP (The left-to-right values of each cube indicate the CRE of different cloud phases during the cold season and warm season, respectively. The small spheres of different colors above each line represent different seasons, with blue and red for the cold and warm seasons, respectively. Here, the first four different cloud phases refer to the case of single-layer clouds.).
Remotesensing 13 00363 g005
Figure 6. Four-year cloud radiation contribution of different cloud phases at the TOA, ATM, and SFC over the TP. ((a) TOA indicates the top of the atmosphere, (b) SFC indicates the surface, and (c) ATM indicates the interior of the atmosphere. Here, ice clouds, water clouds, and mixed-phase clouds refer to the case of single-layer clouds).
Remotesensing 13 00363 g006
Figure 7. Vertical distribution of net heating rate in different cloud phases ((a) represents the single-layer ice cloud, (b) represents the single-layer mixed cloud, (c) represents the single-layer warm water cloud, and (d) represents the single-layer supercooled water cloud).
Remotesensing 13 00363 g007
Figure 8. Vertical distribution of the net heating rate contribution from different cloud phases ((a) represents the cold season and (b) represents the warm season. Each season contains four different single-layer cloud phases and multilayered cloud).
Remotesensing 13 00363 g008
Figure 9. Precipitation frequency of the different cloud phases during the cold season (a1a4 represent ice, mixed-phase, warm water, supercooled water clouds, respectively).
Remotesensing 13 00363 g009
Figure 10. Precipitation frequency of the different cloud phases during the warm season (a1a4 represent ice, mixed-phase, warm water, supercooled water clouds, respectively).
Remotesensing 13 00363 g010
Table 1. Satellite information.
PlatformInstrumentSpecificationValues
CloudSatCPR λ 3200 μm
Attenuation of CloudsWeak
Scatter of Cloud particlesRayleigh/Mie scatter
CALIPSOCALIOP λ 0.532/1.06 μm
Attenuation of CloudsStrong
Scatter of Cloud particlesMie scatter
Table 2. Satellite products.
Data SetFromPrimary VariablesValues
2B-CLDCLASS-LIDARCloudSat/CALIPSOCloudlayer0–10
CloudPhase1–3
2B-FLXHR-LIDARCloudSat/CALIPSOQR−2 Kd−1–2 K d−1
TOACRE0–1500 W m−2
BOACRE0–1500 W m−2
2C-PRECIP-COLUMNCloudSatPrecip_flag0–9
ECMWF-AUXAN-ECMWFPressure~–999
Temperature~–999
Specific_humidity~–999
Publisher’s Note: MDPI stays neutral with regard to jurisdictional claims in published maps and institutional affiliations.

