Abstract
Different types of focal mechanism solutions for the 19 March 2021 Mw 5.7 Nakchu earthquake, Tibet, limit our understanding of this earthquake’s seismogenic mechanism and geodynamic process. In this study, the coseismic deformation field was determined and the geometric parameters of the seismogenic fault were inverted via Interferometric Synthetic Aperture Radar (InSAR) processing of Sentinel-1 data. The inversion results show that the focal mechanism solutions of the Nakchu earthquake are 237°/69°/−70° (strike/dip/rake), indicating that the seismogenic fault is a NEE-trending, NW-dipping fault dominated by the normal faulting with minor sinistral strike-slip components. The regional tectonic stress field derived from the in-situ stress measurements shows that the orientation of maximum principal compressive stress around the epicenter of the Nakchu earthquake is NNE, subparallel to the fault strike, which controlled the dominant normal faulting. The occurrence of seven M ≥ 7.0 historical earthquakes since the M 7.0 Shenza earthquake in 1934 caused a stress increase of 1.16 × 10⁵ Pa at the hypocenter, which significantly advanced the occurrence of the Nakchu earthquake. Based on a comprehensive analysis of stress fields and focal mechanisms of the Nakchu earthquake, we propose that the dominated normal faulting occurs to accommodate the NE-trending compression of the Indian Plate to the Eurasian Plate and the strong historical earthquakes hastened the process. These results provide a theoretical basis for understanding the geometry and mechanics of the seismogenic fault that produced the Nakchu earthquake.
1. Introduction
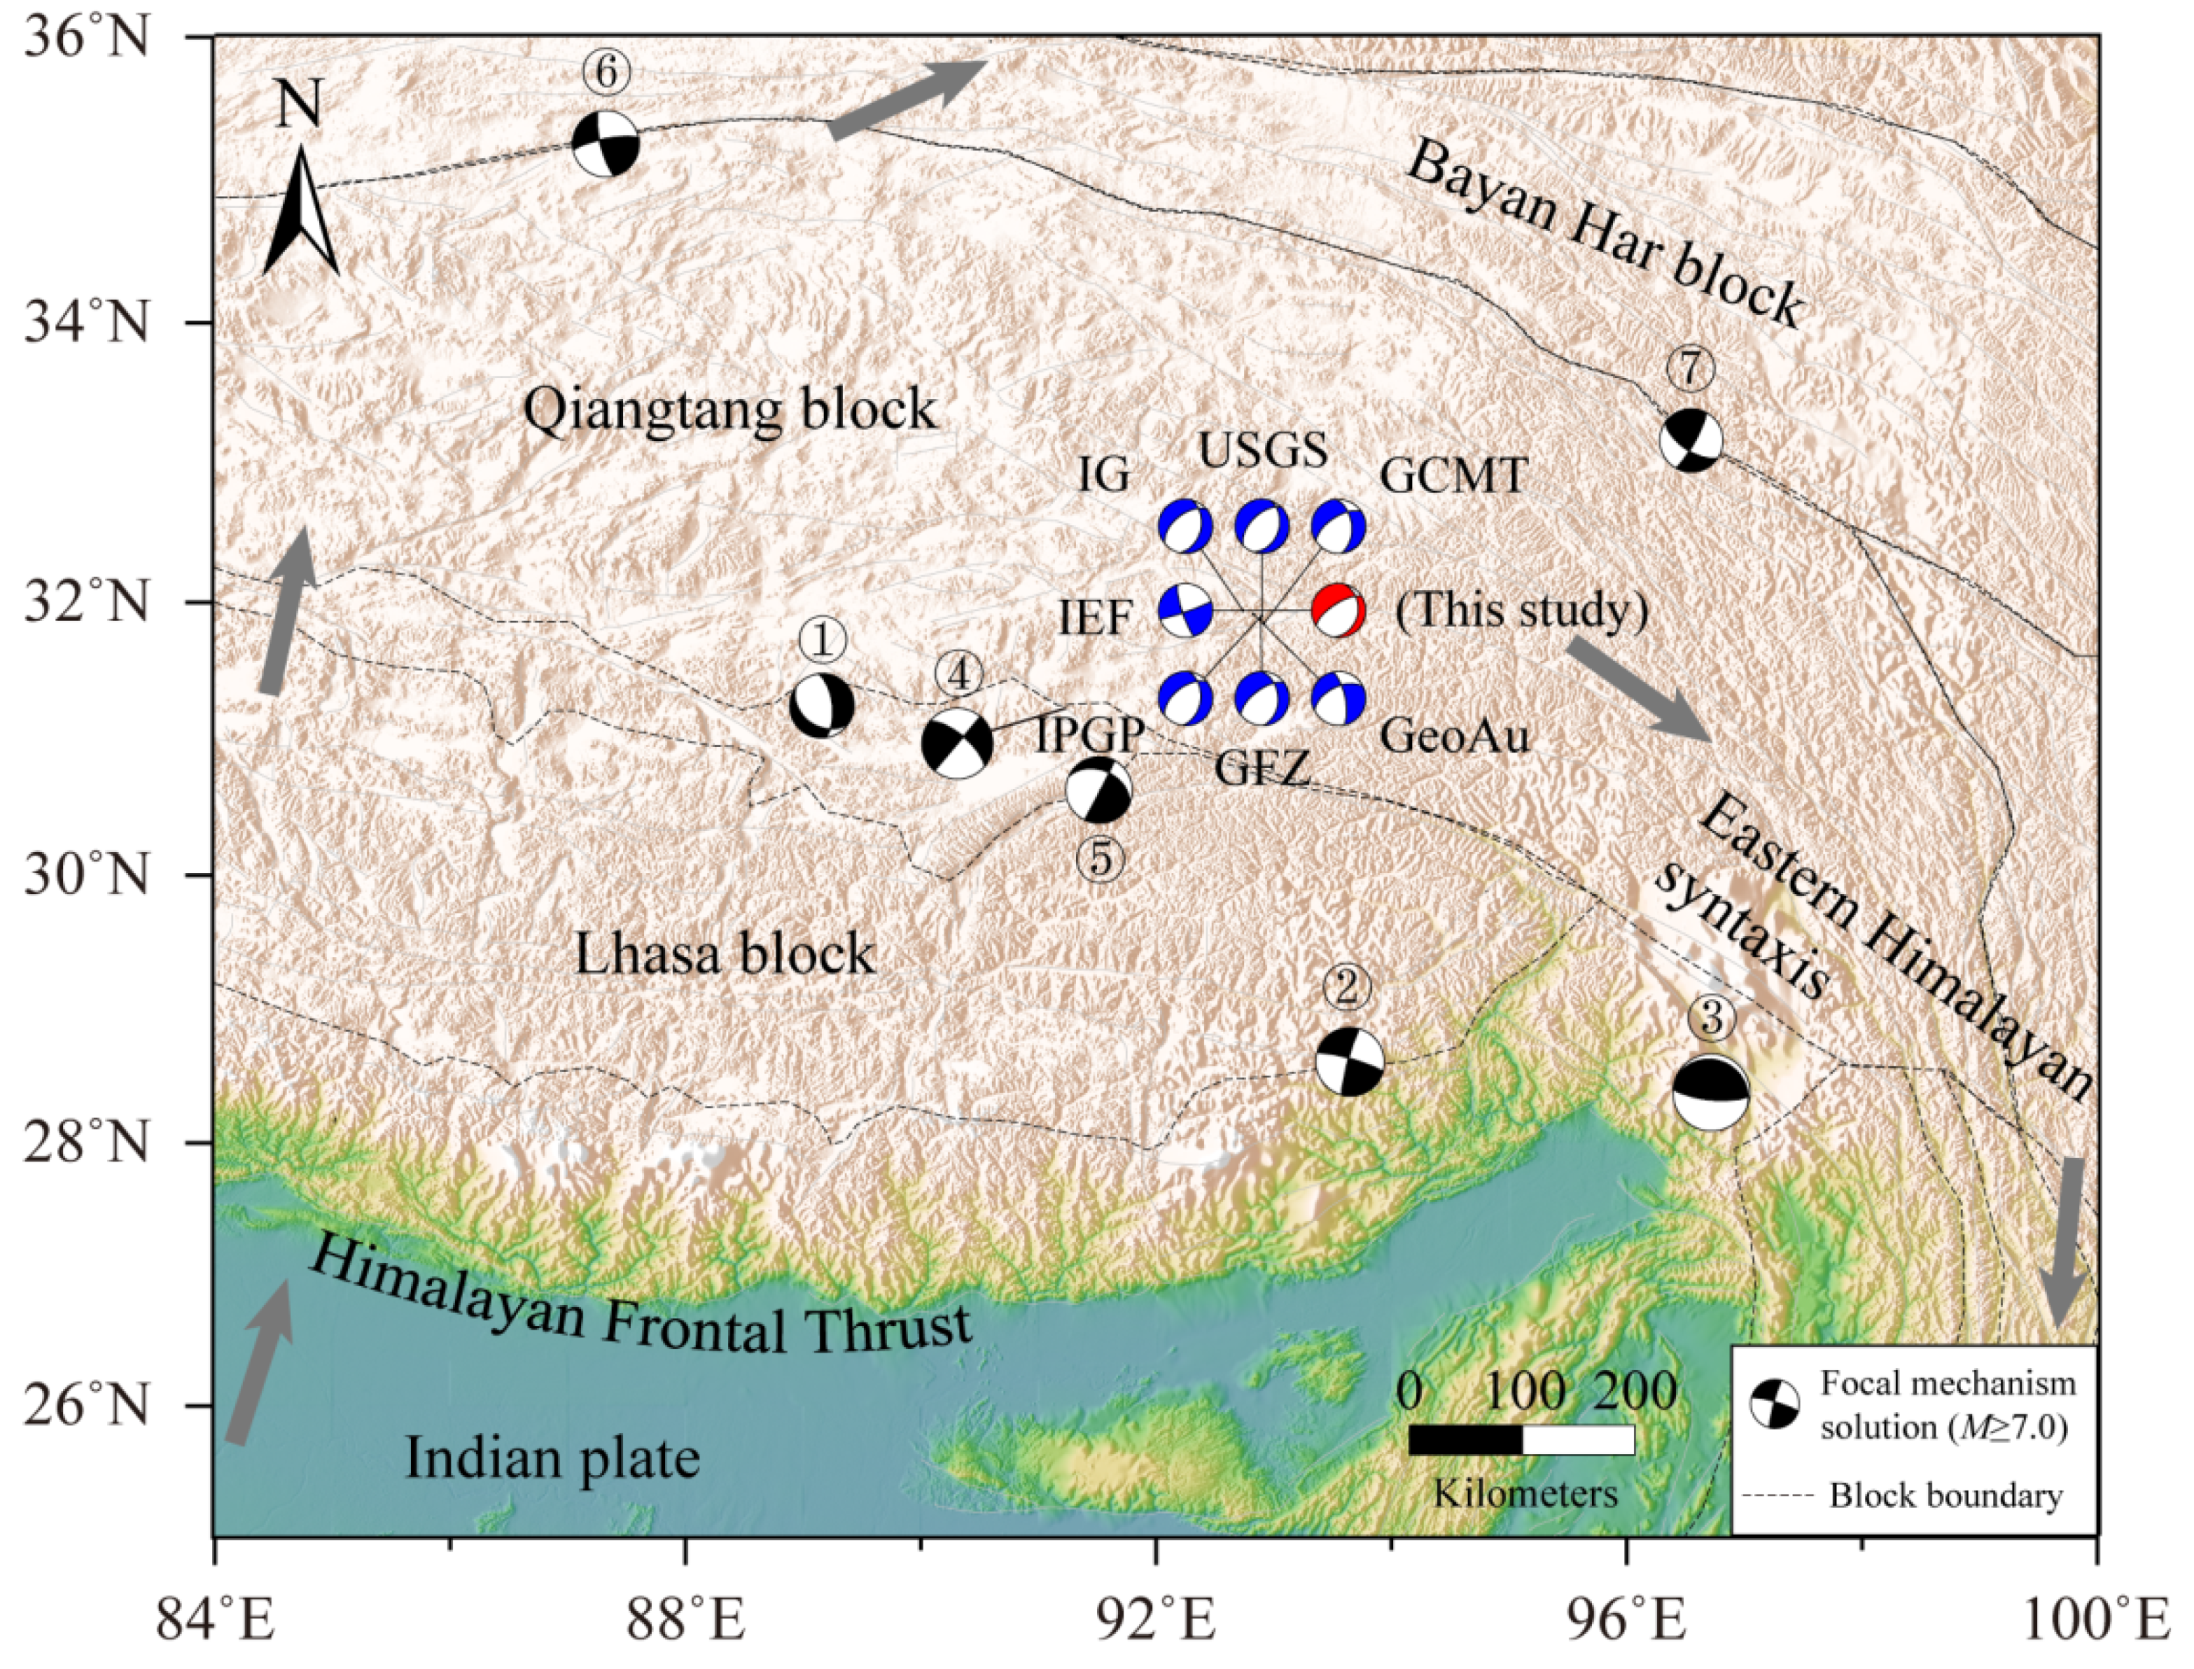
On 19 March 2021, the Mw 5.7 Nakchu earthquake (92.74° E, 31.94° N) occurred in the eastern part of the Qiangtang Block in the interior of the Tibetan Plateau (Figure 1). After the earthquake, based on seismic data from the local seismic network or teleseismic data from the global seismic network, seven groups reported focal mechanism solutions (strike/dip/rake) for the earthquake (Table 1). The results show that the solutions provided by IEF and GeoAu suggest the dominant sinistral strike-slip motion, while the others indicate that this event is dominated by normal faulting with minor sinistral strike-slip components, in which the strike is predominant NEE-trending, the dip angle ranges 55–64°, and the rake angle is larger than 47°. These different focal mechanisms severely limit our understanding of the seismogenic mechanism and geodynamic processes of the earthquake. Interferometric Synthetic Aperture Radar (InSAR) observations offer a critical tool for studying the characteristics of crustal deformation [1,2,3,4]. Further, the coseismic displacement fields provided by such data are widely used to constrain fault geometry parameters and for the inversion of rupture models [5,6,7,8,9,10,11].

Figure 1.
Regional tectonic setting and strong historical earthquakes. The blue and black beach balls represent the focal mechanism solutions of the Nakchu earthquake from different groups and the surrounding historical M ≥ 7.0 strong earthquakes, respectively. The gray arrow indicates the motion directions of the Indian plate and Tibetan plateau [12].

Table 1.
Different focal mechanism solutions of the Nakchu earthquake.
The fault type is closely related to the regional tectonic stress regime [13,14,15,16,17,18]. The modeled principal stress field in Yutian, Xinjiang, explained the patterns of two different types of strong Yutian earthquakes [19]. The spatial differences of the modeled stress fields in the Sichuan−Yunnan region well explained the variability of the strong earthquake activity [20]. The World Stress Map project integrated various types of in-situ stress data to create a global stress field regime [13], which provided a basis for understanding the mechanics of strong earthquakes in different tectonic settings.
The occurrence of earthquakes is controlled by the regional tectonic stress field [21] and related to stress transfer caused by surrounding earthquakes [22,23,24]. Coulomb stress change (ΔCFS) provides insights into the mechanism of interactions between strong earthquakes [25,26,27,28] but is constrained by the fault geometry parameters [29,30,31]. Historically, there experienced strong seismic activity in the vicinity of the Nakchu earthquake, including the M 7.2 Shenza earthquake in 1934, the M 8.7 Assam earthquake in 1950, and the geographically closest M 8.0 Bengcuo earthquake in 1951, as well as the M 7.5 northern Damxung earthquake in 1952 [32,33,34]. It is worthwhile to analyze the impact of the occurrences of these strong historical earthquakes on the Nakchu earthquake.
To address the questions mentioned above, we used the coseismic deformation field data obtained by InSAR to invert the seismogenic fault geometry of the Nakchu earthquake. Then, we employed in-situ stress data to analyze the tectonic stress field around the epicenter through data smoothing and calculated the ΔCFS at the hypocenter of the Nakchu earthquake by integrating the coseismic dislocation and postseismic viscoelastic relaxation effects of the surrounding strong historical earthquakes. Furthermore, we investigated the seismogenic background and dynamic mechanism of the Nakchu earthquake.
2. Materials and Methods
2.1. Synthetic Aperture Radar and Stress Data
In this study, based on the Sentinel-1 satellite descending data of orbit number 77 (7–19 March 2021) and the ascending data of orbit number 143 (12–24 March 2021) from the European Space Agency (ESA), the coseismic deformation field of the Nakchu earthquake was obtained by using the Sentinel-1 SAR-based coseismic deformation monitoring system [35]. The system was designed for the rapid geodetic imaging of global earthquakes using the Sentinel-1 constellation and will periodically query for the USGS website to determine the time, location, depth, and magnitude of each moderate–strong earthquake. Once the occurrence of the earthquake may produce significant deformation, the system will automatically search and download the coseismic SAR data from the ESA Hub and then produce the coseismic interferogram.
The source parameter of the Nakchu earthquake was inversed using the particle swarm optimization (PSO) algorithm with the coseismic deformation field as a constraint [1,5]. We used the PSOKINV geodetic inversion package software to solve an inverse problem to determine fault parameters from geodetic measurements, which can be defined as,
where m denotes fault parameters, and d geodetic measurements. The software is generally implemented using a two-step approach: (i) Applying the particle swarm optimization to determine the fault geometry by minimizing the square misfit under an assumption of a uniform slip on a rectangular fault; (ii) Estimating the slip distribution on an extended fault plane with linear inversion techniques [36].
d = f(m) + ϵ
Five types of stress data, including the methods of overcoring, borehole breakouts, drilling-induced fracture, geological indicator, and focal mechanism solutions, were collected from the Fundamental Database of Crustal Stress Environment in Continental China. The quality of these stress data was rated according to the standards of the World Stress Map [13], and the grade A–C stress data were selected as having a reliable quality. Different quality weight coefficients (1.0 for grade A, 0.75 for grade B, and 0.5 for grade C) were assigned based on the quality of the data, before smoothing and analysis of the stress orientation were carried out [37,38]. The specific smoothing and analysis method is described in [15].
2.2. Coulomb Stress Change Calculation
Coulomb stress change (ΔCFS) is expressed as follows [25],
where Δτ is the shear stress change on the fault plane, positive in the fault slip direction; Δσn is the normal stress change on the fault plane, positive for the fault unclamping; μ′ is the effective friction coefficient. Positive ΔCFS benefits the occurrence of succeeding earthquakes.
The effective friction coefficient μ′ is assumed to be 0.4 [25]. The elastic dislocation model was employed to calculate the coseismic Coulomb stress change, while the Burgers body was used to simulate the viscoelastic rheological properties of the lower crust and the upper mantle [39,40,41,42]. The PSGRN/PSCMP code, based on a stratified viscoelastic model [43], was used to calculate the stress changes by integrating the coseismic dislocations and postseismic viscoelastic relaxation effects of the strong earthquakes.
2.2.1. Viscoelastic Stratified Model
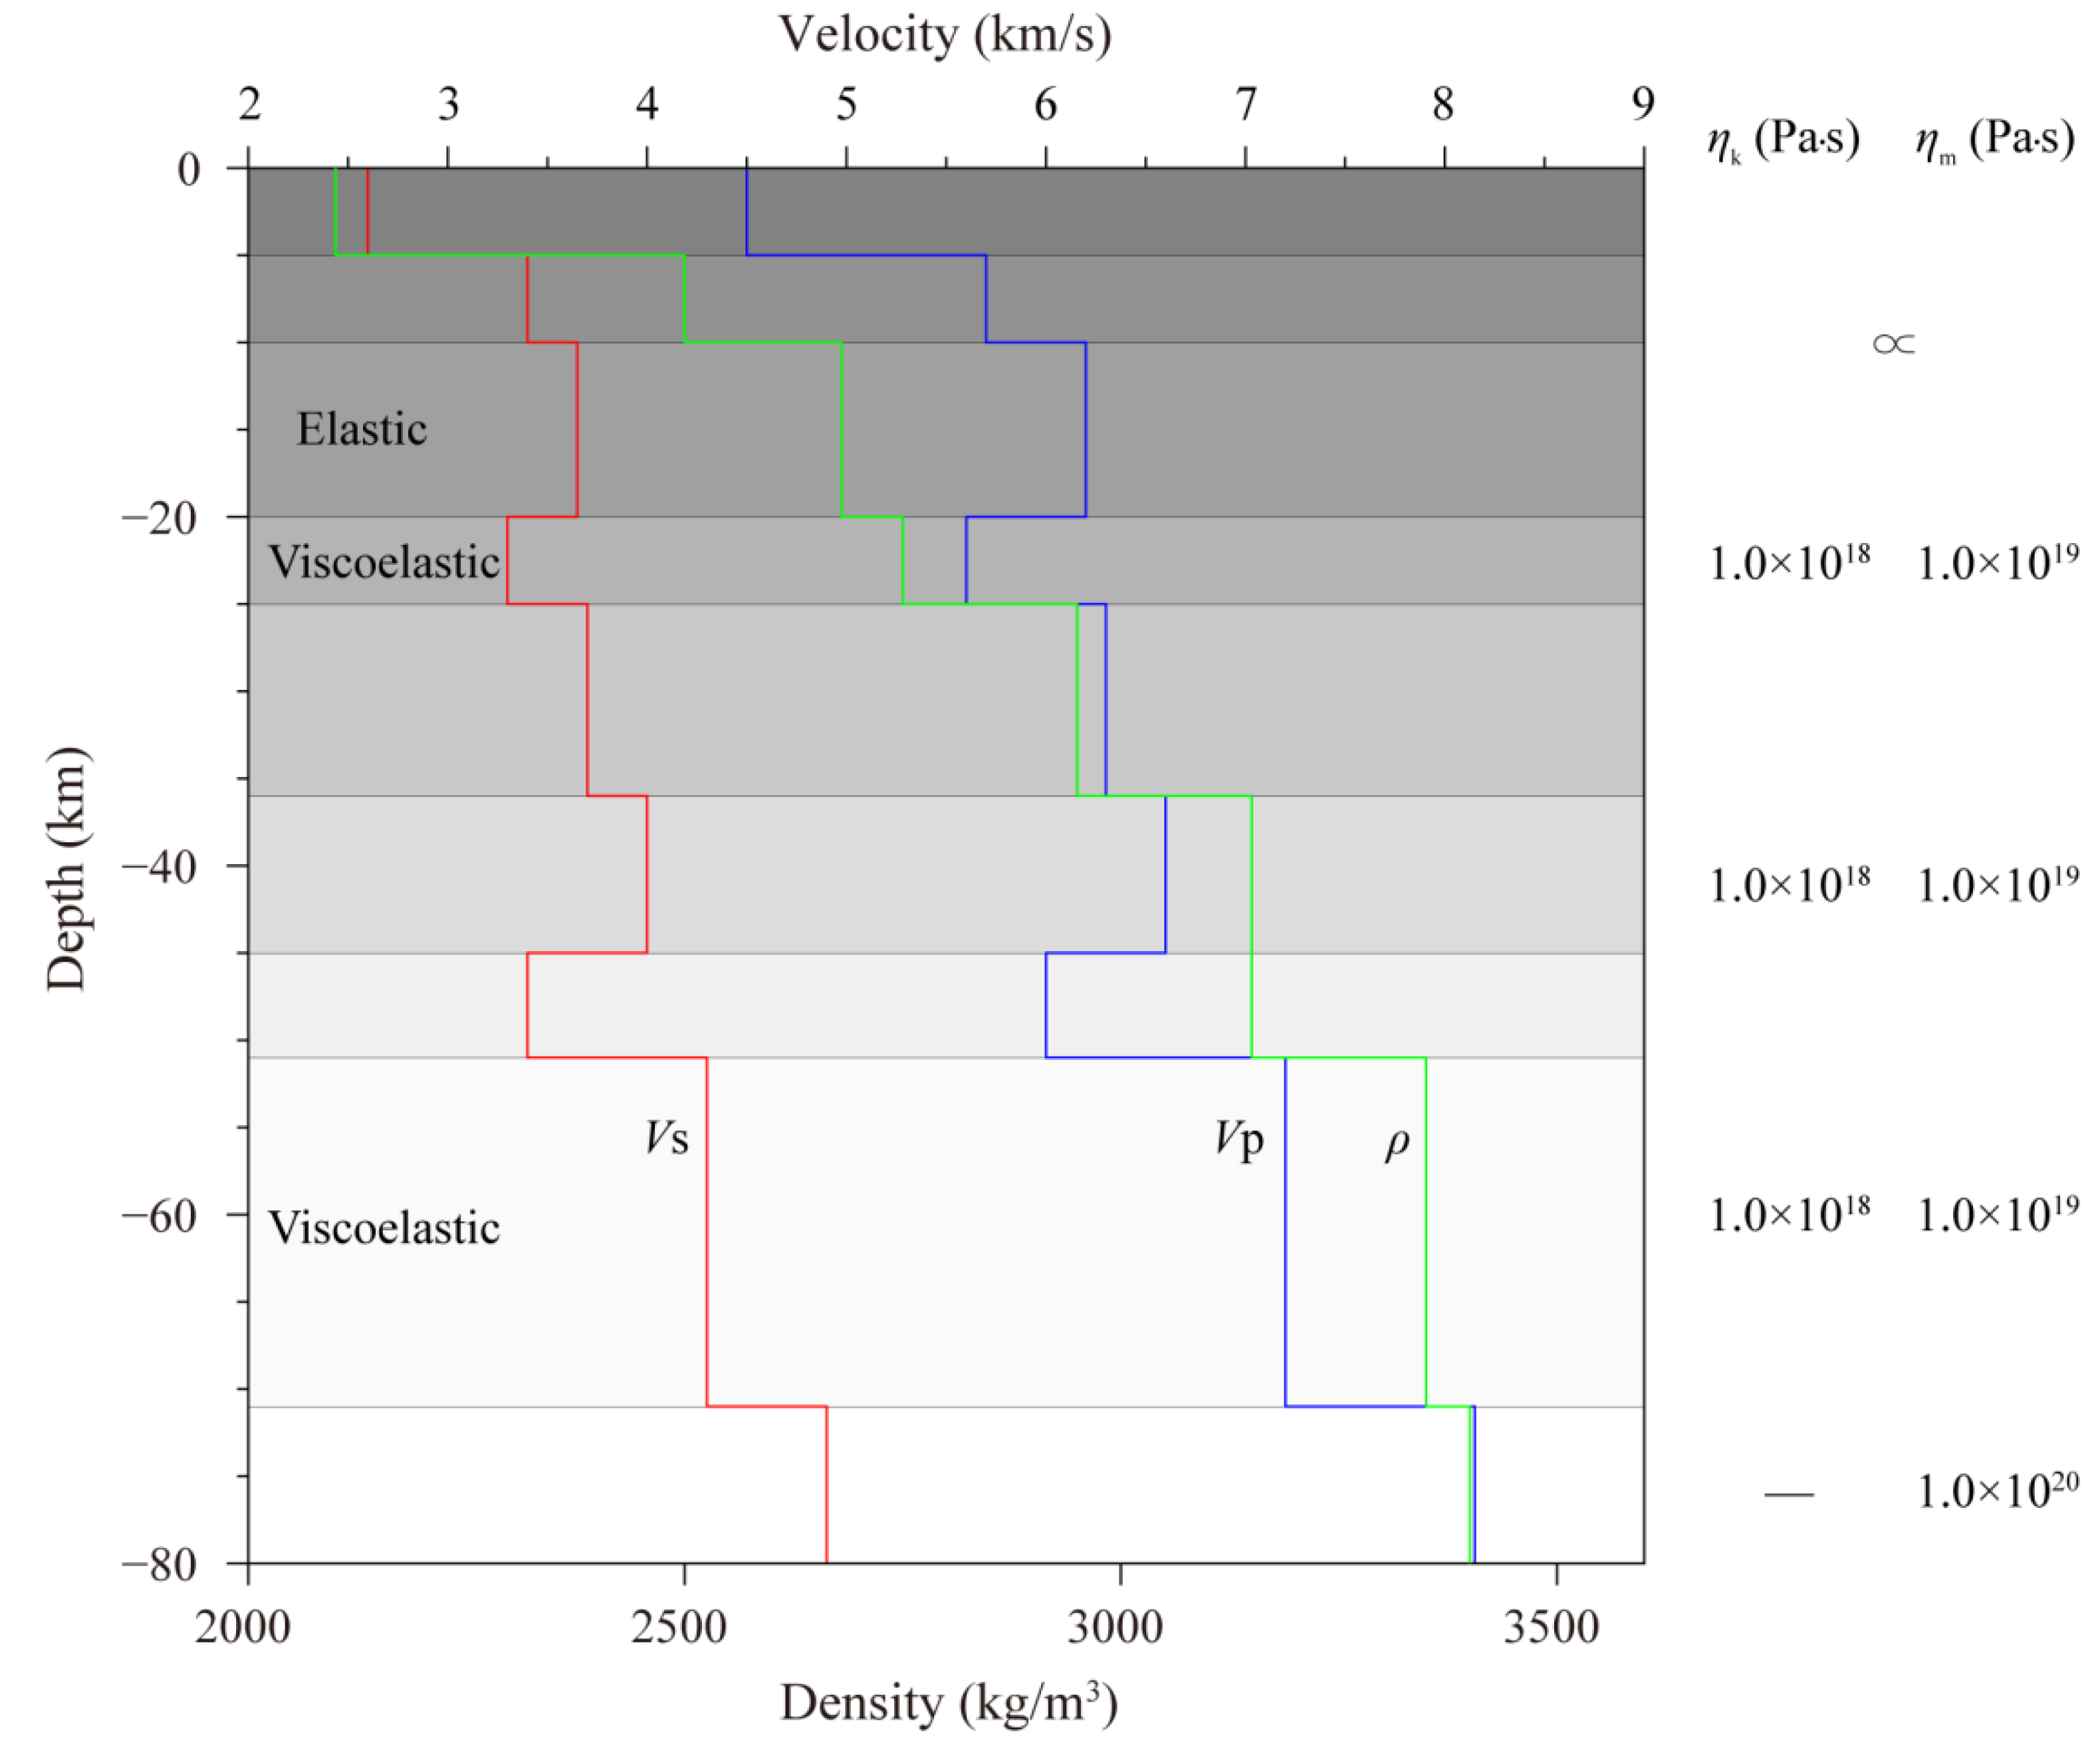
Based on the velocity structure of the crustal and upper mantle in the Tibetan Plateau [44] and rheological properties of the lower crust and mantle lithosphere around this region [45,46], we determined the parameters in the viscoelastic stratified model, as shown in Figure 2.
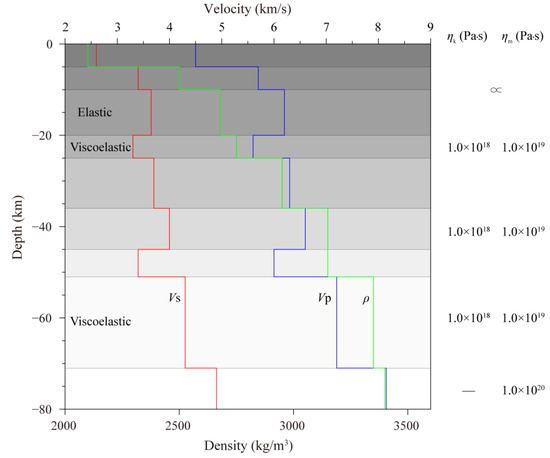
Figure 2.
Parameters in the stratified viscoelastic relaxation model. Vp indicates the P wave velocity, Vs the S wave velocity, and ρ the density; ηk and ηm represent the viscosity of the dashpots in the Kelvin material and the Maxwell material, respectively.
2.2.2. Rupture Source Model
According to previous results of the geological investigations, source rupture process inversion, and geodetic deformation inversion [32,33,34,47,48,49,50], the source parameters and rupture model parameters of the seven M ≥ 7.0 strong historical earthquakes that occurred close to the epicenter of the Nakchu earthquake were determined. The rupture length and slip of the M 7.7 Langxian earthquake in 1947 were derived from the empirical equations due to the lack of direct observations and inversion results [51]. The detailed parameters are shown in Table 2.
Table 2.
Source rupture model parameters of strong historical earthquakes.
3. Results
3.1. Fault Geometry and Slip Distribution
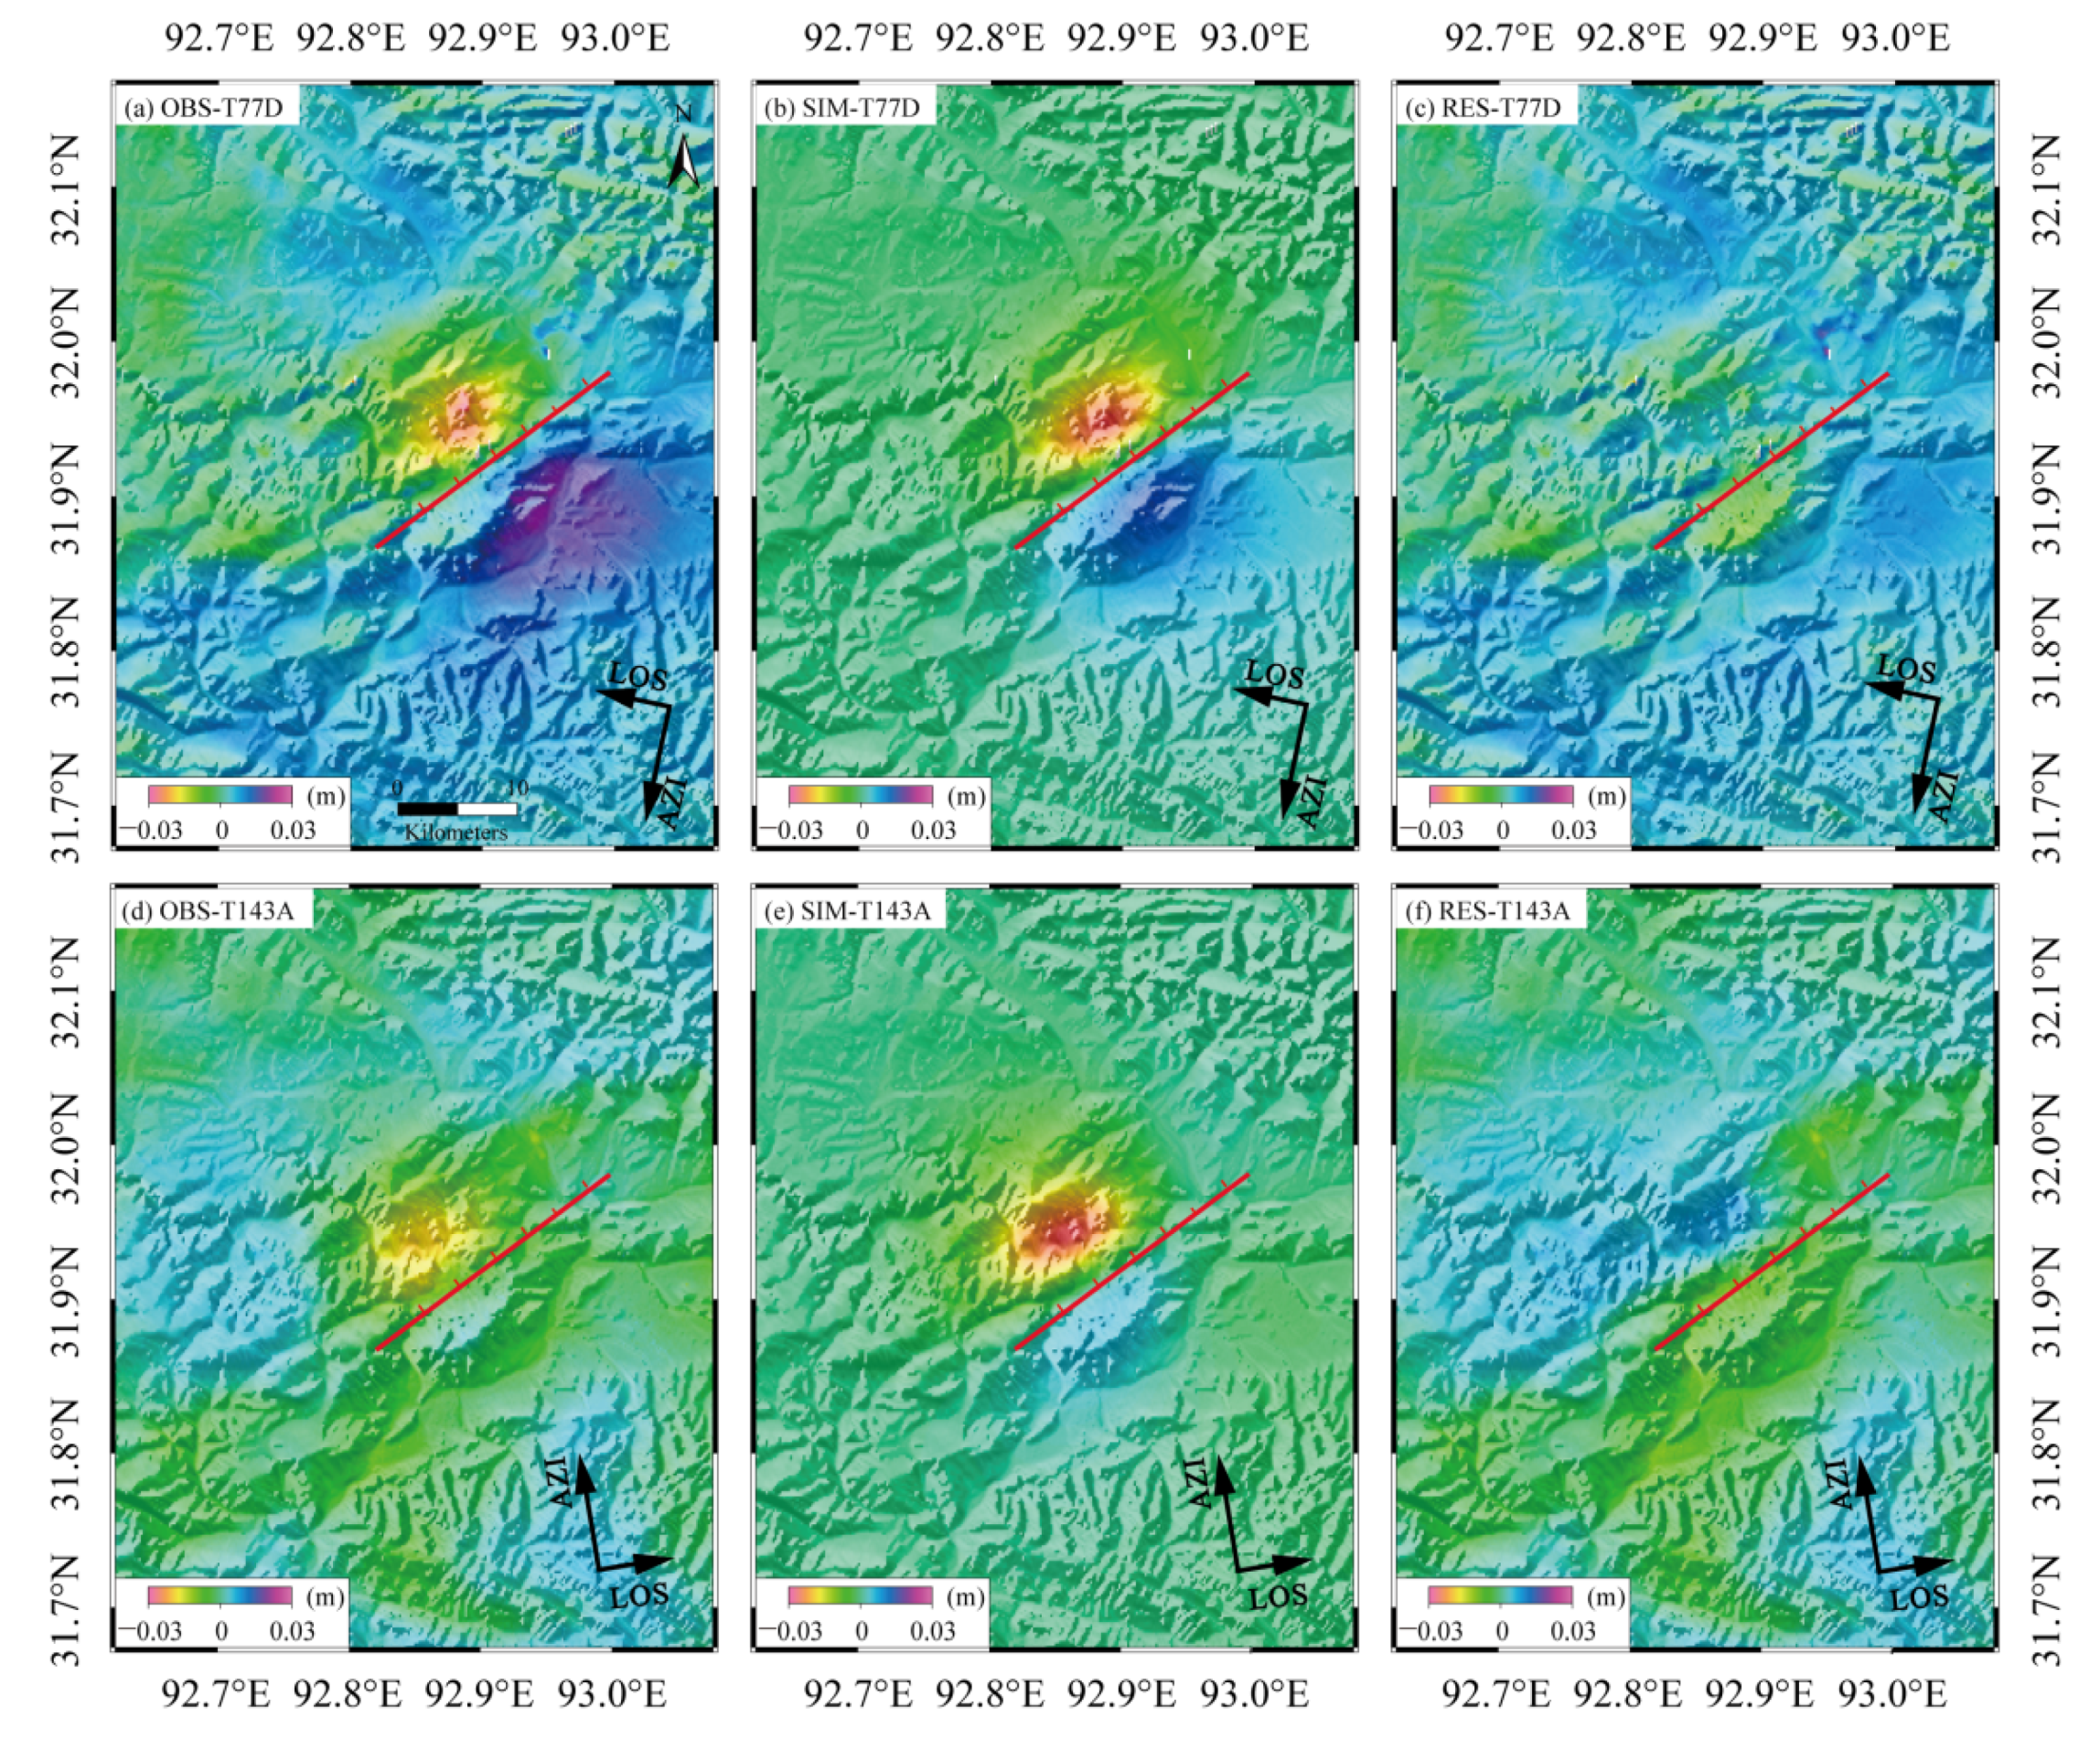
The coseismic deformation field based on the Sentinel-1 satellite data shows that the coseismic deformation interferogram can clearly describe the deformation field’s spatial coverage and deformation intensity (Figure 3). As can be seen from the comparison of the ascending and descending interferograms, the InSAR deformation fields have the same spatial distributions, and they all have a significant subsidence deformation region, with the maximum deformation occurring in the line of sight (LOS) direction in the meizoseismal areas of the descending and ascending data, i.e., approximately 20 mm (Figure 3a) and 25 mm (Figure 3d), respectively. In terms of the residuals between the simulated displacement field using the best-fit parameters based on the focal mechanism solution (Figure 3b) and the actual observations, the T77 descending data simulates the coseismic deformation field well (Figure 3c). This is mainly because the postseismic image acquisition time was very close to the earthquake time, so it is concluded that the deformation signal was mainly caused by the coseismic effect. In comparison, the T143 ascending data were acquired five days after the earthquake, and the residuals are slightly larger, probably because there is a certain component of rapid postseismic deformation in the deformation signal (Figure 3f). The residuals from these two tracks were also expected to provide independent evidence for identifying the optimal model of the mainshock.
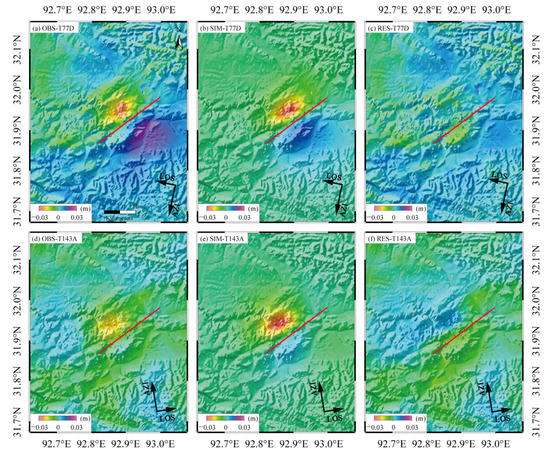
Figure 3.
The observed, modeled, and residual interferograms for the InSAR models. (a,d) are the observed coseismic interferograms of the descending and ascending tracks, respectively; (b,e) are the corresponding modeled data; (c,f) are the residuals. In (a–f), the red line shows the surface trace of the rupture fault plane.
To verify the reliability of the model, the correlation was used to show agreement between the observed and modeled InSAR LOS changes. The results show that the correlation between them exceeds 0.92. Figure 4 shows the optimal slip distribution based on the inversion of the ascending and descending coseismic deformation fields. We can find that the Nakchu earthquake ruptured fault for about 25 km in length, and the slip mainly occurred at depths from 2 to 12 km, with a maximum slip of approximately 0.3 m at a depth of 7 km. The parameters of focal mechanism solution are 237°, 69°, and −70° (strike/dip/rake), respectively, indicating that the Nakchu earthquake occurred on an NNE-trending, NW-dipping fault that is dominated by normal faulting with the minor sinistral strike-slip components.
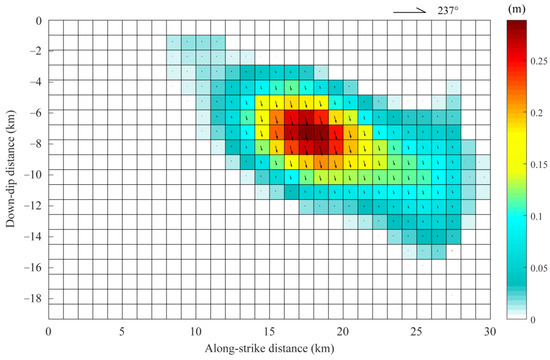
Figure 4.
Fault slip model derived from the InSAR datasets.
3.2. Tectonic Stress Field
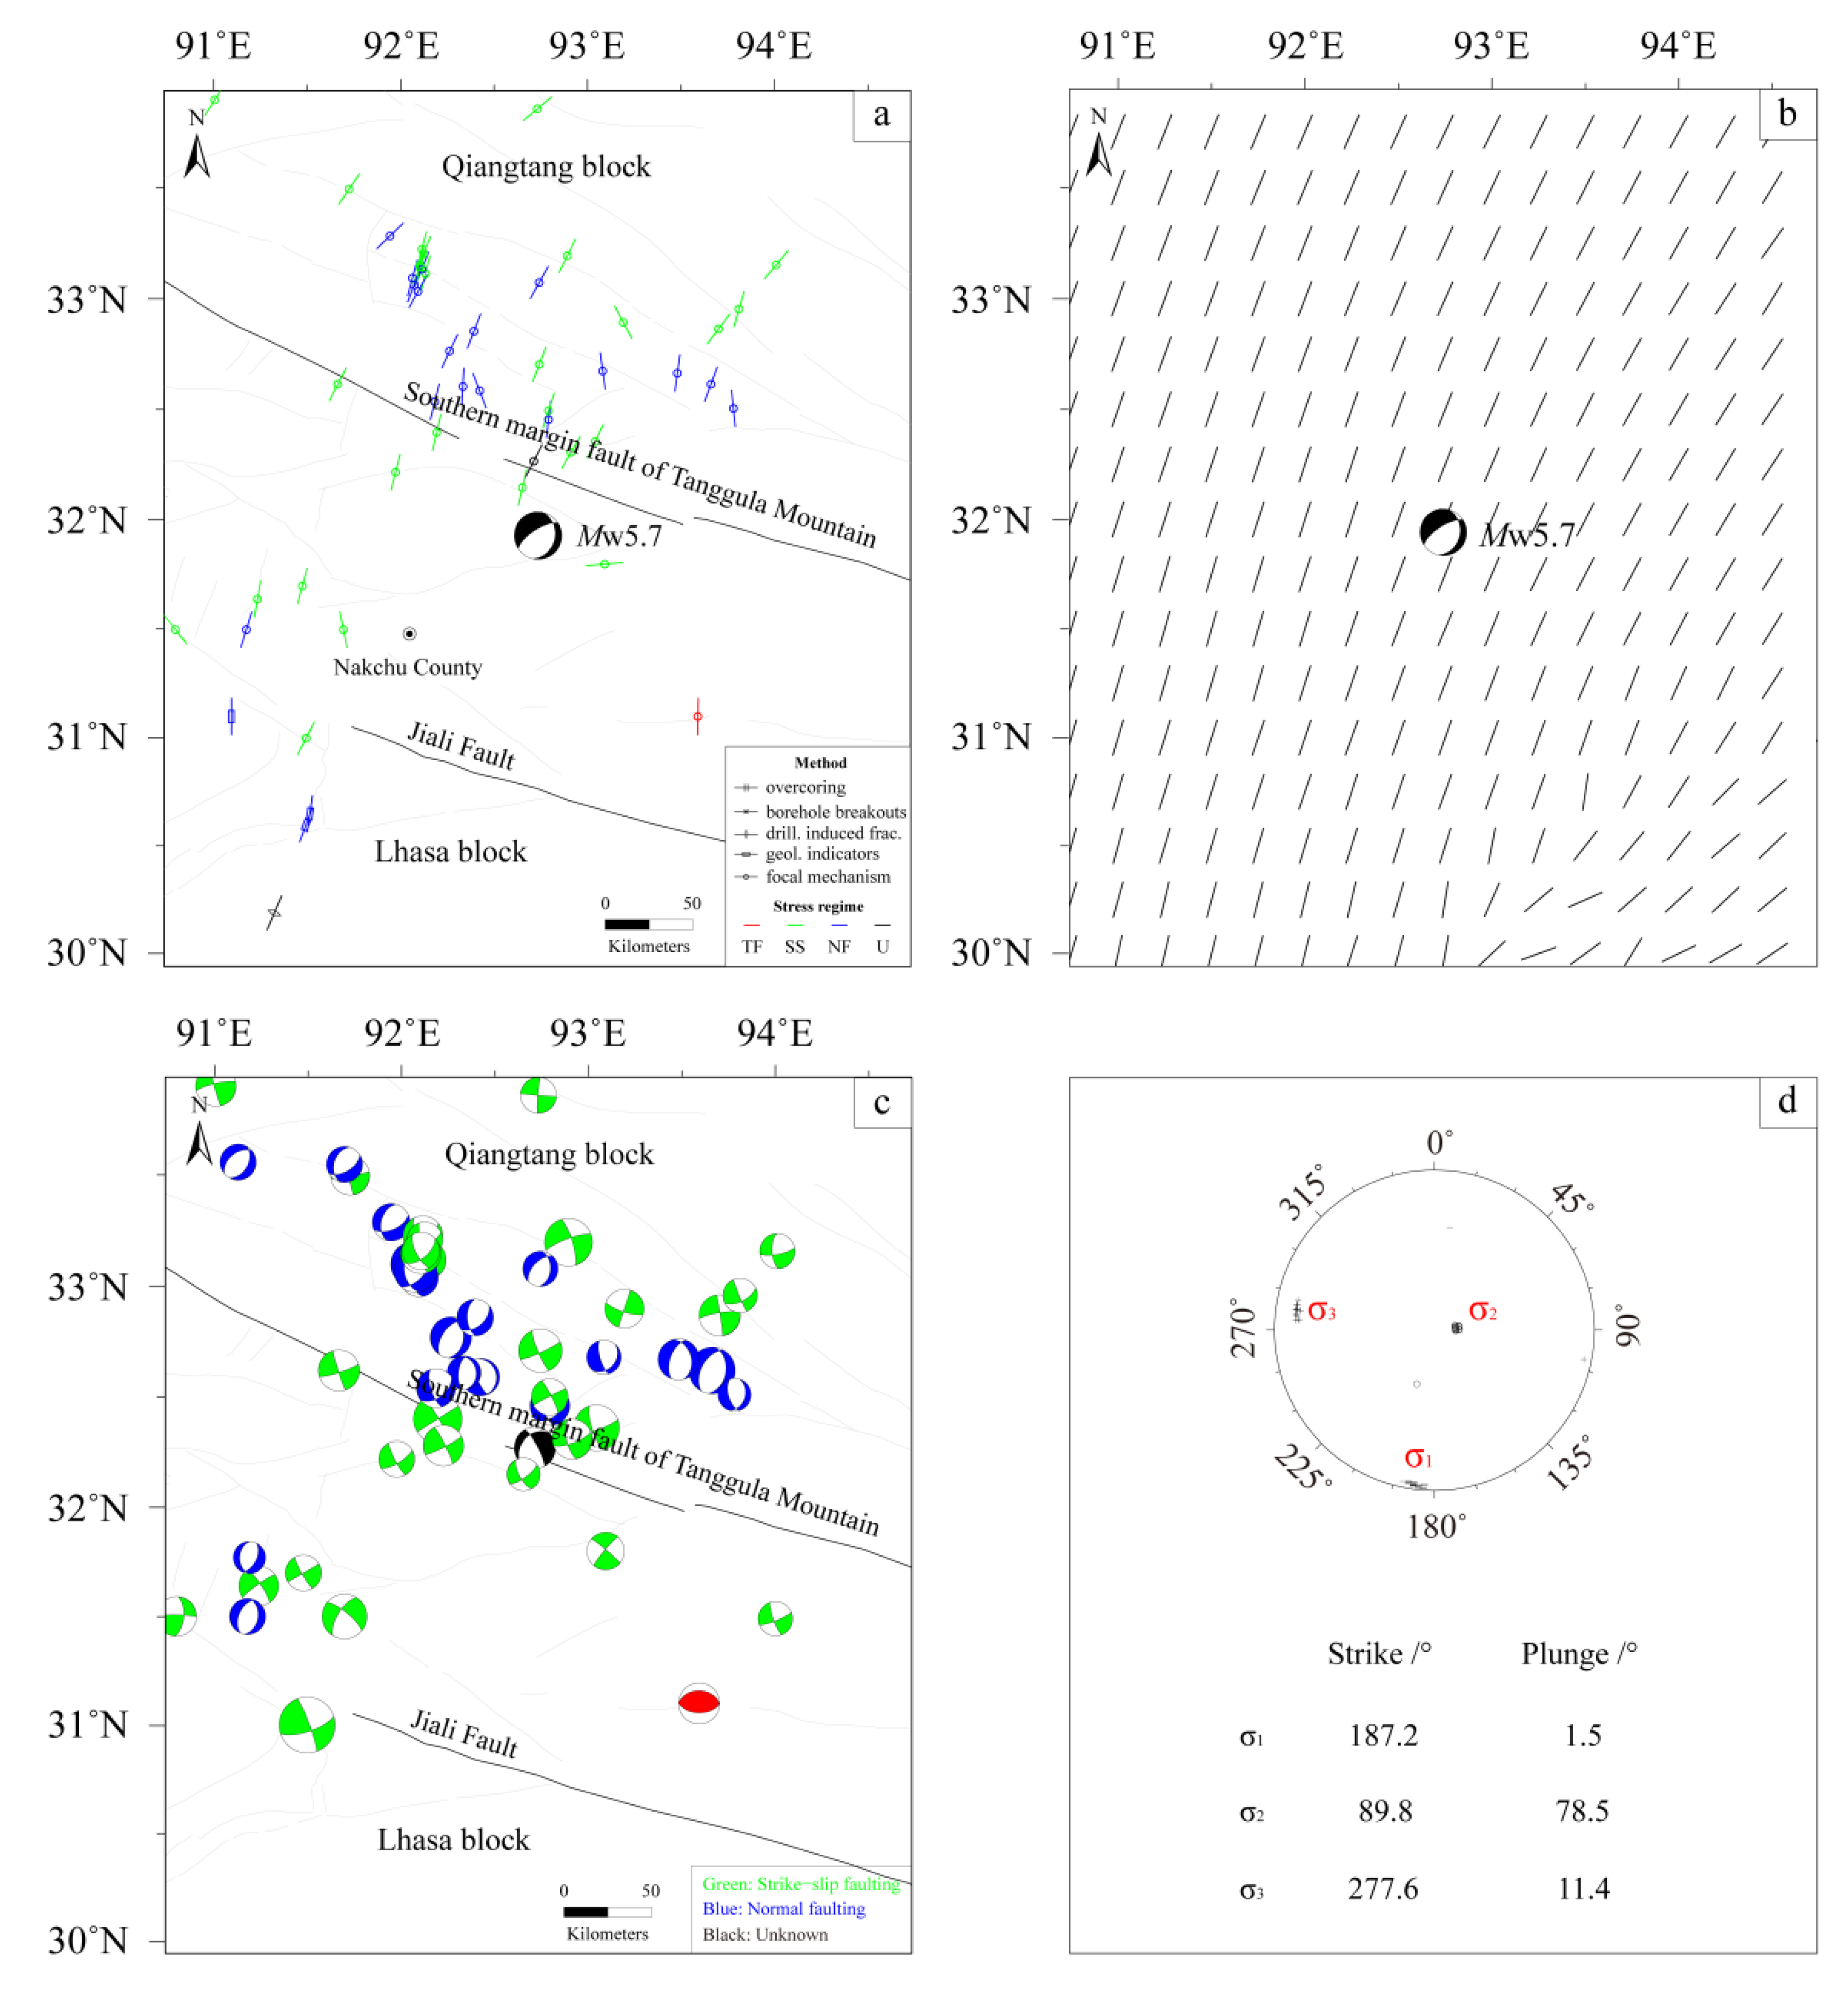
Figure 5a shows the collected stress data surrounding the epicenter and the smoothed result of the horizontal maximum principal stress orientation considering the data quality and distance weighting (Figure 5b). The results demonstrate that both the in-situ stress data and the smoothed results of the combined data show the NNE–SSW orientation of the horizontal maximum principal compressive stress in the region. In addition, the tectonic stress fields that are inverted by calculating the comprehensive solution using the collected focal mechanism solution data for the 51 M ≥ 4.3 historical earthquakes also indicate that the orientation of the maximum principal compressive stress in this region is NNE–SSW (Figure 5c,d). With these stress fields, the seismogenic fault with geometric parameters of 237°/69°/−70° (strike/dip/rake) is characterized by the dominant normal slip.
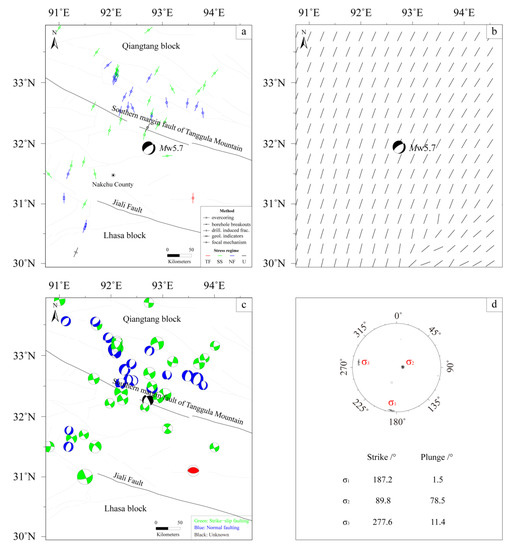
Figure 5.
Tectonic stress fields around the epicenter of the Nakchu earthquake. Panels (a,b) represent stress data around the epicenter and the orientation of the horizontal maximum principal stress after smoothing, respectively; Panels (c,d) represent the focal mechanism solutions of historical earthquakes (M ≥ 4.3) and the inversed regional principal stress, respectively.
3.3. Coulomb Stress Change at the Hypocenter of the Nakchu Earthquake
Based on the coseismic dislocation model of the strong earthquakes and the stratified lithosphere model, we employed the PSGRN/PSCMP code to calculate the stress tensors caused by the coseismic dislocation and postseismic viscoelastic relaxation effects and projected the stress tensors onto the nodal plane of focal mechanism solution (strike/dip/rake: 237°/69°/−70°) from the inversion of the InSAR data, then finally analyze the Coulomb stress change at the hypocenter.
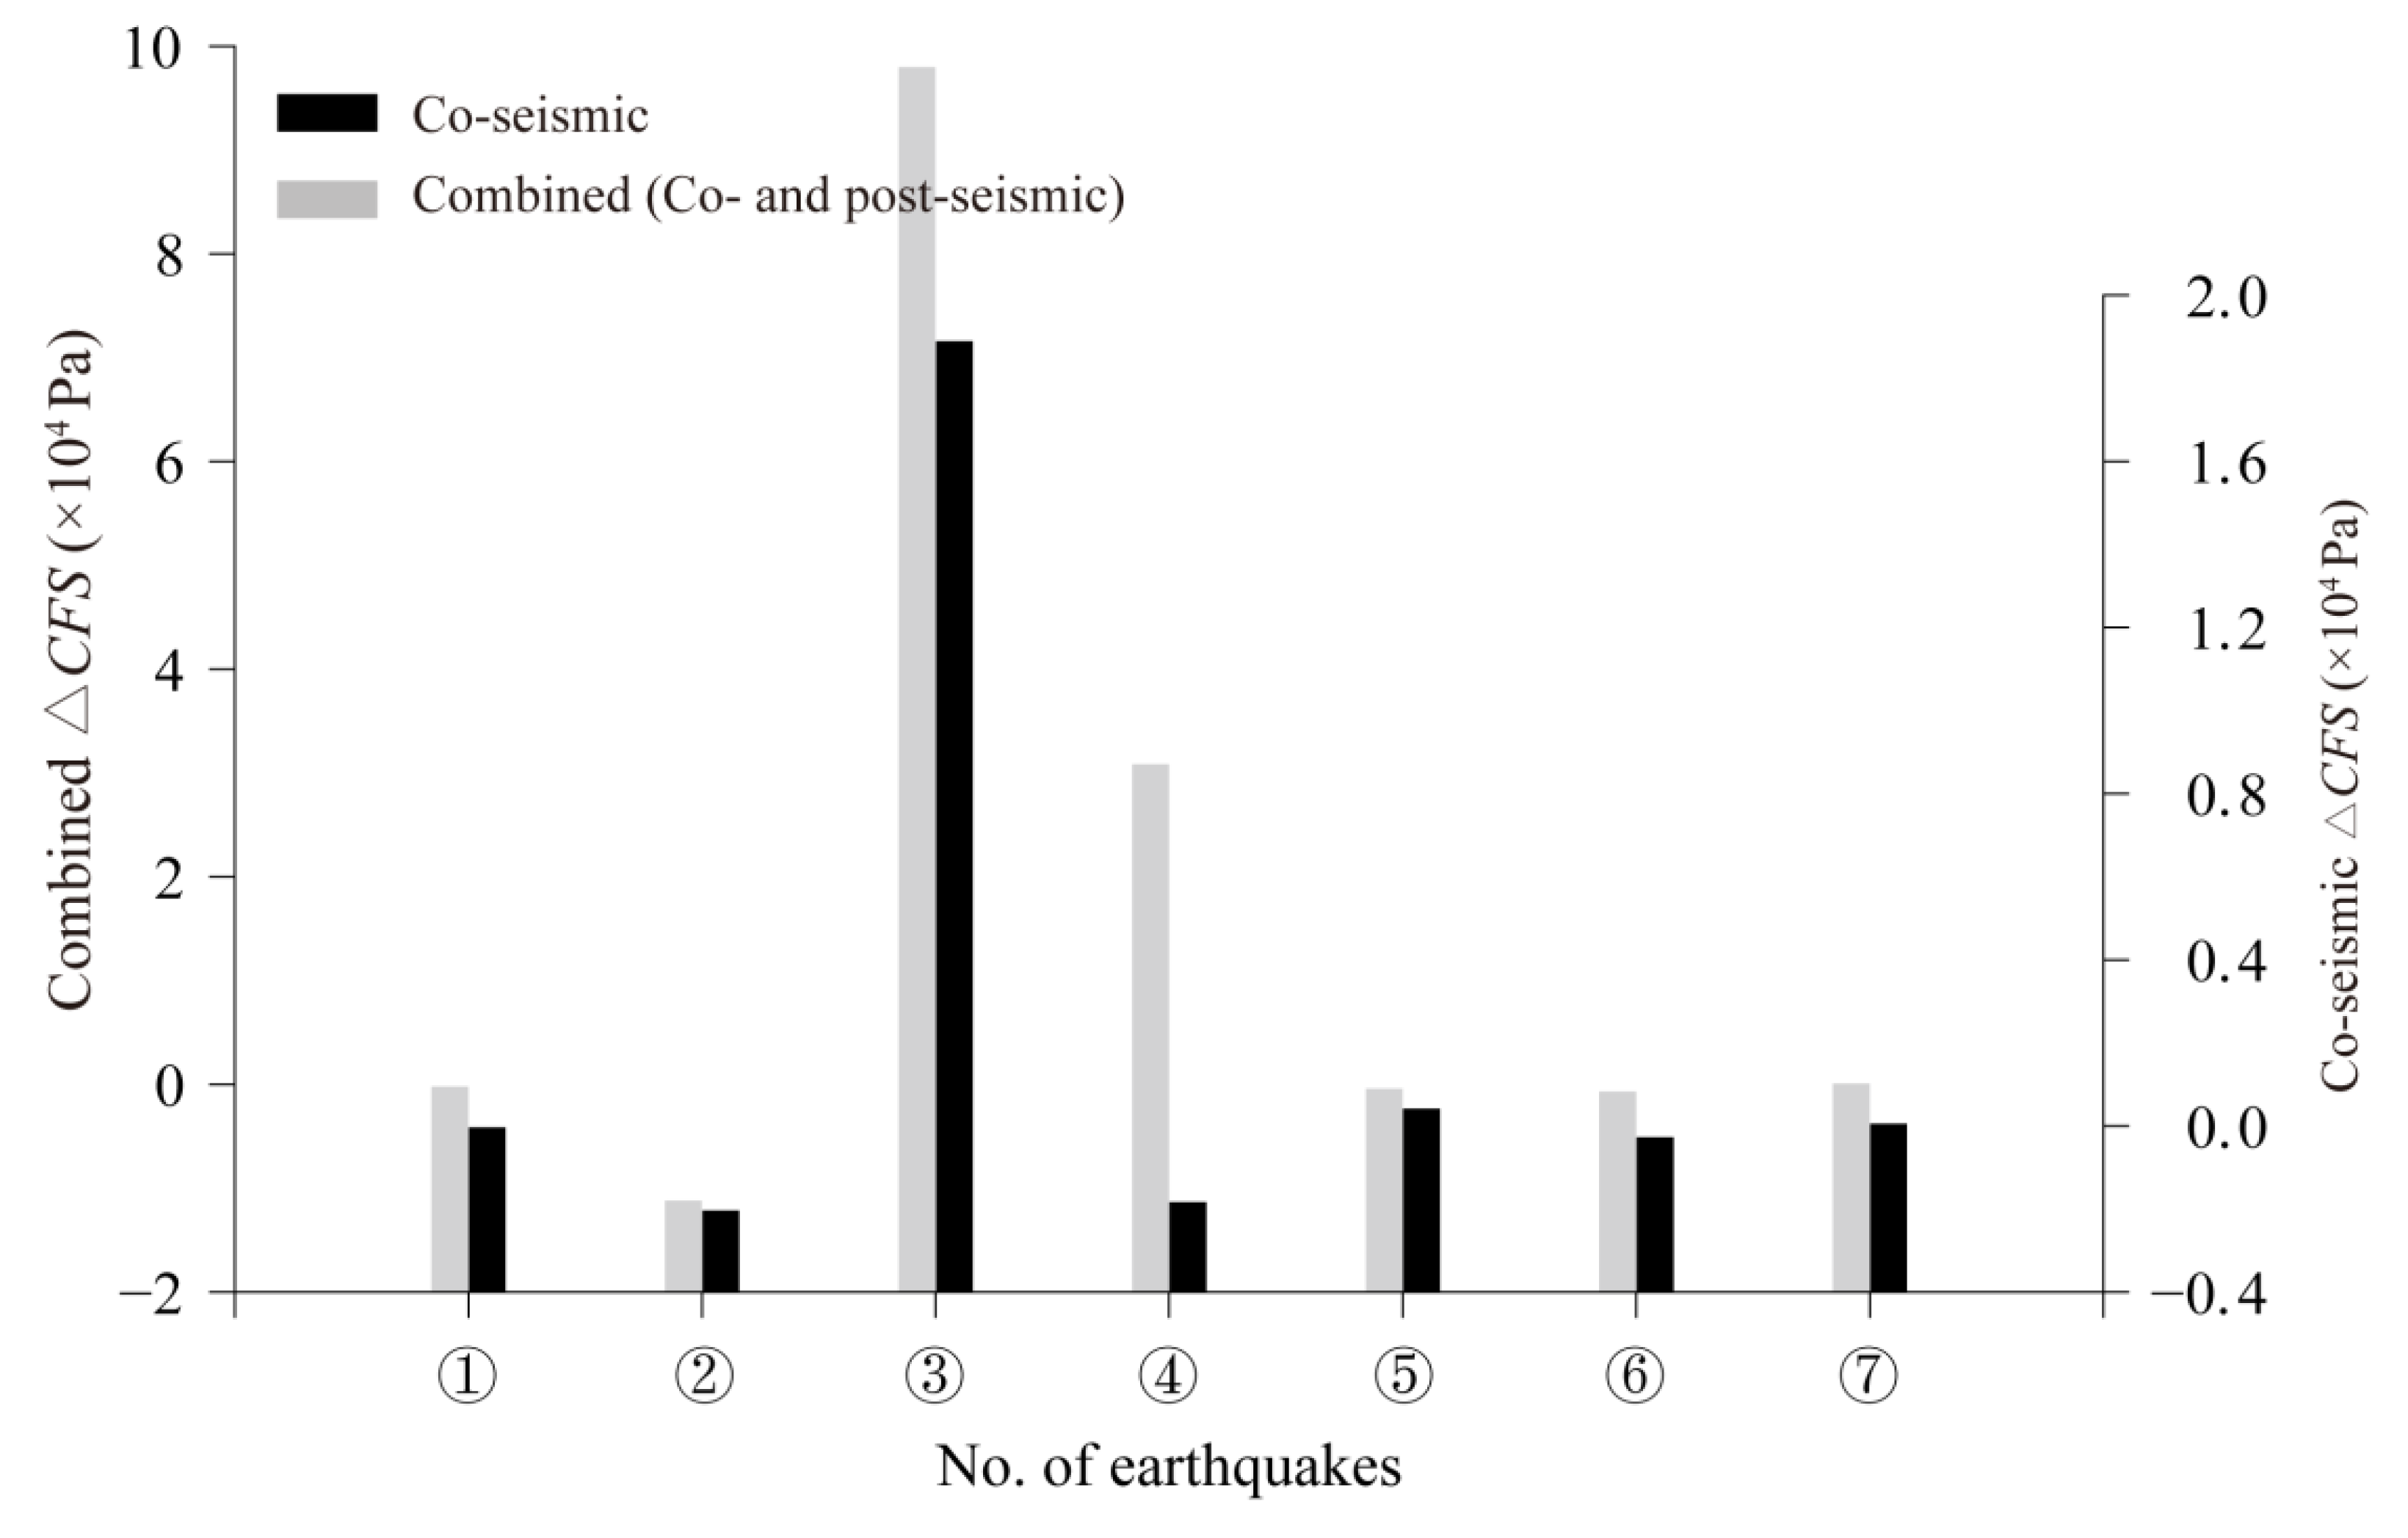
The results show that before the M 8.7 Assam earthquake in 1950, the M 7.0 Shenza and the M 7.7 Lang County earthquakes cast the stress shadow and caused the cumulative combined (co- and post-seismic) ΔCFS at the hypocenter of the Nakchu earthquake to decrease by 1.14 × 10⁴ Pa (Figure 6). However, the occurrence of the M 8.7 Assam earthquake caused a significant coseismic and combined stress increase of 1.89 × 10⁴ Pa and 0.98 × 10⁵ Pa, respectively. The M 7.5 northern Damxung earthquake in 1952 caused a coseismic stress increase of 0.42 × 10² Pa and a combined stress decrease of 0.42 × 10³ Pa. Moreover, the 1997 Manyi earthquake and the 2010 Yushu earthquake, which were geographically farther from the epicenter of the Nakchu earthquake, had little effect on the Nakchu earthquake, with a combined ΔCFS decrease of 0.71 × 10³ Pa and 0.07 × 10³ Pa, respectively.
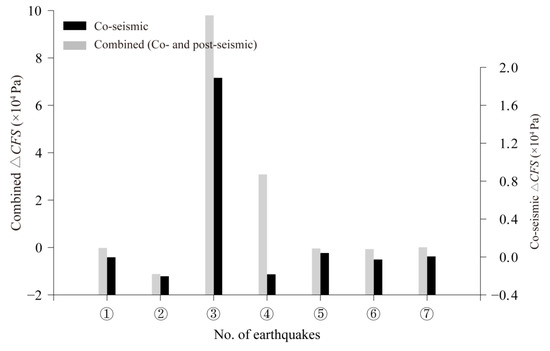
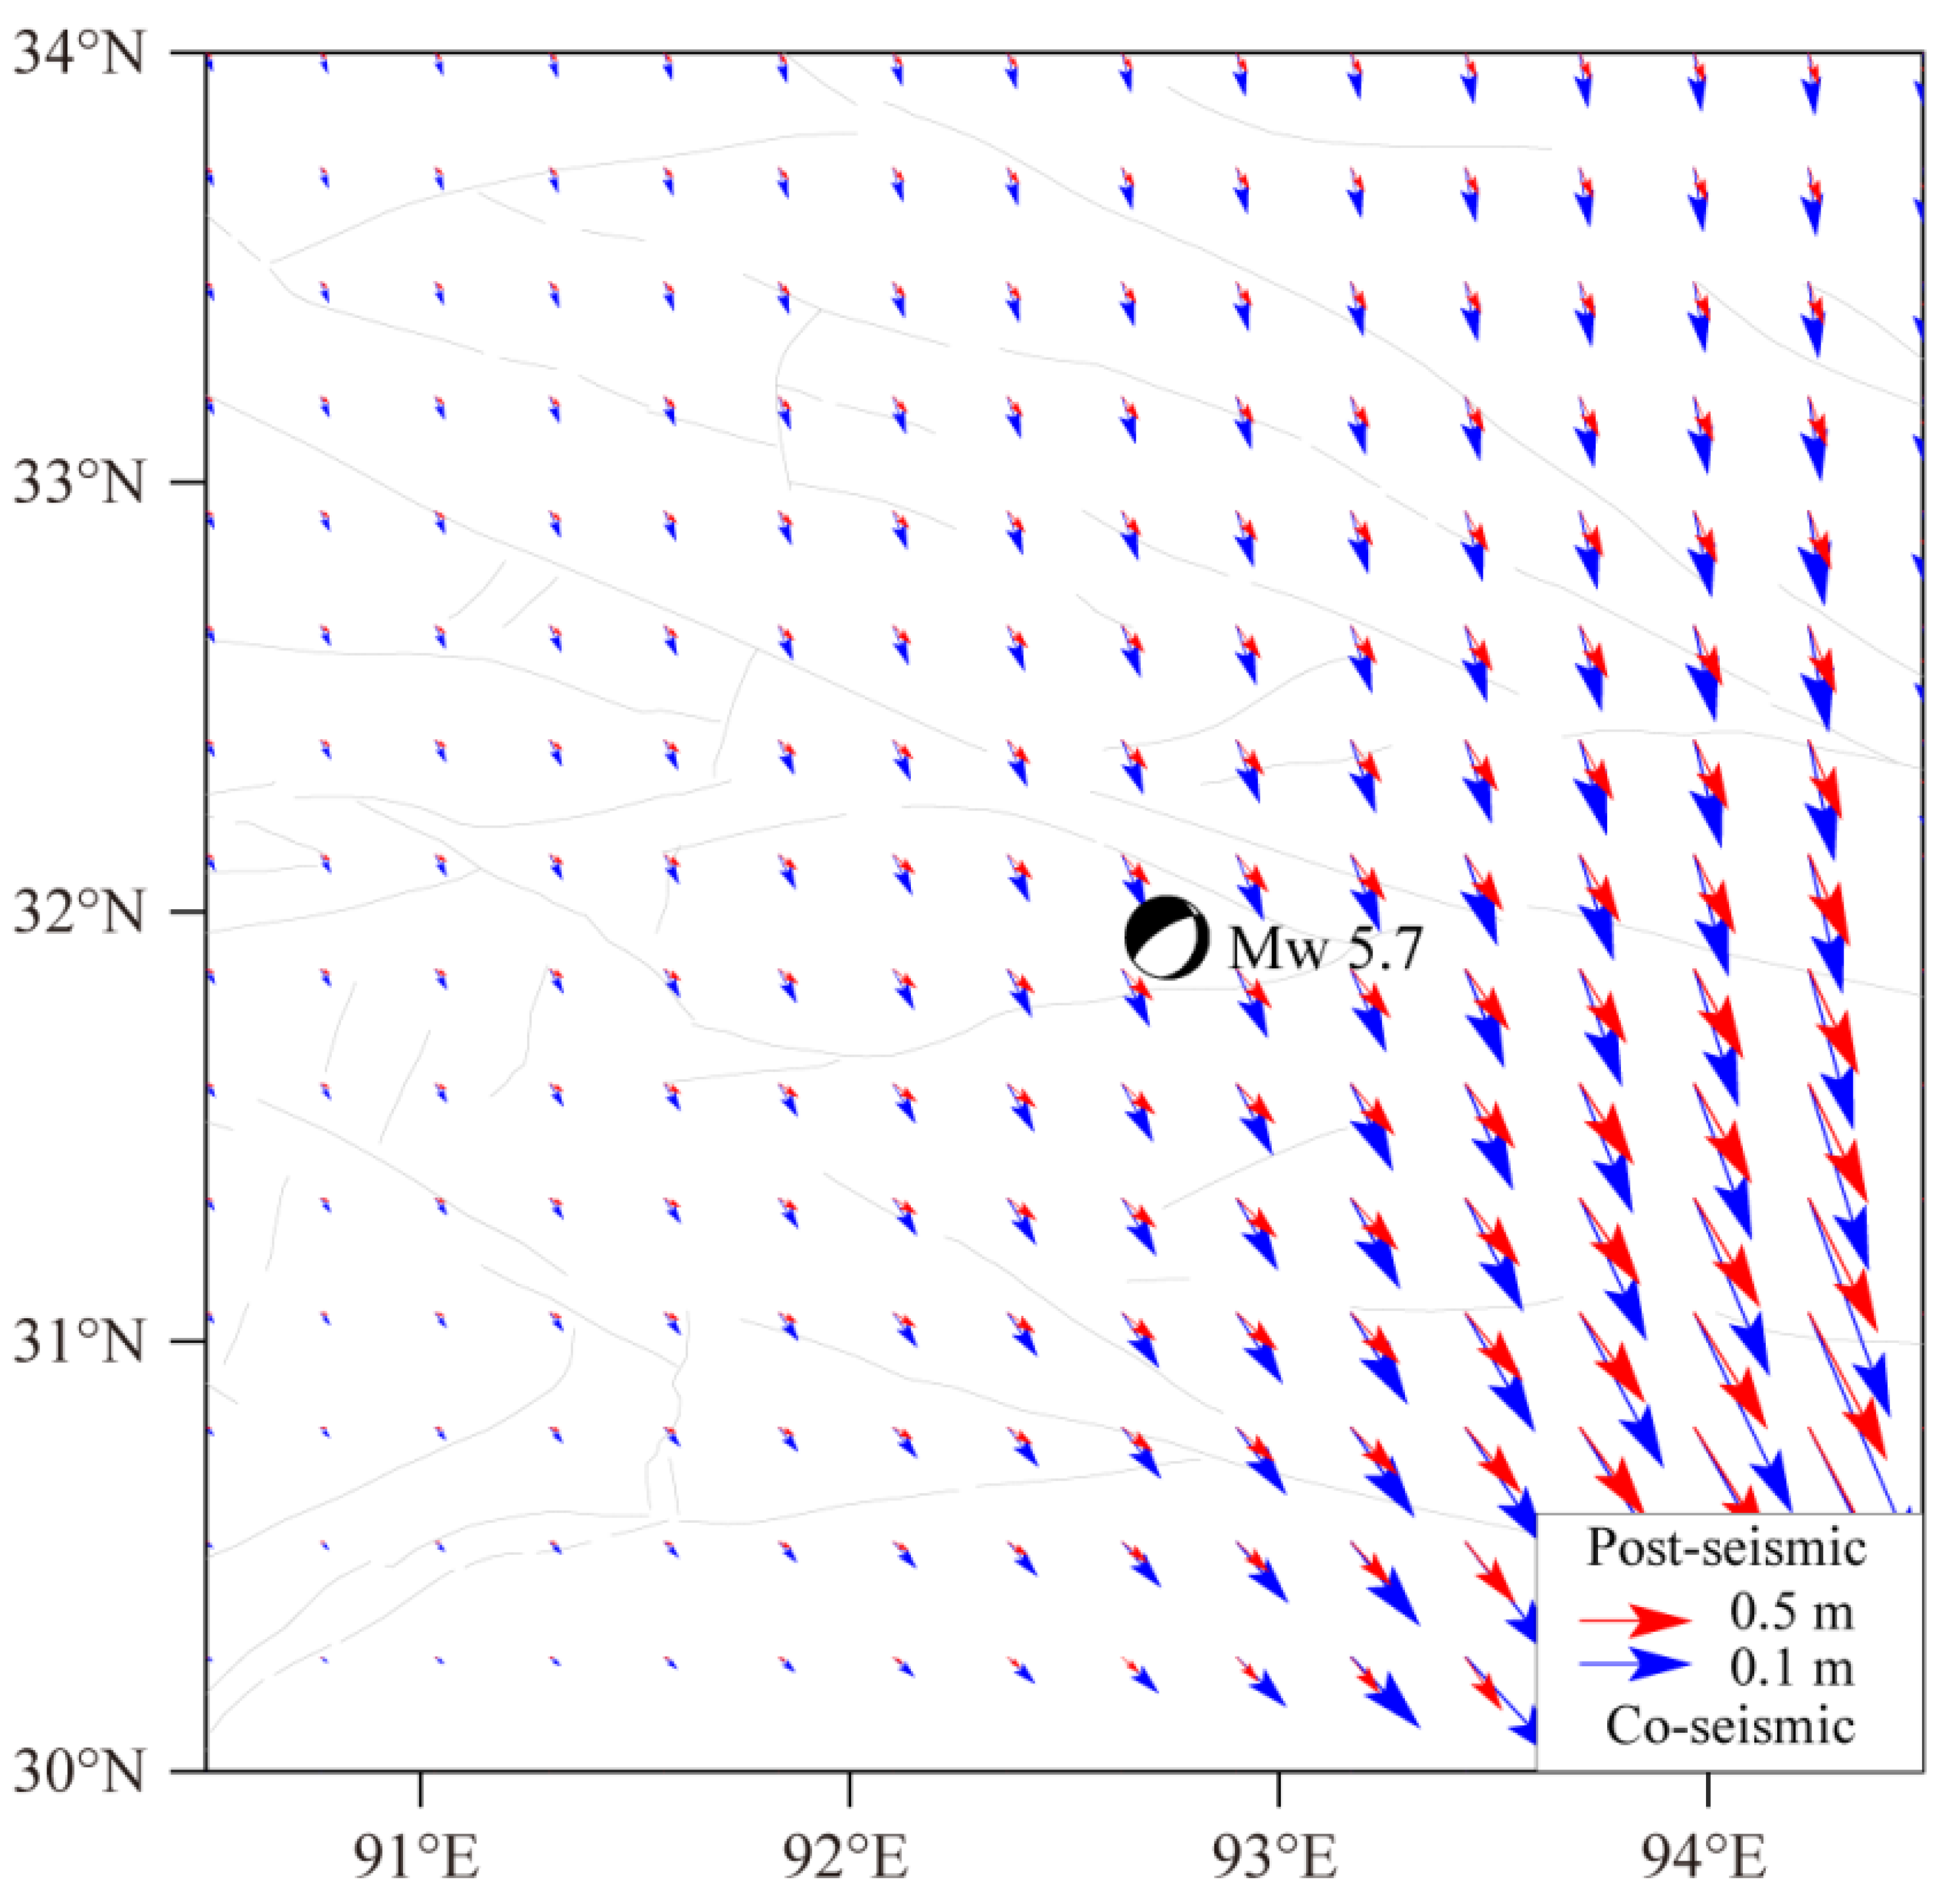
Moreover, the coseismic displacement field associated with the 1950 Assam earthquake shows that the nearly southeast-trending coseismic displacement field gradually increases from northwest to southeast (Figure 7), implying that the hypocenter of the Nakchu earthquake was subjected to tension in the predominantly southeast direction. This was conducive to the occurrence of normal slip motion on the NEE-trending fault, consistent with that reflected by the ΔCFS increase (Figure 6). In terms of the viscoelastic relaxation effects of the middle and lower crust and the upper mantle, the occurrence of the 1950 Assam earthquake caused significant ΔCFS at the hypocenter of the Nakchu earthquake to increase by 7.91 × 10⁴ Pa, indicating the remarkable postseismic loading effect. Meanwhile, the postseismic displacement field shows similar characteristics to that of the coseismic, which also benefits the normal slip. In addition, the Bengco earthquake in 1951 increased the postseismic ΔCFS by 3.26 × 10⁴ Pa, which was much larger than the coseismic stress change. By the time the Nakchu earthquake occurred, the combined stress increase at the hypocenter of the Nakchu earthquake had reached 1.16 × 10⁵ Pa, suggesting that the strong historical earthquakes cause the significant stress loading effect and accelerate the occurrence of the Nakchu earthquake.
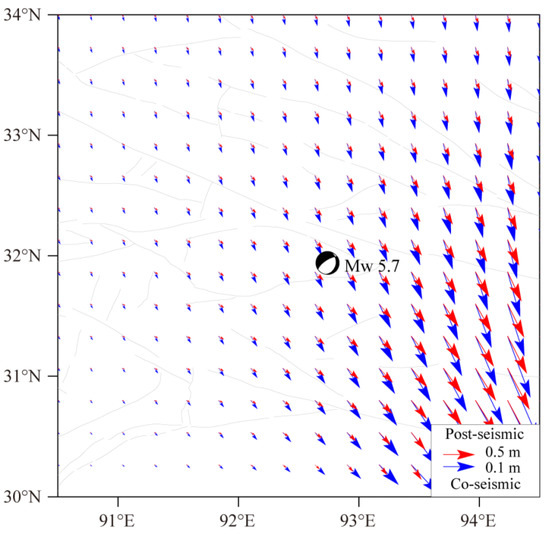
Figure 7.
Co- and post-seismic displacement fields associated with the Assam earthquake. The blue and red arrows indicate the displacement field generated by the co- and post-seismic effects of the Assam earthquake, respectively.
4. Discussion
The occurrence and type of strong earthquake are not only affected by the regional tectonic stress-strain field and fault geometry [13] but are also closely related to the stress change caused by historical earthquakes [21,24], while the calculation of ΔCFS is influenced by the three geometry parameters (strike, dip, and rake) of the receiving fault and the friction coefficient [31,52,53].
4.1. Fault Geometry of the Nakchu Earthquake
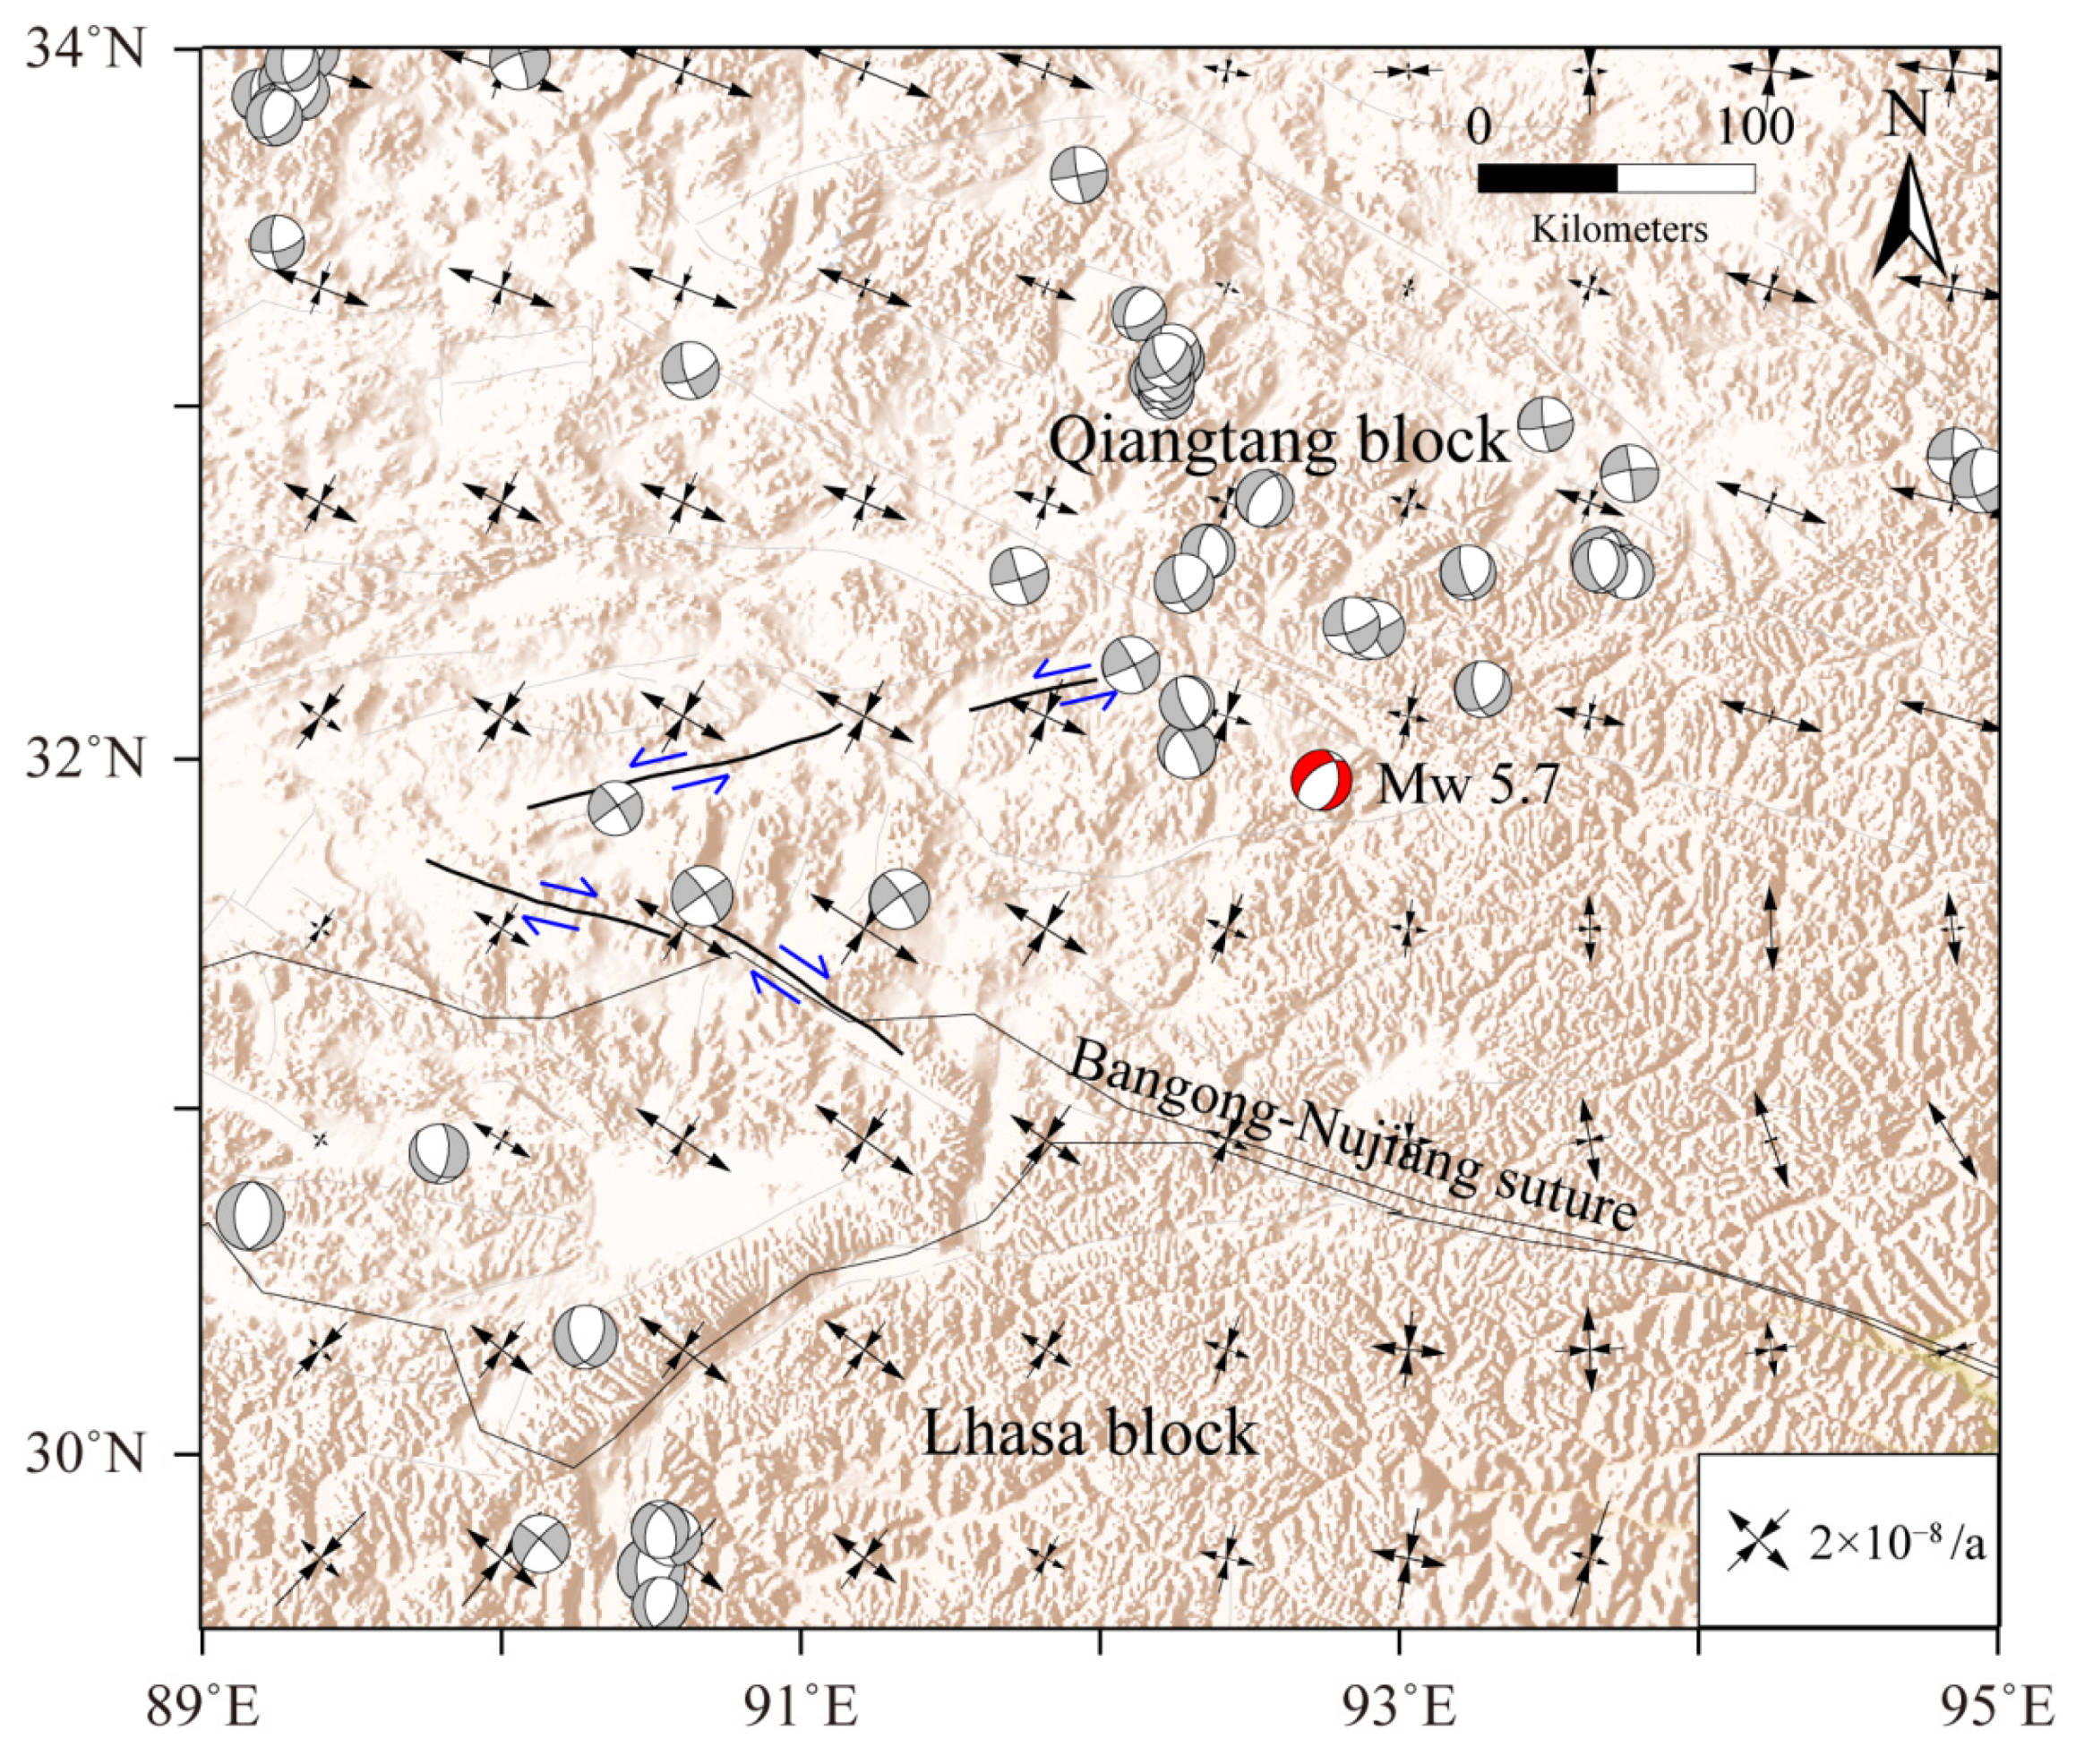
InSAR observation provides an independent method to analyze the surface deformation, particularly in regions with sparse GPS stations [54,55], and can further constrain the fault geometry and coseismic slip model [35]. In this study, we use the InSAR observations to constrain the fault geometry of the Nakchu earthquake. The result shows that the strike, dip, and rake angle of the Nakchu earthquake are 237°, 69°, and −70°, respectively, which is in general agreement with the results reported by the Global Centroid Moment Tensor (CGMT) and the German Research Center for Geosciences (GFZ) (Table 1), all of which indicate that the seismogenic fault of the Nakchu earthquake is dominated by normal faulting with minor sinistral strike-slip components. More importantly, the Nakchu earthquake occurred in the tectonically complex central Tibet, where prevailed the V-shaped conjugate strike-slip fault systems [56] (Figure 8), in which the northern NEE striking fault expresses the sinistral strike-slip, while the southern SEE striking fault the dextral strike-slip. With this complex tectonic setting, the extensional tectonic and the normal faults develop between them [55,57], as reflected by the focal mechanism solutions of historical earthquakes [58,59], the Global Centroid Moment Tensor catalog (M ≥ 5.0), and the Nakchu earthquake in this study (Figure 8). Meanwhile, the direction of the maximum extensional principal strain rates calculated using the spherical wavelet-based multiscale approach [60], based on the 1991–2016 GPS velocity fields [12], is almost perpendicular to the strike of the seismogenic fault (Figure 8). This stress–strain environment helps to explain the dominant normal faulting of the Nakchu earthquake, rather than the dominant strike–slip motion.
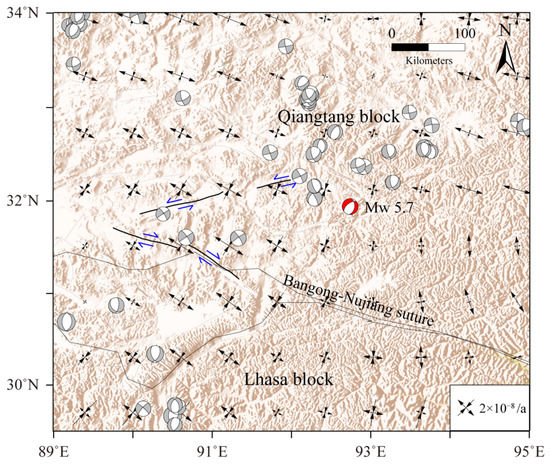
Figure 8.
Conjugate strike-slip fault systems, focal mechanism solutions, and principal strain rate. Gray beach balls and red beach balls are those taken from the Global Centroid Moment Tensor catalog (M ≥ 5.0) and the Nakchu earthquake in this study, respectively. The black arrow pairs represent GPS-derived principal strain rates.
4.2. Sensitivity Test of the Coulomb Stress Changes
From Equation (2), we can find that the effective friction coefficient affects the weight of the normal stress change to the ΔCFS. To analyze the robustness of the ΔCFS, we further calculate the ΔCFS at the hypocenter with the assuming different μ′ = 0.0, 0.2, 0.6, and 0.8. The results show that for the Nakchu earthquake (Table 3), the polarity of the ΔCFS remains the same with the different given effective friction coefficients. In particular, before the M 8.7 Assam earthquake in 1950, the historical earthquakes caused the compressive normal stress change on the fault plane, and the co- and combined ΔCFS gradually decreased with the increasing effective friction coefficient. However, the occurrence of the Assam earthquake caused a significant tensile normal stress change on the fault plane. In this scenario, the larger the effective friction coefficient, the greater the effective normal stress contributes, and the larger the increase in the ΔCFS. Moreover, although the M 8.0 Bengco earthquake in 1951 cast a coseismic compressive normal stress change to the fault plane, the significant postseismic effect changed the normal stress change from compression to extension, which makes the combined ΔCFS increase with the increasing effective friction coefficient. In brief, the results of cumulative ΔCFS are robust with the different effective friction coefficients, all indicating the stress loading effect on the occurrence of the Nakchu earthquake.
Table 3.
Coulomb stress change (ΔCFS) imparted by the historical earthquake with different effective friction coefficient (μ′).
4.3. Geodynamics Implications
With the continuous convergence of the Indian Plate to the Eurasian Plate, the interior of the Tibetan Plateau expressed the distributed crustal deformation, accommodated by the V-shaped conjugate strike-slip fault systems and the normal-slip faults [56,57]. Crustal stress fields were suggested to be associated with the direction of geodynamic movements [18], which provide the key to understanding the geodynamic process of earthquakes [13]. In-situ stress measurement indicates that the predominant orientation of the maximum horizontal principal stress in the interior of the Tibetan Plateau is NE–SW [61], which is largely consistent with that reflected by the focal mechanism solutions of strong historical earthquakes [58] and the smoothed principal stress orientation of this study (Figure 5), well explain the dominant normal faulting of the Nakchu earthquake.
Furthermore, the present-day GPS observations also show that relative to the stable Eurasian Plate, the velocity field around the focal region of the Nakchu earthquake gradually rotates clockwise from NNE to nearly EW [55,62]. The orientation of the maximum compressive principal strain rate also changes from NNE to nearly EW [12,63,64], which is consistent with the characteristics of the maximum principal stress field (Figure 5) and principal strain rate (Figure 8). Moreover, the stress change shows that the occurrence of seven M ≥ 7.0 strong historical earthquakes since the M 7.0 Shenza earthquake in 1934 caused the combined ΔCFS to increase at the hypocenter of the Nakchu earthquake by 1.16 × 10⁵ Pa, which is much larger than the threshold of the earthquake triggering [25], suggesting a triggering effect. In comparison, although there occurred the great M 7.8 Nepal earthquake in 2015 and the M 6.9 Mainling earthquake in 2017, the influence on the stress changes of the hypocenter is little or even negligible, with the ΔCFS changes only −10 to 100 Pa [65,66]. Based on the above comprehensive analysis, we concluded that the dominant normal faulting Mw 5.7 Nakchu earthquake occurred with the context of the continuous collision between the Indian and Eurasian plates in the NE direction, and the regional strong historical earthquake promoted the occurrence of this event.
5. Conclusions
In this study, we inverted the parameters of the focal mechanism solution of the Nakchu earthquake based on the InSAR coseismic deformation field. Then, we analyzed the regional tectonic stress field using the in-situ stress data around the epicenter, and finally, we calculated the co- and post-seismic ΔCFS at the hypocenter of the Nakchu earthquake caused by seven M ≥ 7.0 strong historical earthquakes since the 1934 Shenza earthquake. The results show that:
- (1)
- The focal mechanism parameters of the Nakchu earthquake are 237°/69°/−70° (strike/dip/rake), indicating that the earthquake occurred on a NEE-trending, NW-dipping fault dominated by normal faulting with minor sinistral strike–slip components.
- (2)
- The maximum principal compressive stress orientation at the epicenter of the Nakchu earthquake is NNE, subparallel to the fault strike. Meanwhile, the direction of the maximum extensional principal strain rate is almost perpendicular to the strike of the seismogenic fault. This tectonic stress–strain environment controlled the dominant normal faulting of the Nakchu earthquake.
- (3)
- Seven strong historical earthquakes caused the combined ΔCFS increase at the hypocenter of the Nakchu earthquake by 1.16 × 10⁵ Pa, which significantly hastened the occurrence of the Nakchu earthquake. This study provides a basis for understanding the fault geometry and dynamic mechanism of the Nakchu earthquake.
Author Contributions
Conceptualization, Y.L. (Yujiang Li) and Y.L. (Yongsheng Li); methodology, Y.L. (Yujiang Li), Y.L. (Yongsheng Li) and X.H.; software, Y.L. (Yujiang Li), Y.L. (Yongsheng Li) and X.H.; validation, Y.L. (Yujiang Li), and Y.L. (Yongsheng Li); formal analysis, Y.L. (Yujiang Li) and Y.L. (Yongsheng Li); investigation, X.H. and H.L.; data curation, H.L.; writing—original draft preparation, Y.L. (Yujiang Li); writing—review and editing, Y.L. (Yujiang Li) and Y.L. (Yongsheng Li); visualization, X.H. and Y.L. (Yongsheng Li); supervision, Y.L. (Yujiang Li) and Y.L. (Yongsheng Li); funding acquisition, Y.L. (Yujiang Li) and Y.L. (Yongsheng Li). All authors have read and agreed to the published version of the manuscript.
Funding
This research was funded by the National Natural Science Foundation of China (41874116), the National Key Research and Development Program of China (2021YFC3001903), Gaofen earthquake monitoring and emergency application demonstration (phase II)(31_Y30F09-9001-20/22), the Yunnan Major Science and Technology Special Project (202002AF080003), and the Research Grants from the National Institute of Natural Hazards (ZDJ2019-16).
Institutional Review Board Statement
Not applicable.
Informed Consent Statement
Not applicable.
Data Availability Statement
The Sentinel-1 data used in this study are downloaded from the European Space Agency (ESA) through the ASF Data Hub website https://vertex.daac.asf.alaska.edu/. The PSGRN/PSCMP program is available through the website ftp://ftp.gfz-potsdam.de/home/turk/wang/psgrn+pscmp-2020-code+input.rar (last accessed 20 July, 2020). The In-situ stress data set is available on the WSM project website (world-stress-map.org) and can be downloaded through the website http://doi.org/10.5880/WSM.2016.001 (last accessed 15 June, 2019).
Acknowledgments
The authors would like to thank Rongjiang Wang for providing the PSGRN/PSCMP software package, and Jiankun He, Zhigang Shao, and Lianwang Chen for their helpful discussion. Additionally, the authors thank the linguistic assistance from LetPub. Most figures were plotted using the Generic Mapping Tools (Wessel et al., 2013).
Conflicts of Interest
The authors declare no conflict of interest.
References
- Li, Y.; Tian, Y.; Yu, C.; Su, Z.; Jiang, W.; Li, Z.; Zhang, J.; Luo, Y.; Li, B. Present-day interseismic deformation characteristics of the Beng Co-Dongqiao conjugate fault system in central Tibet: Implications from InSAR observations. Geophys. J. Int. 2020, 221, 492–503. [Google Scholar] [CrossRef]
- Chlieh, M.; De Chabalier, J.; Ruegg, J.; Armijo, R.; Dmowska, R.; Campos, J.; Feigl, K. Crustal deformation and fault slip during the seismic cycle in the North Chile subduction zone, from GPS and InSAR observations. Geophys. J. Int. 2004, 158, 695–711. [Google Scholar] [CrossRef] [Green Version]
- Hooper, A.; Zebker, H.; Segall, P.; Kampes, B. A new method for measuring deformation on volcanoes and other natural terrains using InSAR persistent scatterers. Geophys. Res. Lett. 2004, 31, L23611. [Google Scholar] [CrossRef]
- Li, Z.; Elliott, J.R.; Feng, W.; Jackson, J.A.; Parsons, B.E.; Walters, R.J. The 2010 MW 6.8 Yushu (Qinghai, China) earthquake: Constraints provided by InSAR and body wave seismology. J. Geophys. Res. 2011, 116, B10302. [Google Scholar] [CrossRef] [Green Version]
- Feng, W.; Li, Z.; Elliott, J.R.; Fukushima, Y.; Hoey, T.; Singleton, A.; Cook, R.; Xu, Z. The 2011 Mw 6.8 Burma earthquake: Fault constraints provided by multiple SAR techniques. Geophys. J. Int. 2013, 195, 650–660. [Google Scholar] [CrossRef] [Green Version]
- Li, X.; Xu, W.; Jónsson, S.; Klinger, Y.; Zhang, G. Source Model of the 2014 Mw 6.9 Yutian Earthquake at the Southwestern End of the Altyn Tagh Fault in Tibet Estimated from Satellite Images. Seismol. Res. Lett. 2020, 91, 3161–3170. [Google Scholar] [CrossRef]
- Sangha, S.; Peltzer, G.; Zhang, A.; Meng, L.; Liang, C.; Lundgren, P.; Fielding, E. Fault geometry of 2015, Mw7.2 Murghab, Tajikistan earthquake controls rupture propagation: Insights from InSAR and seismological data. Earth Planet. Sci. Lett. 2017, 462, 132–141. [Google Scholar] [CrossRef] [Green Version]
- Yang, Y.H.; Hu, J.C.; Chen, Q.; Wang, Z.G.; Tsai, M.C. A Blind Thrust and Overlying Folding Earthquake of the 2016 Mw6.0 Hutubi Earthquake in the Northern Tien Shan Fold-and-Thrust Belts, China. Bull. Seismol. Soc. Am. 2019, 109, 770–779. [Google Scholar] [CrossRef]
- Chen, H.; Qu, C.; Zhao, D.; Ma, C.; Shan, X. Rupture Kinematics and Coseismic Slip Model of the 2021 Mw 7.3 Maduo (China) Earthquake: Implications for the Seismic Hazard of the Kunlun Fault. Remote Sens. 2021, 13, 3327. [Google Scholar] [CrossRef]
- Song, C.; Yu, C.; Li, Z.; Li, Y.; Xiao, R. Coseismic Slip Distribution of the 2019 Mw 7.5 New Ireland Earthquake from the Integration of Multiple Remote Sensing Techniques. Remote Sens. 2019, 11, 2767. [Google Scholar] [CrossRef] [Green Version]
- Gong, W.; Zhang, Y.; Li, T.; Wen, S.; Zhao, D.; Hou, L.; Shan, X. Multi-Sensor Geodetic Observations and Modeling of the 2017 Mw 6.3 Jinghe Earthquake. Remote Sens. 2019, 11, 2157. [Google Scholar] [CrossRef] [Green Version]
- Wang, M.; Shen, Z.-K. Present-Day Crustal Deformation of Continental China Derived From GPS and Its Tectonic Implications. J. Geophys. Res. 2020, 125, e2019JB018774. [Google Scholar] [CrossRef] [Green Version]
- Heidbach, O.; Rajabi, M.; Cui, X.; Fuchs, K.; Müller, B.; Reinecker, J.; Reiter, K.; Tingay, M.; Wenzel, F.; Xie, F. The World Stress Map database release 2016: Crustal stress pattern across scales. Tectonophysics 2018, 744, 484–498. [Google Scholar] [CrossRef]
- Hu, J.-C.; Angelier, J. Stress permutations: Three-dimensional distinct element analysis accounts for a common phenomenon in brittle tectonics. J. Geophys. Res. 2004, 109, B09403. [Google Scholar] [CrossRef] [Green Version]
- Hu, X.P.; Zang, A.; Heidbach, O.; Cui, X.F.; Xie, F.R.; Chen, J.W. Crustal stress pattern in China and its adjacent areas. J. Asian Earth Sci. 2017, 149, 20–28. [Google Scholar] [CrossRef] [Green Version]
- Li, Z.X.; Wan, Y.G.; Cui, H.W.; LI, Z.Y.; Hu, X.H.; Huang, J.C.; Jin, Z.T. Characteristics analysis of tectonic stress field around the Mojiang earthquake and its adjacent areas on September 8, 2018. Chin. J. Geophys. 2020, 63, 1431–1443. [Google Scholar]
- Martínez-Garzón, P.; Heidbach, O.; Bohnhoff, M. Contemporary stress and strain field in the Mediterranean from stress inversion of focal mechanisms and GPS data. Tectonophysics 2020, 774, 228286. [Google Scholar] [CrossRef]
- Zoback, M.L. First-and second-order patterns of stress in the lithosphere: The World Stress Map Project. J. Geophys. Res. 1992, 97, 11703–11728. [Google Scholar] [CrossRef]
- Cheng, H.H.; Pang, Y.J.; Dong, P.Y.; Zhang, H.; Shi, Y.-L. Analysis of the stress environment of the 2008 and 2014 Yutian Ms 7.3 earthquakes. Chin. J. Geophys. 2014, 57, 3238–3246. [Google Scholar]
- Li, Y.J.; Liu, S.F.; Chen, L.W.; Du, Y.; Li, H.; Liu, D.Y. Mechanism of crustal deformation in the Sichuan-Yunnan region, southeastern Tibetan Plateau: Insights from numerical modeling. J. Asian Earth Sci. 2017, 146, 142–151. [Google Scholar] [CrossRef]
- Heidbach, O.; Ben-Avraham, Z. Stress evolution and seismic hazard of the Dead Sea fault system. Earth Planet. Sci. Lett. 2007, 257, 299–312. [Google Scholar] [CrossRef] [Green Version]
- Harris, R.A. Introduction to special section: Stress triggers, stress shadows, and implications for seismic hazard. J. Geophys. Res. 1998, 103, 24347–24358. [Google Scholar] [CrossRef]
- Nalbant, S.S.; McCloskey, J.; Steacy, S.; Barka, A.A. Stress accumulation and increased seismic risk in eastern Turkey. Earth Planet. Sci. Lett. 2002, 195, 291–298. [Google Scholar] [CrossRef]
- Shan, B.; Xiong, X.; Wang, R.; Zheng, Y.; Yang, S. Coulomb stress evolution along Xianshuihe–Xiaojiang Fault System since 1713 and its interaction with Wenchuan earthquake, May 12, 2008. Earth Planet. Sci. Lett. 2013, 377–378, 199–210. [Google Scholar] [CrossRef] [Green Version]
- King, G.C.; Stein, R.S.; Lin, J. Static stress changes and the triggering of earthquakes. Bull. Seismol. Soc. Am. 1994, 84, 935–953. [Google Scholar]
- Parsons, T.; Segou, M. Stress, Distance, Magnitude, and Clustering Influences on the Success or Failure of an Aftershock Forecast: The 2013 M 6.6 Lushan Earthquake and Other Examples. Seismol. Res. Lett. 2014, 85, 44–51. [Google Scholar] [CrossRef]
- Stein, R.S. The role of stress transfer in earthquake occurrence. Nature 1999, 402, 605–609. [Google Scholar] [CrossRef]
- Wang, J.; Xu, C.; Freymueller, J.T.; Wen, Y.; Xiao, Z. AutoCoulomb: An Automated Configurable Program to Calculate Coulomb Stress Changes on Receiver Faults with Any Orientation and its Application to the 2020 Mw 7.8 Simeonof Island, Alaska, Earthquake. Seismol. Res. Lett. 2021, 92, 2591–2609. [Google Scholar] [CrossRef]
- Jia, K. Modeling the Spatiotemporal Seismicity Patterns of the Longmen Shan Fault Zone Based on the Coulomb Rate and State Model. Seismol. Res. Lett. 2020, 92, 275–286. [Google Scholar] [CrossRef]
- Wang, J.; Xu, C.; Freymueller, J.T.; Li, Z.; Shen, W. Sensitivity of Coulomb stress change to the parameters of the Coulomb failure model: A case study using the 2008 Mw 7.9 Wenchuan earthquake. J. Geophys. Res. 2014, 119, 3371–3392. [Google Scholar] [CrossRef]
- Xu, D.Y.; Xiao, J.; He, J.K.; Wang, W.M. Strong earthquake clustering around the eastern Tibetan Plateau after the 2008 Mw 7.9 Wenchuan earthquake. Sci. China Earth Sci. 2020, 63, 999–1012. [Google Scholar] [CrossRef]
- Armijo, R.; Tapponnier, P.; Han, T. Late Cenozoic right-lateral strike-slip faulting in southern Tibet. J. Geophys. Res. 1989, 94, 2787–2838. [Google Scholar] [CrossRef]
- Wu, Z.M.; Cao, Z.Q. Review on intensity of Damxung earthquake (Ms= 7.5) in 1952, Tibet. Chin. J. Geophys. 1991, 34, 64–72. [Google Scholar]
- Wu, Z.M.; Deng, Q.D. Deformation features and fracture mechanism of surface rupture of 1951 Bengco, Tibet Ms= 8 earthquake. Seismol. Geol. 1989, 11, 15–25. [Google Scholar]
- Li, Y.; Jiang, W.; Zhang, J.; Li, B.; Yan, R.; Wang, X. Sentinel-1 SAR-Based coseismic deformation monitoring service for rapid geodetic imaging of global earthquakes. Nat. Hazards Res. 2021, 1, 11–19. [Google Scholar] [CrossRef]
- Feng, W. Modelling Co-and Post-Seismic Displacements Revealed by InSAR, and Their Implications for Fault Behaviour. Ph.D. Thesis, University of Glasgow, Scotland, UK, 2015. [Google Scholar]
- Hansen, K.M.; Mount, V.S. Smoothing and extrapolation of crustal stress orientation measurements. J. Geophys. Res. 1990, 95, 1155–1165. [Google Scholar] [CrossRef]
- Heidbach, O.; Tingay, M.; Barth, A.; Reinecker, J.; Kurfeß, D.; Müller, B. Global crustal stress pattern based on the World Stress Map database release 2008. Tectonophysics 2010, 482, 3–15. [Google Scholar] [CrossRef] [Green Version]
- Shao, Z.G.; Xu, J.; Ma, H.S.; Zhang, L.P. Coulomb stress evolution over the past 200years and seismic hazard along the Xianshuihe fault zone of Sichuan, China. Tectonophysics 2016, 670, 48–65. [Google Scholar] [CrossRef]
- Pollitz, F.F.; Wicks, C.; Thatcher, W. Mantle flow beneath a continental strike-slip fault: Postseismic deformation after the 1999 Hector Mine earthquake. Science 2001, 293, 1814–1818. [Google Scholar] [CrossRef]
- Wang, K.L.; Hu, Y.; He, J.H. Deformation cycles of subduction earthquakes in a viscoelastic Earth. Nature 2012, 484, 327–332. [Google Scholar] [CrossRef]
- Li, Y.J.; Shao, Z.G.; Shi, F.Q.; Chen, L.W. Stress evolution on active faults in the southwestern Yunnan region, southeastern Tibetan Plateau, and implications for seismic hazard. J. Asian Earth Sci. 2020, 200, 104470. [Google Scholar] [CrossRef]
- Wang, R.; Lorenzo-Martín, F.; Roth, F. PSGRN/PSCMP—a new code for calculating co-and post-seismic deformation, geoid and gravity changes based on the viscoelastic-gravitational dislocation theory. Comput. Geosci. 2006, 32, 527–541. [Google Scholar] [CrossRef] [Green Version]
- Teng, J.W.; Yuan, X.M.; Zhang, Y.Q.; Hu, G.Z.; Yan, Y.F. The stratificational velocity structure of crust and covering strata of upper mantle and the orbit of deep interaquifer substance locus of movement for Tibetan Plateau. Acta Petrol. Sin. 2012, 28, 4077–4100. [Google Scholar]
- Wang, K.; Fialko, Y. Observations and modeling of coseismic and postseismic deformation due to the 2015 Mw 7.8 Gorkha (Nepal) earthquake. J. Geophys. Res. 2018, 123, 761–779. [Google Scholar] [CrossRef]
- Zhao, B.; Bürgmann, R.; Wang, D.; Tan, K.; Du, R.; Zhang, R. Dominant controls of downdip afterslip and viscous relaxation on the postseismic displacements following the Mw7. 9 Gorkha, Nepal, earthquake. J. Geophys. Res. 2017, 122, 8376–8401. [Google Scholar] [CrossRef] [Green Version]
- Coudurier-Curveur, A.; Tapponnier, P.; Okal, E.; Van der Woerd, J.; Kali, E.; Choudhury, S.; Baruah, S.; Etchebes, M.; Karakaş, Ç. A composite rupture model for the great 1950 Assam earthquake across the cusp of the East Himalayan Syntaxis. Earth Planet. Sci. Lett. 2020, 531, 115928. [Google Scholar] [CrossRef]
- Li, B.K.; Diao, G.L.; Zou, L.Y.; Xu, X.W.; Feng, X.D. The redetermination of the source parameters of the big earthquake M7.7 in the southeast of Lang country in Tibet in 1947. Seismol. Geomagn. Obs. Res. 2014, 35, 85–91. [Google Scholar]
- Xu, L.S.; Chen, Y.T. Tempo-spatial rupture process of the 1997 Mani, Xizang (Tibet), China earthquake of Ms=7.9. Acta Seism. Sin. 1999, 12, 495–506. [Google Scholar] [CrossRef]
- Zhang, Y.; Xu, L.S.; Chen, Y.T. Source process of the 2010 Yushu, Qinghai, earthquake. Sci. China Earth Sci. 2010, 53, 1249–1251. [Google Scholar] [CrossRef]
- Wells, D.L.; Coppersmith, K.J. New empirical relationships among magnitude, rupture length, rupture width, rupture area, and surface displacement. Bull. Seismol. Soc. Am. 1994, 84, 974–1002. [Google Scholar] [CrossRef]
- Mildon, Z.; Roberts, G.; Walker, J.F.; Toda, S. Coulomb pre-stress and fault bends are ignored yet vital factors for earthquake triggering and hazard. Nat. Commun. 2019, 10, 2744. [Google Scholar] [CrossRef] [Green Version]
- Xiong, X.; Shan, B.; Zheng, Y.; Wang, R. Stress transfer and its implication for earthquake hazard on the Kunlun Fault, Tibet. Tectonophysics 2010, 482, 216–225. [Google Scholar] [CrossRef] [Green Version]
- Lindsey, E.O.; Natsuaki, R.; Xu, X.; Shimada, M.; Hashimoto, M.; Melgar, D.; Sandwell, D.T. Line-of-sight displacement from ALOS-2 interferometry: Mw 7.8 Gorkha Earthquake and Mw 7.3 aftershock. Geophys. Res. Lett. 2015, 42, 6655–6661. [Google Scholar] [CrossRef]
- Wang, H.; Wright, T.J.; Liu-Zeng, J.; Peng, L. Strain Rate Distribution in South-Central Tibet From Two Decades of InSAR and GPS. Geophys. Res. Lett. 2019, 46, 5170–5179. [Google Scholar] [CrossRef] [Green Version]
- Taylor, M.; Yin, A.; Ryerson, F.J.; Kapp, P.; Ding, L. Conjugate strike-slip faulting along the Bangong-Nujiang suture zone accommodates coeval east-west extension and north-south shortening in the interior of the Tibetan Plateau. Tectonics 2003, 22, 1044. [Google Scholar] [CrossRef] [Green Version]
- Yin, A.; Taylor, M.H. Mechanics of V-shaped conjugate strike-slip faults and the corresponding continuum mode of continental deformation. GSA Bull. 2011, 123, 1798–1821. [Google Scholar] [CrossRef]
- Bai, L.; Li, G.; Khan, N.G.; Zhao, J.; Ding, L. Focal depths and mechanisms of shallow earthquakes in the Himalayan–Tibetan region. Gondwana Res. 2017, 41, 390–399. [Google Scholar] [CrossRef]
- Ji, L.; Xu, J.; Zhao, Q.; Yang, C. Source Parameters of the 2003–2004 Bange Earthquake Sequence, Central Tibet, China, Estimated from InSAR Data. Remote Sens. 2016, 8, 516. [Google Scholar] [CrossRef] [Green Version]
- Tape, C.; Musé, P.; Simons, M.; Dong, D.; Webb, F. Multiscale estimation of GPS velocity fields. Geophys. J. Int. 2009, 179, 945–971. [Google Scholar] [CrossRef] [Green Version]
- Yang, S.X.; Yao, R.; Cui, X.F.; Chen, Q.C.; Huang, L.Y. Analysis of the characteristics of measured stress in Chinese mainland and its active blocks and North-South seismic belt. Chin. J. Geophys. 2012, 55, 4207–4217. [Google Scholar] [CrossRef]
- Gan, W.J.; Zhang, P.Z.; Shen, Z.K.; Niu, Z.J.; Wang, M.; Wan, Y.G.; Zhou, D.M.; Cheng, J. Present-day crustal motion within the Tibetan Plateau inferred from GPS measurements. J. Geophys. Res. 2007, 112. [Google Scholar] [CrossRef] [Green Version]
- Allmendinger, R.W.; Reilinger, R.; Loveless, J. Strain and rotation rate from GPS in Tibet, Anatolia, and the Altiplano. Tectonics 2007, 26, TC3013. [Google Scholar] [CrossRef] [Green Version]
- Zheng, G.; Wang, H.; Wright, T.J.; Lou, Y.; Zhang, R.; Zhang, W.; Shi, C.; Huang, J.; Wei, N. Crustal Deformation in the India-Eurasia Collision Zone From 25 Years of GPS Measurements. J. Geophys. Res. 2017, 122, 9290–9312. [Google Scholar] [CrossRef]
- Yin, F.; Jiang, C.; Han, L.; Zhang, H.; Zhang, B. Seismic hazard assessment for the Red River fault: Insights from Coulomb stress evolution. Chin. J. Geophys. 2018, 61, 183–198. [Google Scholar] [CrossRef]
- Zha, X.J.; Dai, Z.Y. Using geodetic data to calculate stress changes on faults in the Tibetan Plateau caused by the 2015 Mw7. 8 Nepal earthquake. J. Asian Earth Sci. 2017, 133, 38–45. [Google Scholar] [CrossRef]

Publisher’s Note: MDPI stays neutral with regard to jurisdictional claims in published maps and institutional affiliations. |
© 2021 by the authors. Licensee MDPI, Basel, Switzerland. This article is an open access article distributed under the terms and conditions of the Creative Commons Attribution (CC BY) license (https://creativecommons.org/licenses/by/4.0/).