Abstract
In agronomy, soil organic carbon (SOC) content is important for the development and growth of crops. From an environmental monitoring viewpoint, SOC sequestration is essential for mitigating the emission of greenhouse gases into the atmosphere. SOC dynamics in cropland soils should be further studied through various approaches including remote sensing. In order to predict SOC content over croplands in southwestern France (area of 22,177 km²), this study addresses (i) the influence of the dates on which Sentinel-2 (S2) images were acquired in the springs of 2017–2018 as well as the influence of the soil sampling period of a set of samples collected between 2005 and 2018, (ii) the use of soil moisture products (SMPs) derived from Sentinel-1/2 satellites to analyze the influence of surface soil moisture on model performance when included as a covariate, and (iii) whether the spatial distribution of SOC as mapped using S2 is related to terrain-derived attributes. The influences of S2 image dates and soil sampling periods were analyzed for bare topsoil. The dates of the S2 images with the best performance (RPD ≥ 1.7) were 6 April and 26 May 2017, using soil samples collected between 2016 and 2018. The soil sampling dates were also analyzed using SMP values. Soil moisture values were extracted for each sample and integrated into partial least squares regression (PLSR) models. The use of soil moisture as a covariate had no effect on the prediction performance of the models; however, SMP values were used to select the driest dates, effectively mapping topsoil organic carbon. S2 was able to predict high SOC contents in the specific soil types located on the old terraces (mesas) shaped by rivers flowing from the southwestern Pyrénées.
1. Introduction
Soil organic carbon (SOC) is fundamental to the global carbon cycle. Croplands represent approximately 143.4 Pg of SOC stocks worldwide at a depth of 30 cm, i.e., 20.7% of all land cover types followed by forests and grasslands with 43.1% and 25.9%, respectively [1]. Agricultural production and land use change account for 24% of global greenhouse gas emissions [2]. When converted from forest or native vegetation, cultivated soils lose between 20 and 50% of the carbon content in their top layers (0–30 cm), with the highest rates of loss in the first years of disturbance [3,4,5]. Therefore, SOC sequestration-related practices on croplands can potentially help ensure soil health and have, thus, been proposed as a temporary solution for mitigating climate change [6].
Monitoring changes in SOC is essential, and the use of field or remote sensors to monitor carbon over croplands is highly relevant to this process [7,8]. At global, continental or national scales, mapping the spatial variability of SOC content [9,10,11] and SOC stocks has been possible using spatial models that include environmental covariates such as those derived from climate and terrain using MODIS satellite imagery and SRTM radar systems [12,13]. Such technology is necessary because of increases in arable land due to food demand. Therefore, remote sensing techniques are essential for SOC monitoring in croplands because information regarding soil properties is important for decision-making. The use of spectral data on croplands to predict SOC has been studied by using laboratory/field sensors [14,15], airborne imagery [16,17] and satellite imagery (e.g., [18,19,20,21,22]); by comparing satellite and airborne imagery [23] or using them together in a common approach [24]; by comparing satellite, airborne and unmanned aerial system-based imagery [25,26]; and by combining different satellite imagery with satellite-derived covariates and indices over wide areas with different land uses: cropland, pasture and forest [27,28]. The performance of these approaches for European croplands has demonstrated the ability of the new, free and open-access optical sensor Sentinel-2 (S2) to map and/or to detect changes in SOC [21,23,25].
The use of the S2 satellite for the quantification of soil attributes has increased due to its characteristics, which include high spectral and spatial resolution. However, factors such as the date of satellite image acquisition, the solar elevation angle on the date of satellite image acquisition, the soil moisture (SM) and the surface soil roughness should be considered and studied in detail in order to predict SOC as well as other attributes. Vaudour et al. [21] observed that the performance of S2 images when calculating SOC varied with image acquisition date. Furthermore, these authors found that the best performances (RPD values ≥ 1.4) were mainly related to the solar elevation angle, the soil roughness and the SM. The development of algorithms to obtain soil information using remote sensing could support the study and mapping of soil attributes, e.g., the use of SM products (SMPs) at a sub-plot scale. The SMPs used in our study were obtained through a synergistic combination of Sentinel-1 and -2 (S1/S2) images; these products were generated for croplands and grasslands with or without vegetation cover with an estimated accuracy of 5% vol. [29,30]. SMPs errors mainly depend on soil roughness (root mean surface height or Hrms) and NDVI values. The best results were obtained for soils with moderate surface roughness (for Hrms between 1 and 3 cm). Underestimation and overestimation of estimated moisture, respectively, were observed for a Hrms lower than 1 cm and higher than 3 cm. In addition, the developed approach could be applied to cropland plots mainly with NDVI lower than 0.75. In a study of the Versailles plain, Vaudour et al. [22] compared different approaches for Sentinel 2 images temporal mosaicking, mosaicking either per date or per pixel and either considering or not considering SM maps in order to produce a composite, multi-date, bare topsoil image for predicting SOC content over croplands. The best results were achieved using the per date approach driven by S1-derived moisture content (R² ~ 0.5, RPD ~ 1.4, RMSE ~ 3.7 g.kg−1), which enabled the predicted area to more than double. However, the direct use of SM as a covariate in spectral models for SOC content prediction has not yet been explored.
Moreover, as superficial SOC is a dynamic characteristic, the time-lag between sampling and remote sensing data acquisition may greatly influence prediction performance, especially if changes in land-use or management practices influencing superficial SOC (e.g., organic fertilization) are rather recent. This study relied on the use of S2 time series in addition to time series from S2 in conjunction with SMP time series obtained using S1/S2. Its objectives were (i) to evaluate the influence of image date and soil sampling period, (ii) to assess the effect of SM as a covariate in the prediction models, and (iii) to identify whether the spatial distribution of SOC as mapped in this study is related to specific soilscapes in southwestern France.
2. Materials and Methods
2.1. Study Area
The area studied is located in the administrative region of Occitanie, a large agricultural region in the southwest of France (43°57′N–42°48′N; 0°15′W–1°51′E) covering 22,177 km2 (Figure 1). It is characterized by an oceanic climate (Cfb) according to its Köppen classification (cold winters and cool summers). A shapefile of the Land Parcel Identification System (LPIS) of 2017 (French National Institute of Geographic and Forest Information (IGN)) determined that about 12,415 km2 of the total area consists of croplands. Different types of crops are cultivated in the area, mainly using conventional agriculture (e.g., ploughing). The area’s main crops include winter wheat, maize, sunflowers and winter rapeseed.
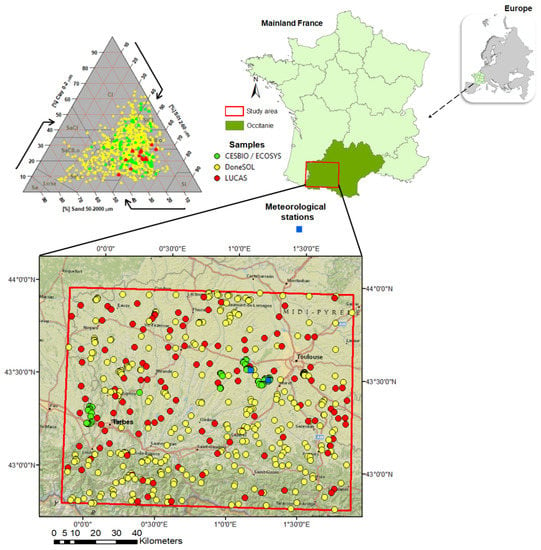
Figure 1.
Locations of soil samples and weather stations in the western part of the Occitanie region (France).
The northeastern part of the study region consists of an old mountain chain, the Massif Central, which was formed approximately 380 million years ago. Calcareous formations shape the base of large plateaus neighboring volcanic and acidic rocks [31]. The soils in the central area located on the left bank of the Garonne River are derived from molassic deposits originating from the area during the Eocene orogenesis of the Pyrenean mountains in combination with an important lacustrine system: these deposits are mainly dominated by marls, giving rise to low permeability. An increase in the flow of rivers during the Quaternary period contributed to incisions of these molassic deposits, which formed north–south-oriented patterns as gravel was deposited during interglacial phases and, thus, created alluvial terraces. The soils developed in these terraces vary from rather-undeveloped alluvial to very illuviated and differentiated soils. Acidic and alkaline soils predominate in the region according to the World Reference Base for Soil Resources with the calcareous soils mainly being Calcaric and Hypereutric Cambisols, Colluvic Regosols, Rendzic Leptosols and Fluvisols and the non-calcareous soils being Haplic Luvisols, Umbric Leptosols and Haplic and Hyperdystric Cambisols [32]. Most of the naturally acidic soils are limed under cultivation in order to correct their acidity.
2.2. Soil Samples
We used 625 topsoil samples collected from 2005 to 2018 that are part of a set that includes three databases used for digital soil mapping (DSM) in France (Figure 1). The first set corresponds to the French soil profile database (DoneSol) (to see more details, visit http://www.gissol.fr/ (accessed on 12 December 2021)), in which soil information (soil profiles and augering sampling and analyses) mainly came from data gathered for conventional soil mapping using points that were spread irregularly across the French mainland territory [33]. The second set was collected in May 2018 by the Center for Spatial Studies of the Biosphere in Toulouse (CESBIO) in conjunction with the functional ecology and ecotoxicology of agroecosystems unit (ECOSYS), and the third data set used in this study is the 2015 Land Use and Land Cover Survey (LUCAS) from the European Union Statistical Office (EUROSTAT) [34]. R software’s “soiltexture package” [35] was used to classify the soil samples into eight textural classes according to the US Department of Agriculture (USDA) classification system (Figure 1).
In addition, in order to evaluate the possible effect of slaking on the performance of the models, slaking crust sensitivity index (SCSI) values were determined using Equation (1) (for pH values > 7) and Equation (2) (for pH ≤ 7) as established by Boiffin [36].
where FS is the fine silt content, CS is coarse silt, Cl is clay and OM is organic matter content as a percentage (%).
2.3. Dataset Acquisition
2.3.1. Sentinel-2 Time Series
The Sentinel-2 (S2) images were acquired during the springs of 2017 and 2018 in periods corresponding to a maximum bare soil coverage. During these periods, the bare soils mainly comprised plots in maize and sunflower seedbed condition. Four tiles were required to cover the entire study area (T30TYN, T30TYP, T31TCH and T31TCJ); therefore, a total of 24 images were downloaded from the Muscate platform from the French Land Data Centre (Theia, https://www.theia-land.fr/, (accessed on 12 December 2021 )) (Figure 2).
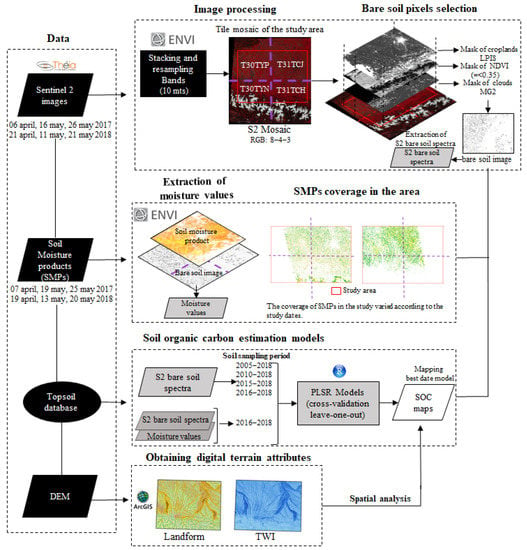
Figure 2.
Methodology flowchart.
The images were from six different dates (6 April, 16 May and 26 May 2017, and 21 April, 11 May and 21 May 2018) (Table 1). These dates were selected according to the availability of S2 images on Theia’s website from between 2016 and 2019 as well as the presence of clouds; we selected those images with lower percentages of clouds (≤30%) covering their surfaces. Bands B2, B3, B4, B5, B6, B7, B8, B8A, B11 and B12 were used with slope effects atmospherically corrected (“flat reflectance” or FRE) (Table 2).

Table 1.
Main characteristics of the S2 images studied.

Table 2.
Bands used from the Sentinel-2 Multispectral sensor.
In order to extract spectral values from the points sampled in each image, all bands were stacked and resampled at 10 m resolution and mosaics were created from the four tiles covering the area using ENVI 5.5 software (Exelis Visual Information Solutions, Boulder, Colorado) (Figure 2). A geophysical mask was used to remove clouds and/or topographical shadows in each scene (“masque géophysique” or MG2) [37]; this mask is available for all S2 images that can be downloaded from Theia’s web site. The percentages of clouds and shadows differed among tiles with the maximum values of approximately 70–75% observed on the T30TYN and T31TCH tiles (close to the Pyrénées Mountains). When only the study area was considered, on the six dates studied, the minimum coverage value was 2.3%, and the maximum coverage was 30% (Table 1). Spectral indices were used to differentiate vegetation and straw residues from bare soil. The normalized difference vegetation index (NDVI, Equation (3)) was used with a threshold ≤0.35 to retrieve bare soil pixels. The normalized burn ratio 2 (NBR2, Equation (4)) was used to determine whether a correlation with the residuals of the created models might indicate the presence of crop residues such as straw in the selected samples [18].
where ρ is the surface reflectance (%) of the shortwave infrared (SWIR) (i.e., SWIR1 = B11 band and SWIR2 = B12 band for Sentinel-2), the near-infrared (NIR = B8) and the red (Red = B4) spectral regions.
2.3.2. Soil Moisture Products and Climate Data
The soil moisture products (SMPs) derived from the Sentinel-1/Sentinel-2 satellites that were used in this work were provided by the Theia platform (https://www.theia-land.fr/product/humidite-du-sol-a-tres-haute-resolution-spatiale/ (accessed on 12 December 2021)) (Figure 2). SM image dates that were as close as possible to the acquisition dates of the S2 images were selected (Table 3). The SM images were obtained over croplands and grasslands at plot scale and provide SM estimates with an approximate accuracy of 5 vol.% [29] with a six-day temporal resolution [29,30]. To estimate SM values (0–10 cm depth), Hajj et al. [29] inverted the water cloud model parameterized by Baghdadi et al. [38] for the C-band combined with the integral equation model as modified by Baghdadi et al. [39]. This algorithm inverts Sentinel-1 radar data to SM values and uses the normalized differential vegetation index (NDVI) derived from S2 optical data from agricultural plots as an input.

Table 3.
Soil moisture products (SMPs) derived from S1/S2.
As in Section 2.3.1, bare soil spectra and SM values were obtained using ENVI software’s “Spectral Library Builder” function (Figure 2). NDVI values lower than 0.35, MG2 and the LPIS were also used for extracting spectra from the mosaics created from the S2 and SM images. However, because the SMPs covered a smaller area than the study area (Figure 2), only soil samples from plots with SM information were considered (Table 3). Rainfall data were acquired from the southwestern France regional space observatory’s Auradé and Lamasquère stations (“Observatoire spatial regional”, OSR SW) (https://osr-cesbio.ups-tlse.fr/index.php (accessed on 12 December 2021)). OSR is a national observation service dedicated to monitoring the long-term effects of climate change at multiple scales. Rainfall events were recorded that corresponded to the dates of the S2 and SM images as well as the days before the images were taken.
2.3.3. Digital Terrain Attributes
The digital elevation model (DEM) source was the BD ALTI® version 2.0 at 25 m resolution in XY and 1 m in Z that is distributed by the IGN (French National Institute of Geographic and Forest Information). Landform classifications and the topographic wetness index (TWI) were derived from the DEM using the Topography Tools for ArcGIS 10.3 and earlier [40] (Figure 2).
2.4. SOC Content Prediction Models
The partial least squares regression (PLSR) method was chosen to construct SOC prediction models based on the bare soil reflectance spectra extracted on each date from the sampling locations. The PLSR relates a matrix X consisting of explanatory variables (spectral reflectance bands and covariates) to a dependent variable Y (SOC content) using a linear multivariate model; this method is also characterized by modeling the structures of X and Y [41,42].
The number of samples per sampling year with bare soil pixels varied among the S2 image dates. Therefore, due to the reduced number, or even the absence, of soil samples in some years, the models’ performances were not evaluated according to year but instead were evaluated using periods consisting of consecutive years. The soil samples were divided into four sampling periods: (i) 2005–2018, (ii) 2010–2018, (iii) 2015–2018, and (iv) (2016–2018), i.e., the most recent data available. Using these groups, it was possible to include soil samples collected over longer periods (within which the SOC content could have changed) as well as over shorter periods (within which SOC changes might be considered negligible) to compare the performances of the S2 models. Finally, PLSR SOC prediction models were first built using only the reflectance spectra of the S2 images with 10 selected spectral bands (Table 2) and were then built including S2 bands with moisture values extracted from SMPs as covariates (Figure 2).
When SM was included in the matrix of explanatory variables X as a band (covariate), the spectral and SM values were scaled and centered on the mean. The optimal number of latent variables was determined using the prediction residual error sum of squares (PRESS). A leave-one-out cross-validation procedure was applied [43]. The quality of model fit was evaluated using the root mean squared error of cross-validation (RMSECV), the coefficient of determination of cross-validation (Rcv²), the residual prediction deviation (RPDCV) and the ratio of performance to interquartile distance (RPIQCV). The models were constructed in RStudio Software version 1.1.453 using the “pls” package [44]. The relationships between the model residuals and the textures of the samples and selected digital terrain attributes (landform and TWI) were explored.
3. Results
The SOC content prediction performance was analyzed for the six S2 image dates and soil sampling periods using either S2 data only or S2 data together with surface SM.
3.1. Sentinel-2 Prediction Performance Variability and Relationships with Soil Attributes
The performance of the SOC content predictions varied according to the soil sampling periods and the dates of the S2 images, reaching RPD and RPIQ values ≥ 1.7 on two different dates (6 April and 26 May 2017) determined using the soil samples collected between 2016 and 2018. The measured SOC range of these models was ≤48.1 g.kg−1 (5.03–53.1 and 5–53.1 g.kg−1, respectively) (Table 4).

Table 4.
S2 prediction performance by date of image acquisition and soil sampling period. SOC content statistics for each set of soil sampling period used in the models (better performing models are in bold characters).
The best performances were obtained for most models using the set of samples from all S2 image dates collected between 2016 and 2018 (Table 4). The performances of the models obtained on 21 April and 21 May 2018 are rather poor. The poor performances of these models might be related to changes in soil roughness, e.g., those changes that were due to the soil plowing operations that were common during this period in plots where corn or sunflower were sown. Another factor contributing to model performance might be the formation of crusts on soil surfaces due to rainfall; for example, in the 2018 soil sample collection, crusting on the soil surfaces of some plots was visually observed. Table 3 shows that there was rainfall on the same day that image S2 was taken as well as three days earlier on 21 May 2018, which could explain, at least in some plots, the formation of surface crust that could affect model performance.
S2 images from all dates prior to use of the MG2 had clouds and shadows, with some having less than others. This may be due to the large size of the area and its proximity to the Pyrénées mountains. The best performances (6 April and 26 May 2017) presented low cloud and shadow coverage (13.12 and 7.15%, respectively) (Table 1). Conversely, 21 May 2018 had the highest percentage of cloud and shadow coverage (30.09%), and its RMSEcv value (>6.3 g.kg−1) was the highest among the models (2016–2018). In almost all of the scenes, most clouds and shadows were located on the tiles (T30TYN and T31TCH) closest to the Pyrénées mountains (Figure 1 and Figure 2 and Table 1). On 6 April and 26 May 2017, which had the images with the best predictions, a negative correlation trend was observed between SOC content levels and the spectral information from the S2 bands. In both models corresponding to the S2 dates of 6 April and 26 May 2017, there was no correlation between SOC and clay content in the soil samples (Figure 3), contrary to what was previously observed at a national scale [45] or in small regions [20]. The Pearson’s correlation matrix figure is important in our study because as described above the relationships between soil physical attributes such as clay and SOC can be different and lead to different conclusions when studies are done at different scales. Furthermore, it would be useful in further studies for SOC mapping to observe the correlation coefficients between the SOC values and the S2 image bands at single dates. Because, as observed in this work, the sensitivity of the satellite bands to different soil properties may vary not only considering the study area but also according to dates of acquisition of the S2 images. It is worth noting that in our study we found suitable correlations of spectral bands with soil properties (e.g., for SOC, r = −0.75 for the bands B2 to B8A of 6 April) (Figure 3). This approach might support the understanding of SOC variability for digital mapping as a baseline to be applied at national scales in order to obtain maps with better accuracy.
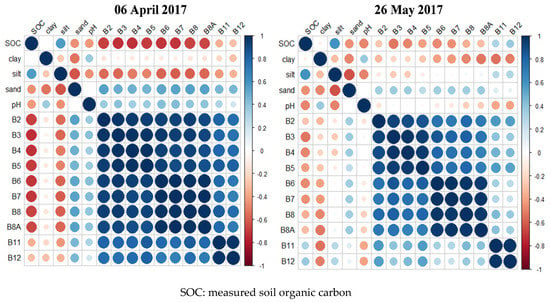
Figure 3.
Pearson’s correlation matrix among Sentinel-2 bands and soil properties (SOC, clay, silt, sand and pH) from the best-performing models.
3.2. S2 and SMP Prediction Performance
In this section, SM was included in the models that used soil samples collected between 2016 and 2018. Due to the limited number of samples with SM information, the number of samples used for the models was lower (between 13% and 46% less, according to the model) than in the first approach described in Section 3.1. Nevertheless, new models with lower sample density were created in order to assess whether the use of SM as a covariate influenced performance. The performance of the models including SM was not better than those considering the S2 bands, remaining almost the same (Table 5).

Table 5.
S2 prediction performance using surface soil moisture from soil moisture products (SMPs) as a covariate. SOC and SM statistics of the sample set used in the models (the models using SM as a covariate are in bold characters).
Figure 4 displays each SMP date and their respective histograms. The dates in 2017 (7 April and 25 May 2017) were characterized by having lower moisture content (15.76 ≥ mean ≥ 14.72) than the other dates, particularly those from 2018 (29.8 ≥ mean ≥19.8). No performance trend was shown for the soil moisture values from the set of samples used in each model (Table 5). The SMP dates were not exactly the same as those of the S2 images; in some cases, when the date difference was greater than 2 days, a rainfall event occurred between the 2 dates (Table 3). The roughness conditions, among other disturbing factors, were unknown for the dates studied herein, so it was not possible to assess their influence. This study does not intend to elucidate disturbing factors such as soil roughness but rather seeks to study the influence of SM on prediction performance.
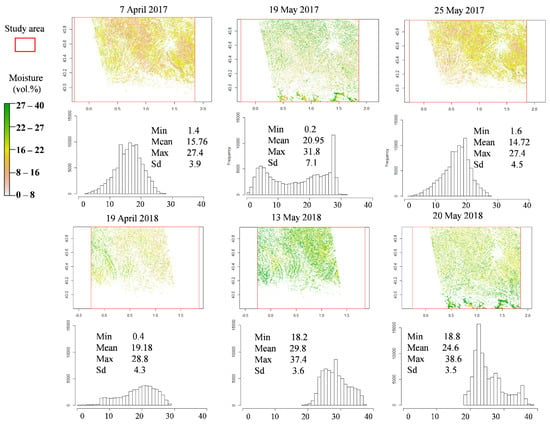
Figure 4.
Soil moisture products (SMPs) and their respective histograms.
3.3. Spatial Prediction and Characteristics of SOC Maps
Based on the best models in Section 3.1, two maps of predicted SOC contents were produced (Figure 5). The mean and SD of the predicted SOC content values were 21.4 and 6.9 g/kg for 6 April 2017 and 27.5 and 7.15 g/kg for 26 May 2017; the models exhibited moderate SD values (<7.2 g/kg). It is noteworthy that the range of predictions varied among the models, while both dates had similar ranges for the observed values for calibration samples (Table 4). However, the SOC map predicted for 26 May 2017 showed a wider prediction range than the previous model (6 April 2017). This variation as well as the moderate SD values of the model indicate rather stable predictive capability in an area with diverse soil types and landforms (Figure 5 and see, further Section 4.3).
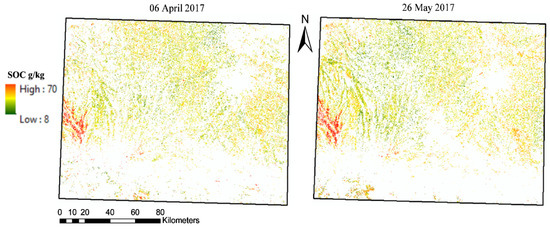
Figure 5.
SOC maps predicted.
4. Discussion
Laboratory and satellite remote sensing studies have shown that soil water content impairs SOC prediction accuracy, so this factor is generally either excluded or controlled for in order to ensure better performance predictions. However, in satellite imagery of croplands, factors related to the conditions of the imagery (clouds, shadows, sun elevation angle), the study area (SM, growing season, roughness, landform) and the agricultural practices (crop rotation, weed management) cannot be controlled. Indices are used to avoid some of these factors. However, if the seasonal relationship between SOC prediction performance and SM is known for a specific region, the best periods from a time series of S2 images can be inferred by considering SM information, improving the performance of SOC predictions.
4.1. Optimal Dates and Characteristics of S2 Images and Sampling Periods for SOC Prediction
S2’s capability for determining different soil attributes such as SOC for croplands has been studied recently due to its characteristics (spatial and temporal resolution), which allow soil monitoring at both the regional and national scales [20,46]. In this study, comparative analysis revealed that both soil sampling period and image date selection affected the accuracy of the SOC prediction models (Table 4). It was found that the prediction models achieved better accuracy when recent samples (2016–2018) were selected; poor performances were observed when sequentially old soil samples were incorporated into the prediction models. This could be due to the fact that SOC contents have decreased a lot over time; this is dependent on the duration of continuous maize cropping in particular [4,47]. The dates of the S2 images also influenced the accuracy of the models. This is consistent with the results of Vaudour et al. [21], who compared the performance of PLSR models using S2 imagery to predict SOC during different periods in the plain of Versailles, reporting variations in predictive capability for the imagery acquired between 2016 and 2017.
S2 has been widely used to map SOC on croplands in several locations using different approaches. For example, these approaches have included the use of single date images [20,21,23] and time series creating composite images of bare soil [22,27] including S2 data, other satellite sensors and environmental variables as inputs [28,48]. The SOC prediction performances in these studies were similar to those in this work. Castaldi et al. [23] achieved RPD values ≥2; however, RMSE values grew higher as the RPD increased. Although their performances were not as high (RPD ≤ 1.5), Vaudour et al. [20,21], obtained RMSE values lower than those found in this work (RMSE ≤ 5 g.kg−1). These results could be related to the different conditions of the study areas, e.g., soil type, relief, management practices, SOC ranges and even sensor accuracy. Moreover, some of the main limitations when determining soil attributes using satellite sensors are the percentages of bare soil available, clouds, vegetation, crop residues and soil moisture in the images, and, thus, algorithms and indices have been developed in order to reduce the effects of these factors (e.g., Demattê et al. [49]; Diek et al. [50]). However, satellite image characteristics such as sun elevation, percentages of clouds and shadows, roughness and SM are often neither related to the performances of the models nor studied in detail [21]. The acquisition conditions of the scenes, e.g., sun elevation angle, can change from one place to another; this is generally determined by the time and season of acquisition. Table 1 shows that all scenes had a sun elevation angle > 50°. Vaudour et al. [21] used images from the Versailles plain from different seasons with sun elevation angles between 16 and 52°. These authors observed that the accuracy of the models improved when the sun elevation angle was higher, achieving values of RMSE = 3.02 g.kg−1 and RPD = 1.5. In the present study, here the range of the angles was not as wide because all images were acquired in spring; therefore, no trend was found. When observing cloud cover and cloud shadows, the percentage of cloud cover was low on the best performing dates of 6 April and 26 May 2017 (Table 1). Further works could examine datasets from different sites in order to compare how image characteristics influence the model performance.
4.2. Impact of Soil Moisture
SM content influences spectral response and the quantification of soil attributes [51]. SOC detection performance is particularly sensitive to soil moisture [52,53]. Therefore, methods using spectral transformations have been proposed for lab measurements [53,54] and via satellites using spectral indices that generally combine infrared bands near the water response to reduce the effect of moisture [18,22,49]. Table 5 displays RPD and RPIQ values > 1.5 from 2017 and 2018. These performances are higher than those in Table 4. The performance of the models did not improve when including SM as a covariate (Table 5); however, as mentioned in the results section above, the number of samples considered for these models was smaller, so the lower number of calibration points may have impeded the performance of the models including SM.
Figure 6 displays the importance of spectral bands and SM when it was considered in the models. The most important bands were detected in the SWIR region (B11 and B12). Studies have found similar results for SOC prediction using S2 bands [20,25]. Castaldi et al. [23] reported that the importance of bands in PLSR regression models can be different depending the study area and soil physical attributes; bands 11 and 12 in all areas of their study were the most important. Regarding SM its importance was the lowest, this confirms the results (see Table 5 and Figure 6). Moreover, the best performances considering only the S2 bands were obtained for the driest periods (Table 4; Figure 4). Rienzi et al. [52] estimated SOC using a spectrometer with different percentages of water content and found that prediction accuracy was the best (RMSE ≤ 6.38 g.kg−1) and there was a larger range in predictions when water content was between 0 and 15%, whereas when the water content was between 20 and 25%, the accuracy was lower (RMSE ≥ 7.06 g.kg−1) and the range of predictions was very narrow. Vaudour et al. [22] obtained similar results with S2 images, although they did not use SM as an input in the models. In addition, their best performances were associated with lower mean SMP values (21.1 ≥ vol.% ≥ 9.8). In our study, the SMP dates were not exactly the same as those of the S2 images (Table 3). In the models (6 April and 26 May 2017), there was exactly one day’s difference between the S2 images and the SMP, and rainfall events were null on and between these dates (Table 3), and therefore, we can deduce that changes in SM were negligible between these two dates. 19 May 2017, and 13 May 2018, presented rainfall values of 59 and 58 mm, respectively, which is consistent with the moisture values of the SMP (Figure 4). On 20 May 2018, no rainfall events were observed; however, three days earlier, rainfall occurred in the area (Table 3), which could explain the high values of the moisture image (Figure 4). The ideal situation could be when the last rain event would be long before both image dates (S2 and SM) with no rain event between the two dates.
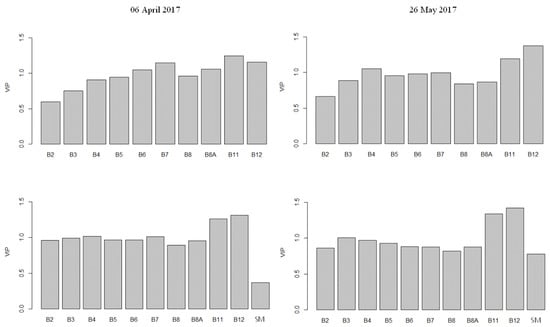
Figure 6.
Variable importance (VIP) of PLSR models considering S2 spectral bands (on the top) and S2 spectral bands plus SM (on the bottom).
4.3. Influence of Digital Terrain Attributes on the Predicted SOC Map
The French Pyrenean piedmont (southwest France) is characterized by the diversity of landforms in the area (Figure 7). The sample set used by the SOC prediction models in this study was mainly divided into two classes: “upper slopes/mesas” and “U-shaped valleys”. An analysis of their SOC content determined the predictive capability of the models, revealing that the highest values were on “upper slopes/mesas” (Figure 8). However, other studies have shown that often, soils located on upper slopes are shallow with low SOC content, while soils on lower slopes are deeper and moister with high SOC content [55,56].
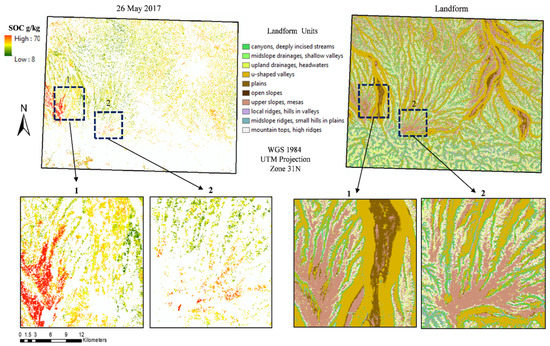
Figure 7.
Zooming into the SOC map and the landforms of the study area.
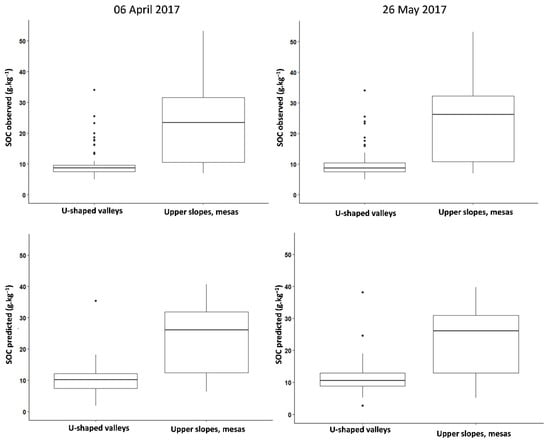
Figure 8.
Relationships between landforms and the SOC observed and predicted using the models from 6 April (left column) and 26 May 2017 (right column).
When considering texture, silty loam (SiLo) soil samples had higher SOC values; moreover, careful examination of the residues indicated underestimation of SOC values in silty textures and overestimation in clay loam (CILo) and clay (Cl) textures (Figure 9). It might be possible to infer that the overestimates were associated with calcareous soils, but the number of samples with CaCO3 values > 100 g.kg−1 was low (approximately 11 samples). Briefly, the results indicated high SOC contents on “upper slopes/mesas” with SiLo textures. Previous works covering three areas within the southwestern Pyrenean piedmont conducted by Arrouays et al. [47,57], Arrouays and Pelissier [4], Besnard et al. [58] reported the acidic, humic silty loam soils classified as “Veracrisols” in the French pedological reference base and as “Vermic Haplumbrepts” in soil taxonomy. These soils developed in Quaternary alluvial deposits and are rich in organic matter; in the past, forests existed on these deposits on ancient terraces, but from the early 1960s to present day, there has been progressive deforestation and conversion into croplands for continuous maize cropping [47,59]. Figure 7 shows that the maps predicted high SOC for two zones in the southwest of the study area (see zooms 1 and 2 on the map) with median values of 34 and 29 g.kg−1, respectively, in each zone. According to the landform map, these two highlighted areas are located on “upper slopes/mesas”, and most of the soil samples collected in these areas had SiLo textures; this confirms Arrouays et al. [57,59]’s description of ancient terraces in the study area as well as in more western parts of the Pyrenean piedmont. In other words, our predictions detected very high SOC values on this specific soilscape under the condition that enough bare soils were available on the S2 acquisition date.
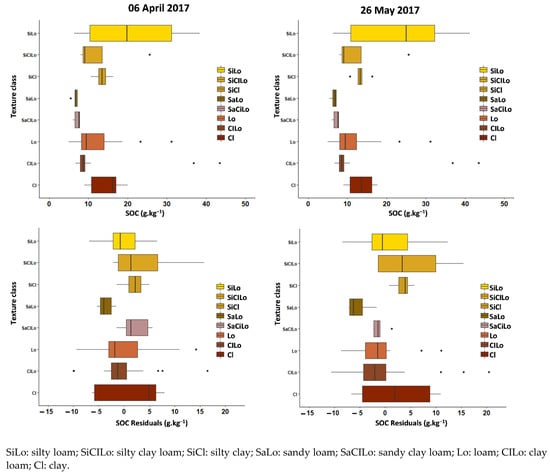
Figure 9.
Relationships between texture classes and observed SOC (up) and SOC prediction residuals (down) from models from 6 April (left column) and 26 May 2017 (right column).
As nearly all of the soils located on these ancient terrace soilscapes are under intensive continuous maize cropping (especially in the extreme southwestern part of the region), the soils are almost all bare during the same period, and if this period is dry, the prediction is fairly accurate. Moreover, this prediction has been performed for soils that still have high SOC [57], which should, therefore, be protected in order not to release CO2 in the atmosphere [60] through enhanced mineralization under intensive cultivation [47]. Further studies on these soils could help assess whether using different sets of S2 data could enable the monitoring of SOC decreases in this specific soilscape. Interestingly, these soils also have rather low clay content, showing that statistical relationships established at different scales [45] can lead to different conclusions. It is very likely that SOC mapping potential also differs depending upon scale and the region of interest. Thus, other case studies should use S1/S2 products to further explore the potential of SOC prediction as well as the effects of various disturbing factors.
Landforms as well as variables derived from relief and drainage networks influence digital soil mapping and carbon stock estimates [56,61]. Slope processes including erosion and runoff deposition are related to terrain attributes such as the topographic wetness index (TWI). Studies have reported TWI to be a strong predictor of SOC stocks, and it has been used in digital SOC mapping at various scales [28,48,62]. In this study, TWI was not used in the prediction models because it was not our main focus, but it was surprising to observe a slight trend from overestimations at lower TWI values (Q1 < 8.9) to underestimations at higher values (Q4 > 10.8) with the predicted SOC residuals in “U-shaped valleys” (Figure 10). This might be explained by the relationship between texture and prediction errors (Figure 9); this is in accordance with the Australian results reported by Minasny et al. [63], who observed that loamy texture soils, which were generally located in depressions, retained more moisture. However, rather than soil moisture for the dates shown in Figure 10, and as soil moisture was similar and lower than 18% vol. in median for both “U-shaped valley” and “upper slopes/ mesas” for such dates, TWI variation could be consistent with the percentage of coarse fragments of alluvial or colluvial origin, which was previously shown influent on spectral prediction errors [20]. Of course, it cannot be inferred from Figure 10 that TWI alone causes “U-shaped valleys” prediction errors.
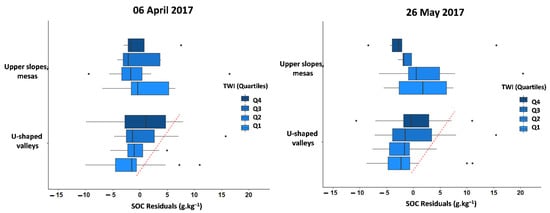
Figure 10.
Relationships between quartiles of the topographic wetness index (TWI) of landforms and SOC prediction residuals.
Finally, the formation of “soil surface slaking crusts” in some plots due to relief and soil attributes was analyzed. According to Aubert et al. [64] and de Jong et al. [65], in regions with silty and loamy textures, soil crusting is commonly observed; this effect was seen in some locations during the field campaign conducted in June 2018, which indicates its possible occurrence in the study area. The results obtained using Boiffin’s method [36] showed higher values for sensitivity to slaking in the prediction errors for “upper slopes /mesas”. However, the values for the indices of sensitivity to slaking were either low or very low according to Boiffin’s classification, and therefore, it is unlikely that they affected model performances. Moreover, sensitivity to slaking does not necessarily imply crusting, which also depends on rainfall intensity and on the structure of the soil surface before a rainfall event. Thus, although it has been experimentally shown that very silty soils in this region may become sensitive to slaking when they have low SOC contents [66], this sensitivity does not necessarily result in crusting during all periods. This research did not focus on all of the different factors that can limit the DSM of SOC via satellite imagery but rather on how differences among soil sampling dates and using S2 images and SM as inputs could influence SOC prediction performance. However, it is worth mentioning that although this work cannot provide a detailed explanation for all of the disturbing factors, some of them were evidenced. Therefore, it would be interesting for further studies to analyze data sets from different sites in order to evaluate effects related to satellite imagery characteristics by date, effects related to the SM obtained from SMPs and effects associated with digital terrain attributes, soil type and/or land-use history. In addition, the use of composite images might extend the areas of bare soil to be researched during dry and wet periods. Information on roughness and management practices and fieldwork surveys observing soil crust could be useful for SOC mapping.
5. Conclusions
This study confirms the previous statement according to which dates of acquisition of S2 images are crucial [21]. It is original in extending such statement to the dates of soil sampling periods, whichaffect SOC prediction. Depending on dynamics of soil organic carbon storage, it is not advisable to use too old samples (>3–5 years in this study), but some samples older than the acquisition years may be used, thus enabling to gather datasets of sufficient size, better capturing the spatial and spectral diversity of the soilscape units.
The performance of a single date may be related to factors disturbing satellite prediction sensitivity such as the circumstantial conditions present in the study area (SM and soil roughness generated by agricultural operations or natural events). Although the combined use of S2 images and SMPs derived from S1 and S2 sensors had no impact on the performance of the models, this work highlights that SMPs can be used to select the best periods for digital SOC mapping. Indeed, all results converge to demonstrate that the driest periods are the best suited for mapping SOC on bare soils.
Landform analysis as well as previous digital soil mapping studies conducted in this region have clearly demonstrated that S2 is able to distinguish high SOC content in “upper slopes/mesas” on rather large Quaternary silty alluvial deposits. In other words, S2 was able to map a specific soilscape characterized by high SOC content. This is an important finding, as mapping soils with high SOC content may be a very useful tool for the implementation of practices protecting these soils (for example, favoring cover-crops in winter). Moreover, these results suggest that S2 products can be used as tools to monitor large decreases in SOC content in this specific soilscape. However, more detailed analyses of the use of SMPs in single-date or composite images should be conducted in order to determine whether these products are useful for choosing the best prediction dates and periods and/or whether including SMP values as covariates in synergy with S2 imagery and terrain-derived covariates could improve digital SOC mapping and monitoring performance in areas with different conditions (climate, topography, soil and soil genesis).
Author Contributions
Conceptualization, D.U.-S., E.V., A.C.R.-d.-F. and D.A.; methodology, D.U.-S., E.V. and D.A.; resources, N.B., E.C., S.L., A.C.R.-d.-F. and D.A.; writing, D.U.-S., E.V., D.A., A.C.R.-d.-F., N.B. and E.C. All authors have read and agreed to the published version of the manuscript.
Funding
This work was carried out in the framework of the POLYPHEME project through the TOSCA program of the CNES (grant number 200769/id5917) and in the framework of the STEROPES project of the EJP-SOIL Horizon H2020 (grant number 862695). It was also supported by Programme National de Télédétection Spatiale through TELEMOS project (PNTS, http://programmes.insu.cnrs.fr/pnts/, accessed on 12 December 2021), grant n° PNTS-2020-17). The first author benefited PhD grant funding by both INRAE and ADEME.
Institutional Review Board Statement
Not applicable.
Informed Consent Statement
Not applicable.
Data Availability Statement
The data presented in this study are available on request from the corresponding author.
Acknowledgments
D.A. and A.C.R.-d.-F. are members of the research consortium GLADSOILMAP supported by the Loire Valley STUDIUM Institute for Advanced Research Studies.
Conflicts of Interest
The authors declare no conflict of interest.
References
- FAO; ITPS. Global Soil Organic Map V1.5: Technical Report; FAO: Quebec City, QC, Canada; ITPS: Den Haag, The Netherlands, 2020; ISBN 9789251321447. [Google Scholar]
- Smith, P.; Bustamante, M.; Ahammad, H.; Clark, H.; Dong, H.; Elsiddig, E.A.; Haberl, H.; Harper, H.; House, J.; Jafari, M.; et al. Agriculture, Forestry and Other Land Use (AFOLU). Climate Change 2014: Mitigation of Climate Change. Contribution of Working Group III to the Fifth Assessment Report of the Intergovernmental Panel on Climate Change. In Climate Change 2014 Mitigation of Climate Change; IPCC: Geneva, Switzerland, 2014; pp. 811–922. [Google Scholar]
- Schlesinger, W. Soil organic matter: A source of atmospheric CO2. Role Terr. Veg. Glob. Carbon Cycle Meas. Remote Sens. 1984, 4, 111–127. [Google Scholar]
- Arrouays, D.; Pelissier, P. Changes in carbon storage in temperate humic loamy soils after forest clearing and continuous corn cropping in France. Plant Soil 1994, 160, 215–223. [Google Scholar] [CrossRef]
- Jolivet, C.; Arrouays, D.; Andreux, F.; Lévêque, J. Soil organic carbon dynamics in cleared temperate forest spodosols converted to maize cropping. Plant Soil 1997, 191, 225–231. [Google Scholar] [CrossRef]
- Minasny, B.; Malone, B.P.; McBratney, A.; Angers, D.A.; Arrouays, D.; Chambers, A.; Chaplot, V.; Chen, Z.-S.; Cheng, K.; Das, B.S.; et al. Soil carbon 4 per mille. Geoderma 2017, 292, 59–86. [Google Scholar] [CrossRef]
- Costa, C.; Seabauer, M.; Schwarz, B.; Dittmer, K.; Wollenberg, E. Scaling Soil Organic Carbon Sequestration for Climate Change Mitigation; CGIAR Research Program on Climate Change, Agriculture and Food Security (CCAFS): Wageningen, The Netherlands, 2021. [Google Scholar]
- Smith, P.; Soussana, J.-F.; Angers, D.; Schipper, L.; Chenu, C.; Rasse, D.P.; Batjes, N.H.; van Egmond, F.; McNeill, S.; Kuhnert, M.; et al. How to measure, report and verify soil carbon change to realize the potential of soil carbon sequestration for atmospheric greenhouse gas removal. Glob. Chang. Biol. 2020, 26, 219–241. [Google Scholar] [CrossRef] [Green Version]
- Hengl, T.; Heuvelink, G.B.M.; Kempen, B.; Leenaars, J.G.B.; Walsh, M.G.; Shepherd, K.D.; Sila, A.; Macmillan, R.A.; De Jesus, J.M.; Tamene, L.; et al. Mapping soil properties of Africa at 250 m resolution: Random forests significantly improve current predictions. PLoS ONE 2015, 10, e0125814. [Google Scholar] [CrossRef]
- Mulder, V.; Lacoste, M.; Richer-De-Forges, A.; Martin, M.; Arrouays, D. National versus global modelling the 3D distribution of soil organic carbon in mainland France. Geoderma 2016, 263, 16–34. [Google Scholar] [CrossRef]
- Poggio, L.; de Sousa, L.M.; Batjes, N.H.; Heuvelink, G.B.M.; Kempen, B.; Ribeiro, E.; Rossiter, D. SoilGrids 2.0: Producing soil information for the globe with quantified spatial uncertainty. SOIL 2021, 7, 217–240. [Google Scholar] [CrossRef]
- Guevara, M.; Arroyo, C.; Brunsell, N.; Cruz, C.O.; Domke, G.; Equihua, J.; Etchevers, J.; Hayes, D.; Hengl, T.; Ibelles, A.; et al. Soil Organic Carbon Across Mexico and the Conterminous United States (1991–2010). Glob. Biogeochem. Cycles 2020, 34, e2019GB006219. [Google Scholar] [CrossRef]
- Hengl, T.; De Jesus, J.M.; MacMillan, R.A.; Batjes, N.H.; Heuvelink, G.B.M.; Ribeiro, E.; Samuel-Rosa, A.; Kempen, B.; Leenaars, J.G.; Walsh, M.G.; et al. SoilGrids1km—Global Soil Information Based on Automated Mapping. PLoS ONE 2014, 9, e105992. [Google Scholar] [CrossRef] [Green Version]
- Stevens, A.; van Wesemael, B.; Bartholomeus, H.; Rosillon, D.; Tychon, B.; Ben-Dor, E. Laboratory, field and airborne spectroscopy for monitoring organic carbon content in agricultural soils. Geoderma 2008, 144, 395–404. [Google Scholar] [CrossRef] [Green Version]
- Gomez, C.; Lagacherie, P.; Coulouma, G. Regional predictions of eight common soil properties and their spatial structures from hyperspectral Vis–NIR data. Geoderma 2012, 189–190, 176–185. [Google Scholar] [CrossRef]
- Stevens, A.; Udelhoven, T.; Denis, A.; Tychon, B.; Lioy, R.; Hoffmann, L.; van Wesemael, B. Measuring soil organic carbon in croplands at regional scale using airborne imaging spectroscopy. Geoderma 2010, 158, 32–45. [Google Scholar] [CrossRef]
- Ou, D.; Tan, K.; Lai, J.; Jia, X.; Wang, X.; Chen, Y.; Li, J. Semi-supervised DNN regression on airborne hyperspectral imagery for improved spatial soil properties prediction. Geoderma 2020, 385, 114875. [Google Scholar] [CrossRef]
- Castaldi, F.; Chabrillat, S.; Don, A.; Van Wesemael, B. Soil Organic Carbon Mapping Using LUCAS Topsoil Database and Sentinel-2 Data: An Approach to Reduce Soil Moisture and Crop Residue Effects. Remote Sens. 2019, 11, 2121. [Google Scholar] [CrossRef] [Green Version]
- Salazar, D.F.; Demattê, J.A.; Vicente, L.E.; Guimarães, C.C.; Sayão, V.M.; Cerri, C.E.; Padilha, M.C.D.C.; Mendes, W.D.S. Emissivity of agricultural soil attributes in southeastern Brazil via terrestrial and satellite sensors. Geoderma 2019, 361, 114038. [Google Scholar] [CrossRef]
- Vaudour, E.; Gomez, C.; Fouad, Y.; Lagacherie, P. Sentinel-2 image capacities to predict common topsoil properties of temperate and Mediterranean agroecosystems. Remote Sens. Environ. 2019, 223, 21–33. [Google Scholar] [CrossRef]
- Vaudour, E.; Gomez, C.; Loiseau, T.; Baghdadi, N.; Loubet, B.; Arrouays, D.; Ali, L.; Lagacherie, P. The Impact of Acquisition Date on the Prediction Performance of Topsoil Organic Carbon from Sentinel-2 for Croplands. Remote Sens. 2019, 11, 2143. [Google Scholar] [CrossRef] [Green Version]
- Vaudour, E.; Gomez, C.; Lagacherie, P.; Loiseau, T.; Baghdadi, N.; Urbina-Salazar, D.; Loubet, B.; Arrouays, D. Temporal mosaicking approaches of Sentinel-2 images for extending topsoil organic carbon content mapping in croplands. Int. J. Appl. Earth Obs. Geoinf. 2021, 96, 102277. [Google Scholar] [CrossRef]
- Castaldi, F.; Hueni, A.; Chabrillat, S.; Ward, K.; Buttafuoco, G.; Bomans, B.; Vreys, K.; Brell, M.; van Wesemael, B. Evaluating the capability of the Sentinel 2 data for soil organic carbon prediction in croplands. ISPRS J. Photogramm. Remote Sens. 2018, 147, 267–282. [Google Scholar] [CrossRef]
- Vaudour, E.; Gilliot, J.M.; Bel, L.; Lefevre, J.; Chehdi, K. Regional prediction of soil organic carbon content over temperate croplands using visible near-infrared airborne hyperspectral imagery and synchronous field spectra. Int. J. Appl. Earth Obs. Geoinf. 2016, 49, 24–38. [Google Scholar] [CrossRef]
- Žížala, D.; Minařík, R.; Zádorová, T. Soil Organic Carbon Mapping Using Multispectral Remote Sensing Data: Prediction Ability of Data with Different Spatial and Spectral Resolutions. Remote Sens. 2019, 11, 2947. [Google Scholar] [CrossRef]
- Biney, J.K.; Saberioon, M.; Boruvka, L.; Houška, J.; Vašát, R.; Chapman Agyeman, P.; Coblinski, J.; Klement, A. Exploring the Suitability of UAS-Based Multispectral Images for Estimating Soil Organic Carbon: Comparison with Proximal Soil Sensing and Spaceborne Imagery. Remote Sens. 2021, 13, 308. [Google Scholar]
- Silvero, N.E.Q.; Demattê, J.A.M.; Amorim, M.T.A.; dos Santos, N.V.; Rizzo, R.; Safanelli, J.L.; Poppiel, R.R.; Mendes, W.D.S.; Bonfatti, B.R. Soil variability and quantification based on Sentinel-2 and Landsat-8 bare soil images: A comparison. Remote Sens. Environ. 2020, 252, 112117. [Google Scholar] [CrossRef]
- Zhou, T.; Geng, Y.; Chen, J.; Pan, J.; Haase, D.; Lausch, A. High-resolution digital mapping of soil organic carbon and soil total nitrogen using DEM derivatives, Sentinel-1 and Sentinel-2 data based on machine learning algorithms. Sci. Total Environ. 2020, 729, 138244. [Google Scholar] [CrossRef] [PubMed]
- El Hajj, M.; Baghdadi, N.; Zribi, M.; Bazzi, H. Synergic Use of Sentinel-1 and Sentinel-2 Images for Operational Soil Moisture Mapping at High Spatial Resolution over Agricultural Areas. Remote Sens. 2017, 9, 1292. [Google Scholar] [CrossRef] [Green Version]
- Bazzi, H.; Baghdadi, N.; El Hajj, M.; Zribi, M.; Belhouchette, H. A Comparison of Two Soil Moisture Products S2MP and Copernicus-SSM Over Southern France. IEEE J. Sel. Top. Appl. Earth Obs. Remote Sens. 2019, 12, 3366–3375. [Google Scholar] [CrossRef]
- Guiresse, A.; Cambou, E.; Collin Bellier, C.; Denjean, A.; Falba, P.; Guigues, E.; Mouclier, M.; Muller, N.; Nesling, E.; Party, J.-P.; et al. Les Pédo-paysages des plaines centrales de Midi-Pyrénées. Etude Gest. Des Sols 2014, 21, 77–84. [Google Scholar]
- Redon, P.-O.; Bur, T.; Guiresse, M.; Probst, J.-L.; Toiser, A.; Revel, J.-C.; Jolivet, C.; Probst, A. Modelling trace metal background to evaluate anthropogenic contamination in arable soils of south-western France. Geoderma 2013, 206, 112–122. [Google Scholar] [CrossRef] [Green Version]
- Arrouays, D.; Richer-De-Forges, A.C.; Héliès, F.; Mulder, V.L.; Saby, N.P.; Chen, S.; Martin, M.P.; Dobarco, M.R.; Follain, S.; Jolivet, C.; et al. Impacts of national scale digital soil mapping programs in France. Geoderma Reg. 2020, 23, e00337. [Google Scholar] [CrossRef]
- Jones, A.; Fernandez Ugalde, O.; Scarpa, S. LUCAS 2015 Topsoil Survey; EUR 30332 EN, JRC121325; Publications Office of the European Union: Luxembourg, 2020; ISBN 978-92-76-21080-1. (online). [Google Scholar] [CrossRef]
- Moeys, J. The Soil Texture Wizard: R Functions for Plotting, Classifying, Transforming and Exploring Soil Texture Data. R Pack-Age, Version 1.2.13, R Vignette; 2018, p. 104. Available online: https://cran.r-project.org/web/packages/soiltexture/vignettes/soiltexture_vignette.pdf (accessed on 12 December 2021).
- Boiffin, J. La Dégradation Structurale des Couches Superficielles des Sols Sous l’action des Pluies. Ph.D. Thesis, Sciences du Vi-vant [q-bio]. Institut National Agronomique Paris Grignon, Paris, France, 1984. (In French). [Google Scholar]
- Baetens, L.; Desjardins, C.; Hagolle, O. Validation of Copernicus Sentinel-2 Cloud Masks Obtained from MAJA, Sen2Cor, and FMask Processors Using Reference Cloud Masks Generated with a Supervised Active Learning Procedure. Remote Sens. 2019, 11, 433. [Google Scholar] [CrossRef] [Green Version]
- Baghdadi, N.; El Hajj, M.; Zribi, M.; Bousbih, S. Calibration of the Water Cloud Model at C-Band for Winter Crop Fields and Grasslands. Remote Sens. 2017, 9, 969. [Google Scholar] [CrossRef] [Green Version]
- Baghdadi, N.; Holah, N.; Zribi, M. Calibration of the Integral Equation Model for SAR data in C-band and HH and VV polarizations. Int. J. Remote Sens. 2006, 27, 805–816. [Google Scholar] [CrossRef]
- Dilts, T.E. Topography Tools for ArcGIS 10.3 and Earlier. Available online: https://www.arcgis.com/home/item.html?id=b13b3b40fa3c43d4a23a1a09c5fe96b9 (accessed on 10 September 2021).
- Geladi, P.; Kowalski, B.R. Partial least-squares regression: A tutorial. Anal. Chim. Acta 1986, 185, 1–17. [Google Scholar] [CrossRef]
- Wold, S.; Sjöström, M.; Eriksson, L. PLS-regression: A basic tool of chemometrics. Chemom. Intell. Lab. Syst. 2001, 58, 109–130. [Google Scholar] [CrossRef]
- Wold, S. Cross-Validatory Estimation of the Number of Components in Factor and Principal Components Models. Technometrics 1978, 20, 397–405. [Google Scholar] [CrossRef]
- Mevik, B.-H.; Wehrens, R. The pls package: Partial least squares and principal component regression. J. Stat. Softw. 2007, 18, 1–24. [Google Scholar] [CrossRef] [Green Version]
- Arrouays, D.; Saby, N.; Walter, C.; Lemercier, B.; Schvartz, C. Relationships between particle-size distribution and organic carbon in French arable topsoils. Soil Use Manag. 2006, 22, 48–51. [Google Scholar] [CrossRef]
- Loiseau, T.; Chen, S.; Mulder, V.L.; Dobarco, M.R.; Richer-De-Forges, A.C.; Lehmann, S.; Bourennane, H.; Saby, N.P.A.; Martin, M.P.; Vaudour, E.; et al. Satellite data integration for soil clay content modelling at a national scale. Int. J. Appl. Earth Obs. Geoinf. 2019, 82, 101905. [Google Scholar] [CrossRef]
- Arrouays, D.; Girardin, C. Modelling organic carbon turnover in cleared temperate forest soils converted to maize cropping by using 13C natural abundance measurements. Plant Soil 1995, 173, 191–196. [Google Scholar] [CrossRef]
- Zhou, T.; Geng, Y.; Ji, C.; Xu, X.; Wang, H.; Pan, J.; Bumberger, J.; Haase, D.; Lausch, A. Prediction of soil organic carbon and the C:N ratio on a national scale using machine learning and satellite data: A comparison between Sentinel-2, Sentinel-3 and Landsat-8 images. Sci. Total Environ. 2020, 755, 142661. [Google Scholar] [CrossRef]
- Demattê, J.A.M.; Fongaro, C.T.; Rizzo, R.; Safanelli, J.L. Geospatial Soil Sensing System (GEOS3): A powerful data mining procedure to retrieve soil spectral reflectance from satellite images. Remote Sens. Environ. 2018, 212, 161–175. [Google Scholar] [CrossRef]
- Diek, S.; Fornallaz, F.; Schaepman, M.E.; De Jong, R. Barest Pixel Composite for Agricultural Areas Using Landsat Time Series. Remote Sens. 2017, 9, 1245. [Google Scholar] [CrossRef] [Green Version]
- Silvero, N.E.Q.; Raimo, L.A.D.L.D.; Pereira, G.S.; de Magalhães, L.P.; Terra, F.D.S.; Dassan, M.A.A.; Salazar, D.F.U.; Demattê, J.A. Effects of water, organic matter, and iron forms in mid-IR spectra of soils: Assessments from laboratory to satellite-simulated data. Geoderma 2020, 375, 114480. [Google Scholar] [CrossRef]
- Rienzi, E.A.; Mijatovic, B.; Mueller, T.G.; Matocha, C.J.; Sikora, F.J.; Castrignanò, A. Prediction of Soil Organic Carbon under Varying Moisture Levels using Reflectance Spectroscopy. Soil Sci. Soc. Am. J. 2014, 78, 958–967. [Google Scholar] [CrossRef]
- Minasny, B.; McBratney, A.; Bellon-Maurel, V.; Roger, J.-M.; Gobrecht, A.; Ferrand, L.; Joalland, S. Removing the effect of soil moisture from NIR diffuse reflectance spectra for the prediction of soil organic carbon. Geoderma 2011, 167–168, 118–124. [Google Scholar] [CrossRef] [Green Version]
- Tan, Y.; Jiang, Q.; Yu, L.; Liu, H.; Zhang, B. Reducing the Moisture Effect and Improving the Prediction of Soil Organic Matter with VIS-NIR Spectroscopy in Black Soil Area. IEEE Access 2021, 9, 5895–5905. [Google Scholar] [CrossRef]
- Meliyo, J.L.; Msanya, M.B.; Kimaro, D.N.; Massawe, J.B.H.; Hieronimo, P.; Mulungu, L.S.; Deckers, J.; Gulinck, H. Variability of soil organic carbon with landforms and land use in the Usambara Mountains of Tanzania. J. Soil Sci. Environ. Manag. 2016, 7, 123–132. [Google Scholar] [CrossRef]
- Patton, N.R.; Lohse, K.A.; Seyfried, M.S.; Godsey, S.E.; Parsons, S.B. Topographic controls of soil organic carbon on soil-mantled landscapes. Sci. Rep. 2019, 9, 6390. [Google Scholar] [CrossRef] [PubMed] [Green Version]
- Arrouays, D.; Vion, I.; Kicin, J.L. Spatial analysis and modeling of topsoil carbon storage in forest humic loamy soils of France. Soil Sci. 1995, 159, 191–198. [Google Scholar] [CrossRef]
- Besnard, E.; Chenu, C.; Balesdent, J.; Puget, P.; Arrouays, D. Fate of particulate organic matter in soil aggregates during cultivation. Eur. J. Soil Sci. 1996, 47, 495–503. [Google Scholar] [CrossRef]
- Arrouays, D.; Baize, D.; Hardy, M. Les sols de “touyas” issus d’alluvions anciennes des gaves pyrénéens: Veracrisols. In-tégration au Référentiel Pédologique. Sci. Du Sol. 1992, 30, 227–247. [Google Scholar]
- Martin, M.P.; Dimassi, B.; Dobarco, M.R.; Guenet, B.; Arrouays, D.; Angers, D.A.; Blache, F.; Huard, F.; Soussana, J.; Pellerin, S. Feasibility of the 4 per 1000 aspirational target for soil carbon: A case study for France. Glob. Chang. Biol. 2021, 27, 2458–2477. [Google Scholar] [CrossRef] [PubMed]
- Mello, F.A.O.; Demattê, J.A.M.; Rizzo, R.; Dotto, A.C.; Poppiel, R.R.; Mendes, W.D.S.; Guimarães, C.C.B. Expert-based maps and highly detailed surface drainage models to support digital soil mapping. Geoderma 2020, 384, 114779. [Google Scholar] [CrossRef]
- Thompson, J.A.; Pena-Yewtukhiw, E.M.; Grove, J.H. Soil–landscape modeling across a physiographic region: Topographic patterns and model transportability. Geoderma 2006, 133, 57–70. [Google Scholar] [CrossRef]
- Minasny, B.; Whelan, B.M.; Triantafilis, J.; McBratney, A.B. Pedometrics Research in the Vadose Zone-Review and Perspectives. Vadose Zone J. 2013, 12, vzj2012.0141. [Google Scholar] [CrossRef]
- Aubert, M.; Baghdadi, N.; Zribi, M.; Douaoui, A.; Loumagne, C.; Baup, F.; El Hajj, M.; Garrigues, S. Analysis of TerraSAR-X data sensitivity to bare soil moisture, roughness, composition and soil crust. Remote Sens. Environ. 2011, 115, 1801–1810. [Google Scholar] [CrossRef] [Green Version]
- de Jong, S.; Addink, E.; van Beek, L.; Duijsings, D. Physical characterization, spectral response and remotely sensed mapping of Mediterranean soil surface crusts. CATENA 2011, 86, 24–35. [Google Scholar] [CrossRef]
- LE Bissonnais, Y.; Arrouays, D. Aggregate stability and assessment of soil crustability and erodibility: II. Application to humic loamy soils with various organic carbon contents. Eur. J. Soil Sci. 1997, 48, 39–48. [Google Scholar] [CrossRef]
Publisher’s Note: MDPI stays neutral with regard to jurisdictional claims in published maps and institutional affiliations. |
© 2021 by the authors. Licensee MDPI, Basel, Switzerland. This article is an open access article distributed under the terms and conditions of the Creative Commons Attribution (CC BY) license (https://creativecommons.org/licenses/by/4.0/).