Review

Earth Observation Data-Driven Cropland Soil Monitoring: A Review

1
School of Agriculture, Faculty of Agriculture, Forestry and Natural Environment, Aristotle University of Thessaloniki, 54123 Thessaloniki, Greece
2
Department of Electrical and Computer Engineering, Faculty of Engineering, Aristotle University of Thessaloniki, 54123 Thessaloniki, Greece
3
Helmholtz Center Potsdam GFZ German Research Centre for Geosciences, Remote Sensing and Geoinformatics, Telegrafenberg, 14473 Potsdam, Germany
4
Institute of Soil Science, Leibniz University Hannover, Herrenhäuser Straße 2, 30419 Hannover, Germany
5
Department of Soil Science, Luiz de Queiroz College of Agriculture, University of São Paulo (ESALQ/USP), Av. Pádua Dias 11, CP9, Piracicaba 13418-900, SP, Brazil
6
The Remote Sensing Laboratory, Department of Geography, School of Earth Science, Tel-Aviv University, Tel Aviv-Yafo 39040, Israel
7
Department of Soil Science and Soil Protection, Faculty of Agrobiology, Food and Natural Resources, Czech University of Life Sciences Prague, Kamycka 129, 16500, Prague, Czech Republic
8
Georges Lemaître Centre for Earth and Climate Research, Earth and Life Institute, Université Catholique de Louvain, 1348 Louvain-la-Neuve, Belgium
*
Author to whom correspondence should be addressed.
Remote Sens. 2021, 13(21), 4439; https://doi.org/10.3390/rs13214439
Submission received: 6 October 2021 / Revised: 3 November 2021 / Accepted: 3 November 2021 / Published: 4 November 2021
(This article belongs to the Special Issue Remote Sensing for Soil Organic Carbon Mapping and Monitoring)

Abstract

:
We conducted a systematic review and inventory of recent research achievements related to spaceborne and aerial Earth Observation (EO) data-driven monitoring in support of soil-related strategic goals for a three-year period (2019–2021). Scaling, resolution, data characteristics, and modelling approaches were summarized, after reviewing 46 peer-reviewed articles in international journals. Inherent limitations associated with an EO-based soil mapping approach that hinder its wider adoption were recognized and divided into four categories: (i) area covered and data to be shared; (ii) thresholds for bare soil detection; (iii) soil surface conditions; and (iv) infrastructure capabilities. Accordingly, we tried to redefine the meaning of what is expected in the next years for EO data-driven topsoil monitoring by performing a thorough analysis driven by the upcoming technological waves. The review concludes that the best practices for the advancement of an EO data-driven soil mapping include: (i) a further leverage of recent artificial intelligence techniques to achieve the desired representativeness and reliability; (ii) a continued effort to share harmonized labelled datasets; (iii) data fusion with in situ sensing systems; (iv) a continued effort to overcome the current limitations in terms of sensor resolution and processing limitations of this wealth of EO data; and (v) political and administrative issues (e.g., funding, sustainability). This paper may help to pave the way for further interdisciplinary research and multi-actor coordination activities and to generate EO-based benefits for policy and economy.

1. Introduction

The interest in soils has recently increased since there pressures are being faced due to intensive agriculture, inappropriate land management practices (e.g., overuse of fertilizers), and the amplifying presence of climate change [1]. For instance, new policy regulations, such as the reform of the European Common Agricultural Policy (CAP) (see Abbreviations for a complete list of the abbreviations used in this study) and the Sustainable Development Goals (SDGs), have brought together the relevant stakeholders (e.g., farmers, policy makers, etc.) ahead of a great challenge to tackle soil health issues, e.g., to enhance Soil Organic Carbon (SOC), improve soil fertility, and address other issues. Despite this need for unbiased quantified information at high spatial resolution over a large geographical coverage area, the existing digital soil maps consist of rather coarse grid cells (i.e., 500 m × 500 m) and are based on legacy data that are not up to date.
Spaceborne and aerial Earth Observation (EO) means provide critical data sources for monitoring the soil ecosystem. EO has the potential to further support the needs of providing robust and widely affordable information services [2,3]. Thus, a radically new EO-based monitoring and service delivery framework promises to make it easier to identify potential critical areas, monitor trends, highlight policy successes or failures, and optimize gain from investments for various economic activities. Subsequently, an EO data-driven approach should be prioritized if progress towards the soil policy and economic strategic goals is to be accelerated.
Nowadays, EO is closely intertwined with the fourth industrial revolution since it is being driven by emerging technologies, such as artificial intelligence (AI), cloud computing, and more [4]. Undoubtedly, the forthcoming increase in low altitude systems (e.g., unmanned aerial systems (UAS)), along with space-based missions (from both space agencies and commercial providers) covering different spectral domains and obtaining data with higher spatial and temporal resolution, will result in a massive increase in EO big data. All of this and much more will usher in a new era in soil monitoring, redefining the meaning of what the future holds for EO data-driven soil monitoring and mapping.
The scope of this paper is twofold. First, we aim to complement previous efforts by reviewing this broad topic to provide a comprehensive updated review of what EO has to offer efficient topsoil monitoring and to highlight its current limitations. Then, we redefine the meaning of what is expected in the coming years by the emergence of new technological possibilities in support of informed decision making related to soil monitoring. For the purpose of this review, we neither focus on specific comparisons among the various methods or research findings nor do we recommend any single best way of using specific EO techniques for soil property estimation. Rather, we redirect the readers to more specific reviews or papers when necessary by citing the major references—and preferably, the most recent ones (2019 and onwards). We desire to further boost the development of scientific applications and raise awareness amongst key stakeholders (scientists, policy makers, farmers, etc.).
This paper, after a short presentation of the methodological framework, is divided into three main sections. The first section focuses on specific requirements in support of policy targets and market needs by presenting the main soil properties that could be estimated by EO. The second section provides an outline of the existing EO techniques that are relevant for topsoil monitoring and demonstrates the plethora of capabilities offered by AI to retrieve them accurately. Last, we provide a synthesis of the emerging opportunities that should strengthen the role of EO in providing robust services for the applications that were mentioned in the previous sections.

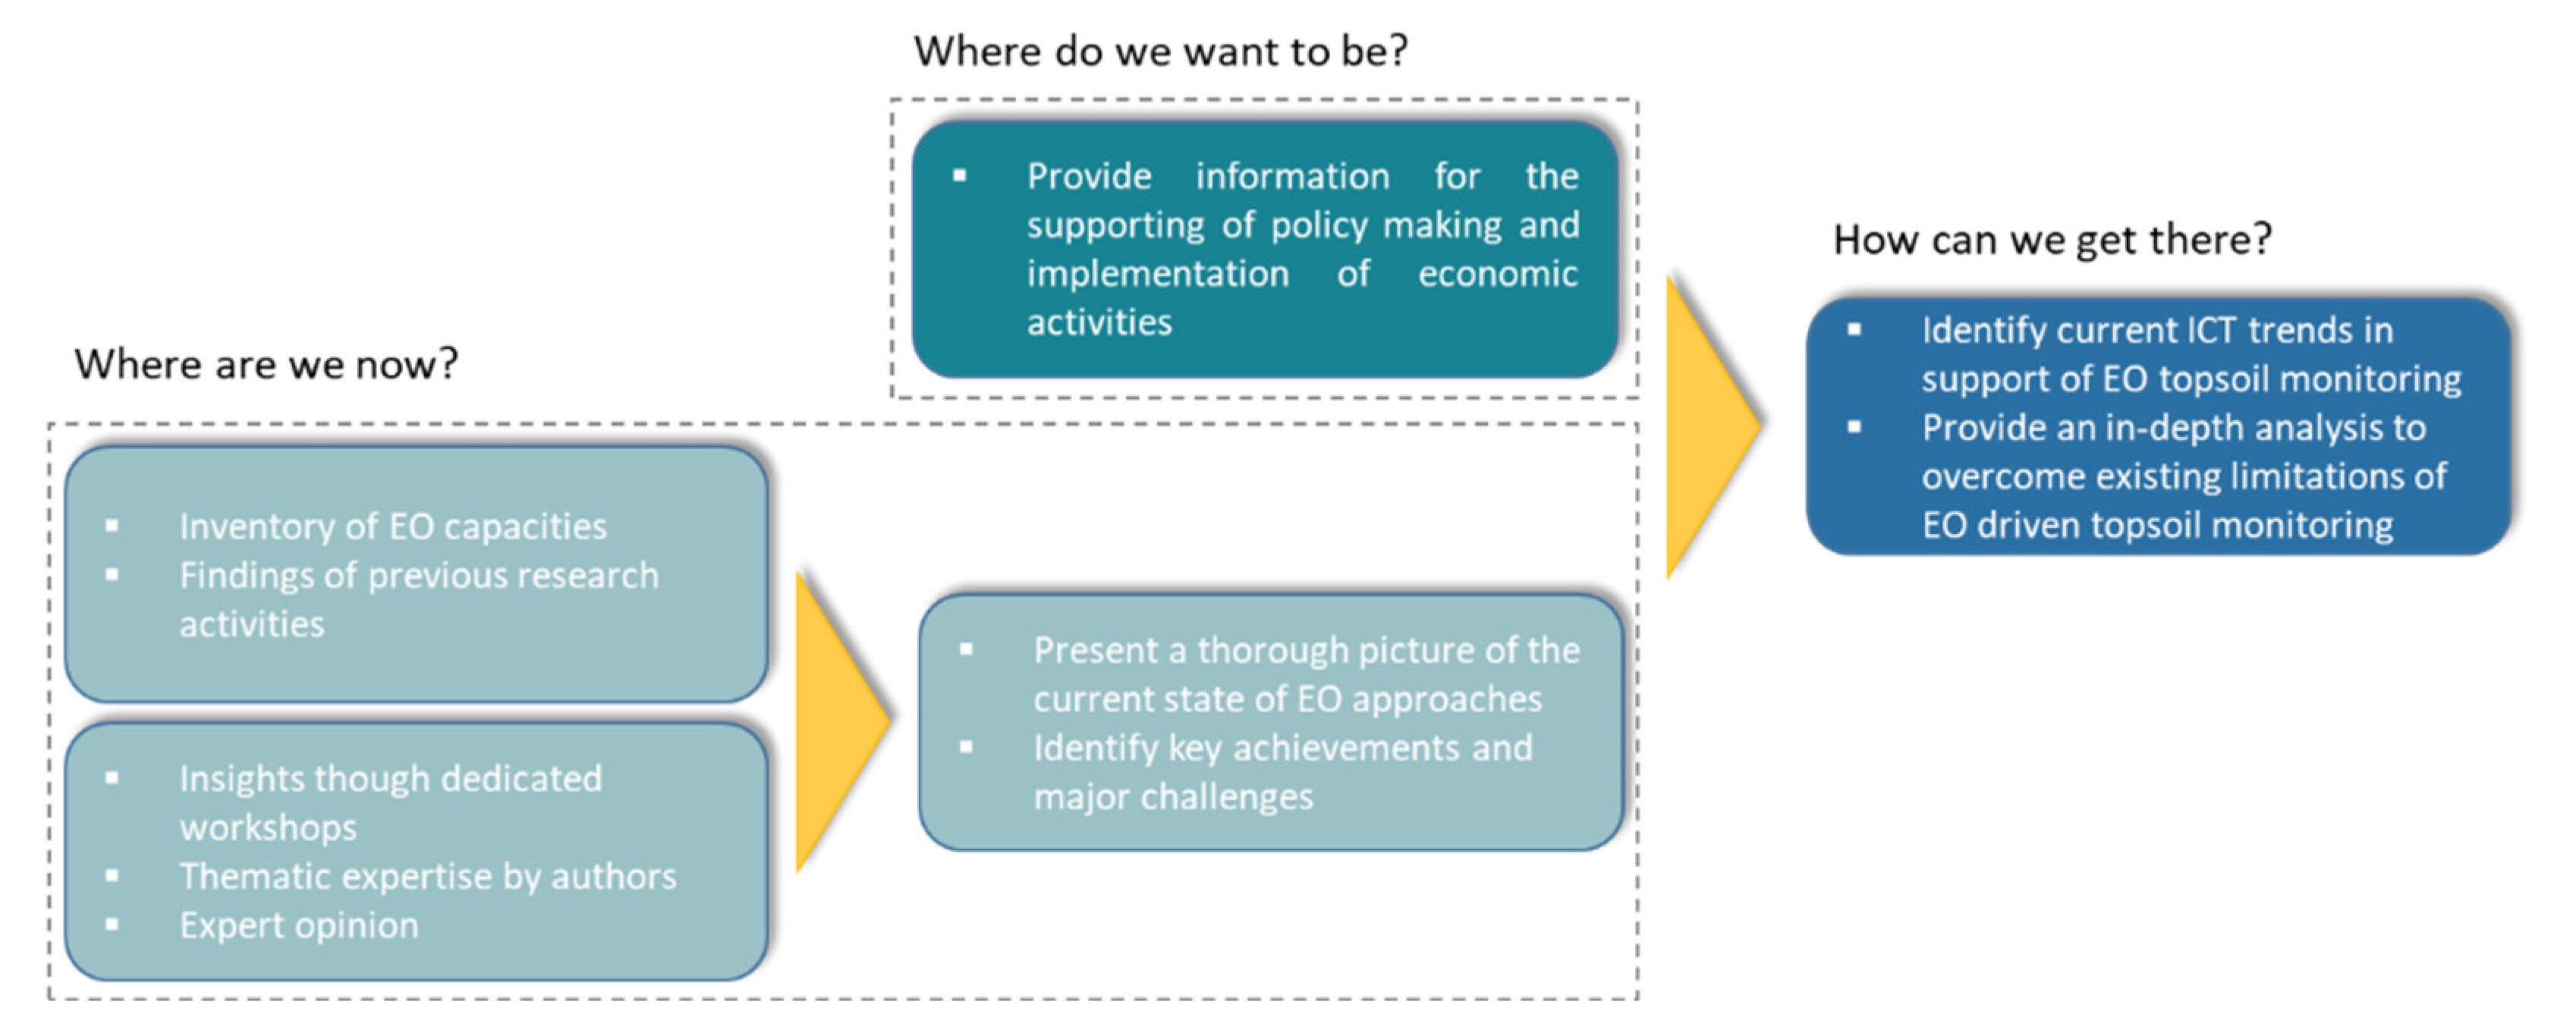
2. Methodological Framework

Essential information is urgently needed for the implementation of soil management systems in support of policy making and business activities (Where do we want to be?, Section 2.1). However, before we go on, we should present the methodology used throughout this work, allowing us to be in a position where we can seek evidence-based answers to understand the current landscape (Where are we now?, Section 2.2), and afterward, to draft meaningful insights regarding the provision of services able to support informed soil management decision making in the coming years (How can we get there?, Section 2.3). The methodology followed to develop this review, relied on three main steps (Figure 1).

2.1. Defining Policy Requirements and Market Needs

Policy makers have increasingly recognized the unprecedented pressure placed on the soil ecosystem and the role played by various economic sectors. Using the findings of the analysis by Keesstra et al. [5] and insights provided in the form of soil-related strategies, we extracted the priorities that were used to facilitate decisions in relation to the implementation of soil targets. Given that agriculture occupies an important percentage of the global land surface and has a strong interlinkage with the soil ecosystem, its contribution to the maintenance of soil resources is substantial. In that regard, this section summarizes the main international policies and treaties (the SDGs, the European CAP, Land Degradation Neutrality, and others) in which careful monitoring of specific soil properties is considered mandatory. Noteworthy here, it is also the vision of the European Commission and the Australian Government to set up and implement carbon farming schemes on their continents.

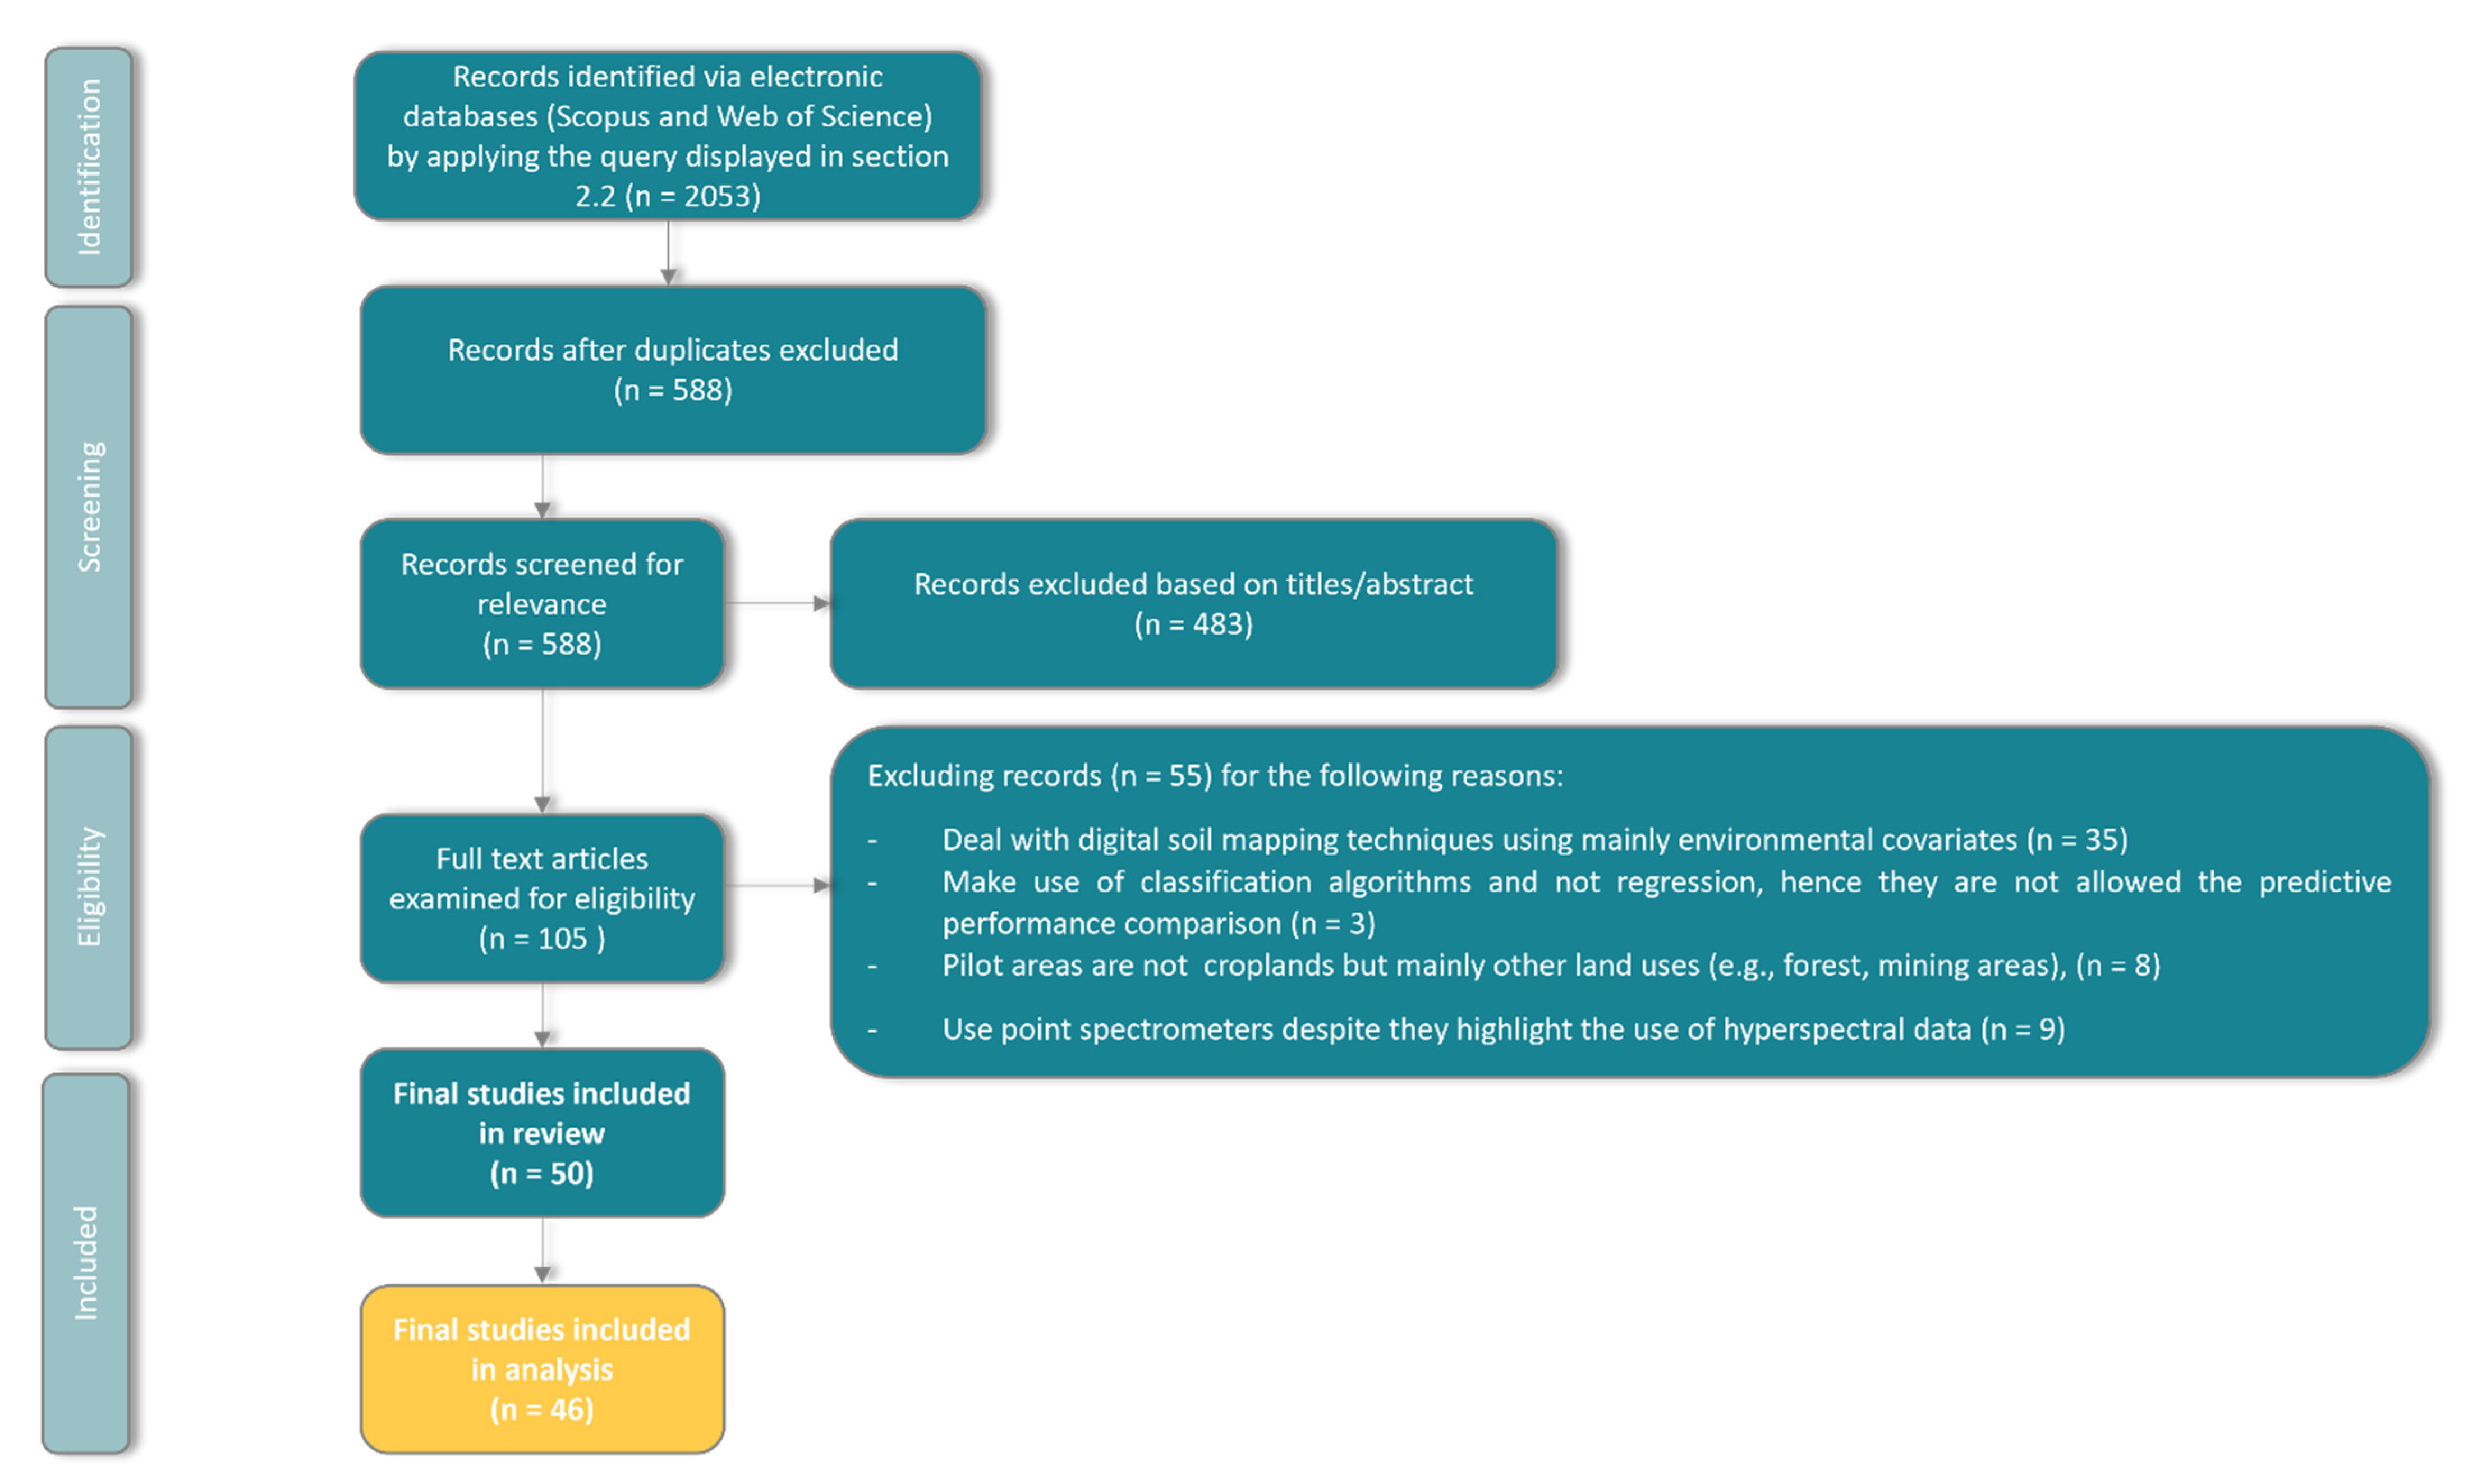
2.2. Constructing a Thorough View of the Current State of EO Approaches

To construct a thorough view of the current state-of-the-art of EO-based approaches to topsoil monitoring, a systematic literature review from 2019 to 2021 was conducted using Elsevier’s Scopus and the Web of Science citation databases. This time period was selected since it follows up on the recent reviews of Chabrillat et al. [6] and Angelopoulou et al. [7]; hence, the literature published before the reviews in 2019 were not considered in the current study. We based our analysis on the preferred reporting items for systematic reviews and meta-analyses methodology [8]. Some earlier articles that were deemed particularly relevant were also included. We carried out a keyword-based search, and we only focused on journal papers by applying the query below:
[“Earth observation” OR “Remote Sensing”] AND [“Soil Property”]
The keyword “Soil Property” refers to those properties that resulted from an analysis of the needs related to policy and market requirements for soil information. We found 588 potentially suitable studies, after removing the duplicates from the initial 2053 studies. We reached 105 potential studies after screening the relevance of the abstracts of each study. The full text of each study was then assessed for eligibility, and 55 studies were excluded that did not meet the criteria of this review (e.g., regression analysis, spectral imagery data, etc.). Finally, we selected 46 manuscripts written in the English language (see Appendix A). It should be mentioned that we focused on studies in the literature that directly applied AI algorithms either to spectral imagery or to reflectance composites that were built by merging large time series over agricultural areas, which is a topic that only recently emerged. We then executed an in-depth analysis of the selected papers, looking into the current state-of-the-art to identify (i) the dominant sources and types of EO data, (ii) the soil properties that were predicted, and (iii) the current limitations that hindered prediction performance and affected the quality of the soil data.
To complete the review with relevant grey literature, qualifying documents published by international agencies were considered. In this context, the conclusions of the 21st World Congress of Soil Science (held in 2018) summarized valuable research activities aimed at reporting innovative EO products or methods in response to authoritative end-users’ requirements, ranging from policy makers to individual farmers. In addition, the European Space Agency (ESA) organized a user consultation workshop (2019) to promote the use and uptake of EO among policy makers, informing them of the concrete benefits stemming from the use of EO in soil mapping. Last, the WORLDSOILS User Requirements Consolidation Workshop (held in 2021) reflected valuable insights towards the implementation of a SOC monitoring system based on EO satellite data, with the active involvement of stakeholders from the policy and user domain. Considering the output of these events and building on the authors’ rich scientific background and the preliminary state-of-the-art analysis described in the above paragraphs, we shaped a valuable pool of knowledge that will guide our research to provide an answer to the question “Where are we now?”

2.3. Shaping the Future of EO Data-Driven Soil Modeling

The domain of EO data-driven soil monitoring in terms of data and services is currently undergoing a significant shift. EO is being driven by emerging technologies, such as Deep Learning (DL), Blockchain, and Citizen Science, as well as by the ever-increasing availability and accessibility of forthcoming enhanced EO data in terms of spectral and spatial resolution from all domains (UAS to satellites). We focused on the emergence of new possibilities around these tech buzzwords. In particular, we utilized the following query:
[“Soil”] AND [“Blockchain” OR “Citizen Science”]
We focused on articles from 2019 to 2021 to include the most up-to-date trends in new technologies. Previous reviews and surveys [9] were further examined for related works. Considering the DL approaches, we reviewed the most recent architectures for evaluating whether they were “fit-for-purpose” in EO data-driven soil mapping activities.

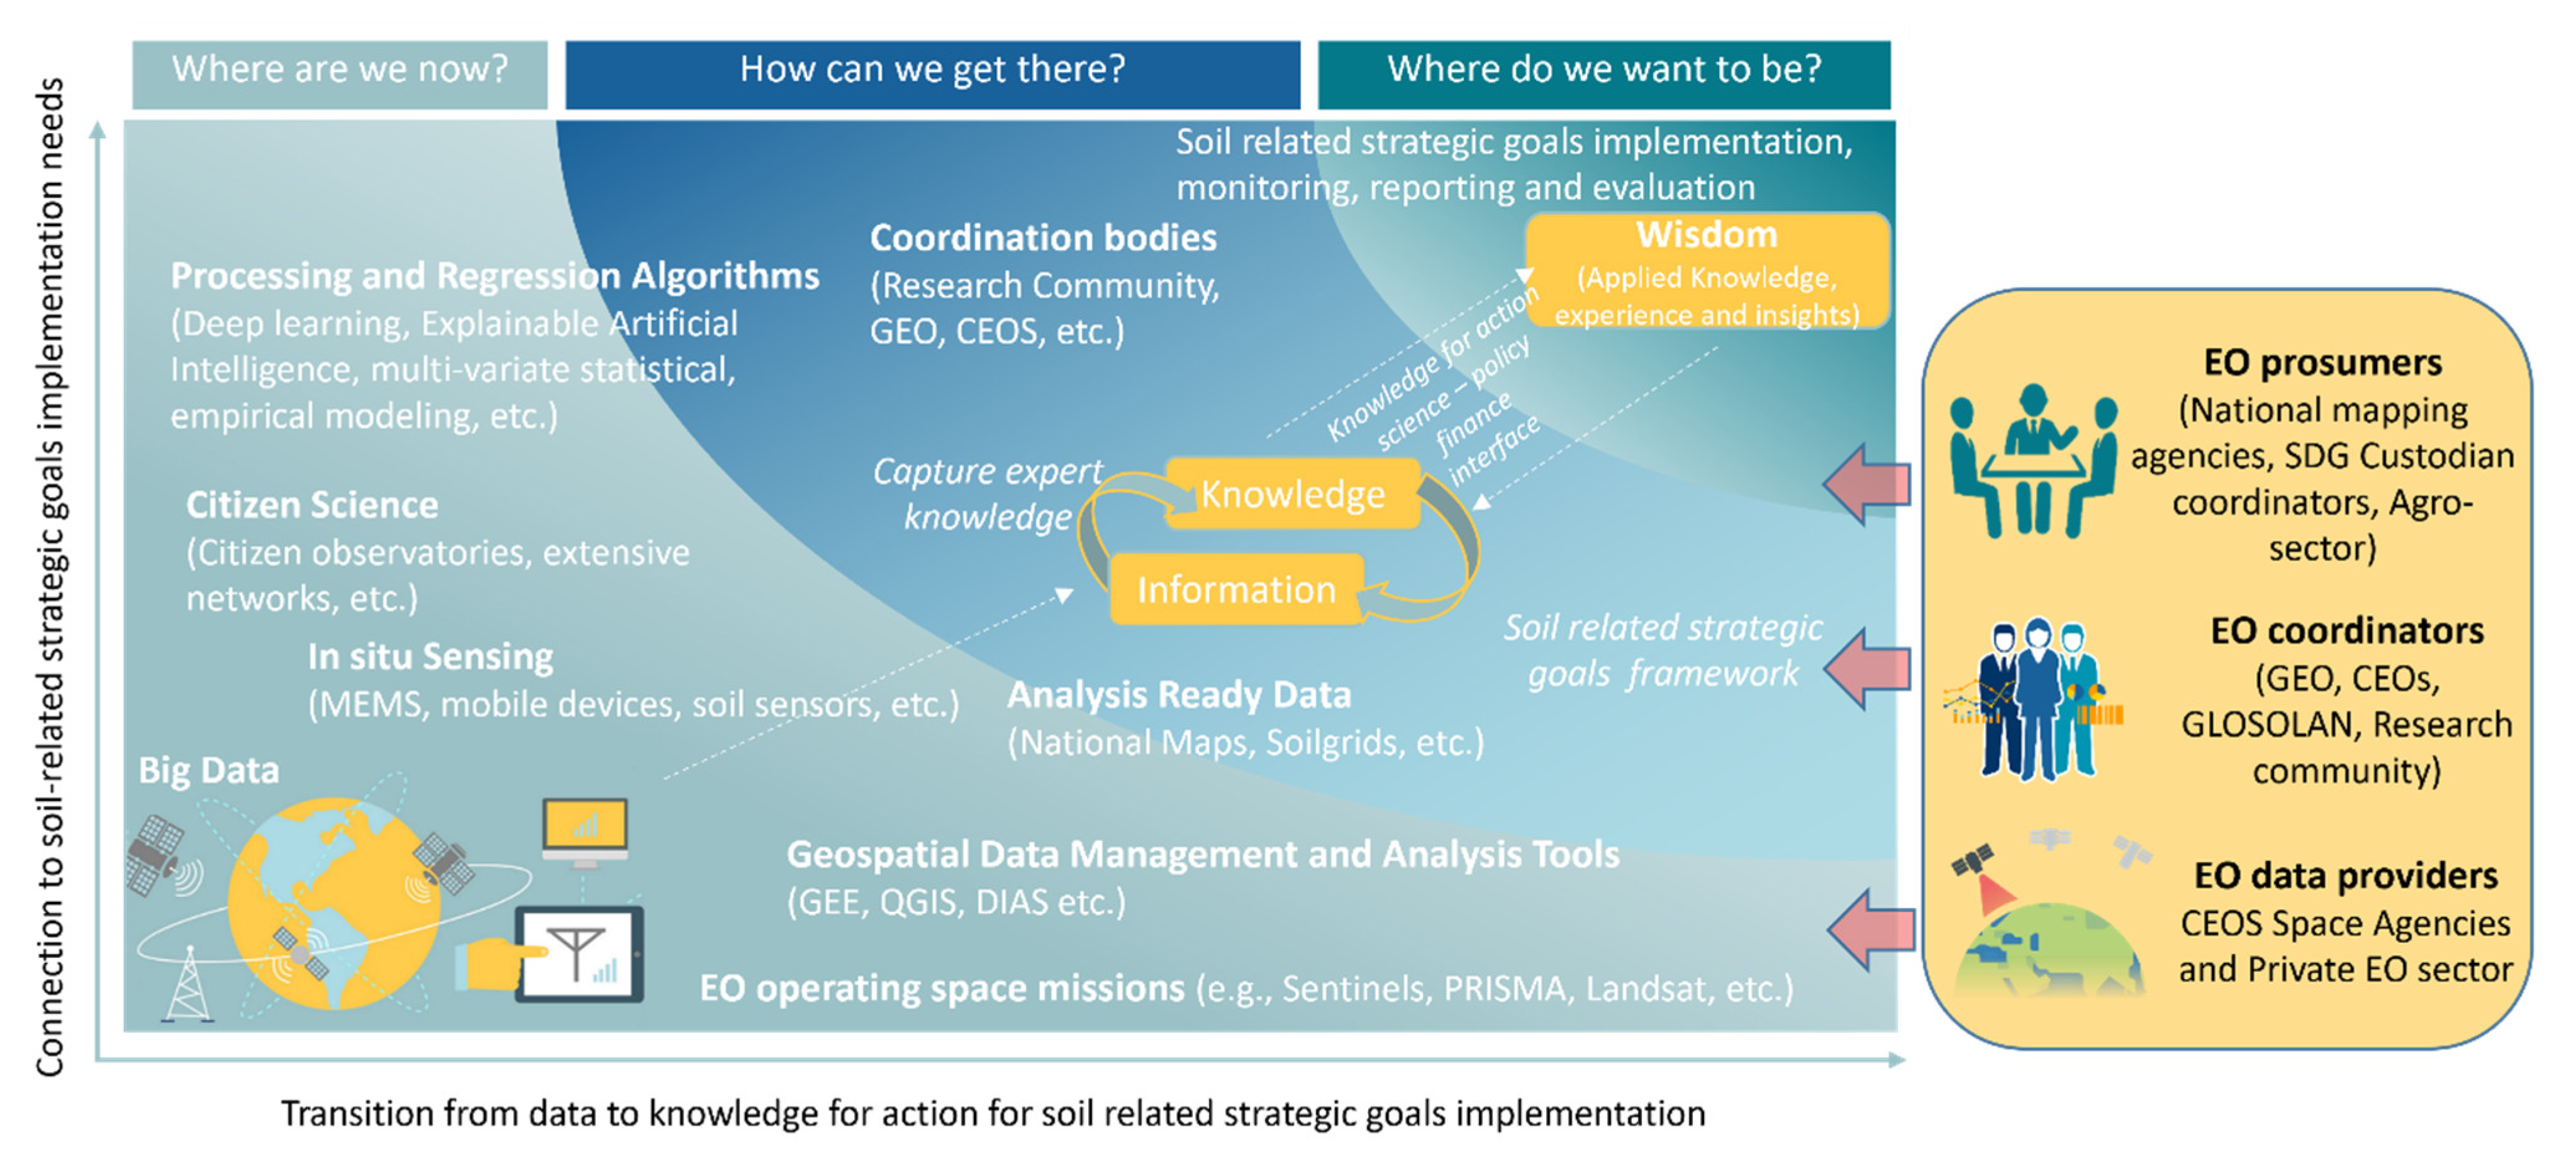
3. Understanding the Pathway from Data to Wisdom for Soil-Related Targets

This chapter lays out the analysis of a wealth of research findings collected throughout an extensive review procedure of current and forthcoming Information and Communications Technologies (ICT) related to EO-driven topsoil monitoring and potential improvements. Additionally, we focused on the main international policies, treaties, and business sectors in which soil monitoring is considered mandatory.
A set of soil spatial indicators is required to help decision makers and potential geospatial data users realize the value of these products as baseline information for downstream institutional and commercial applications and services (e.g., reporting, soil management systems, agricultural applications). The aforementioned activities are targeted at different stakeholder groups. First, these users, such as the national mapping agencies or those involved in the agricultural sector, constitute a group of non-traditional stakeholders who are adopting EO as both data consumers and information producers (EO prosumers). Moreover, we identified two additional broad stakeholder groups with specific interest in and influence on the pathway from data to wisdom towards reliable EO-based soil monitoring applications. Thus, learning from the current technological and scientific innovations, the various EO coordinators and data providers could act as key stakeholders to broaden the use of EO and ICT to address issues related to scientific, institutional, regulatory, and technological challenges (Figure 2). With all of this in mind, we proceed with presenting the pathway from data to wisdom for soil-related targets, followed by a discussion of each action under the three main dimensions presented therein.

3.1. Policy Requirements and Market Needs—Where Do We Want to Be?

Different policy frameworks exist around the world that either explicitly mention soil functions (e.g., plant growth) or implicitly refer to soil protection closely related to specific properties. Here, we review the main policies for which topsoil property monitoring is required, starting from international treaties and focusing on European policies. Moreover, moving forward from policy to finance, the huge amount of EO data presents an enormous opportunity for boosting the innovation and competitiveness of traditional economic sectors (e.g., agriculture), as well as for boosting emerging industries, such as carbon offset schemes, in response to key economic and environmental challenges. This aspect is also addressed in the current section.

3.1.1. Understanding the Governance Framework to Implement and Monitor Soil-Related Policies

On a global scale, the most important contribution of EO is driven by the 2030 SDGs’ agenda. Although the agenda is anchored by 17 SDGs and their 169 associated targets, surprisingly there is not even a single SDG dedicated solely to soil. However, nearly all land-related SDGs directly or indirectly have an impact on the soil ecosystem. This was demonstrated by Bouma and Montanarella [11] through six transdisciplinary case studies. They highlighted the cross-sectoral nature of soil among different ecosystems by providing examples of its services that contribute to address six SDGs (2, 3, 6, 12, 13, and 15). Similarly, a framework linking SDGs that critically rely on healthy soils was also presented by the recent review of Keesstra et al. [5]. Thus, an operational sequence is defined starting with the SDGs, next considering relevant ecosystem services and the contributions that soils can make to enhance those services. Despite these, the need to monitor pH, soil structure, and soil organic carbon, as well as soil pollutants, was highlighted among others to meet the ambitious targets related to environment, biodiversity, and climate. In addition, the indicator of SOC was also included in good practice guidelines of the Intergovernmental Panel on Climate Change (IPCC) as one of the five carbon pools for monitoring and reporting within the framework of Greenhouse Gas (GHG) inventories.
At the European Union level, existing policies relating to soil are still largely fragmented, and thus, the definition of policy priorities or parameters for soil protection is difficult to extract [12]. Mainly, the policies and direct measures of soil protection refer to agricultural land, which is threatened by the intensification of agriculture. In that regard, the Common Monitoring and Evaluation Programme (CMEF) of the EU Common Agricultural Policy (CAP) contains an impact indicator on SOC in arable land (C41) that measures policy interventions over the longer term. On the other hand, soil protection outcomes are mostly derived from delivering environmental targets that are not mainly soil focused, such as reducing contamination, offsetting GHG emissions, and avoiding other environmental threats. In this context, soil erosion is also an indicator that contributes to the assessment of CAP performance; however, because it is mainly a model-driven indicator, it is out of the scope of this review. In addition, Panagos et al. [13] recently recommended the use of soil nutrient data sets both as individual indicators (phosphorus, nitrogen, and potassium) and as a composite indicator of soil fertility.
The European Commission aims to solve some of the greatest global challenges, such as adapting to climate change, protecting our oceans, and living in greener cities. Among the main priorities are soil health and food security, which can be achieved by leveraging novel monitoring techniques, including proximal and Remote Sensing (RS). An example of such priorities is the proposed mission of Caring for Soils, which aims by 2030 to have at least 75% healthy soil in each EU Member State or for each EU Member State to show a significant soil improvement towards meeting accepted thresholds of indicators. The second objective of this mission is to conserve and increase carbon stocks. More recently, the European Green Deal has adopted several policies for which data on agricultural soils will be required, such as the Farm-to-Fork strategy, the EU Biodiversity strategy, and the Zero Pollution Action plan (Table 1).

3.1.2. Towards an Economic Perspective for the Soil Ecosystem

Reliable and accurate information derived from EO data and services is essential for boosting the economic growth towards a transition to net zero agricultural activities. More specifically, EO data and services are restricted not only to supporting the informed implementation of numerous soil-related policies but also to protecting soil by encouraging farmers to take extra steps to improve soil management practices. Subsequently, EO data and services can further contribute to proposing and designing management practices for improving the status of agricultural soils and stopping land degradation through the application of variable rate fertilization [14,15].
The CAP for the period 2021–2027 sets higher ambitions regarding environment and climate through a new green architecture adopted by including eco-schemes for providing funding and a farm advisory system in support of rural development. SOC will play an important role as an effect-based indicator for designing, monitoring, and operating these elements. Thus, the need for monitoring is also prioritized by commercial actors. In this context, the framing of “carbon farming” has been recently introduced in agriculture as a financial opportunity [16]. However, international carbon markets have not resulted in financial returns sufficiently large to motivate the full potential of land sector changes, offering an opportunity for progress. Last but not least, farm advisors should be able to translate EO information into services, adapt those services to specific local circumstances, and design plans offering a prescription for precision farming [17].

3.2. Overview of EO Approaches for Soil Mapping Products—Where Are We Now?

Here we present how and which soil properties can be estimated from various spaceborne and aerial EO means by analyzing their data resolution, modelling approaches, and available datasets and highlighting the limitations that have emerged up to now.

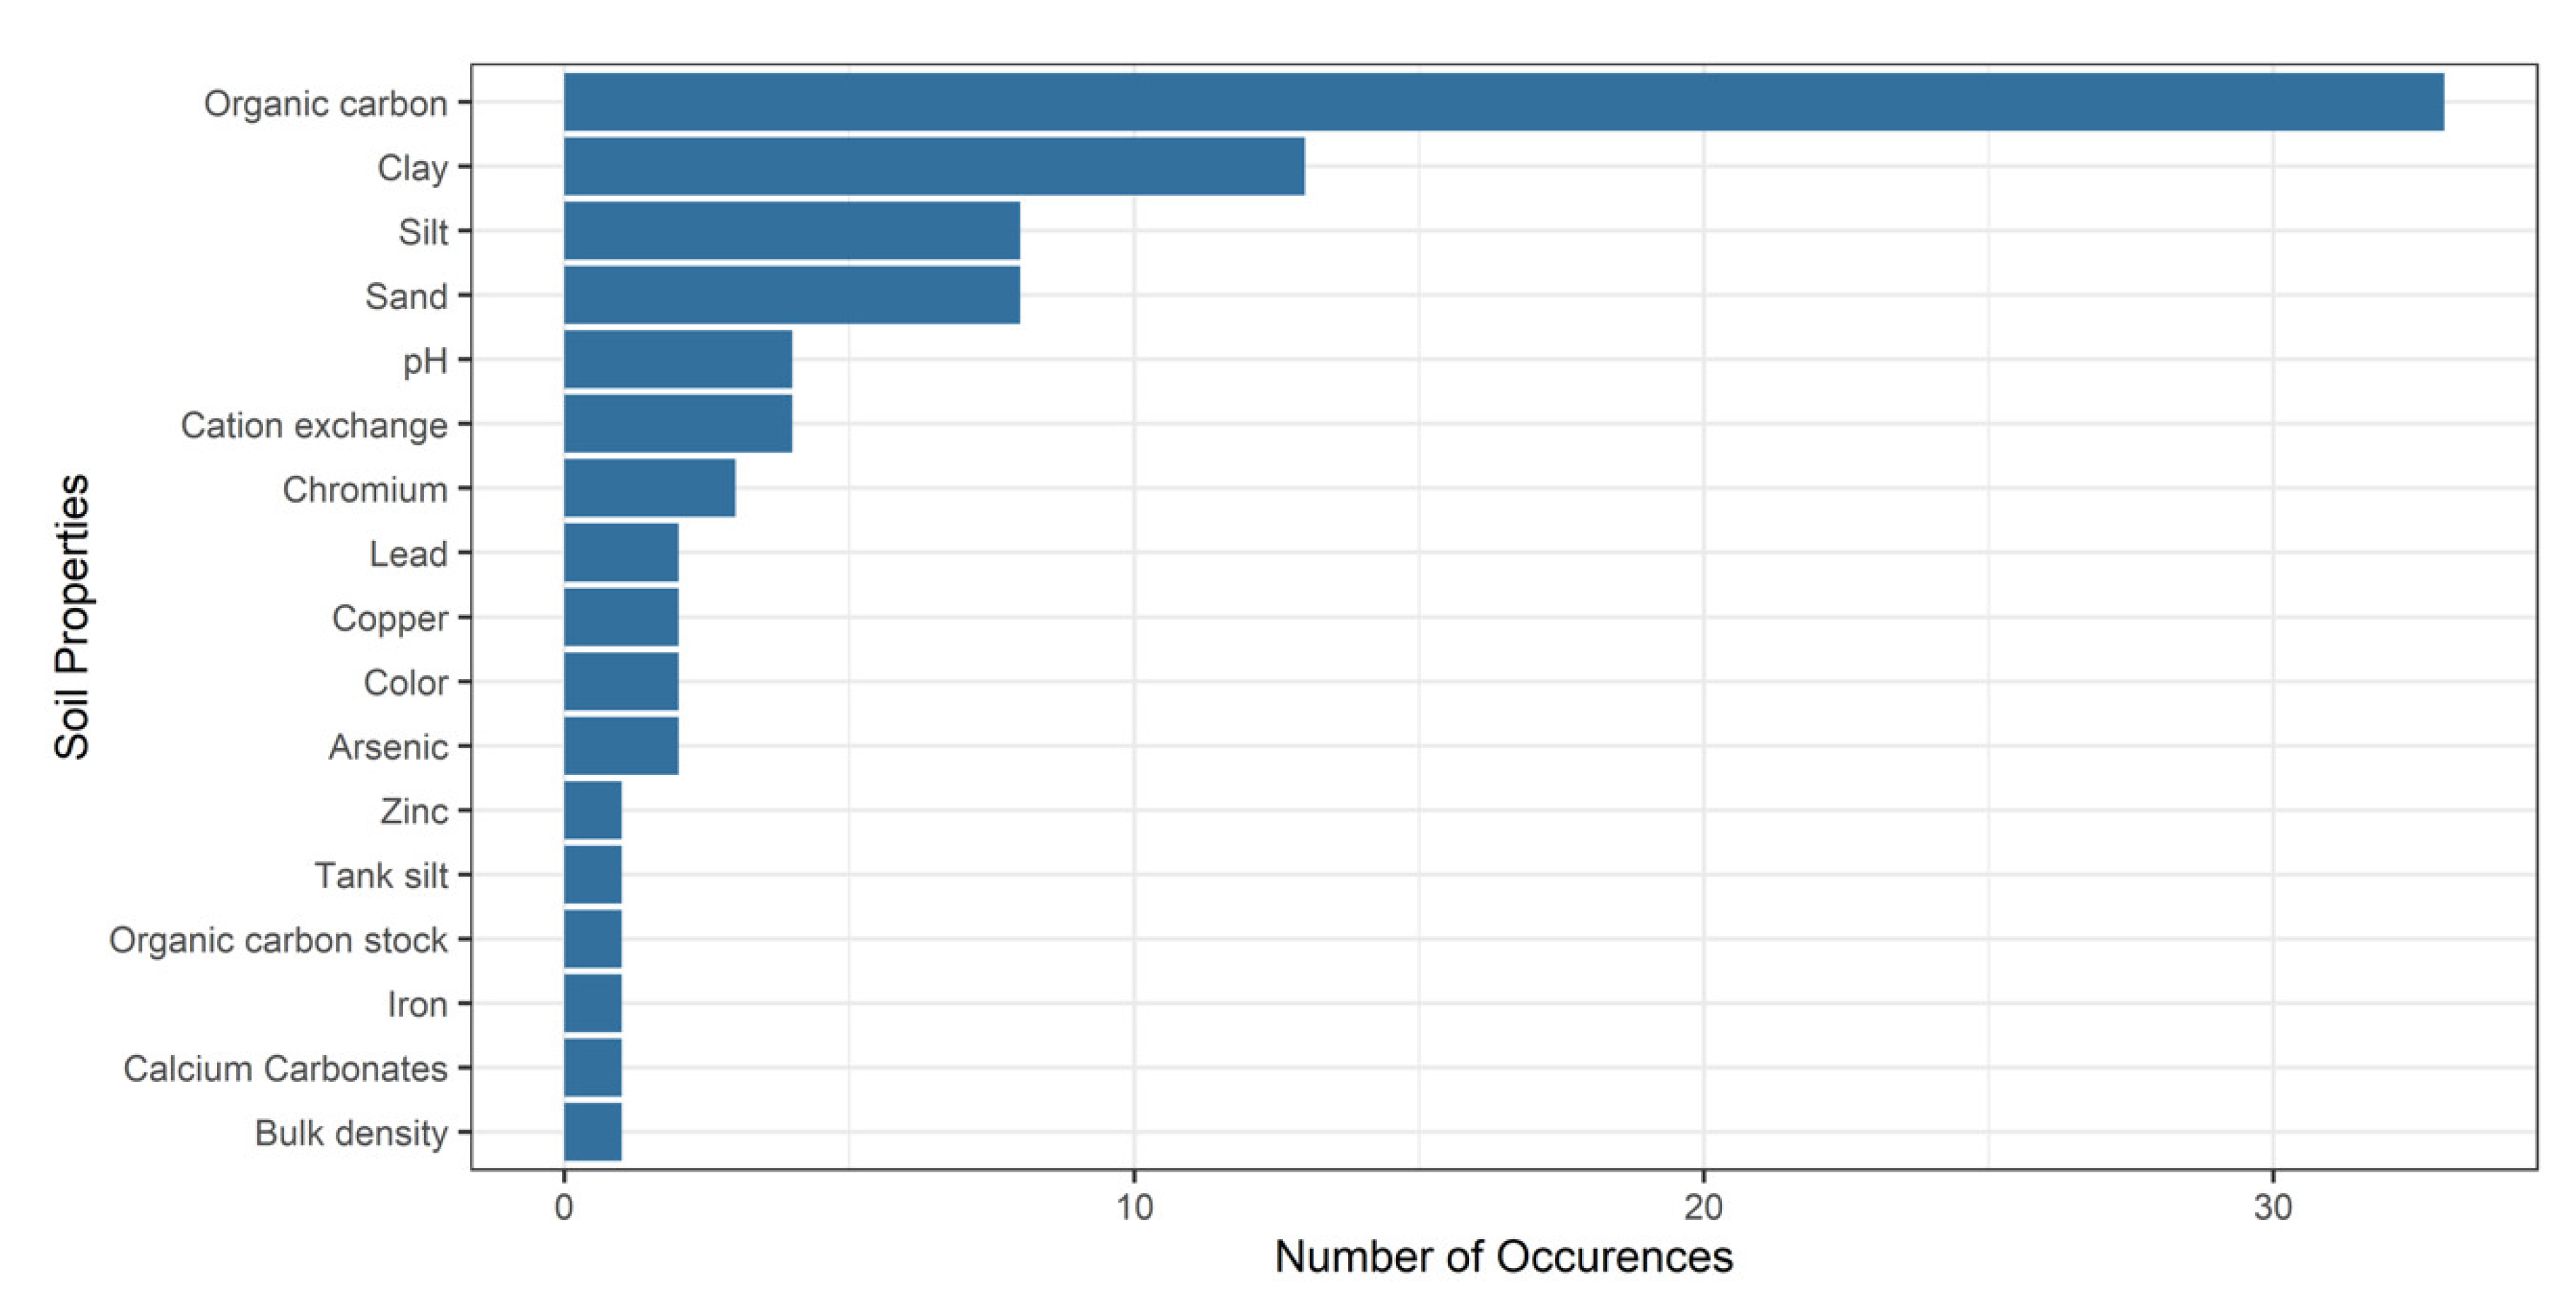
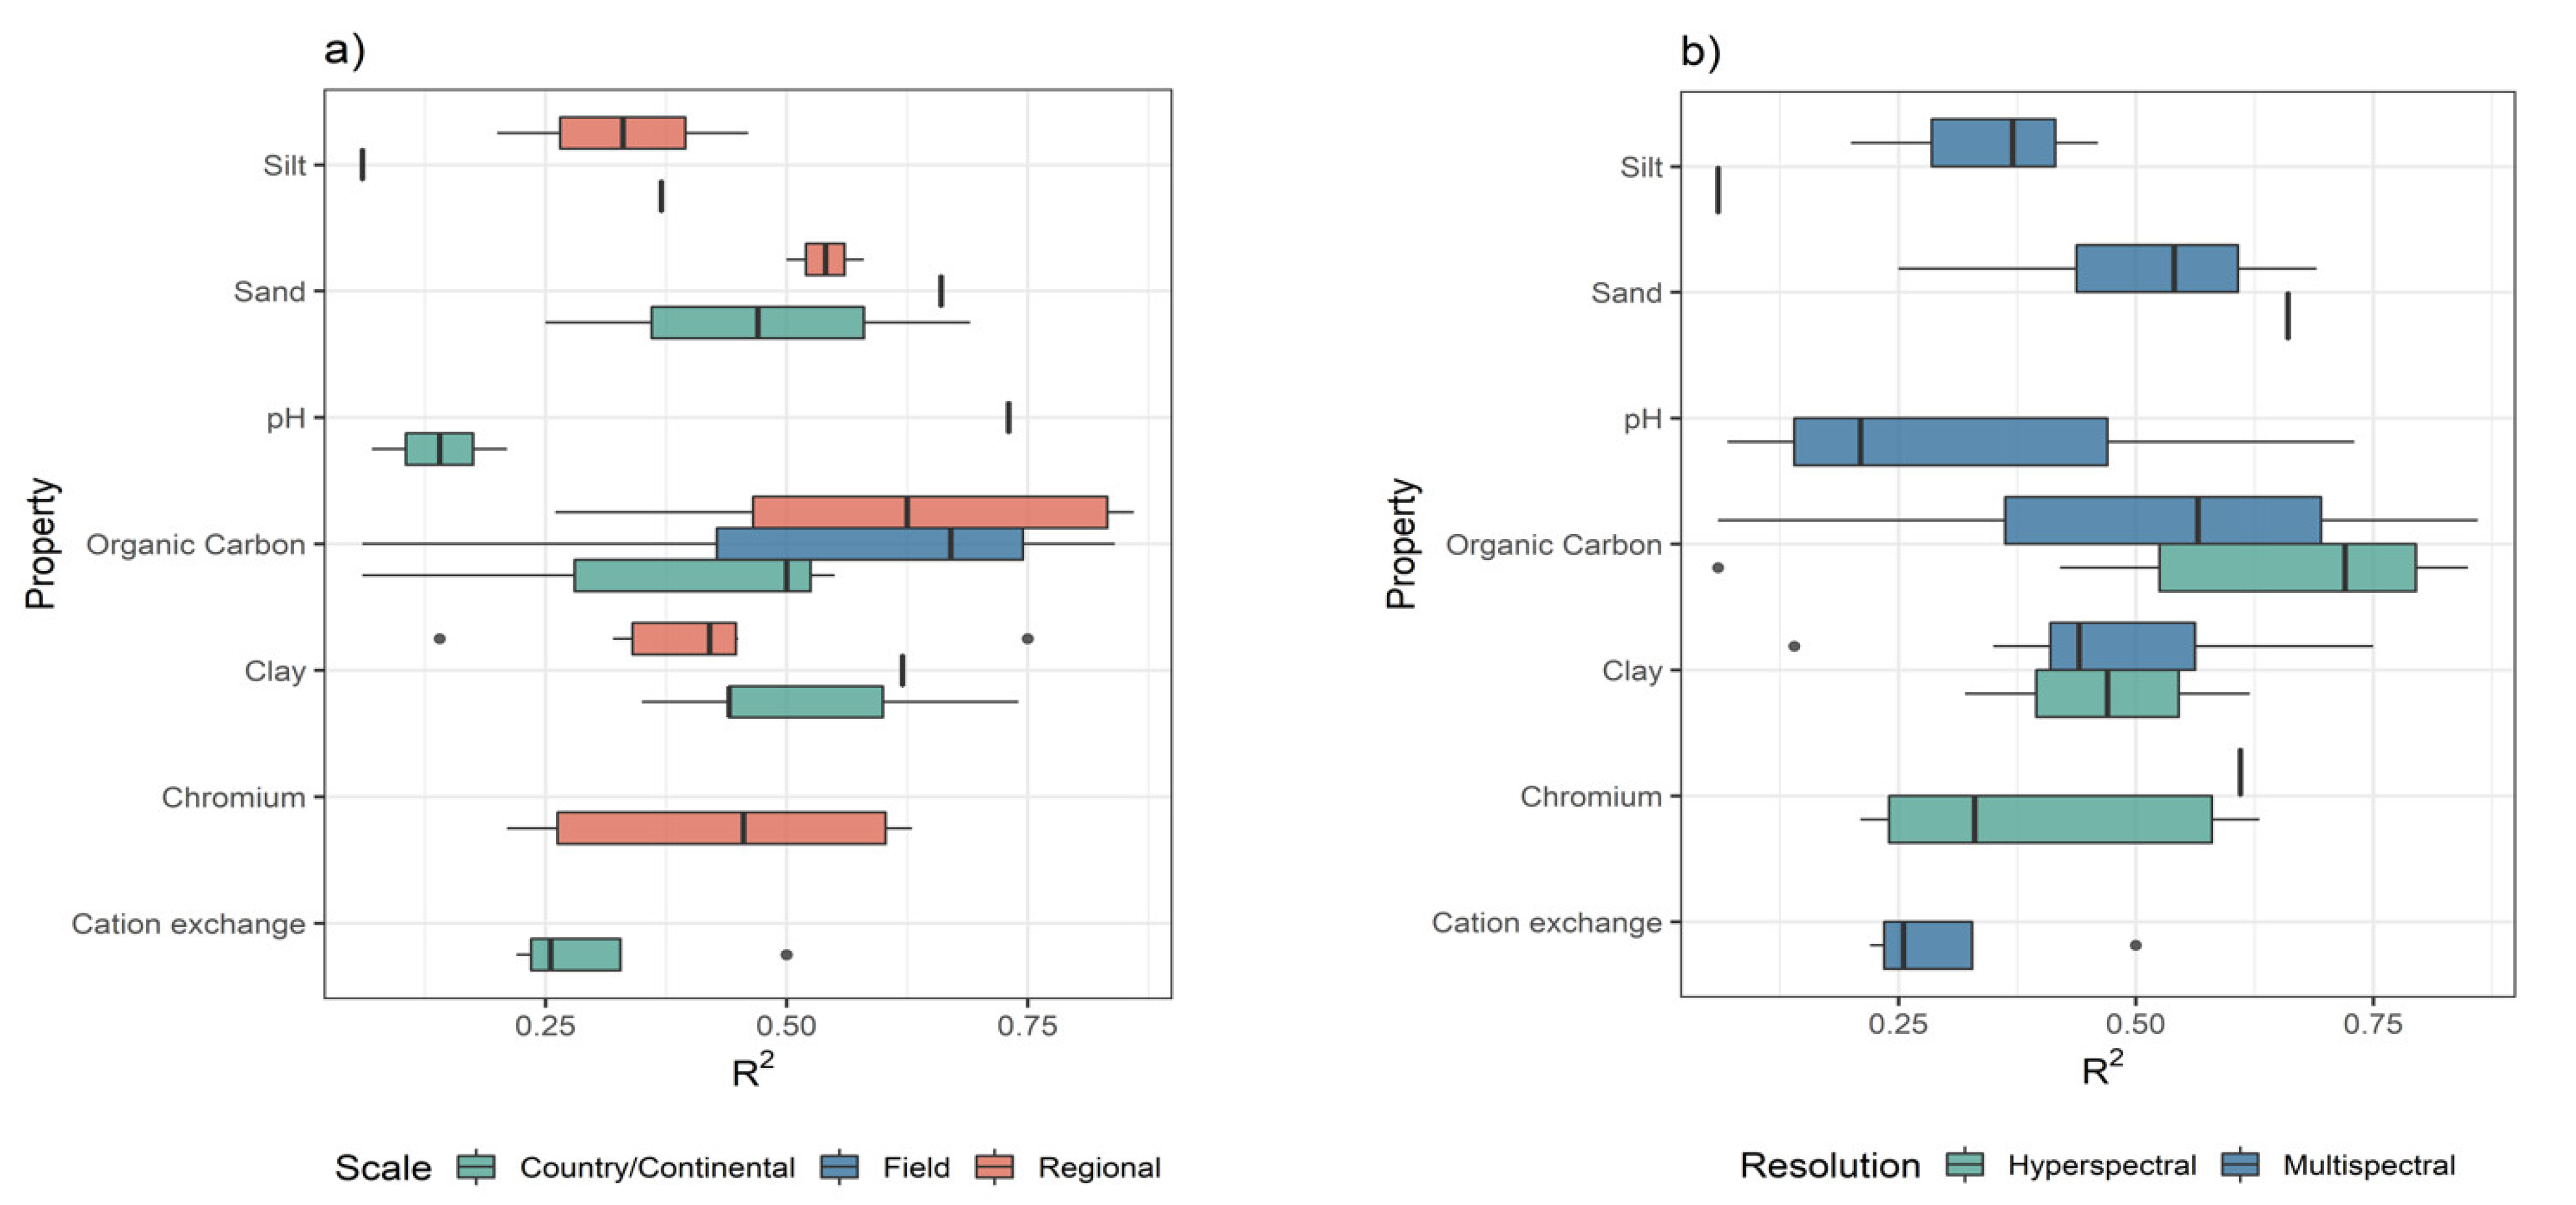
3.2.1. Estimated Soil Variables

The majority of recent mapping approaches provide rasterized soil indicators that are essential for accurate modelling of ecosystem processes, such as carbon exchange [18], specialization towards informed arable farming [19], and for long-term ecological monitoring [20]. Figure 3 illustrates the most important soil properties considered in this study.
In that regard, the estimation of topsoil SOC (or soil organic matter (SOM)) is prominent in 33 (including studies dealing with SOM) of the 46 total studies (72%). Despite the fact that SOC stock is at the core of policy’s requirements, its estimation is not often reported in the EO data-driven literature [21] due to the need for inclusion of ancillary data such as bulk density, coarse fragment content, and vertical SOC gradient. Moreover, soil texture is also generally studied (17% of the total of 46 studies) for mapping purposes and because of its importance in soil fertility and nitrogen distribution. In general, silt resulted in very low predictive performance, even with the use of hyperspectral data [22]. Recently, because of the emerging use of hyperspectral imagery data, new studies are dealing with detection and quantification of heavy metals, such as lead [23,24], arsenic [25], copper [26], and chromium [27]. It is important to notice that soil mineralogy properties did not appear among the listed studies, despite soil mineralogy’s great impact on all soil functions, and on carbon as well. Here it should be highlighted, that the existing soil analytical data vary in terms of analytical protocol and units, which does not facilitate comparisons between countries and individual studies.
To gain valuable insights related to the scale and spectral resolution that are closely connected in EO data-driven soil mapping, a statistical analysis was performed (Figure 4). Only the soil properties across any spectral resolution or spatial scale that were explicitly reported in three papers are presented for the drawing of proper conclusions. Regarding the connection between performance and scale of pilot cases (Figure 4a), we observed a consistent higher prediction performance for almost all soil properties in studies at the field and regional scale, compared with those at the continent or country level. Particularly, only a few examples developed widely applicable models ranging from country [28] to continental scale [29,30]. Thus, their reported errors may be considered significant compared with cases that were implemented at smaller scales and hence worked with lower variances. In one of the more extensive comparisons, in terms of models, Tziolas et al. [30] showed that more advanced modelling techniques, such as convolutional neural networks (CNN), yielded better outcomes compared with simpler approaches for larger scale applications. This could explain why the R2 of clay prediction at continental scale was higher than those at smaller scales (Figure 4a), in addition to the impact of the availability of local data that boosts R2 for local/regional scale studies. Our review shows that hyperspectral data ranked first when predicting organic carbon and promoting the development of modelling approaches for unexplored soil properties, such as chromium (Figure 4b). On the other hand, although soil texture studies (e.g., clay content) have been fully developed based on hyperspectral imagery in the past 10 years, this review shows that in the period 2019–2021, most clay mapping published studies focused on exploring the new potential of multi-spectral time series data. This can be explained because published studies, within the last three years, are associated with the newer availability of Landsat/Sentinel-2 data, and we should consider that there are not yet published studies from new Precursore Iperspettrale della Missione Applicativa (PRISMA) spaceborne hyperspectral imagery (data available since May 2020).
The findings above indicate that the current works focused on a well-studied set of bio-chemical parameters; however, the regression algorithms can be implemented in a way that allows their future extension to soil indices, such as soil salinity. Recent studies have provided promising results using Landsat data in Iran [31], as well as Sentinel-2 data in China [32], albeit they are based on digital soil mapping techniques with the modelling of environmental covariates, and hence, they were not included in the above analysis.

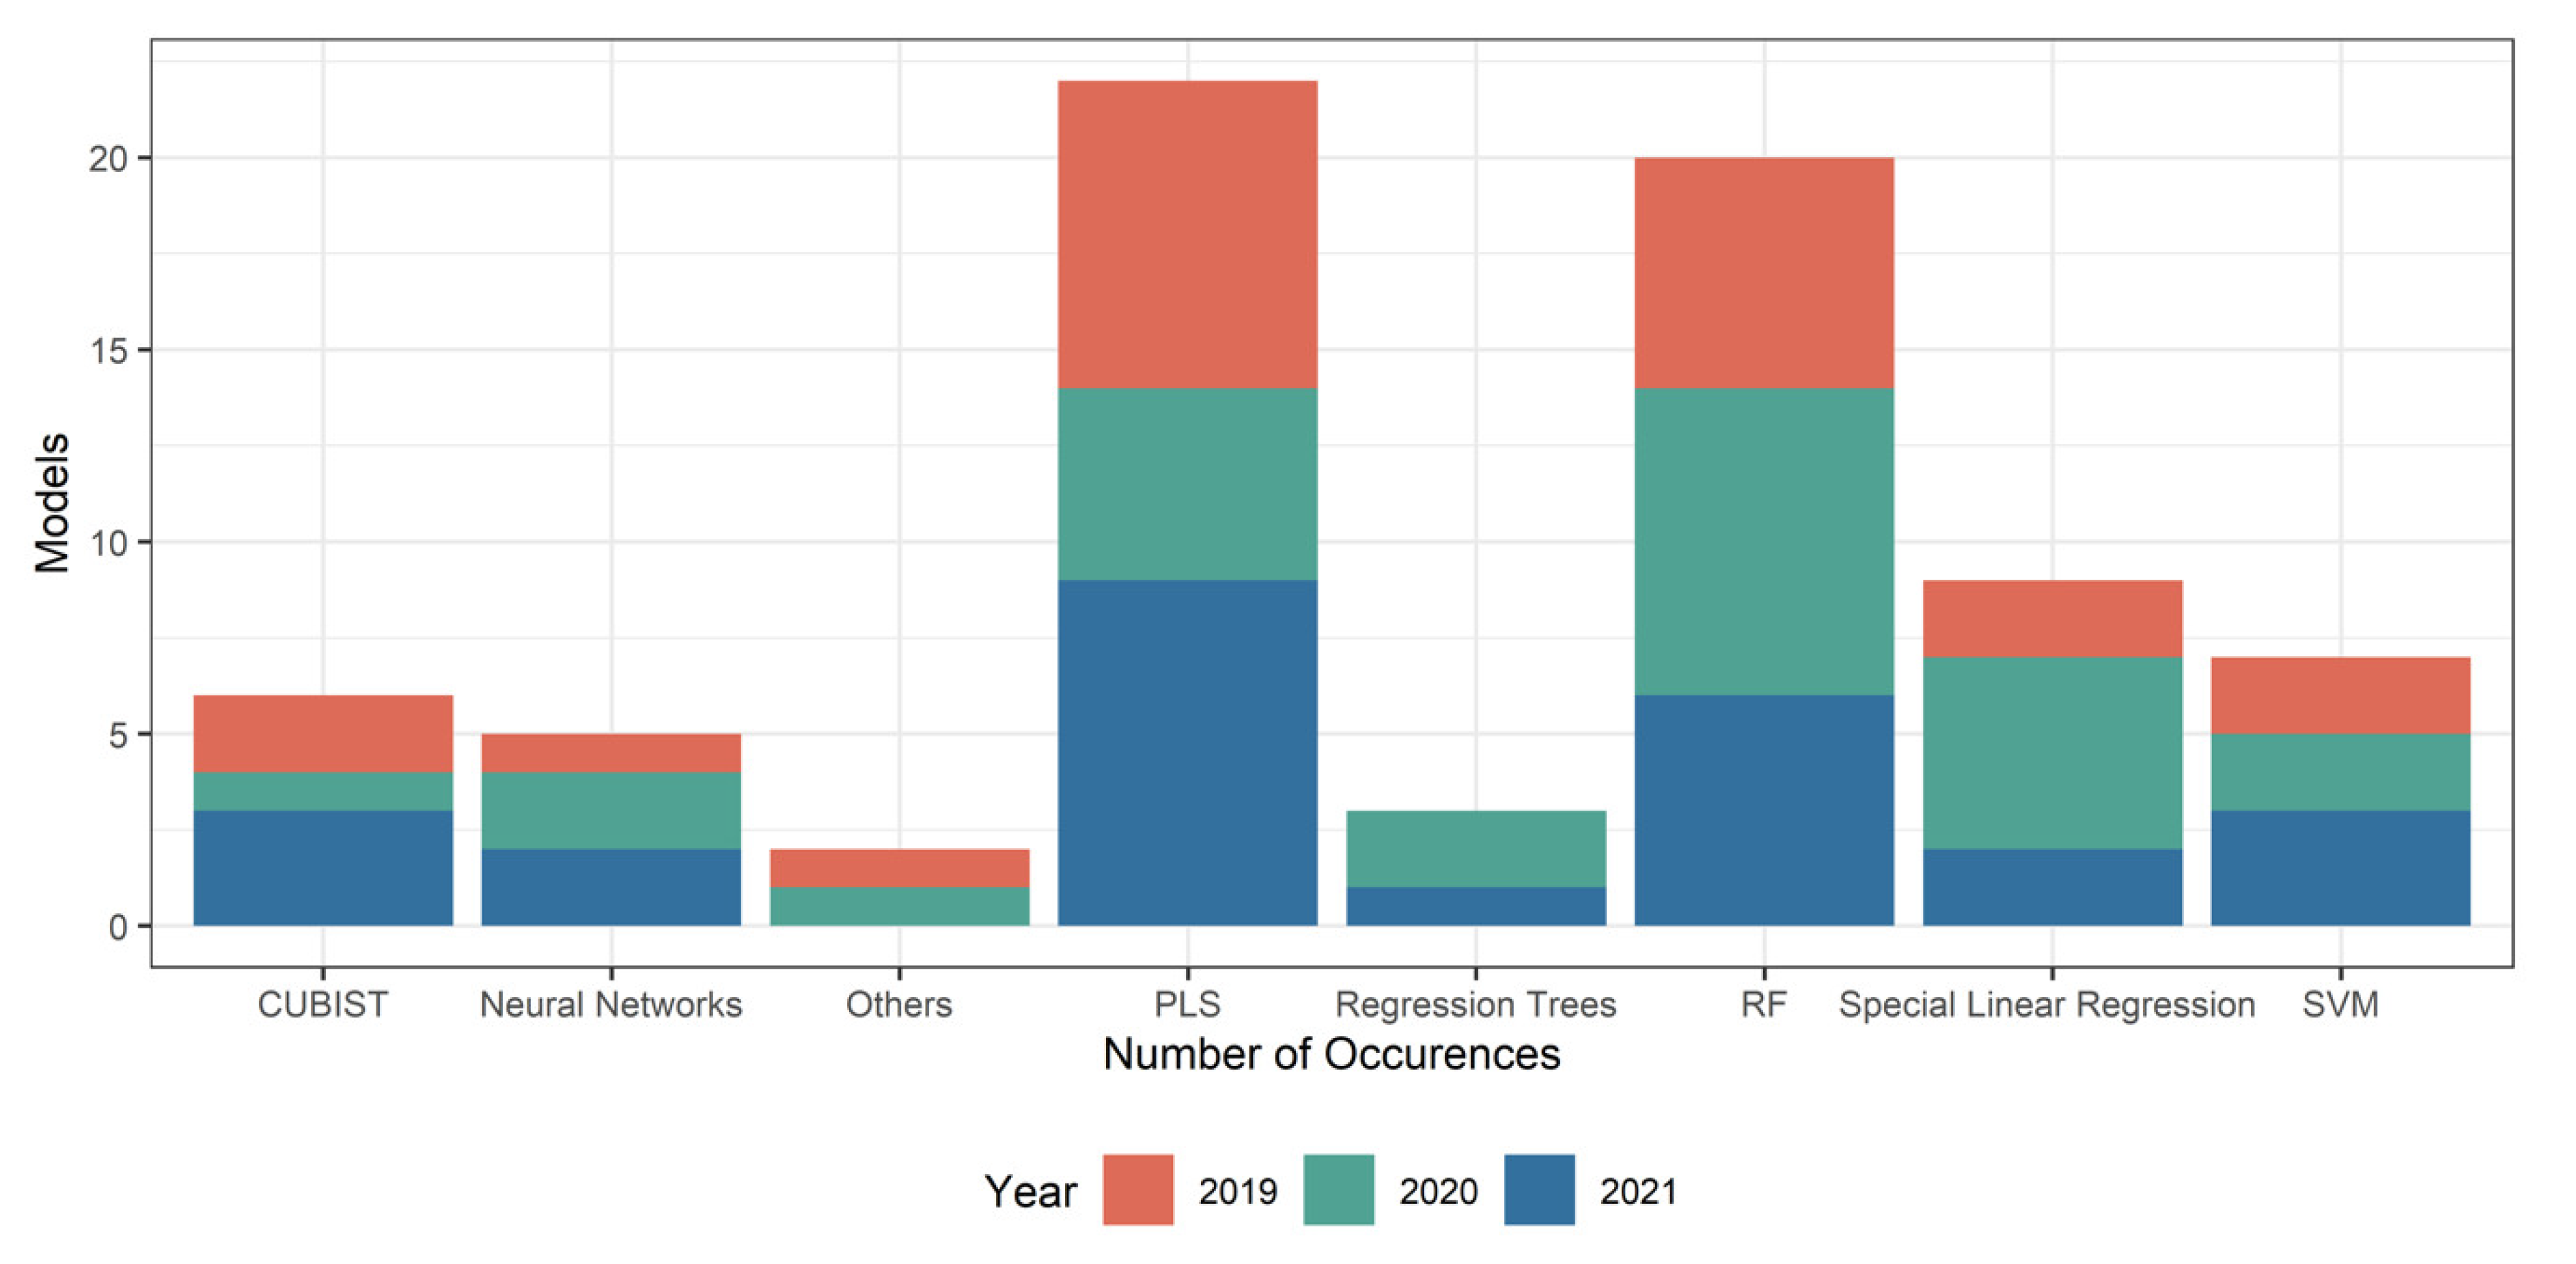
3.2.2. Employment of AI Algorithms

Extensive research in recent years has been conducted regarding the approaches implemented to estimate soil properties from remotely sensed reflectance spectra using AI techniques. In this context, the soil spatial explicit indicators are generally produced through a non-linear combination of the features generated by the EO data and large ground-based soil information, having always a lower performance compared with laboratory spectroscopic analyses, owing to the finer spectral resolution and usually wider spectral range of the latter.
Excluding the partial least-squares (PLS) multivariate regression algorithm commonly used as a baseline status, random forest (RF) currently is certainly the most popular AI algorithm that is used for soil properties estimation and mapping [33]. However, RF is not the only AI technique available for cropland topsoil mapping. Our findings agree with the recent review by Padarian et al. [34], which found that in many studies, neural networks and gradient boosting are recognized as being efficient regression approaches [35], while a decreasing trend in the utilization of support vector machines (SVM) was observed.
During recent years, DL has been at the forefront of many important advances, and it is also recognized as a valuable tool for EO-driven soil analysis. A change was made from 2015 onward, where Veres et al. [36] applied for the first time structured and unstructured DL architectures to soil property prediction. Subsequently, Liu et al. [37] evaluated a pre-trained CNN from Land Use and Coverage Area Survey (LUCAS) dataset for soil clay content mapping using hyperspectral imagery data. Recently, Tziolas et al. [30] investigated soil clay content mapping by CNNs and highlighted emerging multi-input methods that could improve regression for large scale mapping by leveraging information from the temporal variation in topsoil and the combined use of multiple pre-processing techniques. The evolution of the regression and processing algorithms in the period from 2019 to 2021 is presented in Figure 5, including several new AI approaches.
Considering that advanced DL models could be very complex, researchers should attempt to explain the output of these models. Therefore, a model’s interpretability is a crucial factor that should be considered by developers. Interpretability is important for debugging AI models and making informed decisions. In this review, only 20% of the studies presented interpretability in their models or mentioned the importance of considering it. The need for interpreting and explaining data-driven models in soil monitoring has also been highlighted by [38]. Safanelli et al. [39] indicated the variable importance for the successful implementation of RF models. Similarly, Tziolas et al. [30], inspired by the principles of explainable AI [40], examined the generated feature maps of the final convolutional layer to visualize the top activated patterns that considered both optical and radar data. In addition to model validation and cross validation, the models should be tested on an independent dataset; however, only two studies reported performing an external validation.

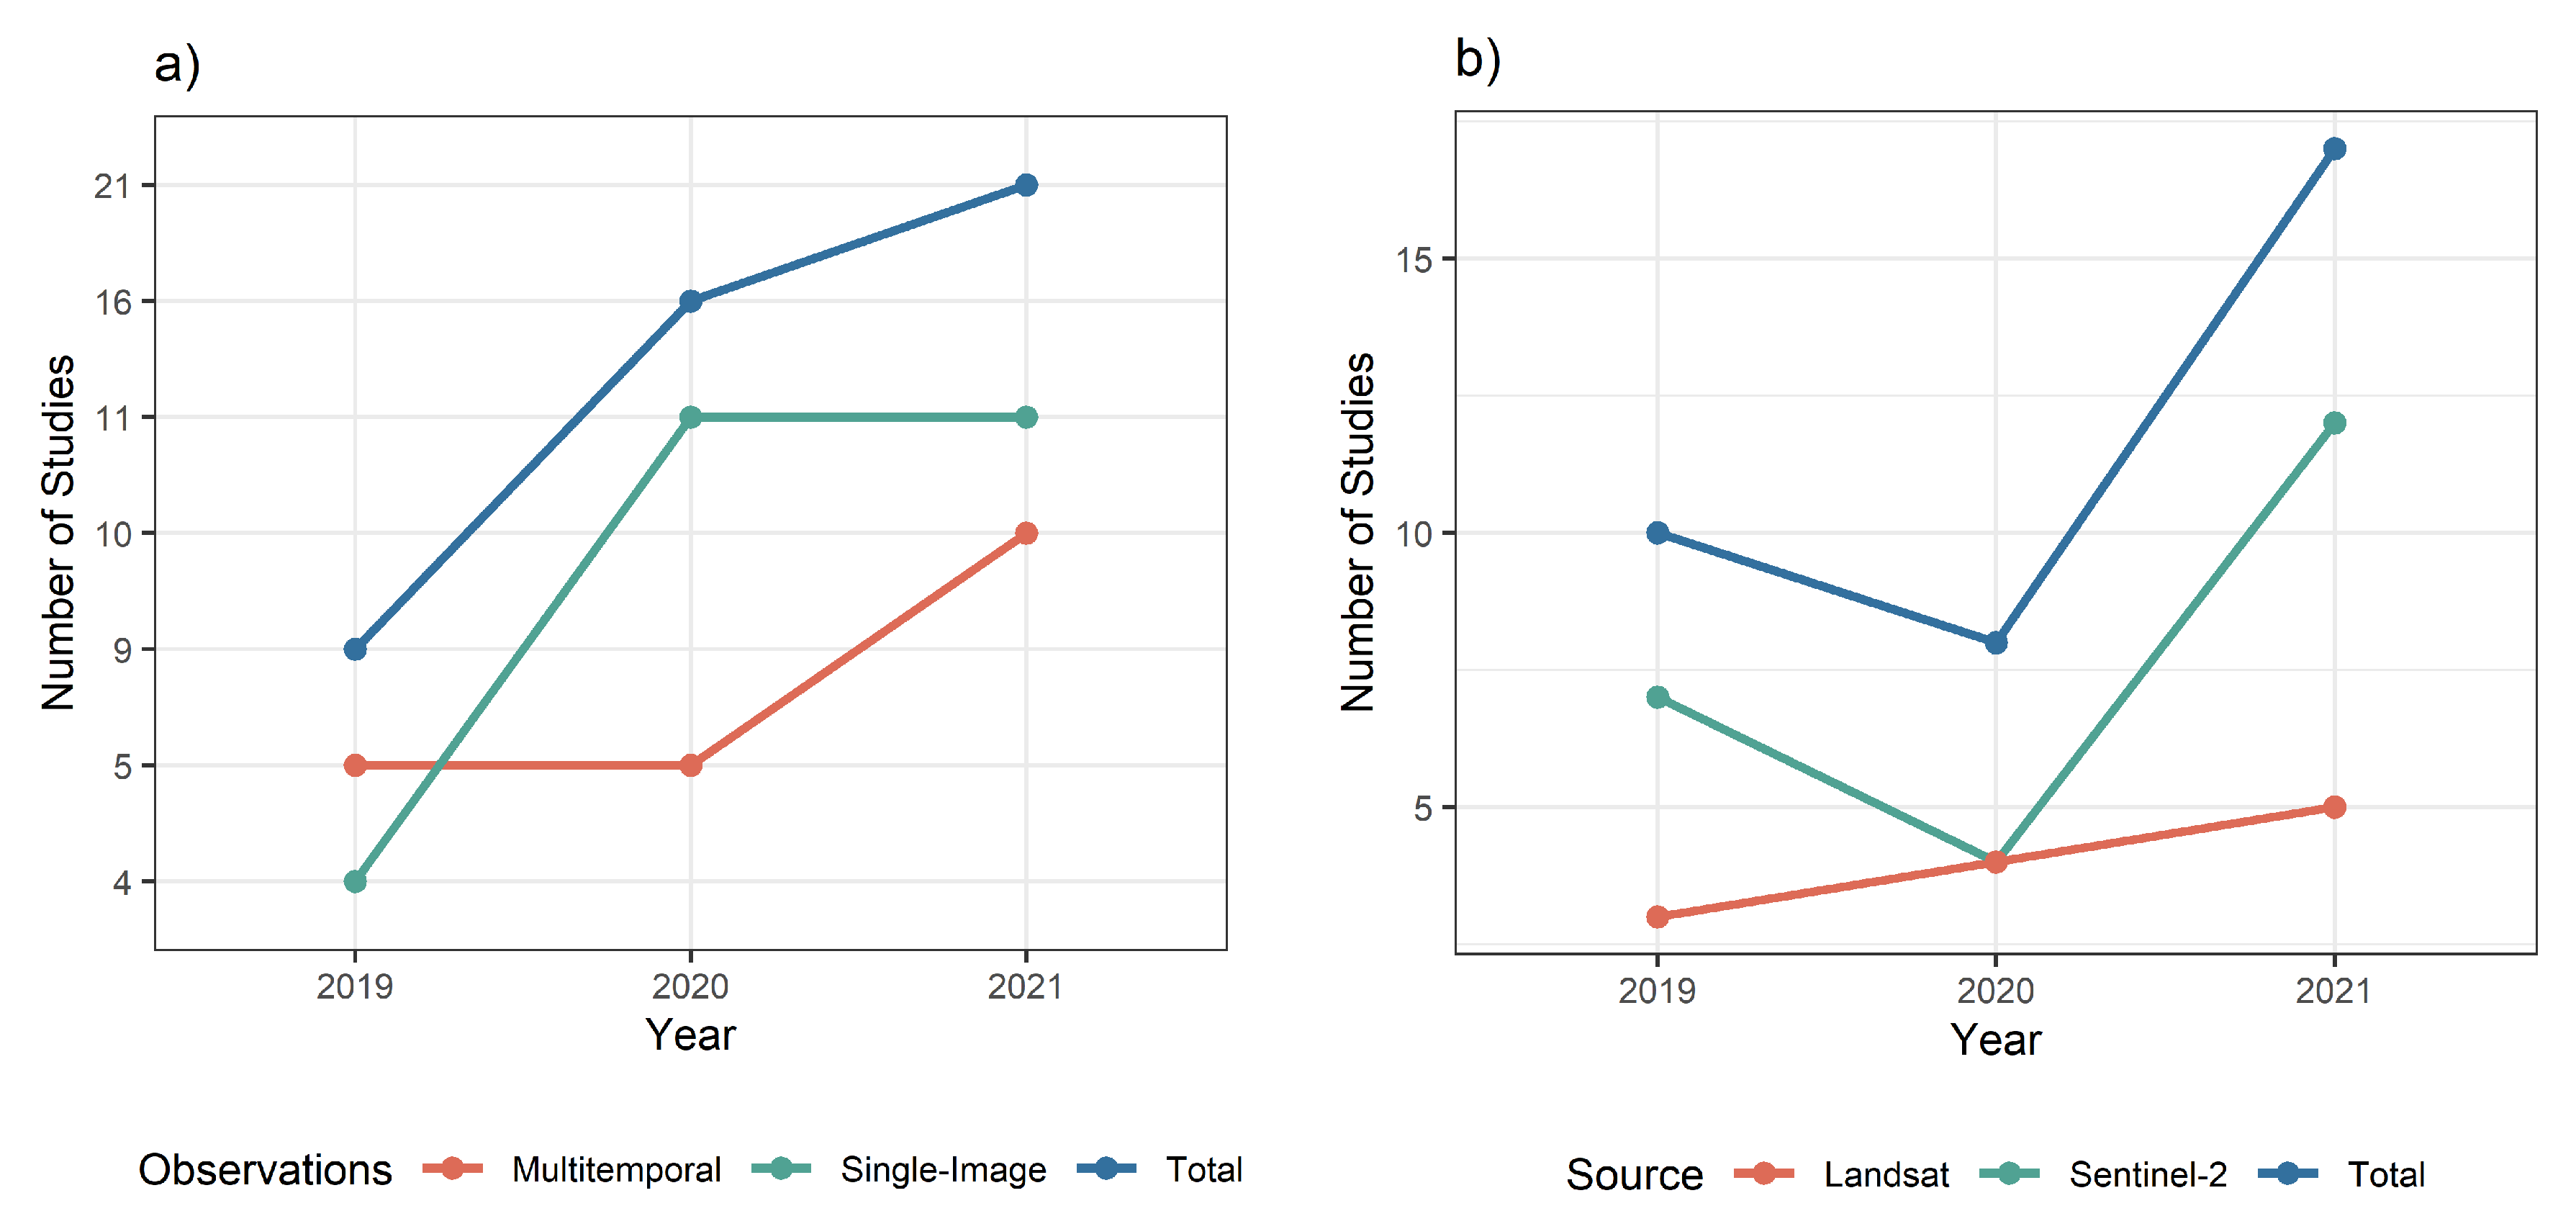
3.2.3. The Temporal Dimension

The estimation of soil variables from EO sources is hindered by the need for bare soil conditions for soil property prediction [41]. In that regard, the generation of multi-temporal composites was one of the most common themes among the inventoried research since it enabled us to significantly increase the total bare soil area across the different dates, compared with one acquisition.
Therefore, we classified the selected studies into two main categories: (i) “single-image” method, where a directly calibrated relationship between the measured spectral signature and the variable of interest was developed; and (ii) “multi-temporal” methods that took advantage of temporal information within the satellite time series to build a composite reflectance or to leverage the multiple observations provided across a selected spectral change detection. In this review, 46% of the 46 studies (n = 21) presented multi-temporal approaches (Figure 6a), while the studies the remaining studies dealt with single multispectral images or with hyperspectral data for which the airborne platforms did not facilitate acquisition of time series.
The need for construction of a single synthetic image from multiple observations was addressed by many scientific groups that developed multi-temporal analysis methods. In this context, the first approach was a processing paradigm—namely, the Geospatial Soil Sensing System (GEOS3), which built a soil image on the multi-petabyte catalog of satellite imagery with planetary-scale cloud processing architecture of the Google Earth Engine [39]. The second example is the Soil Composite Mapping Processor (ScMAP) that delivered exposed soil masks that were run on high-performance local computing clusters [42].
Leveraging the application of current multispectral EO data for mapping cropland soils several applications have been recorded on the regional [43,44,45], national [46], and continental scale [30]. A significant number of these studies were implemented in Brazil [47], India [48], Indonesia [49], and China [50] since detailed information about soils is abundant in those countries. This data were acquired to address the challenges generated by the cropland expansion there during recent decades.
A significant number of these studies (n = 11) used the Landsat archive, highlighting that the continual operation and update of this multispectral information have allowed analyses of the updated data during recent decades, such as the recent paper by Sorenson et al. [28], where they used a decadal time series of Landsat 5 in Canada. Even though recent sensors such as Sentinel-2 lack the period-of-record necessary for generating a bare soil composite at continental scale, a significant number of studies (65%) leverage its high temporal resolution compared with the Landsat-8 satellite (Figure 6b). Sentinel-2 and Landsat time series images are also combined for mapping soil properties in agricultural croplands [51].

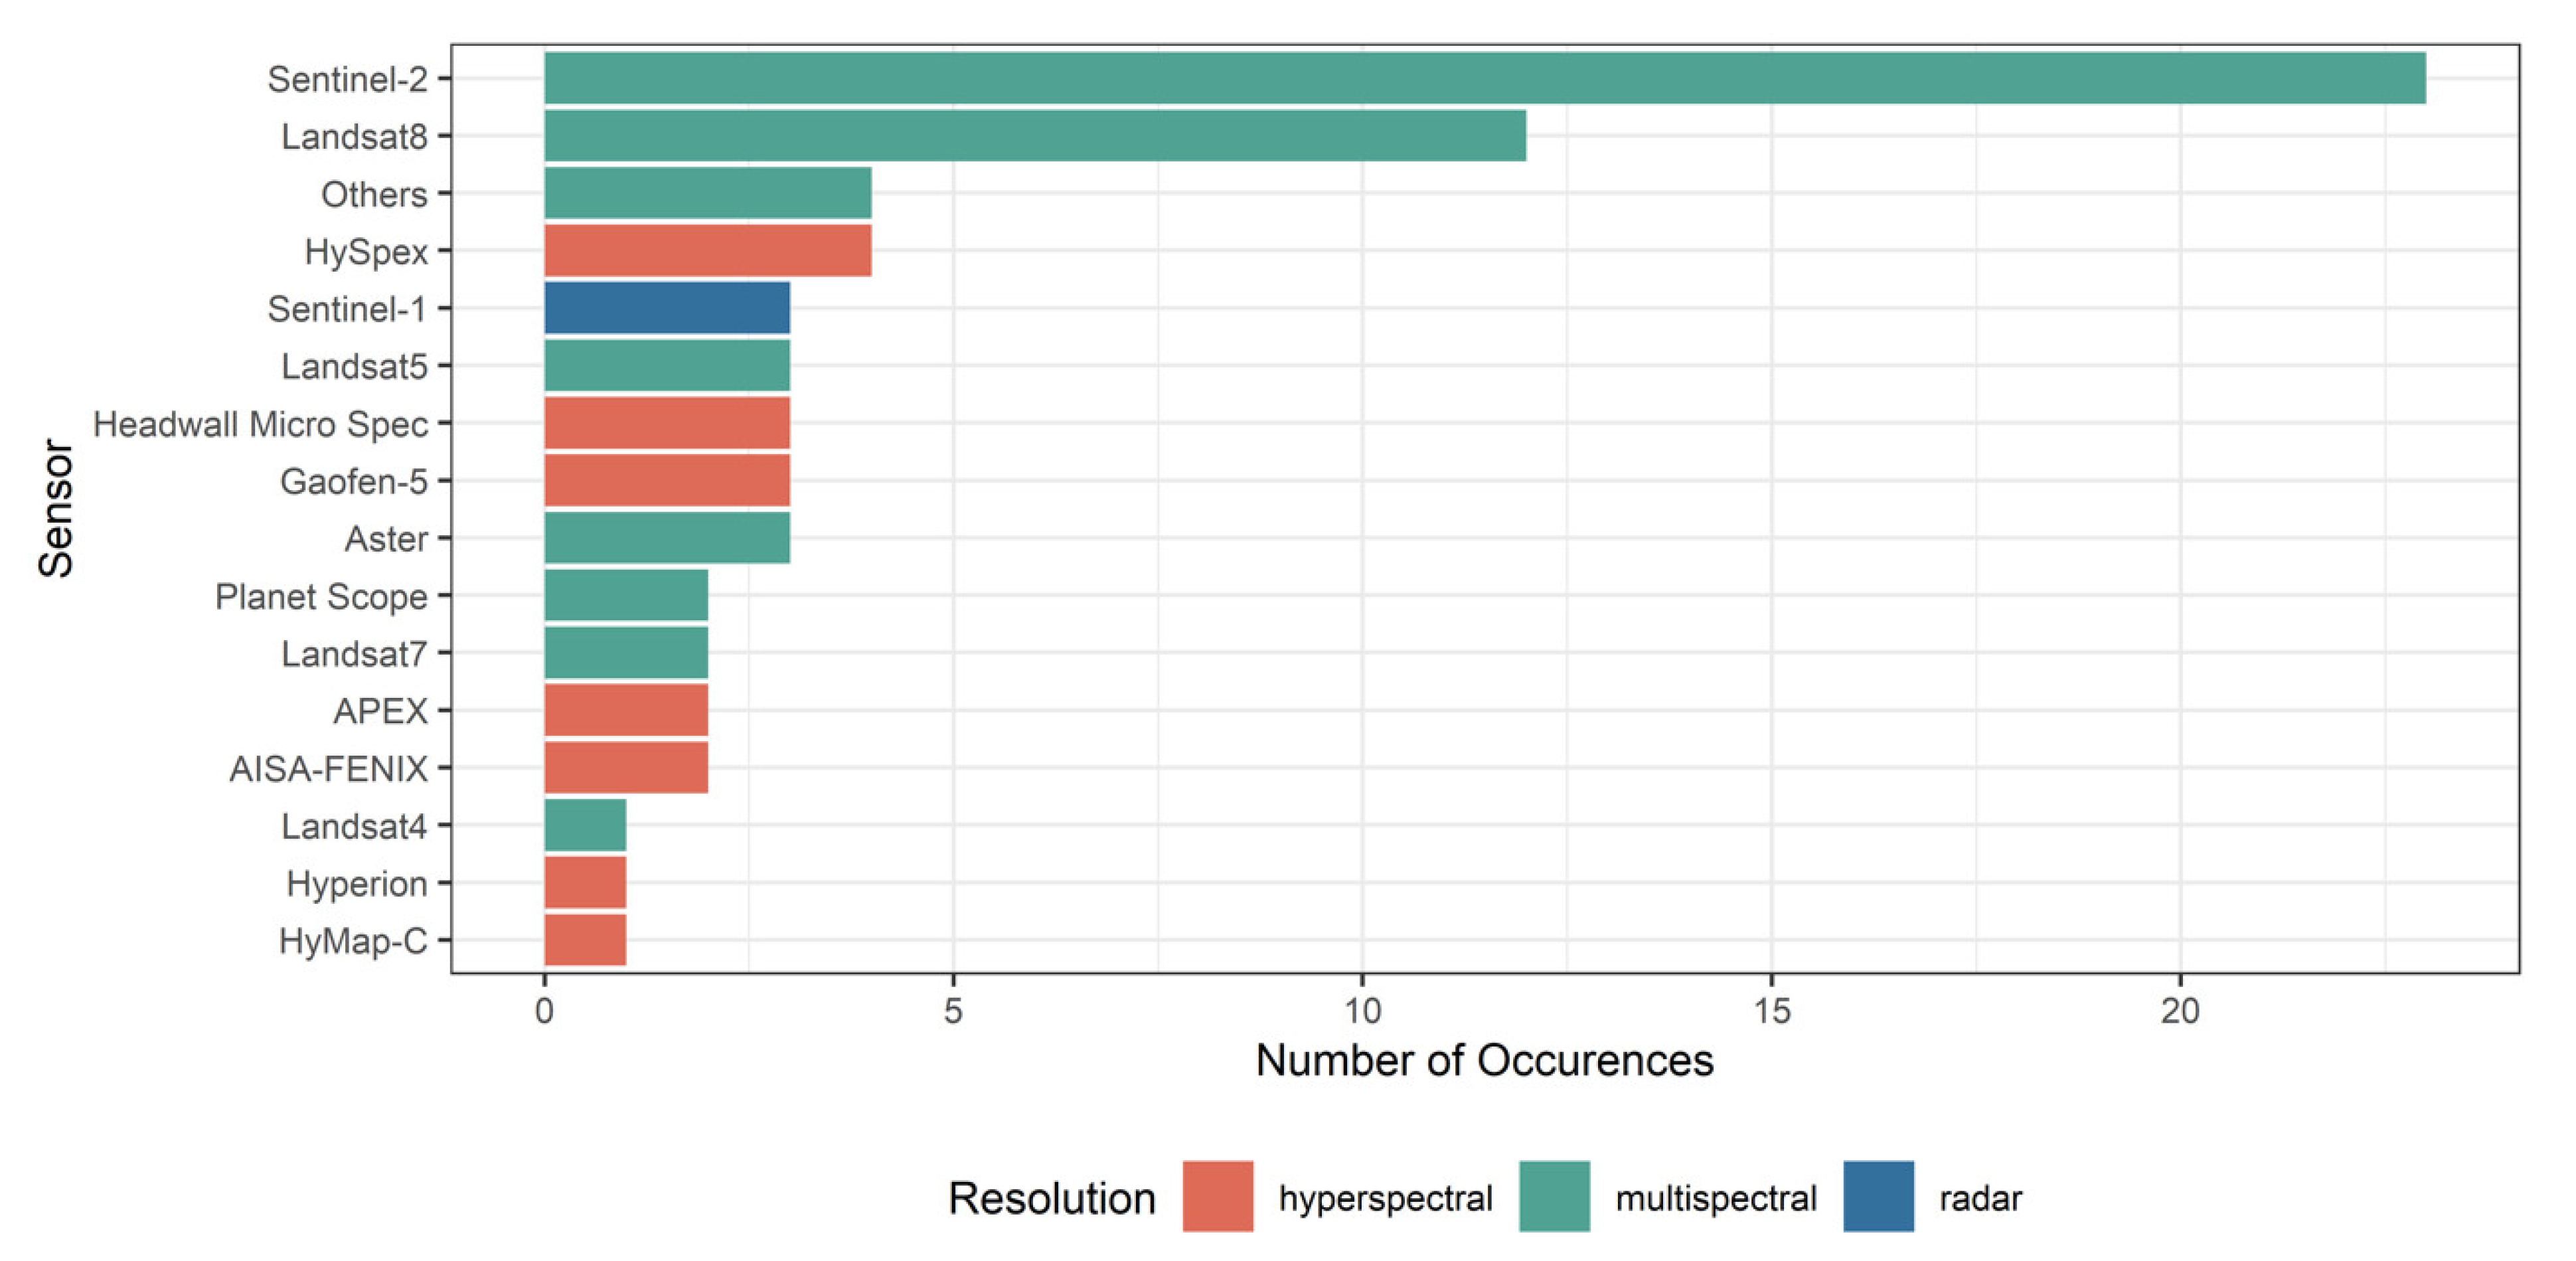
3.2.4. The Spectral Dimension

In terms of EO sensors, passive sensors in the visible-near and short-wave infrared (VNIR–SWIR, 400–2500 nm) spectra are the most relevant, ranging from simple RGB cameras to hyperspectral sensors. The two most common satellite sensors used in soil mapping applications are National Aeronautics and Space Administration (NASA) Landsat archive and Sentinel-2 from the European Copernicus Space component (23% of the studies for Landsat and 33% for Sentinel). It is noteworthy, that recent high spatial resolution sensors (<3 m), such as Planet Imagery [52], are very important contributors to SOC estimation, while their contribution is low for clay estimation [53]. Žížala et al. [54] also indicated that very high-resolution spatial sensors mounted on UAS (<1 m) present moderate accuracy of prediction for organic carbon estimation. Other recent studies show that a good prediction performance for organic carbon estimation can be obtained under outdoor conditions with UAS using the VNIR range and machine learning models [55]. Thus, UAS technologies have been recognized as highly valuable tools for enhancing the spatial coverage and addressing the challenges of data acquisition of EO for croplands soil monitoring [56], especially if they are simultaneously characterized by high spectral resolution. A short description with appropriate references to the existing studies in the VNIR domain for organic carbon estimation may be also found in Nayak et al. [57].
As a part of the worldwide space component, hyperspectral sensors are the latest addition to the global network [58]. In the increasingly relevant field of high spectral resolution optical data, Chabrillat et al. [6] provided a summary of how particle size influences the scattering effect. The authors also reiterated recent findings showing that narrowband spectral data provided a more accurate estimation of soil properties. Reviewing the recent studies, we only found that small size areas for pilot cases were opportunistically monitored due to the availability of detailed hyperspectral imagery data and soil records. For example, Tziolas et al. [59] and Ward et al. [60] developed bottom-up approaches by leveraging existing soil spectral datasets and hyperspectral imagery data to predict organic carbon in small-scale studies. Similarly, Hong et al. [61,62] used feature selection techniques to successfully quantify the SOC content within a pixel based on hyperspectral imagery in Southeast Iowa, United States. In the same direction, Meng et al. [63] selected Gaofen-5 satellite hyperspectral image to explore an applicable and accurate denoising method that can effectively improve the prediction accuracy of SOM content. These findings are important in the context of current and upcoming spaceborne imaging spectroscopy missions, such as the ESA’s planned Copernicus Hyperspectral Imaging Mission (CHIME), NASA’s planned Surface Biology and Geology mission (SBG), the upcoming German Environmental Mapping and Analysis Program (EnMAP) satellite to be launched in 2022, and the present hyperspectral sensors in orbit, such as the Italian PRISMA satellite [64] or the German DESIS satellite on the International Space Station [65], which could significantly improve estimations of soil variables [66].
Microwave (1 mm to 1 m) RS has also been used to effectively monitor soil moisture and roughness. Many multi-temporal approaches have recently been applied [50,67,68] using synthetic aperture radar-derived products to infer disturbance to soil reflectance due to the presence of moisture. However, given the local nature of disturbances, many of these studies provide site-specific information. On the other hand, Light Detection and Ranging (LiDAR) has only been utilized to generate more detailed topographic covariates limited to field scale, despite its tremendous advantage when measuring soil surface roughness [69]. Therefore, it is essential to further investigate the upcoming spaceborne LiDAR sensors. In terms of ancillary data, several studies (14 out of the total 46 studies) pointed out that other datasets are required for an accurate retrieval of soil properties. The use of low resolution sensors (>100 m), such as Sentinel-3A, is also reported in the literature, attaining low predictive performance [70]. An overview of the various EO means in the selected research studies is illustrated in Figure 7.

3.2.5. The Impact of Main Initiatives and Projects

Nowadays, a series of conventional digital soil mapping approaches are used to produce coarse spatial resolution products and reflect the spatial variation of soil variables. For instance, SoilGrids 2.0 provides soil information (250 m) for the globe with quantified spatial uncertainty [71], while Hengl et al. [72] recently provided African soil properties and nutrients mapped at 30 m resolution. Similarly, Fathololoumi et al. [73] improved the digital soil maps in Iran by making use of multitemporal Landsat-8. Notable also is the initiative of the European Soil Observatory (EUSO), which aspires to offer a dynamic and inclusive platform aiming to support policymaking. Till now, soil maps at 500 m have been provided by EUSO, calculated by applying digital soil mapping techniques to the LUCAS-harmonized topsoil database for various properties [74]. Moreover, the Food and Agriculture Organization (FAO) of the United Nations launched a global map as a practical tool for illustrating how much and where carbon dioxide can be sequestered by soils. The last example, along with Australia’s soil classification [75], demonstrated the importance of coordination between government agencies (provision of national soil site data) and research institutes and the role of data mining tools in promoting the operationalization of EO data in support of an effective implementation of soil-related requirements. Another global effort related to the soil ecosystem and its spectral domain is the Global Soil Laboratory Network (GLOSOLAN), established by the FAO. This last effort lays the baseline for a range of standards for soil measurement and data exchange among a collaborative network of multiple independent organizations. Their overarching objective is to provide reliable and comparable information that allow the generation of new harmonized soil data sets (including spectroscopy) among the countries by fostering a standardization process.
Despite the shift from traditional geostatistical approaches to producing soil maps in the current projects and initiatives, the uptake of EO in support of activities to meet the requirements of a range of users has been slow and unevenly adopted by stakeholders. In light of the above, and recognizing the fundamental role of satellite EO in the monitoring and reporting of SOC, the European Space Agency launched the WORLDSOILS project (world-soils.com) aiming to develop, in close cooperation with authoritative end users, a pre-operational monitoring system for providing yearly estimations of organic carbon on a global scale. The WORLDSOILS action plan focuses on exploitation of space-based EO data, large soil data archives, and novel modelling techniques that are mature from an integration perspective, but for which there are still methodological and data availability issues that require attention. The system is conceptualized to be modular to allow covering additional soil properties in the future. Compared with previous efforts, WORLDSOILS has deployed a tailored design (with and for users) to ensure that the global EO soil monitoring system will effectively meet their requirements.
Definitely, the wealth of information and approaches developed during recent years have brought us to a position from which we can develop more robust approaches for reaching the desired level of data reliability (see Section 3.2.1, Section 3.2.2, Section 3.2.3 and Section 3.2.4). However, only a few approaches have been leveraged from the current initiatives, such as the bare soil selection approach introduced by Rogge et al. [42] and further developed by Dvorakova et al. [76], which have been explored within the framework of the WORLDSOILS project.
There is certainly accumulated knowledge in EO data-driven soil modelling in different institutes, as well as in the soil data archives, both of which can be further integrated. Thus, in this sub-section we try to figure out the geographical distribution of all contributing organizations. The authors’ affiliations were taken into account. In the case of a manuscript that included more than one author from the same organization, each institution contributed only once to the final map (Figure 8).
A first glance, the map indicates that out of the 20 contributing countries, the major contributions came from Asian countries (39.5%), while only a single study originated from North Africa [77], whereas no contributions originated from countries in Oceania. The aforementioned result is attributed mainly to the considerable contribution of Chinese (22.4%) as well as Indonesian institutions (3.9%). Brazil seems to be a valuable player since it contributed around 9.2% of the relevant studies. In addition, a worthy sign is that new EO coordinators (India, Russia, and Greece with 2.6%) are working in this broad topic compared with countries such as Israel (1.3%) and United States of America (6.6%) that have a relatively advanced level spanning more than 20 years in this domain. Finally, another remarkable observation is that a large number of articles were the result of international collaboration. Furthermore, in Western Europe, the contributions of France (7.9%), Belgium (6.6%), and Germany (9.2%) stood out.
Based on this solid knowledge of current strengths and weaknesses at a global level, we can conclude that greater awareness and intensified collaboration should be prioritized towards enhancing the EO maturity of each country.

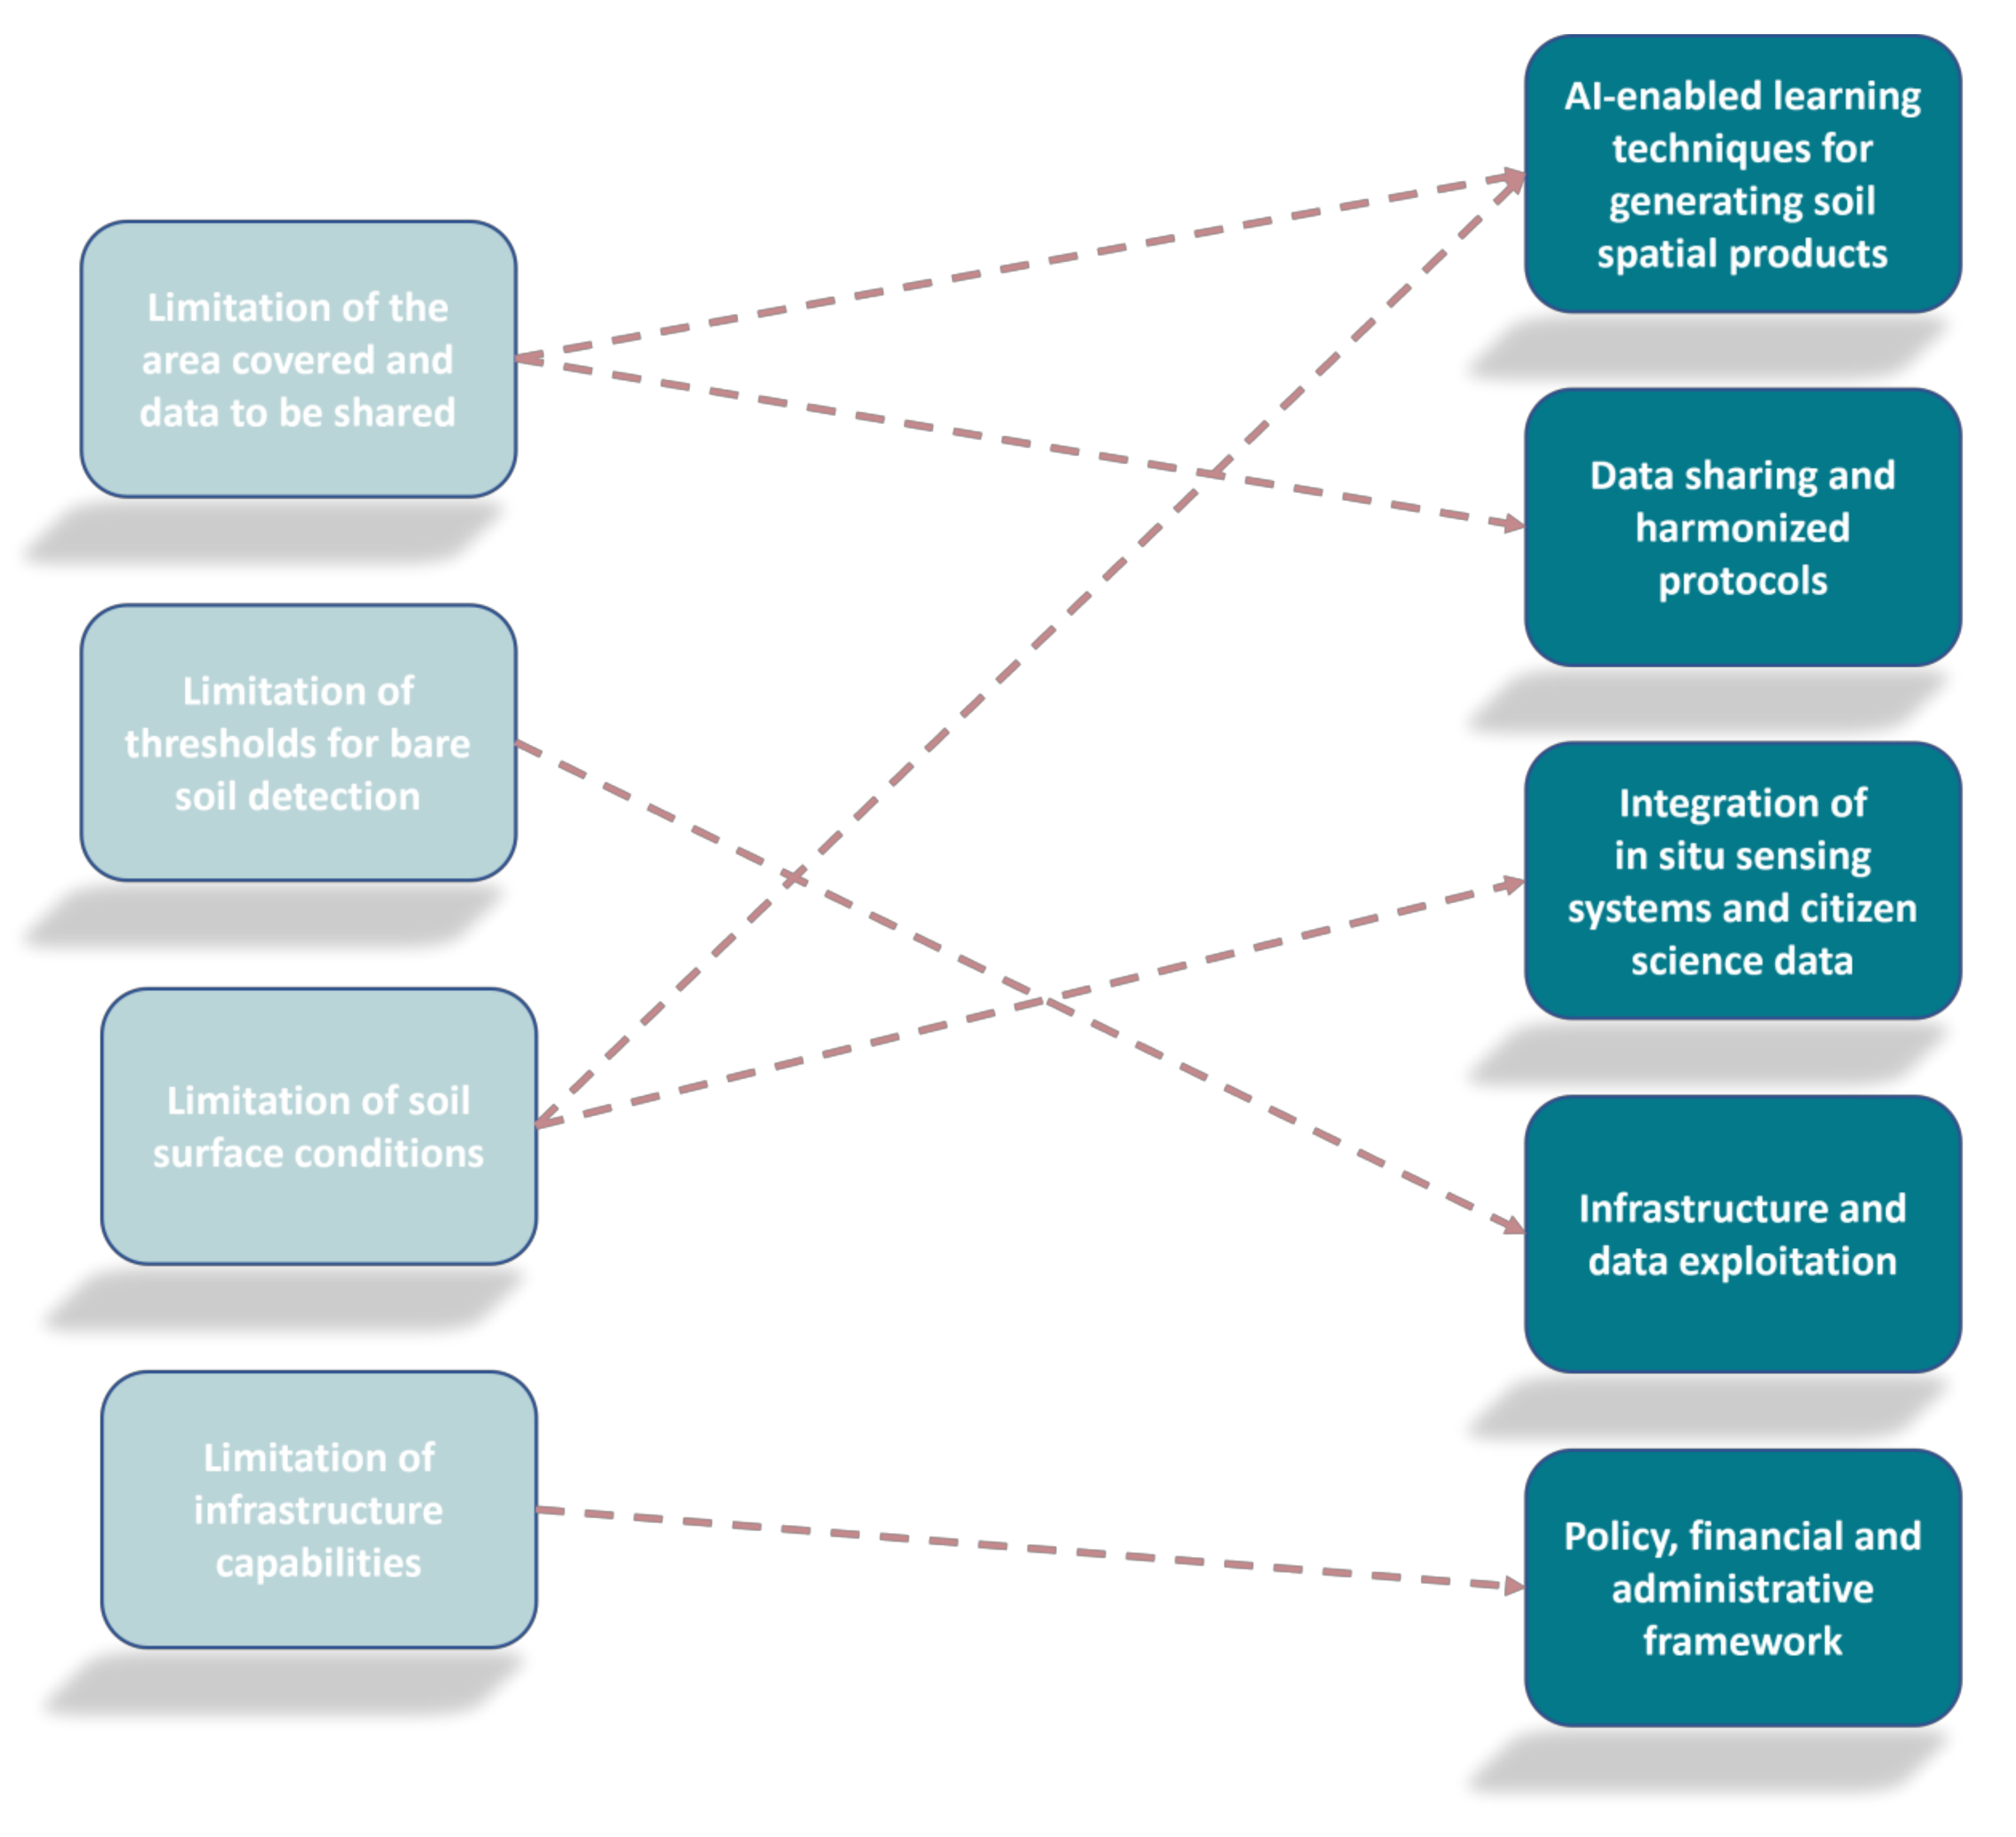
3.2.6. Current Limitations

After reviewing the 46 selected studies, we concluded that there are four main limitations: (i) the area covered and data to be shared, (ii) the use of thresholding to detect bare soil, (ii) the effect of soil surface conditions (i.e., moisture, seals, and roughness), and (iv) the under exploitation of infrastructure capacities.
(i) Limitation of the area covered and data to be shared: It is well-stated that the true value of EO means a reliance on the combination of EO-driven data sources with ground truth data archives for generating the desired spatial products. However, we noticed a lack of coherent data collection and analysis practices, including different data standards, different data accessibility, and lack of interoperability. This issue makes it difficult to find and source relevant local data and expand EO soil solutions to new geographical areas. The issue can have its roots at the policy level of organizations and even at the country level, but it is also manifested in practice in conditions of conducive policy (e.g., the slow availability of data, such as LUCAS 2015 campaign data that were released in 2020). Moreover, the pilot applications included in the studies of this review were mainly restricted to relatively small areas (<200 km2), with only a few samples (n < 200, ~60% of the studies) being utilized in the calibration procedure. Additionally, at such a small scale, the topsoil condition (moisture, residue cover, and roughness) was considered to be almost optimal. These prediction models are all empirical, so extrapolation to other areas for which they were not calibrated is always a problem.
(ii) Limitation of thresholds for bare soil detection: Recently, Dvorakova et al. [76] demonstrated a set of proper thresholds, taking into account the phenological stages of crops and enabling an automatic generation of Sentinel-2 multi-temporal composites by minimizing the influence of distracting factors such as crop residues, surface roughness, and soil moisture. These findings were in concordance with the recent study of Zepp et al. [78], where the influence of vegetation index thresholding on Landsat assessments of exposed soil masks was also studied. Conversely, Castaldi [79] highlighted that Sentinel-2 and Landsat-8 were not able to properly predict clay and CaCO3 because of the low spectral resolution in the SWIR. In a previous research study, Castaldi et al. [80] attained more promising results for SOC. Similarly, in a multi-temporal analysis, Wang [81] retrieved SOC using Sentinel-2 spectral images from bare croplands in autumn. Based on these findings, a new selection strategy was proposed and should be put forward to evaluate the impact of the acquisition dates on the prediction performance of maps [68]—moving forward the definition of comparable agro-climatic zones for deriving local bare soil thresholds and estimating the uncertainty in these approaches.
(iii) Limitation of soil surface conditions: A recent study by Prudnikova et al. [82] demonstrated that rainfall negatively affected the accuracy of SOM predictions based on Sentinel-2 data. Accordingly, we conclude that there is a need for minimization of the effect of soil surface variations in large-scale satellite data. Considering the current multispectral spaceborne sensors, we should mention that the width of the spectral bands does not allow for a straightforward detection of disruptive effects other than partial vegetation cover using the normalized difference vegetation index (NDVI). In this context, the upcoming hyperspectral narrowband data, in particular in the SWIR, will enable the application of new soil moisture indices and proper correction factors [83]. Optimal sampling techniques also require investigation within the framework of AI development. Readers are referred to Castaldi et al. [84], who evaluated different sampling strategies based on the feature spaces to collect a calibration dataset that covered the soil property variability of a study site. Their work reinforces the evidence that regression analysis benefits from a spread of the data set in a feature rather than in the geographic space. However, the spread in the feature space is complex and not simply uniform across the whole spectrum; thus, we should further explore the characteristics of an optimized spectral design for assisting mapping using AI techniques.
(iv) Limitation of infrastructure capabilities: Because of the progress in optical technologies and AI techniques, the exploitation of EO data does not only rely on the advanced spectral resolution of satellites. At the very minimum, it requires the availability of a steady internet connection with a large enough bandwidth to download and process EO datasets. At the advent of the big data era, it also requires cloud storage and computing capabilities that several universities and/or organizations, especially in developing countries, cannot easily afford, or even worse capabilities to which they do not even have access. The ability to collect, store, and process multimodal EO data was widely recognized by a significant percentage (17.4%) of the studies that we reviewed. These works made use of advanced data processing infrastructure working in cloud environments. Therefore, moving from field-level applications to larger scale pilot cases and realizing a future where better exploitation of EO data is possible requires not only the development but also the operation of “basic” infrastructure.

3.3. Future Directions—How Can We Get There?

The overview of the “Where are we now?” chapter illustrates that most of the soil properties, for which EO can play a significant role, require additional sources of information. Despite this, a further leverage of recent AI techniques for overcoming many of the current limitations that have, until now, hindered the desired representativeness and reliability of research is considered to be a necessity. Based on the previous statement, we provide recommendations of potential areas in which to prioritize the use of technologies, algorithms, and applications from the novel industry 4.0, trying to provide valuable insights in order to overcome the current caveats (Figure 9).

3.3.1. AI-Enabled Learning Techniques for Generating Soil Spatial Products

Overall, we conclude that a diversity of AI approaches has been applied across all the available EO sources to predict topsoil parameters at various scales. However, these approaches focus on spatial prediction of properties that are relatively static over the observational period. Till now, the studies that have so far addressed the spatio-temporal dynamics of soil properties using AI methods have still been limited. Overall, current active and passive satellites exhibit a diversity of spectral characteristics that can be synergistically utilized to enhance the predictive performance of topsoil mapping. Here, we raise the discussion of employing DL algorithms, envisioning the development of models capable of better exploiting the spatio-temporal interdependencies in EO data, the features that would normally be difficult for traditional ML methods to extract. In this context, while most of the current state-of-the-art approaches utilize single sensors, future studies should focus on the integration of data and products from additional satellites through more complex non-linear approaches, such as those generated by DL algorithms. In that regard, the architecture of multi-input CNNs provides additional useful capabilities, such as the suitability of fusing features with data from heterogeneous sensors [85] and the potential of being able to address the temporal effects by combining convolutional with recurrent neural networks [86]. In the future, these methods could be applied on EO data by also using static auxiliary data (e.g., location and elevation).
Very High Spatial Resolution (VHR) data could also support the estimation of topsoil properties of agronomic interest at the field scale. Super-spectral and/or hyperspectral data from medium spatial resolution space-borne sensors (e.g., Sentinel-2 and PRISMA satellite) and VHR such as Planet imagery data could be combined to define operational schemes and identify synergies, based on each sensor’s strengths (higher temporal revisit–lower number of spectral bands, higher number of bands, e.g., hyperspectral–lower temporal revisit). This approach should allow observational methods to be further evolved and for tailored algorithms that deliver a higher resolution representation of explicit soil spatial indicators. A super-resolution modelling approach could be applied by teaching a deep neural network to upscale the aforementioned imagery data [87]. Accordingly, the model can learn how to represent medium resolution at a higher resolution, as captured by relevant commercial VHR sensors. This increases the resolution of the images from tens of meters to spatial resolution that is below three meters, while retaining the temporal data. Furthermore, synergies with drone imagery data can also be prioritized to assess the limitations whereby standalone satellite imagery data are not sufficient for reaching the desired spatio-temporal representativeness and reliability.
We strongly believe that opportunities for using AI go beyond the normally implemented supervised ML algorithms. Rather, through generative adversarial neural networks [88], AI can also support modelling activities that are able to overcome the effects of environmental factors in spectral reflectance values. In future steps, we propose exploring the potential of using generative adversarial neural networks to automatically eliminate the effect of soil moisture in the spectral intensity. We assume that such novel architectures can quickly and efficiently improve the quality of the EO-derived spectral signatures using a “denoising” generator and a discriminator. The denoising generator learns how to map the noise from the environmental factors to the pure spectra. Simultaneously, the discriminator learns as a loss function to compare the differences between the noisy spectral signatures. In a final step, the pure spectra are reconstructed by the generator. Recent studies indicate that the proposed approach is better than those of denoising CNNs [89].
Notwithstanding the achievements of DL algorithms, significant limitations have hampered their wider adoption. A few drawbacks, such as the need for huge calibration and unbiased datasets or for extremely time-consuming training [34], should be considered prior the expert intervention. AI algorithms need huge amount of data to deliver accurate results, but they also need to be able to ensure that data are not biased. Considering that a significant number of studies utilized small datasets, as summarized in Table of the Supplementary Materials, AI-enabled data enrichment methods could allow the generation of simulated data from small datasets. Similar examples have been recorded in other fields of research, such as medicine [90]. Other potential applications could be the compression of data space through autoencoders that extract useful features from the initial data, detect and remove input redundancies, and significantly boost the predictions of the neural network [91] or the use of bio-inspired hybridization of artificial neural networks for boosting predictive performance [92]. Similarly, research can examine the use of semi-supervised learning approaches for deriving local spectroscopic calibrations of soil properties in an unknown region by using an existing soil spectral dataset from another region.
In this context, there are inherent limitations in the current ML approaches. It is in this realm that the techniques of DL promise breakthroughs. Table 2 summarizes the most promising types of algorithms for regression analyses that explore correlation across spatial context and multiple timescales and that detect connections between variables, spectra, and ambient factors.
It should be mentioned that the tuning process of hyper-parameters should also be considered for enhancing the models’ reliability. For advanced hyper-parameter tuning and its effect on the context of DL algorithms, we refer to Shen and Viscarra Rossel [95]. The synergy between the two approaches can offer great opportunities for modelling carbon stocks, among others, where global scale data are not available to support a purely empirical DL regression approach. Another technique that can be examined is the potential of object-based image analysis fusing multispectral sensors, as presented by Najafi et al. [96].

3.3.2. Data Sharing and Harmonized Protocols

Another key aspect that should receive special attention by the soil science and EO communities is that of data sharing. Despite the success of having agreed upon the compilation of a globally representative calibrated soil spectral library, subsequent commitments to implement this initiative have in practice fallen short. Thus, the lack of a data sharing culture continues to hamper the uptake and implementation of principles for generating an inter-institutional soil spectral dataset. Building upon countries’ past and ongoing large-scale scientific efforts, research communities should implement a strategy that clearly articulates the specific benefits of, incentives for, and barriers to data sharing amongst those who are expected to share spectral recording data, along with matching conventional soil property data. Recently a new initiative was established under the IEEE Standard Association’s P4005 working group. The aim of this group is to formulate agreed protocols for measuring soil spectroscopy in the laboratory and field for RS applications. Other groups such as GLOSOLAN already work and collaborate in this direction. However, a centralized database management system may be further hindered by multifaceted regulatory requirements of data governance, intellectual property issues, and lack of trust. In this context, the distributed ledger technology, particularly in the form of blockchain, has recently drawn attention from soil scientists [97], as the technology has the potential to enhance efficiency, transparency, and trust in data access and treatment of national and regional in situ datasets [98]. In that regard, the resulting data sharing advocacy products could be leveraged in conjunction with a decentralized database for addressing the missing links in data sharing between what makes sense from a top-down perspective and what the relevant stakeholders perceive as gains. Along these lines, a multidisciplinary team of researchers has been working on the development of a standard protocol and scheme for measuring soil spectroscopy. The agreed standards and protocols from this working group will thus also be aligned with the upcoming hyperspectral technology for mapping and monitoring soils. Moreover, building a future in soil mapping that is characterized by extensive EO data exploitation relies very heavily on the timely release of harmonized and accurate soil data archives from the various coordinating organizations.
Last, the collaboration between National Reporting Centers on soils and research institutes on the development of a spatial information system for soils, such as in the case of Greece, Belgium, and Czech Republic in the WORLDSOILS project, represents a good practice example for creating an enabling environment that conceptualizes and reports on SOC within a geospatial framework and promotes synergies across regularly siloed national bodies.

3.3.3. Integration of In Situ Sensing Systems and Citizen Science Data

Citizen science has gained a significant attendance in the last decade, offering an opportunity for the integration of observations from citizens with those from professionals. Among others, citizen observatories can also impact numerous goals and targets in the agro-environmental sector, highlighting their potential for quantitative in situ data contributions for soil indicators monitoring. For instance, GROW’s citizen scientists [99] have placed low-cost sensors in their soil to feed moisture data back to the observatory. This network of soil sensors is unprecedented, increasing the number of in situ data sources across the European territory from a few hundred to many thousands, enabling potential integration with spaceborne data to address the limitations generated by the moisture content in soils.
Along with this increased number of extensive networks of soil sensors, we are facing a massive data influx from heterogeneous sources. A host of novel and potentially low-cost in situ sensing systems are rapidly maturing and becoming viable alternatives to costlier traditional data collection solutions. For instance, the benefits from mobile device cameras and appropriate applications for analyzing soil properties have been extensively studied as an alternative to commercial color sensors [100] or as a component for identifying bare soil areas via mobile cameras. Consequently, a set of applications have been developed that range from smartphone-captured digital images that use advanced data handling models to applications that can predict soil texture [101] and SOM content [102] with satisfactory accuracy. Furthermore, compact size and portable sensors based on micro-electromechanical systems (MEMS) are undergoing a significant shift [103], enabling among other applications the development of new innovative VNIR–SWIR sensing applications for soil properties or real time variable rate soil sensors [104]. In this context, a set of novel and low-cost spectral acquisition systems has been explored in conjunction with non-linear regression algorithms for predicting soil properties [105,106,107], mainly under controlled illumination conditions in the laboratory. Among other advances, augmented reality now also appears in soil mapping applications, where the locations for sampling are generated automatically, and the user is guided by special glasses to collect the samples representing management zones [108].
However, these novel data acquisition systems need to be further tested under real field conditions, along with the full chain of interconnected systems that can generate complementary data and support the integration of space-based and in situ sensing towards the extraction of harmonized information related to topsoil properties. It is noteworthy that the remarkable success of collecting data in these ways may reflect widespread public interest (e.g., farmers, agri-consultants, and inspectors) and may further promote communication with the science community [109].

3.3.4. Infrastructure and Data Exploitation

The landmark decision of USGS and Copernicus to make Landsat and Sentinel images freely available has fostered quick advancements in the analysis of EO big data for long-term and large-scale digital soil mapping applications. The Landsat data archive offers the longest record, with almost 40 years of observations, while the recently launched Landsat-9 mission will continue this important data record [110], and NASA’s planned Surface Biology and Geology (SBG) mission will continue with the global coverage mission but with a leveraging of the spectral resolution to hyperspectral VNIR–SWIR and the multispectral thermal domain. The Landsat satellite system will broaden the horizon of soil mapping applications by offering advancements with respect to refined spectral band widths (two new shortwave and thermal spectral bands). Similarly, the Sentinel-2 constellation has provided a 5-day global revisit periodicity, as well as significant improvements to data capture in the VNIR region. Moreover, the planned Copernicus Sentinel Expansion Missions with CHIME and the Land Surface Temperature Monitoring (LSTM) mission (operational VNIR–SWIR hyperspectral and thermal infrared multispectral missions, respectively) will foster taking the RS of soils into a new dimension. Their role as space-borne multispectral monitoring tools continues to grow in importance, and it is fully related to the free data availability which is of such great importance to the community. Evolution in the hyper-spectral space component was foreseen by many leading space agencies, in the mid-2020s as a way to improve estimates of soil properties and to overcome limitations not addressed by the existing infrastructure. In particular, planned operational missions from ESA [111] and NASA [112] for launch in the late 2020s carry a strong promise to act as a significant level for EO-based soil mapping that will provide full Earth regular coverage and will be built on experience acquired with the current and upcoming sensors from the German Aerospace Center (Deutsches Zentrum für Luft- und Raumfahrt) hyperspectral missions to orbit as DESIS (present) and EnMAP (>2022), as well as with others such as PRISMA (present), to increase the revisit time with high spectral information. The attention that space agencies such as NASA and ESA have given these days and for the first time in the soil domain is one of the best signs that soil and RS could together become the cornerstone that assists future sustainable development.
More fundamentally, there are processing limitations that are associated with this wealth of EO data. It is in this realm that data cube solutions [113] or operational geospatial processing platforms [114] with a soil mapping orientation should be assessed and piloted. Similarly, the European Commission together with the ESA have procured the Copernicus Data and Information Access Services (DIAS), which provide easy, robust, and continuous access to Copernicus, as well as cloud storage and computing resources to relevant stakeholders for building EO services. It is noteworthy here to mention that the Multi-Mission Algorithm and Analysis Platform (MAAP) is a joint effort between the ESA and NASA. MAAP is the first platform with computing capabilities that is co-located with data as well as with a set of tools and algorithms developed to support research. Moreover, MAAP will address issues related to increased data rates and to the reinforcement of open data policies. A similar effort in EO data-driven analysis is the EnMAP-box [115], which is offered as free and open software for the processing of hyperspectral imagery with potential applications in the soil mapping domain (e.g., EnSoMAP algorithm).

3.3.5. Policy, Financial, and Administrative Framework

Fundamental to the progress of open science is national governments’ continued investment in proper infrastructure and services for data collection, along with equitable and continuous access to these data across the wide community. In this context, diverse national and regional research and/or operational activities should be linked to the greater strategic view of international organizations such as the Group on Earth Observation or the FAO (e.g., GLOSOLAN and Global Soil Partnership).

4. Final Considerations

This paper summarizes efforts that are underway among the research community, international organizations, space agencies, and the private sector, to fill gaps in the provision of insights on how EO coupled with AI could, and is already being utilized to, deliver information related to monitoring and reporting soil-related policies and international treaties, as well as planning and implementing relevant economic activities. The increasing number of peer-reviewed papers within the last three years (addressed here) indicates that EO for topsoil monitoring has now reached a mature level of knowledge, which has been driven by the advent of the EO big data era, spearheaded by free, full, and open data policy (e.g., Sentinel and Landsat) and also by the emergence of appropriate tools (e.g., DL algorithms) and resources (e.g., cloud computing). Many of the methods and applications applied at present show examples of how optical EO can serve as a direct contributor of specific soil parameters, mainly SOC, in support of map creation by leveraging multi-temporal series data to generate composite image that increase the level of detail in the investigated area. A limited number of studies have dealt with the application of hyperspectral data for other parameters, such as heavy metals estimation. Nonetheless, as this technology is promising, a bright future is anticipated with regard to obtaining data for both pure science and practical applications. However, progress is still needed in providing soil products that can support informed decision making at various scales. Despite identification and discussion of the best practices in the field of EO-driven soil monitoring research, accurate and efficient approaches that consider the effects of ambient factors (e.g., moisture, partial cover by vegetation, surface sealing, and plowing of the soil surface) are, and will continue to be, challenging, given the complex interactions inherent in the soil ecosystem. Moreover, the upscaling of these applications has proven to be difficult because of current technological, administrative, and scientific challenges, including among other challenges the lack of standardization and harmonization of soil data archives, the lack of a data sharing culture that can be used as ground truth, and EO data resolution restrictions, as well as an insufficient number of use cases and good practice examples at continental scale.
The prospect of operational use of EO for soil mapping and monitoring by relevant stakeholders will become more attainable if we continue to build on the progress that we have made in the last decade and expand our focus beyond the EO data domain. In light of the above, EO data-driven soil mapping not only requires interdisciplinary research that includes RS, soil, and computer science that work together towards technological and scientific excellence but also requires coordinated support towards “building the workforce of the future”. Thus, through the maximization of synergies amongst key stakeholders and the creation of an ecosystem, we will be able to effectively address the world’s soil health needs, supporting the implementation of an operational global topsoil monitoring system.

Supplementary Materials

Supplementary Materials to this article can be found at https://zenodo.org/record/5615357.

Author Contributions

Conceptualization, writing—original draft preparation, N.T. (Nikolaos Tziolas) and N.T. (Nikolaos Tsakiridis); writing—review and editing, S.C., J.A.M.D., A.G., E.B.-D. and B.v.W.; visualization, N.T. (Nikolaos Tziolas); supervision, B.v.W.; funding acquisition, G.Z. All authors have read and agreed to the published version of the manuscript.

Funding

This research was performed within the framework of the WORLDSOILS application project funded by the European Space Agency developed within the EO Science for Society slice of the 5th Earth Observation Envelope Program. This research was co-financed by the European Regional Development Fund of the European Union and Greek national funds through the Operational Program Competitiveness, Entrepreneurship, and Innovation, under the call RESEARCH–CREATE–INNOVATE (project code: T2EDK-00866).

Institutional Review Board Statement

Not applicable.

Informed Consent Statement

Not applicable.

Data Availability Statement

Supplementary Materials to this article can be found at https://zenodo.org/record/5615357 (accessed on 25 October 2021).

Acknowledgments

We would like to thank Eleni Kalopesa, for her contribution to the editing and proofreading of the manuscript and for her continuous support and encouragement of this study.

Conflicts of Interest

The authors declare no conflict of interest.

Abbreviations

AIArtificial Intelligence
ANNArtificial Neural Networks
CAPCommon Agricultural Policy
CHIMECopernicus Hyperspectral Imaging Mission
CMEFCommon Monitoring and Evaluation Programme
CNNConvolutional Neural Network
DIASData and Information Access Services
DLDeep Learning
EnMAPMapping
EOEarth Observation
ESAEuropean Space Agency
EUEuropean Union
EUSOEuropean Soil Observatory
GEEGoogle Earth Engine
GEOS3Geospatial Soil Sensing System
GLOSOLANGlobal Soil Laboratory Network
IPCCIntergovernmental Panel on Climate Change
LiDARLight Detection and Ranging
LSTMLand Surface Temperature Monitoring
LUCASLand Use and Coverage Area frame Survey
MAAPMulti-Mission Algorithm and Analysis Platform
MEMSMicro Electromechanical Systems
MLMachine Learning
NASANational Aeronautics and Space Administration
NDVINormalized Difference Vegetation Index
PRISMAPrecursore Iperspettrale della Missione Applicativa
R2Coefficient of Determination
RFRandom Forest
RSRemote Sensing
SBGSurface Biology and Geology
ScMAPSoil Composite Mapping Processor
SDGsSustainable Development Goals
SMLRStepwise Multiple Linear Regression
SOCSoil Organic Carbon
SOMSoil Organic Matter
SVMSupport Vector Machine
SWIRShort Wave Infrared
UASUnmanned Aerial Systems
VHRVery High Spatial Resolution
UNFCCUnited Nations Framework Convention on Climate Change
VNIRVisible Near Infrared

Appendix A

The article selection process is illustrated in the preferred reporting items for systematic reviews and meta-analyses methodology flow chart in Figure A1.
Figure A1. The preferred reporting items for systematic reviews and meta-analyses methodology flow diagram of the current review.
Remotesensing 13 04439 g0a1

References

  1. Montanarella, L.; Pennock, D.J.; McKenzie, N.; Badraoui, M.; Chude, V.; Baptista, I.; Mamo, T.; Yemefack, M.; Aulakh, M.S.; Yagi, K.; et al. World’s soils are under threat. SOIL 2016, 2, 79–82. [Google Scholar] [CrossRef] [Green Version]
  2. Castaldi, F.; Hueni, A.; Chabrillat, S.; Ward, K.; Buttafuoco, G.; Bomans, B.; Vreys, K.; Brell, M.; van Wesemael, B. Evaluating the capability of the Sentinel 2 data for soil organic carbon prediction in croplands. ISPRS J. Photogramm. Remote Sens. 2019, 147, 267–282. [Google Scholar] [CrossRef]
  3. Vaudour, E.; Gomez, C.; Fouad, Y.; Lagacherie, P. Sentinel-2 image capacities to predict common topsoil properties of temperate and Mediterranean agroecosystems. Remote Sens. Environ. 2019, 223, 21–33. [Google Scholar] [CrossRef]
  4. Yao, X.; Li, G.; Xia, J.; Ben, J.; Cao, Q.; Zhao, L.; Ma, Y.; Zhang, L.; Zhu, D. Enabling the big earth observation data via cloud computing and DGGS: Opportunities and challenges. Remote Sens. 2020, 12, 62. [Google Scholar] [CrossRef] [Green Version]
  5. Keesstra, S.D.; Bouma, J.; Wallinga, J.; Tittonell, P.; Smith, P.; Cerdà, A.; Montanarella, L.; Quinton, J.N.; Pachepsky, Y.; van der Putten, W.H.; et al. The significance of soils and soil science towards realization of the United Nations Sustainable Development Goals. SOIL 2016, 2, 111–128. [Google Scholar] [CrossRef] [Green Version]
  6. Chabrillat, S.; Ben-Dor, E.; Cierniewski, J.; Gomez, C.; Schmid, T.; van Wesemael, B. Imaging Spectroscopy for Soil Mapping and Monitoring. Surv. Geophys. 2019, 40, 361–399. [Google Scholar] [CrossRef] [Green Version]
  7. Angelopoulou, T.; Tziolas, N.; Balafoutis, A.; Zalidis, G.; Bochtis, D. Remote Sensing Techniques for Soil Organic Carbon Estimation: A Review. Remote Sens. 2019, 11, 676. [Google Scholar] [CrossRef] [Green Version]
  8. Moher, D.; Liberati, A.; Tetzlaff, J.; Altman, D.G. Preferred reporting items for systematic reviews and meta-analyses: The PRISMA statement. BMJ 2009, 339, 332–336. [Google Scholar] [CrossRef] [Green Version]
  9. Mabkhot, M.M.; Ferreira, P.; Maffei, A.; Podržaj, P.; Mądziel, M.; Antonelli, D.; Lanzetta, M.; Barata, J.; Boffa, E.; Finžgar, M.; et al. Mapping industry 4.0 enabling technologies into united nations sustainability development goals. Sustainability 2021, 13, 2560. [Google Scholar] [CrossRef]
  10. Kavvada, A.; Metternicht, G.; Kerblat, F.; Mudau, N.; Haldorson, M.; Laldaparsad, S.; Friedl, L.; Held, A.; Chuvieco, E. Towards delivering on the sustainable development goals using earth observations. Remote Sens. Environ. 2020, 247. [Google Scholar] [CrossRef]
  11. Bouma, J.; Montanarella, L. Facing policy challenges with inter- and transdisciplinary soil research focused on the un Sustainable Development Goals. SOIL 2016, 2, 135–154. [Google Scholar] [CrossRef] [Green Version]
  12. Panagos, P.; Montanarella, L. Soil Thematic Strategy: An important contribution to policy support, research, data development and raising the awareness. Curr. Opin. Environ. Sci. Health 2018, 5, 38–41. [Google Scholar] [CrossRef]
  13. Panagos, P.; Ballabio, C.; Scarpa, S.; Borelli, P.; Lugato, E.; Montanarella, L. Soil Related Indicators to Support Agro-Environmental Policies; Publications Office of the European Union: Luxembourg, 2020; ISBN 9789276156444. [Google Scholar]
  14. Basso, B.; Fiorentino, C.; Cammarano, D.; Schulthess, U. Variable rate nitrogen fertilizer response in wheat using remote sensing. Precis. Agric. 2016, 17, 168–182. [Google Scholar] [CrossRef]
  15. Rukhovich, D.I.; Koroleva, P.V.; Kalinina, N.V.; Vilchevskaya, Y.V.; Suleiman, G.A.; Chernousenko, G.I. Detecting Degraded Arable Land on the Basis of Remote Sensing Big Data Analysis. Eurasian Soil Sci. 2021, 54, 161–175. [Google Scholar] [CrossRef]
  16. Kragt, M.E.; Dumbrell, N.P.; Blackmore, L. Motivations and barriers for Western Australian broad-acre farmers to adopt carbon farming. Environ. Sci. Policy 2017, 73, 115–123. [Google Scholar] [CrossRef] [Green Version]
  17. Schreiner, S.; Culibrk, D.; Bandecchi, M.; Gross, W.; Middelmann, W. Soil monitoring for precision farming using hyperspectral remote sensing and soil sensors. At. Automatisierungstechnik 2021, 69, 325–335. [Google Scholar] [CrossRef]
  18. Paul, S.; Dowell, L.; Coops, N.; Johnson, M.; Krzic, M.; Geesing, D.; Smukler, S. Tracking changes in soil organic carbon across the heterogeneous agricultural landscape of the Lower Fraser Valley of British Columbia. Sci. Total Environ. 2020, 732, 138994. [Google Scholar] [CrossRef]
  19. Hagen, S.; Delgado, G.; Ingraham, P.; Cooke, I.; Emery, R.; Fisk, J.P.; Melendy, L.; Olson, T.; Patti, S.; Rubin, N.; et al. Mapping Conservation Management Practices and Outcomes in the Corn Belt Using the Operational Tillage Information System (OpTIS) and the Denitrification–Decomposition (DNDC) Model. Land 2020, 9, 408. [Google Scholar] [CrossRef]
  20. Smith, P.; Soussana, J.; Angers, D.; Schipper, L.; Chenu, C.; Rasse, D.P.; Batjes, N.H.; van Egmond, F.; McNeill, S.; Kuhnert, M.; et al. How to measure, report and verify soil carbon change to realize the potential of soil carbon sequestration for atmospheric greenhouse gas removal. Glob. Chang. Biol. 2019, 26, 219–241. [Google Scholar] [CrossRef] [Green Version]
  21. Guo, L.; Sun, X.; Fu, P.; Shi, T.; Dang, L.; Chen, Y.; Linderman, M.; Zhang, G.; Zhang, Y.; Jiang, Q.; et al. Mapping soil organic carbon stock by hyperspectral and time-series multispectral remote sensing images in low-relief agricultural areas. Geoderma 2021, 398, 115118. [Google Scholar] [CrossRef]
  22. Nanni, M.; Demattê, J.; Rodrigues, M.; Santos, G.; Reis, A.; Oliveira, K.; Cezar, E.; Furlanetto, R.; Crusiol, L.; Sun, L. Mapping Particle Size and Soil Organic Matter in Tropical Soil Based on Hyperspectral Imaging and Non-Imaging Sensors. Remote Sens. 2021, 13, 1782. [Google Scholar] [CrossRef]
  23. Tan, K.; Wang, H.; Chen, L.; Du, Q.; Du, P.; Pan, C. Estimation of the spatial distribution of heavy metal in agricultural soils using airborne hyperspectral imaging and random forest. J. Hazard. Mater. 2019, 382, 120987. [Google Scholar] [CrossRef]
  24. Tan, K.; Ma, W.; Chen, L.; Wang, H.; Du, Q.; Du, P.; Yan, B.; Liu, R.; Li, H. Estimating the distribution trend of soil heavy metals in mining area from HyMap airborne hyperspectral imagery based on ensemble learning. J. Hazard. Mater. 2020, 401, 123288. [Google Scholar] [CrossRef]
  25. Jia, X.; Cao, Y.; O’Connor, D.; Zhu, J.; Tsang, D.C.; Zou, B.; Hou, D. Mapping soil pollution by using drone image recognition and machine learning at an arsenic-contaminated agricultural field. Environ. Pollut. 2020, 270, 116281. [Google Scholar] [CrossRef]
  26. Yin, F.; Wu, M.; Liu, L.; Zhu, Y.; Feng, J.; Yin, D.; Yin, C.; Yin, C. Predicting the abundance of copper in soil using reflectance spectroscopy and GF5 hyperspectral imagery. Int. J. Appl. Earth Obs. Geoinf. 2021, 102, 102420. [Google Scholar] [CrossRef]
  27. Hasab, H.A.; Dibs, H.; Dawood, A.S.; Hadi, W.H.; Hussain, H.M.; Al-Ansari, N. Monitoring and Assessment of Salinity and Chemicals in Agricultural Lands by a Remote Sensing Technique and Soil Moisture with Chemical Index Models. Geosciences 2020, 10, 207. [Google Scholar] [CrossRef]
  28. Sorenson, P.; Shirtliffe, S.; Bedard-Haughn, A. Predictive soil mapping using historic bare soil composite imagery and legacy soil survey data. Geoderma 2021, 401, 115316. [Google Scholar] [CrossRef]
  29. Safanelli, J.L.; Chabrillat, S.; Ben-Dor, E.; Demattê, J.A.M. Multispectral Models from Bare Soil Composites for Mapping Topsoil Properties over Europe. Remote Sens. 2020, 12, 1369. [Google Scholar] [CrossRef]
  30. Tziolas, N.; Tsakiridis, N.; Ben-Dor, E.; Theocharis, J.; Zalidis, G. Employing a Multi-Input Deep Convolutional Neural Network to Derive Soil Clay Content from a Synergy of Multi-Temporal Optical and Radar Imagery Data. Remote Sens. 2020, 12, 1389. [Google Scholar] [CrossRef]
  31. Fathizad, H.; Ardakani, M.A.H.; Sodaiezadeh, H.; Kerry, R.; Taghizadeh-Mehrjardi, R. Investigation of the spatial and temporal variation of soil salinity using random forests in the central desert of Iran. Geoderma 2020, 365, 114233. [Google Scholar] [CrossRef]
  32. Wang, J.; Ding, J.; Yu, D.; Teng, D.; He, B.; Chen, X.; Ge, X.; Zhang, Z.; Wang, Y.; Yang, X.; et al. Machine learning-based detection of soil salinity in an arid desert region, Northwest China: A comparison between Landsat-8 OLI and Sentinel-2 MSI. Sci. Total Environ. 2020, 707, 136092. [Google Scholar] [CrossRef] [PubMed]
  33. Svetnik, V.; Liaw, A.; Tong, C.; Culberson, J.C.; Sheridan, R.P.; Feuston, B.P. Random Forest: A Classification and Regression Tool for Compound Classification and QSAR Modeling. J. Chem. Inf. Comput. Sci. 2003, 43, 1947–1958. [Google Scholar] [CrossRef] [PubMed]
  34. Padarian, J.; Minasny, B.; McBratney, A.B. Machine learning and soil sciences: A review aided by machine learning tools. SOIL 2020, 6, 35–52. [Google Scholar] [CrossRef] [Green Version]
  35. Meng, X.; Bao, Y.; Liu, J.; Liu, H.; Zhang, X.; Zhang, Y.; Wang, P.; Tang, H.; Kong, F. Regional soil organic carbon prediction model based on a discrete wavelet analysis of hyperspectral satellite data. Int. J. Appl. Earth Obs. Geoinf. 2020, 89, 102111. [Google Scholar] [CrossRef]
  36. Veres, M.; Lacey, G.; Taylor, G.W. Deep Learning Architectures for Soil Property Prediction. In Proceedings of the 2015 12th Conference on Computer and Robot Vision (CRV), Halifax, NS, Canada, 3–5 June 2015. [Google Scholar]
  37. Liu, L.; Ji, M.; Buchroithner, M. Transfer Learning for Soil Spectroscopy Based on Convolutional Neural Networks and Its Application in Soil Clay Content Mapping Using Hyperspectral Imagery. Sensors 2018, 18, 3169. [Google Scholar] [CrossRef] [Green Version]
  38. Wadoux, A.M.J.; Román-Dobarco, M.; McBratney, A.B. Perspectives on data-driven soil research. Eur. J. Soil Sci. 2020, 72, 1675–1689. [Google Scholar] [CrossRef]
  39. Safanelli, J.L.; Demattê, J.A.; Chabrillat, S.; Poppiel, R.R.; Rizzo, R.; Dotto, A.C.; Silvero, N.E.; Mendes, W.D.S.; Bonfatti, B.R.; Ruiz, L.F.; et al. Leveraging the application of Earth observation data for mapping cropland soils in Brazil. Geoderma 2021, 396, 115042. [Google Scholar] [CrossRef]
  40. Arrieta, A.B.; Díaz-Rodríguez, N.; Del Ser, J.; Bennetot, A.; Tabik, S.; Barbado, A.; Garcia, S.; Gil-Lopez, S.; Molina, D.; Benjamins, R.; et al. Explainable Artificial Intelligence (XAI): Concepts, taxonomies, opportunities and challenges toward responsible AI. Inf. Fusion 2019, 58, 82–115. [Google Scholar] [CrossRef] [Green Version]
  41. Diek, S.; Fornallaz, F.; Schaepman, M.E.; De Jong, R. Barest Pixel Composite for Agricultural Areas Using Landsat Time Series. Remote Sens. 2017, 9, 1245. [Google Scholar] [CrossRef] [Green Version]
  42. Rogge, D.; Bauer, A.; Zeidler, J.; Mueller, A.; Esch, T.; Heiden, U. Building an exposed soil composite processor (SCMaP) for mapping spatial and temporal characteristics of soils with Landsat imagery (1984–2014). Remote Sens. Environ. 2018, 205, 1–17. [Google Scholar] [CrossRef] [Green Version]
  43. Zepp, S.; Heiden, U.; Bachmann, M.; Wiesmeier, M.; Steininger, M.; van Wesemael, B. Estimation of Soil Organic Carbon Contents in Croplands of Bavaria from SCMaP Soil Reflectance Composites. Remote Sens. 2021, 13, 3141. [Google Scholar] [CrossRef]
  44. Loiseau, T.; Chen, S.; Mulder, V.; Dobarco, M.R.; Richer-De-Forges, A.; Lehmann, S.; Bourennane, H.; Saby, N.; Martin, M.; Vaudour, E.; et al. Satellite data integration for soil clay content modelling at a national scale. Int. J. Appl. Earth Obs. Geoinf. 2019, 82. [Google Scholar] [CrossRef]
  45. Zhou, T.; Geng, Y.; Chen, J.; Pan, J.; Haase, D.; Lausch, A. High-resolution digital mapping of soil organic carbon and soil total nitrogen using DEM derivatives, Sentinel-1 and Sentinel-2 data based on machine learning algorithms. Sci. Total. Environ. 2020, 729, 138244. [Google Scholar] [CrossRef] [PubMed]
  46. Rizzo, R.; Medeiros, L.G.; de Mello, D.C.; Marques, K.P.P.; Mendes, W.D.S.; Silvero, N.E.Q.; Dotto, A.C.; Bonfatti, B.R.; Demattê, J.A. Multi-temporal bare surface image associated with transfer functions to support soil classification and mapping in southeastern Brazil. Geoderma 2019, 361, 114018. [Google Scholar] [CrossRef]
  47. Padilha, M.C.D.C.; Vicente, L.E.; Demattê, J.A.; Loebmann, D.G.D.S.W.; Vicente, A.K.; Salazar, D.F.; Guimarães, C.C.B. Using Landsat and soil clay content to map soil organic carbon of oxisols and Ultisols near São Paulo, Brazil. Geoderma Reg. 2020, 21, e00253. [Google Scholar] [CrossRef]
  48. Gomez, C.; Dharumarajan, S.; Lagacherie, P.; Riotte, J.; Ferrant, S.; Sekhar, M.; Ruiz, L. Mapping of tank silt application using Sentinel-2 images over the Berambadi catchment (India). Geoderma Reg. 2021, 25, e00389. [Google Scholar] [CrossRef]
  49. Ghazali, M.F.; Wikantika, K.; Harto, A.B.; Kondoh, A. Generating soil salinity, soil moisture, soil pH from satellite imagery and its analysis. Inf. Process. Agric. 2020, 7, 294–306. [Google Scholar] [CrossRef]
  50. Wang, H.; Zhang, X.; Wu, W.; Liu, H. Prediction of Soil Organic Carbon under Different Land Use Types Using Sentinel-1/-2 Data in a Small Watershed. Remote Sens. 2021, 13, 1229. [Google Scholar] [CrossRef]
  51. Silvero, N.E.Q.; Demattê, J.A.M.; Amorim, M.T.A.; dos Santos, N.V.; Rizzo, R.; Safanelli, J.L.; Poppiel, R.R.; Mendes, W.D.S.; Bonfatti, B.R. Soil variability and quantification based on Sentinel-2 and Landsat-8 bare soil images: A comparison. Remote Sens. Environ. 2020, 252, 112117. [Google Scholar] [CrossRef]
  52. Planet Team. Planet Team. Planet Application Program Interface. In Space for Life on Earth; Planet Team: San Francisco, CA, USA, 2017. [Google Scholar]
  53. Bellinaso, H.; Silvero, N.E.; Ruiz, L.F.C.; Amorim, M.T.A.; Rosin, N.A.; Mendes, W.D.S.; de Sousa, G.P.B.; Sepulveda, L.M.A.; de Queiroz, L.G.; Nanni, M.R.; et al. Clay content prediction using spectra data collected from the ground to space platforms in a smallholder tropical area. Geoderma 2021, 399, 115116. [Google Scholar] [CrossRef]
  54. Žížala, D.; Minařík, R.; Zádorová, T. Soil Organic Carbon Mapping Using Multispectral Remote Sensing Data: Prediction Ability of Data with Different Spatial and Spectral Resolutions. Remote Sens. 2019, 11, 2947. [Google Scholar] [CrossRef]
  55. Guo, L.; Fu, P.; Shi, T.; Chen, Y.; Zhang, H.; Meng, R.; Wang, S. Mapping field-scale soil organic carbon with unmanned aircraft system-acquired time series multispectral images. Soil Tillage Res. 2020, 196, 104477. [Google Scholar] [CrossRef]
  56. Biney, J.; Saberioon, M.; Borůvka, L.; Houška, J.; Vašát, R.; Agyeman, P.C.; Coblinski, J.; Klement, A. Exploring the Suitability of UAS-Based Multispectral Images for Estimating Soil Organic Carbon: Comparison with Proximal Soil Sensing and Spaceborne Imagery. Remote Sens. 2021, 13, 308. [Google Scholar] [CrossRef]
  57. Nayak, A.; Rahman, M.M.; Naidu, R.; Dhal, B.; Swain, C.K.; Tripathi, R.; Shahid, M.; Islam, M.R.; Pathak, H. Current and emerging methodologies for estimating carbon sequestration in agricultural soils: A review. Sci. Total Environ. 2019, 665, 890–912. [Google Scholar] [CrossRef]
  58. Transon, J.; D’Andrimont, R.; Maugnard, A.; Defourny, P. Survey of Hyperspectral Earth Observation Applications from Space in the Sentinel-2 Context. Remote Sens. 2018, 10, 157. [Google Scholar] [CrossRef] [Green Version]
  59. Tziolas, N.; Tsakiridis, N.; Ogen, Y.; Kalopesa, E.; Ben-Dor, E.; Theocharis, J.; Zalidis, G. An integrated methodology using open soil spectral libraries and Earth Observation data for soil organic carbon estimations in support of soil-related SDGs. Remote Sens. Environ. 2020, 244, 111793. [Google Scholar] [CrossRef]
  60. Ward, K.; Chabrillat, S.; Brell, M.; Castaldi, F.; Spengler, D.; Foerster, S. Mapping Soil Organic Carbon for Airborne and Simulated EnMAP Imagery Using the LUCAS Soil Database and a Local PLSR. Remote Sens. 2020, 12, 3451. [Google Scholar] [CrossRef]
  61. Hong, Y.; Guo, L.; Chen, S.; Linderman, M.; Mouazen, A.M.; Yu, L.; Chen, Y.; Liu, Y.; Liu, Y.; Cheng, H.; et al. Exploring the potential of airborne hyperspectral image for estimating topsoil organic carbon: Effects of fractional-order derivative and optimal band combination algorithm. Geoderma 2020, 365. [Google Scholar] [CrossRef]
  62. Hong, Y.; Chen, S.; Chen, Y.; Linderman, M.; Mouazen, A.M.; Liu, Y.; Guo, L.; Yu, L.; Liu, Y.; Cheng, H.; et al. Comparing laboratory and airborne hyperspectral data for the estimation and mapping of topsoil organic carbon: Feature selection coupled with random forest. Soil Tillage Res. 2020, 199, 104589. [Google Scholar] [CrossRef]
  63. Meng, X.; Bao, Y.; Ye, Q.; Liu, H.; Zhang, X.; Tang, H.; Zhang, X. Soil Organic Matter Prediction Model with Satellite Hyperspectral Image Based on Optimized Denoising Method. Remote Sens. 2021, 13, 2273. [Google Scholar] [CrossRef]
  64. Loizzo, R.; Guarini, R.; Longo, F.; Scopa, T.; Formaro, R.; Facchinetti, C.; Varacalli, G. Prisma: The Italian hyperspectral mission. In Proceedings of the International Geoscience and Remote Sensing Symposium (IGARSS), Valencia, Spain, 22–27 July 2018. [Google Scholar]
  65. Krutz, D.; Venus, H.; Eckardt, A.; Walter, I.; Sebastian, I.; Reulke, R.; Günther, B.; Zender, B.; Arloth, S.; Williges, C.; et al. DESIS -DLR Earth Sensing Imaging Spectrometer. In Proceedings of the SPIE Remote Sensing, Berlin, Germany, 11–12 September 2018. [Google Scholar]
  66. Castaldi, F.; Palombo, A.; Santini, F.; Pascucci, S.; Pignatti, S.; Casa, R. Evaluation of the potential of the current and forthcoming multispectral and hyperspectral imagers to estimate soil texture and organic carbon. Remote Sens. Environ. 2016, 179, 54–65. [Google Scholar] [CrossRef]
  67. Vaudour, E.; Gomez, C.; Lagacherie, P.; Loiseau, T.; Baghdadi, N.; Urbina-Salazar, D.; Loubet, B.; Arrouays, D. Temporal mosaicking approaches of Sentinel-2 images for extending topsoil organic carbon content mapping in croplands. Int. J. Appl. Earth Obs. Geoinf. 2020, 96, 102277. [Google Scholar] [CrossRef]
  68. Vaudour, E.; Gomez, C.; Loiseau, T.; Baghdadi, N.; Loubet, B.; Arrouays, D.; Ali, L.; Lagacherie, P. The Impact of Acquisition Date on the Prediction Performance of Topsoil Organic Carbon from Sentinel-2 for Croplands. Remote Sens. 2019, 11, 2143. [Google Scholar] [CrossRef] [Green Version]
  69. Zhang, Y.; Hartemink, A.E.; Huang, J.; Townsend, P.A. Synergistic use of hyperspectral imagery, Sentinel-1 and LiDAR improves mapping of soil physical and geochemical properties at the farm-scale. Eur. J. Soil Sci. 2021, 72, 1690–1717. [Google Scholar] [CrossRef]
  70. Li, X.; Ding, J.; Liu, J.; Ge, X.; Zhang, J. Digital Mapping of Soil Organic Carbon Using Sentinel Series Data: A Case Study of the Ebinur Lake Watershed in Xinjiang. Remote Sens. 2021, 13, 769. [Google Scholar] [CrossRef]
  71. Poggio, L.; de Sousa, L.M.; Batjes, N.H.; Heuvelink, G.B.M.; Kempen, B.; Ribeiro, E.; Rossiter, D. SoilGrids 2.0: Producing soil information for the globe with quantified spatial uncertainty. SOIL 2021, 7, 217–240. [Google Scholar] [CrossRef]
  72. Hengl, T.; Miller, M.A.E.; Križan, J.; Shepherd, K.D.; Sila, A.; Kilibarda, M.; Antonijević, O.; Glušica, L.; Dobermann, A.; Haefele, S.M.; et al. African soil properties and nutrients mapped at 30 m spatial resolution using two-scale ensemble machine learning. Sci. Rep. 2021, 11, 6130. [Google Scholar] [CrossRef]
  73. Fathololoumi, S.; Vaezi, A.R.; Alavipanah, S.K.; Ghorbani, A.; Saurette, D.; Biswas, A. Improved digital soil mapping with multitemporal remotely sensed satellite data fusion: A case study in Iran. Sci. Total Environ. 2020, 721, 137703. [Google Scholar] [CrossRef]
  74. Ballabio, C.; Panagos, P.; Monatanarella, L. Mapping topsoil physical properties at European scale using the LUCAS database. Geoderma 2016, 261, 110–123. [Google Scholar] [CrossRef]
  75. Teng, H.; Rossel, R.A.V.; Shi, Z.; Behrens, T. Updating a national soil classification with spectroscopic predictions and digital soil mapping. CATENA 2018, 164, 125–134. [Google Scholar] [CrossRef]
  76. Dvorakova, K.; Heiden, U.; van Wesemael, B. Sentinel-2 Exposed Soil Composite for Soil Organic Carbon Prediction. Remote Sens. 2021, 13, 1791. [Google Scholar] [CrossRef]
  77. Aichi, H.; Fouad, Y.; Chabaane, Z.L.; Sanaa, M.; Walter, C. Soil total carbon mapping, in Djerid Arid area, using ASTER multispectral remote sensing data combined with laboratory spectral proximal sensing data. Arab. J. Geosci. 2021, 14, 405. [Google Scholar] [CrossRef]
  78. Zepp, S.; Jilge, M.; Metz-Marconcini, A.; Heiden, U. The influence of vegetation index thresholding on EO-based assessments of exposed soil masks in Germany between 1984 and 2019. ISPRS J. Photogramm. Remote Sens. 2021, 178, 366–381. [Google Scholar] [CrossRef]
  79. Castaldi, F. Sentinel-2 and Landsat-8 Multi-Temporal Series to Estimate Topsoil Properties on Croplands. Remote Sens. 2021, 13, 3345. [Google Scholar] [CrossRef]
  80. Castaldi, F.; Chabrillat, S.; Don, A.; Van Wesemael, B. Soil Organic Carbon Mapping Using LUCAS Topsoil Database and Sentinel-2 Data: An Approach to Reduce Soil Moisture and Crop Residue Effects. Remote Sens. 2019, 11, 2121. [Google Scholar] [CrossRef] [Green Version]
  81. Wang, K.; Qi, Y.; Guo, W.; Zhang, J.; Chang, Q. Retrieval and Mapping of Soil Organic Carbon Using Sentinel-2A Spectral Images from Bare Cropland in Autumn. Remote Sens. 2021, 13, 1072. [Google Scholar] [CrossRef]
  82. Prudnikova, E.; Savin, I. Some Peculiarities of Arable Soil Organic Matter Detection Using Optical Remote Sensing Data. Remote Sens. 2021, 13, 2313. [Google Scholar] [CrossRef]
  83. Diek, S.; Chabrillat, S.; Nocita, M.; Schaepman, M.E.; de Jong, R. Minimizing soil moisture variations in multi-temporal airborne imaging spectrometer data for digital soil mapping. Geoderma 2018, 337, 607–621. [Google Scholar] [CrossRef]
  84. Castaldi, F.; Chabrillat, S.; Van Wesemael, B. Sampling Strategies for Soil Property Mapping Using Multispectral Sentinel-2 and Hyperspectral EnMAP Satellite Data. Remote Sens. 2019, 11, 309. [Google Scholar] [CrossRef] [Green Version]
  85. Ienco, D.; Interdonato, R.; Gaetano, R.; Minh, D.H.T. Combining Sentinel-1 and Sentinel-2 Satellite Image Time Series for land cover mapping via a multi-source deep learning architecture. ISPRS J. Photogramm. Remote Sens. 2019, 158, 11–22. [Google Scholar] [CrossRef]
  86. Interdonato, R.; Ienco, D.; Gaetano, R.; Ose, K. DuPLO: A DUal view Point deep Learning architecture for time series classificatiOn. ISPRS J. Photogramm. Remote Sens. 2019, 149, 91–104. [Google Scholar] [CrossRef] [Green Version]
  87. Deudon, M.; Kalaitzis, A.; Goytom, I.; Arefin, M.R.; Lin, Z.; Sankaran, K.; Michalski, V.; Kahou, S.E.; Cornebise, J.; Bengio, Y. HighRes-net: Recursive Fusion for Multi-Frame Super-Resolution of Satellite Imagery. arxiv 2020, arXiv:2002.06460. [Google Scholar]
  88. Goodfellow, I.; Pouget-Abadie, J.; Mirza, M.; Xu, B.; Warde-Farley, D.; Ozair, S.; Courville, A.; Bengio, Y. Generative adversarial networks. Commun. ACM 2020, 63, 139–144. [Google Scholar] [CrossRef]
  89. Wu, M.; Bu, Y.; Pan, J.; Yi, Z.; Kong, X. Spectra-GANs: A New Automated Denoising Method for Low-S/N Stellar Spectra. IEEE Access 2020, 8, 107912–107926. [Google Scholar] [CrossRef]
  90. Chen, R.J.; Lu, M.Y.; Chen, T.Y.; Williamson, D.F.K.; Mahmood, F. Synthetic data in machine learning for medicine and healthcare. Nat. Biomed. Eng. 2021, 5, 493–497. [Google Scholar] [CrossRef]
  91. Tsimpouris, E.; Tsakiridis, N.L.; Theocharis, J.B. Using autoencoders to compress soil VNIR–SWIR spectra for more robust prediction of soil properties. Geoderma 2021, 393, 114967. [Google Scholar] [CrossRef]
  92. Taghizadeh-Mehrjardi, R.; Emadi, M.; Cherati, A.; Heung, B.; Mosavi, A.; Scholten, T. Bio-Inspired Hybridization of Artificial Neural Networks: An Application for Mapping the Spatial Distribution of Soil Texture Fractions. Remote Sens. 2021, 13, 1025. [Google Scholar] [CrossRef]
  93. Gargiulo, M. Advances on CNN-Based Super-Resolution of Sentinel-2 Images. In Proceedings of the International Geoscience and Remote Sensing Symposium (IGARSS), Yokohama, Japan, 28 July–2 August 2019. [Google Scholar]
  94. Chawla, N.V.; Bowyer, K.; Hall, L.O.; Kegelmeyer, W.P. SMOTE: Synthetic Minority Over-sampling Technique. J. Artif. Intell. Res. 2002, 16, 321–357. [Google Scholar] [CrossRef]
  95. Shen, Z.; Rossel, R.A.V. Automated spectroscopic modelling with optimised convolutional neural networks. Sci. Rep. 2021, 11, 208. [Google Scholar] [CrossRef]
  96. Najafi, P.; Navid, H.; Feizizadeh, B.; Eskandari, I.; Blaschke, T. Fuzzy Object-Based Image Analysis Methods Using Sentinel-2A and Landsat-8 Data to Map and Characterize Soil Surface Residue. Remote Sens. 2019, 11, 2583. [Google Scholar] [CrossRef] [Green Version]
  97. Padarian, J.; McBratney, A.B. A new model for intra- and inter-institutional soil data sharing. SOIL 2020, 6, 89–94. [Google Scholar] [CrossRef] [Green Version]
  98. Casino, F.; Dasaklis, T.K.; Patsakis, C. A systematic literature review of blockchain-based applications: Current status, classification and open issues. Telemat. Inform. 2018, 36, 55–81. [Google Scholar] [CrossRef]
  99. Ajates, R.; Hager, G.; Georgiadis, P.; Coulson, S.; Woods, M.; Hemment, D. Local Action with Global Impact: The Case of the GROW Observatory and the Sustainable Development Goals. Sustainability 2020, 12, 10518. [Google Scholar] [CrossRef]
  100. Stiglitz, R.; Mikhailova, E.; Post, C.; Schlautman, M.; Sharp, J.; Pargas, R.; Glover, B.; Mooney, J. Soil color sensor data collection using a GPS-enabled smartphone application. Geoderma 2017, 296, 108–114. [Google Scholar] [CrossRef] [Green Version]
  101. Swetha, R.; Bende, P.; Singh, K.; Gorthi, S.; Biswas, A.; Li, B.; Weindorf, D.C.; Chakraborty, S. Predicting soil texture from smartphone-captured digital images and an application. Geoderma 2020, 376, 114562. [Google Scholar] [CrossRef]
  102. Fu, Y.; Taneja, P.; Lin, S.; Ji, W.; Adamchuk, V.; Daggupati, P.; Biswas, A. Predicting soil organic matter from cellular phone images under varying soil moisture. Geoderma 2019, 361, 114020. [Google Scholar] [CrossRef]
  103. Fathy, A.; Sabry, Y.M.; Nazeer, S.; Bourouina, T.; Khalil, D.A. On-chip parallel Fourier transform spectrometer for broadband selective infrared spectral sensing. Microsyst. Nanoeng. 2020, 6, 10. [Google Scholar] [CrossRef] [PubMed] [Green Version]
  104. Guerrero, A.; De Neve, S.; Mouazen, A.M. Current sensor technologies for in situ and on-line measurement of soil nitrogen for variable rate fertilization: A review. Adv. Agron. 2021, 168, 1–38. [Google Scholar] [CrossRef]
  105. Barthès, B.G.; Kouakoua, E.; Clairotte, M.; Lallemand, J.; Chapuis-Lardy, L.; Rabenarivo, M.; Roussel, S. Performance comparison between a miniaturized and a conventional near infrared reflectance (NIR) spectrometer for characterizing soil carbon and nitrogen. Geoderma 2018, 338, 422–429. [Google Scholar] [CrossRef]
  106. Karyotis, K.; Angelopoulou, T.; Tziolas, N.; Palaiologou, E.; Samarinas, N.; Zalidis, G. Evaluation of a Micro-Electro Mechanical Systems Spectral Sensor for Soil Properties Estimation. Land 2021, 10, 63. [Google Scholar] [CrossRef]
  107. Tang, Y.; Jones, E.; Minasny, B. Evaluating low-cost portable near infrared sensors for rapid analysis of soils from South Eastern Australia. Geoderma Reg. 2019, 20, e00240. [Google Scholar] [CrossRef]
  108. Huuskonen, J.; Oksanen, T. Soil sampling with drones and augmented reality in precision agriculture. Comput. Electron. Agric. 2018, 154, 25–35. [Google Scholar] [CrossRef]
  109. Ebitu, L.; Avery, H.; Mourad, K.A.; Enyetu, J. Citizen science for sustainable agriculture—A systematic literature review. Land Use Policy 2021, 103, 105326. [Google Scholar] [CrossRef]
  110. Masek, J.G.; Wulder, M.A.; Markham, B.; McCorkel, J.; Crawford, C.; Storey, J.; Jenstrom, D.T. Landsat 9: Empowering open science and applications through continuity. Remote Sens. Environ. 2020, 248, 111968. [Google Scholar] [CrossRef]
  111. Nieke, J.; Rast, M. Status: Copernicus Hyperspectral Imaging Mission for the Environment (CHIME). In Proceedings of the International Geoscience and Remote Sensing Symposium (IGARSS), Yokohama, Japan, 28 July–2 August 2019. [Google Scholar]
  112. Green, R.O. Global VSWIR imaging spectroscopy and the 2017 decadal survey: Robert O. In Green and the imaging spectroscopy community. In Proceedings of the International Geoscience and Remote Sensing Symposium (IGARSS), Valencia, Spain, 22–27 July 2018. [Google Scholar]
  113. Killough, B. Overview of the open data cube initiative. In Proceedings of the International Geoscience and Remote Sensing Symposium (IGARSS), Valencia, Spain, 22–27 July 2018; Volume 2018, pp. 8629–8632. [Google Scholar]
  114. Gorelick, N.; Hancher, M.; Dixon, M.; Ilyushchenko, S.; Thau, D.; Moore, R. Google Earth Engine: Planetary-scale geospatial analysis for everyone. Remote Sens. Environ. 2017, 202, 18–27. [Google Scholar] [CrossRef]
  115. Van Der Linden, S.; Rabe, A.; Held, M.; Jakimow, B.; Leitão, P.J.; Okujeni, A.; Schwieder, M.; Suess, S.; Hostert, P. The EnMAP-Box—A Toolbox and Application Programming Interface for EnMAP Data Processing. Remote Sens. 2015, 7, 11249–11266. [Google Scholar] [CrossRef] [Green Version]
Figure 1. The methodological framework to answer the main key questions regarding the review of various components of EO data-driven soil monitoring.
Remotesensing 13 04439 g001
Figure 2. Research from the EO and soil communities needs to focus on the Data–Information–Knowledge–Wisdom pathway to be relevant for the implementation of the soil-related strategic goals. EO prosumers—non-traditional end-users who are adopting EO as both data consumers and information producers—have a key role to play in generating knowledge using EO to monitor and drive progress on soil mapping and reporting (inspired from Kavvada et al. [10]).
Remotesensing 13 04439 g002
Figure 3. Overview of the most important estimated soil properties taken into account by the studies included in this review. Organic matter is displayed together with organic carbon.
Remotesensing 13 04439 g003
Figure 4. Boxplot of reported R2 grouped by (a) scale and (b) resolution in the various pilot cases. The median is shown with a bold black line.
Remotesensing 13 04439 g004
Figure 5. Evolution of regression model usage in the period 2019–2021. Neural networks includes both artificial and convolutional neural networks; others include elastic network and k-nearest neighbor algorithms; regression trees includes gradient boosting, and C4.5 algorithms; while special linear regressions refer to stepwise multiple regression, RIDGE, and LASSO algorithms.
Remotesensing 13 04439 g005
Figure 6. Evolution of the number of research studies that (a) use Sentinel-2 or Landsat data; and (b) follow a single-image or a multi-temporal modelling approach within the time period of 2019–2021.
Remotesensing 13 04439 g006
Figure 7. Number of EO means mentioned in the articles studied in this review. Others include RGB and multispectral sensors mounted on the UAS.
Remotesensing 13 04439 g007
Figure 8. Total number of institutions per country that contributed to research studies included in this review. Outlined countries have zero occurrences.
Remotesensing 13 04439 g008
Figure 9. Interlinkages of the recognized current limitations with the proposed future direction in order to reach the final goals.
Remotesensing 13 04439 g009
Table 1. The policy frameworks relevant to soil and information needs that can be supported by EO data.
Policy FrameworkInformation NeedsEO Spatial Explicit Indicators
United Nations—Sustainable Development Goals
(SDGs)
Soil fertility and the role of soils for food security; soil and public health; soil water interdependencies; impact of climate change on soils and opportunities for mitigation; functions of soil biodiversity; implementation of effective soil conservationpH, soil texture, SOC
United Nations—Framework Convention on Climate Change—Intergovernmental Panel on Climate Change
(UNFCC-IPCC)
Mitigation value (carbon stores, sequestration rate, avoided loss, and rehabilitation potential); specific inputs for tier one reportingSOC
Common Monitoring and Evaluation Framework (CMEF)Maintenance of soil organic matter (SOM) levelSOC
Common Agricultural Policy (CAP)Maintenance of SOM levelSOC
Mission area Soil Health and FoodMaintenance of SOM levelSOC, pH
Green DealSoil-related information for Farm-to-Fork and the EU Biodiversity strategies; the Zero Pollution Action planpH, soil texture, SOC
Table 2. Emergent and potential DL approaches in EO-based soil regression modelling.
Scientific TaskConventional ApproachesLimitations of Conventional ApproachesEmergent or Potential Approaches
Multi-temporal soil regression analysisML and DL algorithms using bare soil compositesTemporal effects not
considered
Combination of CNN with recurrent networks [86]
Removing the effect of ambient factorsExternal parameter orthogonalization, piecewise direct standardizationAmbient factors effect not addressed properlyGenerative adversarial networks [88], denoising autoencoders [89]
Downscaling and super resolution modellingPansharpeningShallow spatial context used or noneRecursive fusion for multi-frame super-resolution of EO data [87,93]
Fusing features from heterogeneous data sourcesRandom forests, multi-kernel methods, feedforward neural networksNot revealing the spatio-spectral interdependenciesMulti-source DL architecture [85]
Compressing the latent space of featuresPrincipal component analysisNot extracting useful features from spectral dataDeep connected autoencoder architectures [91]
Data enrichment for unbalanced classification problemsSynthetic minority oversampling technique [94]Overcoming
the paucity and representativeness of annotated soil spectral data
Generative adversarial networks [90]
Publisher’s Note: MDPI stays neutral with regard to jurisdictional claims in published maps and institutional affiliations.

