Article

How Well Do We Know Europa’s Topography? An Evaluation of the Variability in Digital Terrain Models of Europa

1
United States Geological Survey, Astrogeology Science Center, Flagstaff, AZ 86001, USA
2
Sagen Center at the SETI Institute, Mountain View, CA 94043, USA
*
Author to whom correspondence should be addressed.
Remote Sens. 2021, 13(24), 5097; https://doi.org/10.3390/rs13245097
Submission received: 5 November 2021 / Revised: 7 December 2021 / Accepted: 11 December 2021 / Published: 15 December 2021
(This article belongs to the Special Issue Planetary 3D Mapping, Remote Sensing and Machine Learning)

Abstract

:
Jupiter’s moon Europa harbors one of the most likely environments for extant extraterrestrial life. Determining whether Europa is truly habitable requires understanding the structure and thickness of its ice shell, including the existence of perched water or brines. Stereo-derived topography from images acquired by NASA Galileo’s Solid State Imager (SSI) of Europa are often used as a constraint on ice shell structure and heat flow, but the uncertainty in such topography has, to date, not been rigorously assessed. To evaluate the current uncertainty in Europa’s topography we generated and compared digital terrain models (DTMs) of Europa from SSI images using both the open-source Ames Stereo Pipeline (ASP) software and the commercial SOCET SET® software. After first describing the criteria for assessing stereo quality in detail, we qualitatively and quantitatively describe both the horizontal resolution and vertical precision of the DTMs. We find that the horizontal resolution of the SOCET SET® DTMs is typically 8–11× the root mean square (RMS) pixel scale of the images, whereas the resolution of the ASP DTMs is 9–13× the maximum pixel scale of the images. We calculate the RMS difference between the ASP and SOCET SET® DTMs as a proxy for the expected vertical precision (EP), which is a function of the matching accuracy and stereo geometry. We consistently find that the matching accuracy is ~0.5 pixels, which is larger than well-established “rules of thumb” that state that the matching accuracy is 0.2–0.3 pixels. The true EP is therefore ~1.7× larger than might otherwise be assumed. In most cases, DTM errors are approximately normally distributed, and errors that are several times the derived EP occur as expected. However, in two DTMs, larger errors (differences) occur and correlate with real topography. These differences primarily result from manual editing of the SOCET SET® DTMs. The product of the DTM error and the resolution is typically 4–8 pixel2 if calculated using the RMS image scale for SOCET SET® DTMs and the maximum images scale for the ASP DTMs, which is consistent with recent work using martian data sets and suggests that the relationship applies more broadly. We evaluate how ASP parameters affect DTM quality and find that using a smaller subpixel refinement kernel results in DTMs with smaller (better) resolution but, in some cases, larger gaps, which are sometimes reduced by increasing the size of the correlation kernel. We conclude that users of ASP should always systematically evaluate the choice of parameters for a given dataset.

1. Introduction

Of all of the icy moons in the outer Solar System, Europa is particularly scientifically compelling. Its outer ice shell may be just tens of kilometers thick and underlain by a deep subsurface ocean that is in direct contact with the rock mantle [1]. Europa’s deep environment might therefore provide the conditions necessary for habitability: water, energy, and key chemical elements derived from water-rock interactions. Additionally, pockets of water or brine have been postulated to be perched in the shallow subsurface [2,3], and these pockets provide yet another potentially habitable zone nearer Europa’s surface. Determining the extent to which Europa is actually habitable depends, in part, on understanding the structure of its ice shell. In some cases, ice shell structure can be inferred from the surface topography. For example, the inference of liquid water perched in the shell depends sensitively on the long-wavelength topography associated with chaos features [2], and crater depths derived from topography help constrain the thickness and structure of the ice shell [4,5]. Additionally, topographic information has been used to constrain the thickness of the elastic lithosphere, as a proxy for heat flow out of the interior [6,7], to infer lateral variations in ice shell thickness [8], test for true polar wander [9,10], and determine the properties of the ice shell [11]. It also provides constraints on the formation of bands and ridges, e.g., [12,13,14], chaos [15], dark spots (Macula) [16], and pits and uplifts [17], all of which provide insight into the structure of the ice shell, and thus Europa’s habitable potential.
Because Europa is potentially habitable, it is the target of NASA’s Europa Clipper mission, which is currently scheduled to launch in 2024 and arrive at Jupiter in 2030. Although topography derived from Galileo images will be rapidly superseded once the Europa Clipper mission arrives at Europa, e.g., [18], evaluating how well we know Europa’s topography is critical to set mission science priorities (e.g., focusing observations on specific regions due to topography that is consistent with subsurface water) and setting expectations for the technical performance of instruments (e.g., the amount of surface clutter expected for the radar system [19]). Additionally, at least some of the lessons learned from examining digital terrain models (DTMs) derived from Galileo images will apply to Europa Clipper DTMs as well.
Given how important topographic information is in evaluating Europa’s habitability and informing the Europa Clipper mission design, it is critical that we, as a community, understand how well we actually know Europa’s topography. Therefore, the goal of this work is to begin to address the accuracy (and quality) of DTMs generated from Galileo images of Europa. Although our analysis is Europa-specific, many of our results and conclusions can inform our understanding of the accuracy of topographic data when a reference elevation data set does not exist.

2. Materials and Methods

2.1. Assessing DTM Quality

Users of topographic data need to know the extent to which they can believe that features are (in both form and dimensions) as they appear in a given DTM. Conversely, where the DTM does not show a feature, is it truly absent? These concerns lead to multiple measures of DTM quality, such as accuracy, precision, resolution, and artifacts. Unfortunately, absolute positional accuracy and relative elevations (tilts) across or among DTMs are outside the scope of our investigation. The lack of independent elevation data, such as radar or lidar altimetry, for Europa leaves us without the reference needed to assess these factors—and also without the ground data needed to improve the absolute accuracy of DTMs by bundle adjustment (though such adjustment is useful to ensure good relative alignment of groups of images and DTMs; see Bland et al. [20]). Instead, we focus on local properties of DTMs, such as their vertical precision and horizontal resolution, which determine what features are likely to be represented reliably. We also consider qualitative aspects, such as the characteristic appearance of artifacts, which can sometimes be used to distinguish them from real features. These aspects of DTM quality are influenced primarily by the behavior of the automated dense matching algorithm and the quality and geometric properties of the images. Even with this restricted focus, our task remains challenging. On Earth, ground surveys and GPS provide abundant, dense and accurate reference data that address all aspects of quality. On the Moon and Mars, lidar altimetry provides a high absolute precision (albeit sparse) reference that has been used for DTM evaluation e.g., [21,22]. Very high resolution stereopairs are also available for these bodies, and DTMs from them can be used to assess the resolution and precision of DTMs from other, lower resolution images [23]. Even overlapping stereopairs with comparable resolution can provide some information about DTM precision [24]. On Europa, we have none of these resources. We therefore examine the difference between DTMs produced from the same stereopair with different software as a proxy for vertical precision. Orthoimages (the images of the stereopair, projected onto the DTM surface) provide information that allows us to estimate the horizontal resolution and characterize artifacts [21].

2.2. Overview of Stereo Criteria

Stereotopographic mapping works by identifying the corresponding features in two (or more) images and then using the geometry of the images to estimate the features’ three-dimensional locations in the real world. It is thus not surprising that geometric properties of the images, such as their viewing and illumination directions and their pixel scale, affect the DTM quality. Criteria for selecting stereo image pairs for mapping are often stated in terms of go/no-go ranges for key parameters. For example, Becker et al., [25] recommend, among other criteria, images with incidence angles (i) between 40° and 65°, and emission angles (e) between 0° and 40°. If it were this simple, we could simply state that the DTMs in this study were made from image pairs with acceptable parameters. In reality, DTM quality degrades gradually rather than abruptly with most parameters, so this effect is a factor in interpreting the variation in quality results even from “acceptable” images. Furthermore, the optimal or acceptable parameter ranges are influenced by the target characteristics, particularly surface slopes. For example, the upper limits on incidence and emission angles are intended to avoid shadowing and excessive foreshortening (or even disappearance) of back slopes, respectively. Thus, higher incidence and emission angles can be tolerated on bodies, such as Europa, that are relatively smooth (except perhaps at the smallest scales [26]). The lower limit on incidence is intended to avoid the vanishing of slope contrasts under overhead sun and may not be an issue if there are strong albedo contrasts. Again, this may be the case for Europa (see Kirk et al. [27]), and if so, the limit can be relaxed.
The compatibility of the viewing and illumination geometry between images must also be taken into account. The strength of the stereo viewing geometry is characterized by the parallax-height ratio (p/h), which relates image parallax measurements to the desired height estimates. This is computed by considering how a hypothetical one-meter-high feature would appear displaced when each image is projected onto a horizontal surface, and then calculating the length of the vector difference (see Becker et al. [25] for equations). When both emission angles are modest, p/h is approximately equal to the tangent of the stereo convergence angle (the angle between the look directions from the two camera stations), which may be easier to visualize mentally. Small convergence angles (and p/h) lead to less precise, noisier DTM data at the same image resolution, as discussed below. Large convergence is desirable in the sense of improving height precision, but the large emission angles needed run the risk of foreshortened or invisible surface areas, as discussed above. As a general rule, convergence angles between 20° and 30° (p/h of 0.4 to 0.6) are considered desirable, but angles between 5° and 45° (p/h between 0.1 and 1) have been used under certain circumstances. For Galileo images, p/h is frequently greater than 1, and the relative smoothness of Europa’s surface (generally less than 1 km of total relief and maximum slopes of 10–15° [26]) makes this both acceptable and desirable (to improve precision).
Differing illumination causes corresponding features in the images to appear less similar, degrading the precision with which they can be matched. The limits of acceptable illumination difference have been parameterized in a variety of ways. Cook et al. [28] stipulated Daz ≤ 45°, Di ≤ 10° where Daz and Di are the differences in sun azimuth (measured on the ground, not the image plane) and incidence angles. Kirk et al. [29] modified this scheme to allow increasing Daz for high, medium, and low incidence angles. More recently, Becker et al. [25] introduced the concept of shadow tip distance (DST), which is computed from the incidence and solar azimuth of the two images by the same equations used to compute p/h from the spacecraft angles. The quantity indicates the distance between the outer ends of the shadows in the two images of a hypothetical 1-m high stick. Thus, although somewhat less intuitive than Daz or Di alone, DST encapsulates the dependence of stereo quality on both solar angles simultaneously. Based on experience producing numerous HiRISE DTMs, a limit of DST ≤ 0.6 was suggested. Kirk et al. [27] simulated stereopairs of Europa from a known DTM and showed that allowing the vertical error of the resulting stereo DTM to increase by no more than 2× compared to identical illumination was generally consistent with these earlier criteria. They also suggested, however, that a simple set of linear inequalities Daz ≤ (90°-i), Di ≤ 0.8 (90°-i) would serve as well. Finally, they noted a special case in which DST > 0.6 can be tolerated without increasing DTM errors. When both incidence angles are large (though not so large as to lead to extensive shadowing) and Daz is small, increasing i darkens the scene without changing its appearance. In this situation images with different incidence angles can still be matched successfully.
Image resolution, or more precisely, ground sample distance (GSD, the size of a pixel projected onto the target), requires special consideration. The image resolution directly and proportionately impacts vertical precision, as discussed below. Because matching images involves comparing patterns of pixels, the image resolution also directly impacts the horizontal resolution of the DTM. Stereo DTMs are frequently made with a GSD of three to five times that of the images, based on the idea that this represents a lower limit on the size of image patches that can be compared; DTM posts (i.e., pixels) can be spaced closer than this but this will not provide a higher resolution because they will not be based on independent image data. In practice, the effective resolution of the DTM depends on the details of the matching software and can be substantially greater than three to five pixels [23,30,31]. From this point of view there is no cutoff resolution at which stereo becomes impossible, but the likely resolution of the resulting DTM must be compared to the size of the features to be studied. It is also desirable for the GSD of the two images to differ by no more than a factor of 2.5, but this is more an issue of convenience than one of DTM quality. Exceeding this ratio is possible (the higher resolution can be downsampled to bring the ratio back into this range if need be) but multiple images will be needed to cover the same area as a single lower (worse) resolution image. Similarly, an overlap of at least 30% between images is desirable, but using images with less overlap mostly increases the work effort rather than degrading DTM quality (note that overlap is not directly tied to p/h as it is for aerial photography of the Earth).
The geometric parameters just discussed affect the expected vertical precision (EP) of the stereo DTM, but the viewing and illumination geometries appear in radically different ways. EP is defined as the root mean square (RMS) uncertainty in a point elevation sampled from the DTM. It is given by the equation
E P = ρ G S D ( p / h )
The stereo viewing geometry enters through the parallax height-ratio, which is a rigorous expression converting horizontal (parallax) measurements to elevation changes, and also via the ground sample distance GSD of the images. Care must be used in choosing the GSD if the two images have different GSD values. Kirk et al. [24] used the RMS GSD of the two images (GSDRMS). This is more consistent with the NGATE matching algorithm within SOCET SET® (Section 2.4), which works internally with the mean GSD of the images (not the RMS) and Kirk et al. [23] saw evidence that this carries over to the resolution of the output. In contrast, ASP orthorectifies the images at the coarsest GSD (GSDmax), and this value may be more applicable to Europa. Throughout this work we discuss both GSDRMS and GSDmax and discuss which is more useful when assessing DTM accuracy. The two different GSD values yield different EP, which we define as EPRMS (EP calculated using GSDRMS) and EPmax (EP calculated using GSDmax).
The remaining parameter ρ is the matching precision, the RMS error in locating corresponding points in the two images, expressed in pixels. This should be largely independent of the image scale but dependent on the scene content, e.g., [23], and the details of the matching algorithm used. If ρ can be estimated in advance, vertical precision can be predicted from the stereo geometry. Conversely, if EP can be estimated (by comparing a DTM to reference data), then ρ can be inferred and the assumption that it is constant can be tested. We and other planetary scientists have investigated the matching precision in multiple studies involving diverse cameras and different approaches [24,27,28,29,30,31,32] and have found that ρ is usually on the order of 0.2 to 0.3 pixel. Recently, Kirk et al. [23] found that ρ = 0.3–0.4 (using SOCET SET® with the NGATE+AATE matcher, see Section 2.4) except for smooth terrains, where ρ was smaller. Thus, these studies lend support to the use of 0.3 pixel matching precision as a general photometric “rule of thumb.” This value is not entirely universal, however. Matching precision approaching 0.05 pixel can be obtained for very favorable conditions (matching the same scene with no parallax, lighting changes, or noise) [33]. On the other hand, Kirk et al. [29] showed that ρ increases with increasing lossy compression (which both blurs the images and adds noise). The simulations by Kirk et al. [27] showed that ρ increases with differences in the illumination in the paired images. Numerous other effects can also be expected to worsen the matching precision, including imaging smooth featureless terrain, actual surface changes, atmospheric haze, use of images taken through different color filters (if the surface is colorful), and the use of large emission angles with resulting foreshortening of the surface. Of these, high compression and the need to use pairs with different illumination and large emission angles, because there are no alternatives, are highly relevant for Europa. As we will show below, using ρ = 0.3 pixels leads to overly optimistic estimates of the true vertical precision for most Europa DTMs. Thus, one of the goals of this investigation can be formulated as an attempt to estimate what matching precision ρ to use in predicting the expected vertical precision of Europa DTMs, both for selecting stereopairs and interpreting the results. As with EP, the two different GSD values yield two different estimates of ρ, and we define ρRMS as ρ calculated using GSDRMS and ρmax as that calculated using GSDmax. The latter is smaller for the same EP because the pixel size is larger.
Finally, we note that EP captures only one aspect (albeit a key one) of DTM errors, namely the RMS value. Matching, and thus elevation errors, commonly follow a composite probability distribution that combines a quasi-normally distributed component (driven by the influence of various minor noise sources on matching) and a component of extreme outliers or “blunders.” The latter errors commonly arise from mistaking a feature in one image for an entirely different feature in the other, rather than measuring its alignment with the correct feature inaccurately. Such blunders can often be identified because they are spatially localized [23]. The matching algorithms used in this study [34,35,36] all use a multi-pass approach to matching a “pyramid” of reduced resolution versions of the images, and additionally incorporate various filtering steps. As a result, errors are not independent from one DTM pixel (or “post”) to another but are spatially correlated in a software-dependent and potentially complex way [24]. We will therefore examine extreme errors, as well as the dispersion described by EP, and will attempt to give at least a qualitative description of the spatial form of any artifacts. Finally, we emphasize that EP is a statistical measure of the DTM precision, and the quasi-normally distribution of error will naturally result in errors that are several times larger. Thus, in no case should EP be thought of as an upper bound on the error within a given DTM.

2.3. General Technical Approach to DTM Generation

Previously, digital elevation models of localized regions of satellites in the outer Solar System have been created by a number of research groups on an as-needed basis for individual investigations. In the Jupiter system, the highest resolution dataset available is from the Galileo Solid State Imager (SSI) (see Section 2.7 for additional details). Due to the failure of Galileo’s high-gain antenna deployment, the quantity of imaging data returned by the mission was limited. This severely restricts the regions of Europa for which quality stereo-pairs exist, and in the decades since the end of the Galileo mission, stereo-derived DTMs have been created for all regions on Europa for which stereo-pairs are available [Paul Schenk, personal communication]. The majority of these DTMs were created with the Ames Stereo Pipeline (ASP) [37] (see Phillips et al. [38,39] for examples), SOCET SET® (see Phillips et al. [38,39] for examples of Europa DTMs from SOCET SET® and, e.g., Kirk et al. [24,32] and Section 2.4 for a description of SOCET SET® itself), software adapted from the control point matching tools available in the USGS’ Integrated Software for Imagers and Spectrometers (ISIS), e.g., [2,4,16,40], and unreleased VICAR software developed at the German Aerospace Center DLR [41]. Our investigation focuses on ASP and SOCET SET® because they, the ISIS package needed to support their planetary use, and the DTMs generated from them are widely available (ASP and ISIS are free and open-source; SOCET SET® is a commercial package from BAE Systems, but is widely used).
Whether ASP, SOCET SET®, or some other software package is used, DTM generation follows the same set of basic steps. First, the image pair must be appropriately prepared (e.g., calibration, application of NAIF SPICE-Navigation and Ancillary Information Facility; Spacecraft, Planet, Instrument, Camera-matrix, Events—kernels, which define the location and orientation of the camera and target [42]) and in most cases bundle adjusted to improve their relative alignment to one another. Second, dense matching between the two images is performed to find features or points in common between the two images. Third, terrain is extracted using these matches and the known camera geometries (i.e., triangulation). Interpolation of the surface and optional smoothing can then be performed. The differences then between ASP and SOCET SET® are largely due to the details of the algorithms used to complete each step, many of which can be modified by adjusting relevant parameters. Most significantly, SOCET SET® provides the user with the ability to manually edit the DTM that results from the process just described, which permits both the removal of gross blunders and the sharpening of features of interest. ASP does not currently include this capability. In practice, ASP and SOCET SET® each have their own advantages and challenges and our purpose is not to determine which is “best”. However, throughout this paper we highlight these advantages so that the reader has a better understanding of the costs and benefits of each software package when applied to Europa Galileo data or similar data sets. Below, we describe our methodology for generating DTMs in SOCET SET® and ASP in more detail.

2.4. Producing DTMs Using SOCET SET®

The USGS Astrogeology has adopted the commercial software system SOCET SET® from BAE Systems [43] for DTM production from planetary images. Although the SOCET SET® software package is transitioning to SOCET GXP, the Europa DTMs discussed here were created using SOCET SET®. SOCET GXP uses identical algorithms for bundle adjustment and matching as SOCET SET® but provides a different interface. Astrogeology has used SOCET SET® extensively for martian (e.g., Mars Reconnaissance Orbiter High Resolution Imaging Science Experiment (HiRISE) and Context Camera (CTX)) and lunar (Apollo, Lunar Orbiter, Clementine, LROC) datasets, as well as for mapping Venus, Titan, comets, and other bodies. We have also produced a very limited number of DTMs from Galileo stereo images ([44] https://astrogeology.usgs.gov/search/map/Io/Topography/TvashtarPaterae/TvashtarPaterae_DEM_900m accessed on 4 November 2021). Here we describe our general approach to DTM creation for Europa. Details specific to each dataset are described in Section 3.
The procedure for DTM generation using framing camera data in SOCET SET® begins with images in PDS format (.img files) that are converted to ISIS image cubes (.cub files) [45] using the ISIS command gllssi2isis (or alternatively pds2isis). We then radiometrically calibrate the images and prepare supporting position/pointing metadata (NAIF SPICE kernels) for use in SOCET SET®. In some instances where “a priori” SPICE data is inaccurate, the images were initially photogrammetrically controlled in ISIS. This step is now unnecessary due to the improved image locations provided by Bland et al. [20] for the entire Galileo dataset. The images, along with the trajectory and pointing metadata, are then transferred to SOCET SET®, where they are controlled and bundle adjusted using the SOCET SET® program Multi-Sensor Triangulation (MST). In MST, tie-points, and in some cases “z” (or height) constrained ground control points are measured, followed by iterative bundle adjustment to achieve a solution with subpixel error. DTMs are extracted using the known camera orientation and automated high-density area-and feature-based matching across image stereopairs using a combination of the Next Generation Automatic Terrain Extraction (NGATE) [34] and the Adaptive Automatic Terrain Extraction (AATE) [35] algorithms. For NGATE DTM extractions, we optionally use a single, high-resolution pass of the AATE algorithm to smooth the DTM without allowing it to depart significantly from the original NGATE solution. This follows the method used for higher-resolution datasets such as HiRISE and CTX where DTMs produced using NGATE alone usually have a low rate of serious errors but can include block-like artifacts [32]. To avoid potentially over-smoothing DTMs generated from low-resolution Europa Galileo data, we ran NGATE extractions with a low-smooth option invoked and no subsequent AATE pass. In limited cases, NGATE failed entirely, and we adopted an AATE-only multi-pass strategy. We have not observed a significant degradation in the quality of the AATE-only DTMs.
In all cases, we visually inspected the resulting DTM against the controlled images utilizing stereo viewing, and performed manual editing as required to remove artifacts and correct other identifiable errors resulting from the automated matching process. Visual inspection followed by manual editing significantly improves the quality of the DTM by removing blunders caused by inaccurate matching (see Section 4.3). Given high quality data and assuming an experienced analyst with good visual stereo acuity, manual editing results in a matching accuracy of 0.2 pixels. That is, technicians train their stereo acuity until they are able to consistently place points on the surface to within the expected vertical precision of the DTM. However, Galileo images are challenging to work with, and in many cases post-placement is uncertain.

2.5. Producing DTMs Using the Ames Stereo Pipeline

The Ames Stereo Pipeline (ASP) is built upon the Vision Workbench software, which is a general purpose image processing and computer vision library that has been developed by the Intelligent Robotics group at the NASA Ames Research Center [37,46,47,48,49]. For many datasets, the ASP is capable of generating high quality DTMs with minimal human intervention, decreasing the cost and eliminating the need for highly specialized equipment and commercial software [37]. As with SOCET SET®, once the settings for a specific dataset are selected, these same settings can generally be used on the remaining images in that dataset, allowing for multiple images to be processed in a single pipeline, e.g., [50,51]. Alternatively, as in Section 3.4, one or more parameters can be varied in batch mode, allowing their effect on DTMs extracted from the same image pair to be assessed rapidly. The ASP supports the ISIS cube (.cub) file format and can make use of the ISIS camera models and ancillary information (i.e., SPICE kernels) for images. The software has been successfully used to generate DTMs of Europa and other satellites (e.g., Dione, Rhea, Tethys) [38,39,52,53].
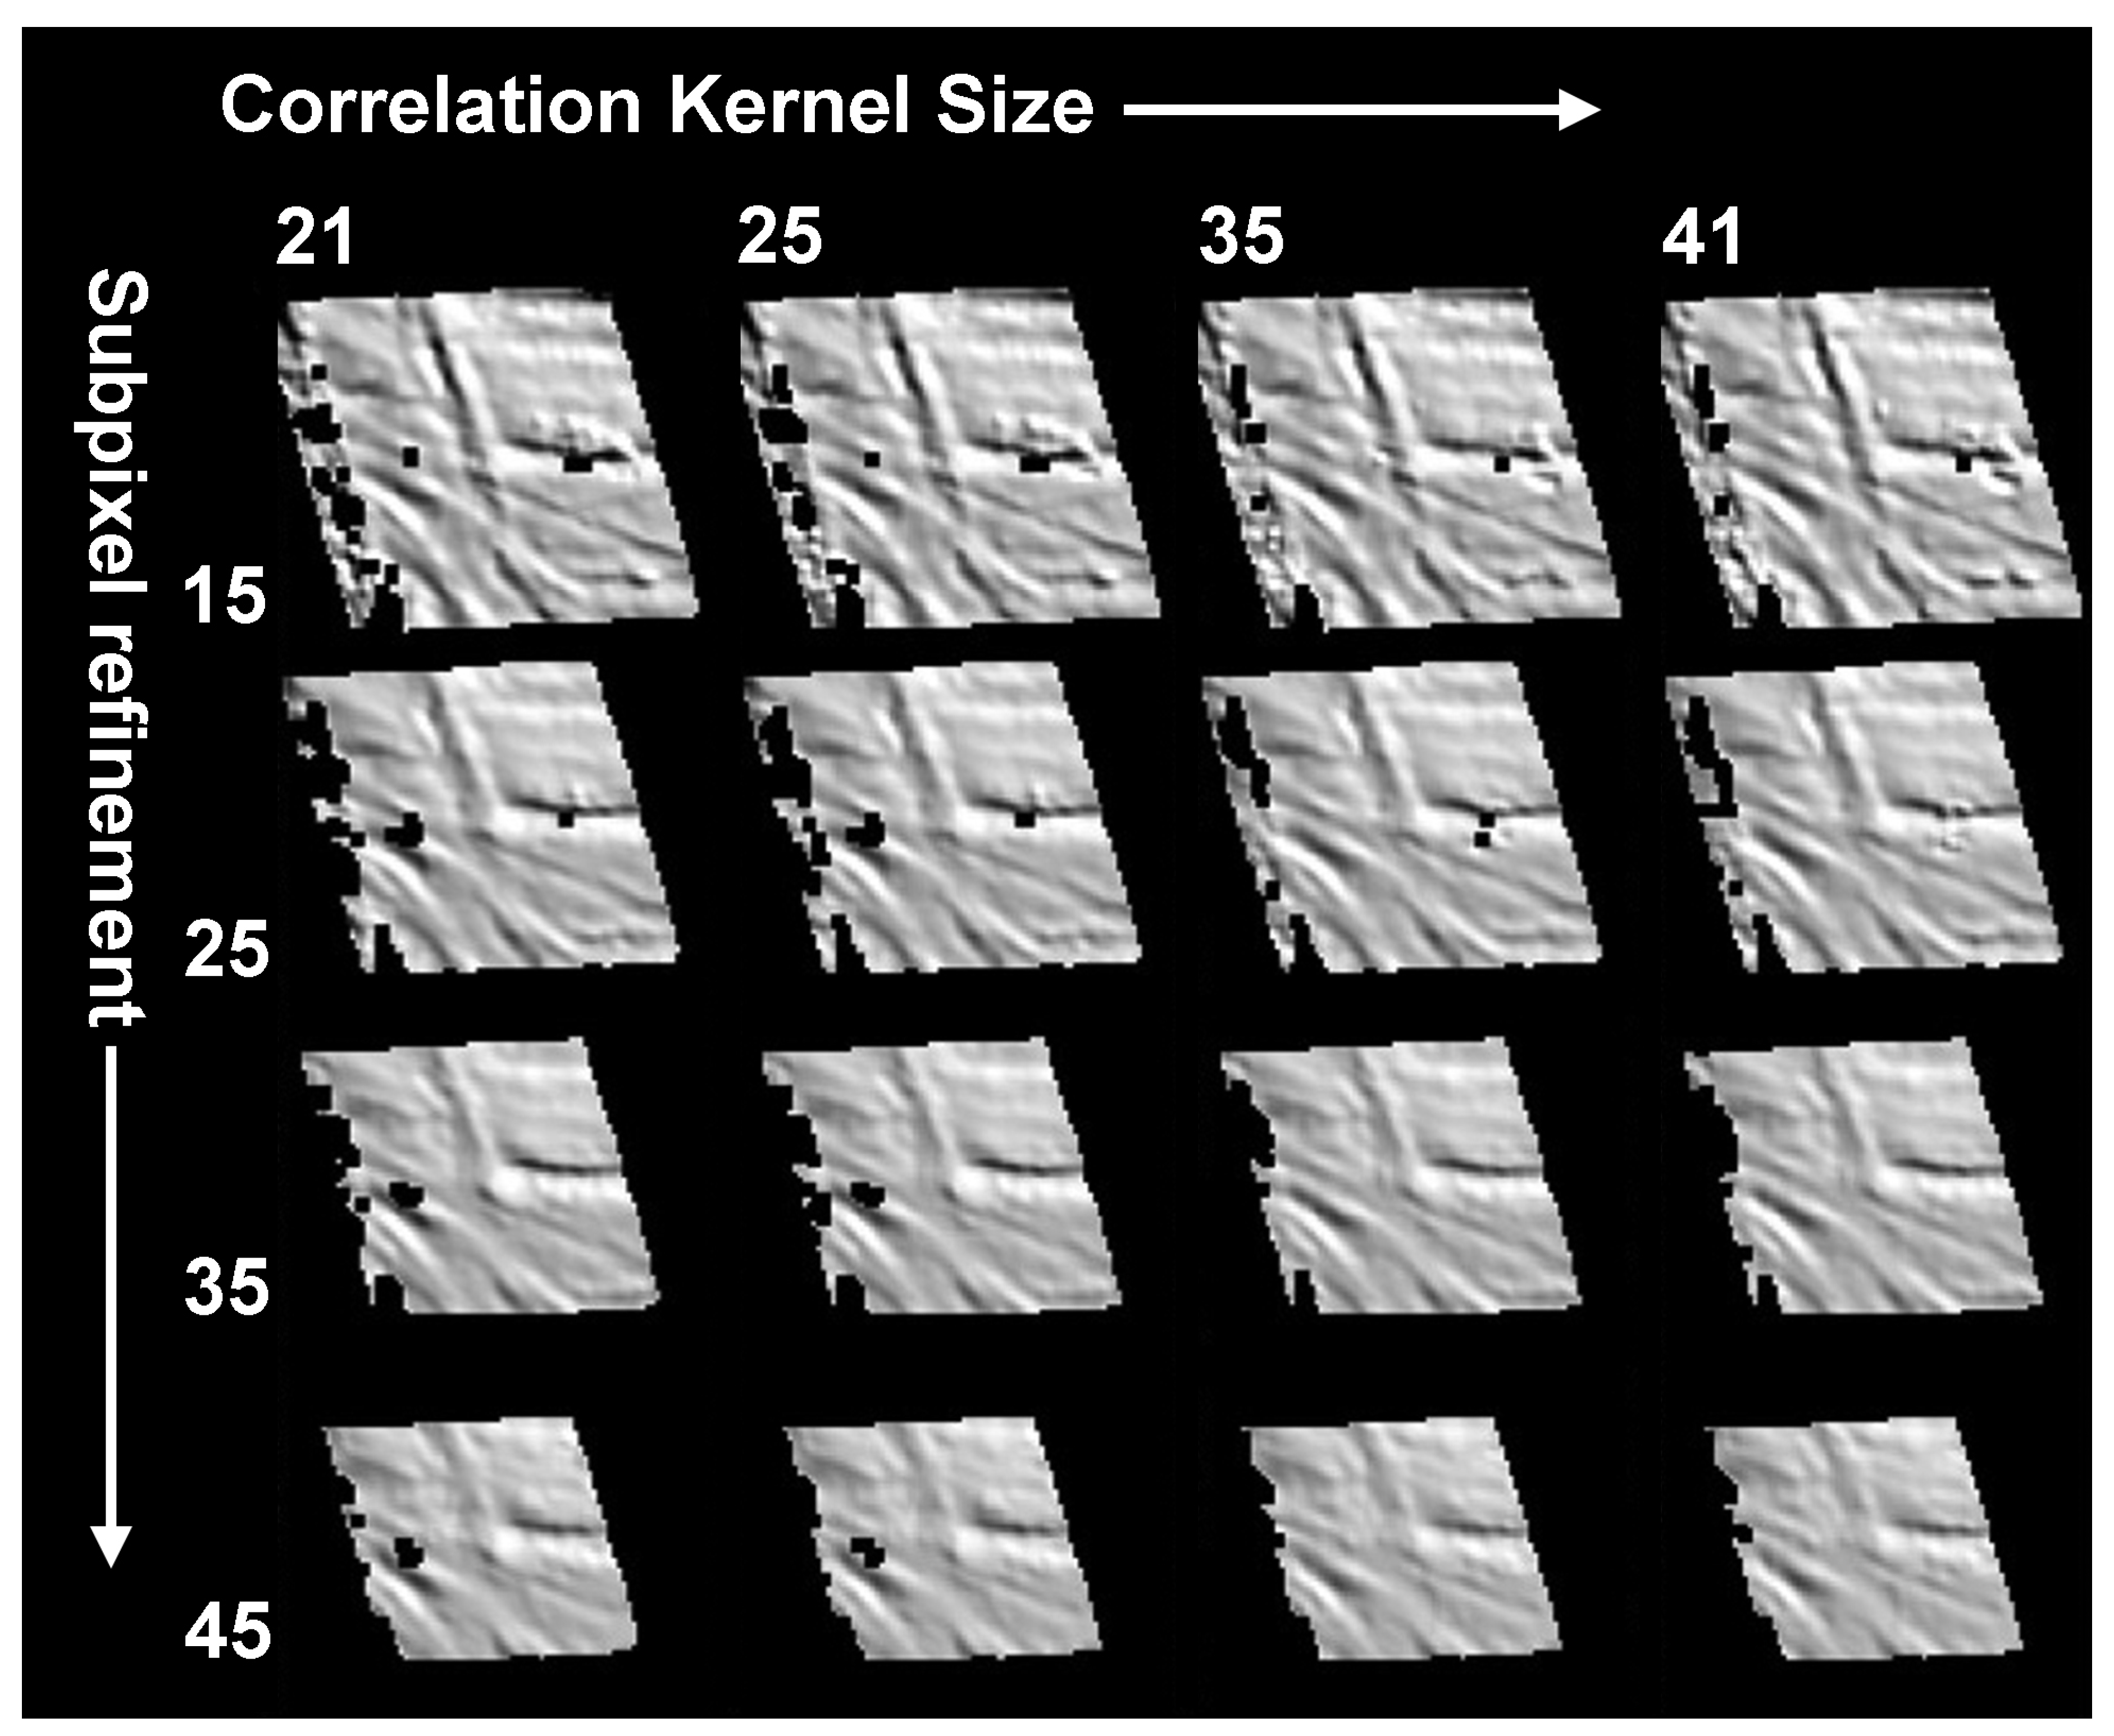
DTM production in ASP again begins with Galileo images in PDS (.img) format. We then use ISIS to generate radiometrically calibrated cubes with attached SPICE. We then photogrammetrically control the image pair in ISIS (using ISIS’s jigsaw application to perform the bundle adjustment) and project the data to a common map projection. This control step is necessary because, although ASP includes its own bundle adjustment application, the reconstructed SPICE information for Galileo images is often sufficiently inaccurate that the ASP bundle fails (the “smithed” SPICE kernels of Bland et al. [20] were unavailable at the time of this work). We do not perform a second bundle in ASP, as we found this does not improve the solutions. We also note that ASP can use either projected or unprojected images as input. We choose to use images projected onto a sphere with Europa’s mean radius, as they produced marginally better results for our image pairs. With these pre-ASP processing steps completed, the images are ready for DTM generation. The ASP implements a normalized cross-correlation algorithm that determines correspondences between pixels in two images and then uses an adaptive affine window tracking algorithm to refine the matches to sub-pixel precision [36]. Parallax between corresponding points is then used to determine 3D point locations. A surface generation step interpolates the calculated 3D points, and resamples the surface on a regular grid to produce the output DTM and corresponding orthoimages [46,47]. These steps are accomplished in ASP’s stereo and parallel_stereo tools. Additional details are provided in Section 3.4, and we point the reader to the high-quality ASP documentation (https://stereopipeline.readthedocs.io/en/latest/ accessed on 4 November 2021).

2.6. Methods of Comparing DTMs

Within the planetary remote sensing and mapping community, several investigations have compared DTMs to assess variability and quality due to differences in illumination, image pairs used, and even data type, e.g., [27,54,55] (we do not attempt to summarize similar investigations using Earth data, which generally involve reference data that are unavailable elsewhere). A more limited number of efforts have compared the absolute and relative quality of DTMs generated from different methodologies but the same starting data. Heipke et al. [21] describes one of the most extensive analyses of this type. Eight groups, some with multiple approaches, generated DTMs and hillshades from identical High Resolution Stereo Camera (HRSC) images to assess the variability between techniques. Each DTM was quantitatively compared to Mars Orbiter Laser Altimeter (MOLA) topography to evaluate absolute accuracy. Hillshades, contours, the ability to resolve small features (craters), individual profiles derived from each DTM, and bidirectional slopes were also compared. Similar but less well-documented comparisons have been performed for other data sets. Kirk et al. [24] briefly describe an evaluation of DTMs produced from the same Mars Orbiter Camera (MOC) images by different methods in order to assess subpixel matching accuracy. Beyer et al. [22] performed an assessment for DTMs generated from the LROC Narrow Angle Camera (NAC) images, but found direct comparison between the techniques challenging due to misalignment (an issue we address below). Della-Giustina et al. [56] compared DTMs of MESSENGER Mercury Dual Imaging System (MDIS) images of Mercury generated from SOCET SET® with those generated from the commercial software package Photoscan in preparation of the OSIRIS REx mission to asteroid Bennu (unfortunately the results of this analysis remain unpublished). Kirk et al. [30,31] compared DTMs produced from HRSC images of Mars by using SOCET SET® and the HRSC team pipeline, evaluating them against HiRISE DTMs with ~50× higher resolution. Kirk et al. [23] extended that analysis and added DTMs generated using the ASP.
Beddingfield et al. [52] explicitly compared the DTMs generated for SOCET SET® and ASP using Cassini Imaging Science Subsystem (ISS) images of several Saturnian Satellites (see their appendix). Their work is thus perhaps the closest analog to our own: like Europa, the Saturnian satellites also do not have ground control and the data was acquired during different flybys and is thus highly variable in terms of image geometry and pixel scale. Their assessment focused on the variability of measured fault slopes, which were central to their geologic interpretation of tectonic activity. They found that, at least in some cases, the differences between the DTMs was statistically significant.
For our analysis we follow many of the methodologies used by Heipke et al. [21]. Unfortunately, as described above, we have no ground control (as provided by, e.g., MOLA or the Mercury Laser Altimeter) to assess absolute accuracy. Instead, we make qualitative assessments of the DTMs and derived hillshades, including an evaluation of the scale at which topographic features can be identified (the horizontal resolution). We then align the DTMs using ASP’s pc_align application and create and evaluate elevation difference maps for each DTM pair. These difference maps are qualitatively assessed, difference histograms are computed and compared to normal distributions, and the RMS absolute difference is compared to the nominal expected vertical precision of each DTM. We also quantitatively compare individual topographic profiles extracted from the aligned DTMs. Slope statistics are also derived and compared. Below we briefly describe each of our approaches to DTM assessment. Figure 1 provides a flowchart synthesizing our approach.

2.6.1. Visual Inspection of the DTMs and Identification of Small-Scale Topography

We begin our assessment of DTM variability by qualitatively examining, describing, and comparing the individual DTMs themselves. We qualitatively assess the morphological forms apparent in the DTMs and quantitatively identify small-scale topography that corresponds to real features (often ridges) in the orthoimages. We also identify gaps, blunders and artifacts, as well as problems directly attributable to the input data (e.g., Galileo images often contain sections of missing data, see Section 2.7). The horizontal resolution in DTM posts is determined from this assessment, and converted to a resolution in both physical units (using the DTM post-spacing) and image pixels relative to GSDRMS and GSDmax.

2.6.2. Generation and Evaluation of Hillshades

A hillshade provides a hypothetical illumination of a surface (i.e., the DTM) for a given solar azimuth and zenith. At each post, the hillshade is calculated from the slope and slope aspect (the direction of steepest slope) of the DTM. Thus, the hillshade is a function of the first derivative of the DTM and emphasizes higher spatial frequencies than the DTM itself. They are therefore useful in comparing to orthoimages to determine the scale of smallest identifiable features, and which small-scale features are “real.” The ability to discriminate small-scale features in the hillshade and/or DTM (Section 2.6.1) provides one measure of the horizontal resolution.
We generate hillshades in ArcGIS using a solar incidence angle (zenith) of 30° to accentuate topography. Solar azimuth was chosen for each study area to match that of the orthoimages as closely as possible. This facilitates direct comparison between the hillshade and orthoimages. We have not performed a photometric correction of the images; however, we ensure that the hillshades for SOCET SET® and ASP are stretched the same to enable direct comparison.

2.6.3. Differencing DTMs

Another effective way to evaluate the differences between two DTMs is to literally difference them: subtracting one DTM from the other. Before the DTMs are differenced, they must be rigidly aligned to each other. We use the pc_align function in ASP [57] to perform such alignment. The pc_align program uses an interactive closest points algorithm to estimate a rigid 3D transformation that includes both translation and rotation. It therefore minimizes long-wavelength differences between the DTMs. For example, pc_align may remove (or minimize) a DTM-wide regional tilt present in one DTM and not the other. We emphasize that our evaluation is therefore limited to relatively short-wavelength differences. After alignment of DTMs generated in SOCET SET® and ASP at identical post spacing, difference maps were created using standard ArcGIS functionality. We evaluate difference maps both qualitatively and statistically to determine both where the two DTMs differ from each other and the magnitude and distribution of those differences. As discussed in Section 2.2, The EP of a DTM is a measure of the RMS uncertainty in the elevation of a point sampled from the DTM. The RMS difference between the two DTMs is a proxy for that uncertainty. Comparison of the RMS difference and the EP therefore provides a way to estimate the matching accuracy, ρ. How reliable such an estimate will be depends on the extent to which errors in the two DTMs are correlated. If the errors were perfectly correlated, as might happen if two software packages utilized an identical matching algorithm, the DTMs would be identical but could both be in error by an arbitrary amount. Conversely, if errors in two DTMs were completely independent, the RMS difference would equal the root summed square of the individual precisions, or √2 EP if these are equal. The real situation is likely to fall between these extremes. Kirk et al. [23] show that when DTMs produced with SOCET SET® and ASP from the same HRSC images are smoothed to comparable horizontal resolution, their EPs (measured against a high precision reference DTM) are similar and about 1.1 times the RMS difference. Although this result was derived for unedited DTMs of Mars, it lends confidence that the differences between our Europa DTMs will provide a rough approximation of EP.

2.6.4. Topographic Profile Comparison

Difference maps provide an indication of where two DTMs deviate from each other as well as a statistical indication of the distribution of those differences. However, to better understand how differences could affect typical measurements made from DTMs (e.g., topographic relief such as crater depths and ridge heights), we also extracted topographic profiles across characteristic topography to quantitatively evaluate the differences in relief measured between DTMs, cf. [54,55]. For each pair of DTMs described below, we measure the relief of distinctive features (e.g., crater walls, crater central peaks, ridge structures, pits, etc.). Differences in relief are compared to the EP for each DTM to provide a secondary constraint on ρ. Profiles were extracted from the aligned DTMs with identical post spacing using standard methods in ArcGIS.

2.6.5. Slopes and Slope Statistics

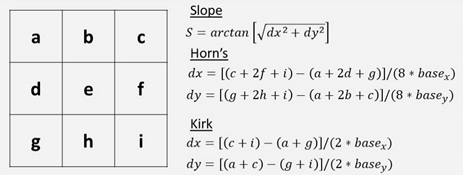
Finally, we also calculate and compare adirectional slopes for each DTM. We use two independent methods for our slope calculation. One-pixel adirectional slope maps were calculated using ArcGIS, which implements a standard Horn’s method [58], which weights the near-pixels more heavily than the diagonals (Box 1). These maps, and the statistics derived from them (e.g., RMS slopes and slope distributions) were compared for each pair of DTMs.
We also calculate the slope for each DTM at a series of longer baselines. Our Python implementation calculates slopes over a given baseline using a method that only uses the pixel diagonals (Box 1). Characterization of the slope of a natural surface (often quantified as the RMS slope or RMS slope deviation) at a variety of scales provides direct insight into the roughness of a surface, e.g., [24,32,59,60], and such analyses have previously been applied to Europa [26,61]. Here our emphasis is on how the slope characteristics differ between the DTMs generated from different methods, rather than the topography itself (cf. Kirk et al. [23,31]). This analysis provides greater insight into the uncertainty (or lack thereof) of such approaches and illuminates the tradeoff between noise and smoothing for each method.
Box 1. Summary of slope calculations.
Remotesensing 13 05097 i001

2.7. Overview of Galileo Data for Europa

In the Jupiter system, the highest resolution dataset available is from the Galileo Solid State Imager (SSI), an 800 × 800 pixel framing camera, equipped with an eight-position filter wheel. Due to the failure of Galileo’s high-gain antennae deployment, the quantity of imaging data returned by the mission was limited. The GSD of Galileo images of Europa varies from a minimum of ~6–9 m/pixel (for a very limited number of oblique images) to full disk images at >10 km/pixel. Two nearly pole-to-pole swaths of images were acquired at GSD of ~200 m/pixel for regional mapping, and these constitute much of the regional coverage (i.e., most of the surface was imaged at larger pixel scales). Because Galileo was in Jupiter’s orbit, images were acquired with widely varying illumination conditions, both within a given flyby sequence, and from one flyby to the next. The limited data return and highly variable resolution and illumination of the images severely restricts the regions of Europa for which useful stereo-pairs exist.
Unfortunately, Galileo images also pose a number of additional challenges. The reconstructed SPICE data is often inaccurate due to uncertainty in the spacecraft position and pointing when images were acquired. In some cases, this results in image locations that are inaccurate by 10s to 100s of kilometers [see Bland et al. [20] for examples]. These inaccuracies must be corrected either before or during DTM extraction. Updated SPICE kernels for nearly the entire Europa imaging data set were generated by Bland et al. [20], but these were not available when the work described here was completed. Additionally, in many instances, data downlink interruptions resulted in data for a single image being transmitted as two or more separate files that must be reconstructed into a single image before use. We used the ISIS application handmos to perform this reconstruction. In some cases, the missing data was never re-transmitted, and images are simply missing lines. These no-data regions can result in DTM blunders at their margins due to poor or inadequate matching. We note that the images from Galileo were returned at relatively high-compression ratio, which Kirk et al. [29] have noted can result in poor subpixel registration and hence lower DTM quality. We do not photometrically correct the images (although ASP uses prefiltering—see Section 3.4), and this remains an avenue for future exploration.
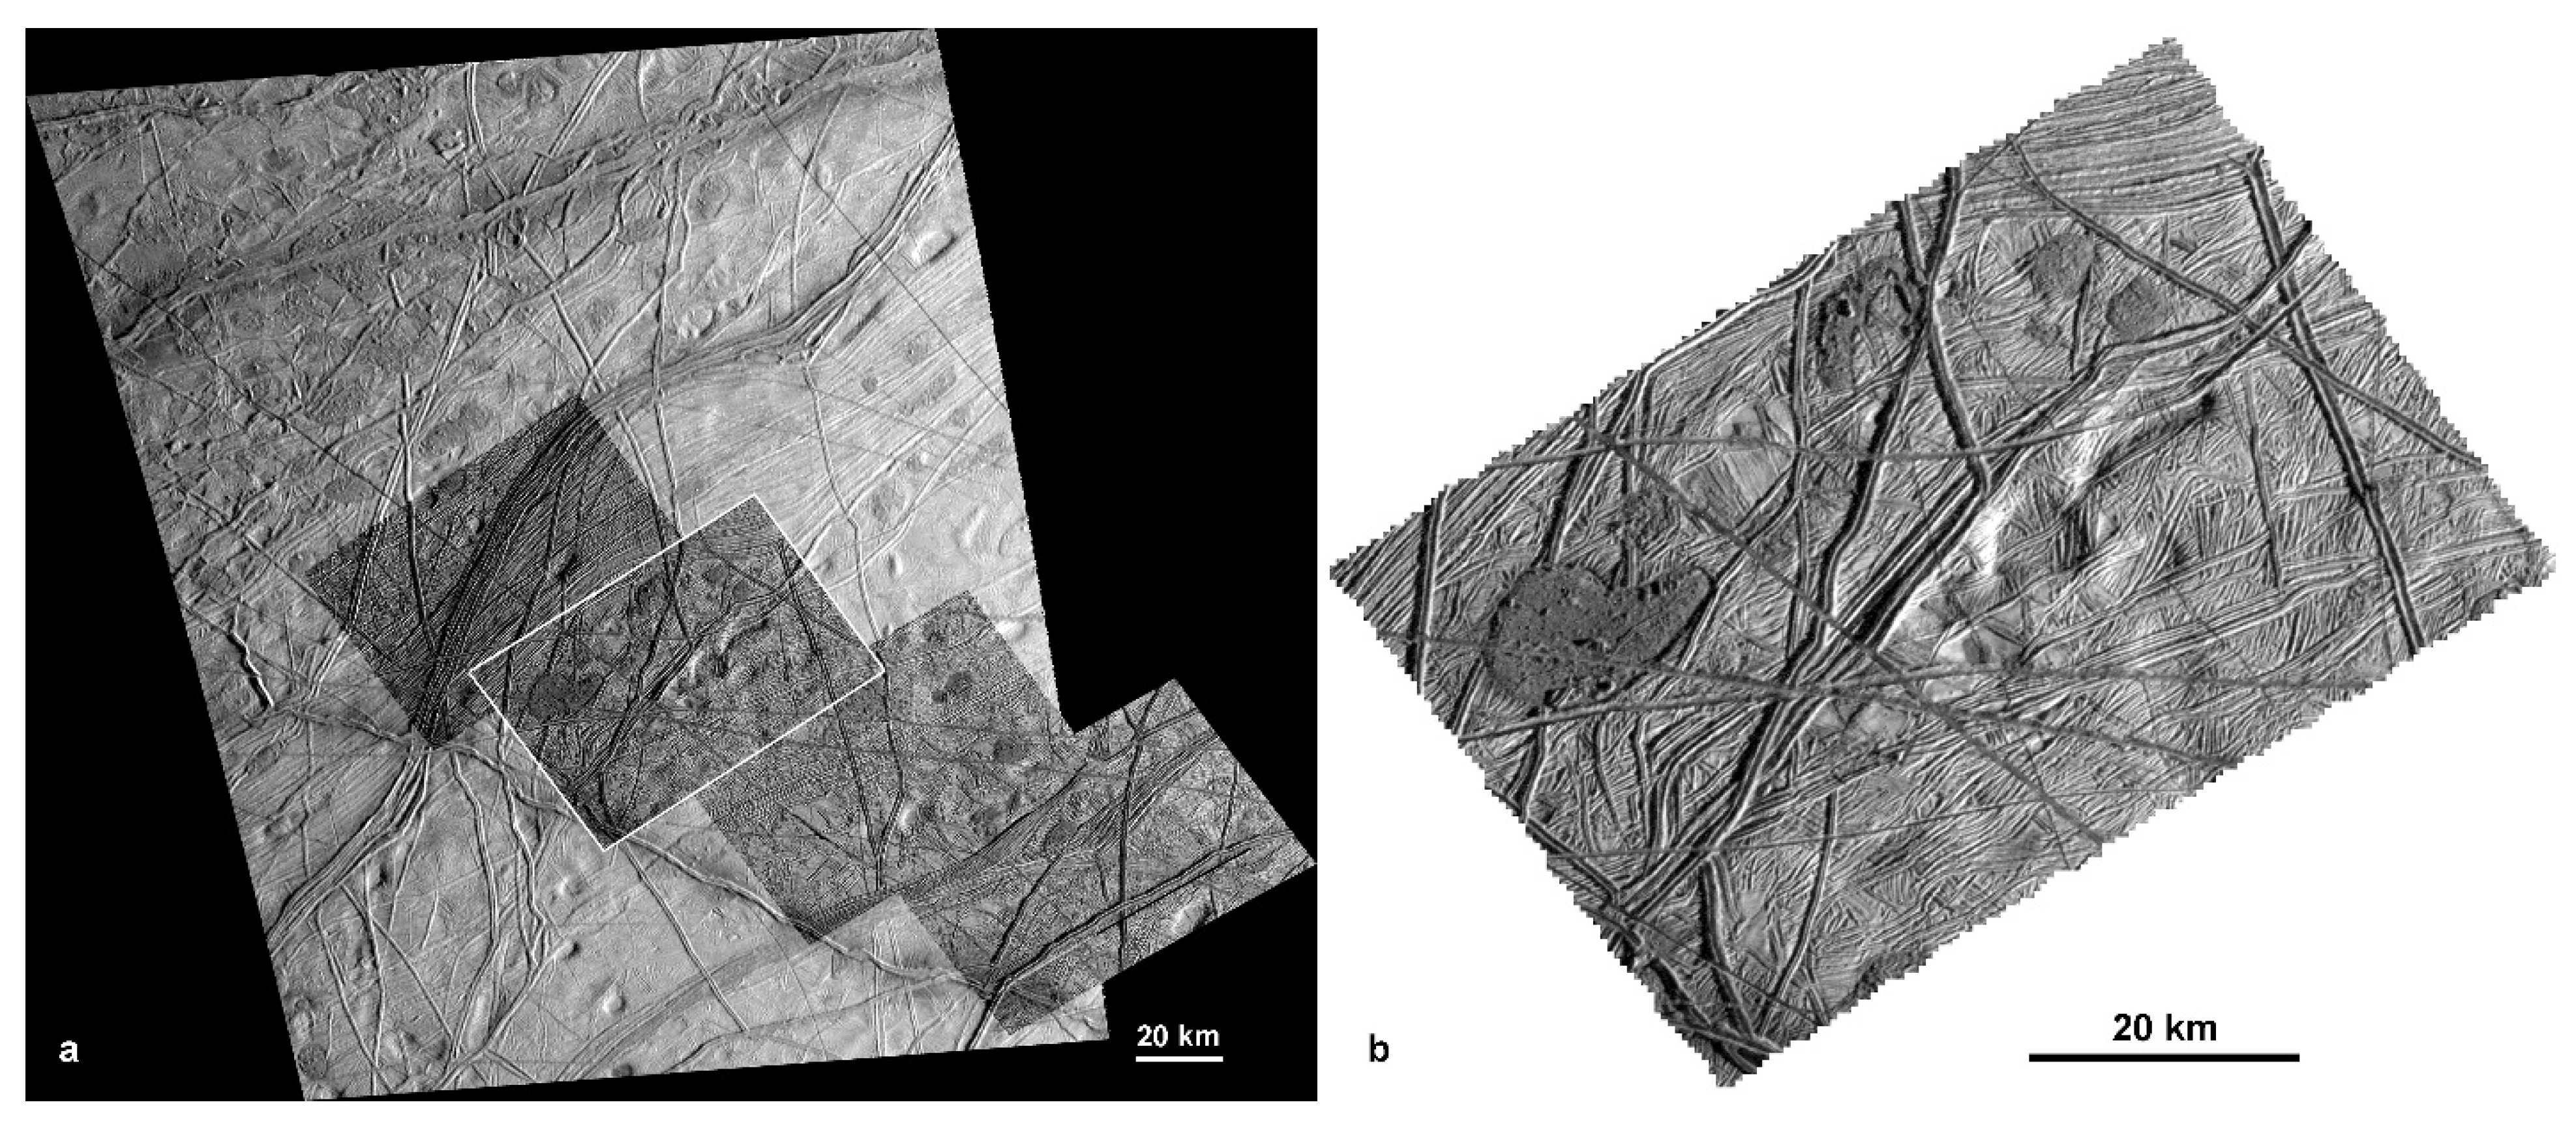
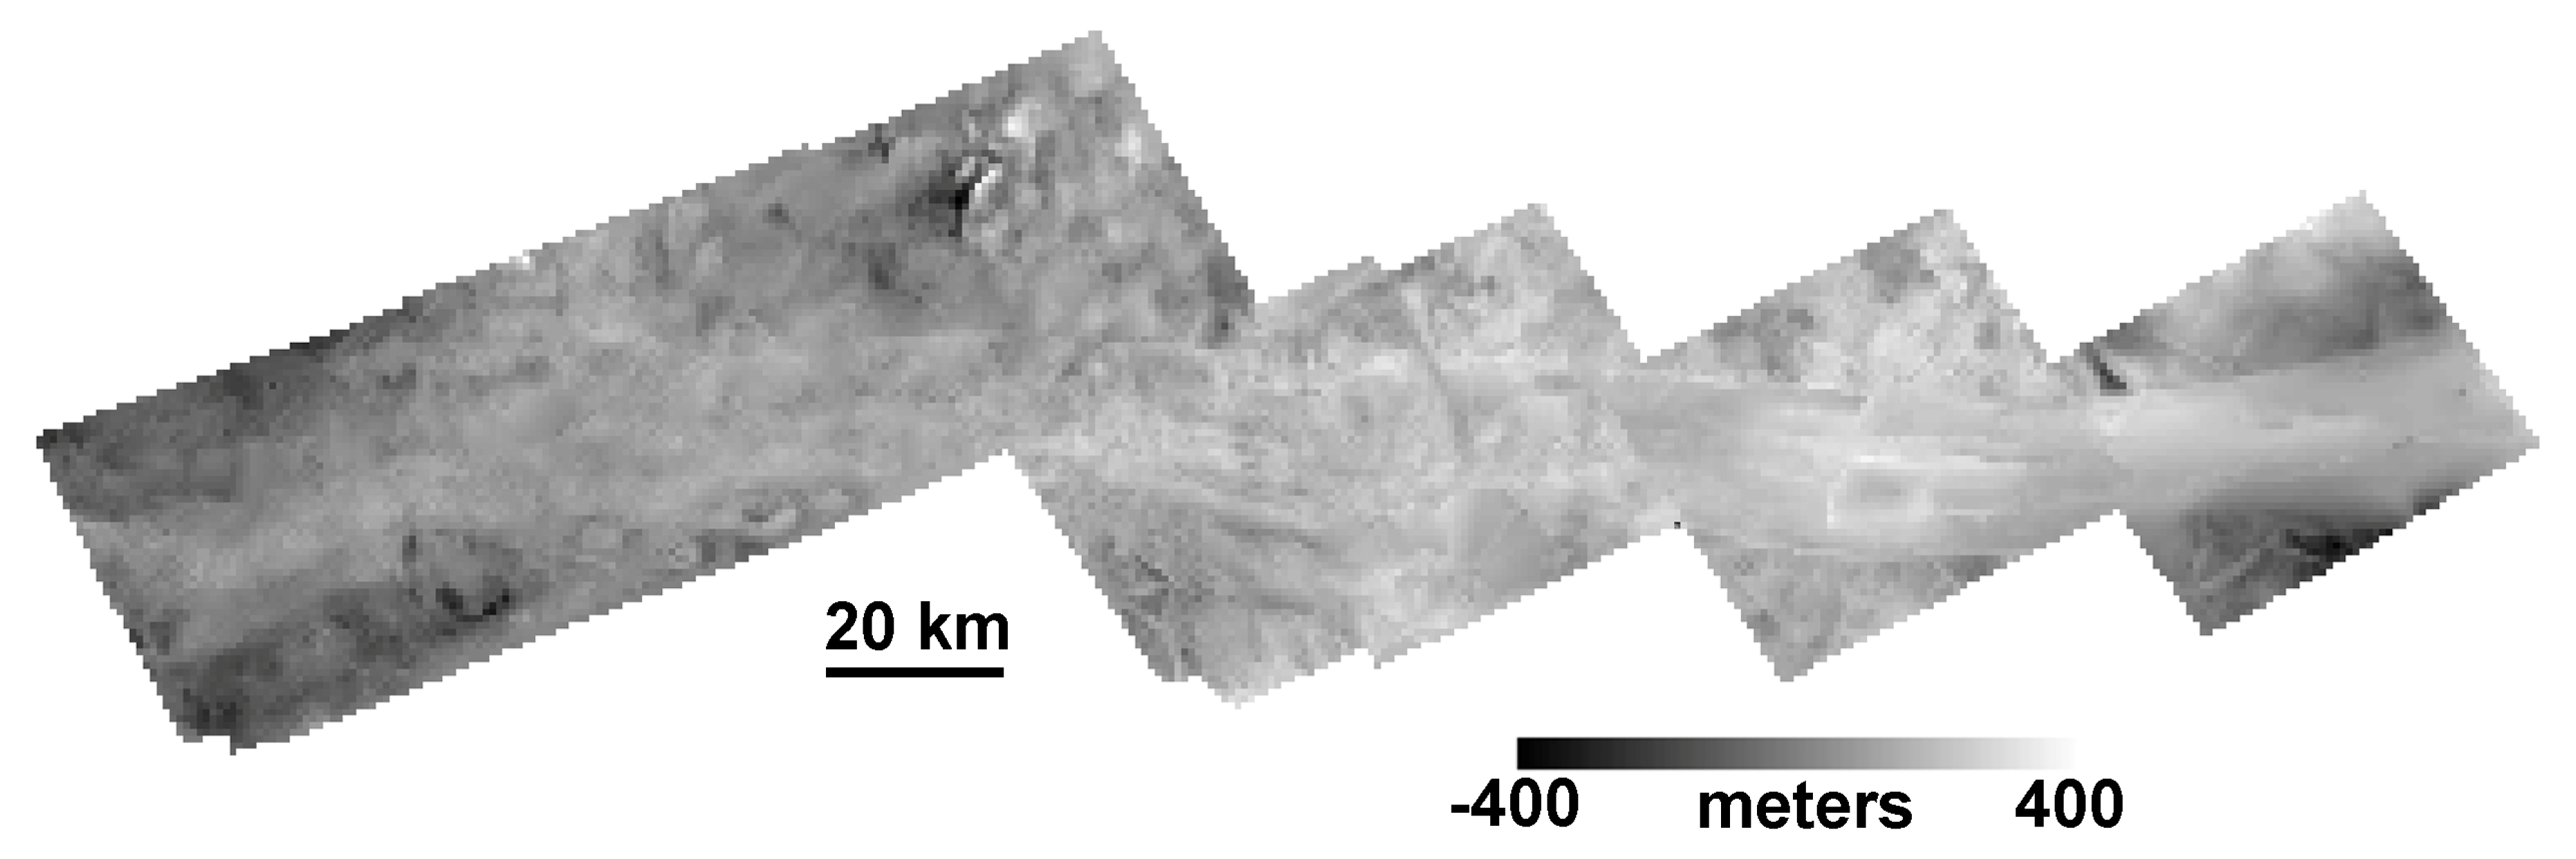
We selected five case studies on Europa for which SSI stereo-pairs are available (Figure 2). These regions include two impact craters (Cilix and Pwyll), a relatively high-resolution (compared to typical Europa ISS data) section of ridged plains, a prominent band (Agenor Linea), and a section of ridged plains containing moderate- and small-scale pits and chaos (near Rhadamanthys Linea). In the following sections we describe two of these case studies in detail: Cilix crater (Section 3.1), and the chaos and Pits near Rhadamanthys Linea (Section 3.2). The other three case studies are described in less detail (Section 3.3), but a description of the salient characteristics is provided to better support our conclusions.

3. Results

3.1. Detailed Case Study 1: Cilix Crater

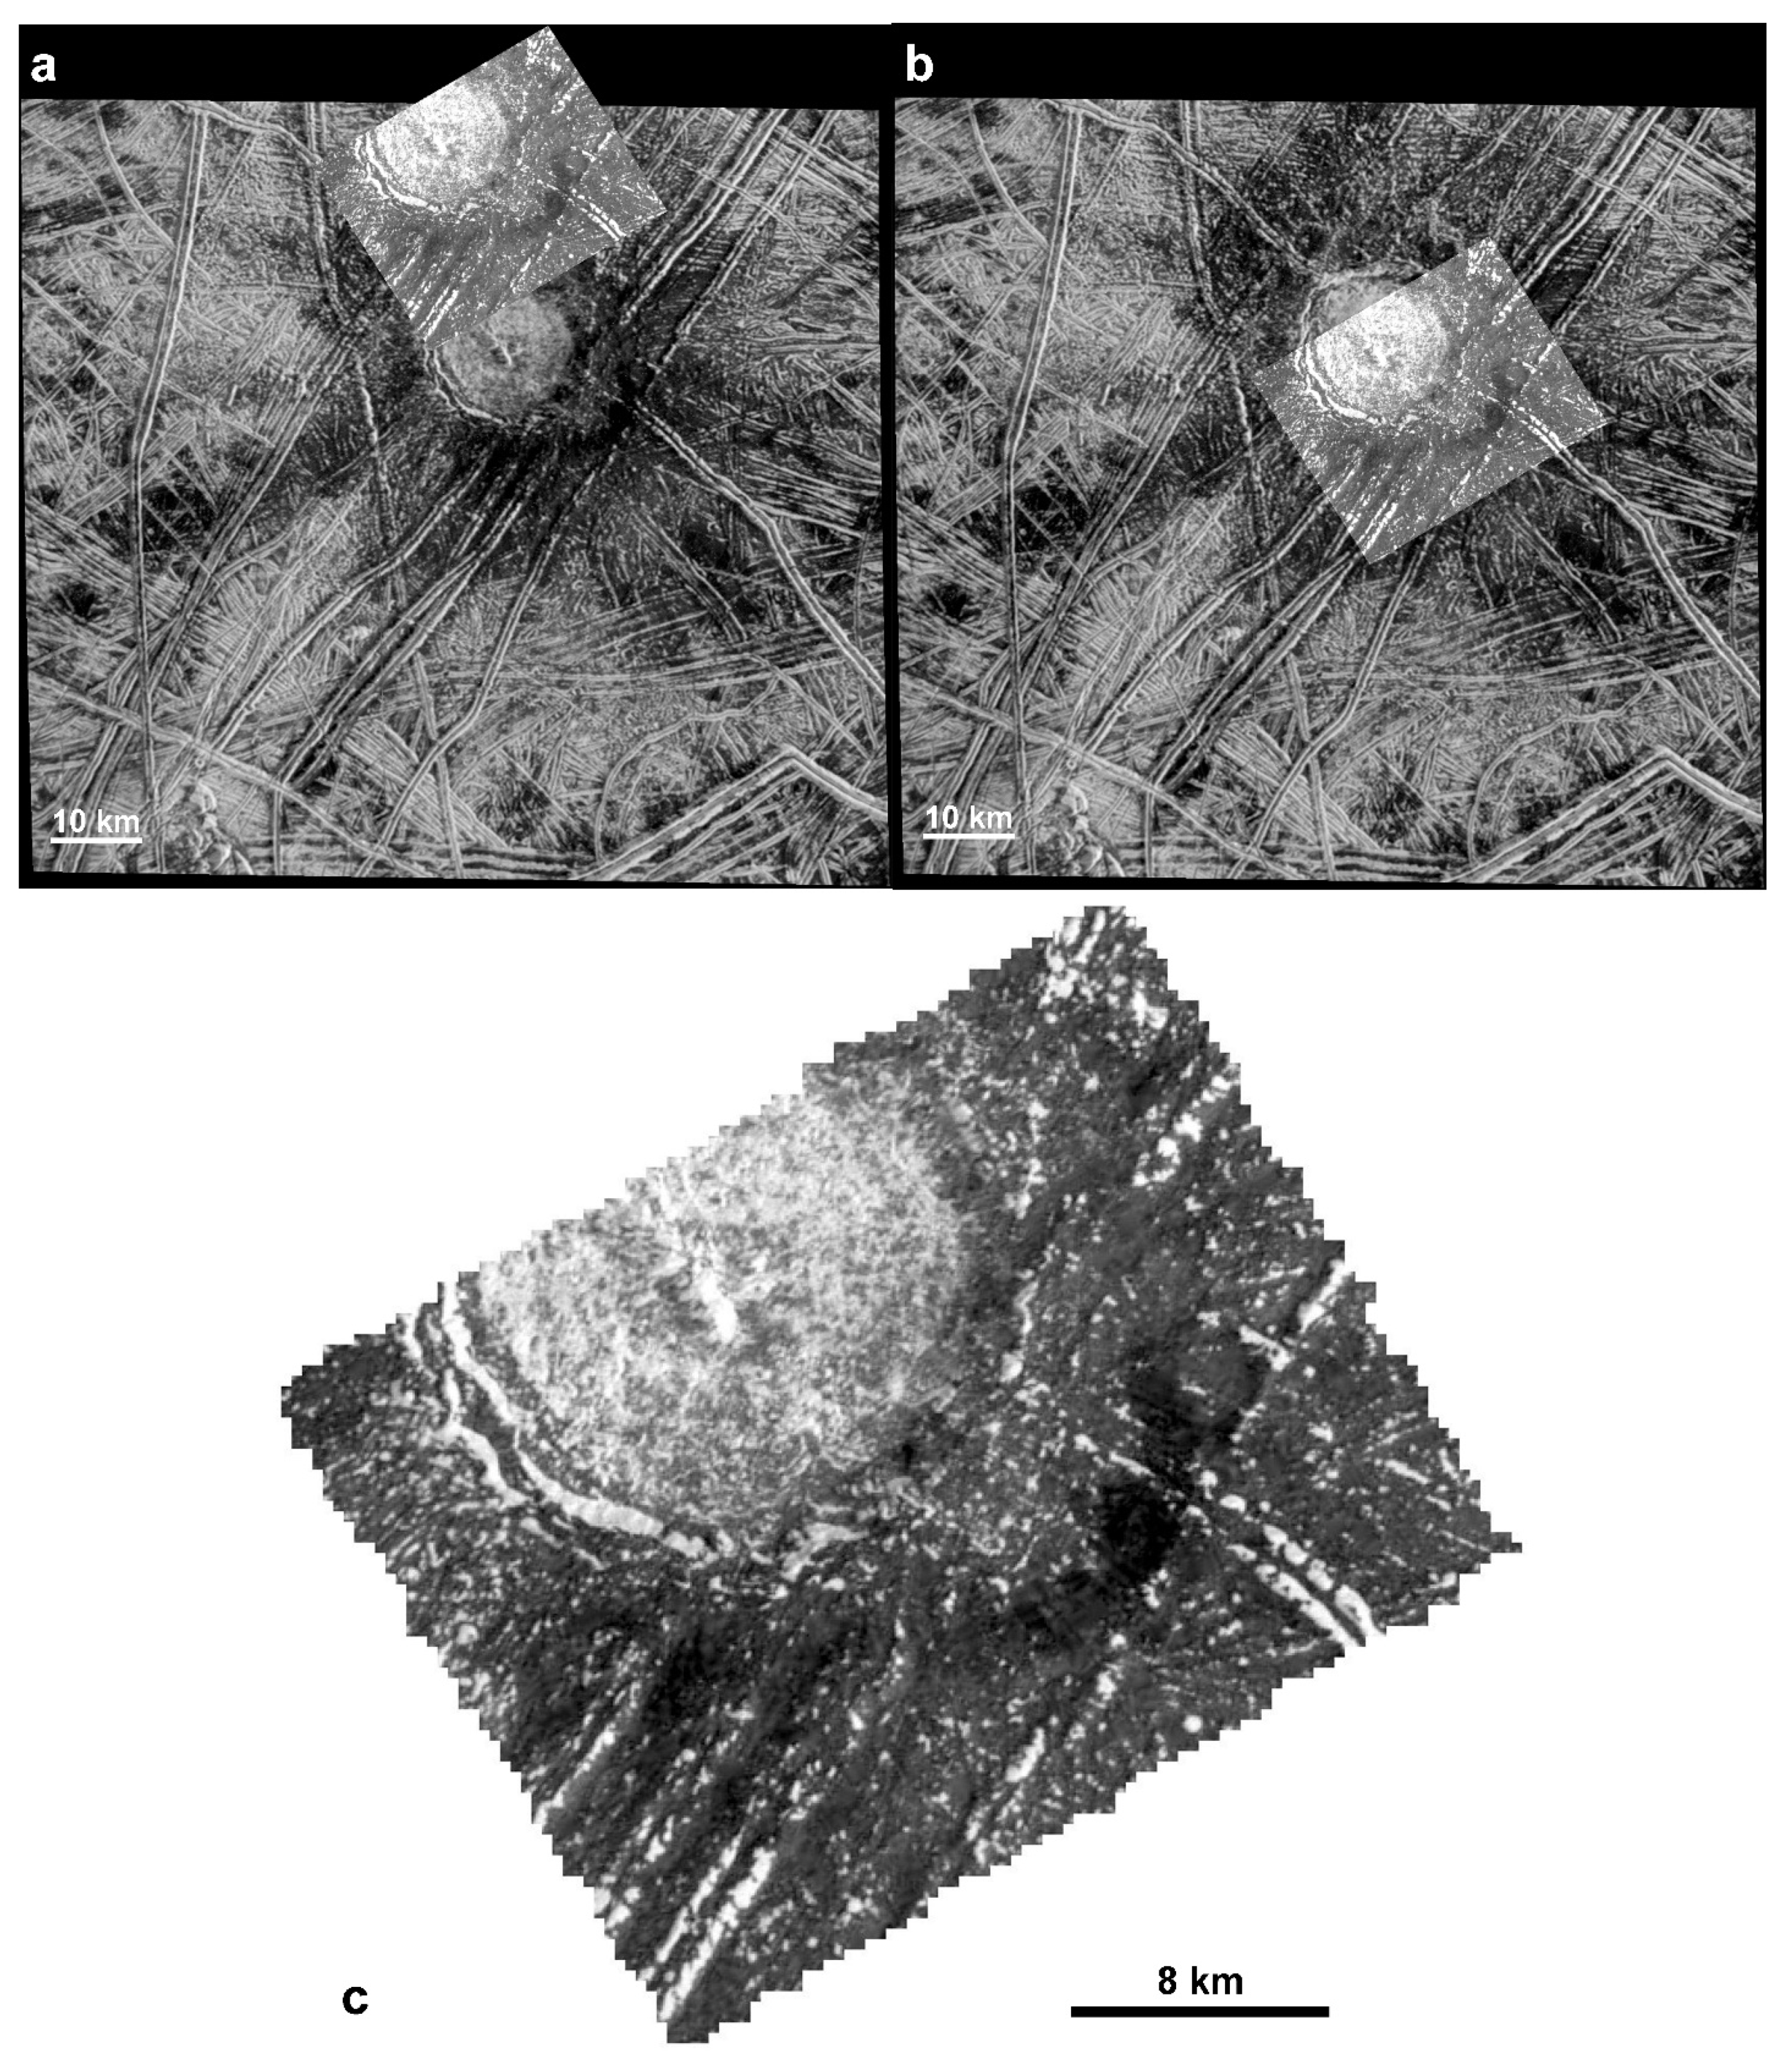
Cilix is a 19-km diameter complex crater located in Europa’s anti-Jovian hemisphere (Figure 3). The relatively deep crater has a narrow, well-defined rim, flat floor, small and slightly offset central peak, and minor rim terracing. Cilix is similar in appearance to complex craters on Ganymede, and therefore contrasts many other large impact structures on Europa, such as the slightly larger Pwyll (26-km diameter), and Manannán (22-km diameter) craters [62]. The crater is located within a section of ridged plains (discussed in Section 3.3.2) with substantial pre-existing topography, and is surrounded by a dark halo of material that is either ejecta or disrupted frost deposits [62], which suggests that the crater may be relatively young.
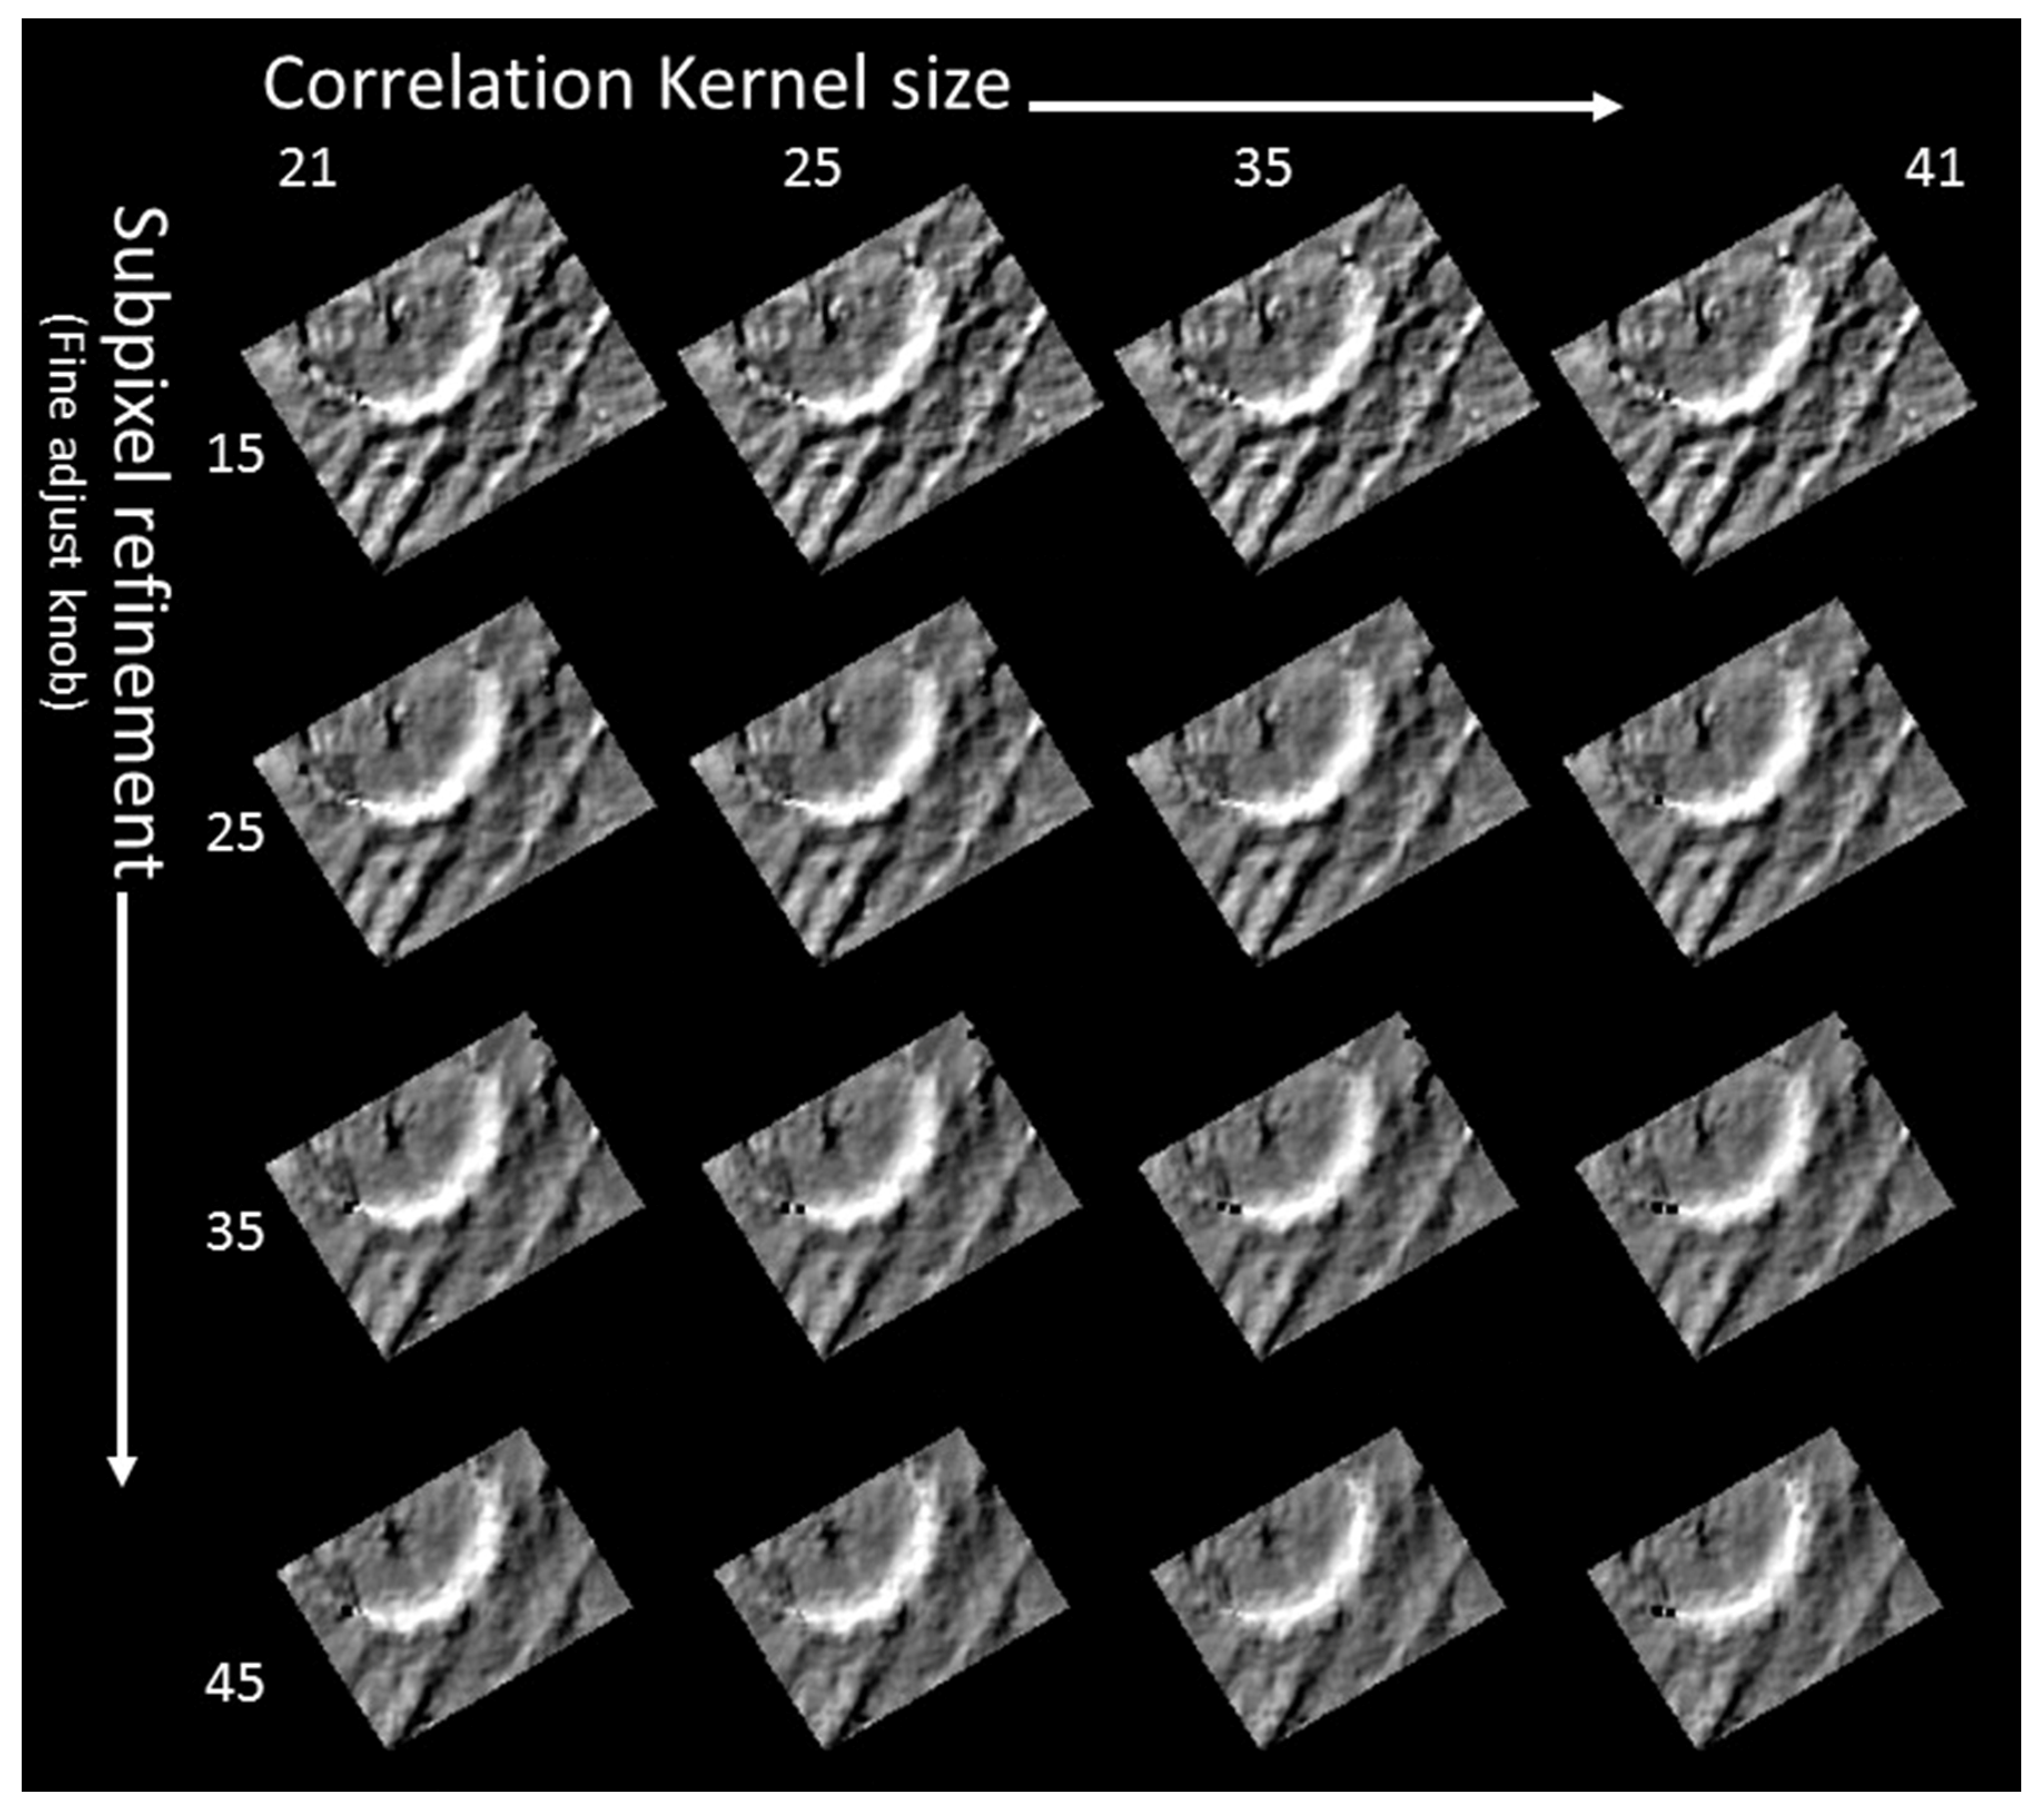
Galileo acquired two images of Cilix at moderate resolution (110.1 m/pixel and 63.2 m/pixel; Figure 3). Lower resolution images were also acquired but are less suitable for DTM generation. A complete list of stereo parameters for the two images can be found in Table 1. Unfortunately, using reconstructed SPICE kernels results in a misalignment of the image pair by 25 km, as shown in Figure 3a, which was corrected via two methods: within SOCET SET® for the SOCET SET® DTM, and within ISIS (control network and bundle adjustment) for the ASP DTM, as described above. This correction is no longer necessary following work by Bland et al. [20] to update the image locations of the entire Galileo SSI data set. Although far from “ideal” stereo, the pair provides one of the better stereo pairs for Europa. If we assume a priori that the pixel matching accuracy ρ is 0.3 pixels, EPRMS = 23 m and EPmax = 28 m. We generated DTMs for Cilix gridded at 350 m/post, equivalent to roughly three times GSDmax, using both SOCET SET® and the ASP. In the subsections below we describe a qualitative and quantitative evaluation of the horizontal resolution and vertical precision of these DTMs, following the approaches described in Section 2.6.
Table 1. Image and Stereo Criteria for DTMs generated in this work.
Image aGSD (m/pixel)ΔGSD bieGSDRMS
(m/pixel)
DSTc(p/h)dEPRMSeEPmaxf
Cilix craters0449965000
s0449967535
110.1
63.2
1.731.8°
36.8°
25.9°
29.9°
900.0441.1823 m28 m
Chaos and pitss0449961826
s0484888726
232.1
63.3
3.779.8°
79.9°
38.8°
47.6°
1700.141.3239 m53 m
Pwyll craters0383715500
s0383715504
s0426268700
243.8
244.7
125.8
1.976.2°
80.0°
57.9°
40.3°
43.9°
48.3°
1944.11.832 m41 m
Ridged Plainss0426272642
s0426272646
s0426272821
14.0
14.0
25.6
1.829.8°
29.8°
29.9°
37.8°
37.8°
47.7°
210.0040.5511 m14 m
Agenor Lineas0466669500 s046666957850.0
210–223
4.375–80°
71–80°
37–39°
31–40°
1562.20.8852 m74 m
s0466664665 s0466664326
a Image number based on the spacecraft clock start count (keyword SpacecraftClockStartCount). Horizontal dashed line separates images that formed each pair when more than two images were used. Agenor Linea included all images between s0466669500 and s0466669578 (seven in total). b ΔGSD is the ratio of the image GSDs. c DST is shadow tip difference. Low values are preferable and indicate similar illumination. d p/h is the base-height ratio. Ideal values are 0.4 to 0.6, which correspond to convergence angles of 20–30°. e EP calculated assuming ρ = 0.3 and GSDRMS. f EP calculate assuming ρ = 0.3 and GSDmax.

3.1.1. Visual Inspection of DTMs and Hillshades: Smallest Observable Features, Blunders and Artifacts

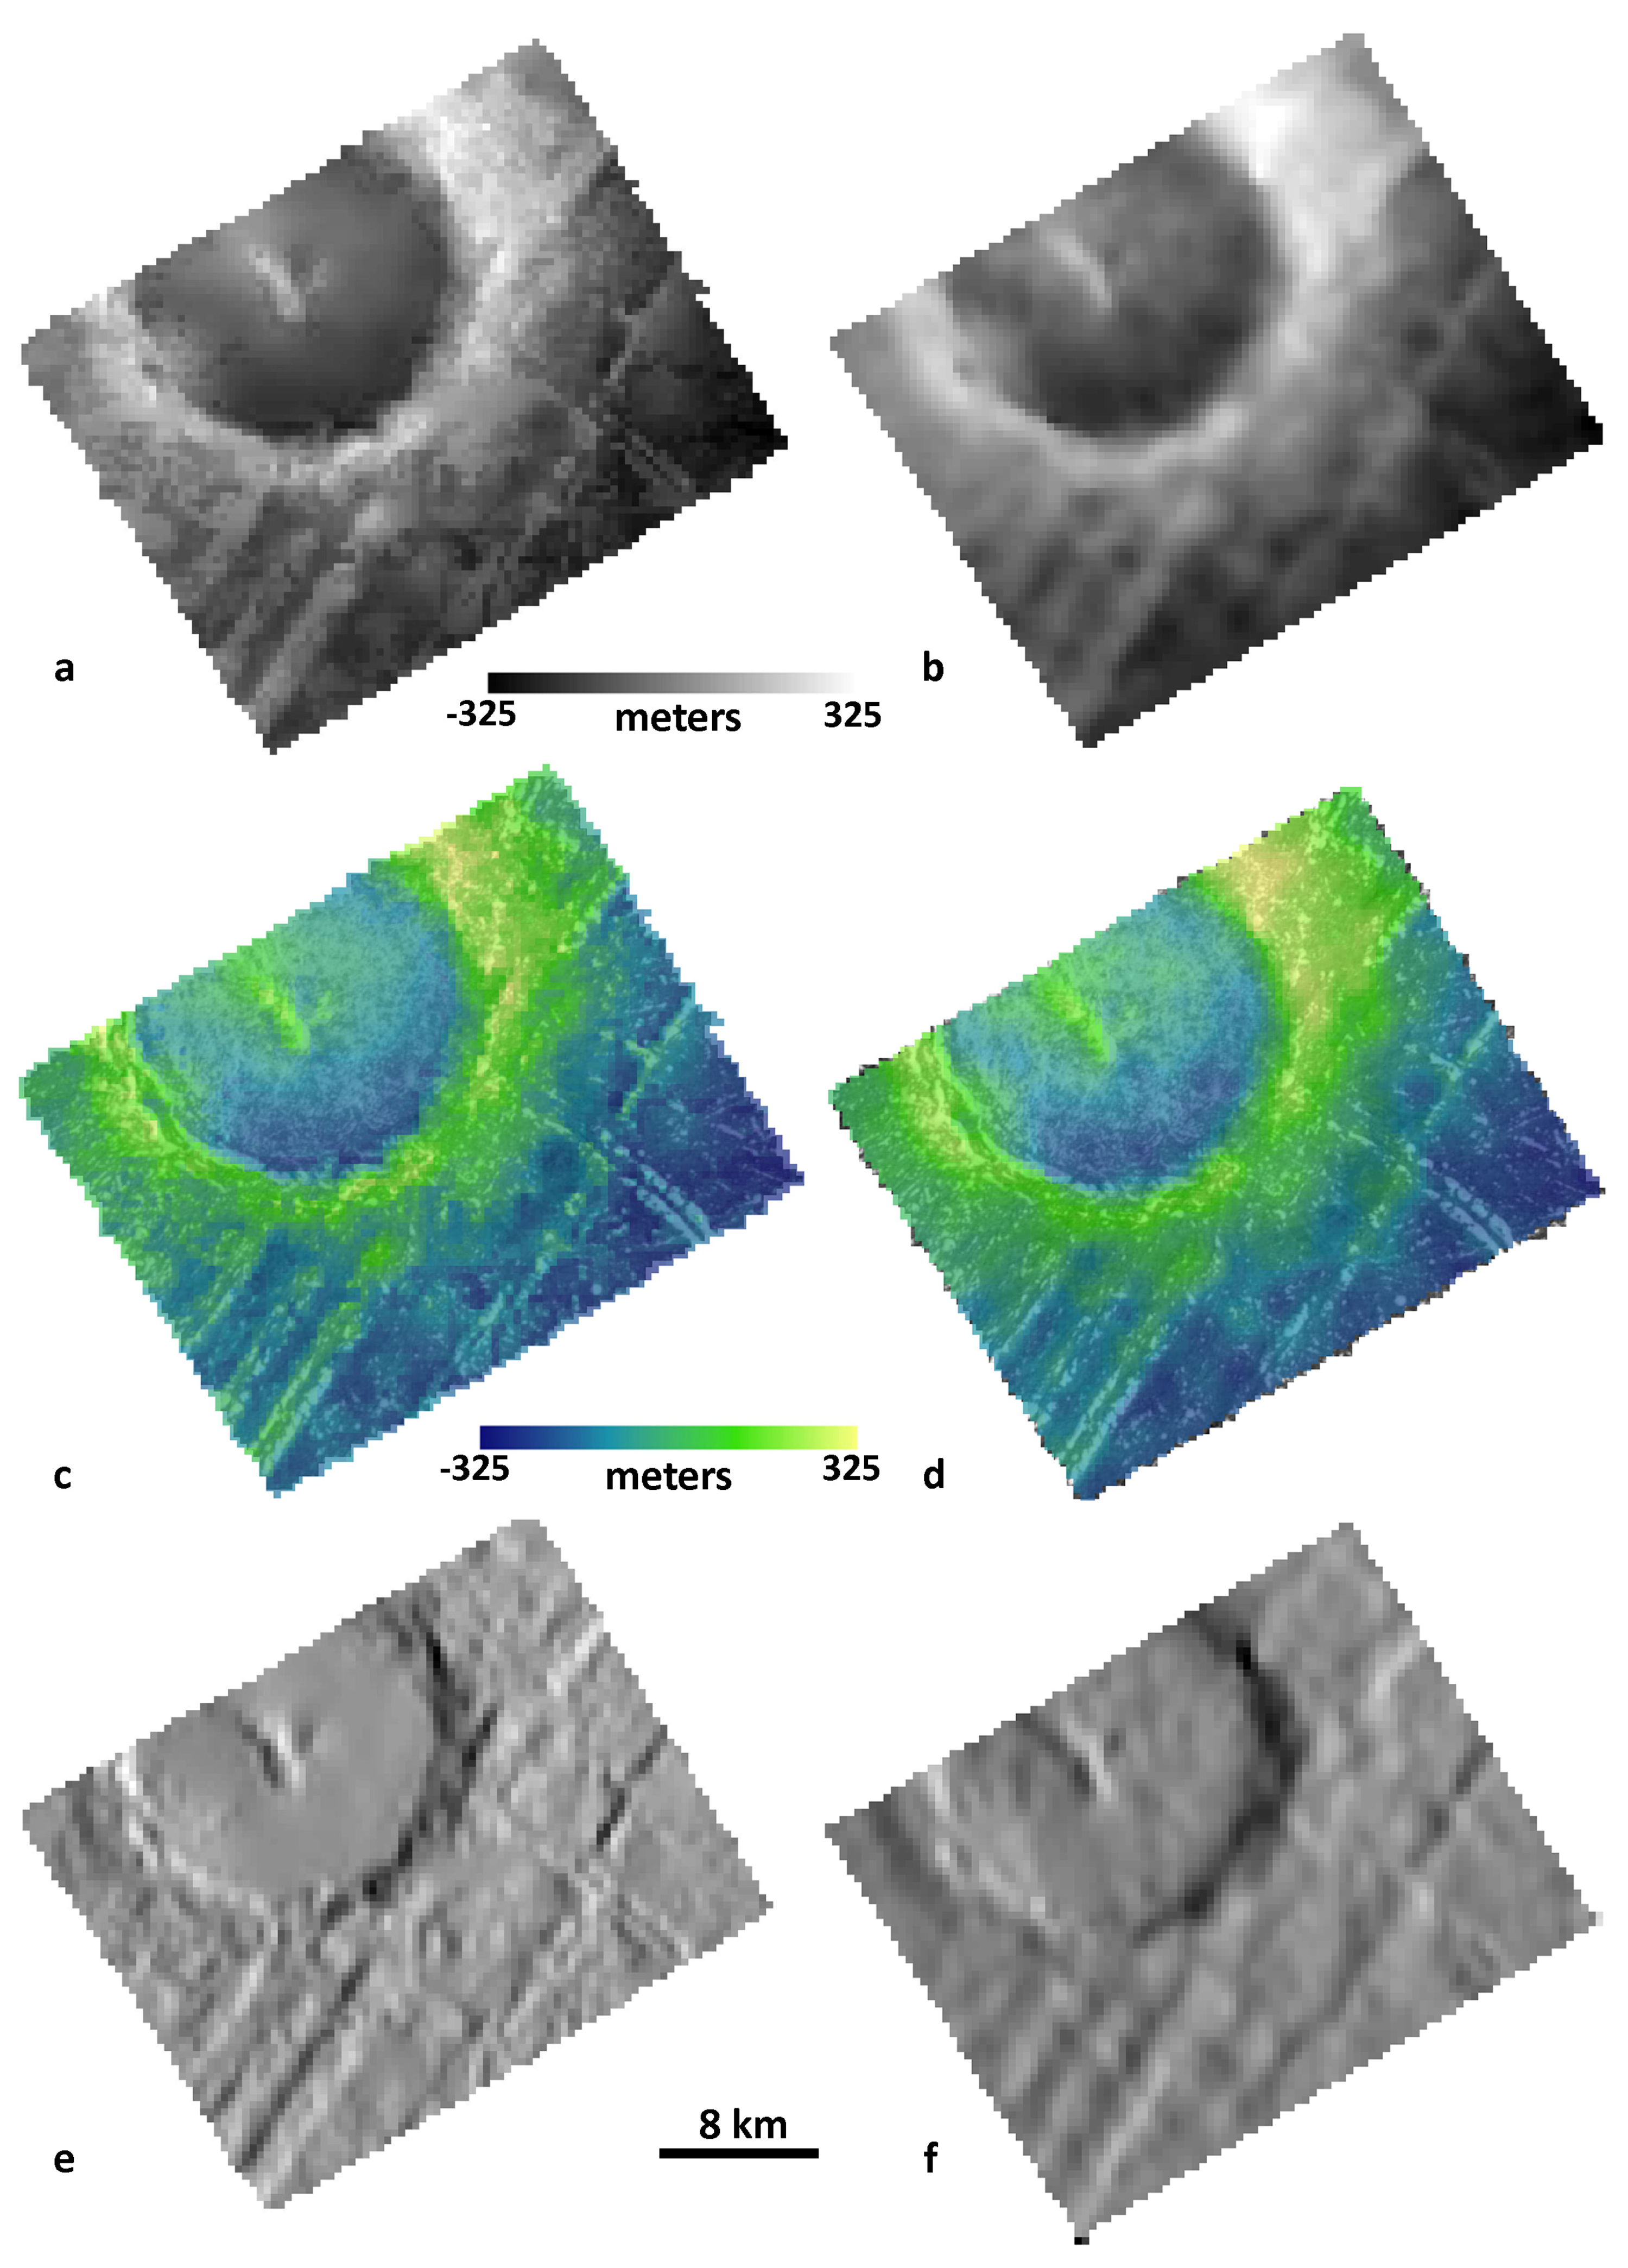
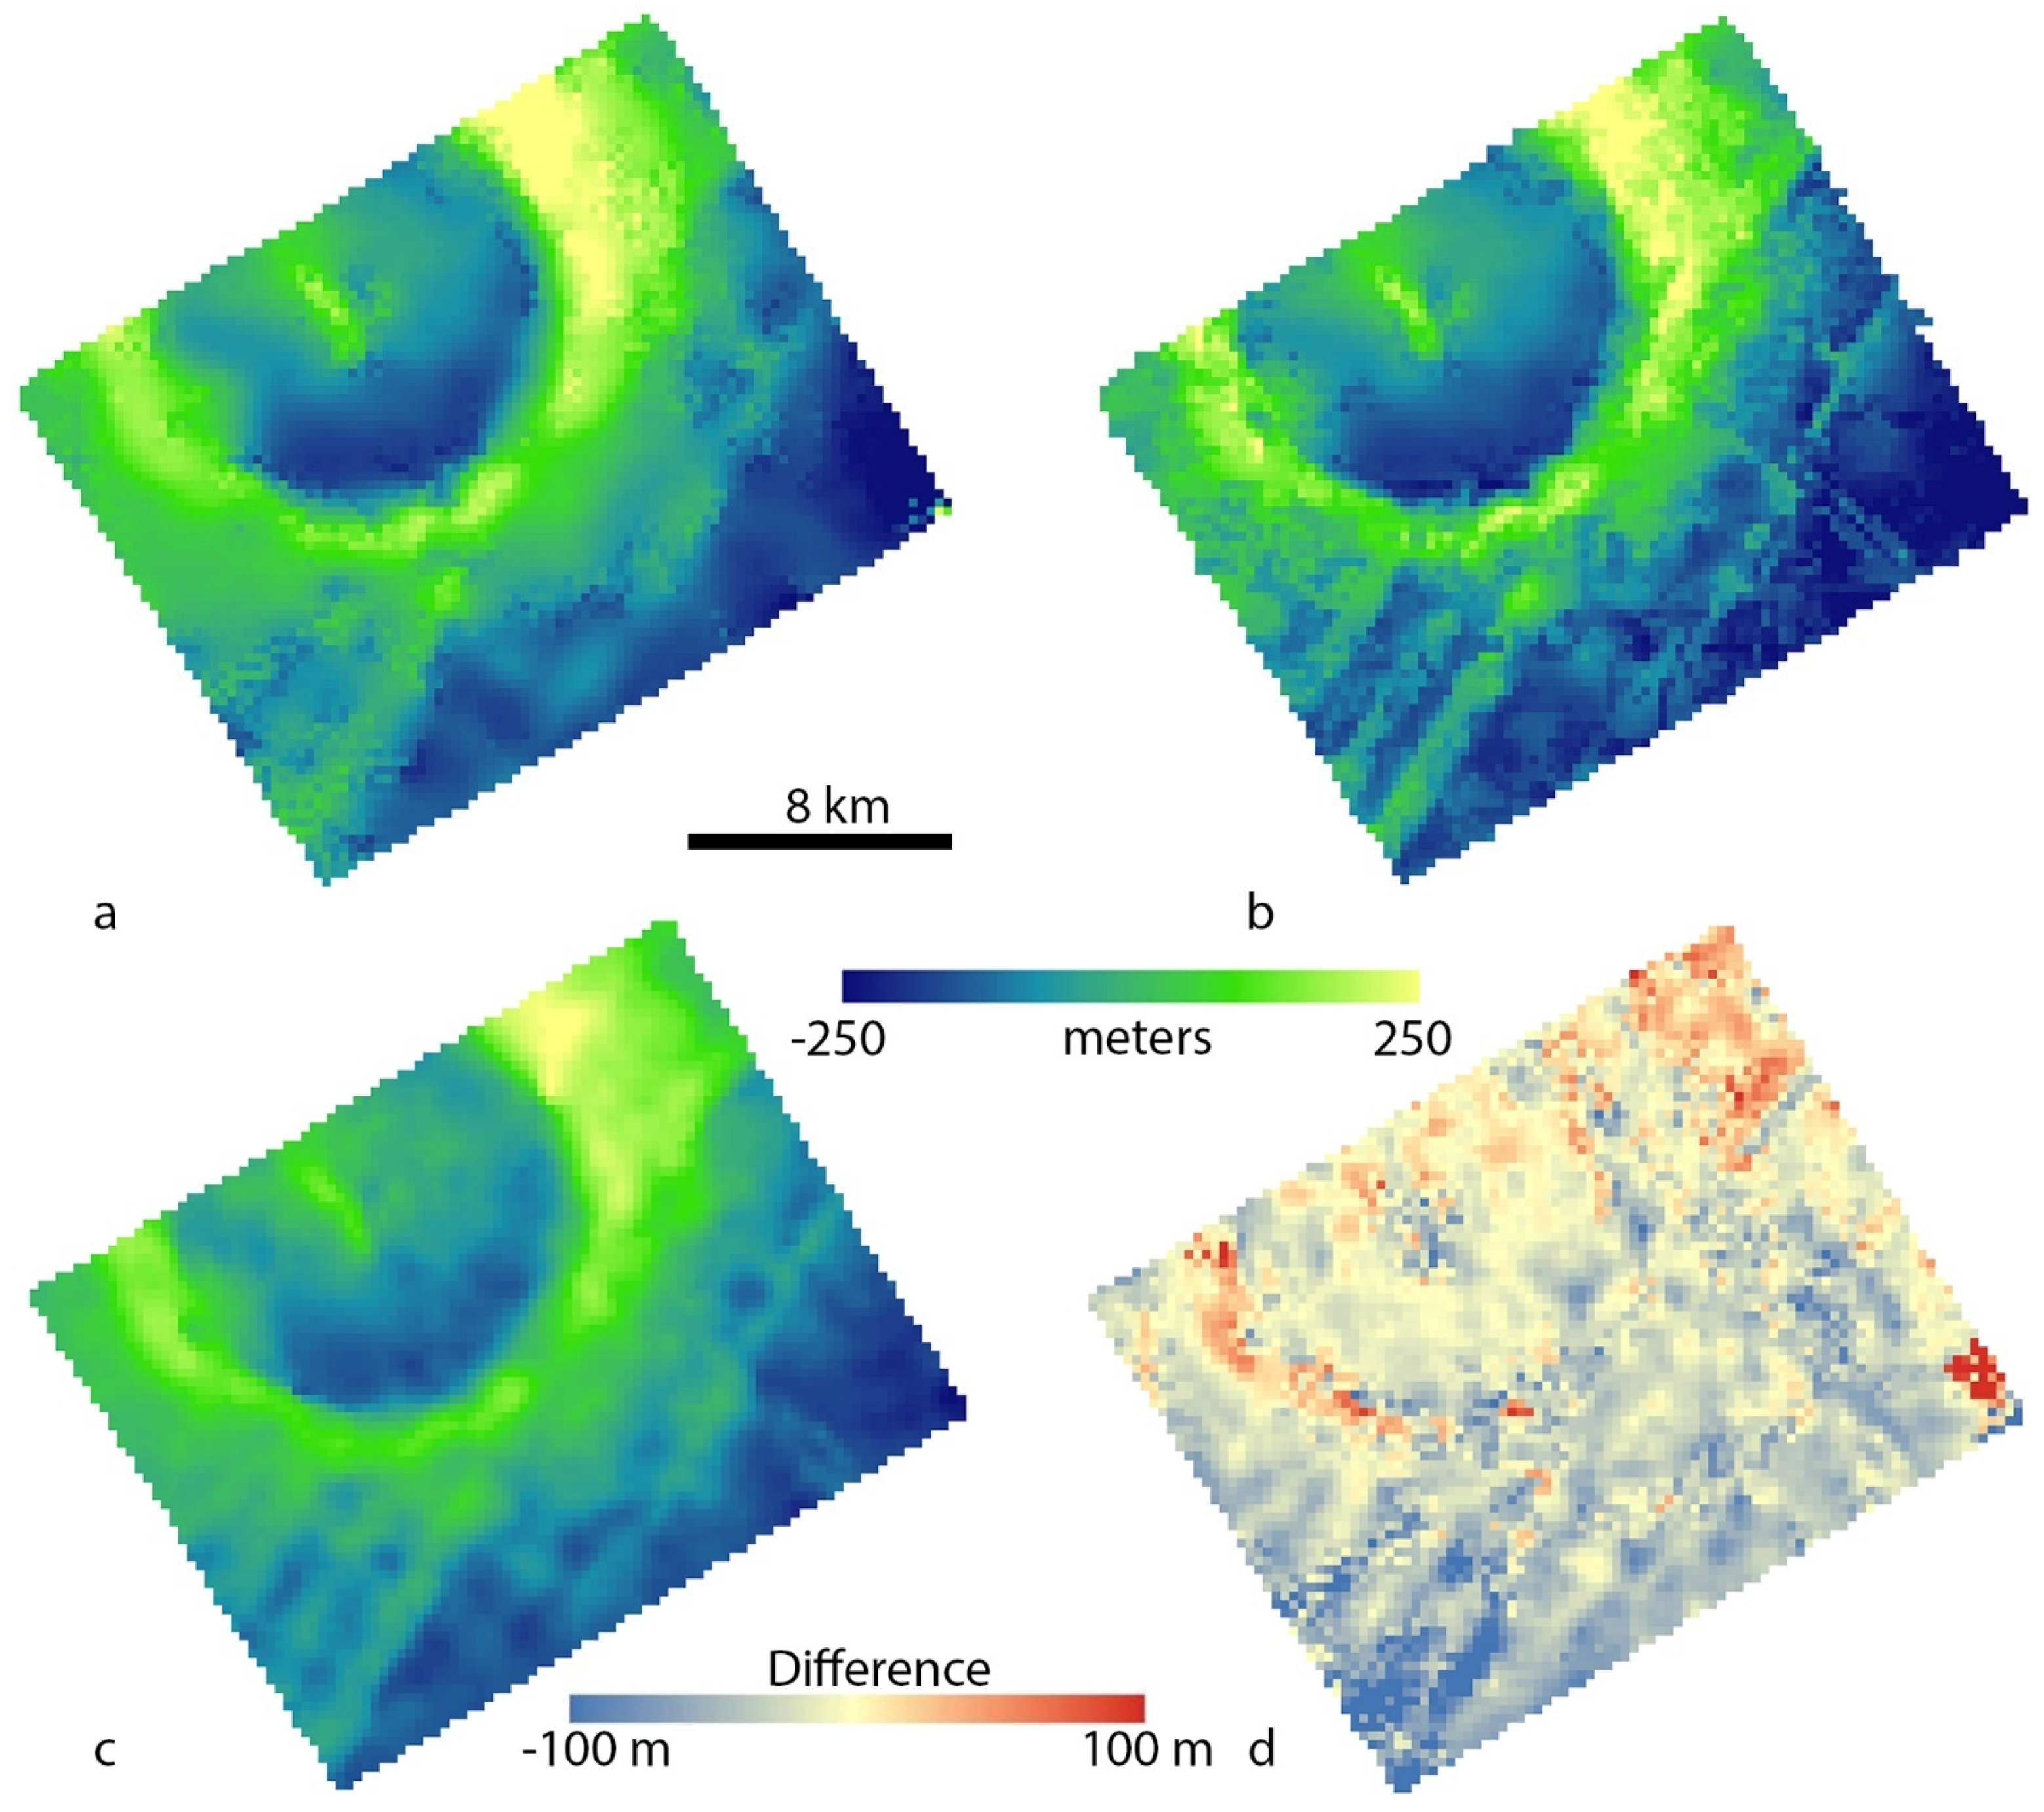
The orthoimage generated from SOCET SET® is shown in Figure 3c and the SOCET SET® and ASP DTMs are shown in Figure 4. Both DTMs provide a qualitatively reasonable representation of the crater bowl, central structure, and largest ridges. The smallest real features (i.e., that are also observed in the orthoimage) discernable in the SOCET SET® DTM are ~2 DTM posts (700 m) across. Specifically, the central trough of the northwest-southeast trending double ridge in the lower right of the scene is well resolved along its entire length and has a width of 1–2 DTM posts (350–700 m). Comparison of the hillshade, which emphasizes short-wavelength topography, and the orthoimage indicate that, more generally, the limit of resolution is three DTM posts (1.1 km). That is, features of this scale are consistently resolved in the DTM, including details along the crater rim (especially where it intersects pre-existing ridges) and numerous “ridge fragments” in the lower right of the scene. There are no obvious gaps, blunders or artifacts in the DTM (manual editing can generally fix these); however, there is significant texture below the scale of ~1 km with amplitudes of 20–40 m, and it is difficult to determine from the DTM, hillshade, and orthoimage alone if this texture corresponds to real surface texture or is simply due to statistical inliers in the successful matching process (i.e., the errors of which should follow a quasi-normal distribution).
For the ASP DTM and hillshade, the smallest discernable feature is again the central trough of the northwest-southeast trending double ridge in the lower right of the scene. However, the trough is not as well defined as in the SOCET SET® DTM. Comparing the hillshade to the orthoimage we find that all major features larger than four DTM posts (1.4 km) in horizontal scale are apparent, as are many features at the scale of three DTM posts (1.1 km). The ASP DTM is generally smoother in appearance than the SOCET SET® DTM at scales below three DTM posts (1.1 km). The DTM is free of gaps, but the hillshade reveals a small bright area that is four to six posts (1.4–2.1 km) wide on the southwest rim of Cilix that may be a blunder due to incorrect matching. The area is not distinctive in the DTM itself.
Given these observations, we consider the horizontal resolution (as distinguished from post spacing) of these DTMs to be similar (~1 km). The somewhat better resolution of parts of the SOCET SET® DTM, enabling features as small as two DTM posts (700 m) to be observed in some places, appears to result mainly from the manual editing process, which not only corrects any blunders, but has also been used to more clearly define real topography, like the narrow trough of the double ridge described above. The SOCET SET® DTM has a resolution 11.1 × GSDRMS of the images and 9.1 × GSDmax. The ASP DTM has a resolution 15.5 × GSDRMS or 12.7 × GSDmax. Resolution estimates for each DTM in our study are provided in Table 2.
Table 2. Summary of SOCET SET® and ASP DTM resolution.
DTM Pixel Scale (m/Post)SOCET Res.
(DTM Posts)
SOCET Res.
(Meters)
SOCET Res. (RMS Image Pixels)SOCET Res. (Max Image Pixels)ASP Res.
(DTM Posts)
ASP Res. (Meters)ASP Res. (RMS Image Pixels)ASP Res. (Max Image Pixels)
Cilix crater35031.1 km11.19.141.4 km15.512.7
Chaos and pits45041.8 km10.67.852.3 km13.29.7
Pwyll crater75021.5 km7.76.132.3 km11.59.2
Ridged Plains603180 m8.67.04240 m11.49.4
Agenor Linea75043.0 km19.213.8
Res. = resolution.

3.1.2. Difference Map and Statistics

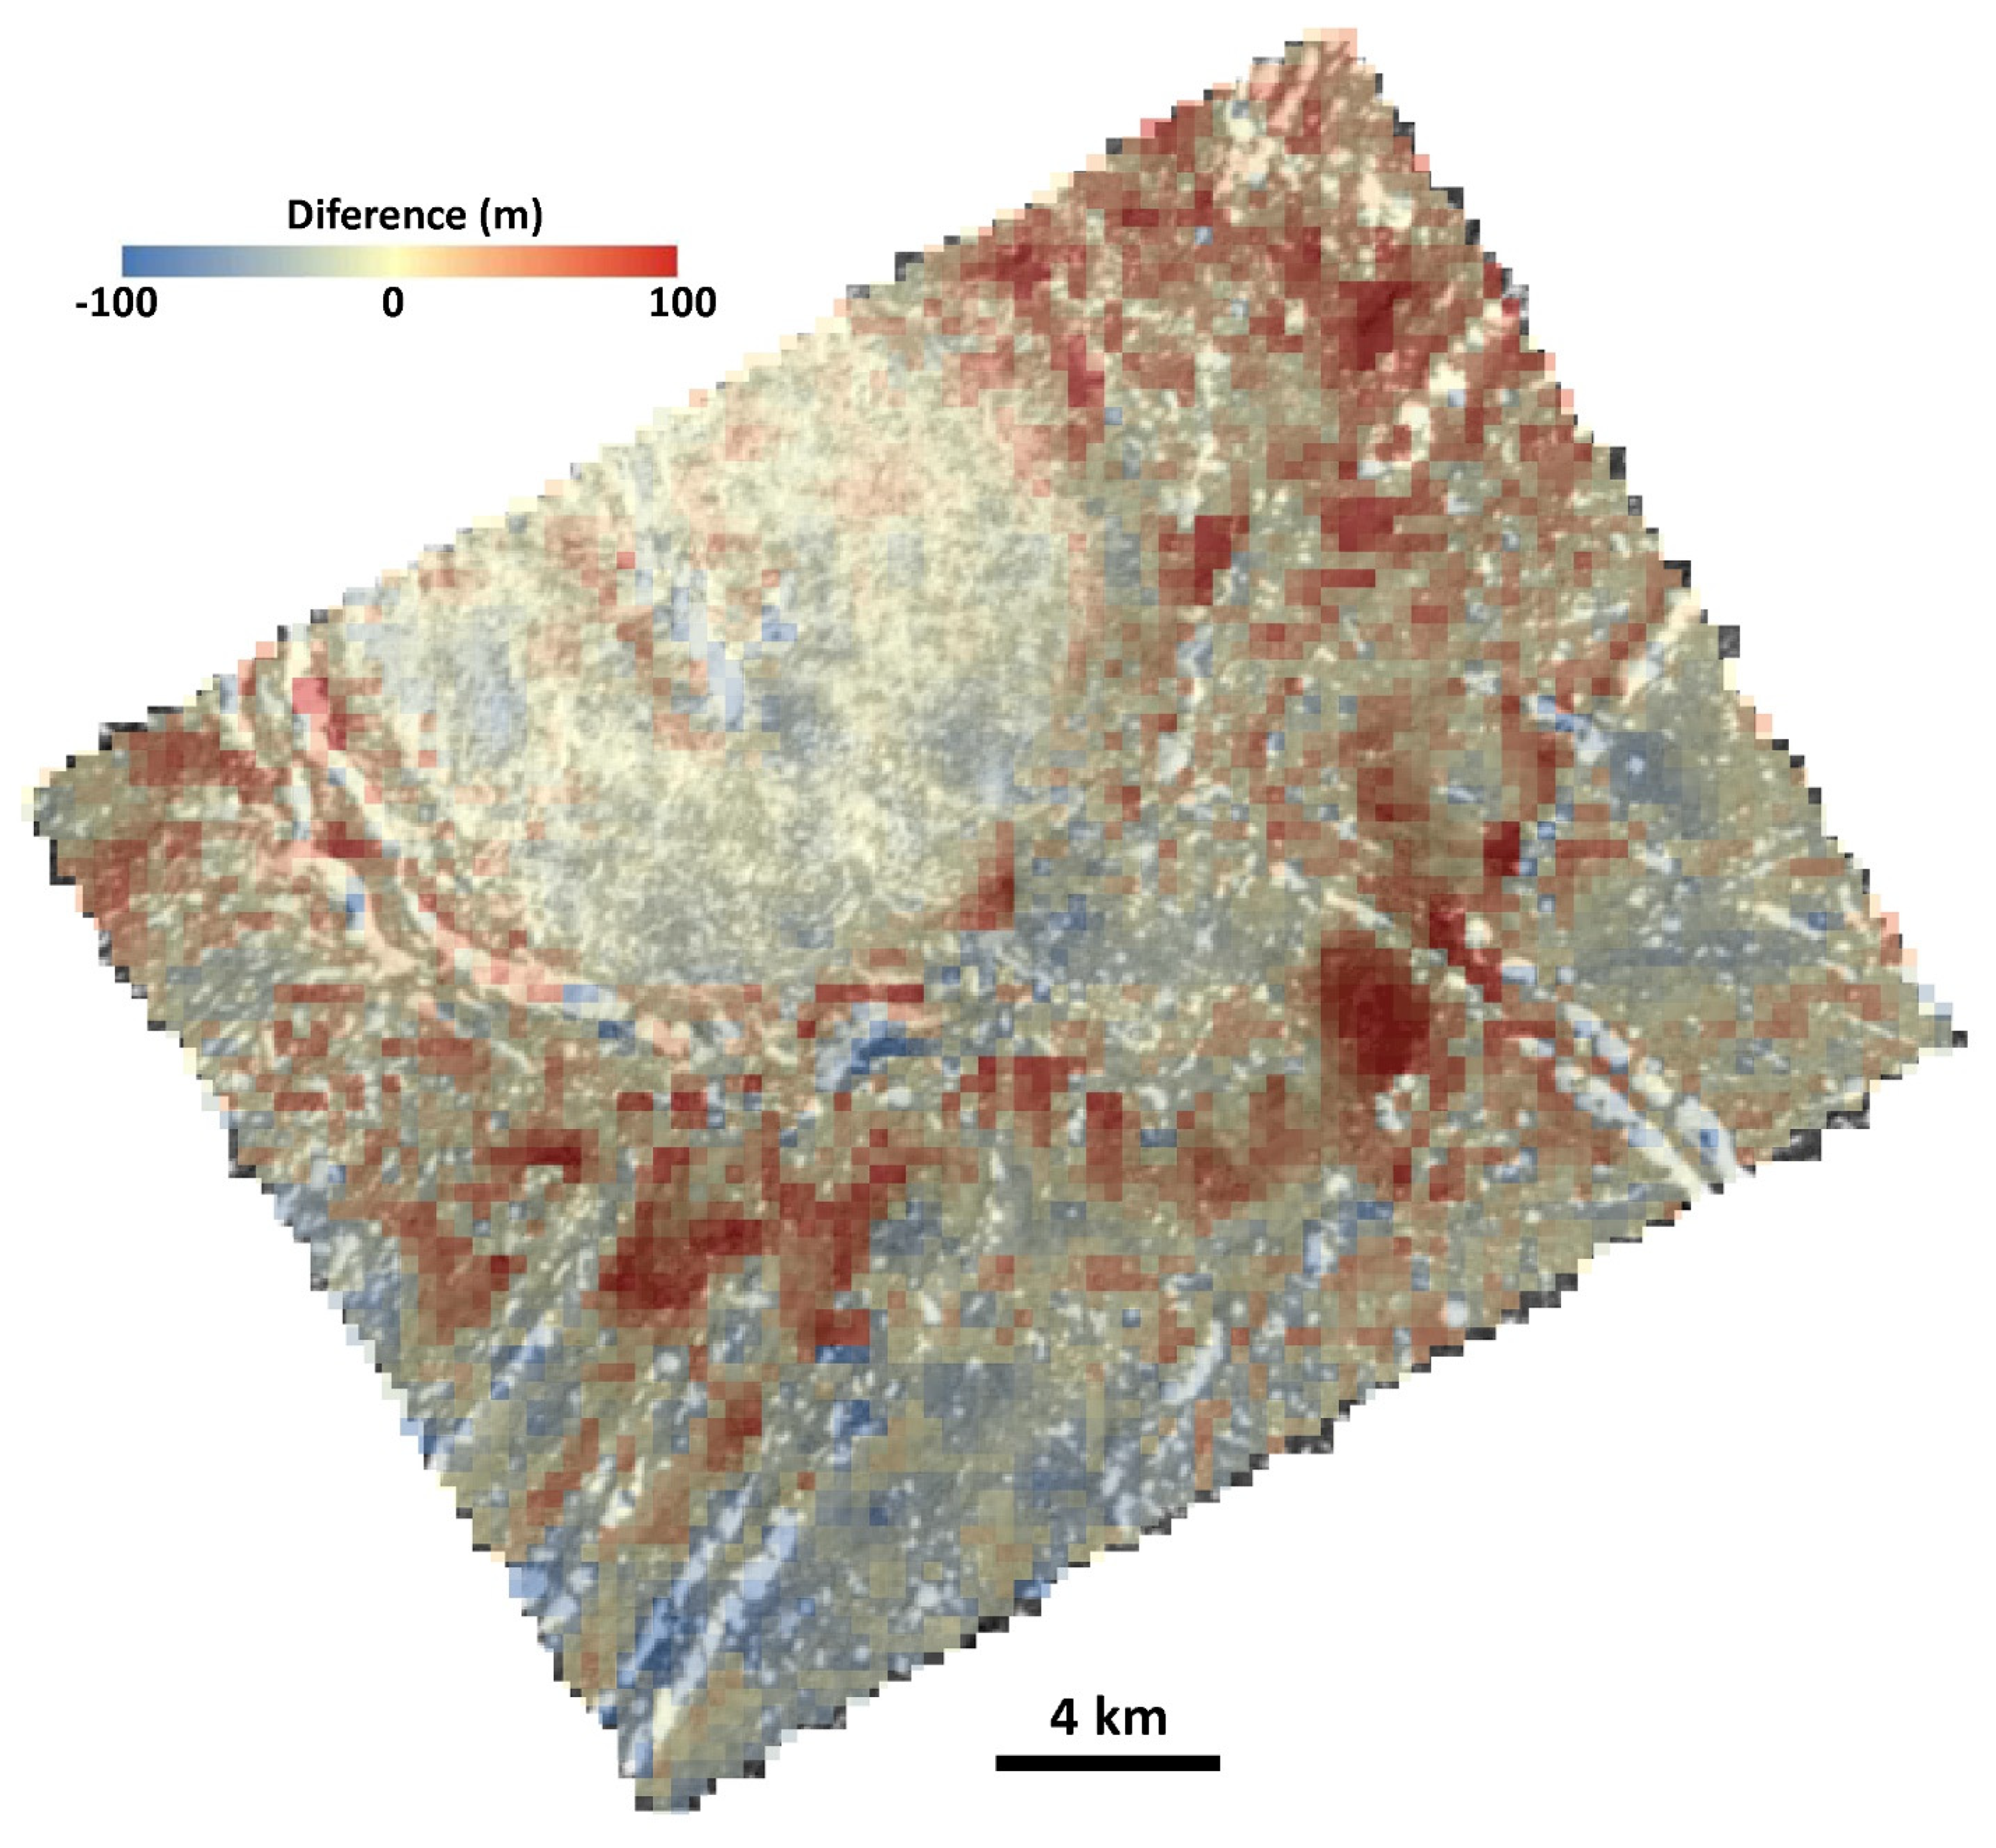
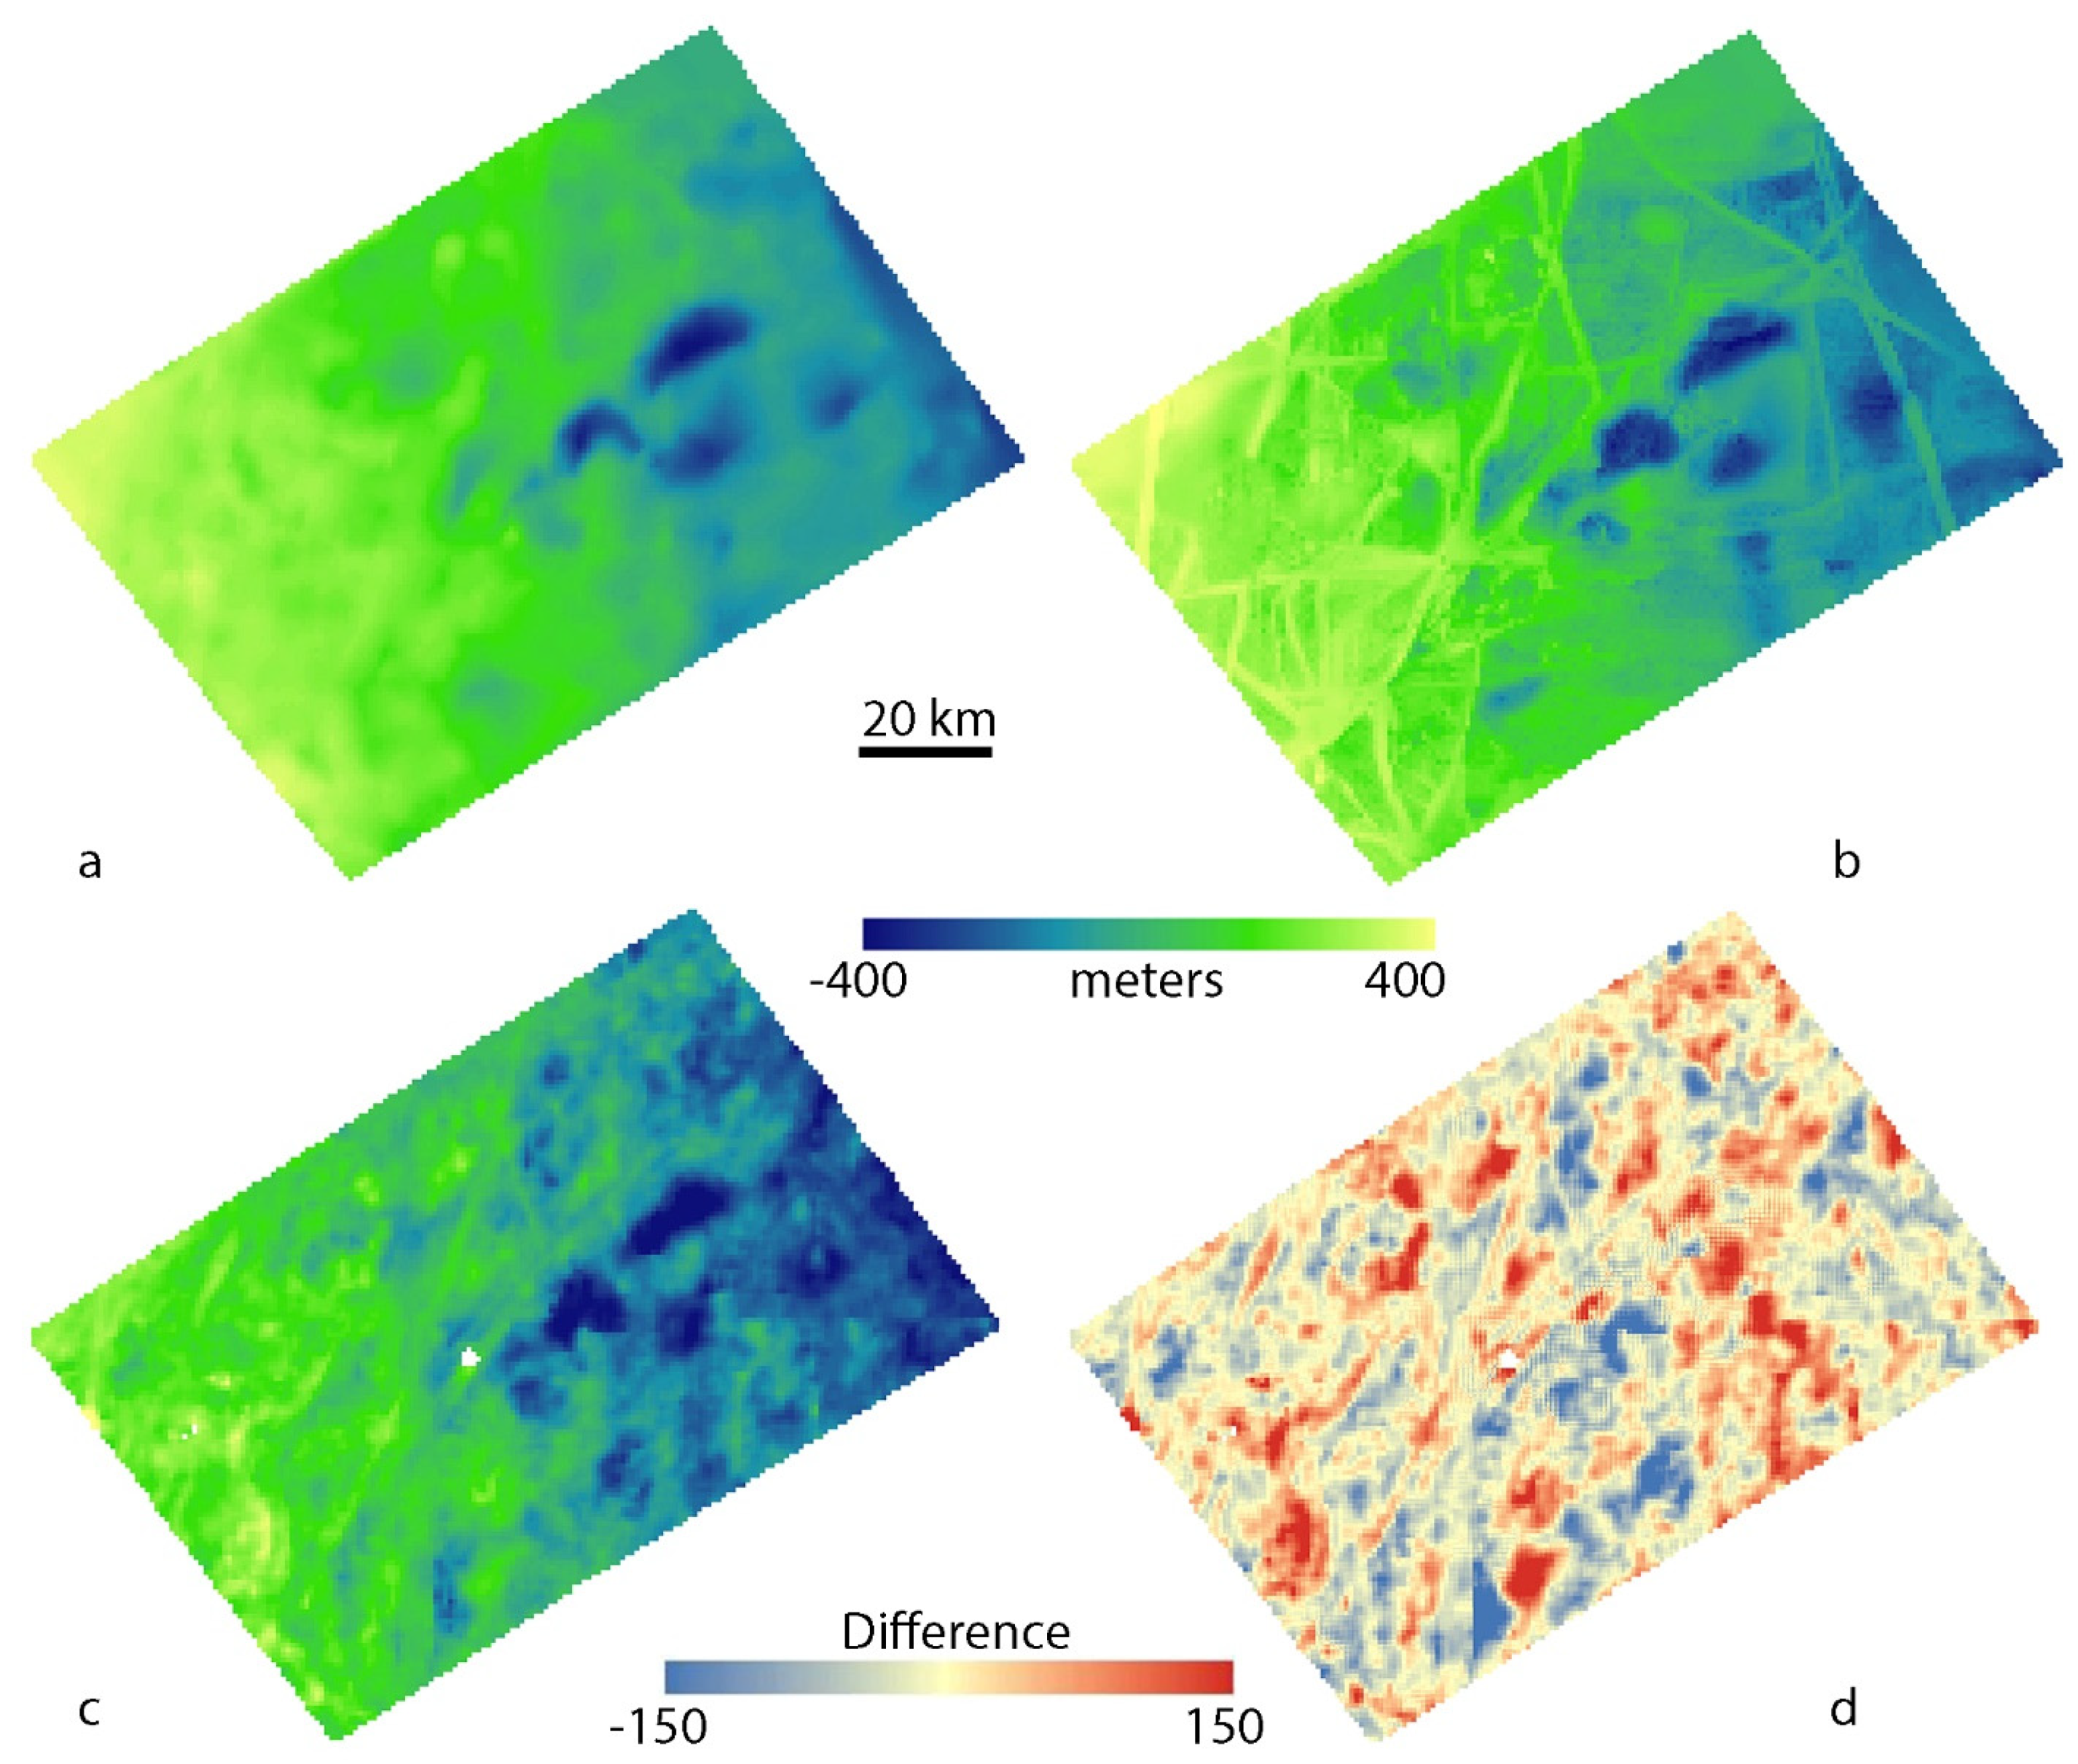
Figure 5 shows a difference map between the two aligned DTMs. Yellow regions indicate that the two DTMs are similar. Red regions are those in which the ASP DTM has a greater elevation than the SOCET SET® DTM. Blue regions are those in which the SOCET SET® DTM has a higher elevation. The greatest differences are associated with real topographic features. The SOCET SET® DTM shows larger-amplitude ridges than the ASP DTM (e.g., the southwest-northeast ridges in the lower right of the scene) resulting in blue ridge tops (SOCET SET® higher) and red troughs between (SOCET SET® lower). There are also substantial differences in the elevation of the ejecta around Cilix which is consistently higher in the ASP DTM. Other differences are less obviously correlated with topographic features, such as the region directly west of the intersection of the two narrow ridges in the lower-right of the scene, which is relatively flat in the ASP DTM but quite low (almost a pit) in the SOCET SET® DTM. In this case the orthoimage does not clarify which is correct: the region is quite dark, and the low albedo obscures the topography (and may hinder good stereo matching in that location).
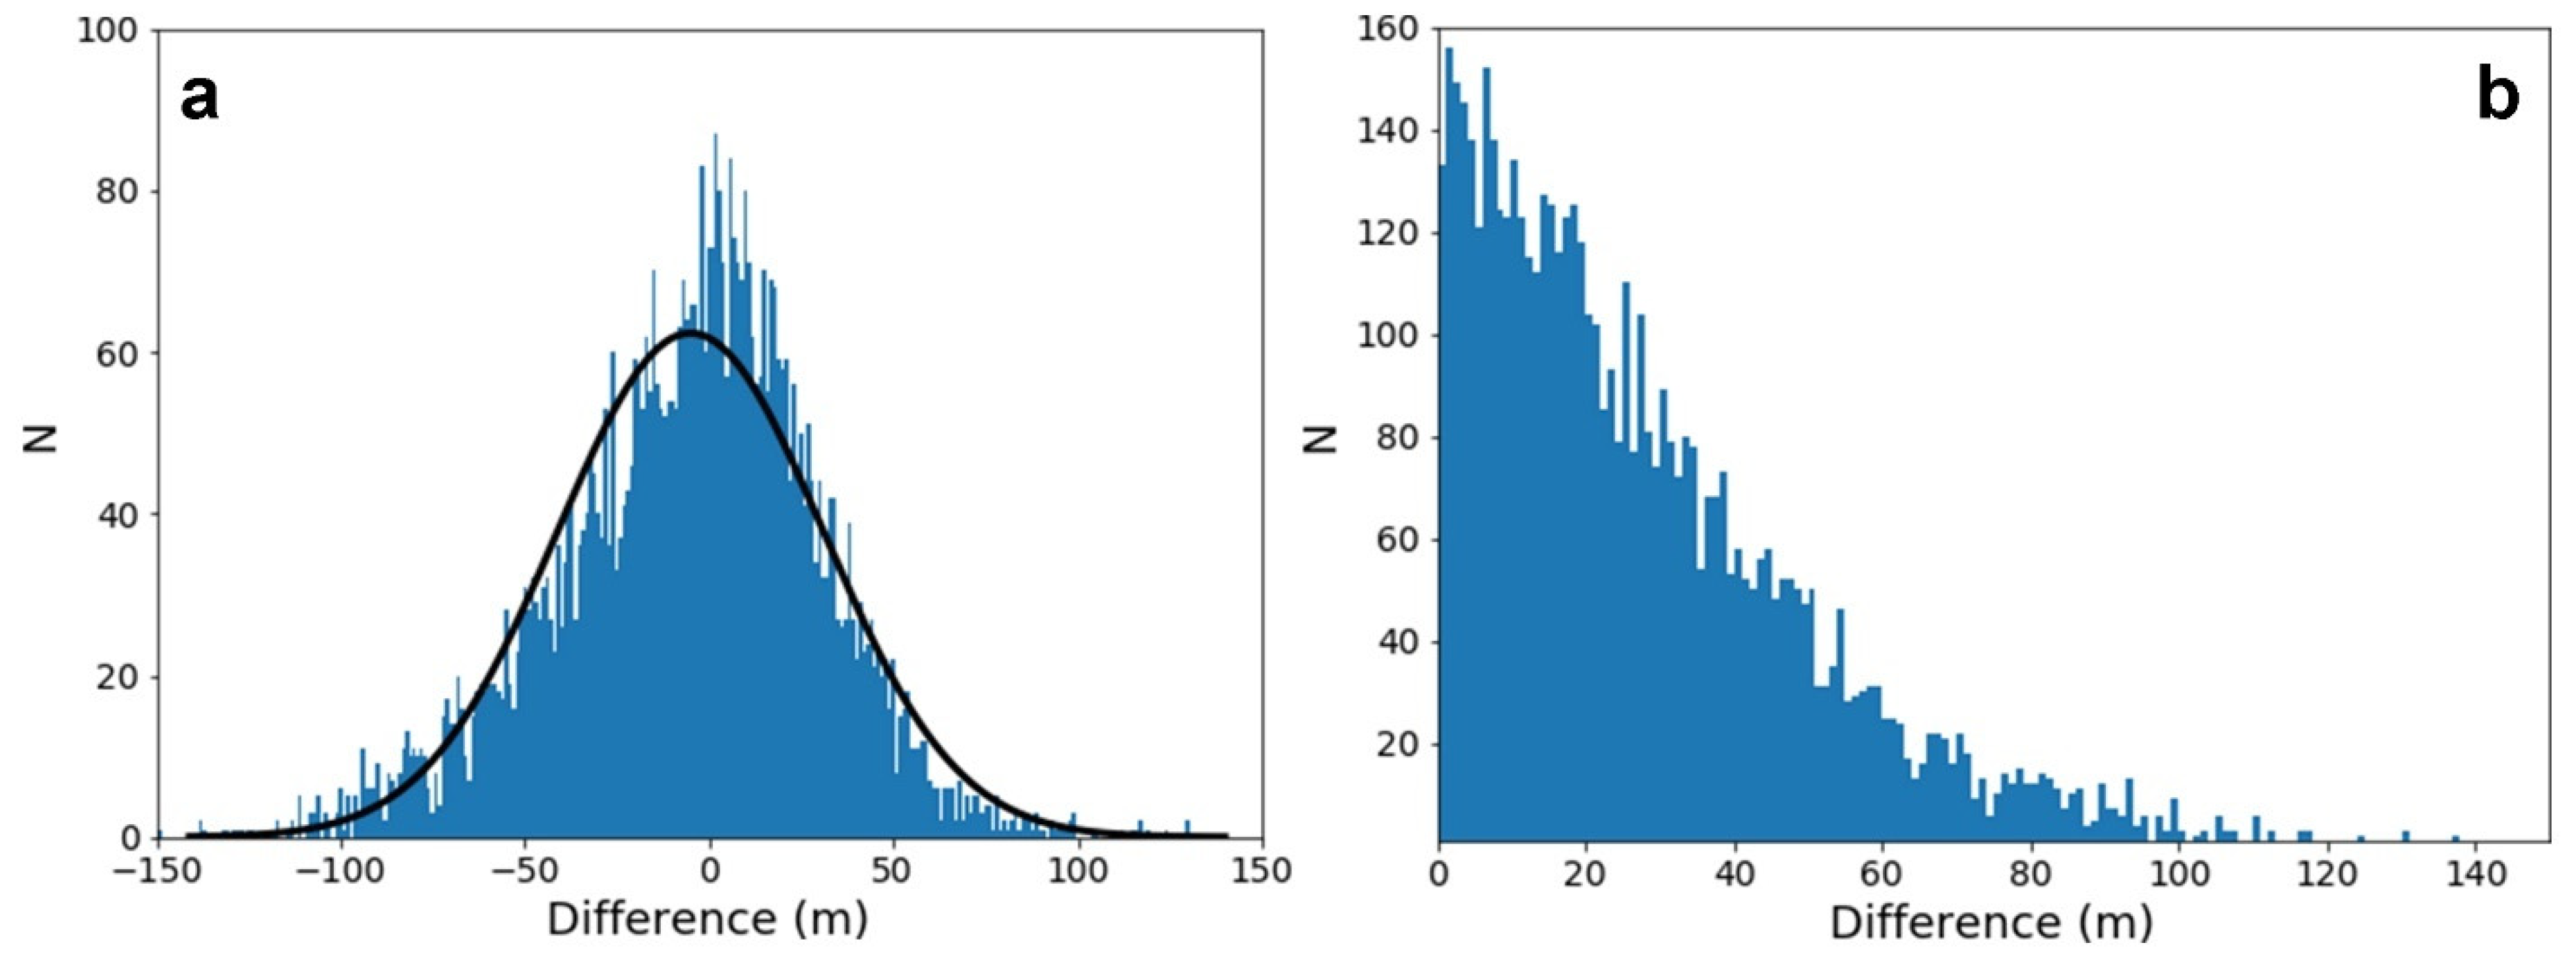
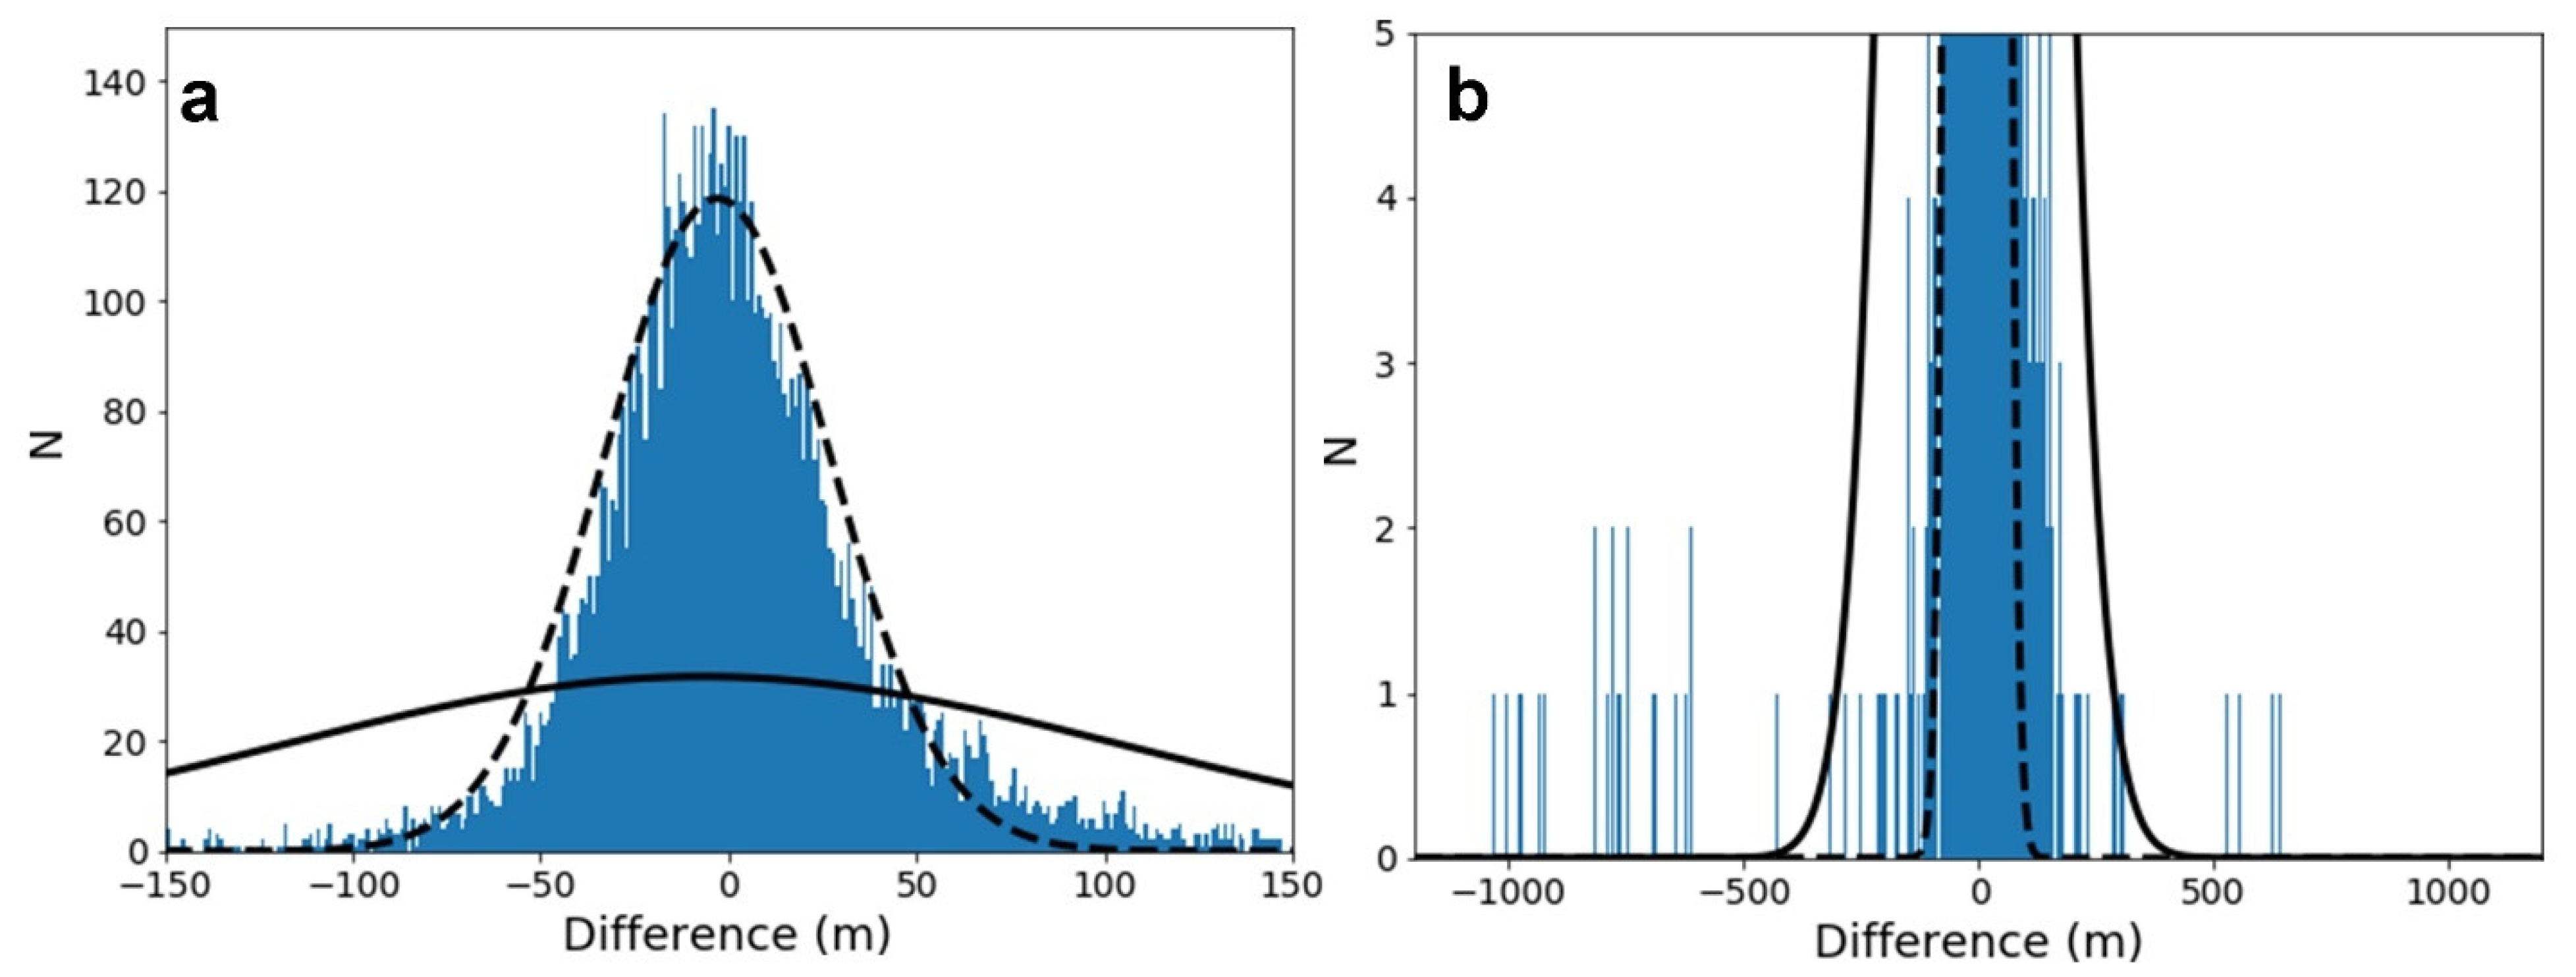
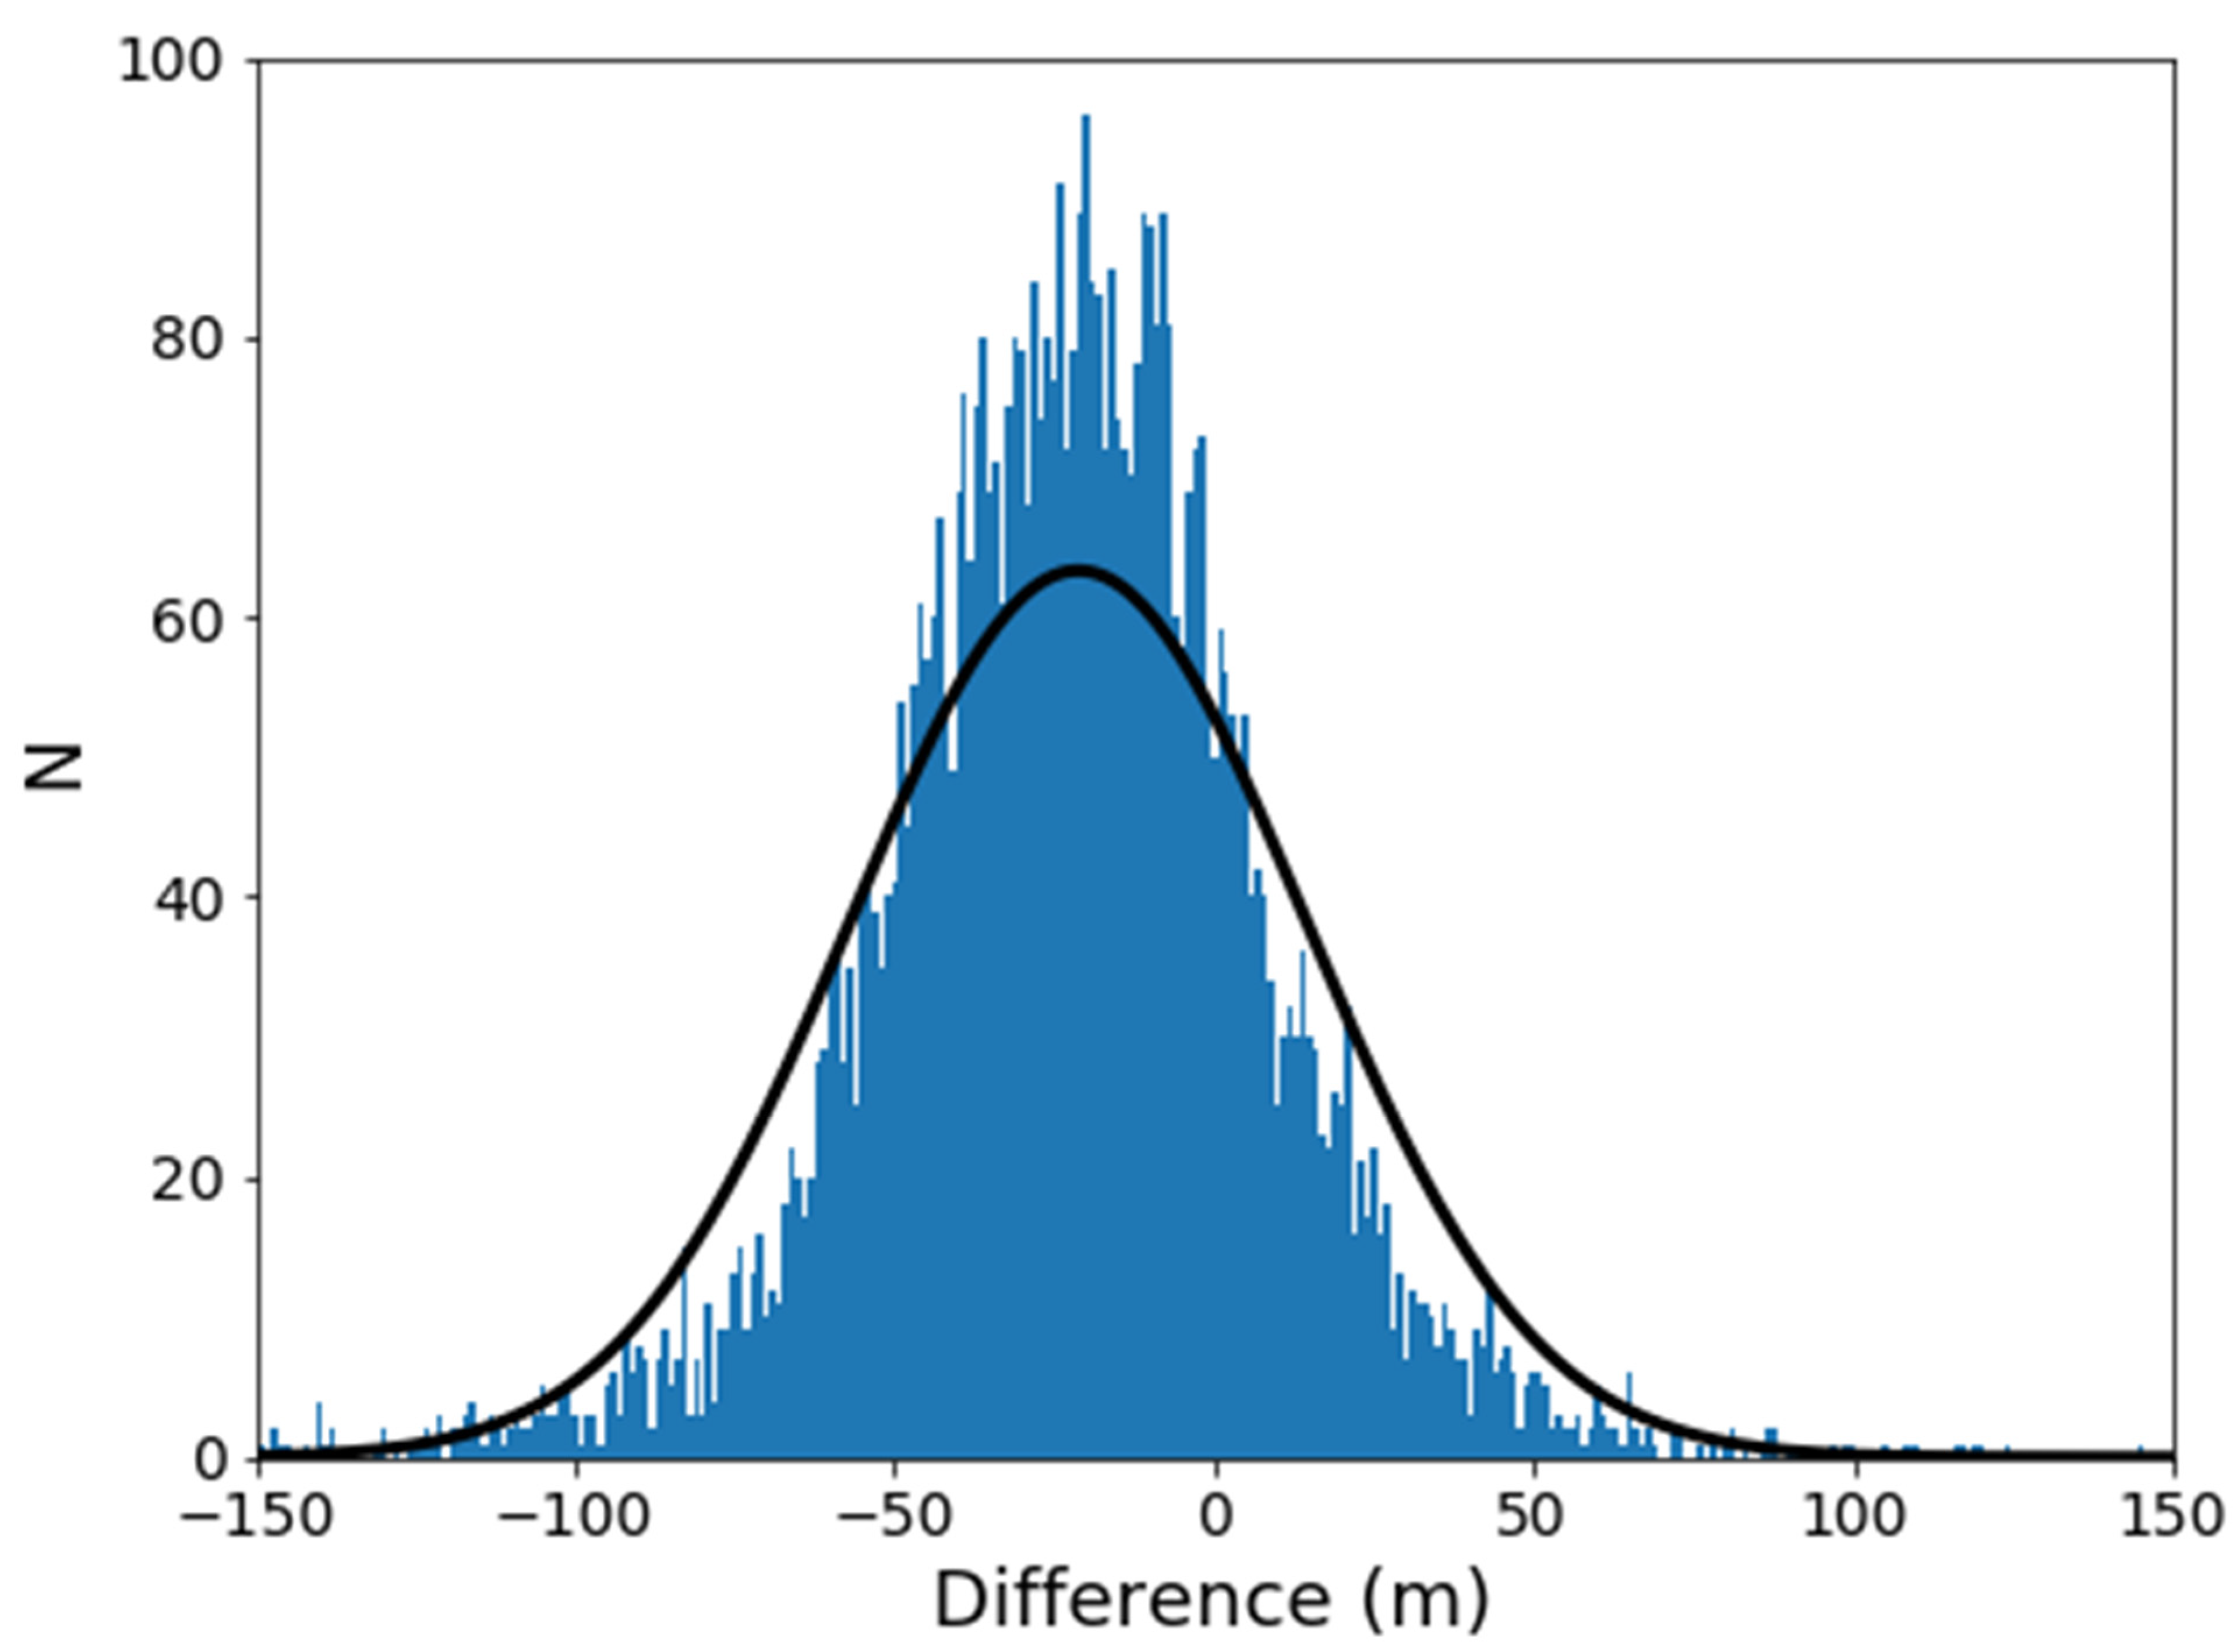
A histogram of the distribution of differences (compared to a normal distribution) and the absolute value of the differences is shown in Figure 6. Differences are approximately normally distributed, although large differences (at the tails of the distribution) occur somewhat more often than might be expected. The maximum and minimum differences are large: 130 m and −208 m, respectively, for a total range of 338 m (the color scale used in Figure 5 covers only 200 m of this range). The total relief in the DTMs is 650 m, so the maximum differences are roughly half the total relief in the scene. As Figure 6 illustrates, most differences are much smaller. The mean absolute difference is 28 m with a standard deviation of 23 m, yielding an RMS absolute difference between the two DTMs of 36 m (Table 3). As discussed in Section 2.2, if we assume that the RMS absolute difference is roughly equivalent to the RMS uncertainty in the DTM, we can then equate this with the observed or derived EP (which is a measure of the RMS uncertainty in the elevation of a point sampled from the DTM). That is, EPderived = 36 m (Table 3), which is 1.3 × EPmax and 1.6 × EPRMS and suggests that the matching accuracy is ρmax = 0.4 pixels and ρRMS = 0.5 pixels, rather than the assumed value of 0.3 (Table 3). The 90th percentile absolute difference of 59.6 m is then 1.655 × EPderived, which is larger than that expected for a normal distribution where the 90th percentile is 1.28 times the mean of the distribution, or 46 m (notably, it’s very close to the 95th percentile for which the value would be 1.645 × EPderived).
Table 3. Summary of DTM Accuracy based on SOCET SET/ASP differences.
EPderivedρRMS
(Pixels)
ρmax
(Pixels)
SOCET Res × ρRMS (Pixels2)SOCET
Res. × ρmax (Pixels2)
ASP
Res. × ρRMS (Pixels2)
ASP
Res. × ρmax
(Pixels2)
Cilix crater36 m0.50.45.63.67.85.1
Chaos and pits66 m0.50.45.33.16.63.8
Pwyll crater112 m1 *0.8 *7.7 *4.9 *11.5 *7.4 *
Ridged Plains 21 m
14 m
0.6
0.4
0.5
0.3
5.2
3.4
3.5
2.1
6.8
4.6
4.7
2.8
Agenor Linea~100 m0.60.411.55.5
* The large value of ρ is unrepresentative of most of the DTM, where ρ is ≈0.5 pixels or less. The two values are for the left (top number) and right (bottom number) pair, respectively.
In recent work, Kirk et al. [23] evaluated DTMs generated from HRSC and CTX images of Mars, and found that the product of resolution (in image pixels) and matching accuracy (in pixels) is typically 4–5 pixels2. For SOCET SET®, we find that the product is 3.6 and 5.6 pixels2 for GSDmax and GSDRMS, respectively. For ASP, the product is 5.1 or 7.8 pixels2 for GSDmax and GSDRMS, respectively. Our results (Table 3) are thus consistent with, although somewhat larger than, those found by Kirk et al. [23]. Although preliminary, the result suggests that the trades between the resolution and matching accuracy described by Kirk et al. [23] may be broadly applicable.

3.1.3. Topographic Profiles

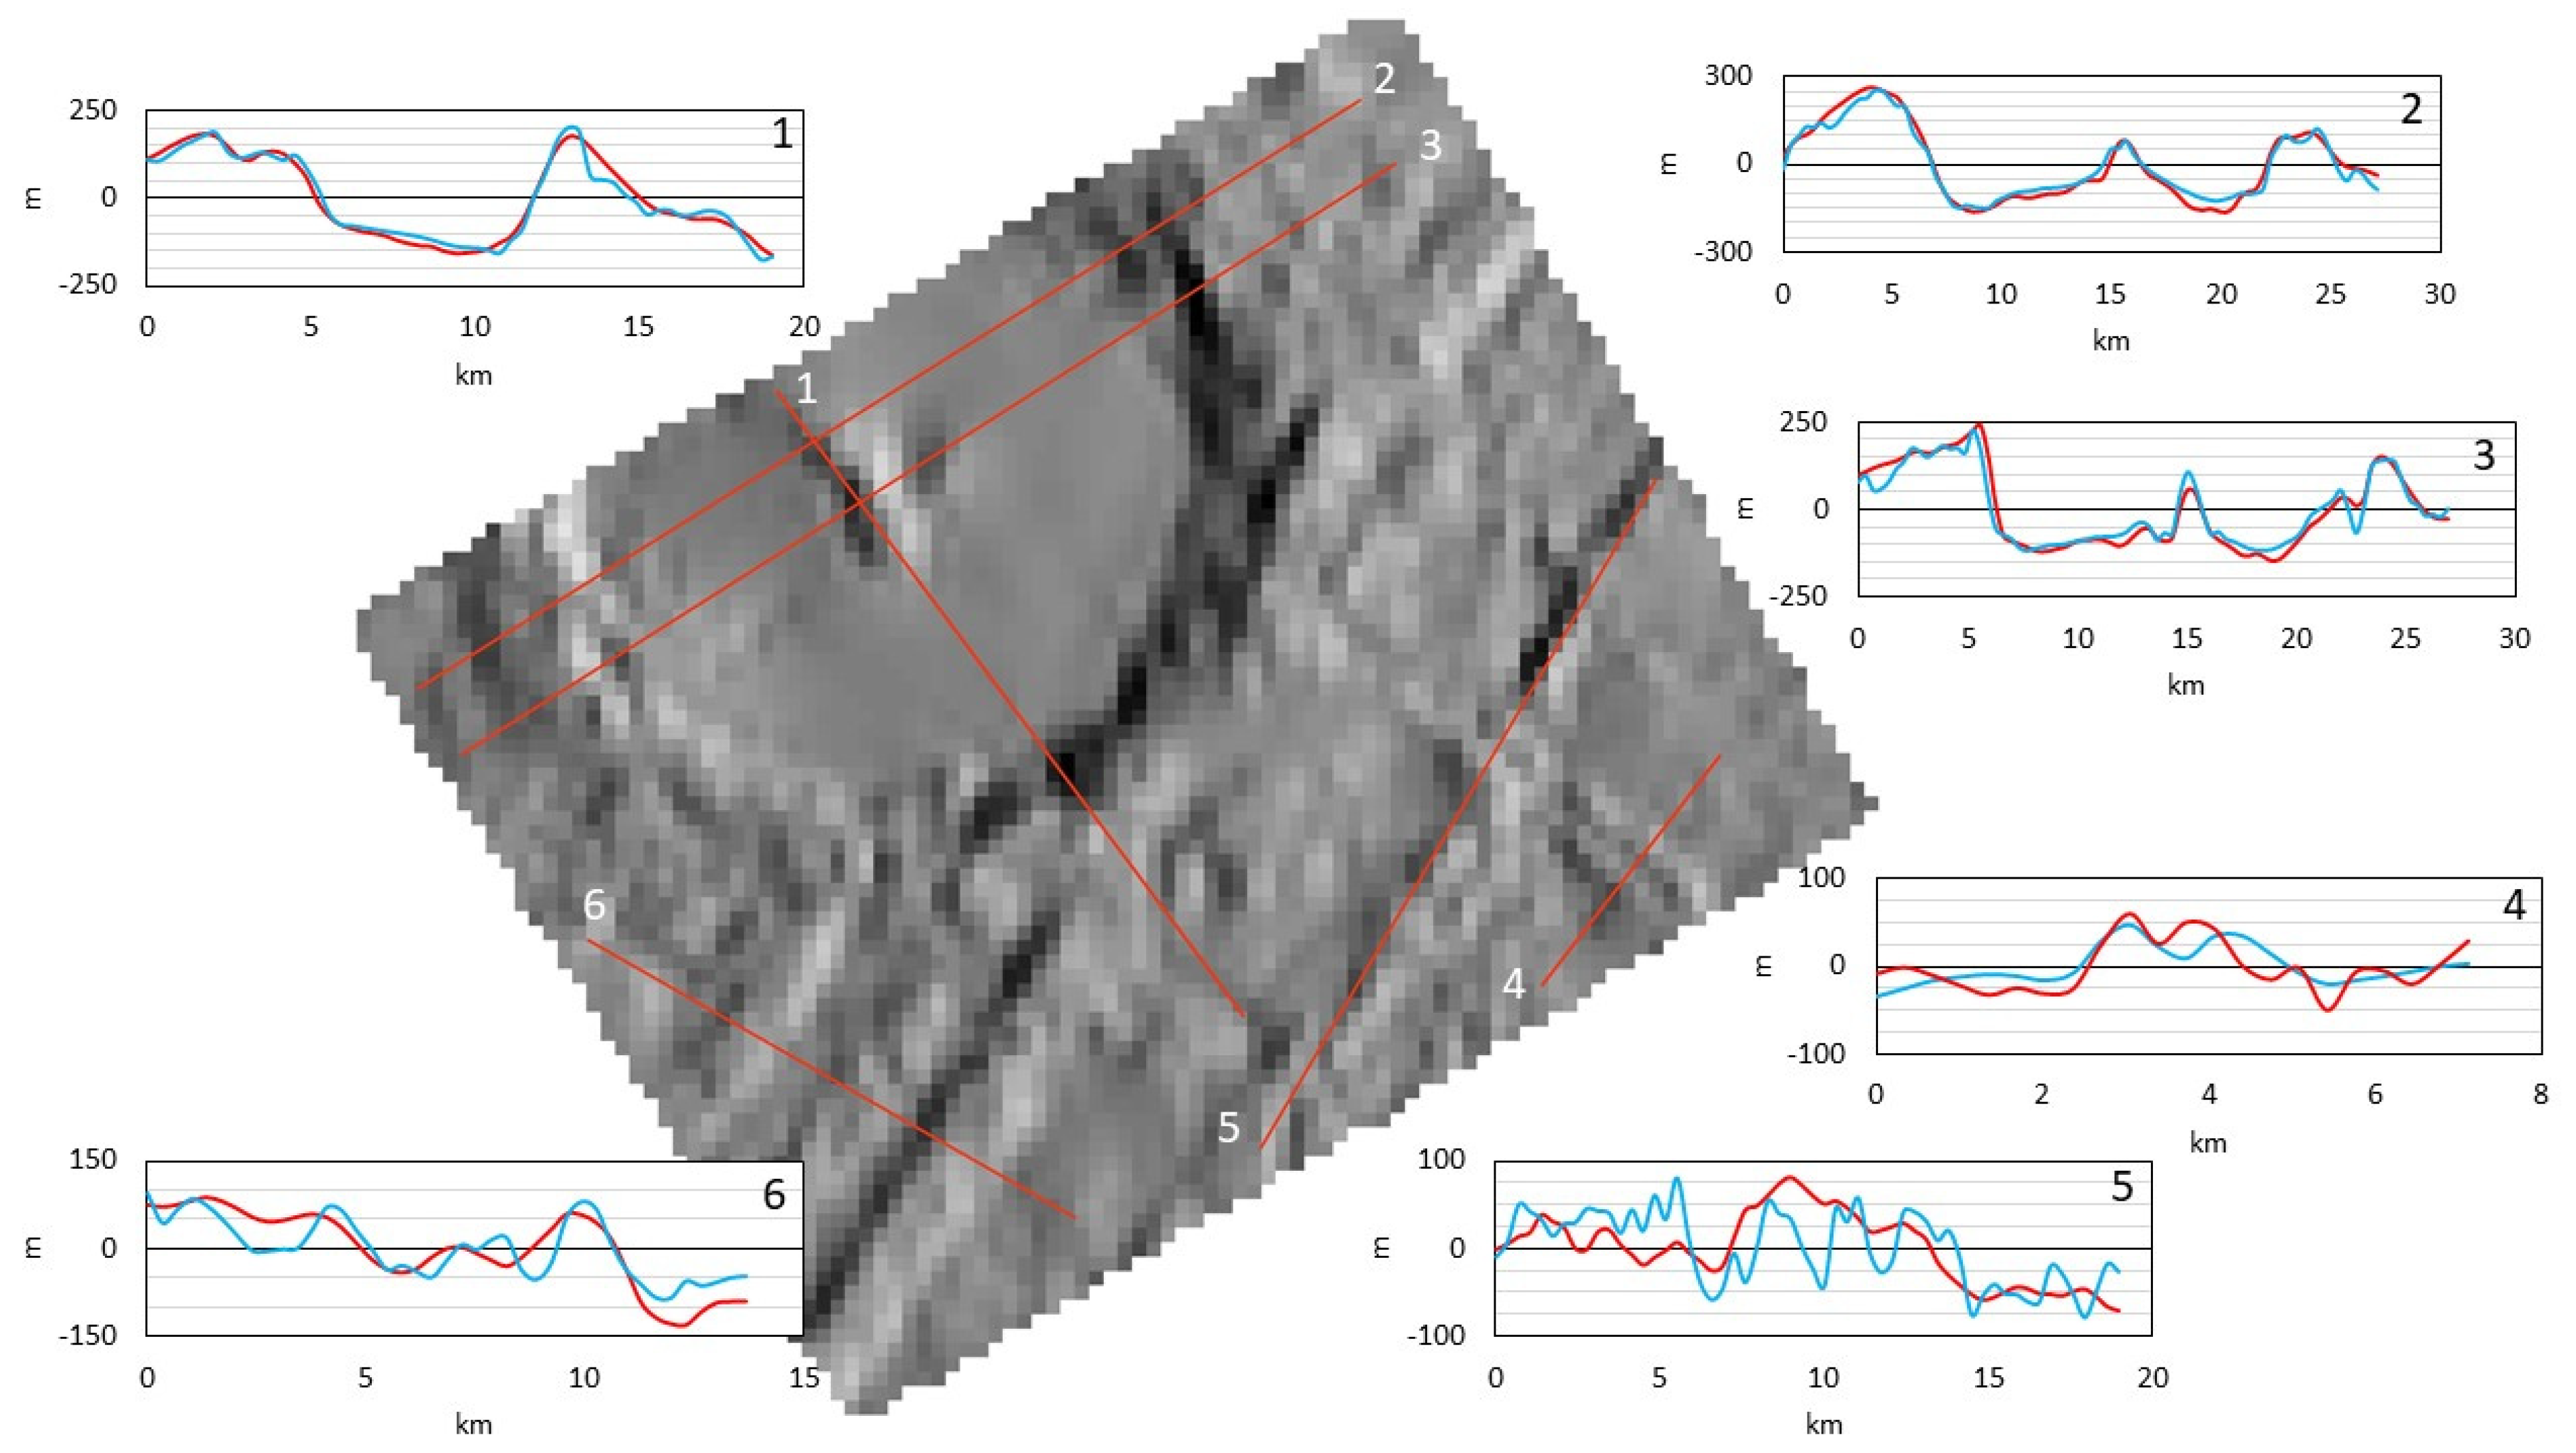
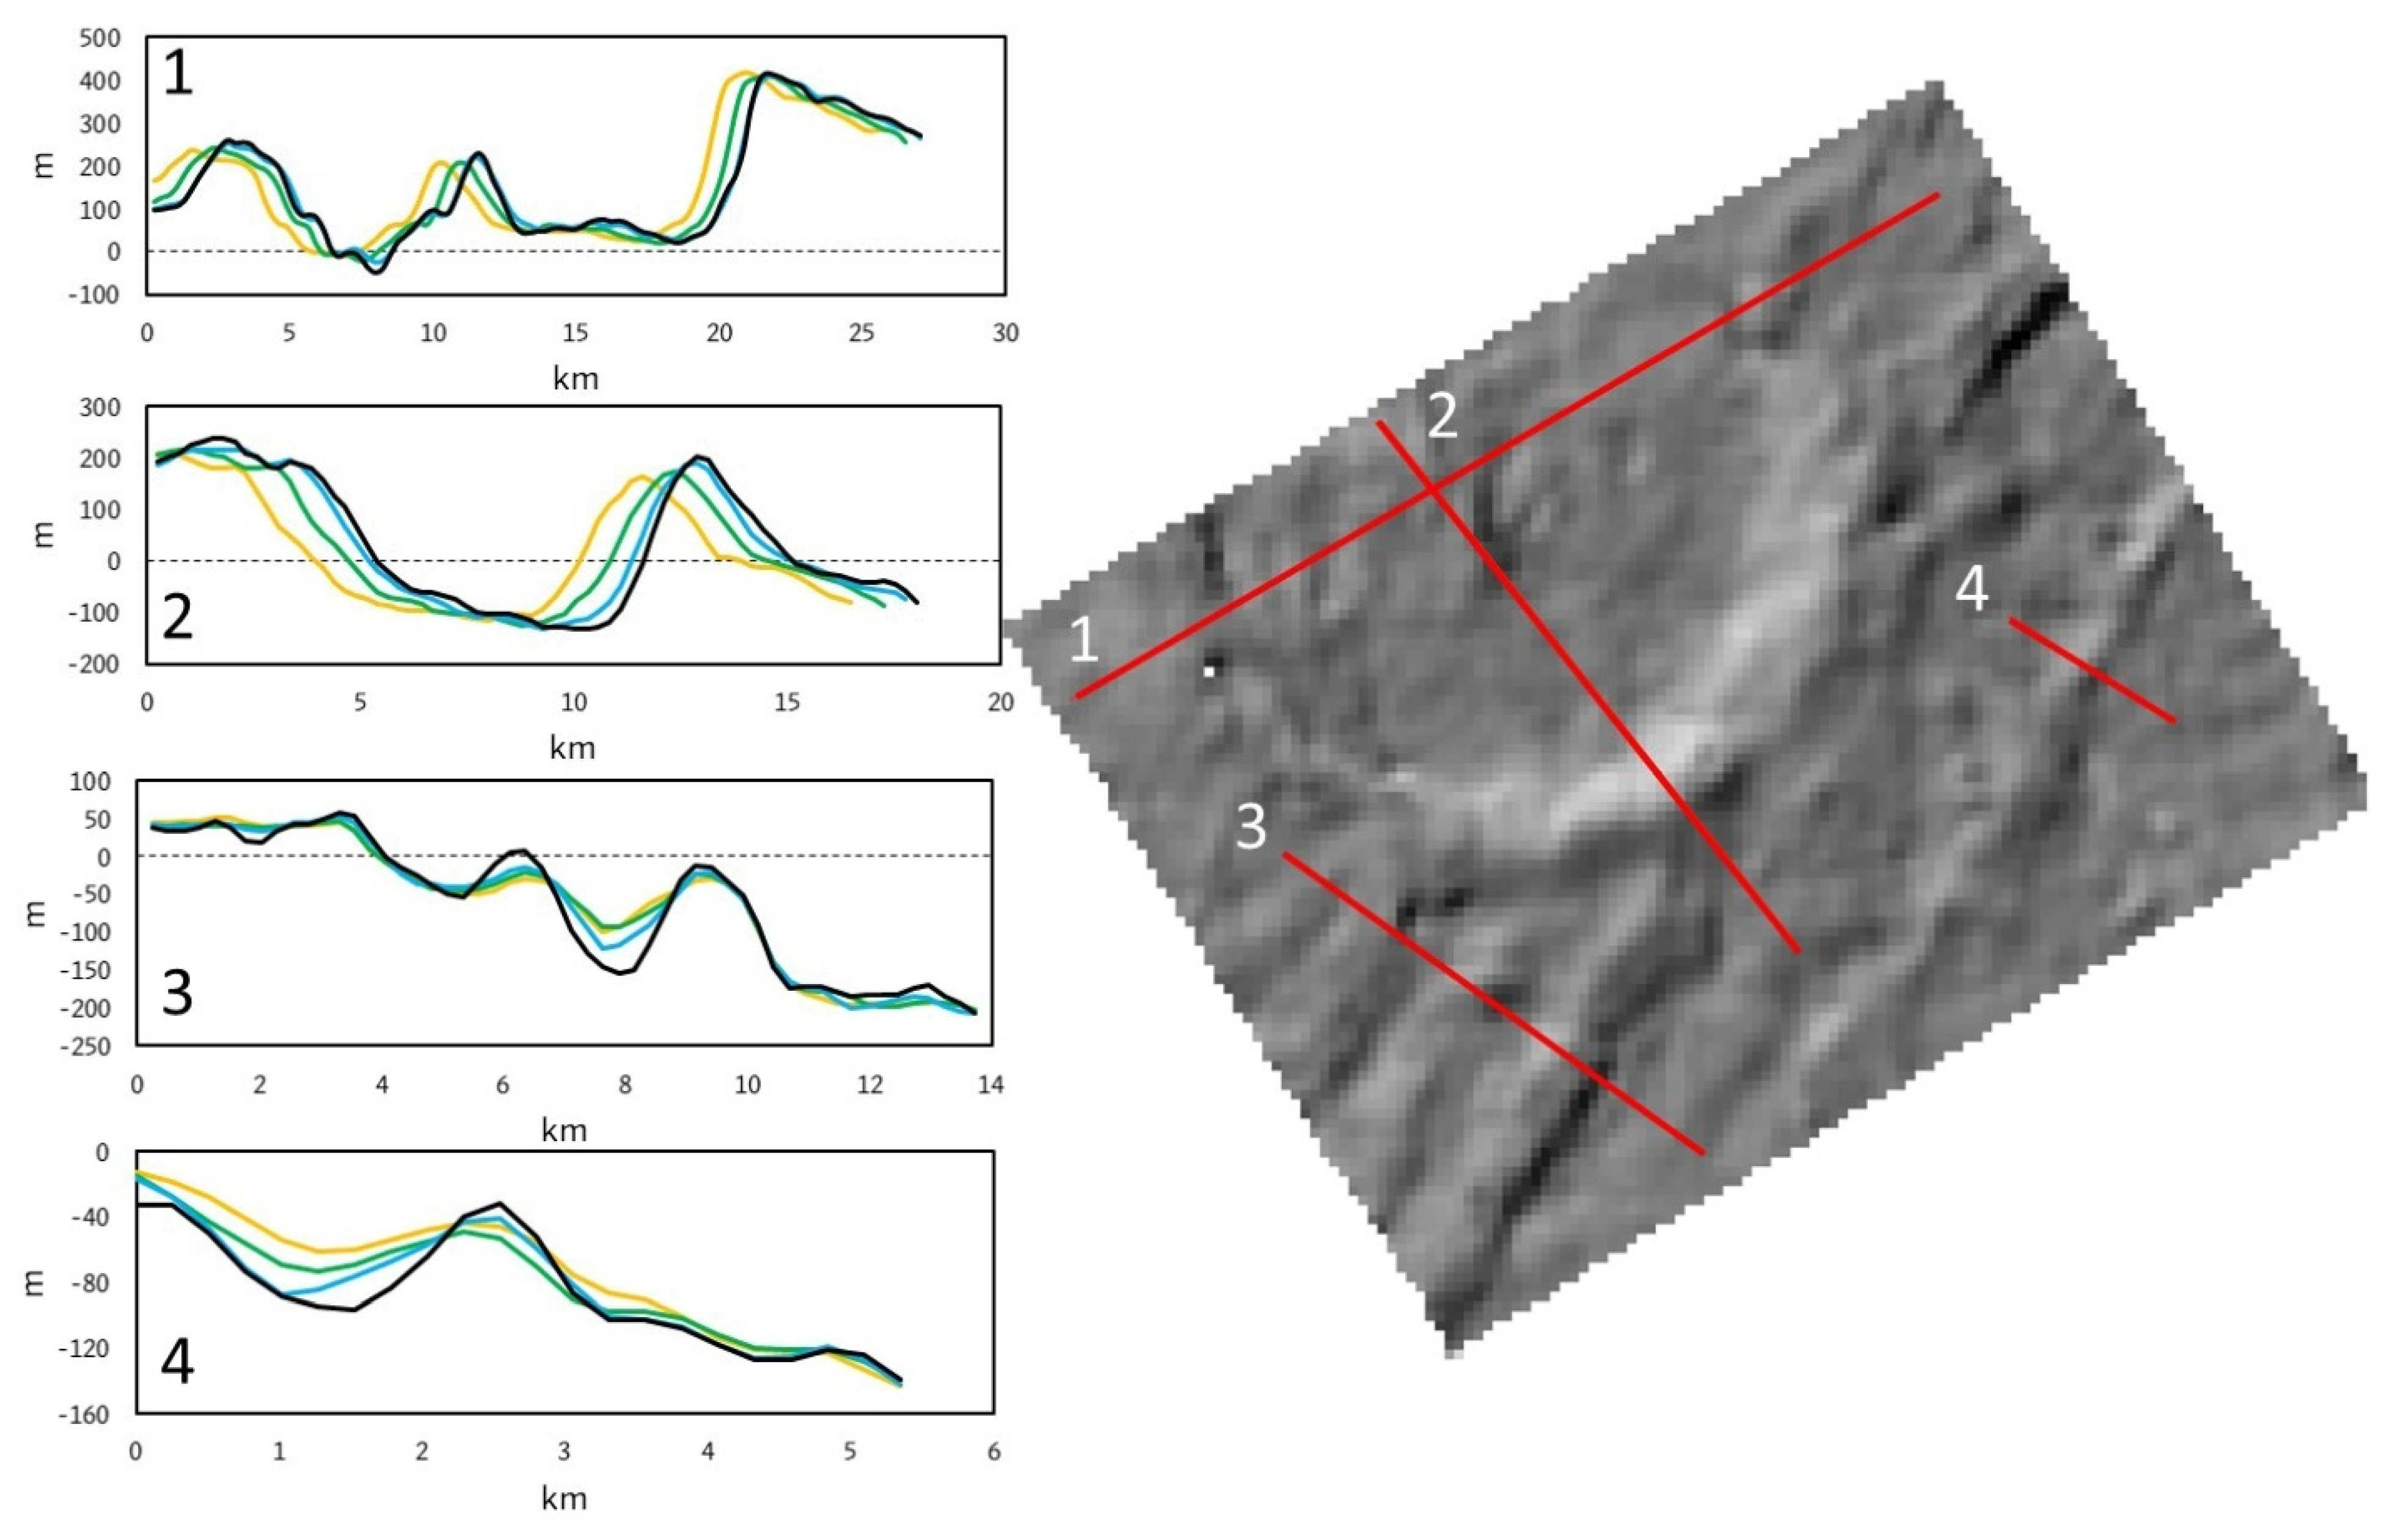
Figure 7 gives a sense of the variability between the two DTMs as they might be used for scientific analysis (e.g., crater morphometry or ridge height). The profiles extracted from the SOCET SET® DTM show more detail than those extracted from the ASP DTM, as expected given the smaller resolution of the SOCET SET® DTM. This is most clearly seen in profiles 1, 2, and 3, for which the overall shape of the crater is quite similar between the two DTMs, but the SOCET SET® DTM includes more short-wavelength topography. Using the three profiles that cross the crater (1, 2, and 3) to measure the crater depth (here defined as the relief between the highest point on the rim and the lowest point of the floor in the profile), we find differences as small as 13 m (the western rim from profile 3) and as large as 38 m (the eastern side of profile 3), which is larger than EPRMS and EPmax but similar to EPderived. The average rim height from the five measurements is quite similar: 322 m and 336 m for the SOCET SET® and ASP DTMs, respectively, a difference of just 14 m, which is well within both EPRMS and EPderived. Not surprisingly, averaging reduces the error, and at least in this specific case, using either DTM to measure crater depth is therefore likely to give a similar result, even if the detail of each profile differs by 20–30 m (differences less than EPderived).
Differences elsewhere in the DTMs are more substantial. The elevation of Cilix’s central peak in profile 3 differs by 51 m between the two DTMs, and the amplitude of the ridges in profile 6 varies by as much as 63 m. The average amplitude of the narrow ridge in profile 4 are similar (a difference in relief of 27 m occurs on the west side of the ridge), however the ridge is 700 m (two posts) narrower in the ASP DTM compared to the SOCET SET® DTM. These differences are similar to the 90th percentile absolute difference of ~60 m, and this emphasizes a key point. The EP is a statistical measure of the uncertainty, and we therefore expect differences of ~60 m in 10% of all samples. The EP (whether EPRMS, EPmax, or EPderived) should not be interpreted as an upper bound on the error in the DTM (i.e., elevations are not “known” to ±EP).

3.1.4. Slopes and Slope Statistics

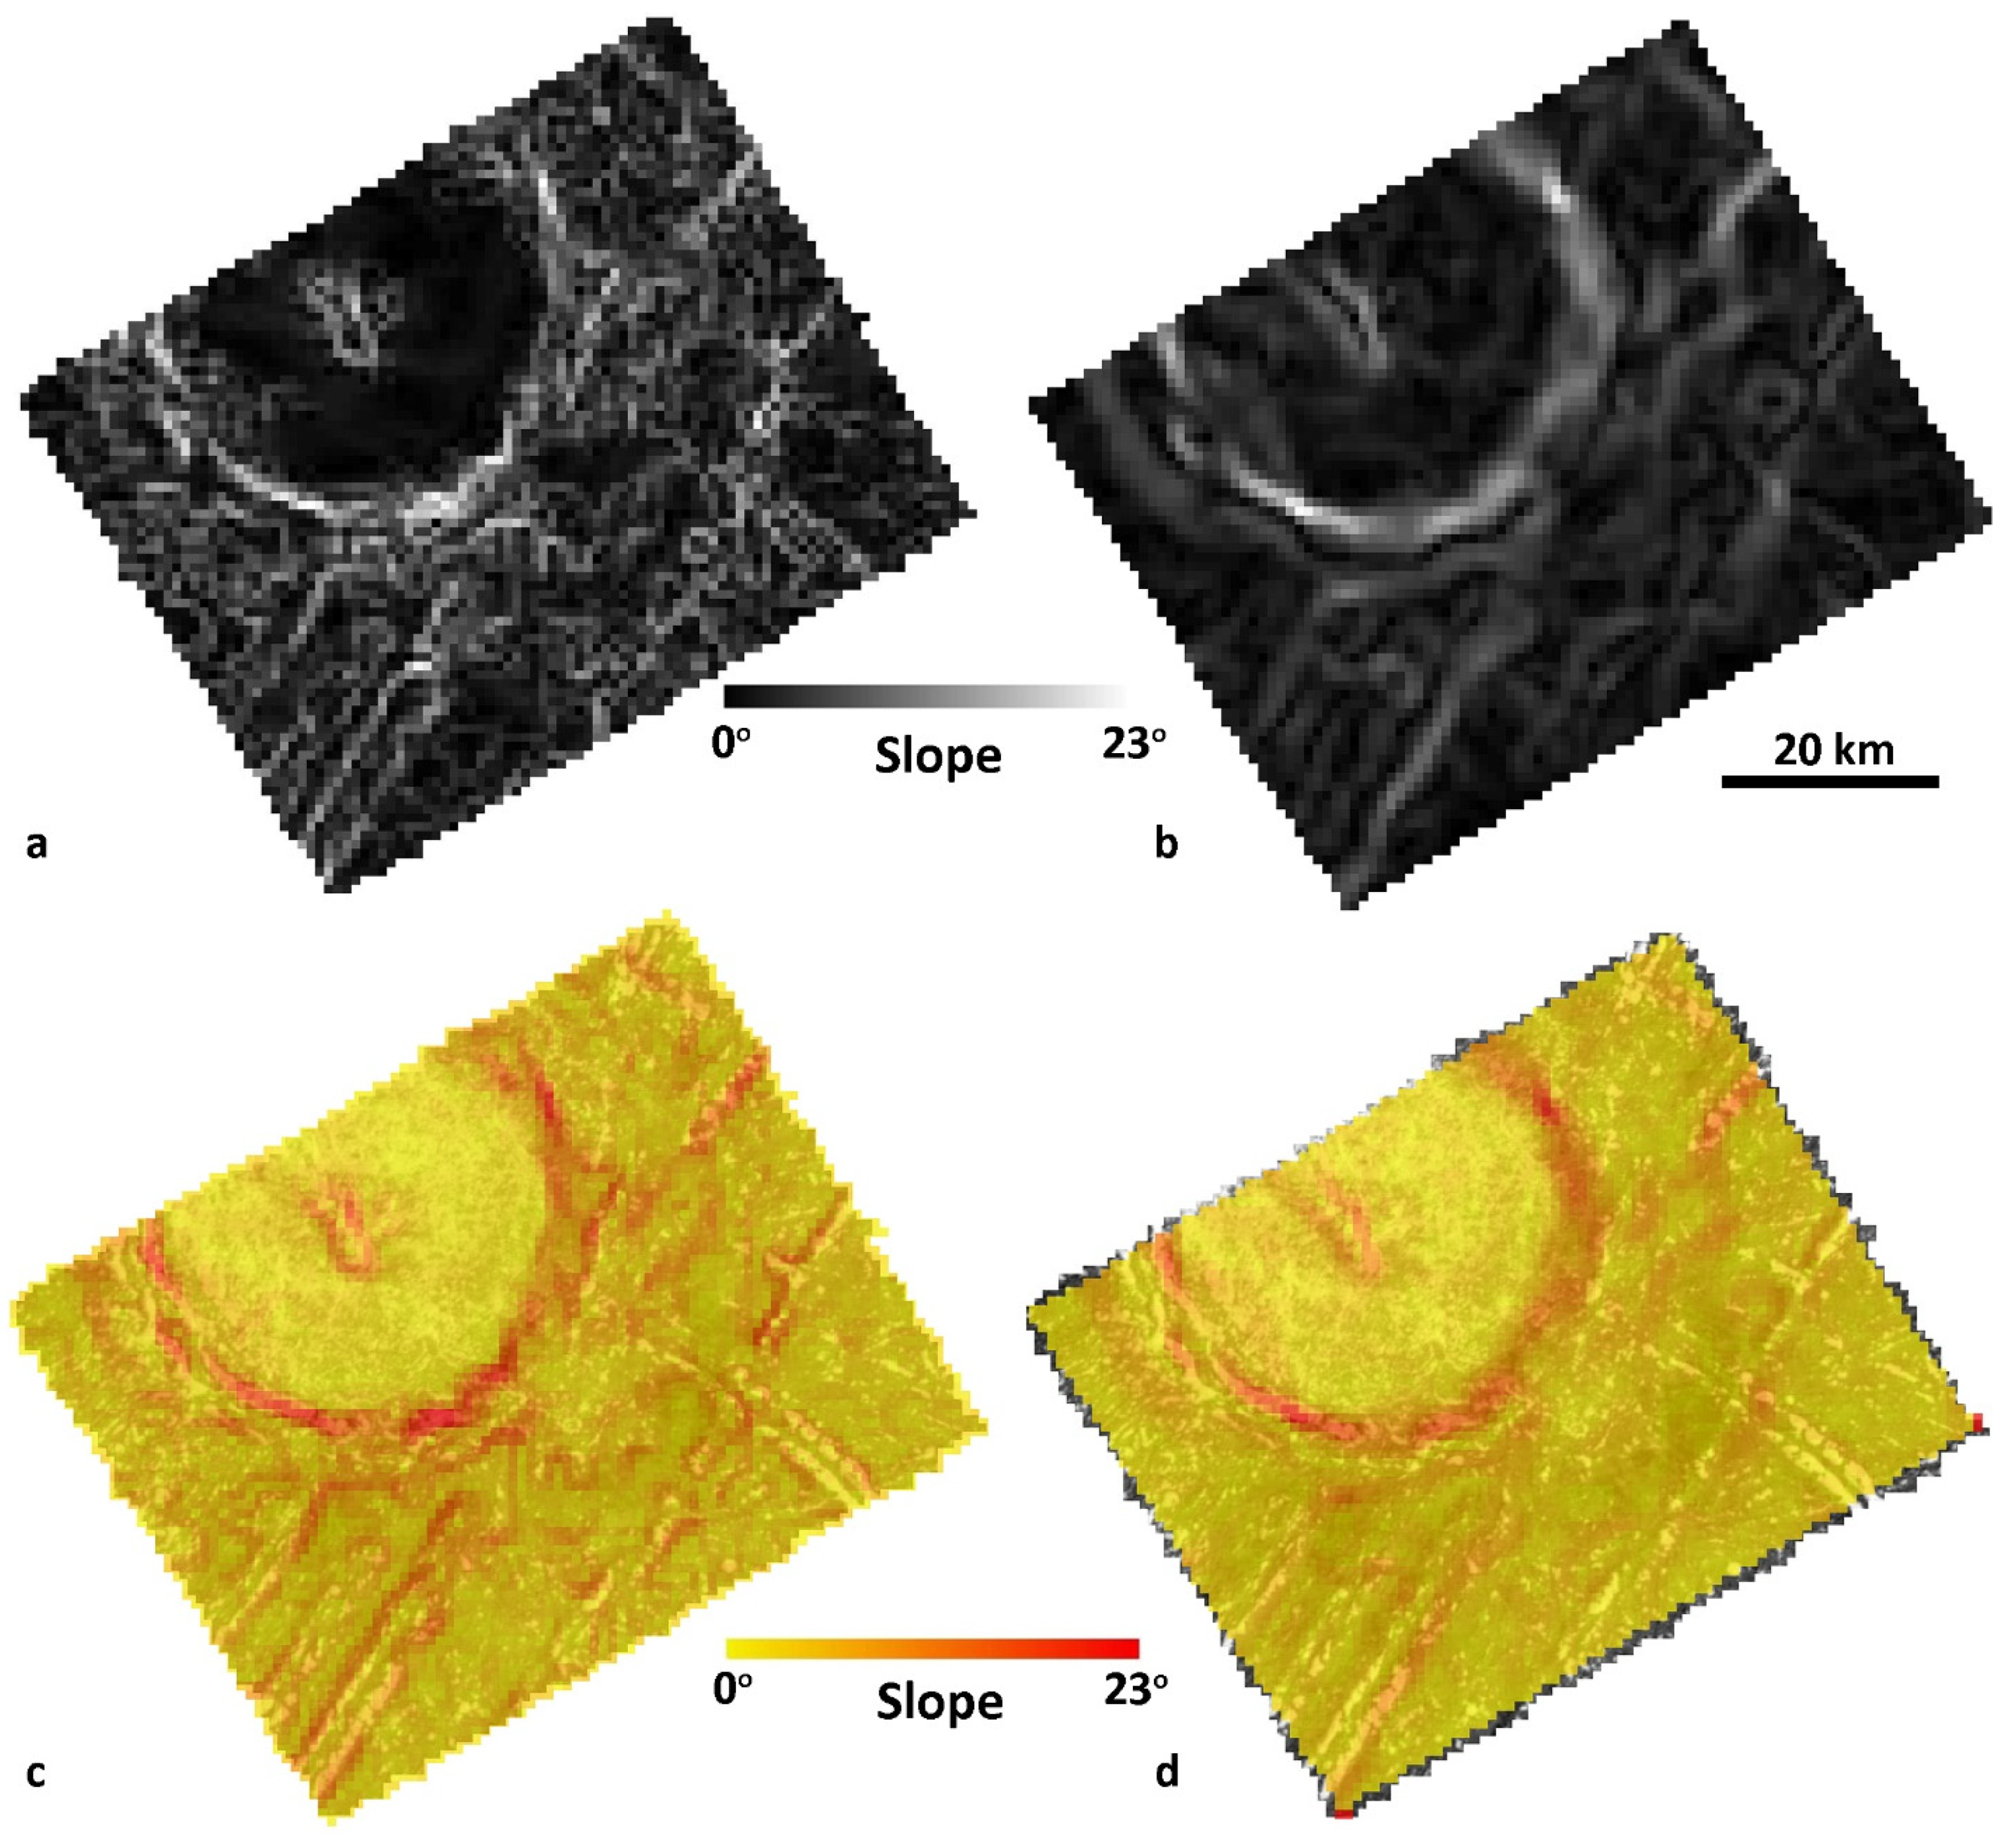
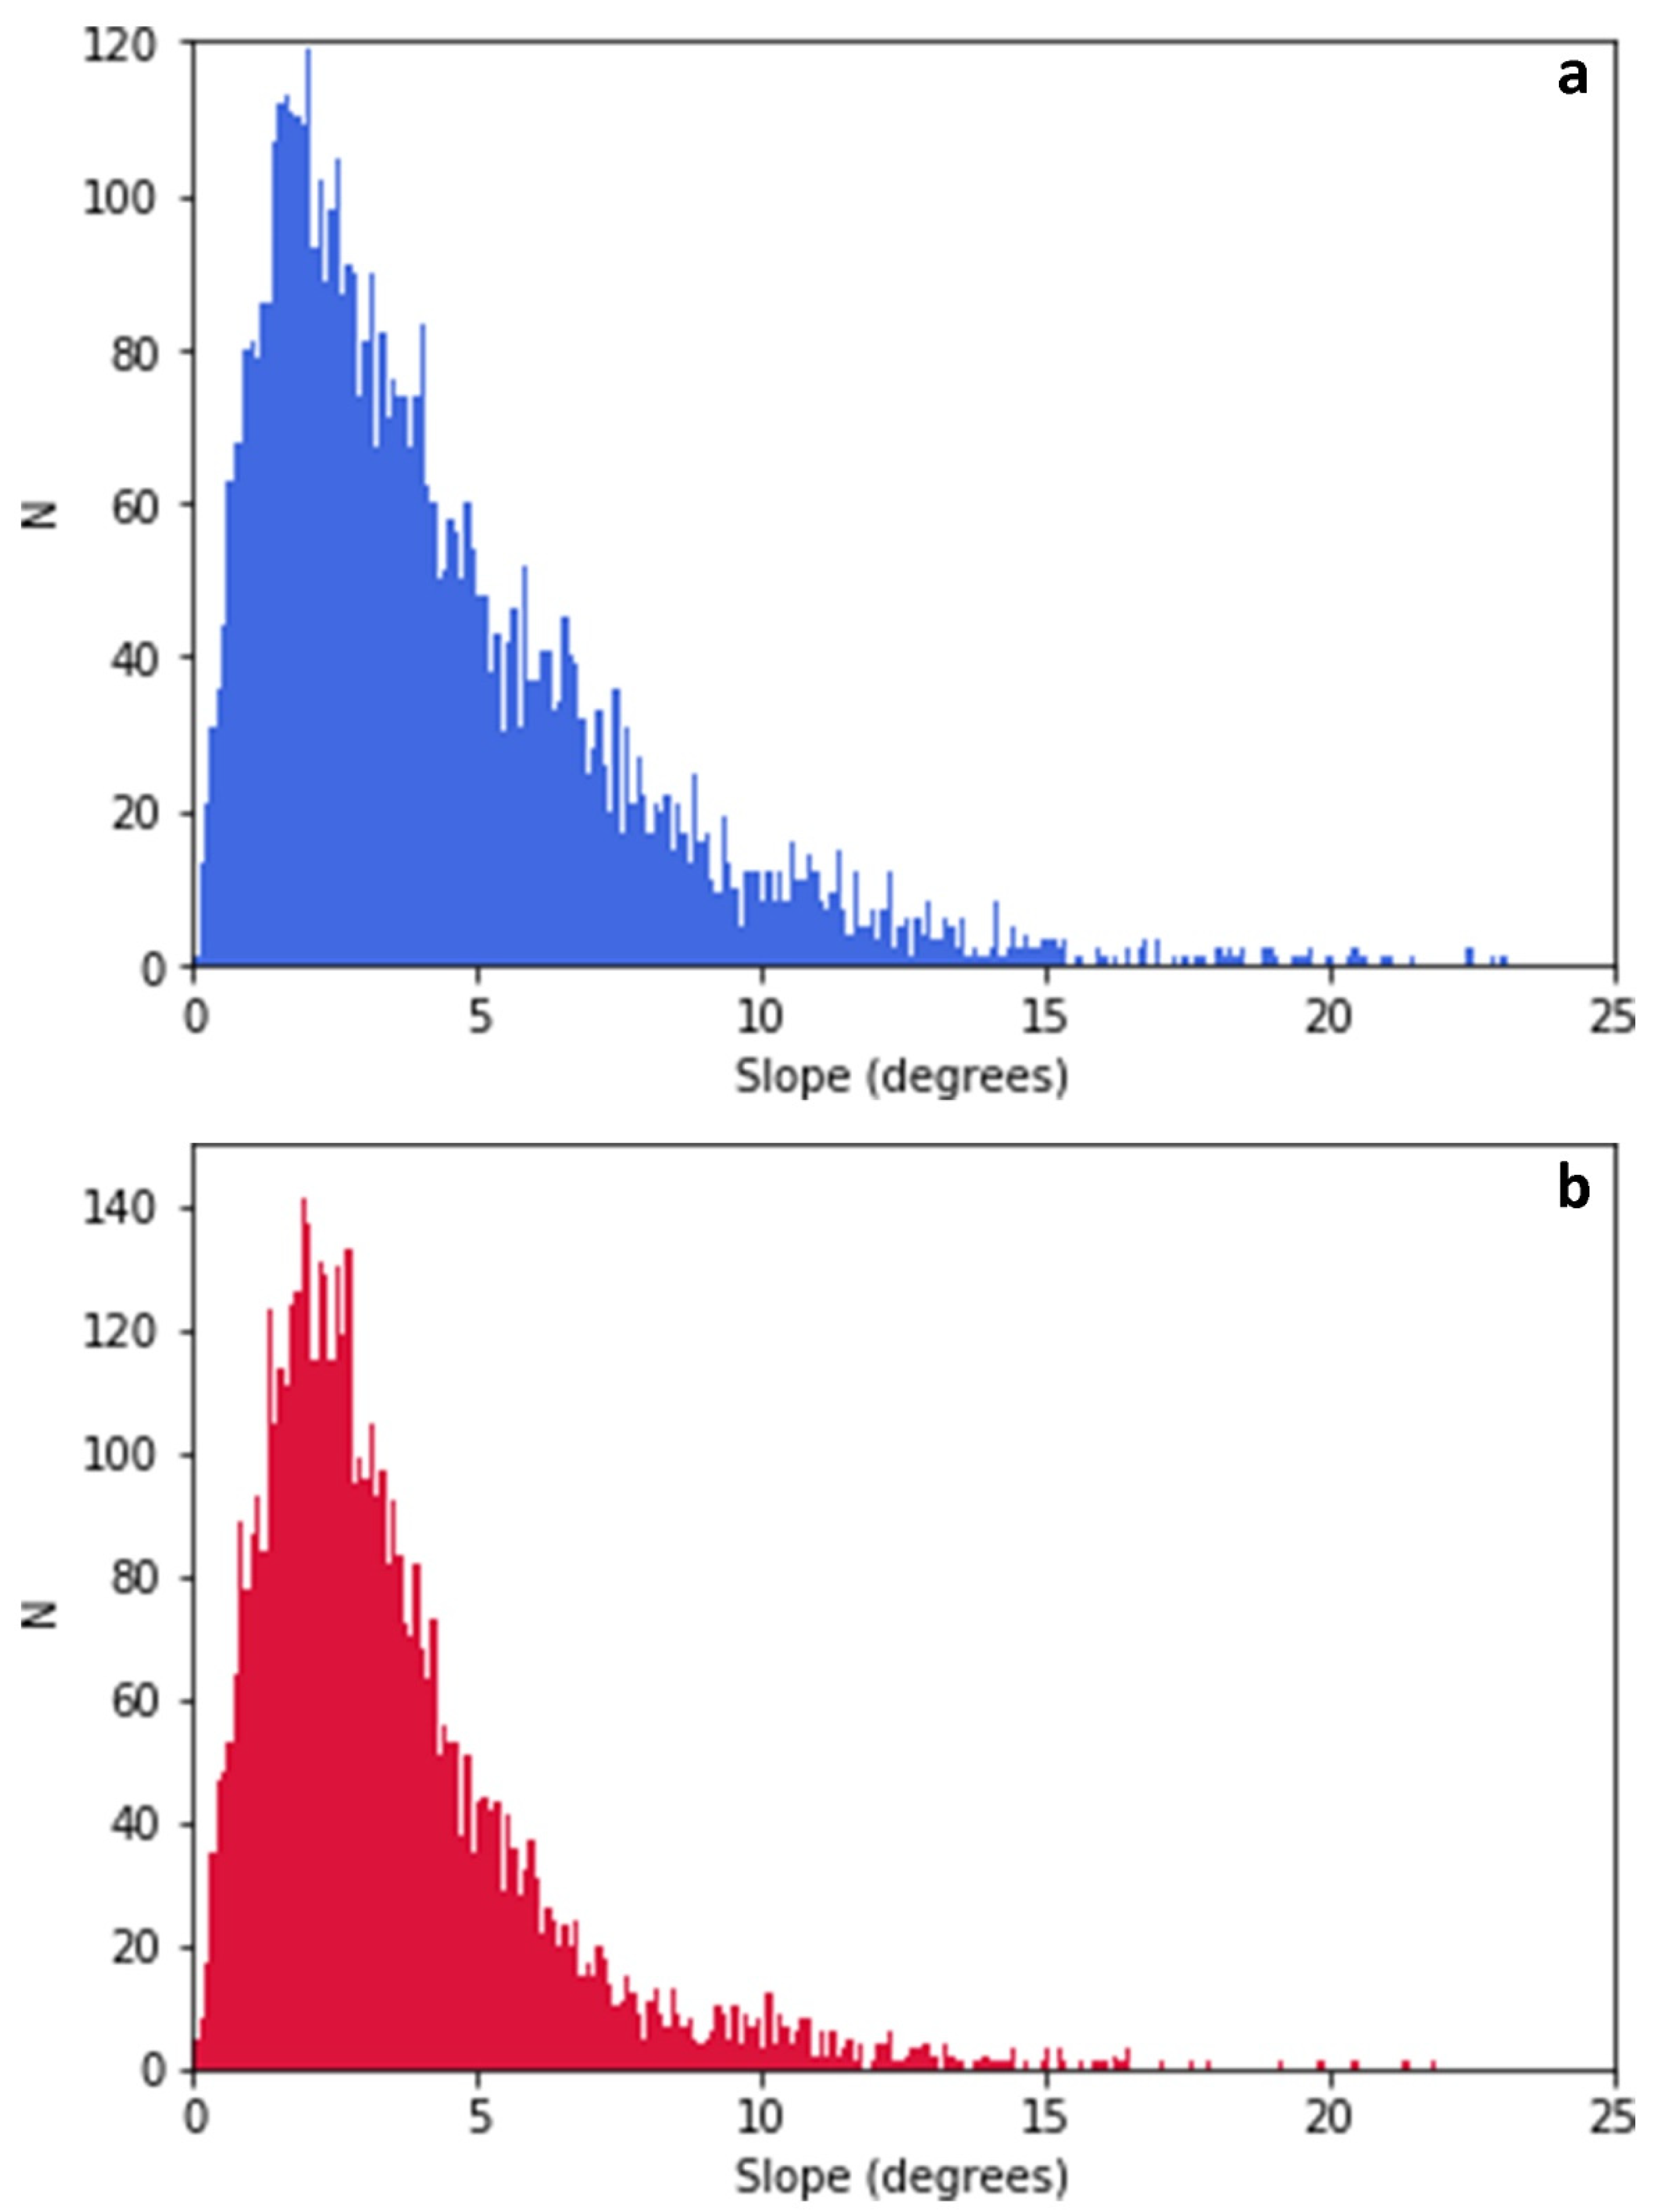
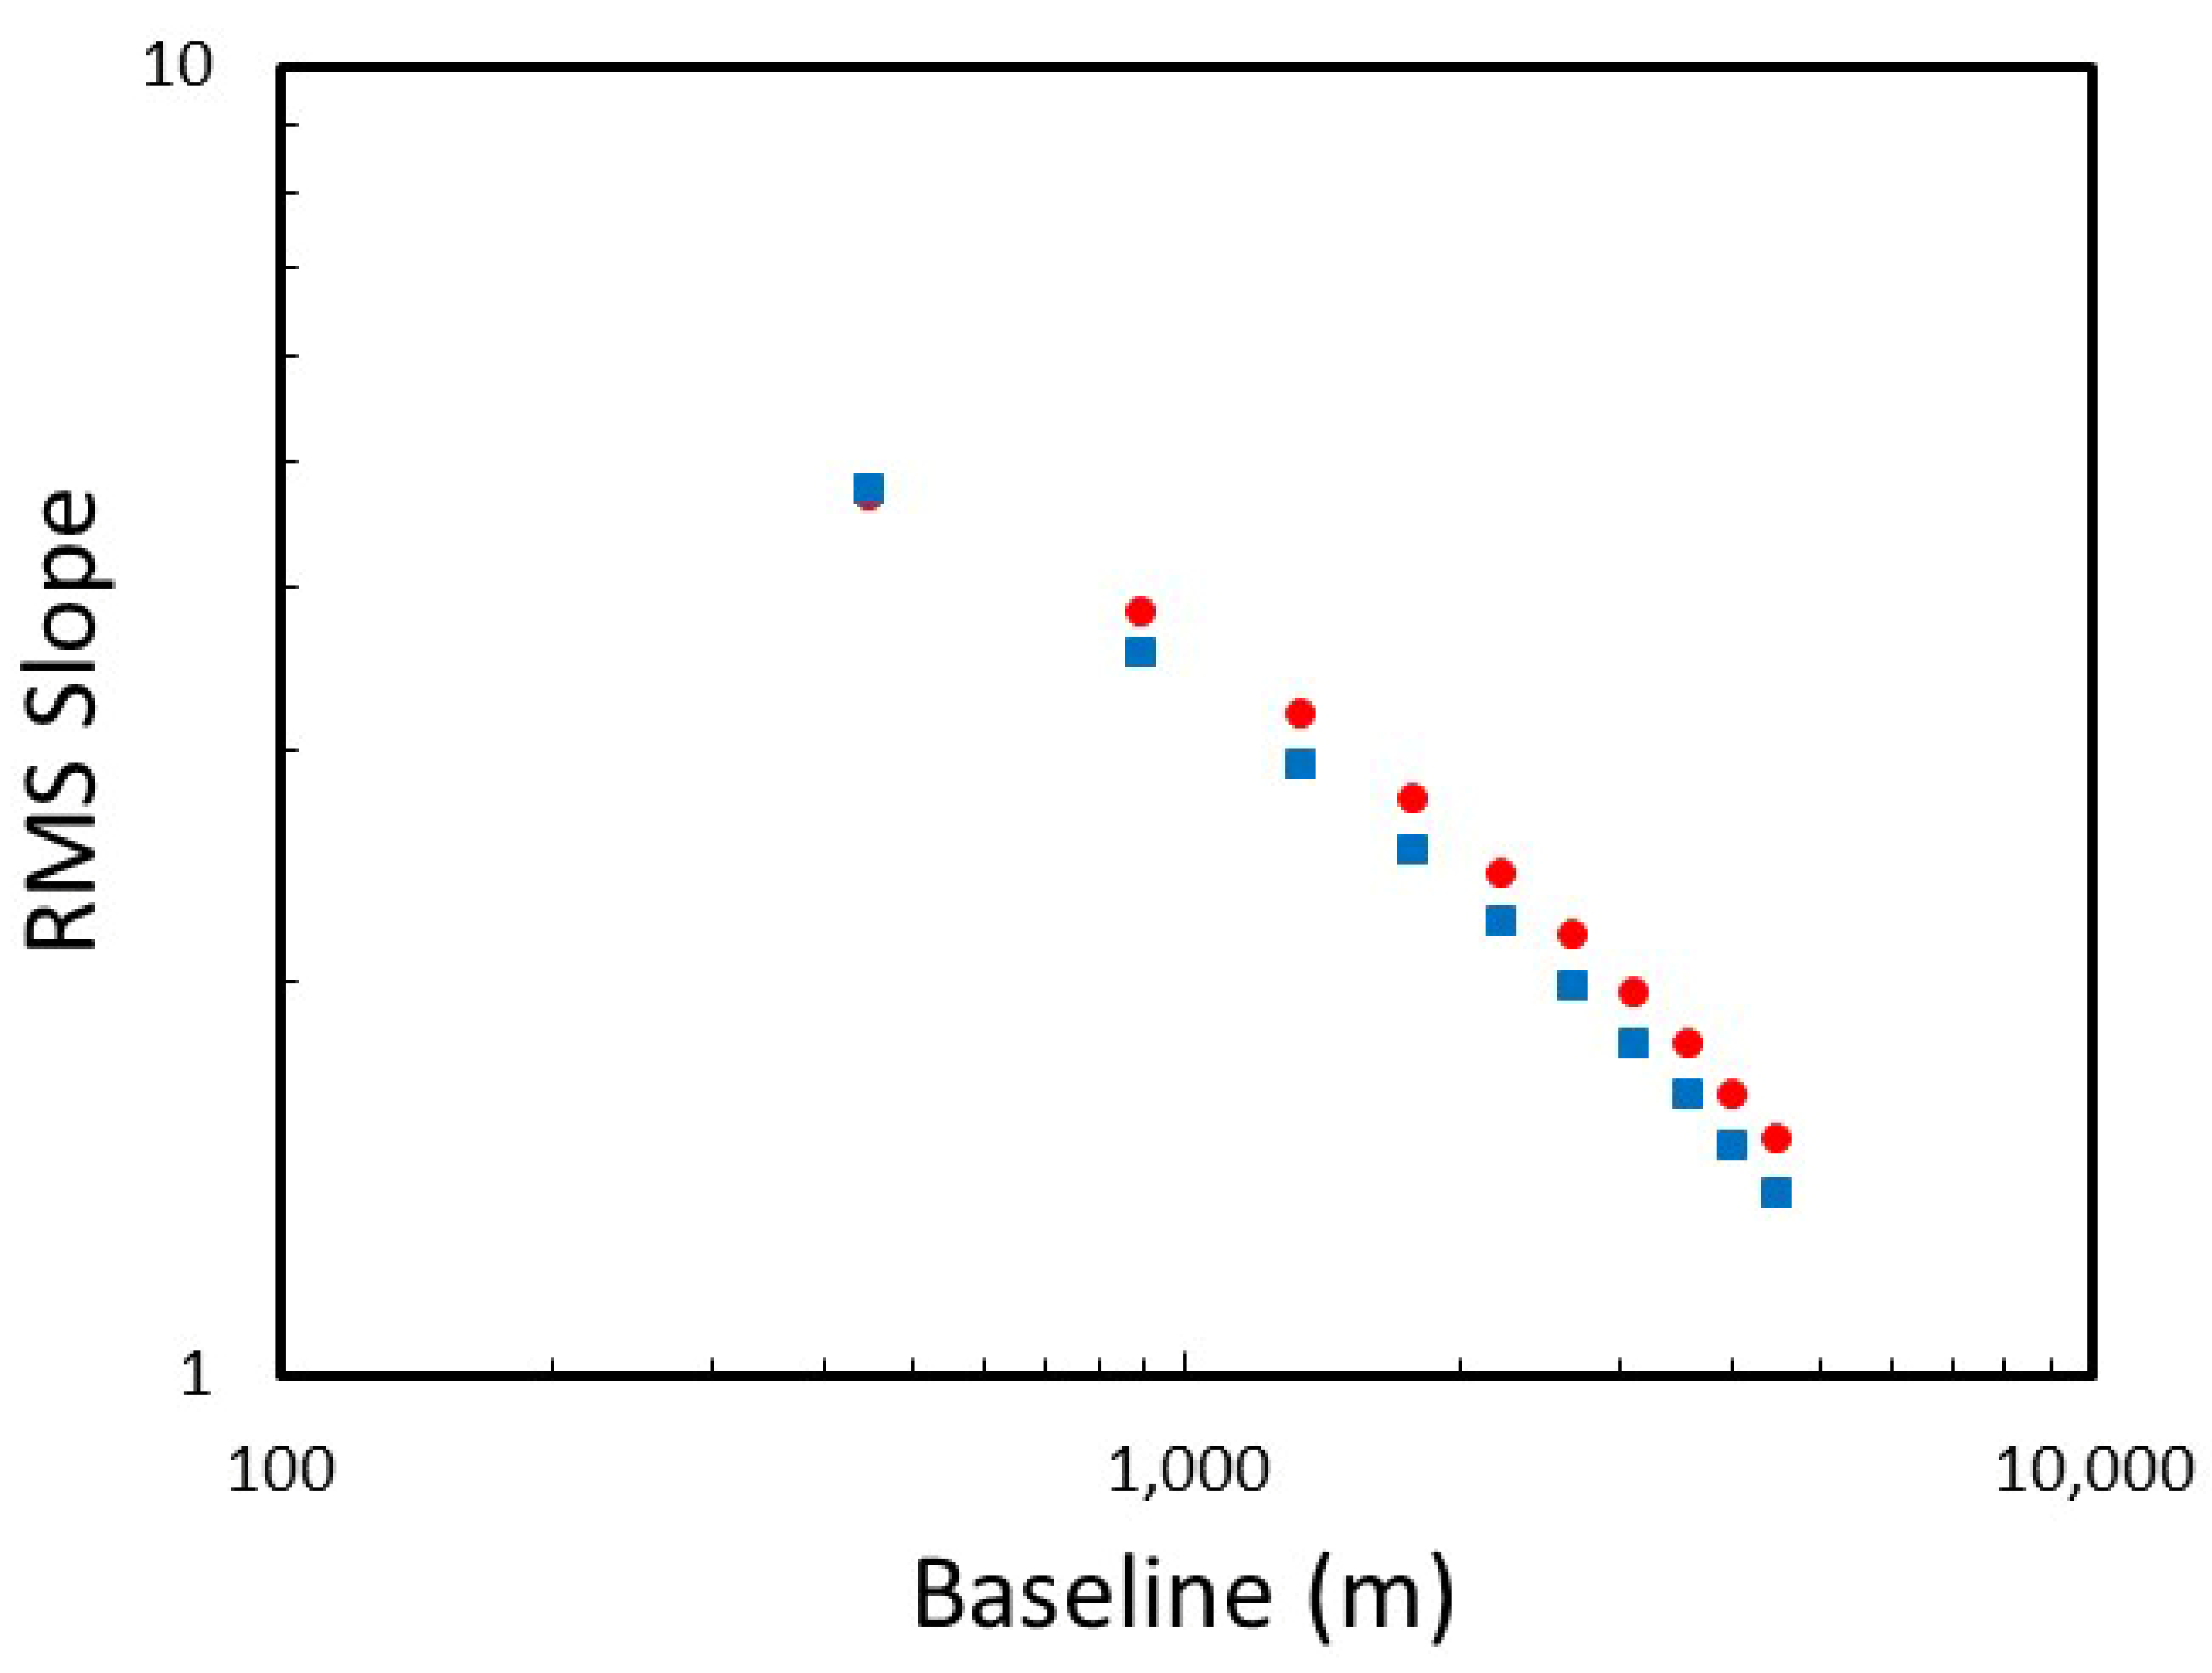
Uncertainty also extends to the slopes derived from the DTMs (Figure 8). Although the minimum and maximum one-pixel adirectional slopes derived from the two models are similar, the “rougher” terrain of the SOCET SET® DTM results in a substantially broader distribution of slopes and a larger one-pixel RMS slope of 5.4° compared to ASP’s 3.8° (Figure 9). This result is consistent with the smoother appearance of the ASP DTM compared to the SOCET SET® DTM. Figure 10 compares the RMS slope at different spatial scales for the SOCET SET® and ASP DTMs. Similar data have previously been interpreted in terms of planetary surface roughness [59]; and see [26,61] for application to Europa. At the shortest baselines, the two DTMs have very different RMS slopes as noted above. RMS slopes in the SOCET SET® DTM decrease more rapidly with an increasing baseline than those of the ASP DTM, such that at long baselines (10 DTM posts or 3.5 km), RMS slopes are similar between the two DTMs. The larger slopes at short baselines in the SOCET SET® DTM may be partly attributable to the manual editing of the DTM, which tends to focus on resolving small-scale features, which often have high slopes. The roll-off in slope at four DTMs posts in the ASP DTM is consistent with our estimated horizontal resolution for that DTM (also four posts). The absence of a similar roll-off in the SOCET SET® DTM suggests that features are nearly completely resolved to the one post level. However, we also note that SOCET SET®’s NGATE matcher is also known to produce blocky textures with somewhat exaggerated slopes for other datasets [23]. Longer-wavelength features are better resolved during DTM extraction, resulting in a better match between the DTMs at long baselines. We also note that alignment of the DTMs should remove slope differences at the very longest wavelengths (beyond those considered here).
The differences in RMS slope as a function of baseline between the two DTMs should provide a warning for investigations of slope characteristics on Europa, e.g., [26,61]. Fitting the RMS slopes to a power law and extrapolating to a 100-m baseline (roughly the GSD of the images) results in RMS slopes of 12.6° and 7.5° for the SOCET SET® and ASP DTMs, respectively. The 5° difference, which is driven only by how the DTMs were generated, may lead to different conclusions regarding Europa’s geology or lander safety.

3.2. Detailed Case Study 2: Chaos and Pits near Rhadamanthys Linea

Rhadamanthys Linea is a prominent, ~2000 km-long, northwest-southeast trending, low-albedo double ridge in Europa’s northern trailing anti-Jovian hemisphere. The northwestern portion of the ridge was well-imaged and transects a region with numerous small-scale (order 10 km in diameter) chaos and pits. The surface of Europa is covered with such chaos, spots, pits, and domes (sometimes collectively referred to as lenticulae). Chaos appears as regions of disrupted surface material (see review by [63]). Isolated patches of chaos range in size from a few kilometers (Figure 11) to ~100 km across (e.g., Conamara chaos), while even larger expanses of chaos terrain cover a substantial portion of Europa’s surface [64]. Spots are simply small, low-albedo regions. Pits and domes are isolated topographic depressions or rises (respectively) several kilometers in diameter that, in contrast to chaos, typically do not disrupt the surface (Figure 11). Chaos, pits, spots, and domes may all form by similar processes [65], although the nature of that process, and the link between these disparate features, has been debated [66]. The presence of melt, perhaps triggered by warm diapirs of clean ice partially melting an overlying layer of lower-melting-point ice, is likely involved [63,67].
Two moderate resolution sequences of images were acquired of the northwestern end of Rhadamanthys Linea, which provide high-quality stereo-pairs. The first sequence is part of Galileo’s pole-to-pole regional mapping campaign at 220° W longitude acquired during orbit E15. The second is a higher-resolution sequence of four overlapping images acquired during orbit E19. Image geometries are shown in Figure 11. For the DTM described here, we selected a single image from the pole-to-pole sequence with GSD = 232.1 m/pixel and paired it with a single higher-resolution image from the second sequence with GSD = 63.3 m/pixel. All image and stereo parameters are provided in Table 1. Assuming a priori that the pixel matching accuracy ρ is again 0.3 pixels, EPRMS = 39 m and EPmax= 53 m. For both SOCET SET® and ASP we first performed an initial bundle adjustment of the images in ISIS. The DTMs were extracted with a post spacing of 450 m, or roughly three times the GSDRMS.

3.2.1. Visual Inspection of DTMs and Hillshades: Smallest Observable Features, Blunders and Artifacts

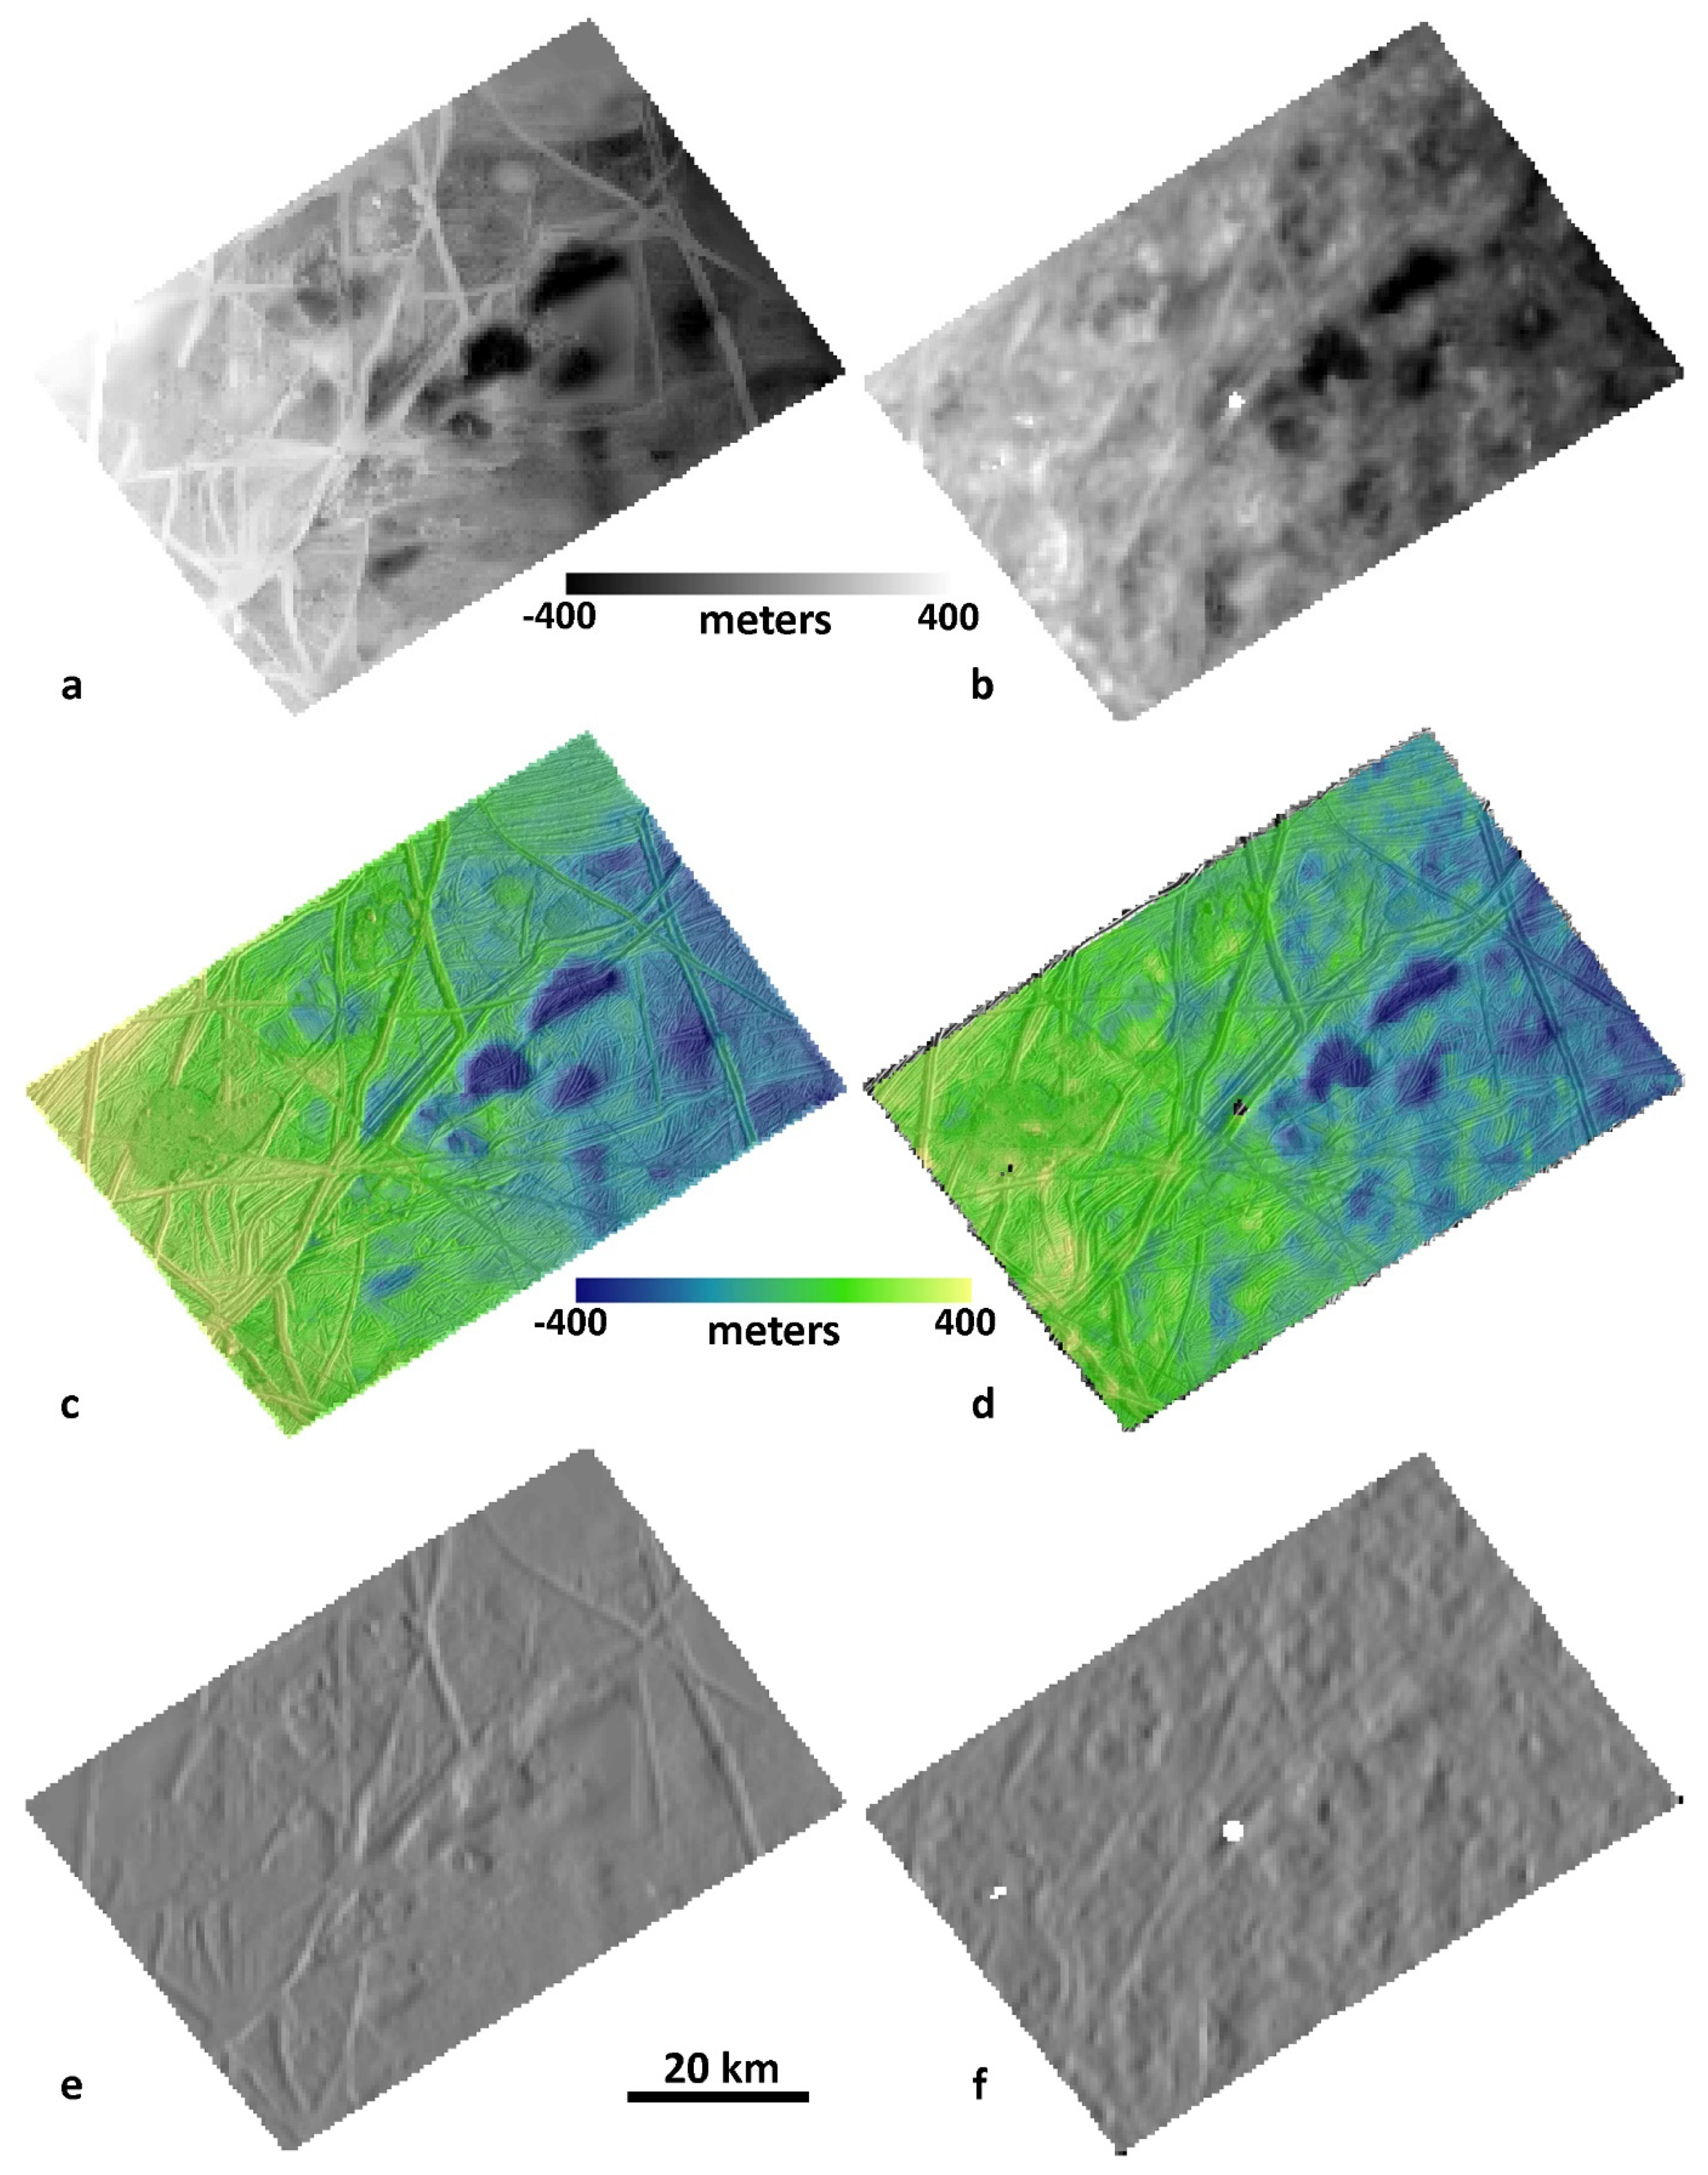
The DTMs and resulting hillshades are shown in Figure 12. Qualitatively, the SOCET SET® DTM (Figure 12a,c) resolves most of the largest ridges and deep pits in the scene. The smallest-scale features observable are relatively narrow ridges that are just two DTM posts wide (900 m). Interestingly, the two small chaos regions in the northern portion of the DTM are elevated relative to the surrounding terrain, but the larger chaos in the western corner has very little topographic signature. The DTM also reveals a substantial regional slope of ~600 m from west to east. It is impossible to determine whether this regional tilt is real without an absolute reference (such as laser altimetry). The same regional tilt is observed in the un-aligned ASP DTM discussed below (Figure 12b,d), although with slightly smaller amplitude (~500 m). Comparison of the SOCET SET® hillshade with the orthoimage reinforces the exceptional detail present in parts of the DTM, with pits, ridges and high-standing chaos all clearly visible. Despite this, numerous small-scale features (mostly ridges) visible in the orthoimage are absent in the hillshade suggesting that broad smooth areas exist where they almost certainly do not on Europa. Many of these are ridge complexes that are two to four DTM posts (900–1800 m) in width and with unknown relief. As with the DTM, the large western chaos is not apparent in the hillshade. The horizontal resolution of the SOCET SET® DTM is thus four DTM posts (1.8 km). Although smaller features (900 m) are in some cases resolved, there are also features at this scale that apparently are not. The resolution is thus 10.6 × GSDRMS and 7.8 × GSDmax.
The ASP DTM also clearly resolves the deepest pits and largest ridges near the center of the scene. Although it is more subtle, the small, high-standing chaos in the northern portion of the DTM are also observed. Overall, however, the ASP DTM reveals much less detail than the SOCET SET® DTM. The smallest identifiable features in the DTM are ~3 DTM posts across (1.4 km), but there are numerous features at this scale which are visible in the orthoimage but absent in the hillshade. The hillshade generally has a muddy appearance. There are fewer smooth areas compared to the SOCET SET® hillshade, but the textures apparent in the hillshade are difficult to correlate with real features in the orthoimage. The ASP DTM also includes a significant gap at its center and two smaller gaps to the west where stereo matching apparently failed. Despite the muddy appearance, essentially all features > 5 DTM posts (2.3 km) in their smallest dimension visible in the orthoimage are also apparent in the DTM. We therefore argue that the horizontal resolution of the ASP DTM is five posts, or 2.3 km, which is slightly larger (i.e., worse) than that of the SOCET SET® DTM. The resolution is 13.2 × GSDRMS and 9.7 × GSDmax (Table 2).
Although the SOCET SET® DTM appears to be more detailed than the ASP DTM, many of the differences are due to the editing capability of SOCET SET®. In Section 4.3 we show that, in some ways, the ASP DTM qualitatively outperforms the unedited SOCET SET® DTM. The capability to edit DTMs may be necessary when stereo quality is low and/or differences in GSD are large, as is the case here.

3.2.2. Difference Map and Statistics

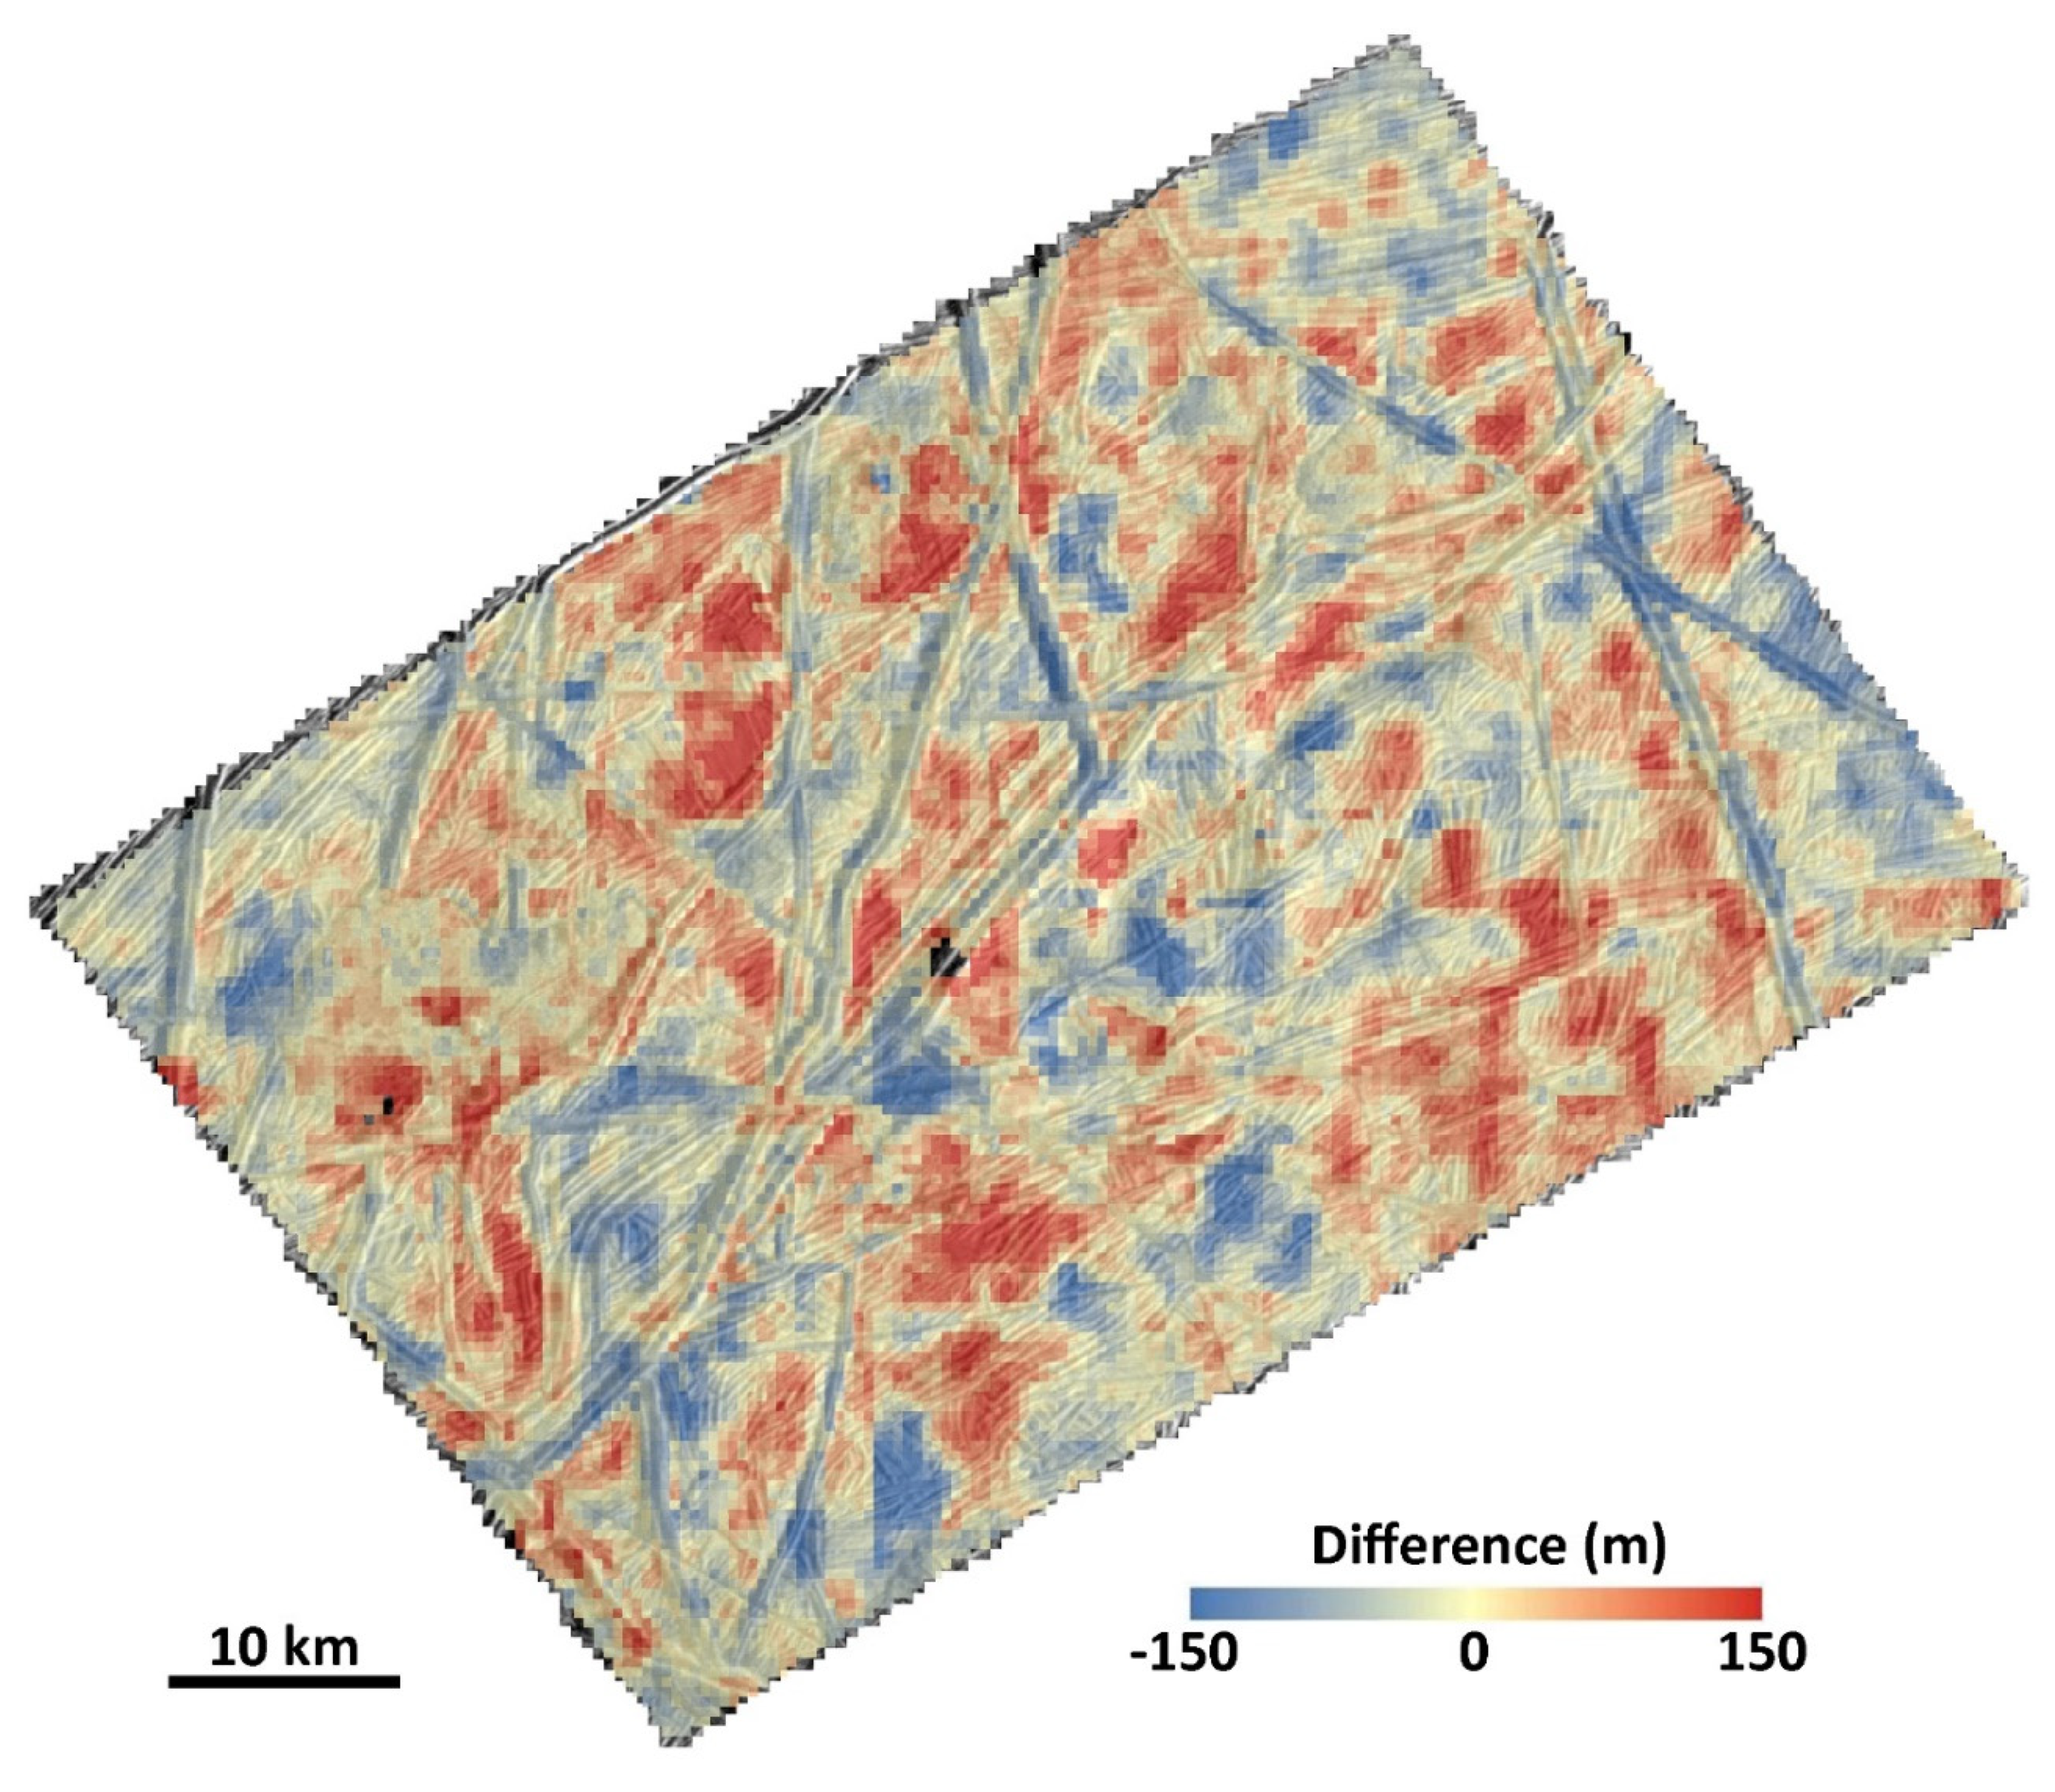
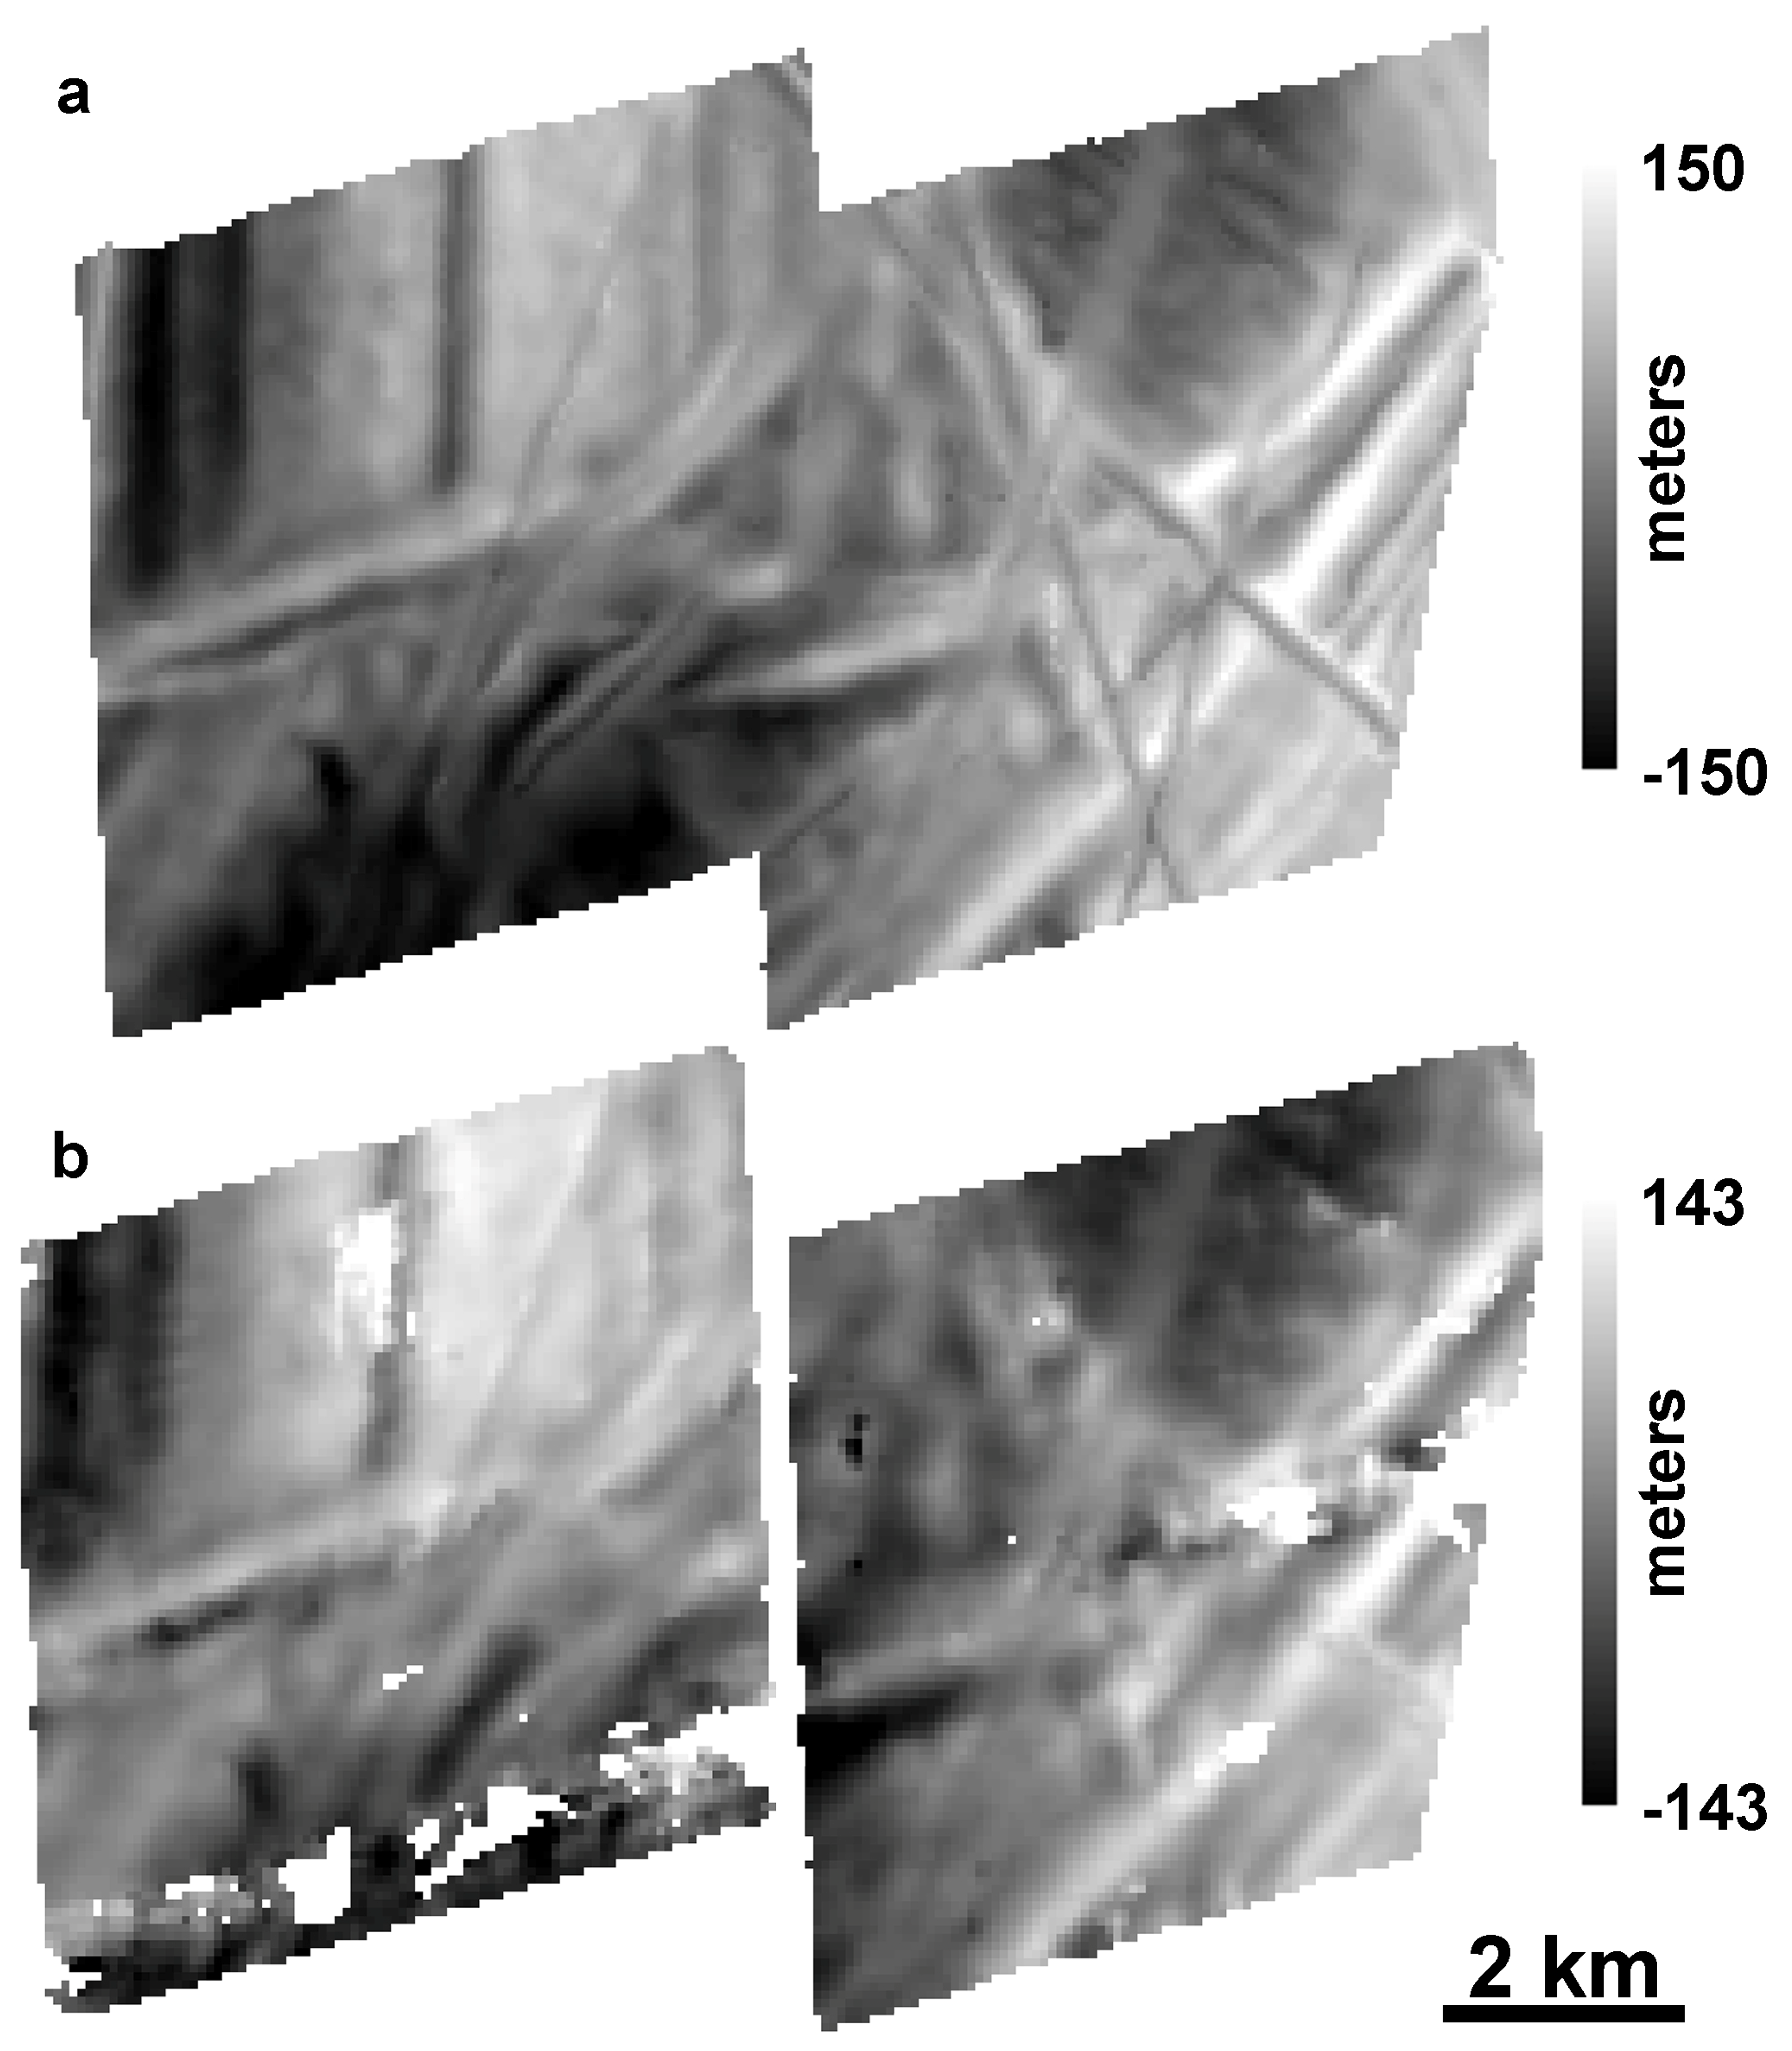
Figure 13 shows a map of the elevation differences between the two DTMs, and Figure 14 shows histograms of the distribution of differences (compared to a normal distribution) and the absolute value of the differences. The differences are large, with a median and maximum absolute difference of 41 m and 316 m, respectively. As observed for Cilix (Section 3.1), some of the differences correspond to real features. For example, many of the ridges appear blue because these appear in the SOCET SET® DTM but are completely absent in the ASP DTM. However, in this DTM many of the differences do not appear to be correlated with real features, giving the difference map a mottled appearance. In part, these differences may be due to the nature of Europa’s surface in this region. Examination of both the DTMs and the orthoimage suggests that the surface is lumpy or undulatory at the scale of ~10 km (e.g., subtle brightness variations are apparent in the orthoimage). These undulations are not correlated with surface features, consistent with the morphology of the more obvious pits, which contain undeformed ridged plains within them. The pits are simply the largest manifestation of these undulations. The SOCET SET® and ASP DTMs seem to have tracked these undulations with varying success, resulting in the substantial differences between the DTMs.
Whatever the cause, the difference map clearly indicates that differences between the DTMs can exceed 150 m, which is more than four times the EPRMS. The RMS absolute difference, EPderived, is 66 m, which is 1.7 × EPRMS and 1.2 × EPmax. The pixel matching accuracy is ρRMS = 0.5 pixels and ρmax = 0.4 pixels (Table 3). The 90th percentile absolute difference is 106 m or 1.61 × EPderived, which is again somewhat larger than that expected for a normal distribution (1.28 × EPderived). The product of resolution and matching accuracy is shown in Table 3, and is generally ~4–5 pixel2, consistent with Kirk et al. [23].
Although measurable differences exist, it is also important to note what is not different between the DTMs. In particular, both DTMs show similar topography (or lack thereof) for the chaos: both the largest one in the west and the smaller ones in the north. Additionally, the depths of the largest pits appear to be similar. These similarities are discussed further in Section 3.2.3.

3.2.3. Topographic Profiles

As described in Section 3.1.3, a more nuanced understanding of the differences between DTMs is provided by comparing individual topographic profiles. Figure 15 shows eight such profiles. Profiles across the deep pits (profile 5 and 6), which are perhaps the most-notable features in the scenes, show remarkably similar topography. The elevation of the floor of the largest pit (profile 5) differs by only 14 m, and the average pit depth (i.e., the relief) differs by approximately 30 m, which is less than the EPRMS of 39 m. Similarly, profile 6, which crosses multiple pits, shows elevation differences of ~20 m or less within the pit floors. For profile 6, the most significant differences are at the far northern end of the profile, where a chaos feature stands ~100 m higher in the SOCET SET® DTM than the ASP DTM, and at the far southern end of the profile, where the ASP DTM seems to not have resolved a depression that occurs in the SOCET SET® DTM. In these cases, a geologic analysis that required knowledge of the pit depth would come to similar conclusions independent of the DTM used. Many of the other profiles do not show such consistency. In the long northwest-southeast trending profile (profile 1), the ASP DTM reveals several tall peaks not readily apparent in the SOCET SET® profile. One of these peaks is correlated with a block of material in the large chaos region that was not resolved in the SOCET SET® DTM. In other portions of this profile, the two DTMs have simply resolved different ridges, and in one case the complex crossing of ridges in the SOCET SET® DTM obscures the topography in a 2D profile, which is more apparent in the ASP DTM in which fewer ridges are resolved. In any case, elevation differences of >100 m occur, and differences >70 m are common. These differences are two to three times the EPRMS and EPmax, respectively, and somewhat larger than EPderived, again indicating that the latter is a more appropriate measure of DTM precision. Similar differences are observed in the other profiles as well (e.g., profile 3 and 8 in particular), and differences of ~100 m are common in these cases. As we noted in Section 3.1.3, differences of this size (90th percentile) are not unexpected. These profiles are consistent with the difference map in Figure 13, which indicated differences between the two DTMs that do not correlate with features in the orthoimage.

3.2.4. Slopes and Slope Statistics

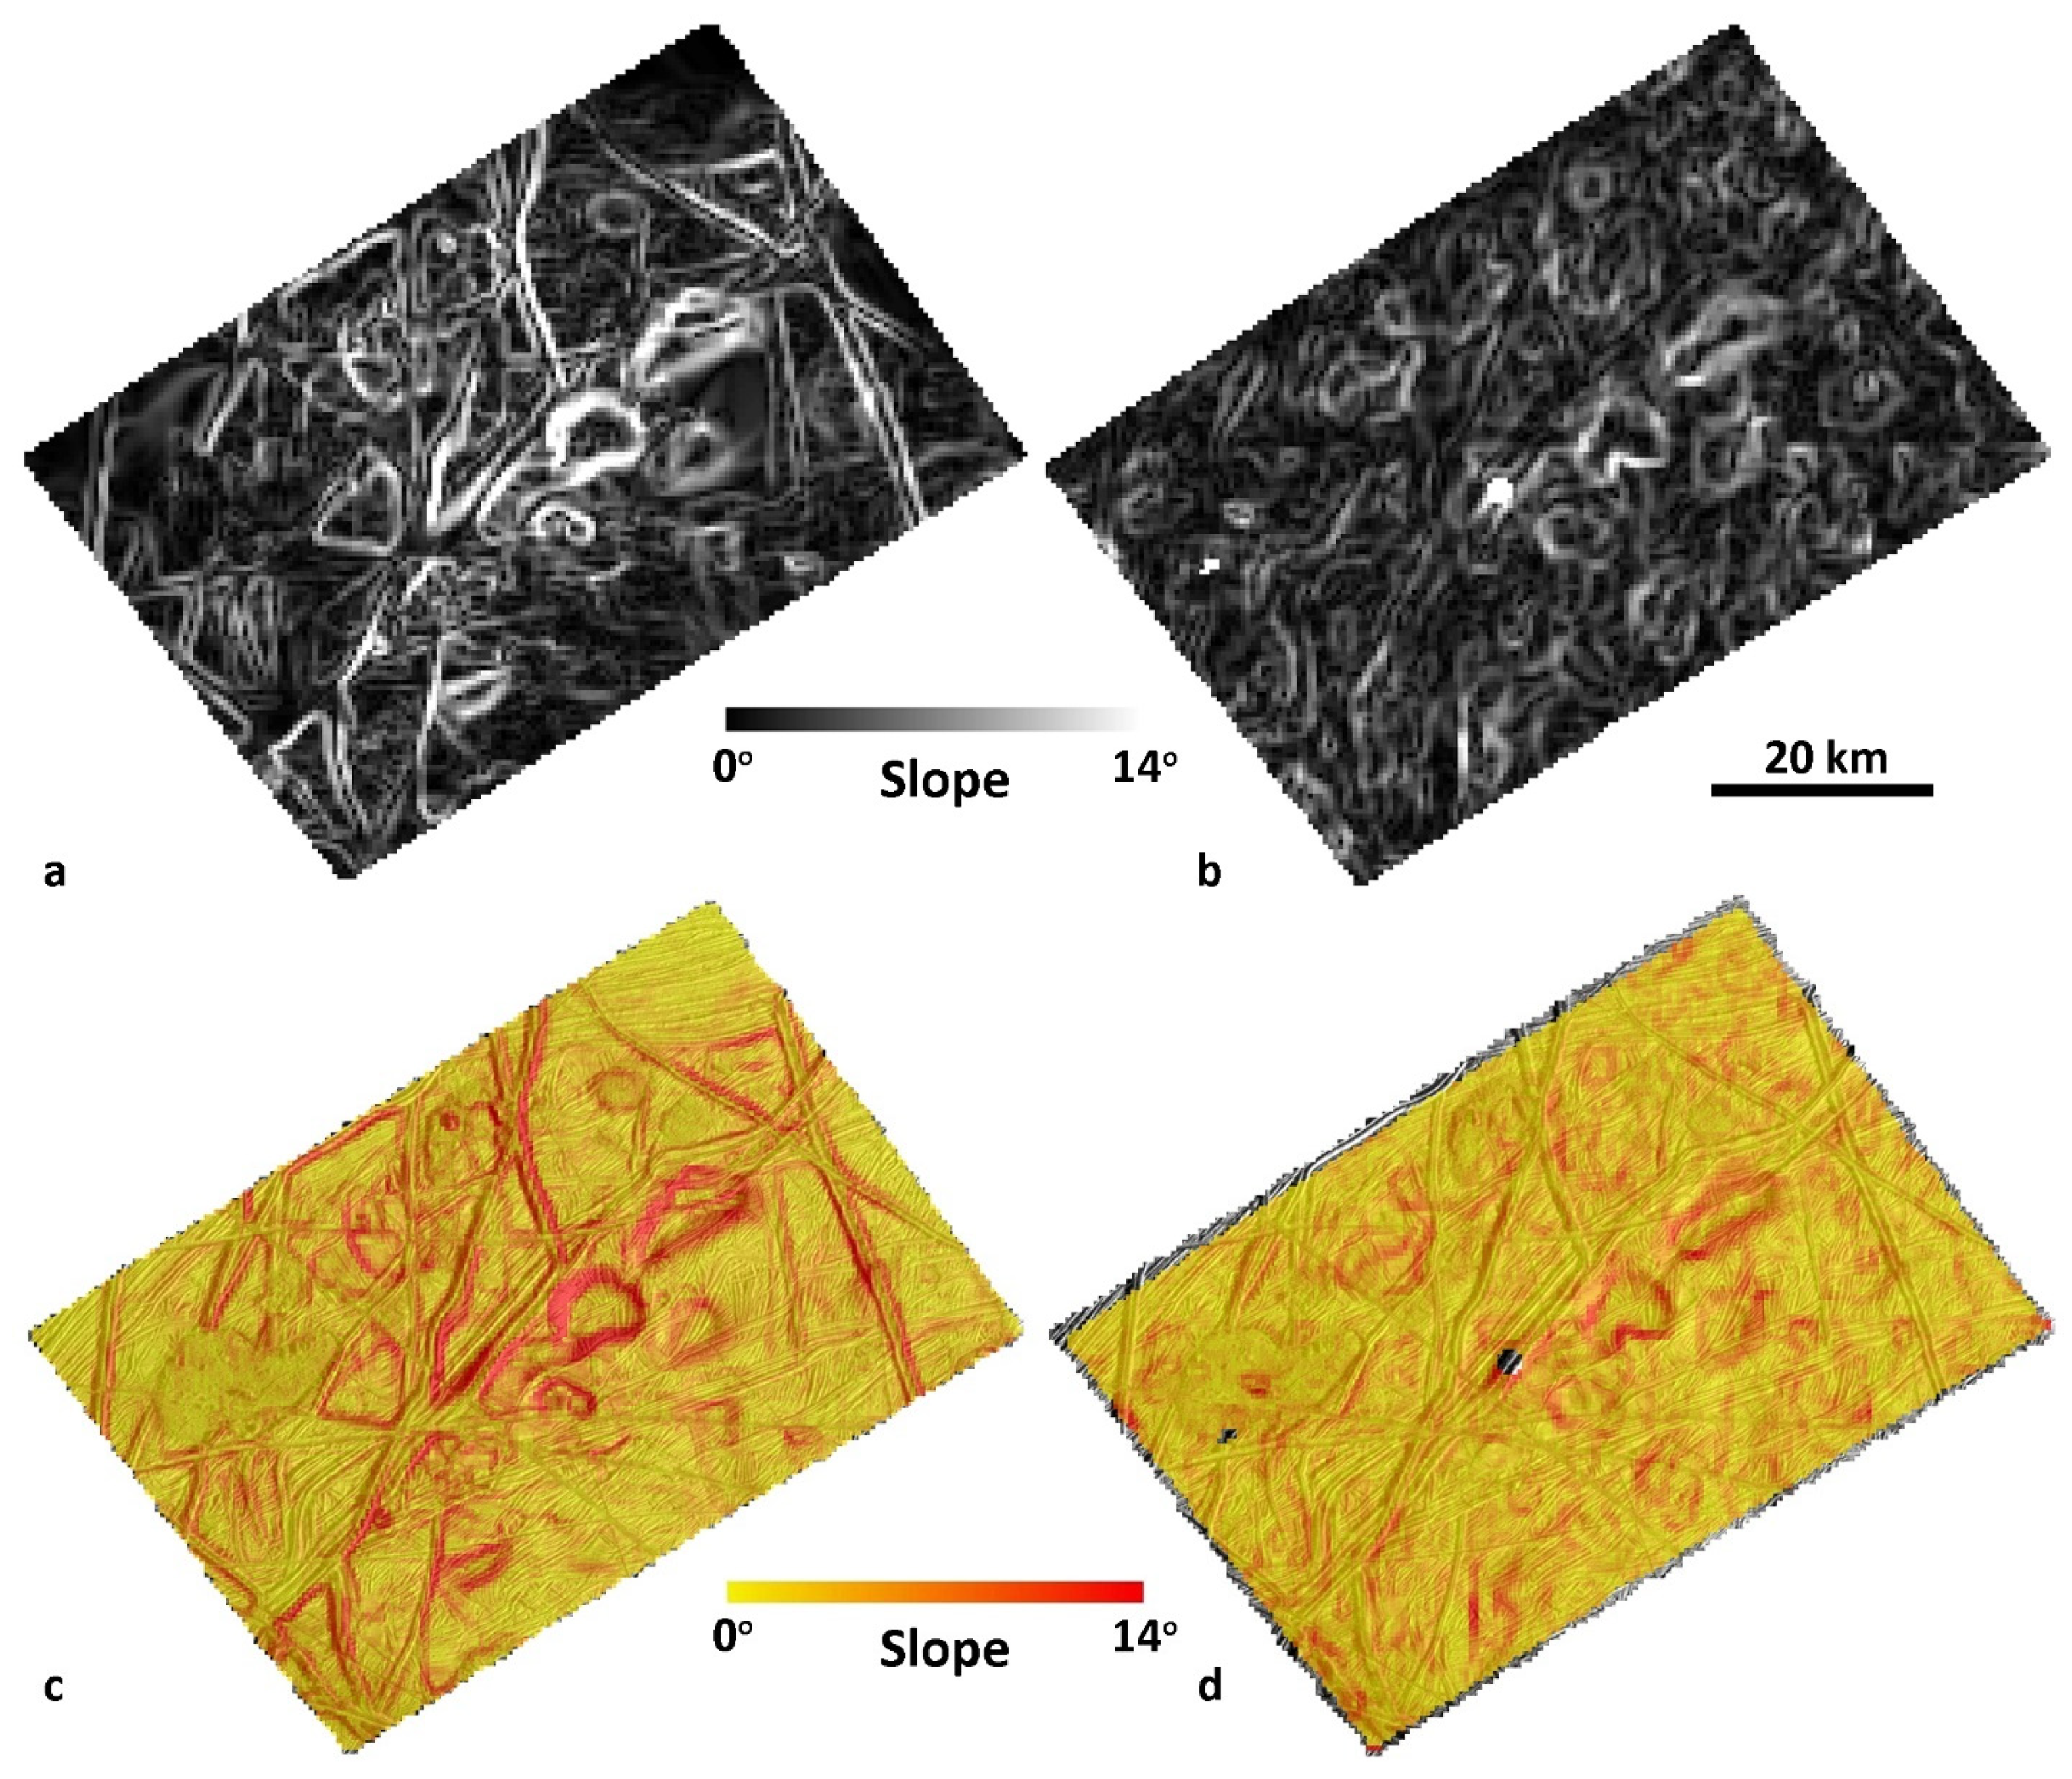
Figure 16 shows the one-pixel adirectional slope maps for the two DTMs. Slopes in the SOCET SET® DTM are strongly correlated with image features (again largely due to manual editing), with ridge slopes exceeding 14° and slopes along pit walls of 10° (the maximum slope was 17.9°). Despite these large slopes, many regions of the DTM have slopes of less than 2° and the distribution of slopes is strongly peaked near 1.1° (Figure 17). The RMS slope is 3.66°, and the 90% slope is just 6.0°. Slopes in the ASP DTM are less obviously correlated with features, and slopes at ridges and pit walls are lower than in the SOCET SET® DTM. However, the ASP DTM contains fewer “flat” regions, and thus the RMS slope is higher (4.0°) than in the SOCET SET® DTM. The distribution of slopes is correspondingly much broader for the ASP DTM, with a peak near 2.3°. The 90% slope of the ASP DTM is 6.2°, similar to that of the SOCET SET® DTM.
Despite these differences, the scale-dependent slope characteristics derived from the two DTMs are similar at all baselines (Figure 18). RMS slopes from both DTMs decrease at a similar rate as the baseline increases from 450 m (one pixel) to 4.5 km (10 pixels). Unlike our Cilix results, however, the RMS slopes differ slightly even at the longest baselines, and in fact are most similar at short baselines. RMS slopes derived from the ASP DTM are consistently higher than those of the SOCET SET® DTM. The result is intriguing and contrasts the slope characteristics of the Cilix (Section 3.1.4) and Pwyll (discussed in Section 3.3.1 below) DTMs, in which slopes from the SOCET SET® DTM are larger at a short baseline. In those cases, larger slopes were attributed to manual editing, which accentuates small-scale features with large slopes (e.g., steep scarp faces). In this case, the SOCET SET® DTM simply is flatter at all scales, relative to the ASP DTM. This may result from the terrain-dependent behavior of SOCET SET’s® NGATE matching algorithm described in Kirk et al. [23]. The matcher attempts to allow rough terrain to be expressed, so that it smooths both errors and real topography less in rough areas and more in relatively smooth ones (such as these undulations).

3.3. DTMs of Pwyll Crater, Ridged Plains, and Agenor Linea: A summary

In addition to the two case studies described in detail above, SOCET SET® and ASP DTMs were also generated for Pwyll crater, and a region of ridged plains, and additional comparisons were performed. A SOCET SET® DTM of Agenor Linea was also generated and evaluated. For the sake of brevity, we summarize those results in the sections below.

3.3.1. Pwyll Crater

Pwyll is a 26.6-km diameter crater located in Europa’s trailing hemisphere (Figure 2). The crater is distinctive in global imaging of Europa due to its dark floor and inner continuous ejecta blanket, but extensive bright outer continuous and discontinuous ejecta blanket, the latter of which extends more than 1000 km from the crater. The bright ejecta indicates that Pwyll formed recently, but unlike Cilix and similarly sized craters on Ganymede, the rim of the crater is poorly preserved, and the floor of the crater is at nearly the same height as the surrounding terrain [62]. A blocky, off-center central massif is retained. The crater is located near the boundary of ridged plains and an extensive region of blocky chaos terrain [64]. Stereo imaging of Pwyll is provided by three Galileo images that together constitute a set of stereo images. DTMs were produced at a post spacing of 750 m/post and have EPGSD = 32 m, and EPmax = 41 m. The complete image and stereo parameters are provided in Table 1. The ASP DTM used only the western pair of images and so covers just half the scene shown by the SOCET SET® DTM.
The SOCET SET® and ASP DTMs are broadly similar (Figure 19). Both DTMs are relatively bland with essentially just the crater itself and a few smaller features evident in the topography. This is likely due to the large GSD of the images relative to the topographic features present. The crater rim is well represented in both DTMs and the central massif is resolved. As in the case of Cilix crater, the manually edited SOCET SET® DTM shows greater detail relative to ASP’s fully automated approach.
The smallest feature in the orthoimage that is discernable in the SOCET SET® DTM and hillshade is a double ridge that is two DTM posts across (1.5 km). That same feature is not observed in the ASP DTM or hillshade, and the smallest feature clearly discernable in that DTM is the rim of Pwyll crater (~2 km across in the ortho). The horizontal resolution is thus two posts (1.5 km) and three posts (2.3 km) for the SOCET SET® and ASP DTMs, respectively; however, the relatively bland appearance of the DTM suggests that not all surface features at this scale are truly resolved. If we accept these values, the resolution of the SOCET SET® DTM is 7.7 × GSDRMS and 6.1 × GSDmax, whereas the resolution of the ASP DTM is 11.5 × GSDRMS and 9.2 × GSDmax (Table 2).
The median absolute difference between the DTMs is 21 m (less than EPRMS) and the 90th percentile difference is 71 m. However, the tail of the distribution is extremely long (the maximum absolute difference is 1100 m). The long tail results in a large standard deviation of 104 m, and an RMS absolute difference (EPderived) of 112 m, which implies ρRMS of 1 pixel and ρmax of 0.8 pixel (Table 3). Figure 20 shows the error (difference) distribution for the Pwyll DTMs. Most of the error is approximately normally distributed with an estimated standard deviation of ≈30 m, although errors are somewhat larger than expected for a normal distribution at the positive tail of the distribution. The large value of EPderived primarily results from ~100 posts that have extremely large differences between SOCET SET® and ASP (Figure 20b). Some of these differences appear to be due to blunders or artifacts at the edges of the ASP DTM, where posts are anomalously ~500 m higher or ~100 m lower than adjacent posts. In other cases, absolute differences of ~300 m are observed that correspond to topography on the crater rim, within the central massif, and along a depression west of the crater. In most case, the difference is due to higher elevations in the ASP DTM relative to the SOCET SET® DTM that result from the higher horizontal resolution of the SOCET SET® DTM. For example, Pwyll’s complex central massif appears as a large, connected high elevation region in the ASP DTM, whereas the manually edited SOCET SET® DTM brings out finer details in the massif, including its division into more discrete topographic blocks. Thus, in this case we have greater assurance that the manually edited SOCET SET® DTM is a more accurate representation of Europa’s topography (i.e., it’s in better agreement with the orthoimage). Furthermore, the differences are primarily due to differences in horizontal resolution, rather than the matching precision. In fact, the standard deviation of the normal error distribution curve that fits the majority of the data is similar to the EPRMS (and smaller than EPmax), suggesting that the pixel matching accuracy ρ is significantly less than 1 pixel, and possibly as good as 0.3 pixel over most of the DTM. Assessing the uncertainty in the Pwyll DTMs is thus particularly complex. Most of the differences are within the range expected for normally distributed errors, assuming ρ ≤ 0.5 pixel. Some of the differences outside this range are due to apparent blunders in the ASP DTM, whereas others correspond to real topography. The majority of the latter are in regions where manual editing of the SOCET SET® DTM has brought out finer details in the topography, and are therefore at least partly a resolution effect. In any case, the end user of the ASP DTM might measure local rim or central peak heights 300 m different from a user using the SOCET SET® DTM, which are well outside those expected from EPRMS and three standard deviations away from EPderived. These differences could result in significantly different interpretations of Pwyll’s morphometry.

3.3.2. Ridged Plains

Ridges are one the most common morphological features on Europa’s surface [14]. Many Europan ridges have a distinct morphology, consisting of a central trough flanked by two raised edifices that form a structure that is commonly referred to as a double ridge. Europa’s most prominent ridges are several kilometers across, hundreds of meters high, and ~1000 km long; however, ridges have a variety of morphologies that range from these large, isolated double ridges to ridge-complexes, to ridged bands ([14,68] provide summaries). Additionally, innumerable smaller-scale ridges of varying orientation cross and merge in complex patterns that form a background fabric of ridges known as ridged plains [64,69]. The ridged plains are ubiquitous on Europa and form the background geologic unit in nearly every global or regional geologic map, e.g., [64,69,70]. An east-west sequence of very high-resolution images (by Galileo standards) of ridged plains was acquired in Europa’s “Wedges region” (formally Argadnel Regio, Figure 2) near Yelland Linea. That sequence crosses a second, north-south oriented sequence of more moderate (although still relatively high) resolution images, forming a set of stereo images where the two sequences intersect. We selected two images from the high-resolution sequence and paired them with a lower resolution image to generate SOCET SET® and ASP DTMs at 60 m/post with EPRMS of 11 m, and EPmax of 14 m (Figure 21). The complete image and stereo parameters are provided in Table 1. This set of images is one of the highest-resolution, and highest-quality stereo pairs available from Galileo Europa data.
The high resolution of the images and excellent p/h (Table 1) results in high-quality DTMs from both SOCET SET® and ASP. The smallest features in the orthoimage that are discernable in the SOCET SET® DTM and hillshade are the central troughs of ridges just two to three DTM posts (120–180 m) across. Also notable is a set of ~30-m high ridges that are four to eight posts (240–480 m) across in the northeast corner of the DTM. The same features can be discerned in the ASP DTM, although they are not as distinct: the same 30-m high ridges are barely resolved. The horizontal resolution of the SOCET SET® DTM is generally three posts (180 m), which is 8.6 × GSDRMS or 7.0 × GSDmax. The resolution of the ASP DTM is closer to four DTM posts (240 m), which is 11.4 × GSDRMS or 9.4 × GSDmax (Table 2). The ASP DTM contains a number of gaps where stereo matching apparently failed. Differences between the DTMs were calculated separately for the left and right high-resolution images, but the results are similar. The median absolute difference between the DTMs is just 5 m (right pair) and 7 m (left pair), and the RMS absolute difference (EPderived) is 14 m for the right DTM and 21 m for the left, indicating ρRMS and ρmax is 0.3 and 0.4 pixels, respectively for the right pair, and 0.5 and 0.6 pixels, respectively, for the left pair. The difference in EPderived between the right and left pairs is surprising given the nearly identical stereo geometry. We speculate that the right pair has greater texture than the left, which includes relatively bland regions in the upper portion of the scene, and this may have facilitated marginally better stereo matching. For the SOCET SET® DTM, the product of resolution and error is 3.4 (GSDRMS) and 2.1 pixels2 (GSDmax) for the right pair, and 5.2 (GSDRMS) and 3.5 pixels2 (GSDmax) for the left. For the ASP DTM, the product of resolution and error is 4.6 (GSDRMS) and 2.8 pixels2 (GSDmax) for the right pair, and 6.8 (GSDRMS) and 4.7 pixels2 (GSDmax) for the left (Table 3). The product is surprisingly low for the right pair due to the small resolution of the DTM.
In both cases, the 90th percentile absolute differences (19 m for right pair and 29 m for the left pair) are 1.4 or 1.7 × EPderived, respectively, which are somewhat larger than expected for a normal distribution. In fact, a normal distribution with the same mean and standard deviation is a poor fit to the error distribution (both left and right pairs) because the error distribution is much narrower, but with longer and broader tails than expected. The maximum absolute difference is 170 m, more than 10 × EPderived. As was the case for Pwyll, some of the large differences correlate with real topography and may be due to the manual editing of the SOCET SET® DTM.

3.3.3. Agenor Linea

Agenor Linea is a prominent bright band in Europa’s southern trailing hemisphere. The band is ~1500 km long and ~20 km wide (the width is highly variable). Because of its prominence, and because it was relatively well-imaged by Galileo, Agenor Linea is perhaps the best-studied bright band on Europa. For this study we used a sequence of seven higher-resolution images that overlay two lower resolution images to generate a single continuous DTM of the central portion of Agenor Linea (Figure 22). The resulting DTM has EPRMS = 52 m and EPmax = 74 m, and was generated at 750 m/post, or roughly three times GSDmax. The complete image and stereo parameters are provided in Table 1. Due to the difficulty of combining multiple DTMs in ASP, we only generated DTMs of Agenor Linea in SOCET SET®, which precludes the types of comparisons described above; however, examination of the SOCET SET® DTM can provide additional insight into how well we can know Europa’s topography.
The smallest features in the 50-m orthoimages that are clearly discernable in the DTM and hillshade are several 0.6-km wide troughs (referred to as “tension gashes” in Hoyer et al. [71]) within the eastern portion of Agenor that appear as one-post wide depressions. Several double ridges a few DTM posts across are also clearly visible outside the band on the eastern side of the DTM; however, these features actually appear narrower in the DTM than in the orthoimage (this may be real if the feature is highly sloped). Two fractures near the center of the DTM (each about 300 m across in the orthoimage) are resolved. However, many features that are 1–2 km in scale and are observable in the orthoimage, such as the many ridges outside the band, are not resolved. The horizontal resolution of the DTM is thus more typically four DTM posts (3 km). The resolution of this DTM is 19.2 × GSDRMS and 13.8 × GSDmax. The horizontal resolution is a factor of two larger (worse) than that typically found for SOCET SET® DTMs in this study.
The vertical precision is harder to assess; however, it is notable that the DTM resolves subtle topography that seems to be associated with real features. Perhaps the most notable example is a circular depression 80–100 m deep in the eastern portion of the DTM. The depression is bounded on the east and west by obvious fault scarps, which stand slightly higher than the surrounding band. A similar, but less obvious depression appears to the north. Agenor itself is also high-standing, sitting ~100 m above the surrounding terrain. The small double ridge noted above has topography of 60–100 m, and a small mound near the center of the DTM has ~100 m of relief. In general, DTM quality appears higher in the east than in the west, where the DTM becomes mottled. The reasons for this are not clear, as the geometry of the individual stereo pairs does not vary substantially across the scene. It may be that the topography itself is simply more subdued in the western portion of the DTM, as larger amplitude topography, such as the 100–200-m deep depression associated with a foundered portion of Agenor, is still clearly resolved.
These observations suggest that the DTM includes vertical differences of about 100 m for extended features, or twice the EPRMS and 1.4 × EPmax. If we take 100 m as ~EPderived, then ρRMS = 0.6 pixels and ρmax = 0.4 pixels, consistent with the other four DTMs we have examined. However, EP applies for a single independent height measurement, so extended features with relief less than EP can still be detected but will appear noisy. Therefore, the actual EPderived may be several times larger than that suggested by the observable relief. A larger EPderived would indicate ρ closer to 1. If we take the more optimistic values of 0.6 and 0.4 pixels, the product of resolution and error is 11.5 pixels2 (GSDRMS) and 5.5 pixels2 (GSDmax), with the high value driven by the poor horizontal resolution of the DTM.

3.4. Optimization of Ames Stereo Pipeline DTM Parameters

Additional insight into the variability in DTMs can be gained by assessing the role of the weakly-constrained parameters that must be set during DTM generation. The ASP provides an excellent opportunity to perform such an analysis because its fully automated processing lends itself to scripting the production of large numbers of test DTMs. The exercise is also facilitated by the small size of the Galileo SSI data, which results in trivial computation time when a reasonably sized compute cluster is utilized. A similar investigation should be undertaken for SOCET SET® DTMs, cf. [23], but due to resource limitations is left as future work.
For our analysis, we focused on the effect of three parameters that users can modify during DTM generation in ASP. ASP has many more adjustable parameters, but we focused on these three as they are particularly important for controlling how ASP establishes its disparity map (the map of image correspondences). The three parameters were the width of the pre-filter kernel (λpre), the size of the correlation kernel (λcorr), and the size of the subpixel refinement kernel (λsp). Each of these parameters is described in detail in the Ames Stereo Pipeline manual (https://stereopipeline.readthedocs.io/en/latest/ accessed on 4 November 2021), and we only provide a brief description here. We note that Shean et al. [72] performed a similar analysis for ASP using WorldView data (DigitalGlobe) of Greenland, but they focused on the method of subpixel refinement (rather than the kernel size) and the DTM post spacing. Kirk et al. [23] made similar comparisons for Mars, where they were able to use a high precision reference DTM to obtain precise measurements as opposed to rough estimates of resolution and EP used here.
The prefilter kernel reduces the noise in images before stereo correlation begins. We use ASP’s Laplacian of Gaussian (LoG) filter (prefilter-mode = 2), which both reduces noise (via the Gaussian smoothing) and highlights edges (via the Laplacian). The filter also helps to reduce the effects of variation in lighting conditions between images. The default width of λpre in ASP is 1.4 pixels, and larger prefilter kernels produce smoother initial images. Once prefiltering is complete, ASP proceeds to the correlation stage. Correlation is the process by which initial, whole-pixel correspondences between images are identified. In ASP, a small rectangular template window from the left image is moved across a specified region in the right image (left and right are specified on input) and the “best” match is determined by applying a cost function that compares the two windows. The correlation kernel size (λcorr) sets the size (in pixels) of the template window. In some cases, increasing λcorr can increase the chance of finding useful image texture for the correlator, and thus increases the number of matches. The default λcorr in ASP is 25 × 25 pixels. Once ASP constructs a disparity map via a coarse-to-fine, pyramid-based correlation scheme, every valid pixel undergoes a subpixel refinement of its position. The refinement can be thought of as a “fine adjust” once the rougher correspondences are identified. We chose to use the ASP Bayes Expected Maximization (EM) weighted affine adaptive window correlator (ASP subpixel-mode 2), which has been shown to produce high-quality stereo matches [36]. The Bayes EM subpixel refinement has only a single parameter: the size of the subpixel correlation kernel (λsp). The default λsp in ASP is 35 × 35 pixels; however, larger windows are recommended for the Bayes EM method because it weights the kernel with a Gaussian distribution which reduces the effective area of the kernel. Once the disparity map has been refined, it is combined with the camera model to compute the 3D location of points on the surface, and these are interpolated into an evenly gridded DTM.
We generated ASP DTMs of Cilix crater (Section 3.1, GSDRMS = 90 m) for three different values of λpre (1.4, 1.5, and 3 pixels to evaluate both small and large changes), four different values of λcorr (21, 25, 35, 45 pixels), and four different values of λsp (15, 25, 35, 45 pixels), resulting in 48 different ASP DTMs of Cilix crater. Figure 23 shows 16 hillshades from those simulations, all of which used the default λpre of 1.4. Qualitatively, we find that, for these images and a given λpre, the results are relatively independent of λcorr. This is perhaps not surprising as long as the value of λcorr is good enough that the subpixel refinement can fix problems during the correlation stage. DTM quality depends more heavily on λsp. Large λsp significantly reduced the amount of detail visible in the resulting hillshade; however, a very small λsp results in relatively noisy hillshades (i.e., more detail is visible, but it is unclear if those “details” are real). For this stereo-pair, a λcorr of 21–25, and a λsp of 15–25 appear to produce the highest quality results when compared to the orthoimage. These results are consistent with the findings of Kirk et al. [23] for Mars data. They found that increasing λcorr beyond ~21 pixels had little effect, but that smaller values led to localized DTM errors that became more numerous and severe as λcorr was reduced. Increasing λsp beyond 13 pixels led to smoother DTMs and smaller errors, but decreasing λsp below 13 pixels caused a rapid and dramatic rise in the RMS error, as well as worsening resolution.
We can gain a more quantitative understanding of how small changes in these values affects measurements of Europa’s topography by examining individual topographic profiles. Following the approach described in Section 2.6.4, we extracted four sets of identical profiles from DTMs generated with λpre of 1.4, λcorr of 21 pixels, and variable λsp (Figure 24). Profiles were extracted that transect the entire crater from southwest to northeast (profile 1), transect half the crater along the line of the central massif (profile 2), transect the southwest-northeast trending ridges southwest of Cilix (profile 3), and transect the narrow ridge southeast of Cilix (profile 4). Although the overall shape of each profile is similar, the profiles show significant variations in terms of both feature relief and breadth. The profiles crossing the ridges southwest (profile 3) and southeast (profile 4) of Cilix have the largest differences. In profile 3, measurement of ridge relief differs by up to 70 m between λsp = 15 and λsp = 45, which amounts to a factor of two difference (the maximum ridge relief is 150 m, when λsp = 15). Even relatively small differences in λsp impact the resulting topography: the elevation of the ridge crest is 20 m higher, and the ridge trough is 20 m lower when λsp = 15 compared to λsp = 25, resulting in a difference of 40 m of relief. In profile 4, the ridge amplitude decreases from 64 m for λsp = 15 to 15 m for λsp = 45. These differences are accompanied by a broadening of the ridges, indicating that the difference in amplitude is a resolution effect. The width and spacing of the ridges are near the DTM resolution (~1 km, Section 3.1) so their amplitude decreases in DTMs with larger kernels, which produce smoother results. The effect is especially notable in profile 4. Smaller differences are also observed for the crater transecting profiles (profile 1 and 2). From λsp = 15 to λsp = 45, the difference in measured crater depth is ~40 m for the southwest-northeast transect (profile 1), and 55 m from the northwest-southeast transect (profile 2). In the latter case, the difference is about 15% of the total relief and is again accompanied by broadening of the crater rim. In the former, the difference in relief is smaller and broadening is not observed, suggesting that the large-scale topography is better resolved in this profile even when a larger kernel results in a smoother DTM.
In addition to the elevation differences, the profiles also are not well aligned horizontally. In profile 1, DTMs with small values of λsp are shifted by ~1 km to the northeast (to the right in the profile) relative to those with large λsp. However, the offset is not systematic. Profiles with small λsp are shifted to the south in profile 2 and 4, relative to those with larger λsp, but shifted slightly north in profile 3 (depending the feature chosen). The cause of this shift is uncertain, but may suggest that the results are not properly centered for different kernel sizes. This effect was not observed in the similar analysis by Kirk et al. [23].
The DTMs shown in Figure 23 all used a prefilter kernel (λpre) of 1.4 pixels. We find that small changes in λpre (e.g., from 1.4 to 1.5) have a very limited effect on DTM quality; however, large increases in λpre result in DTMs that are significantly degraded compared with smaller values. Figure 25 shows 16 DTMs with varying λcorr and λsp (as in Figure 23) but with λpre = 3. In general, these DTMs are excessively blocky at low λsp and overly smooth at high λsp. The best results are therefore not at λsp = 15, as when λpre = 1.4, but rather at λsp = 25. Thus, DTM quality requires a careful balance of parameter choices. If a larger λpre is required, users should also select a larger λsp.
To determine whether the parameter choices we derived above can be applied semi-universally to Galileo data, we performed a second parameter sweep in λcorr, λsp, and λpre (same values as above) for the western pair of our “ridged plains” DTM (Section 3.3.2). The 16 DTMs varying λcorr and λsppre = 1.4) are shown in Figure 26. Again, we find that the amount of detail/noise is highest for small λsp, and the DTMs become smoother as λsp increases; however, now we see that small λsp also results in regions in which the matcher fails completely, resulting in gaps in the DTM. In these cases, increasing λcorr reduces the size and number of these gaps, which is expected given that a larger λcorr increases the chance of finding quality matches between the images. Unfortunately, a larger λcorr also results in a substantially smaller DTM because the edges are no longer mapped. Thus, for this set of DTMs we find that a larger λcorr (~35 pixels) and intermediate λsp (35 pixels) results in DTMs with a more favorable tradeoff between detail and gaps. These results indicate that there is a minimum size for both λsp and λcorr or there can be gaps in the resulting DTM. Kirk et al. [23] found a similar result for Mars. In that work, ASP was used to interpolate all gaps; however, they found that small λcorr resulted in a greater number of blunders, which in many cases resulted from small blunders around gap edges being interpolated to create more bad points. For our current work, increasing λpre (e.g., to three pixels) again results in lower-resolution DTMs. However, given that Kirk et al. [23] found that the product of resolution and error is relatively constant, these lower resolution DTMs may also have reduced error—a hypothesis that can be tested by future work.
This analysis indicates that although ASP is essentially fully automated, users must have some understanding of how parameter choices might affect DTM quality. Furthermore, there is not one set of parameter values that are optimal for every pair of Galileo images, and the default values in ASP are not always the most appropriate for this dataset. Differences between qualitatively similar DTMs are generally similar to the EP; however, larger differences can occur if poor parameter choices are made.

4. Discussion

4.1. The Expected Vertical Precision as a Measure of Quality for Europa DTMs

As discussed in Section 2.2, the expected vertical precision (EP) of a DTM, which can be thought of as the ratio of the “matching accuracy” (ρ × GSD) to the “stereo strength” (parallax to height ratio, p/h), provides a simple measure of stereo quality. The GSD and p/h are a function of the images and geometry of the stereo pair and are therefore fixed. If we also assume that ρ is known from experience with other datasets (typically 0.2–0.3 pixels) we can define EP for each DTM and provide a quantitative measure of the vertical precision of the DTM. Throughout this work, we have compared DTMs generated with two widely used software packages to determine the derived expected vertical precision (EPderived) of the DTMs. We found that EPderived consistently exceeds both EPRMS (EP calculated using GSDRMS) and EPmax (EP calculated with GSDmax). Based on these assessments we conclude that the appropriate value of ρ is ~0.5 pixels for Galileo images of Europa, and suggest this as a more conservative “rule of thumb” for this dataset. The result is perhaps surprising, as Bland et al. [20] have demonstrated that more precise matching of Galileo images of Europa (e.g., in ISIS) is achievable in other contexts. However, in the case of Bland et al. [20], matching was performed to control the image locations, not generate stereo topography. While tie point density was relatively high, complete coverage of the images was unnecessary: only a handful of well-distributed points is necessary to relatively control framing camera images. Thus, only points in areas with sufficient texture for high-quality matching need be retained. In contrast, for DTM generation dense matching is performed across the image. In other words, ρ may be highly variable across an image, cf. [23]. Matching done to control image locations can focus on areas where ρ is small, whereas matching for stereo uses the entire image, resulting in a higher overall ρ.
The fact that ρ > 0.3 pixels for Galileo images of Europa is perhaps not surprising. A substantial body of work [23,24,27,29,30,31,32] has shown that ρ = 0.2 pixel is best interpreted, not as a universal rule of thumb, but as a lower limit on matching precision, and one that is achieved, if at all, for high quality stereopairs (characterized by high signal-to-noise and well-matched illumination and resolution). The challenges of the Galileo image dataset are well documented, e.g., [20], and it is probable that this lower limit simply cannot be achieved. That should not be interpreted to mean that a better image set for Europa, such as that to be returned by NASA’s Europa Clipper mission, would not produce better pixel matching accuracy. Instead, ρ ~ 0.5 pixel is the best that can be achieved with currently available tools and data.
Finally, we reiterate that EP is a statistical measure of the uncertainty (essentially a standard deviation) not an upper limit on the error. Thus, errors a few times EP are expected for every DTM. Cases where errors are much larger than those expected from a quasi-normal distribution, such as the Pwyll DTM, are more concerning and should be used with caution. Unresolved features may also have height errors much greater than the DTM EP, not because of measurement precision but simply because of the DTM resolution. Finally, we emphasize that neither the SOCET SET® nor the ASP DTM represents a truth dataset and because they are generated from the same images, the errors they contain may be partially correlated. There is reason to believe that height differences between DTMs will follow a distribution whose width is similar to those for the individual error distributions (i.e., EP) but agreement between the DTMs at a point does not guarantee that Europa’s topography is better known at the location, as both DTMs may be incorrect.

4.2. The Horizontal Resolution of Europa DTMs

We find that the horizontal resolution of the SOCET SET® DTMs is consistently two to four DTM posts, or 8–11 × GSDRMS. The resolution of the ASP DTMs is somewhat larger, at three to five DTM posts, or 9–13 × GSDmax. A good rule of thumb is therefore that the DTM resolution is ~10 × GSD, but the appropriate GSD for SOCET SET® is GSDRMS, which is closer to the GSD used internally by the NGATE matching algorithm, whereas the appropriate GSD for ASP is GSDmax, consistent with the rectification of the images to coarsest pixel scale.
Our resolution estimates are imprecise because we estimate feature sizes only to the nearest DTM post. In addition, our method is necessarily somewhat subjective. We have attempted to estimate the size of features that are reliably present in the DTMs rather than the size of the smallest features (which is smaller and strongly affected by manual editing in SOCET SET®), but the limited number of surface features complicates this assessment. On other bodies, such as Mars, impact craters, which have a broad distribution of sizes, can be used to assess the DTM resolution at which features are detected at a given level of reliability [21]. Europa has very few small craters, and the “small-scale” features we identify are typically linear ridges with larger effective size. That is, a 30-km long, 1-km wide ridge might be discernable in a DTM with 300 m post spacing when a 1-km diameter crater is not. Our approach also yields only the local resolution of the DTM, which may vary with terrain type.
Recently, Kirk et al. [23] used a reference HiRISE DTM to assess the horizontal resolution and vertical precision of HRSC DTMs (generated in both SOCET SET® and ASP, as well as by the HRSC team processing pipeline). They found that resolution varied by more than a factor of two, depending on the software used, parameter values, and terrain. ASP DTMs generally had a resolution of 18 image pixels, whereas DTMs produced in SOCET SET® with the NGATE + AATE approach used here (but without editing) had resolutions ranging from 11 image pixels on steep terrain to 16 image pixels on very smooth terrain. For an area with an RMS adirectional slope of 7.1° (similar to Cilix), the resolution was 13 image pixels. These resolutions are larger than those estimated here, suggesting our feature-based approach does underestimate the DTM resolution (i.e., the resolution is actually worse). Vertical precision also varied by more than a factor of two but was inversely correlated with resolution, so that the product of resolution and ρ was consistently between four and five pixels2. We found that the product of resolution and ρ was typically between four and eight pixels2, moderately greater than estimates of Kirk et al. [23] but consistent given the lower precision with which we were able to estimate resolution by eye. Our estimates of horizontal resolution are lower (and more consistent between ASP and SOCET SET®) than for the same matcher settings on Mars, and our estimates of matching precision are correspondingly higher. Given the good agreement for the combined metric, it is tempting to speculate that the relatively poor precision and good resolution are real effects, and may result from the distinctive properties of Europa’s surface and the Galileo images. In any case, it appears that smoothing our Europa DTMs with a lowpass filter is likely to bring their quality statistics into closer agreement with what is seen at Mars (in particular, 0.25 pixel matching at 20 pixel resolution), should this be desirable.

4.3. The Impact of Manual Editing

The goal of this work is to better understand how much variability can occur between DTMs generated for Europa. Because of this, we have focused on comparing the final “end-products” of ASP and SOCET SET® (i.e., the manually edited SOCET SET® DTM). These are the products that would be used in a scientific investigation or during mission planning. When evaluating these end-products it is clear that the primary source of variability (i.e., differences between the DTMs) results from manual editing. Figure 27 compares an unedited SOCET SET® DTM of Cilix with the final SOCET SET® and ASP DTMs shown in Figure 4. Qualitatively, the unedited SOCET SET® DTM is more similar to the ASP DTM than the edited SOCET SET® DTM is to ASP. Like the ASP DTM, the unedited SOCET SET® DTM is smoother than the edited version and fails to resolve both the three double ridges southwest of Cilix and the northwest-southeast trending double ridge southeast of the crater.
Differencing the unedited SOCET SET® DTM and the ASP DTM (Figure 27d) shows that the largest differences are strongly correlated with topography (although in the opposite sense as the edited case, with ridges in the ASP DTM higher than those in the unedited SOCET SET® DTM). The RMS absolute difference (EPderived) is 41 m, marginally higher than the EPderived of 36 m found for the ASP and edited SOCET SET® DTM. However, the distribution of differences between the ASP and the unedited SOCET SET® DTM (Figure 28) is narrower than that for the ASP and the edited SOCET SET® DTM (Figure 6) and departs more significantly from a normal distribution. The larger EPderived therefore results from larger differences at the negative tail of the distribution (higher SOCET SET® elevations). The similarity between the two distributions is not surprising given that 37% of the pixels (2187 of 5816 total pixels) in the edited SOCET SET® DTM were not modified at all, and most of those that were edited changed by only a few tens of meters (the median change was 12 m). Large outliers in the SOCET SET® DTM (e.g., due to small blunders) were corrected by editing, thus reducing the RMS absolute difference for the edited product.
Figure 29 clearly shows the benefit of manual editing, which enables greater detail to be captured and permits a technician to correct post elevations to accuracy similar to EPderived. In this case, 83% of the pixel were manually edited and the median change was 62 m. We therefore conclude that, where stereo conditions are poor (e.g., in this case a large disparity in GSD and high incidence angles), the editing process can significantly improve the quality of the DTM. In contrast, where data quality is higher, the SOCET SET® and ASP DTMs are more similar (e.g., the DTM of ridged terrain described in Section 3.3.2). Given the nature of most of the Galileo imaging data set, manual editing capability may be necessary for high-fidelity DTMs from Galileo images.
Not all of the differences between the ASP and SOCET SET® DTMs are the result of manual editing. Figure 27d and Figure 29d clearly illustrate this point: differences of 100–150 m (3.6 × EPderived) are common before any editing is performed. These differences result from the DTM extraction processes itself and are likely due to differences in how matching across the stereo-pair is performed between ASP (i.e., the creation of a refined disparity map) and SOCET SET® (e.g., the performance of NGATE). This investigation was not designed to systematically characterize differences due to the many choices available in both ASP and SOCET SET® during image correlation. A full evaluation of why ASP and SOCET SET® produce significant differences in unedited DTMs may be warranted but is beyond the scope of the present work. Here we simply emphasize that such differences occur and should be considered during scientific investigations.
Throughout this work we have treated the DTMs produced by ASP and SOCET SET® as equally uncertain, focusing on the differences between the two to assess how well we can know Europa’s topography. However, the editing capability included with SOCET SET® enables a well-trained technician with a stereo viewer and good stereo acuity to place posts “on the ground” (i.e., adjust their elevation) to within the theoretical EP of the DTM. This method of DTM editing has been used for high-fidelity products such as the Mars 2020 Terrain Relative Navigation DTMs [73]. Where the ASP and edited SOCET SET® DTM differ, we might then consider the SOCET SET® DTM as more accurate than the ASP DTM (still in relative terms, as the absolute elevation remains unknown). However, as noted in Section 2.4, the relatively low quality of Galileo data (compared to, e.g., HiRISE images of Mars) makes manual editing more challenging (and therefore less accurate) than for, e.g., HiRISE DTMs.

5. Conclusions

The results of our DTM investigations are summarized in Table 2 and Table 3. Evaluation of DTMs generated in ASP and SOCET SET® from identical stereo pairs allows us to generalize the following conclusions.
  • The horizontal resolution of the DTMs (i.e., the smallest features that can be resolved) is at least an order of magnitude greater than the RMS pixel scale of the images, a finding consistent with recent work by Kirk et al. [23] on martian datasets.
  • Stereo matching accuracy (ρ) is ~0.5 pixels. Matching accuracy is therefore poorer when compared to many other (mostly martian) datasets and leads to relatively large EP for Galileo-derived DTMs. However, in some cases the horizontal resolution of the Europa DTMs is better than those datasets, such that the product of resolution and error is similar across all datasets.
  • Differences (i.e., uncertainty) between DTMs usually follow a quasi-normal distribution, and errors several times larger than EPderived are expected. Such differences were observed in comparisons of topographic profiles, and in two cases, the error distribution departed from normal due to large errors at both tails. The expected vertical precision should never be thought of as an upper bound on the DTM uncertainty.
  • Slope information should be used cautiously, as distribution of slopes and the RMS slope as a function of baseline can vary substantially depending on the method used to generate the DTMs.
  • Manual editing substantially improves the horizontal resolution of DTMs generated from Galileo images (especially when stereo quality is poor), permitting smaller-scale topographic features to be resolved.
  • Users should optimize ASP parameters to generate the highest-quality DTMs possible given the limitations of the dataset. Smaller subpixel refinement kernels are generally preferable but may lead to holes in the DTM.
Because of the nature of the Galileo data, systematic investigation of why DTM quality varies is challenging. Each set of stereo pairs has its own unique challenges. It might be expected, for example, that the stereo pairs with the largest ∆GSD would have the largest ρ, since matching between images with very different pixel scales is often challenging. However, we find that ρ is relatively independent of ∆GSD. Instead, the largest ρ is found for the Pwyll DTM, where ∆GSD ~ 2 (i.e., similar to other DTMs studied). In that case, the appearance of the surface is substantially different between the two images of the stereo pair, possibly due to large differences in phase angle that are not fully captured by DST. The difference in appearance apparently results in poor matching accuracy. In this case, a better photometric correction might improve DTM generation.
Given the limitations of the Europa Galileo dataset, more systematic investigations may require synthetic data, as was used by Kirk et al. [27]. Alternatively, use of more extensive real-world datasets acquired under similar conditions to Galileo images might provide additional insights into how well we understand Europa’s topography. For example, the Cassini Imaging Science Subsystem images of Enceladus [74] were also acquired during multiple flybys with highly variable illumination and viewing geometry. Understanding the systematics of DTM uncertainty in that dataset might yield insight into the equivalent performance for Europa. Another avenue for exploration is SOCET SET® itself. While we performed an extensive evaluation of how ASP parameters affect DTM quality a similar investigation was not performed for SOCET SET®. Although not as easily automated, such an investigation is feasible. The results of Kirk et al. [23], who carried out such an investigation for Mars, suggest that a dramatic improvement in the combined quality (resolution × error) is unlikely, but that resolution can be traded for error over a broad range either during or after matching.
We end by returning to our understanding of Europa’s topography and its implications for the structure of the ice shell, heat flow, and ultimately habitability. Within the next decade, NASA plans to use the EIS cameras on the Europa Clipper mission to acquiring new imaging data of Europa that will be used to generate a globally extensive topography dataset of Europa [18]. Those DTMs will largely or completely supersede those generated from Galileo images of Europa. Until that time, DTMs generated from Galileo images should be used for science and mission planning with a detailed understanding of both the limits of the dataset and the highly variable (and sometimes difficult to quantify) uncertainty in Europa’s topography that results from them.

Author Contributions

Conceptualization, M.T.B., R.L.F., R.L.K. and R.A.B.; Methodology, D.M.G. (SOCET SET®) and D.P.M. (ASP); Investigation, M.T.B., R.LK. and D.P.M.; Writing—Original draft, M.T.B.; Writing—Reviewing and Editing, M.T.B., R.L.K., D.M.G., D.P.M., R.L.F. and R.A.B.; Funding acquisition, M.T.B., R.L.F. and R.A.B.; Project administration, M.T.B. All authors have read and agreed to the published version of the manuscript.

Funding

This work was supported by NASA’s Planetary Data, Archiving, Restoration and Tools (PDART) Program award number NNH16AC37I.

Institutional Review Board Statement

Not applicable.

Informed Consent Statement

Not applicable.

Data Availability Statement

All images used in this work are publicly available via NASA Planetary Data System (PDS) Imaging Node (https://pds-imaging.jpl.nasa.gov/portal/galileo_mission.html accessed on 4 November 2021). The SOCET SET® and ASP DTMs, orthoimages, and accompanying metadata are available via figshare at https://figshare.com/s/77bb13f3ba599798bad9 (accessed on 4 November 2021). These products are made available for readers to assess the validity of our results; however, we note that the SOCET SET® DTMs have been superseded by those now available at https://stac.astrogeology.usgs.gov/browser/#/ accessed on 4 November 2021), which are rigorously aligned to Europa’s cartographic coordinate system. The Ames Stereo Pipeline software is open source and available via github (https://github.com/NeoGeographyToolkit/StereoPipeline accessed on 4 November 2021). The USGS ISIS software used to pre-process the images is available via github (https://github.com/USGS-Astrogeology/ISIS3 accessed on 4 November 2021) as are the scripts used to transfer data between ISIS and SOCET SET® (https://github.com/USGS-Astrogeology/APPL-Tools accessed on 4 November 2021). The SOCET SET® software is commercial and is distributed by BAE Systems.

Acknowledgments

We thank Marc Hunter and Jay Laura for assistance making the data publicly available. Any use of trade, firm, or product names is for descriptive purposes only and does not imply endorsement by the U.S. Government.

Conflicts of Interest

The authors declare no conflict of interest.

References

  1. Schubert, G.; Sohl, F.; Hussmann, H. Interior of Europa. In Europa; Pappalardo, R.T., McKinnon, W.B., Khurana, K., Eds.; The University of Arizona Press: Tucson, AZ, USA, 2009; pp. 353–368. ISBN 978-0-8165-2844-8. [Google Scholar]
  2. Schmidt, B.E.; Blankenship, D.D.; Patterson, G.W.; Schenk, P.M. Active formation of ‘Chaos Terrain’ over shallow subsurface water on Europa. Nature 2011, 479, 502–505. [Google Scholar] [CrossRef]
  3. Dombard, A.J.; Patterson, G.W.; Lederer, A.P.; Prockter, L.M. Flanking fractures and formation of double ridges on Europa. Icarus 2013, 223, 74–81. [Google Scholar] [CrossRef]
  4. Schenk, P.M. Thickness constraints on the icy shells of the Galilean satellites from a comparison of crater shapes. Nature 2002, 417, 419–421. [Google Scholar] [CrossRef] [PubMed] [Green Version]
  5. Turtle, E.P.; Pierazzo, E. Thickness of a Europan ice shell from impact crater simulations. Science 2001, 294, 1326–1328. [Google Scholar] [CrossRef] [PubMed]
  6. Nimmo, F.; Giese, B.; Pappalardo, R.T. Estimates of Europa’s ice shell thickness from elastically-supported topography. Geophys. Res. Lett. 2003, 30, 1233. [Google Scholar] [CrossRef] [Green Version]
  7. Hurford, T.A.; Beyer, R.A.; Schmidt, B.; Preblich, B.; Sarid, A.R.; Greenberg, R. Flexure of Europa’s lithosphere due to ridge loading. Icarus 2005, 177, 280–296. [Google Scholar] [CrossRef]
  8. Nimmo, F.; Thomas, P.C.; Pappalardo, R.T.; Moore, W.B. The global shape of Europa: Constraints on lateral shell thickness variations. Icarus 2007, 191, 183–192. [Google Scholar] [CrossRef]
  9. Schenk, P.M.; Matsuyama, I.; Nimmo, F. True polar wander on Europa from global-scale small-circle depressions. Nature 2008, 453, 368–371. [Google Scholar] [CrossRef] [PubMed]
  10. Schenk, P.M.; McKinnon, W.B. New crop circles found on Europa [but not Ganymede]! True polar wander conspiracy confirmed! Lunar Planet. Sci. Conf. 2015, 46, 1526. [Google Scholar]
  11. Nimmo, F.; Schenk, P.M. Normal faulting on Europa: Implications for ice shell properties. J. Struct. Geo. 2006, 28, 2194–2203. [Google Scholar] [CrossRef] [Green Version]
  12. Nimmo, F.; Pappalardo, R.T.; Giese, B. On the origins of bands topography, Europa. Icarus 2003, 166, 21–23. [Google Scholar] [CrossRef]
  13. Coulter, C.E.; Kattenhorn, S.A.; Schenk, P.M. Topographic profile analysis and morphologic characterization of Europa’s double ridges. Lunar Planet. Sci. Conf. 2009, 40, 1960. [Google Scholar]
  14. Prockter, L.M.; Patterson, G.W. Morphology and evolution of Europa’s ridges and bands. In Europa; Pappalardo, R.T., McKinnon, W.B., Khurana, K., Eds.; The University of Arizona Press: Tucson, AZ, USA, 2009; pp. 237–258. ISBN 978-0-8165-2844-8. [Google Scholar]
  15. Schenk, P.M.; Pappalardo, R.T. Topographic variations in chaos on Europa: Implications for diapiric formation. Geophys. Res. Lett. 2004, 31, L16703. [Google Scholar] [CrossRef]
  16. Prockter, L.M.; Schenk, P.M. Origins and evolution of Castalia Macula, an anomalous young depression on Europa. Icarus 2005, 177, 305–326. [Google Scholar] [CrossRef]
  17. Singer, K.N.; McKinnon, W.B.; Schenk, P.M. Pits, uplifts and small chaos features on Europa: Morphologic and morphometric evidence for intrusive upwelling and lower limits on ice shell thickness. Icarus 2021, 364, 114465. [Google Scholar] [CrossRef]
  18. Turtle, E.P.; McEwen, A.S.; Collins, G.C.; Fletcher, L.; Hansen, C.J.; Hayes, A.G.; Hurford, T.A.; Kirk, R.L.; Barr-Mlinar, A.C.; Nimmo, F.; et al. The Europa Imaging System (EIS): High-resolution imaging and topography to investigate Europa’s geology, ice shell, and potential for current activity. Lunar Planet. Sci. Conf. 2016, 47, 1626. [Google Scholar]
  19. Steinbrugge, G.; Schroeder, D.M.; Haynes, M.S.; Hussmann, H.; Grima, C.; Blankenship, D.D. Assessing the potential for measuring Europa’s tidal love number h2 using radar sounder and topographic imager data. Earth Planet. Sci. Lett. 2018, 482, 334–341. [Google Scholar] [CrossRef]
  20. Bland, M.T.; Weller, L.A.; Archinal, B.A.; Smith, E.; Wheeler, B.H. Improving the usability of Galileo and Voyager images of Jupiter’s moon, Europa. Earth Space Sci. 2021, 8, e2021EA001935. [Google Scholar] [CrossRef]
  21. Heipke, C.; Oberst, J.; Albertz, J.; Attwnger, M.; Dorninger, P.; Dorrer, E.; Ewe, M.; Gehrke, S.; Gwinner, K.; Hirschmuller, H.; et al. Evaluating planetary digital terrain models: The HRSC DTM test. Planet. Space Sci. 2007, 55, 2173–2191. [Google Scholar] [CrossRef]
  22. Beyer, R.A.; Archinal, B.; Cheng, Y.; Edmundson, K.; Howington-Kraus, E.; Kirk, R.; Li, R.; McEwen, A.; Mattson, S.; Meng, X.; et al. LROC DTM comparison Effort. Lunar Planet. Sci. Conf. 2011, 42, 2715. [Google Scholar] [CrossRef] [Green Version]
  23. Kirk, R.L.; Mayer, D.; Redding, B.; Galuszka, D.; Fergason, R.L.; Hare, T.M.; Gwinner, K. Evaluating stereo digital terrain model quality at Mars rover landing sites with HRSC, CTX, and HiRISE. Remote Sens. 2021, 13, 3511. [Google Scholar] [CrossRef]
  24. Kirk, R.L.; Howington-Kraus, E.; Redding, B.; Galuszka, D.; Hare, T.M.; Archina, B.A.; Soderblom, L.A.; Barrett, J.M. High-resolution topomapping of candidate MER landing sites with Mars Orbiter Camera narrow-angle images. J. Geophys. Res. 2003, 108, 8088. [Google Scholar] [CrossRef]
  25. Becker, K.J.; Archinal, B.A.; Hare, T.H.; Kirk, R.L.; Howington-Kraus, E.; Robinson, M.S.; Rosiek, M.R. Criteria for automated identification of stereo image pairs. Lunar Planet. Sci. Conf. 2015, 46, 2703. [Google Scholar]
  26. Schenk, P.M. Slope characteristics of Europa: Constraints for landers and radar sounding. Geophys. Res. Lett. 2009, 36, L15204. [Google Scholar] [CrossRef]
  27. Kirk, R.L.; Howington-Kraus, E.; Hare, T.M.; Jorda, L. The effects of illumination on stereo DTM quality: Simulations in support of Europa exploration. ISPRS Ann. Photogramm. Remote Sens. Spat. Inf. Sci. 2016, 3, 103–110. [Google Scholar] [CrossRef] [Green Version]
  28. Cook, A.C.; Oberst, J.; Roatsch, T.; Jaumann, R.; Acton, C. Clementine imagery: Selenographic coverage for cartographic and scientific use. Planet. Space Sci. 1996, 44, 1135–1148. [Google Scholar] [CrossRef]
  29. Kirk, R.L.; Howington-Kraus, E.; Hare, T.; Dorrer, E.; Cook, D.; Becker, K.; Thompson, K.; Redding, B.; Blue, J.; Galuszka, D.; et al. Digital photogrammetric analysis of the IMP Camera Images: Mapping the Mars Pathfinder landing site in three dimensions. J. Geophys. Res. 1999, 104, 8869–8887. [Google Scholar] [CrossRef] [Green Version]
  30. Kirk, R.L.; Howington-Kraus, E.; Edmundons, K.; Redding, B.; Galuszka, D.; Hare, T.; Gwinner, K. Community tools for cartographic and photogrammetric processing of Mars Express HRSC images. Int. Arch. Photogramm. Remote Sens. Spat. Inf. Sci. 2017, 42, 69–76. [Google Scholar] [CrossRef] [Green Version]
  31. Kirk, R.L.; Howington-Kraus, E.; Edmundons, K.; Redding, B.; Galuszka, D.; Hare, T.; Gwinner, K. Community tools for cartographic and photogrammetric processing of Mars Express HRSC images. Lunar Planet. Sci. Conf. 2018, 49, 2184. [Google Scholar]
  32. Kirk, R.L.; Howington-Kraus, E.; Rosiek, M.R.; Anderson, J.A.; Archinal, B.A.; Becker, K.J.; Cook, D.A.; Galuszka, D.; Geissler, P.E.; Hare, T.M.; et al. Ultrahigh resolution topographic mapping of Mars with MRO HiRISE stereo images: Meter-scale slopes of candidate Phoenix landing sites. J. Geophys. Res. 2008, 113, E00A24. [Google Scholar] [CrossRef]
  33. Kirk, R.L.; Shepherd, M.; Sides, S.C. A novel technique for precision geometric correction of jitter distortion for the Europa Imaging System and other rolling-shutter cameras. ISPRS Ann. Photogramm. Remote Sens. Spat. Inf. Sci. 2018, 42, 735–739. [Google Scholar] [CrossRef] [Green Version]
  34. Zhang, B. Toward a higher level of automation in softcopy photogrammetry: NGATE and LIDAR processing in SOCET SET®. In Proceedings of the GeoCue Corporation 2nd Annual Technical Exchange Conference, Nashville, TN, USA, 26–27 September 2006; p. 32. [Google Scholar]
  35. Zhang, B.; Miller, S. Adaptive Automatic Terrain Extraction. In Integrating Photogrammetric Techniques with Scene Analysis and Machine Vision III; McKeown, D.M., McGlone, J.C., Jamet, J.C., Eds.; 1997; Volume 3072, pp. 27–36. Available online: https://www.spiedigitallibrary.org/conference-proceedings-of-spie/3072/1/Adaptive-automatic-terrain-extraction/10.1117/12.281065.short (accessed on 5 November 2021).
  36. Nefian, A.V.; Hussmann, K.; Broxton, M.; To, V.; Lundy, M.; Hancher, M.D. A bayesian formulation for sub-pixel refinement in stereo orbital imagery. IEEE Int. Conf. Image Process. (ICIP) 2009, 16, 2361–2364. [Google Scholar] [CrossRef]
  37. Beyer, R.A.; Alexandrov, O.; McMichael, S. The Ames Stereo Pipeline: NASA’s open source software for deriving and processing terrain data. Earth Space Sci. 2018, 5. [Google Scholar] [CrossRef]
  38. Phillips, C.B.; Hammond, N.P.; Robuchon, G.; Nimmo, F.; Beyer, R.; Roberts, J. Stereo imaging, crater relaxation, and thermal histories of rhea and dione. Lunar Planet. Sci. Conf. 2012, 43, 2571. [Google Scholar]
  39. Phillips, C.B.; El Henson, E.; Nimmo, F. Stereo topography of surface features on Europa and comparisons with formation models. In Proceedings of the AGU Fall Meeting, San Francisco CA, USA, December 2013; p. P53A-1846. [Google Scholar]
  40. Schenk, P.M. “Ah… not so flat as we were led to believe”: Global and regional topography characteristics of Europa. In Proceedings of the American Geophysical Union, Fall Meeting, San Francisco CA, USA, December 2010; p. P31D-02. [Google Scholar]
  41. Giese, B.; Oberst, J.; Roatsch, T.; Neukum, G.; Head, J.W.; Pappalardo, R.T. The Local topography of Uruk Sulcus and Galileo Regio obtained from stereo images. Icarus 1998, 135, 303–316. [Google Scholar] [CrossRef] [Green Version]
  42. Acton, C.J. Ancillary data services of NASA’s Navigation and Ancillary Information Facility. Planet. Space Sci. 1996, 44, 65–70. [Google Scholar] [CrossRef]
  43. Miller, S.B.; Walker, A.S. Further developments of Leica digital photogrammetric systems by Helava. ACSM/ASPRS Annu. Conv. 1993, 3, 256–263. [Google Scholar]
  44. Dundas, C.M. Effects of lava heating on volatile-rich slopes on Io. J. Geophys. Res. 2017, 122, 546–559. [Google Scholar] [CrossRef]
  45. Sides, S.C.; Beckter, T.L.; Becker, K.J.; Edmundson, K.L.; Backer, J.W.; Wilson, T.J.; Weller, L.A.; Humphrey, I.R.; Berry, K.L.; Shepard, M.R.; et al. The USGS Integrated Software for Imagers and Spectrometers (ISIS 3) instrument support, new capabilities, and releases. Lunar Planet Sci. Conf. 2017, 48, 2739. [Google Scholar]
  46. Broxton, M.J.; Edwards, L.J. The Ames Stereo Pipeline: Automated 3D surface reconstruction from orbital imagery. Lunar Planet. Sci. Conf. 2008, 39, 2419. [Google Scholar]
  47. Edwards, L.J.; Broxton, M.J. Automated digital elevation Model generation from orbital imagery. Lunar Planet. Sci. Conf. 2008, 39, 2489. [Google Scholar]
  48. Moratto, Z.M.; Broxton, M.J.; Beyer, R.A.; Lundy, M.; Hussmann, K. Ames Stereo Pipeline, NASA’s open source automated stereogrammetry software. Lunar Planet. Sci. Conf. 2010, 41, 2364. [Google Scholar]
  49. Moratto, Z.M.; McMichael, S.; Beyer, R.A.; Alexanderov, O.; Fong, T. Automated and accurate: Making DTMs from LRO-NAC using the Ames Stereo Pipeline. Lunar Planet. Sci. Conf. 2014, 45, 2892. [Google Scholar]
  50. McMichael, S.; Moratto, Z.M.; Beyer, R.A. LRO-NAC mass DTM pipeline. Lunar Planet. Sci. Conf. 2015, 46, 2491. [Google Scholar]
  51. Adoram-Kerschner, L.A.; Wheeler, B.H.; Laura, J.R.; Fergason, R.L.; Mayer, D.P. Automated Kaguya TC and MRO CTX Stereo DEM Generation. 5th Planetary Data Workshop and PSIDA (LPI Contrib. 2549). 2021. Available online: https://ui.adsabs.harvard.edu/abs/2021LPICo2549.7021A/abstract (accessed on 5 November 2021).
  52. Beddingfield, C.B.; Burr, D.M.; Emery, J.P. Shallow normal fault slopes on Saturnian icy satellites. J. Geophys. Res. 2015, 120. [Google Scholar] [CrossRef]
  53. Beddingfield, C.B.; Burr, D.M.; Emery, J.P. Fault geometries on Uranus’ satellite Miranda: Implications for internal structure and heat flow. Icarus 2015, 247, 35–53. [Google Scholar] [CrossRef]
  54. Fassett, C.I. Ames Stereo Pipeline-derived digital terrain models of Mercury from MESSENGER stereo imaging. Planet Space Sci. 2016, 134, 19–28. [Google Scholar] [CrossRef] [Green Version]
  55. Wang, Y.; Wu, B. Comparison and co-registration of DEMs generated from HiRISE and CTX images. ISPRS Ann. Photogramm. Remote Sens. Spat. Inf. Sci. 2016, XLI-B4, 511–517. [Google Scholar] [CrossRef] [Green Version]
  56. Della-Giustina, D.N.; Kinney-Spano, E.K.; Chojnacki, M.; Sutton, S. Comparison of digital terrain models derived using different techniques. 2nd Planet. Data Workshop 2015, 2, 7069. [Google Scholar]
  57. Beyer, R.A.; Alexandrov, O.; Moratto, Z.M. Aligning terrain model and laser altimeter point clouds with the Ames Stereo Pipeline. Lunar Planet. Sci. Conf. 2014, 45, 2902. [Google Scholar]
  58. Horn, B.K.P. Hill shading and the reflectance map. Proc. IEEE 1981, 69, 14. [Google Scholar] [CrossRef] [Green Version]
  59. Shepard, M.K.; Campbell, B.A.; Bulmer, M.H.; Farr, T.G.; Gaddis, L.R.; Plaut, J. The roughness of natural terrain: A planetary and remote sensing perspective. J. Geophys. Res. 2001, 106, 32777–32795. [Google Scholar] [CrossRef]
  60. Beyer, R.A.; Kirk, R.L. Meter-scale slopes of candidate MSL landing sites from point photoclinometry. Space Sci. Rev. 2012, 170, 775–791. [Google Scholar] [CrossRef]
  61. Steinbrugge, G.; Voigt, J.R.C.; Schroeder, D.M.; Stark, A.; Haynes, M.S.; Scanlan, K.M.; Hamilton, C.W.; Young, D.A.; Hussmann, H.; Grima, C.; et al. The surface roughness of Europa derived from Galileo stereo images. Icarus 2020, 343, 113669. [Google Scholar] [CrossRef]
  62. Schenk, P.M.; Turtle, E.P. Europa’s impact craters. In Europa; Pappalardo, R.T., McKinnon, W.B., Khurana, K., Eds.; The University of Arizona Press: Tucson, AZ, USA, 2009; pp. 181–198. ISBN 978-0-8165-2844-8. [Google Scholar]
  63. Collins, G.C.; Nimmo, F. Chaotic terrain on Europa. In Europa; Pappalardo, R.T., McKinnon, W.B., Khurana, K., Eds.; The University of Arizona Press: Tucson, AZ, USA, 2009; pp. 259–282. ISBN 978-0-8165-2844-8. [Google Scholar]
  64. Leonard, E.J.; Patthoff, D.A.; Senske, D.A.; Collins, G.C. The Europa global geologic map. In Proceedings of the Planetary Geologic Mappers Annual Meeting, Knoxville, TN, USA, 12–14 June 2018. LPI Contribution No. 2066, id. 7008. [Google Scholar]
  65. Pappalardo, R.T.; Belton, M.J.S.; Breneman, H.H.; Carr, M.H.; Chapman, C.R.; Collins, G.C.; Denk, T.; Fagents, S.; Geissler, P.E.; Giese, B.; et al. Does Europa have a subsurface ocean? Evaluation of the geologic evidence. J. Geophys. Res. 1999, 104, 24015–24056. [Google Scholar] [CrossRef]
  66. Greenberg, R.; Hoppa, G.V.; Tufts, B.R.; Geissler, P.; Riley, J.; Kadel, S. Chaos on Europa. Icarus 1999, 141, 263–286. [Google Scholar] [CrossRef]
  67. Collins, G.C.; Head, J.W.; Pappalardo, R.T.; Spaun, N.A. Evaluation of models for the formation of chaotic terrain on Europa. J. Geophys. Res. 2000, 105, 1709–1716. [Google Scholar] [CrossRef]
  68. Kattenhorn, S.A.; Hurford, T. Tectonics of Europa. In Europa; Pappalardo, R.T., McKinnon, W.B., Khurana, K., Eds.; The University of Arizona Press: Tucson, AZ, USA, 2009; pp. 199–236. ISBN 978-0-8165-2844-8. [Google Scholar]
  69. Figueredo, P.H.; Greeley, R. Resurfacing history of Europa from pole-to-pole geological mapping. Icarus 2004, 167, 287–312. [Google Scholar] [CrossRef]
  70. Doggett, T.; Greeley, R.; Figueredo, P.; Tanaka, K. Geologic stratigraphy and evolution of Europa’s surface. In Europa; Pappalardo, R.T., McKinnon, W.B., Khurana, K., Eds.; The University of Arizona Press: Tucson, AZ, USA, 2009; pp. 137–160. ISBN 978-0-8165-2844-8. [Google Scholar]
  71. Hoyer, L.; Kattenhorn, S.A.; Watkeys, M.K. Multistage evolution and variable motion history of Agenor Linea, Europa. Icarus 2014, 232, 60–80. [Google Scholar] [CrossRef]
  72. Shean, D.E.; Alexanderov, O.; Moratto, Z.M.; Smith, B.E.; Joughin, I.R.; Porter, C.; Morin, P. An automated, open-source pipeline for mass production of digital elevation models (DEMs) from very-high resolution commercial stereo satellite imagery. ISPRS J. Photogram. Rem. Sens. 2016, 116, 101–117. [Google Scholar] [CrossRef] [Green Version]
  73. Fergason, R.L.; Hare, T.M.; Mayer, D.P.; Galuszka, D.M.; Redding, B.L.; Smith, E.D.; Shinaman, J.R.; Cheng, Y.; Otero, R.E. Mars 2020 terrain relative navigation flight product generation: Digital terrain model and orthorectified image mosaics. Lunar Planet. Sci. Conf. 2020, 51, 2020. [Google Scholar]
  74. Bland, M.T.; Becker, T.L.; Edmundson, K.L.; Roatsch, T.; Archinal, B.A.; Takir, D.; Patterson, G.W.; Collins, G.C.; Schenk, P.M.; Pappalardo, R.T.; et al. A new Enceladus global control network, image mosaic, and updated pointing kernels from Cassini’s 13-year mission. Earth Space Sci. 2018, 5, 604–621. [Google Scholar] [CrossRef]
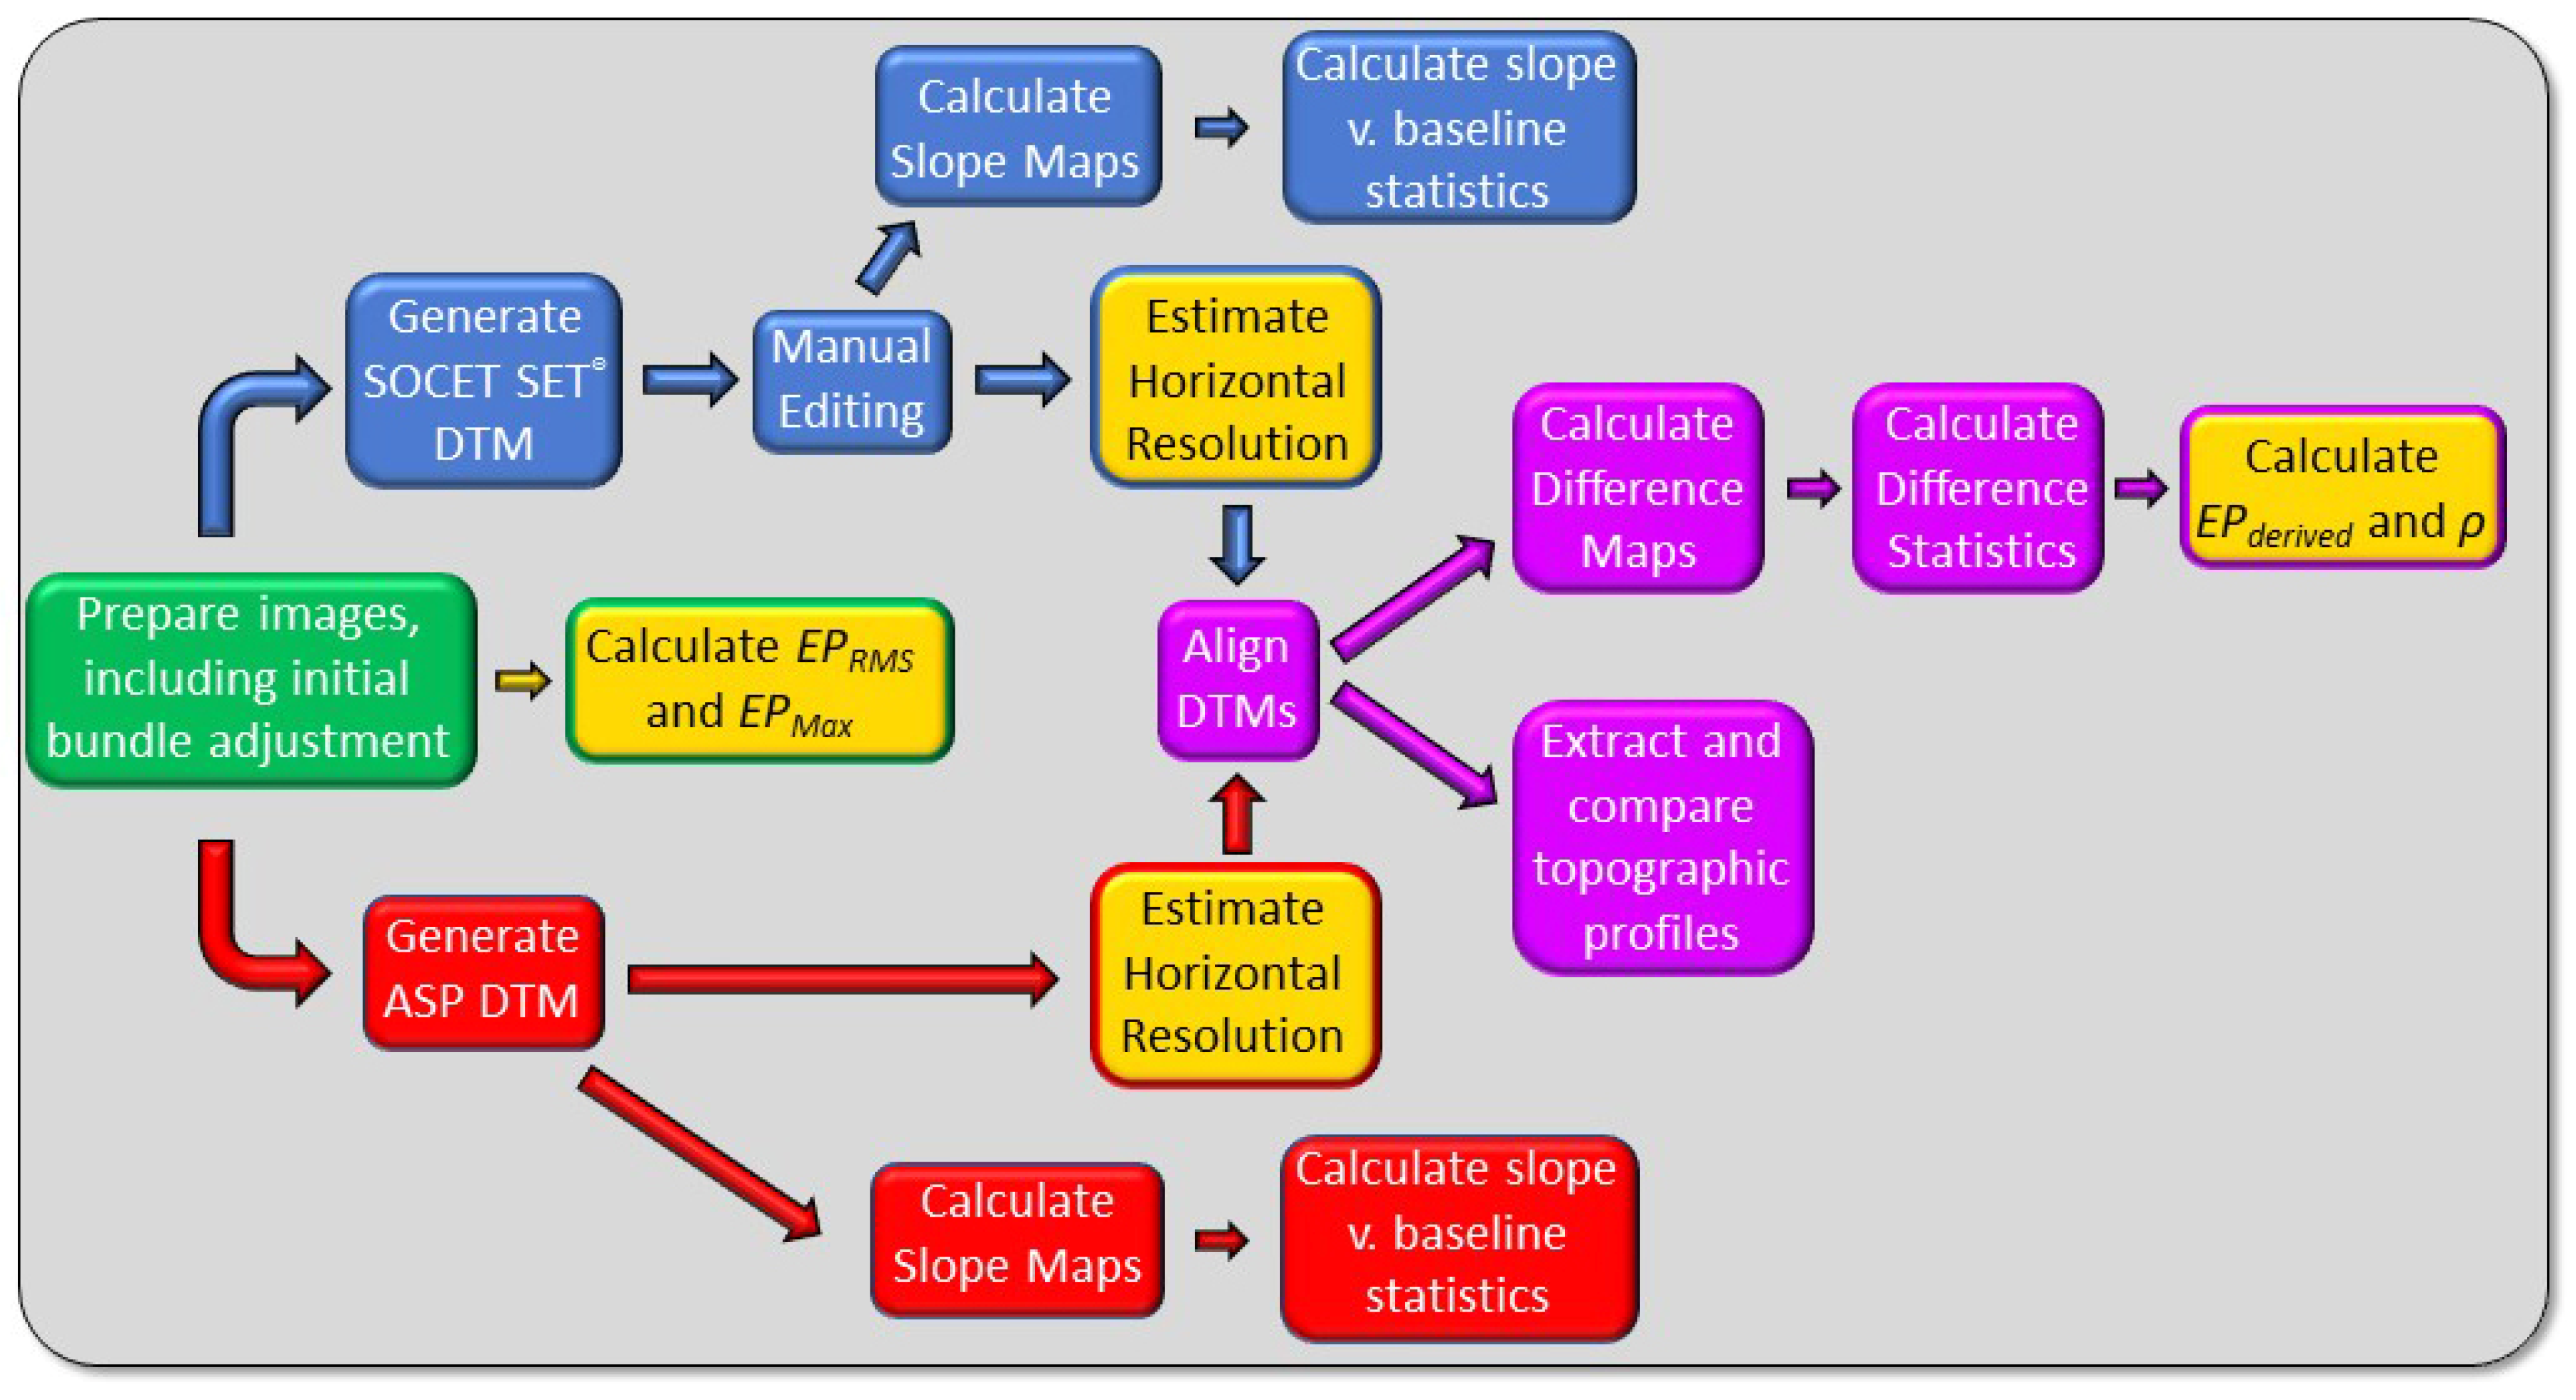
Figure 1. Flowchart synthesizing our approach to DTM comparisons and assessment. The workflow begins by preparing the images (green box). Blue and red items pertain to the SOCET SET® and ASP DTMs, respectively, while purple items require both DTMs. Gold boxes are quantities reported in Table 1, Table 2 and Table 3.
Remotesensing 13 05097 g001
Figure 2. USGS controlled mosaic of Europa (https://astrogeology.usgs.gov/search/map/Europa/Voyager-Galileo/Europa_Voyager_GalileoSSI_global_mosaic_500m (accessed on 4 November 2021) [U. S. Geological Survey 2002]) showing the five regions for which we generated DTMs.
Remotesensing 13 05097 g002
Figure 3. (a) Uncontrolled and (b) controlled mosaics of the Galileo SSI images used to produce the DTMs of Cilix crater. The reconstructed SPICE results in a 25 km offset between the location of the crater in the two images. The smaller of the two images has the smaller pixel scale (63 m/pixel). Images in equirectangular projection, north is up. (c) The orthoimage derived from the SOCET SET® DTM shown at 63 m/pixel.
Remotesensing 13 05097 g003
Figure 4. DTMs and hillshades of Cilix crater. (a) The SOCET SET® DTM. (b) The ASP DTM. (c) Colorized DTM from SOCET SET® overlain on the SOCET SET®-derived orthoimage. (d) as in ‘c’ but for the ASP DTM. (e) SOCET SET® hillshade derived from the DTM shown in (a). (f) ASP hillshade derived from the DTM in shown (b).
Remotesensing 13 05097 g004
Figure 5. Map of the differences between the two DTMs (ASP DTM minus SOCET SET® DTM). Red areas are those in which the ASP DTM has a higher elevation, and blue areas are those in which the SOCET SET® DTM has a higher elevation. Total difference range is ±100 m.
Remotesensing 13 05097 g005
Figure 6. (a) Histogram of the difference between the SOCET SET® and ASP DTMs of Cilix crater. The black curve is a normal distribution with the same mean and standard deviation. (b) Histogram of the absolute difference between the SOCET SET® and ASP DTMs of Cilix crater.
Remotesensing 13 05097 g006
Figure 7. Topographic profiles extracted from the ASP (red) and SOCET SET® (blue) DTMs. The location of each profile is indicated in red on the SOCET SET® hillshade.
Remotesensing 13 05097 g007
Figure 8. One-pixel adirectional slope maps derived from (a) the SOCET SET® DTM and (b) the ASP DTM. The same maps but colorized and overlain on the SOCET SET® orthoimage are shown in (c,d) for SOCET SET® and ASP, respectively.
Remotesensing 13 05097 g008
Figure 9. Histograms of the adirectional one-pixel slope for (a) SOCET SET® and (b) ASP DTMs of Cilix.
Remotesensing 13 05097 g009
Figure 10. RMS slope as a function of baseline for the SOCET SET® (blue squares) and ASP (red circles) DTMs.
Remotesensing 13 05097 g010
Figure 11. (a) The geometry of stereo images. The image outlined in white is that chosen for DTM generation. Rhadamanthys Linea is the northwest-southeast trending ridge at the southern corner of each of the high-resolution images. (b) The orthoimage generated from SOCET SET® at 63 m/pixel showing small-scale chaos, pits, and ridged plains. All images are in equirectangular projection.
Remotesensing 13 05097 g011
Figure 12. DTMs and hillshades of chaos and pits near Rhadamanthys Linea. (a) The SOCET SET® DTM. (b) The ASP DTM. (c) Colorized DTM from SOCET SET® overlain on the SOCET SET®-derived orthoimage. (d) As in (c) but for the ASP DTM. (e) SOCET SET® hillshade derived from the DTM shown in (a). (f) ASP hillshade derived from the DTM in shown (b).
Remotesensing 13 05097 g012
Figure 13. Map of the differences between the two DTMs shown in Figure 12 (ASP DTM minus SOCET SET® DTM). Red areas are those in which the ASP DTM has a higher elevation, and blue areas are those in which the SOCET SET® DTM has a higher elevation. Total difference range is ±150 m.
Remotesensing 13 05097 g013
Figure 14. (a) Histogram of the difference between the SOCET SET® and ASP DTMs of chaos and pits near Rhadamanthys Linea. The black curve is a normal distribution with the same mean and standard deviation. (b) Histogram of the absolute difference between the SOCET SET® and ASP DTMs.
Remotesensing 13 05097 g014
Figure 15. Topographic profiles extracted from the ASP (red) and SOCET SET® (blue) DTMs. The location of each profile is indicated in red on the SOCET SET® orthoimage.
Remotesensing 13 05097 g015
Figure 16. One-pixel adirectional slope maps derived from (a) the SOCET SET® DTM and (b) the ASP DTM. The same maps but colorized and overlain on the SOCET SET® orthoimage are shown in (c,d) for SOCET SET® and ASP, respectively.
Remotesensing 13 05097 g016
Figure 17. Histograms of the adirectional one-pixel slope (Horn’s method) for (a) SOCET SET® and (b) ASP DTMs of Rhadamanthys Linea.
Remotesensing 13 05097 g017
Figure 18. RMS slope as a function of baseline for the SOCET SET® (blue squares) and ASP (red circles) DTMs.
Remotesensing 13 05097 g018
Figure 19. (a) SOCET SET® and (b) ASP DTMs of Pwyll crater.
Remotesensing 13 05097 g019
Figure 20. Histograms of difference between the SOCET SET® and ASP DTMs of Pwyll crater. (a) The distribution is shown and compared to the normal distribution with the same mean and standard deviation (104 m) as the actual distribution (sold black curve) and a normal distribution with mean of 0 m and standard deviation of 30 m (dashed black curve). (b) As in (a) but the horizontal scale has been expanded and the vertical scale decreased to highlight outliers.
Remotesensing 13 05097 g020
Figure 21. (a) SOCET SET® and (b) ASP DTMs of ridged terrain.
Remotesensing 13 05097 g021
Figure 22. SOCET SET® DTM of Agenor Linea.
Remotesensing 13 05097 g022
Figure 23. Comparison of DTMs derived for Cilix crater (Section 3.1) using different correlation kernel size (21 to 41 pixels, increasing left to right, as indicated), and subpixel refinement kernel size (15 to 45 pixels increasing top to bottom, as indicated). Each DTM used a prefilter kernel of 1.4 pixels. Note that the ASP DTM of Cilix crater shown in Figure 4 used λcorr = 35, λsp = 25, and λpre = 1.5 pixels.
Remotesensing 13 05097 g023
Figure 24. Comparison of individual profiles (red lines on the hillshade at right) derived from four ASP DTMs of Cilix crater. The DTMs differ only in the value of λsp: 15 is black, 25 is blue, 35 is green, 45 is yellow. The hillshade shown uses λsp = 15.
Remotesensing 13 05097 g024
Figure 25. As in Figure 22 but using a prefilter kernel size of 3 pixels.
Remotesensing 13 05097 g025
Figure 26. Comparison of DTMs derived for the ridged plains (Section 3.3.2) using different correlation kernel size (21 to 41 pixels, increasing left to right, as indicated), and subpixel refinement kernel size (15 to 45 pixels increasing top to bottom, as indicated). Each DTM used a prefilter kernel of 1.4 pixels.
Remotesensing 13 05097 g026
Figure 27. A comparison of (a) unedited SOCET SET®, (b) edited SOCET SET® and (c) ASP DTMs of Cilix crater. The edited SOCET SET® and ASP DTMs are the same as those shown in Figure 4. (d) Difference map for the unedited SOCET SET® and ASP DTMs (ASP minus SOCET SET®).
Remotesensing 13 05097 g027
Figure 28. Histogram of the difference between the ASP and unedited SOCET SET® DTMs of Cilix crater (Figure 27) compared to a normal distribution with the same mean and standard deviation. Compare to Figure 6, which shows a similar histogram but using the edited SOCET SET® DTM.
Remotesensing 13 05097 g028
Figure 29. A comparison of (a) the unedited SOCET SET®, (b) edited SOCET SET®, and (c) ASP DTMs of pits and chaos near Rhadamanthys Linea. The edited SOCET SET® and ASP DTMs are the same as those shown in Figure 12. (d) Difference map for the unedited SOCET SET® and ASP DTMs (ASP minus SOCET SET®).
Remotesensing 13 05097 g029
Publisher’s Note: MDPI stays neutral with regard to jurisdictional claims in published maps and institutional affiliations.