Article

Land-Surface Quantitative Analysis to Investigate the Spatial Distribution of Gravitational Landforms along Rocky Coasts

1
Department of Earth Sciences, Sapienza University of Rome, 00185 Rome, Italy
2
Department of Pure and Applied Sciences, University of Urbino, 61029 Urbino, Italy
*
Author to whom correspondence should be addressed.
Remote Sens. 2021, 13(24), 5012; https://doi.org/10.3390/rs13245012
Submission received: 9 November 2021 / Revised: 24 November 2021 / Accepted: 6 December 2021 / Published: 9 December 2021

Abstract

:
The increasing availability of high-quality digital elevation models (DEMs) has been associated with a growing interest in developing quantitative analyses aimed at taking advantage of these detailed, updated, and promising digital datasets. Land-surface quantitative (LSQ) analysis is valuable for describing the land-surface topography and performing measures of the signature of specific geomorphic processes, taking into account site-specific geological contexts and morphoclimatic settings, proving to be particularly effective in transitional environments, such as rocky coasts. This paper presents the results of research aimed at investigating the spatial distribution of gravitational landforms along rocky coasts, by means of LSQ analysis based on a DEM with a ground resolution of 2 m, derived from airborne LiDAR (light detection and ranging) surveys. The study area is at Mt. San Bartolo (Northern Marche, Italy) and characterized by a sea cliff diffusely affected by gravitational phenomena of different sizes and types. Geomorphological and geological field data, interpretations of remotely sensed datasets derived from ad hoc unmanned aerial vehicle (UAV) flights, and DEM-derived hillshades were also adapted to support LSQ analysis. In detail, four morphometric variables (slope, roughness, terrain ruggedness index, and elevation standard deviation) were computed and the outputs evaluated based on visual–spatial inspections of derived raster datasets, descriptive statistics, and joint comparison. Results reveal the best performing variables and how combined interpretations can support the identification and mapping of zones characterized by varying spatial distribution of gravitational landforms of different types. The findings achieved along the Mt. San Bartolo rocky coast confirm that an approach based on land-surface quantitative analysis can act as a proxy to efficiently investigate gravitational slope processes in coastal areas, especially those that are difficult to reach with traditional field surveys.

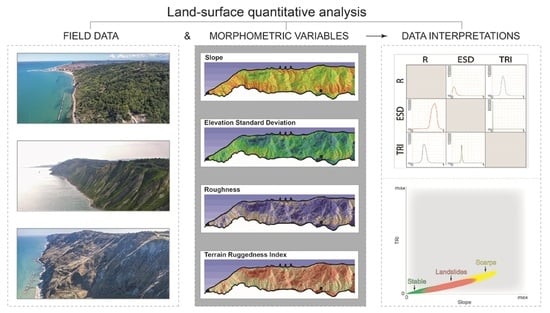
Graphical Abstract

1. Introduction

Rocky coasts represent about 80% of coasts worldwide [1] and characterize many coastal zones around the Mediterranean Sea [2]. Gravitational landforms, including landslides of different type and size often occur along active retreating coastal slopes. In these areas, a complex interaction occurs among lithology, structural factors, and Earth surface processes. In fact, the morphogenesis due to gravity often superimposes itself, in space and time, on marine processes contributing to the shaping of this dynamic landscape.
Rocky coasts represent zones with high economic, social, cultural, and touristic value; consequently, many geomorphological studies have been completed along both hard and soft rocky coasts, which generally focused on the factors controlling erosional processes [3]. Moreover, other studies focused on the active morphodynamics along coastal reliefs, emphasizing the role of mass movements along sea cliffs on the present morphoevolution of the coastlines, also considering the associated geomorphologic hazards [4,5,6,7].
The investigation of rocky coasts is often challenging due to the inaccessibility of sea cliffs; consequently, conventional field surveys can be difficult. Likewise, the interpretation of aerial photos can be sometimes difficult due to cliff orientation and/or in the case of high-angle sloping coasts, such as plunging cliffs [8]. A specific method for the continuous acquisition of geological, geomorphological, hydrogeological, and biological datasets along rocky coasts based on a snorkeling approach has been proposed by [9]. The latter is helpful for detailed mapping of landforms and processes at the toe of the sea cliffs but useless for mapping landforms along the uppermost sectors of the coastal slopes. On the other hand, the use of remotely sensed datasets from satellite and/or from aerial platforms, such as from ad hoc flights of unmanned aerial vehicles (UAVs), are suitable for the acquisition of detailed data in inaccessible coastal areas [10,11]. Along the central Adriatic coastline of Italy, a combination of geological–geomorphological field surveys and the spatial interpretation of morphometric variables, derived from digital elevation model (DEM) data, has been successfully proposed by [6] for the study of the slope instabilities in relation with the long-term morphoevolution of a 5 km-long rocky sea cliff.
The increasing availability of high-quality digital topographic data, as digital elevation models (DEMs) derived from airborne LiDAR (light detection and ranging) surveys, accounts for a rising interest in developing quantitative analyses aimed at taking advantage of these detailed, updated, and promising datasets. During recent years, traditional geomorphological maps have been integrated with data directly extracted from DEMs, providing new tools for improving the qualitative and quantitative interpretation of Earth surface processes and landforms [12]. Moreover, land-surface quantitative (LSQ) analyses are valuable for describing the land-surface topography and performing measures of the signature of specific geomorphic processes ([13,14,15], including the references), considering site-specific geological contexts and morphoclimatic settings [16,17], proving to be particularly effective along rocky coasts [6].
In this work, a research approach based on LSQ analysis is presented and aimed at investigating the spatial distribution of gravitational landforms along rocky coasts. The methodological approach is complemented by geological–geomorphological field surveys and the qualitative visual interpretation of available multiplatform remotely sensed datasets including DEM-derived hillshade maps.
The study area coincides with the northern Marche region (Central Italy) coastal zone including the Mt. San Bartolo relief, north of Pesaro town. The coastal slope is characterized by a sea cliff formed on marl and sandstone rocky layers affected by many gravitational processes as landslides of different types, geometry, and state of activity [18,19]. The final objective of this study is to enhance the use of quantitative analyses of land-surface topography as one of the geomorphological applications that can assist the mapping of processes and landforms along coastal areas.

2. Study Area

The Mt. San Bartolo rocky coast stretches for about 10 km in the central–northern sector of the Adriatic Sea between the localities of Gabicce and Pesaro and is included in a natural regional park (Parco Naturale del Monte San Bartolo) (Figure 1). The Mt. San Bartolo coastal area is scarcely anthropized due to the steepness of the slopes and its generalized instability. The landscape is rural with slopes covered by Mediterranean-type vegetation, characterized here by grass, small woods of Turkey oaks (Quercus cerris), and, especially, by Spanish broom. Locally, small patches are cultivated with olive groves, vineyards, and fruit trees.
Some villages (i.e., Castel di Mezzo, Fiorenzuola di Focara, and Santa Marina) lie upon the top of the coastal cliff, which reach maximum height at the summit of Mt. San Bartolo (222 m a.s.l.). The cited rural areas have problems of instabilities and during the last few decades many mitigation and repair measures have been carried out along the slopes [20]. At several points, the coastal shore is protected by block barriers (Castel di Mezzo, Fiorenzuola di Focara, Pesaro), and parts of the rock coast are armored at the toe with protective materials (e.g., Vallugola) [21].
The coastline, consisting mainly of pebbly beaches, presents a NW–SE orientation and its coastal morphodynamics are mainly driven by winds and waves approaching from the NE, NNE, and, subordinately, from the SE. This leads to both longshore and rip currents, the first due to a high incidence angle between the waves and the coastline, and the second caused by waves that reach the shore in parallel [23]. A shore rocky platform, dipping seaward with a gradient of few degrees, occurs up to 5 km offshore. Sea storm waves can reach 1.80–2 m, based on the data obtained from the National Sea-Wave Measurement Network [24], while the average tidal range is about 50 cm measured in the harbor at Pesaro [25].
The climate is mesothermic of Mediterranean type (Csa type according to Köppen classification [26]) with a mean annual temperature equal to 14.6 °C and mean annual rainfall equal to 712 mm, with monthly values ranging from 30 mm (July) to 90 mm (November). The daily mean temperature is 23 °C on July, while is 6 °C on January.

2.1. Geological Setting

In the area, marl and sandstone of the Upper Miocene, pertaining to the Marche–Romagna Apennines foredeep succession, mainly outcrops. The prototorbiditic marls of Upper Tortonian Schlier Fm. outcrop for a few tens of meters at the base of the sea cliff at Castel di Mezzo, Mt. Castellaro, and Santa Marina. The lithology consists of grey-blue marl with beds 20–30 cm thick, with a few cyclic thin black shales [27].
The Gessoso Solfifera Fm. overlies the Schlier Fm. with two unconformities, one postdating the main Upper Miocene compressional tectonic phase that affected the area, and responsible of the foredeep evolution. The Gessoso Solfifera Fm. consists of different evaporites and euxinic shales facies with few calcareous beddings, many meters thick [28]. In these layers is located one of the main regional shallow thrust detachments. An unconformity and the presence of volcanoclastic layers mark the passage to the overlying Late Miocene turbiditic sequences of the San Donato and Colombacci Fms. [27,29]. They consist of alternating marl and sandstone where marl prevails in the lower stratigraphic part, while sandstone is prevalent in the Colombacci Fm., with layers that frequently reach 1 m in thickness. The total thickness of this turbiditic sequence is more than 200 m and represents the main outcrops along the sea cliff.
The Mt. San Bartolo ridge is characterized by a syncline with an arcuate shape with the axis oriented NW–SE in the northern sector, which turns into the N–S direction in the southern part. This structure is located at the hinge zone of a larger NE-verging anticline, affected in the western part by at least two backthrusts imprinting the synform structure. The anticline, with its axis oriented NW–SE (N130°), is thrust towards the NE a few kilometers and the basal detachment outcrops offshore, while a shallow and low-angle thrust shear zone outcrops at the base of the cliff, in correspondence to the Schlier and Gessoso Solfifera Fms. A few right lateral strike-slip faults, striking N–S with offset of few hundred meters and with a shear zone of few decimeters in thickness, affect all the structures at different levels along the coastal area. The geometry of all of the Mt. San Bartolo structures is defined by seismic reflection images and verified by a deep borehole that cross the basal sole thrust [30].
The bedrock attitude along the southern part of the cliff dips toward the NE, while in the central and northern part of the Mt. San Bartolo structure, the layer bedding dips toward the SW, with an inclination of few degrees in antidip slope geometry. The sandstone layers are affected at least by two conjugate systems of subvertical extensional joints striking NW–SE and NE–SW, while N–S and E–W fault shear zones and fractures are localized. These fractures are closely related to the Late Miocene–Pliocene compressional tectonic phase, with subhorizontal maximum compressional stress oriented toward the NE [31]. The most recent joint system, oriented NE–SW, runs parallel to the cliff face. Marl layers have a refracted fracturing also related to the Plio-Pleistocene exhumation process. The geomechanical properties evaluated with a Schmidt hammer revealed that the effective compressive strength measured on the sandstones and marls shows a significant reduction from 40 MPa in dry conditions to 15 MPa in wet rocks.

2.2. Geomorphological Setting

The Mt. San Bartolo coast consists of a very steep seaward slope whose morphogenesis is mainly conditioned by marine and gravity-driven processes (Figure 1). Along the coastline, narrow and discontinuous sandy and gravel beaches are present. The widespread landforms are ascribable to landslides of different depth, size, and state of activity [32,33]. Slides, slumps, and flows are the most common landslide types affecting the slope. Furthermore, phenomena of generalized shallow instability, caused by the action of running water rather that gravitational processes, characterize large areas. The extensive occurrences of mass movements cause a generalized retreating trend of the entire coastal cliff. About 6000 years. BP the shoreline was located seaward with respect to its present position, about 300 m in the Castel di Mezzo zone, while during the Roman period it was some tens of meters seaward with respect to the present one [25,34]. As products of the retreating process, an extended wave-cut platform fronting the entire plunging cliff is observable. Abundant landslide deposits lay at the base of the cliff, protecting the slope toe from erosion played by the sea, the latter being the main landslide-causing factor during the short time recognized in the area. Significant rainy events are also identified as a relevant landslide-causing factor as reported in historical information [25,35], according to which numerous landslide events, especially of shallow typology, occurred in connection with exceptional rainy periods.

3. Materials and Methods

Land-surface quantitative (LSQ) analysis was performed starting from a digital terrain model (DTM) (i.e., a digital elevation model filtered from vegetation and anthropic features), with ground resolution of 2 m and altimetric accuracy of ±15 cm, derived from an airborne LiDAR (light detection and ranging) dataset available for the entire Italian coastal area, available at www.pcn.minambiente.it [36].
LSQ analysis was supported by geomorphological and structural surveys. The latter were completed by the visual interpretation of multitemporal panchromatic (years 1988–1989, 1994–1998), and color orthophotos (years 2000, 2006, 2012), available at www.pcn.minambiente.it as a web map service (WMS). Furthermore, low altitude vertical nadir and oblique images acquired with a small UAV were used for detailing the previous datasets.
An accompanying topographical dataset, available for the study area in vector format at the scale of 1:10,000, was used as the base map. Geographic information system (GIS) platforms (ESRI—ArcGIS and QGIS) were used for storing geomorphological and geostructural data derived from the surveys, for the elaboration of the morphometric variables, and to complete quantitative geomorphic analyses.

Morphometric Variables

The objective categorizations of land surface entities, the basis of quantitative geomorphic analyses, can be performed by means of selected parameters and indexes. Many morphometric variables have been proposed in the scientific literature to provide a quantitative description of topography and for defining the topographic signature of different Earth surface processes and landforms [14,15,37,38].
In this study, four morphometric variables were selected and computed starting from the available 2 m cell-size DTM; these are slope angle (slope), elevation standard deviation (ESD), roughness (R), and topographic ruggedness index (TRI).
Slope is a local parameter of geometric type and was obtained using the surface slope algorithm running in the Spatial Analyst extension of ArcGIS 10.8.1. This latter computes the first derivative of the elevation surface or the maximum change in elevation on a cell-by-cell basis (i.e., the steepest downhill descent from the cell) [39]. This parameter is considered as a basic parameter for defining the specific signature of several geomorphic processes and especially of gravitational phenomena [40,41,42,43]. Besides the fact that stable and unstable areas exhibit different slope values, different landslide types are also distinguished by variations of this parameter [44,45,46,47,48]. The slope values were computed using the dedicated tool in the Spatial Analyst extension of ArcGIS 10.8.1.
ESD is of statistic type and was computed by performing a neighborhood operation using a 3 × 3 moving window where the output value for each cell represents the standard deviation value within the window considered [15]. ESD is a measure of the amount of variation in heights within the selected area where values close to zero indicate flat zones. The ESD values were computed using the focal statistics approach in the Spatial Analyst extension of ArcGIS 10.8.1.
R was considered as the third morphometric variable. This is largely adopted to quantify the topographic complexity as a function of the elevation variability of landscapes within an area and, being scale-dependent, there are several approaches proposed for its computation. Here it is expressed as the largest intercell absolute difference of a focal cell and its surroundings [49], defined as a 3 × 3 cell moving window in our study [15], defined by the Equation (1):
R = E m a x E m i n
where Emax and Emin are the maximum and the minimum elevations in the neighborhood considered.
The R values were computed using the focal statistics approach in the Spatial Analyst extension of ArcGIS 10.8.1 and, later, applying the subtraction operation by means of the Raster Calculator tool.
Lastly, the TRI was computed considering the equation proposed by [50], to which readers may refer for more details. This index concurs to define the complexity of the terrain quantifying the mean value of the absolute difference in elevation (z) between a focal cell and its surroundings, which in our study is a 3 × 3 cell window [15] (Equation (2)):
T R I = z 1 ; 1 z 0 ; 0 + z 0 ; 1 z 0 ; 0 + z 1 ; 1 z 0 ; 0 + + z 1 ; 0 z 0 ; 0 + z 1 ; 0 z 0 ; 0 + + z 1 ; 1 z 0 ; 0 + z 0 ; 1 z 0 ; 0 + z 1 ; 1 z 0 ; 0 8
where the focal cell is indicated with (0; 0) and the eight surrounding cells, starting from the cell in the top right and proceeding clockwise, are, respectively, (−1; 1), (0; 1), (1; 1), (1; 0), (1; −1), (0; −1), (−1; −1), and (−1; 0). TRI was calculated with the specific GDAL tool available in the QGIS 3.12.1 software.

4. Results

The multifaceted approach, which includes geomorphological and geological field data in support of LSQ analysis, has led to: (i) compilation of a geological–geomorphological map with special detail for gravitational landforms; (ii) inspection of the spatial distribution of the value of four morphometric variables; (iii) interpretation of the descriptive statistics of four morphometric variables inferring the relation among the values of each variable and the gravitational landforms; (iv) exploration of the ratio among the morphometric variables; and (v) evaluation of the spatial variation of the morphometric variables in relation to the presence of landslides and the geostructural assets of the rocky mass.

4.1. Geomorphological and Geological Field Data

Field survey findings and image analysis, based on the wide-ranging dataset, allow for the production of a geological–geomorphological map with special details on gravitational landforms (Figure 1).
The San Bartolo coastal area is deeply affected by landslides of different typologies, which cover up to the 40% of the total area (pie chart in Figure 1) and mainly account for erosional landforms at the upslope zones and abundant landslide deposits along the footslope.
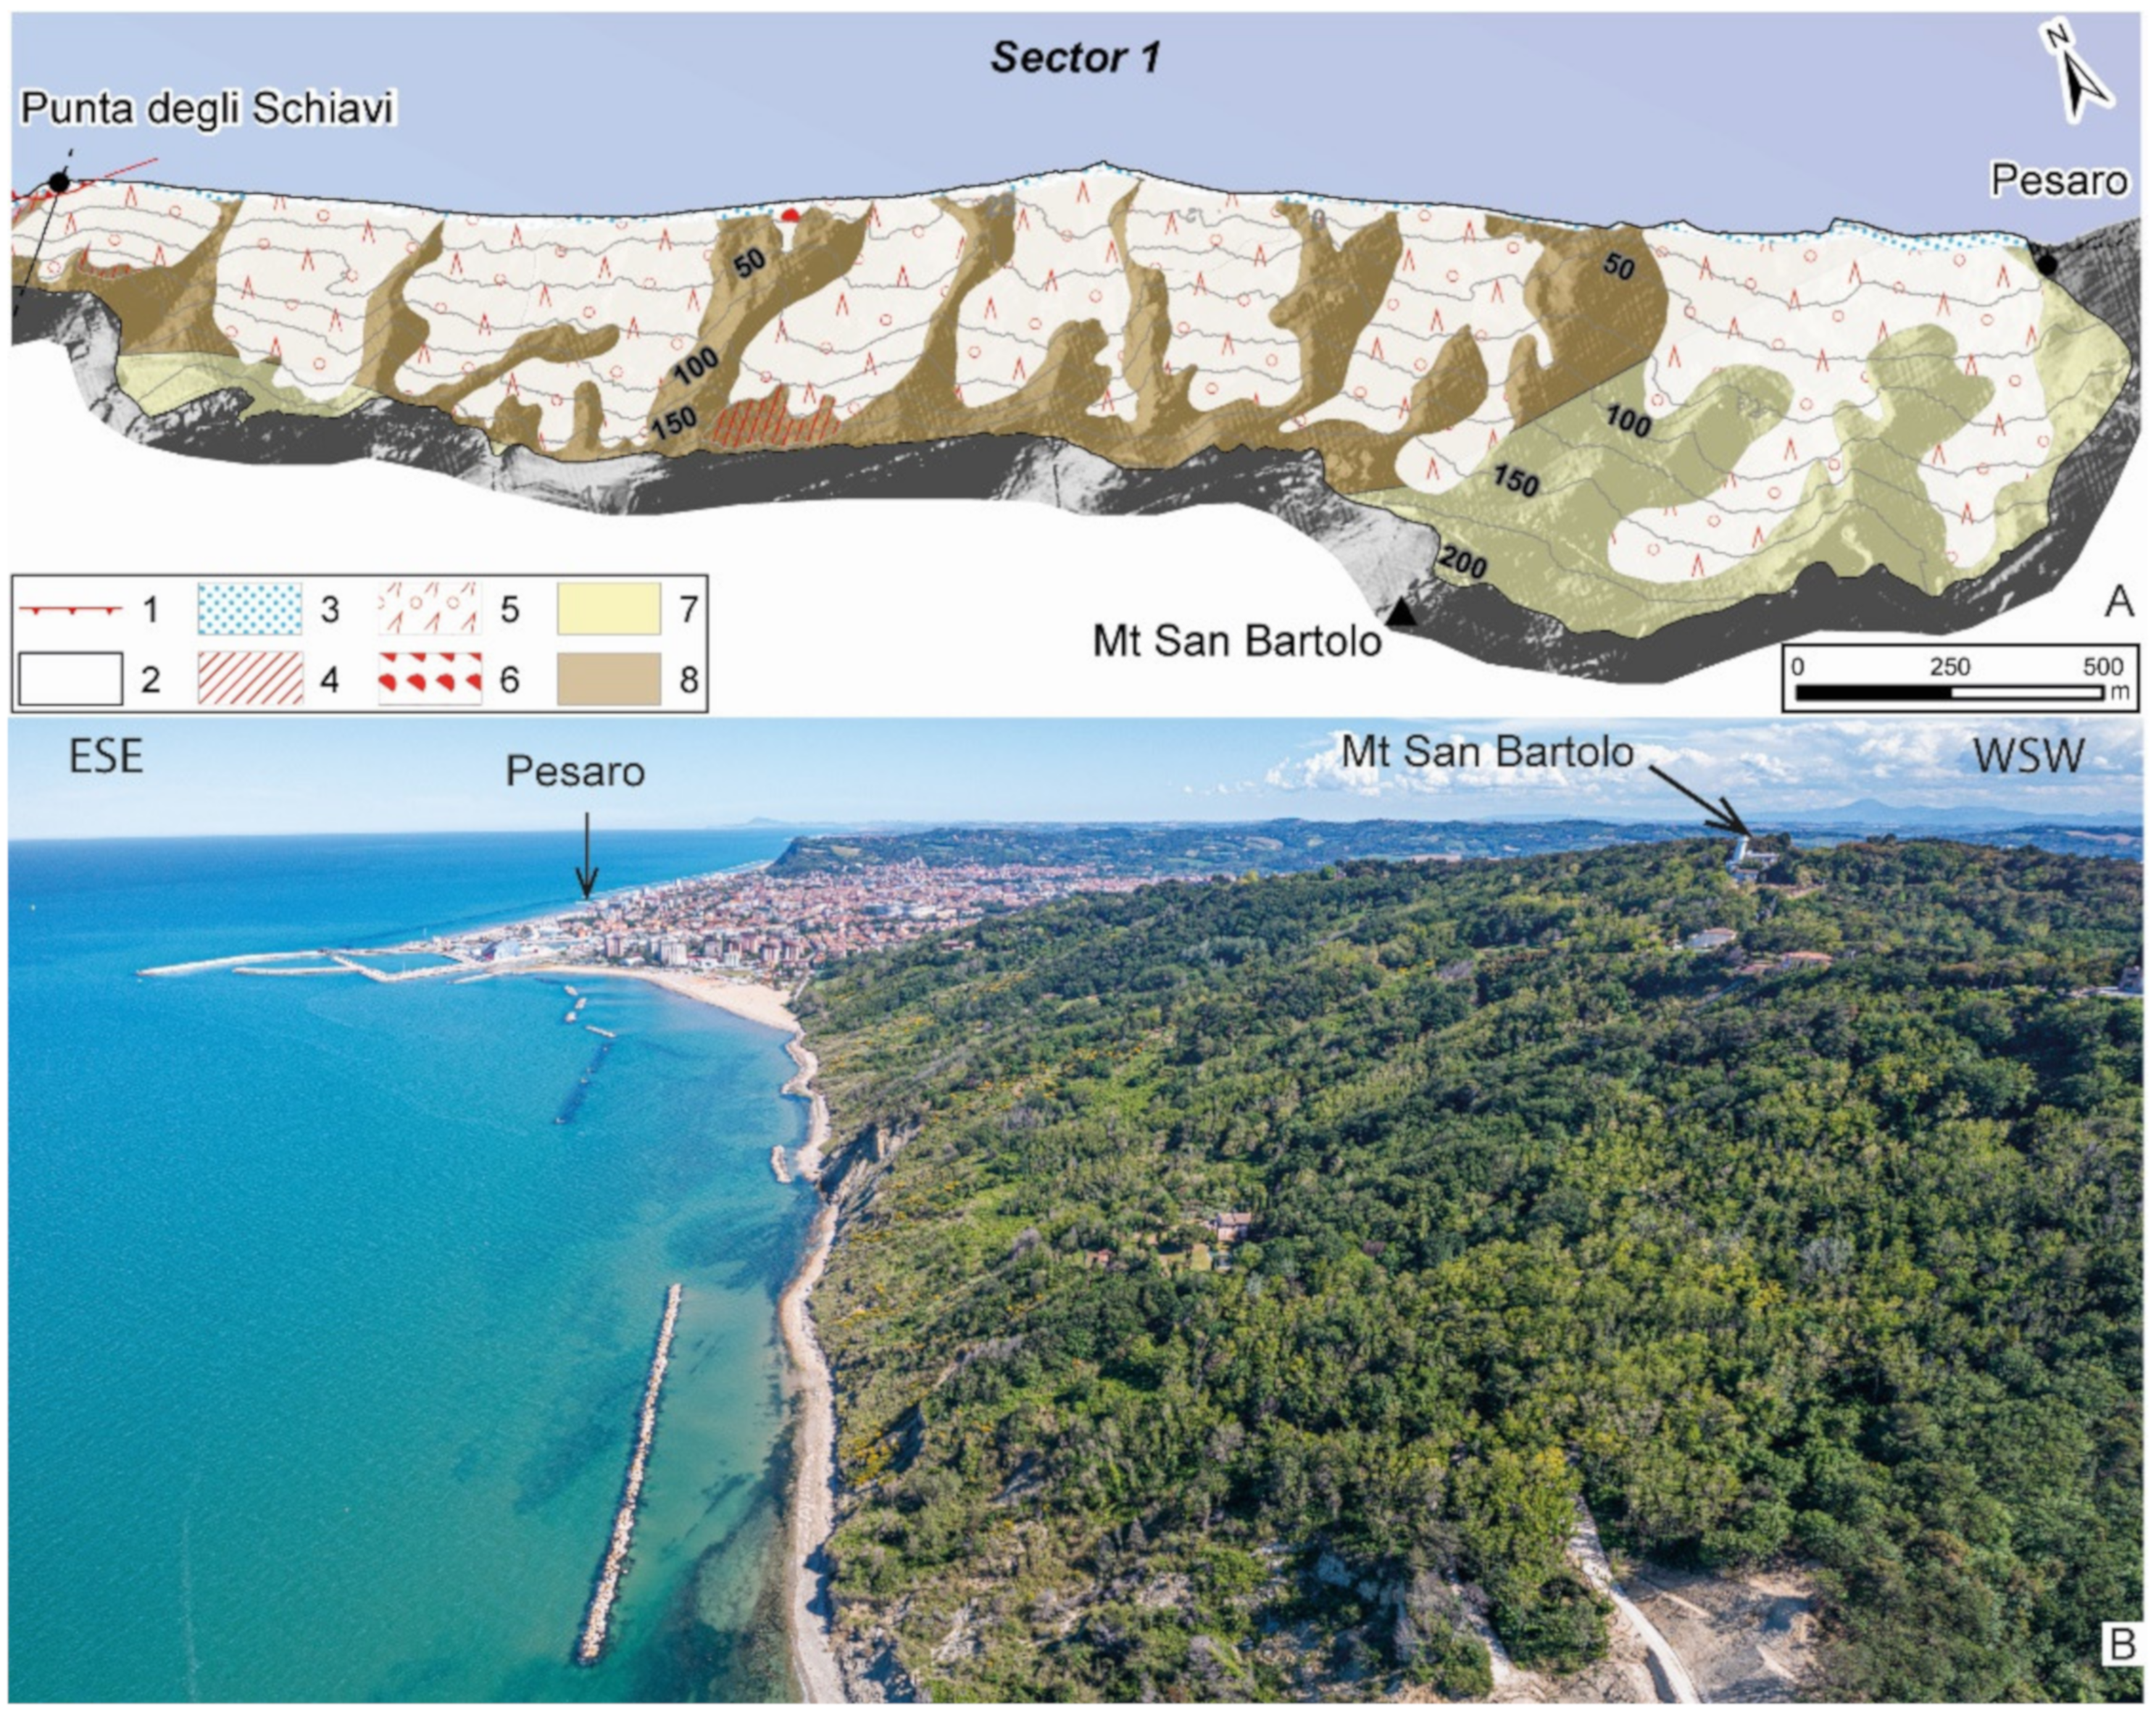
Slide phenomena are prevalent (20% of landsliding area) and characterize the largest mass movements observable in the area with extensions reaching 0.15 km2. They involve both the Colombacci Fm. and San Donato Fm. and occur in the southern sector between Pesaro and Punta degli Schiavi (sector 1) (Figure 2), where the concordant dip between slope and stratification induces large mass movements characterized by translational slide kinematics.
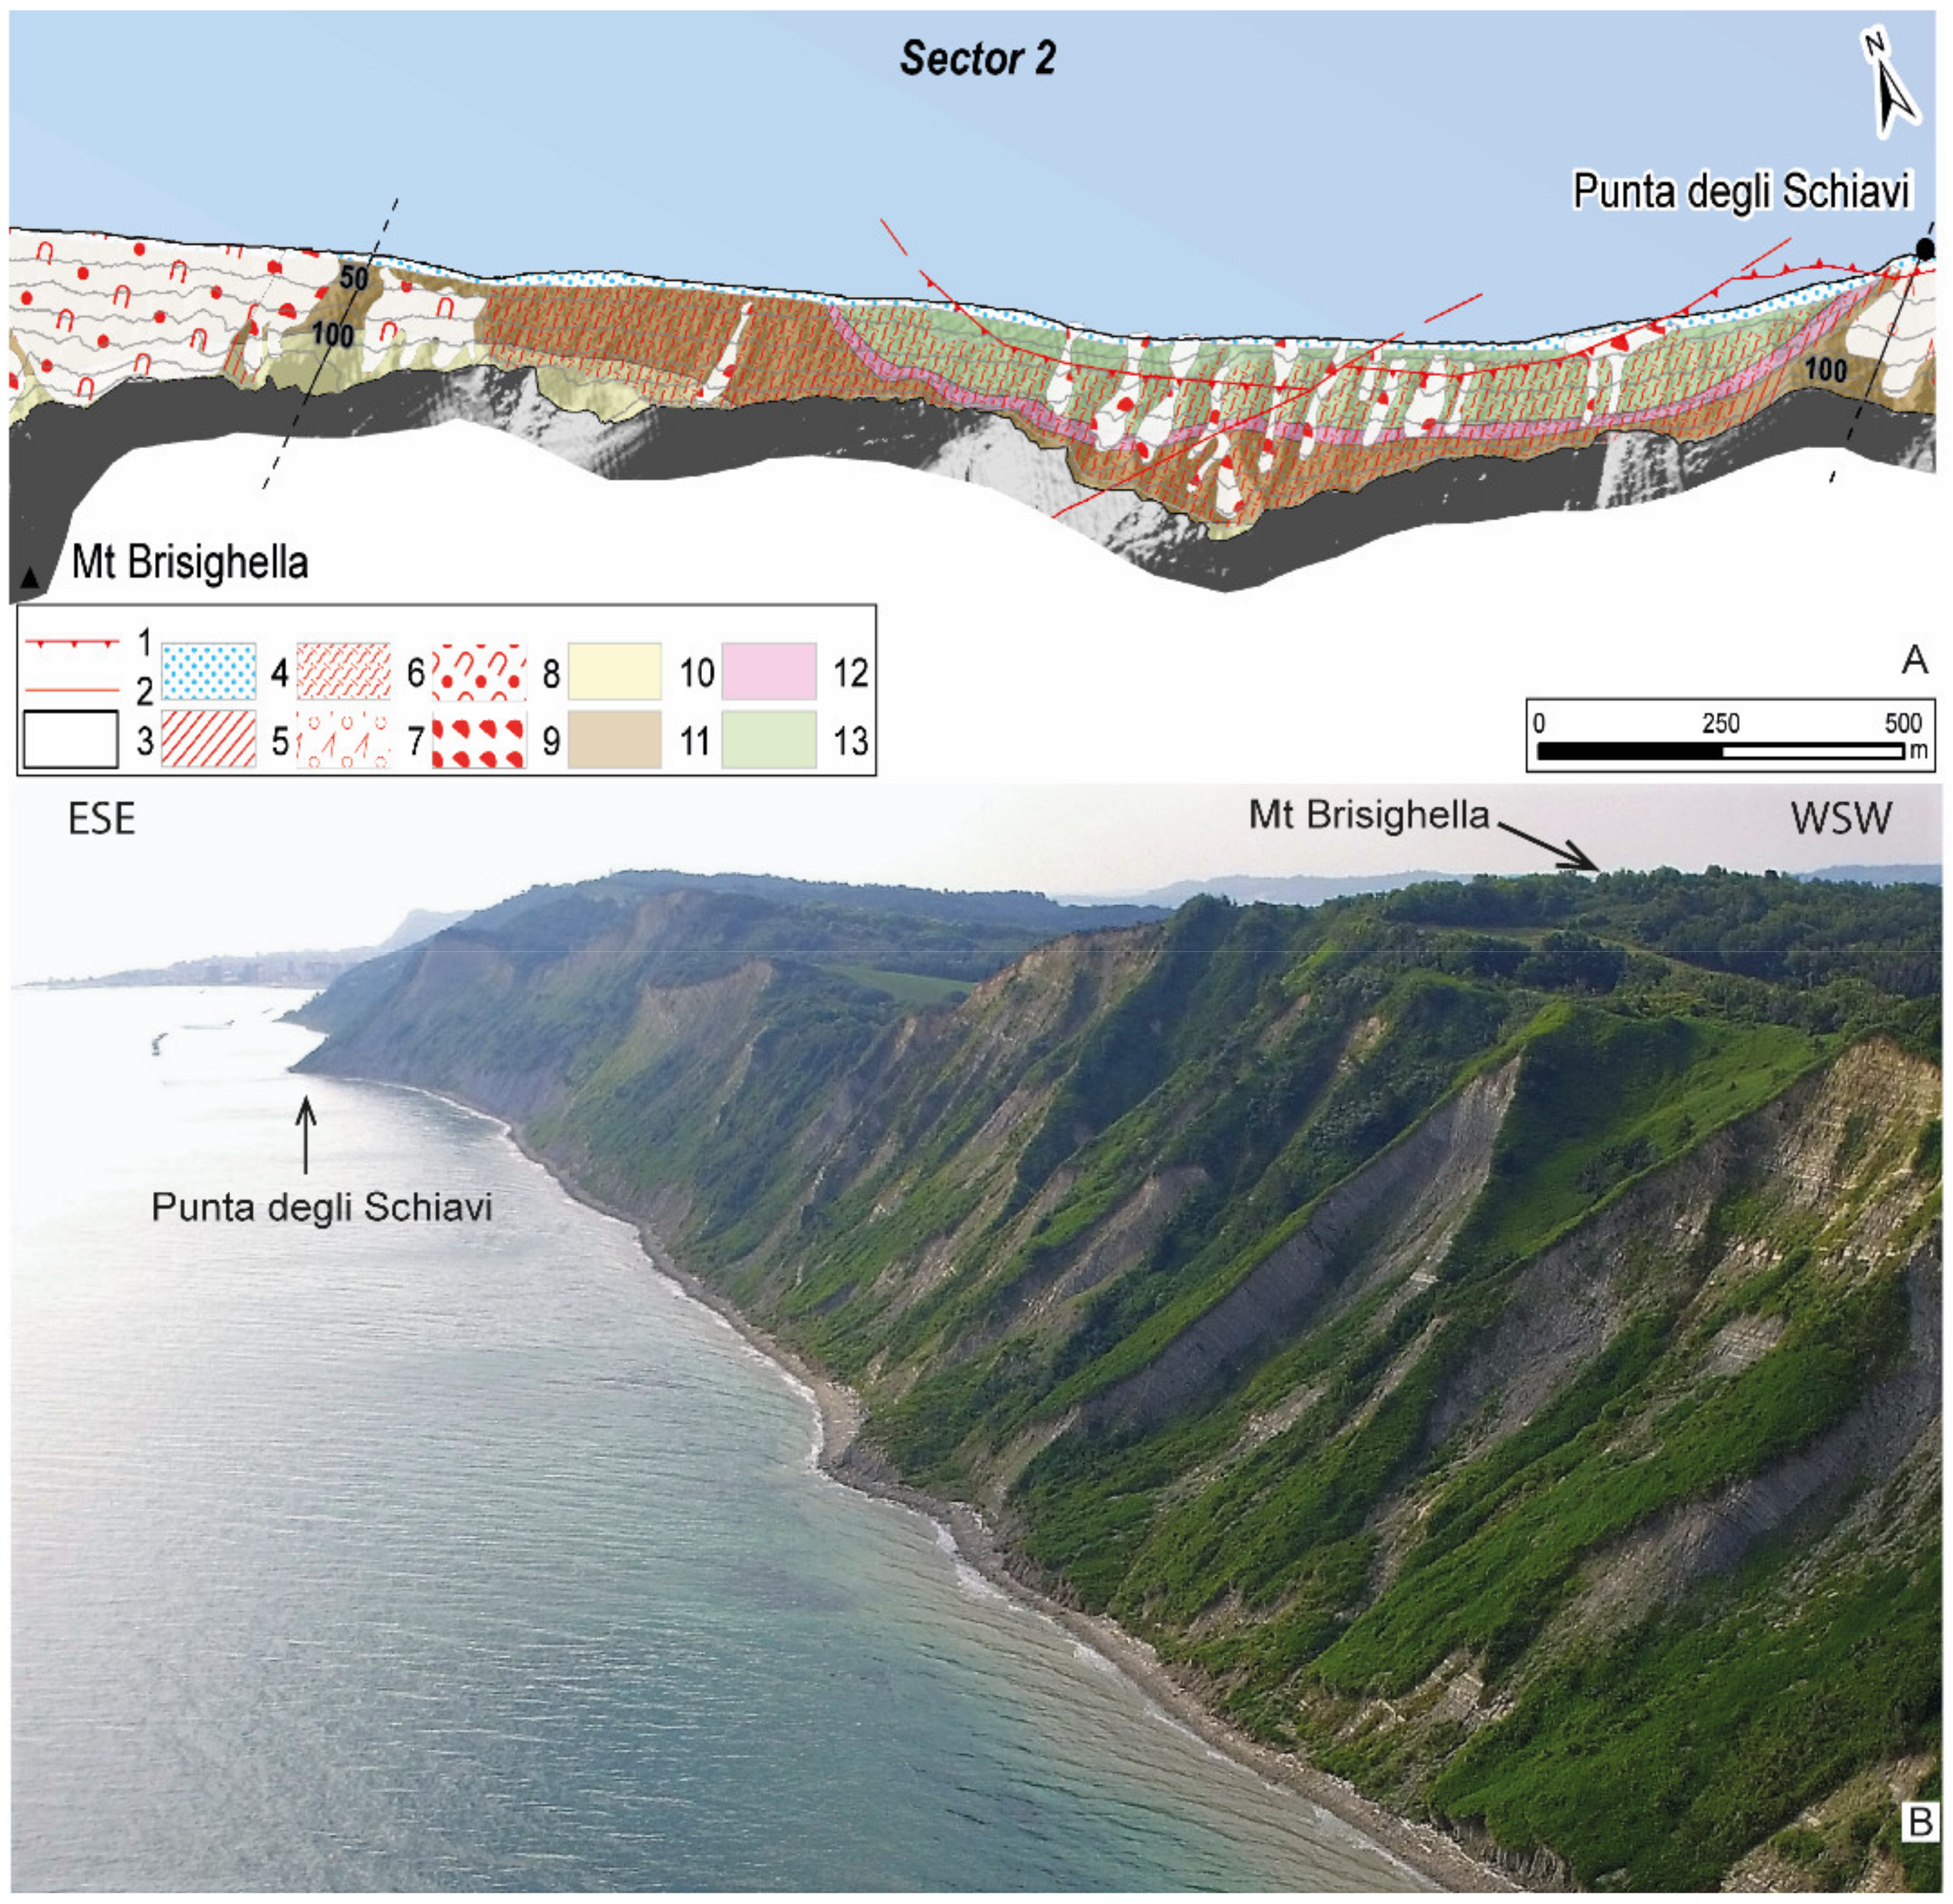
The coastal slope between Punta degli Schiavi and Mt. Brisighella (sector 2) is characterized by diffuse instability, corresponding to 4% of the total area occupied by landslides (Figure 3). Here, typical landforms are mainly due to running water processes and only subordinately to gravitational processes. The large slope angle values favor a generalized instability condition of the sector with subparallel deeply incised hanging gullies alternating with narrow ridges. Earth-debris flows of limited extent take place on the coastal slope of Mt. Castellaro.
A cross-dip slope relationship between the attitude of the bedding planes, here dipping toward the SW, and the geometry of the slope occurs in the outer side of the syncline. Several NE verging thrust low-angle shear zones are localized along the shoreline at the base of the San Donato Fm., in the Schlier marls, and in the Gessoso Solfifera layers. Right lateral N–S strike-slip faults with decametric offset affect different part of the cliff and can favor slope instabilities.
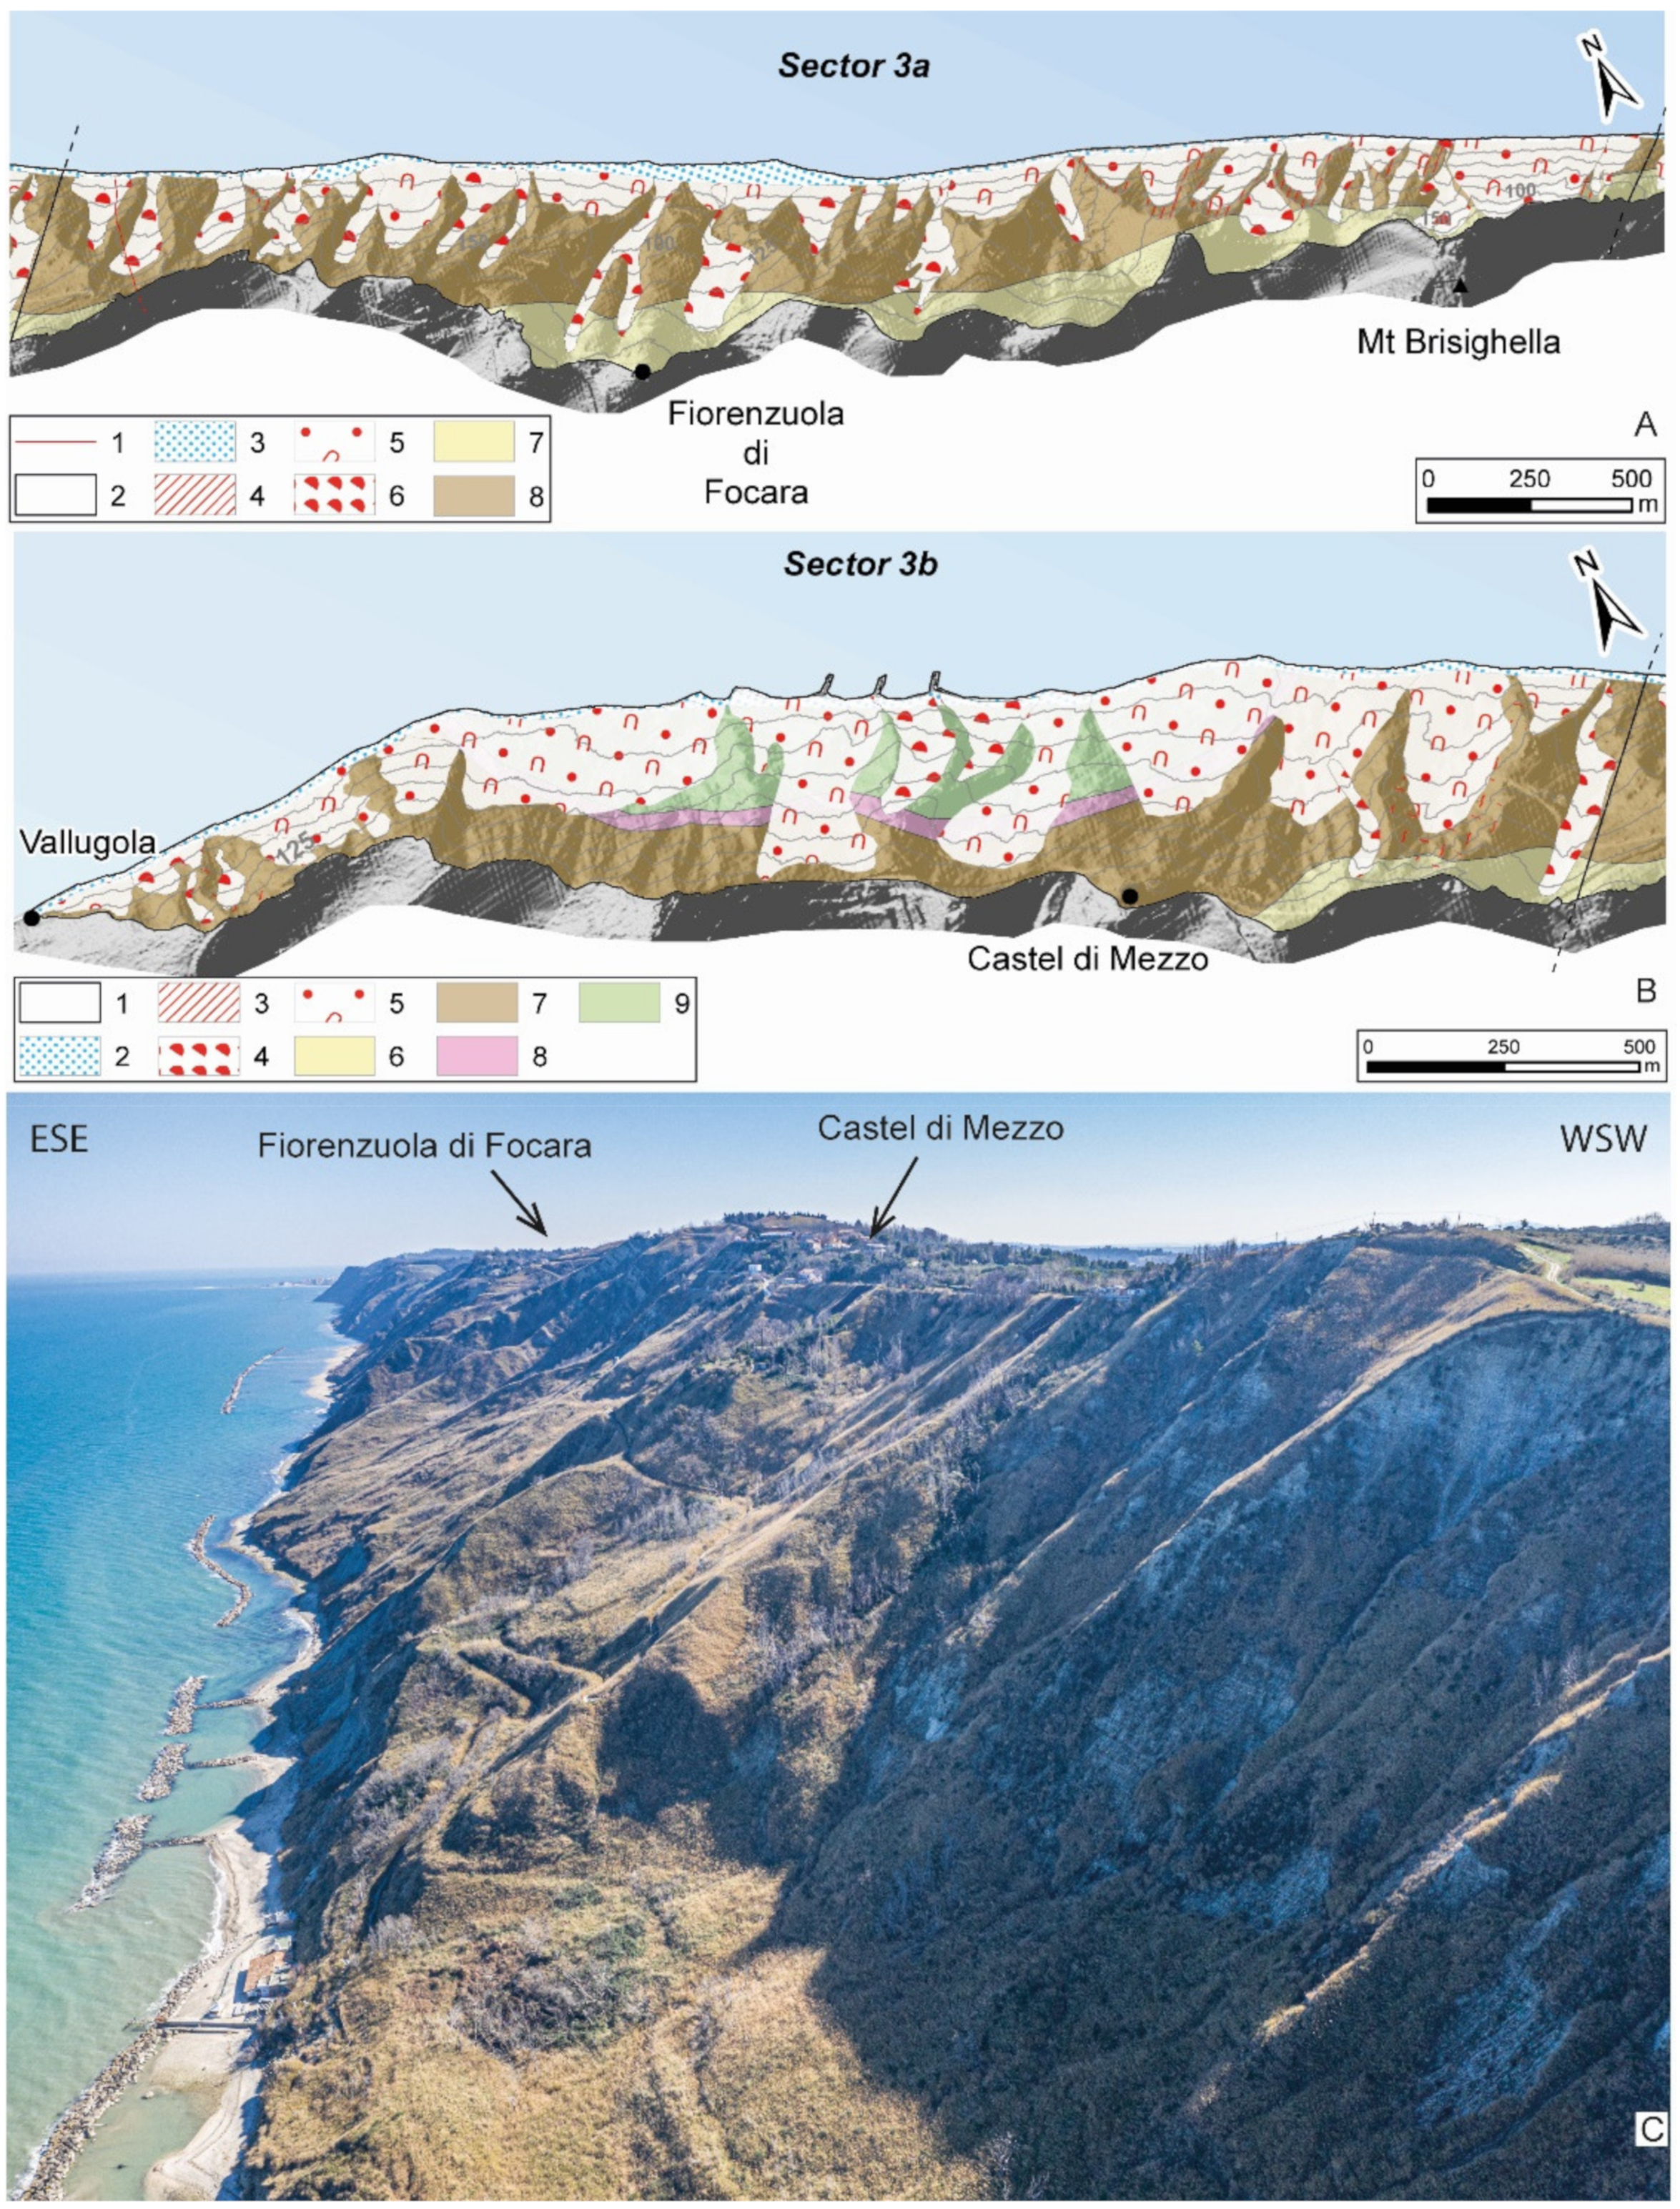
Afterward, in the sector between Mt. Brisighella and the Vallugola harbor (sector 3), mass movements are widespread (Figure 4). Here, slumps (16% of the total landsliding area) and flows (8% of the total landsliding area) of considerable size and depth affect the slope from the watershed to the shoreline. Flows mainly occur in the southern portion of this sector between Mt. Brisighella and Castel di Mezzo (sector 3a), while slumps characterize the northern zone between Castel di Mezzo and the Vallugola harbor (sector 3b). Gravitational phenomena here even threaten infrastructure, as roads and settlements are present along this coastal sector. Bedrock is characterized by bedding planes that dip toward the SW. In sector 3a, landslides involve the San Donato Fm. and subordinately the Colombacci Fm., while also in sector 3b the terrain belonging to the Gessoso Solfifera Fm. and Schlier Fm. are intersected by gravitational phenomena. In sector 3a, a right-lateral strike slip fault, oriented about N–S with a shear zone many meters wide, is observable along the cliff.

4.2. Spatial Distribution of Morphometric Variables

The four morphometric variables selected were processed and their spatial variations evaluated. As a first approach, the computed variables were analyzed by means of visual interpretations aided by superimposing color-coded maps to a hillshade map (Figure 5). This initial assessment is highlighted as the sector encompassing Pesaro–Punta degli Schiavi (sector 1) shows low values for all four variables, while the sector encompassing Punta degli Schiavi–Mt. Brisighella (sector 2) clearly stands out with respect to the surrounding zones. Moreover, the Mt. Brisighella–Vallugola harbor sector (sector 3) presents high local variability, both within the Mt. Brisighella–Castel di Mezzo portion (sector 3a) and within the Castel di Mezzo–Vallugola harbor area (sector 3b) (Figure 5). In detail, the outputs were also overlaid with the landslide spatial distribution obtained by field surveys, and this cross comparison provides at a first glance a significant visual correspondence between the highest values of each variable and the presence of landslide bodies. In particular, the three metric-based variables (i.e., ESD, R, and TRI) provided, though with different value ranges, very similar spatial distributions.

4.3. Descriptive Statistics of Morphometric Variables

The distribution of the four selected variables was also explored and defined through the analysis of the main descriptive statistic parameters for pointing out similarity and difference in the tendency of the morphometric variables in relation to the presence of landslide features. In detail, the variable trends were investigated (i) for each identified coastal sector, (ii) for the areas affected or not affected by landslide phenomena, and (iii) for each recognized landslide type.
In sector 1, the slope variable shows a maximum value of about 70° and mean values of 24° (table in Figure 5a and Figure 6a). Otherwise, the slope variable presents in sector 2 diffusely high values with a mean around 40° and maximum value >80°. Similarly, sector 3a and 3b show slope values that reach 80° but with a mean value of about 30°.
Sectors also differ for the slope value distribution. Sector 1 is characterized by a standard deviation equal 12.78°, negative kurtosis (−0.31) and positive skewness (0.37); sector 2 presents a comparable standard deviation (12.59°) but positive kurtosis (0.61) and negative skewness (−0.42); lastly, sector 3a and 3b show higher standard deviation values, respectively, of 15.41 and 14.26, negative kurtosis (respectively, −0.69 and −0.58), and slightly negative skewness (respectively, −0.12 and −0.05). These trends are further appreciable considering the slope values normalized in relation to the spatial extension of each sector (Figure 6b).
Areas in which landslides occur are characterized by most of the slope values ranging between 20° and 45° with mean value of 30° and mode value of 26° (table in Figure 5a; Figure 6c). Otherwise, in the zones where landslides are not recognized, slope values are slightly different with a mean value of 28° and mode value of 29°. The slope value distribution is generally similar in areas with or without landslides, with standard deviation, respectively, of 13.91 and 15.67, negative kurtosis (respectively, −0.57 and −0.77) and positive skewness (respectively, 0.15 and 0.10). Additionally, for this subset, analyses of the delineated trends are more evident considering the normalized values (Figure 6d).
Distinct slope value distributions also characterize the different landslide typologies (table in Figure 5a and Figure 6e). Slides shows slope values ranging from 0 to 69° with mean and median values of about 23°, while slumps present a comparable maximum value of 74° but mean and median values of about 32°. Similar mean and median values (33°) belong to flows, but reveal a maximum slope value of 77°. The maximum slope value (81°), however, is reached by the diffuse instability phenomena, which also present higher mean and median values of about 43°.
The mode values of the four landslides typologies range from 22° for slide movements to 41° for areas typified by diffuse instability with slump and flow phenomena, which show rather similar values of 35° and 38°. The slope value distribution of slumps and flows is quite similar with negative kurtosis of −0.61 and −0.41, respectively, and negative skewness of −0.07 and −0.04, respectively. Conversely, the slides show a trend with a positive skewness (0.45) and a negative kurtosis (−0.18), while the diffuse instability areas are characterized by a positive kurtosis of 0.27 and a negative skewness of −0.04. The standard deviation values range from about 11° in areas typified by diffuse instability to about 13° for slumps, including slide and flow phenomena with a value of about 12°.
The evidence described above is prominent in plots showing normalized slope values (Figure 6f).
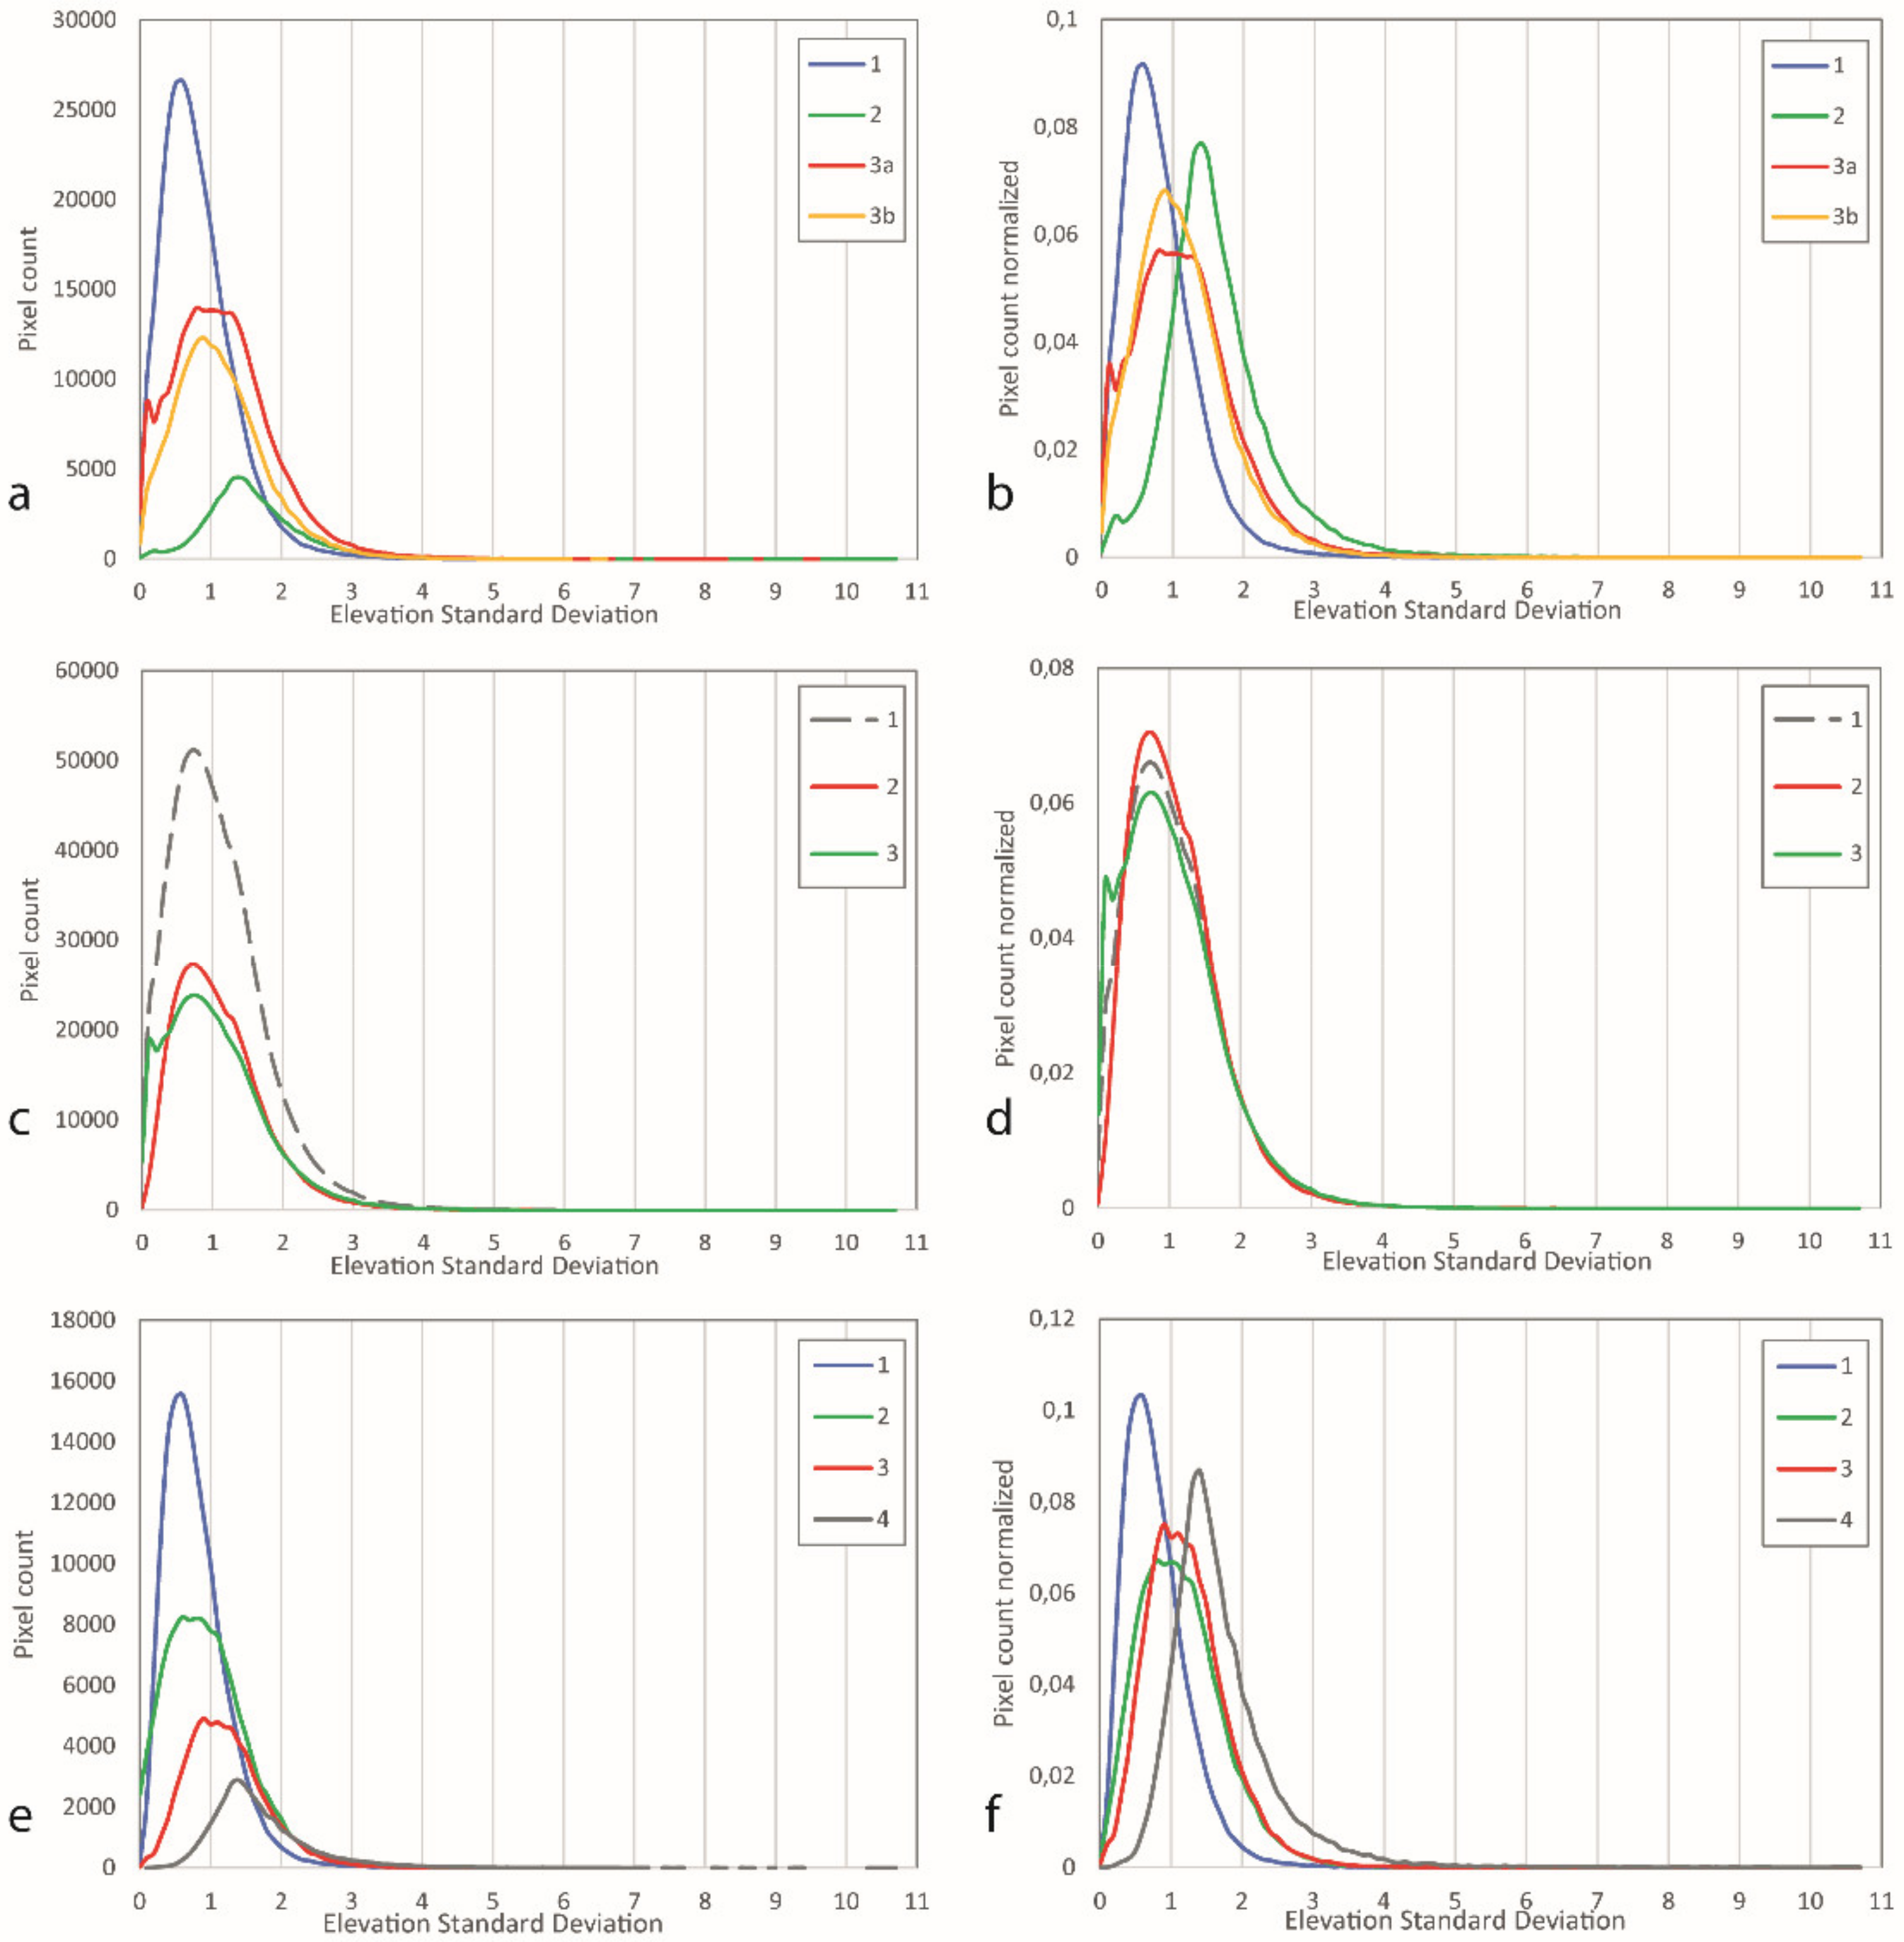
The ESD variable shows values ranging from 0 to 10.74 m reached in sector 2 (table in Figure 5b and Figure 7a) characterized by a mean value of 1.65 m and a median of 1.52 m. In sector 1, the maximum value is about 5 m, the mean is 0.82 m, and the median values is 0.74 m. Sectors 3a and 3b show, respectively, maximum values of 9.59 and 6.87 m, mean values of 1.14 and 1.07 m, and median values of 1.10 and 1.06 m. The sectors exhibit similar ESD value distribution with standard deviation values ranging from 0.51 m in sector 1 to 0.80 m in sector 2 and skewness values ranging from 1.01 m in sector 3b to 2.09 in sector 2. Just the kurtosis value of sector 2, equal to 10.95 m, differs from the kurtosis values of other sectors, which range from 2.09 to 3.33 m.
The area affected by landslides does not show ESD values significantly different from those of the total study area and of the zones without landslides (table in Figure 5b and Figure 7c). The mean values are in the range 1.04–1.10 m, the median is about 1 m, and the standard deviation is 0.65–0.70 m. The kurtosis values range from 7.85 m for areas with landslides to 2.55 m for areas without. The skewness values are slightly different (1.16–1.67 m).
The ESD trend revealed distinct landslide types (table in Figure 5b and Figure 7e). In detail, slides and zones characterized by diffuse instability are clearly distinguished with mean values of 0.80 and 1.70 m, together with median values of 0.72 and 1.54 m, respectively. Slumps and flows show a similar trend with mean values of 1.15 and 1.23 m combined with median values of 1.08 and 1.16 m, respectively. The ESD value distributions present standard deviation ranging from 0.45 m for slide phenomena to 0.75 m in areas with diffuse instability, where the kurtosis value is the largest at 12.59 m. All four landslide types show positive skewness (0.87–2.39 m).
These trends are further appreciable taking into account the normalized ESD values (Figure 7b,d,f).
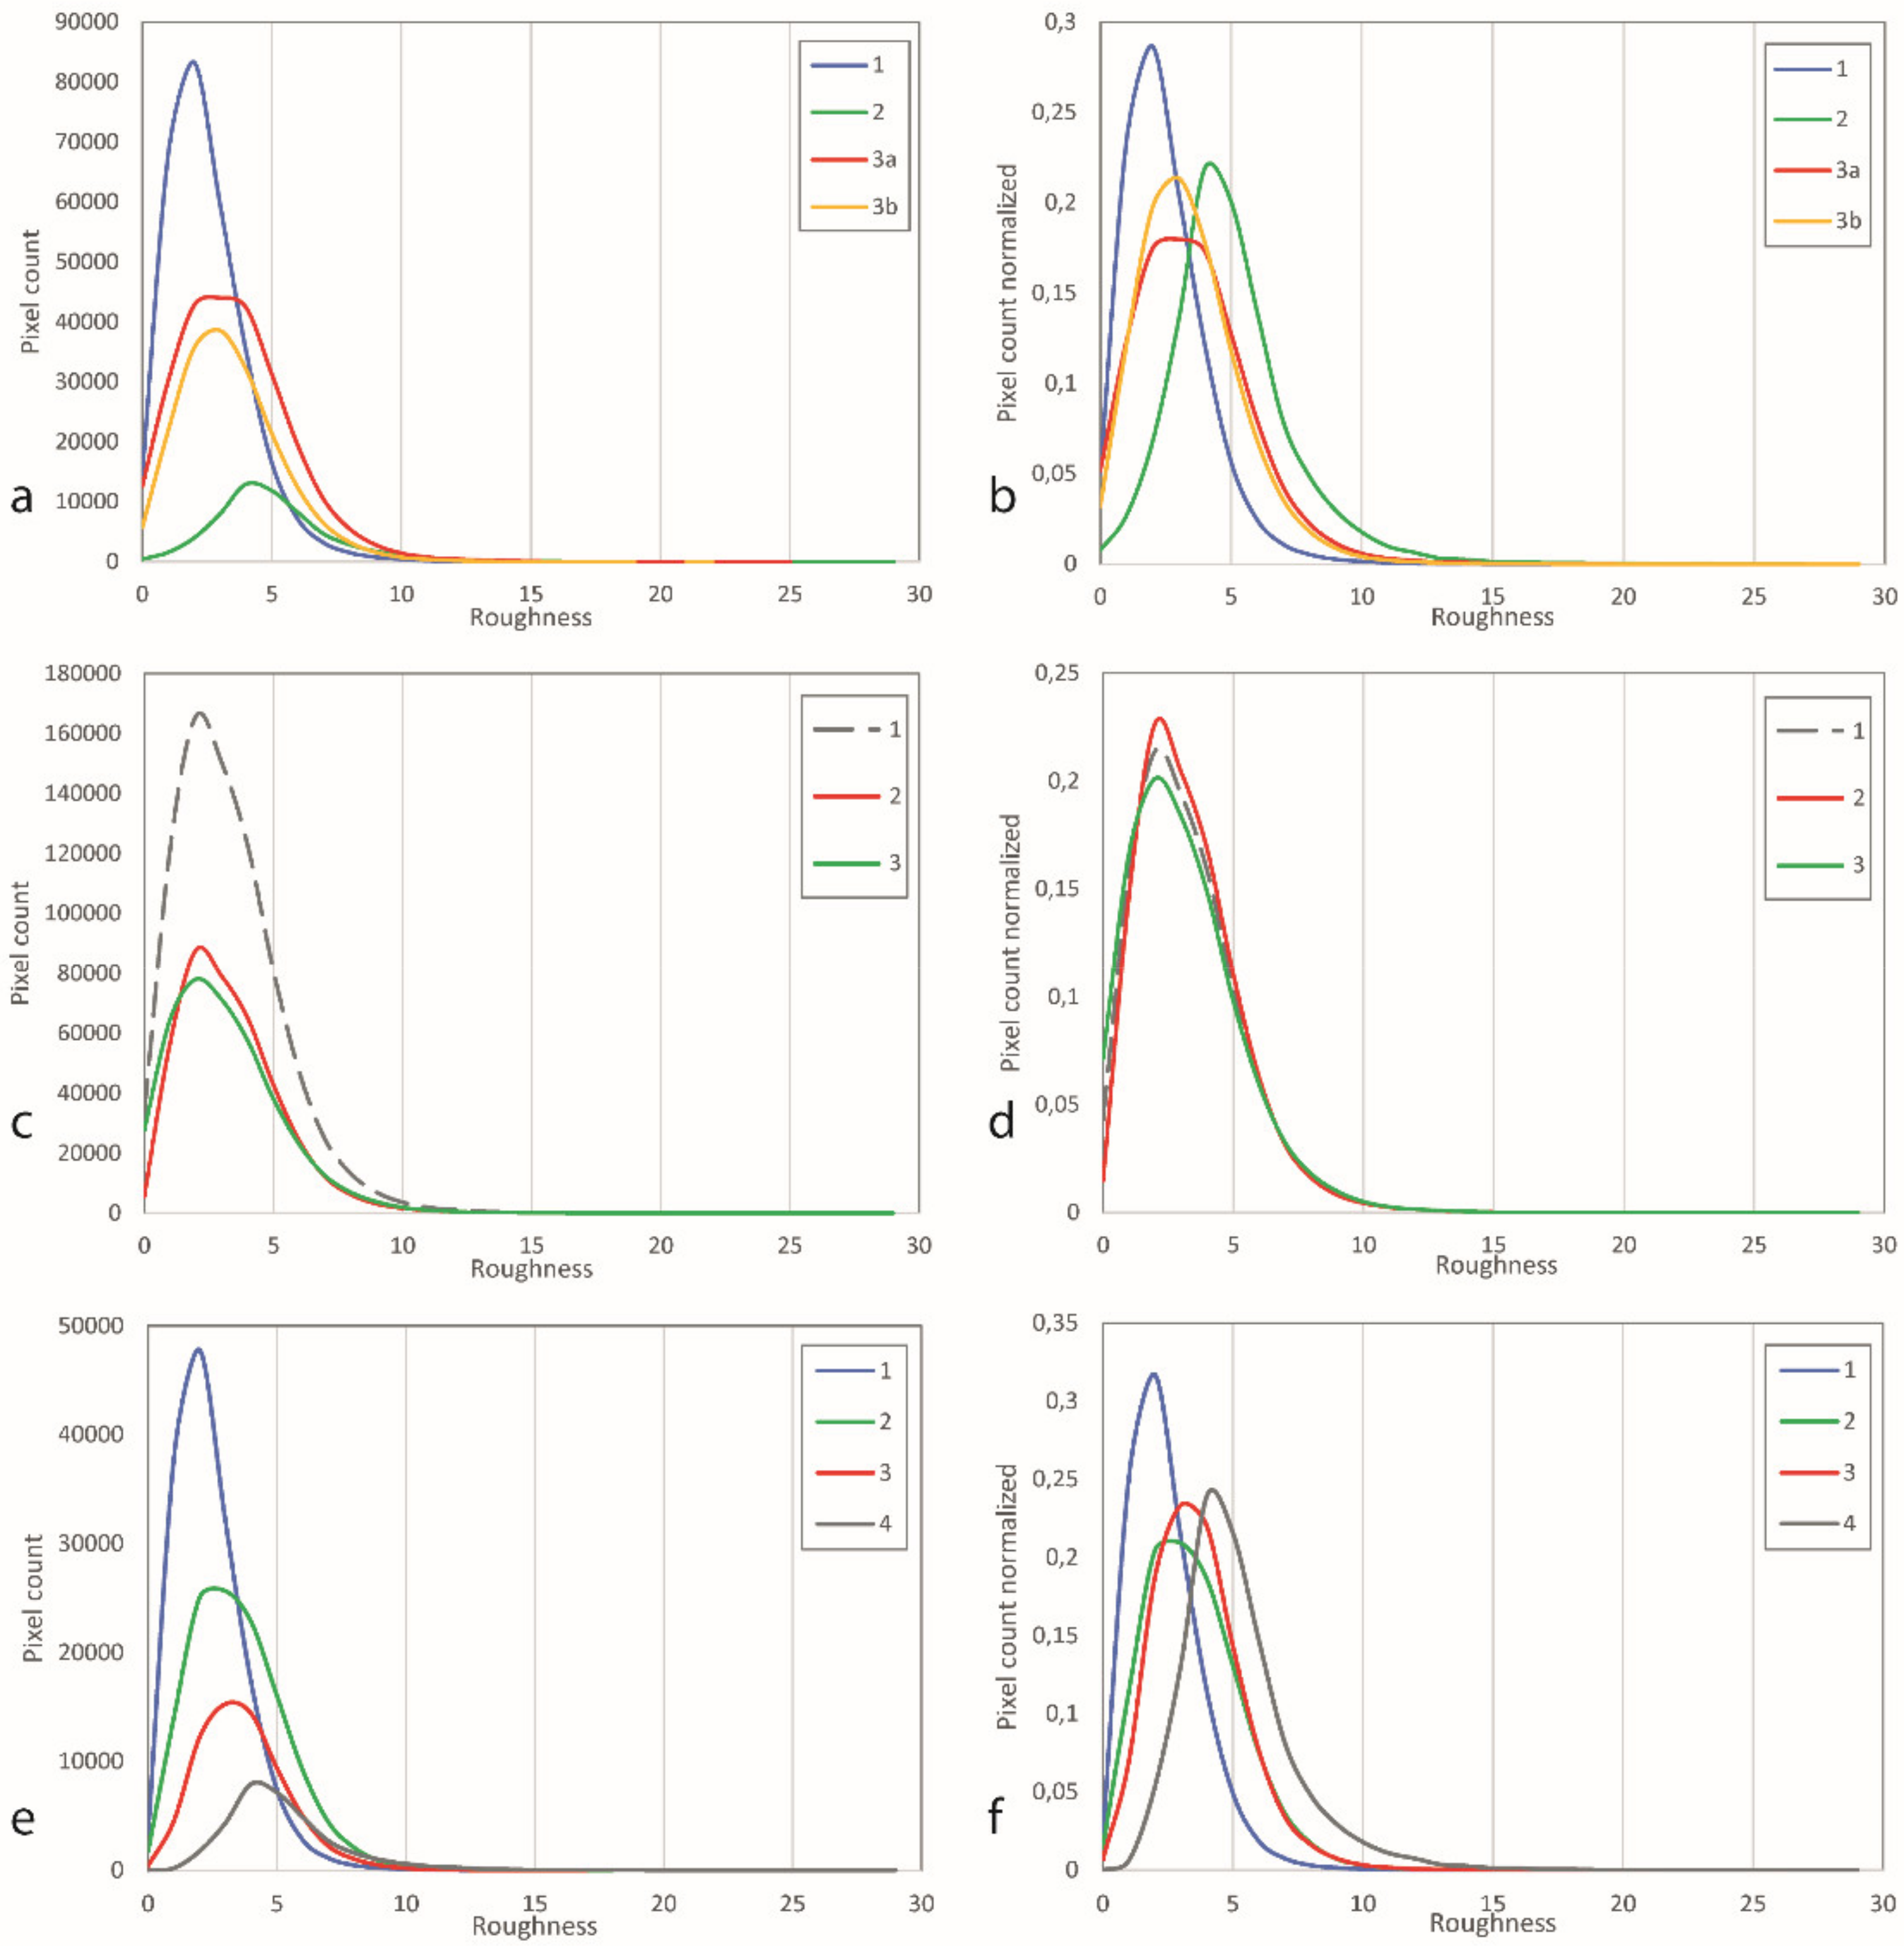
The R value trends are comparable with those of the ESD variable described above, though in a wider range of values (0–28.64 m) (table in Figure 5c and Figure 8). Sector 1 exhibits the lower maximum (17.20 m) while sector 2 presents the highest (28.64 m), and sectors 3a and 3b show inner values (25.40 and 21.80 m, respectively) (table in Figure 5c and Figure 8a). The mean values, which do not significantly differ from medians (±0.30 m), are 5.05 m for sector 2, 3.56 m for sector 3a, 3.44 m for sector 3b, and 2.51 m in sector 1. The four sectors show standard deviation ranging from 2.44 to 1.58 m, positive kurtosis (respectively, 3.05; 7.48; 2.21; 1.73 m) and skewness (respectively, 1.29; 1.71; 0.98; 0.95 m).
As for the ESD values, the R values also do not vary significantly between the entire study area and the zones affected or not affected by landslides (table in Figure 5c and Figure 8c). The mean values are in the range 3.15–3.36 m, the median is about 3 m, and the standard deviation is in the range 2.00–2.13 m. The kurtosis value ranges from 5.65 m for areas with landslides to 2.17 m for areas without landslides. The skewness values are comparable (from 1.11 to 1.48 m).
Likewise, the trend of the R values allows for distinguishing the landslide types (table in Figure 5c and Figure 8e). Slides are characterized by a maximum value of 13.50 m, mean value of 2.44, and median value of 2.19. Areas with diffuse instability show a maximum value of 5.22 m, mean value of 3.97, and median value of 3.78 m. Slumps and flows exhibit maximum values of 17.55 and 21.80, respectively, and similar values both in mean (respectively, 3.51 and 3.70 m) and median values (respectively, 3.28 and 3.51 m). The standard deviation values are 1.41 m for slides, 2.29 m for diffuse instability, 1.86 m for slumps, and 1.75 m for flows, while kurtosis ranges from 8.71 m for areas with diffuse instability to 1.03 for the slumps. Skewness values are positive and vary from 0.80 m for slumps to 1.97 m for diffuse instability zones.
For the R variable, the trends described above are also further appreciable considering the normalized values (Figure 8b,d,f).
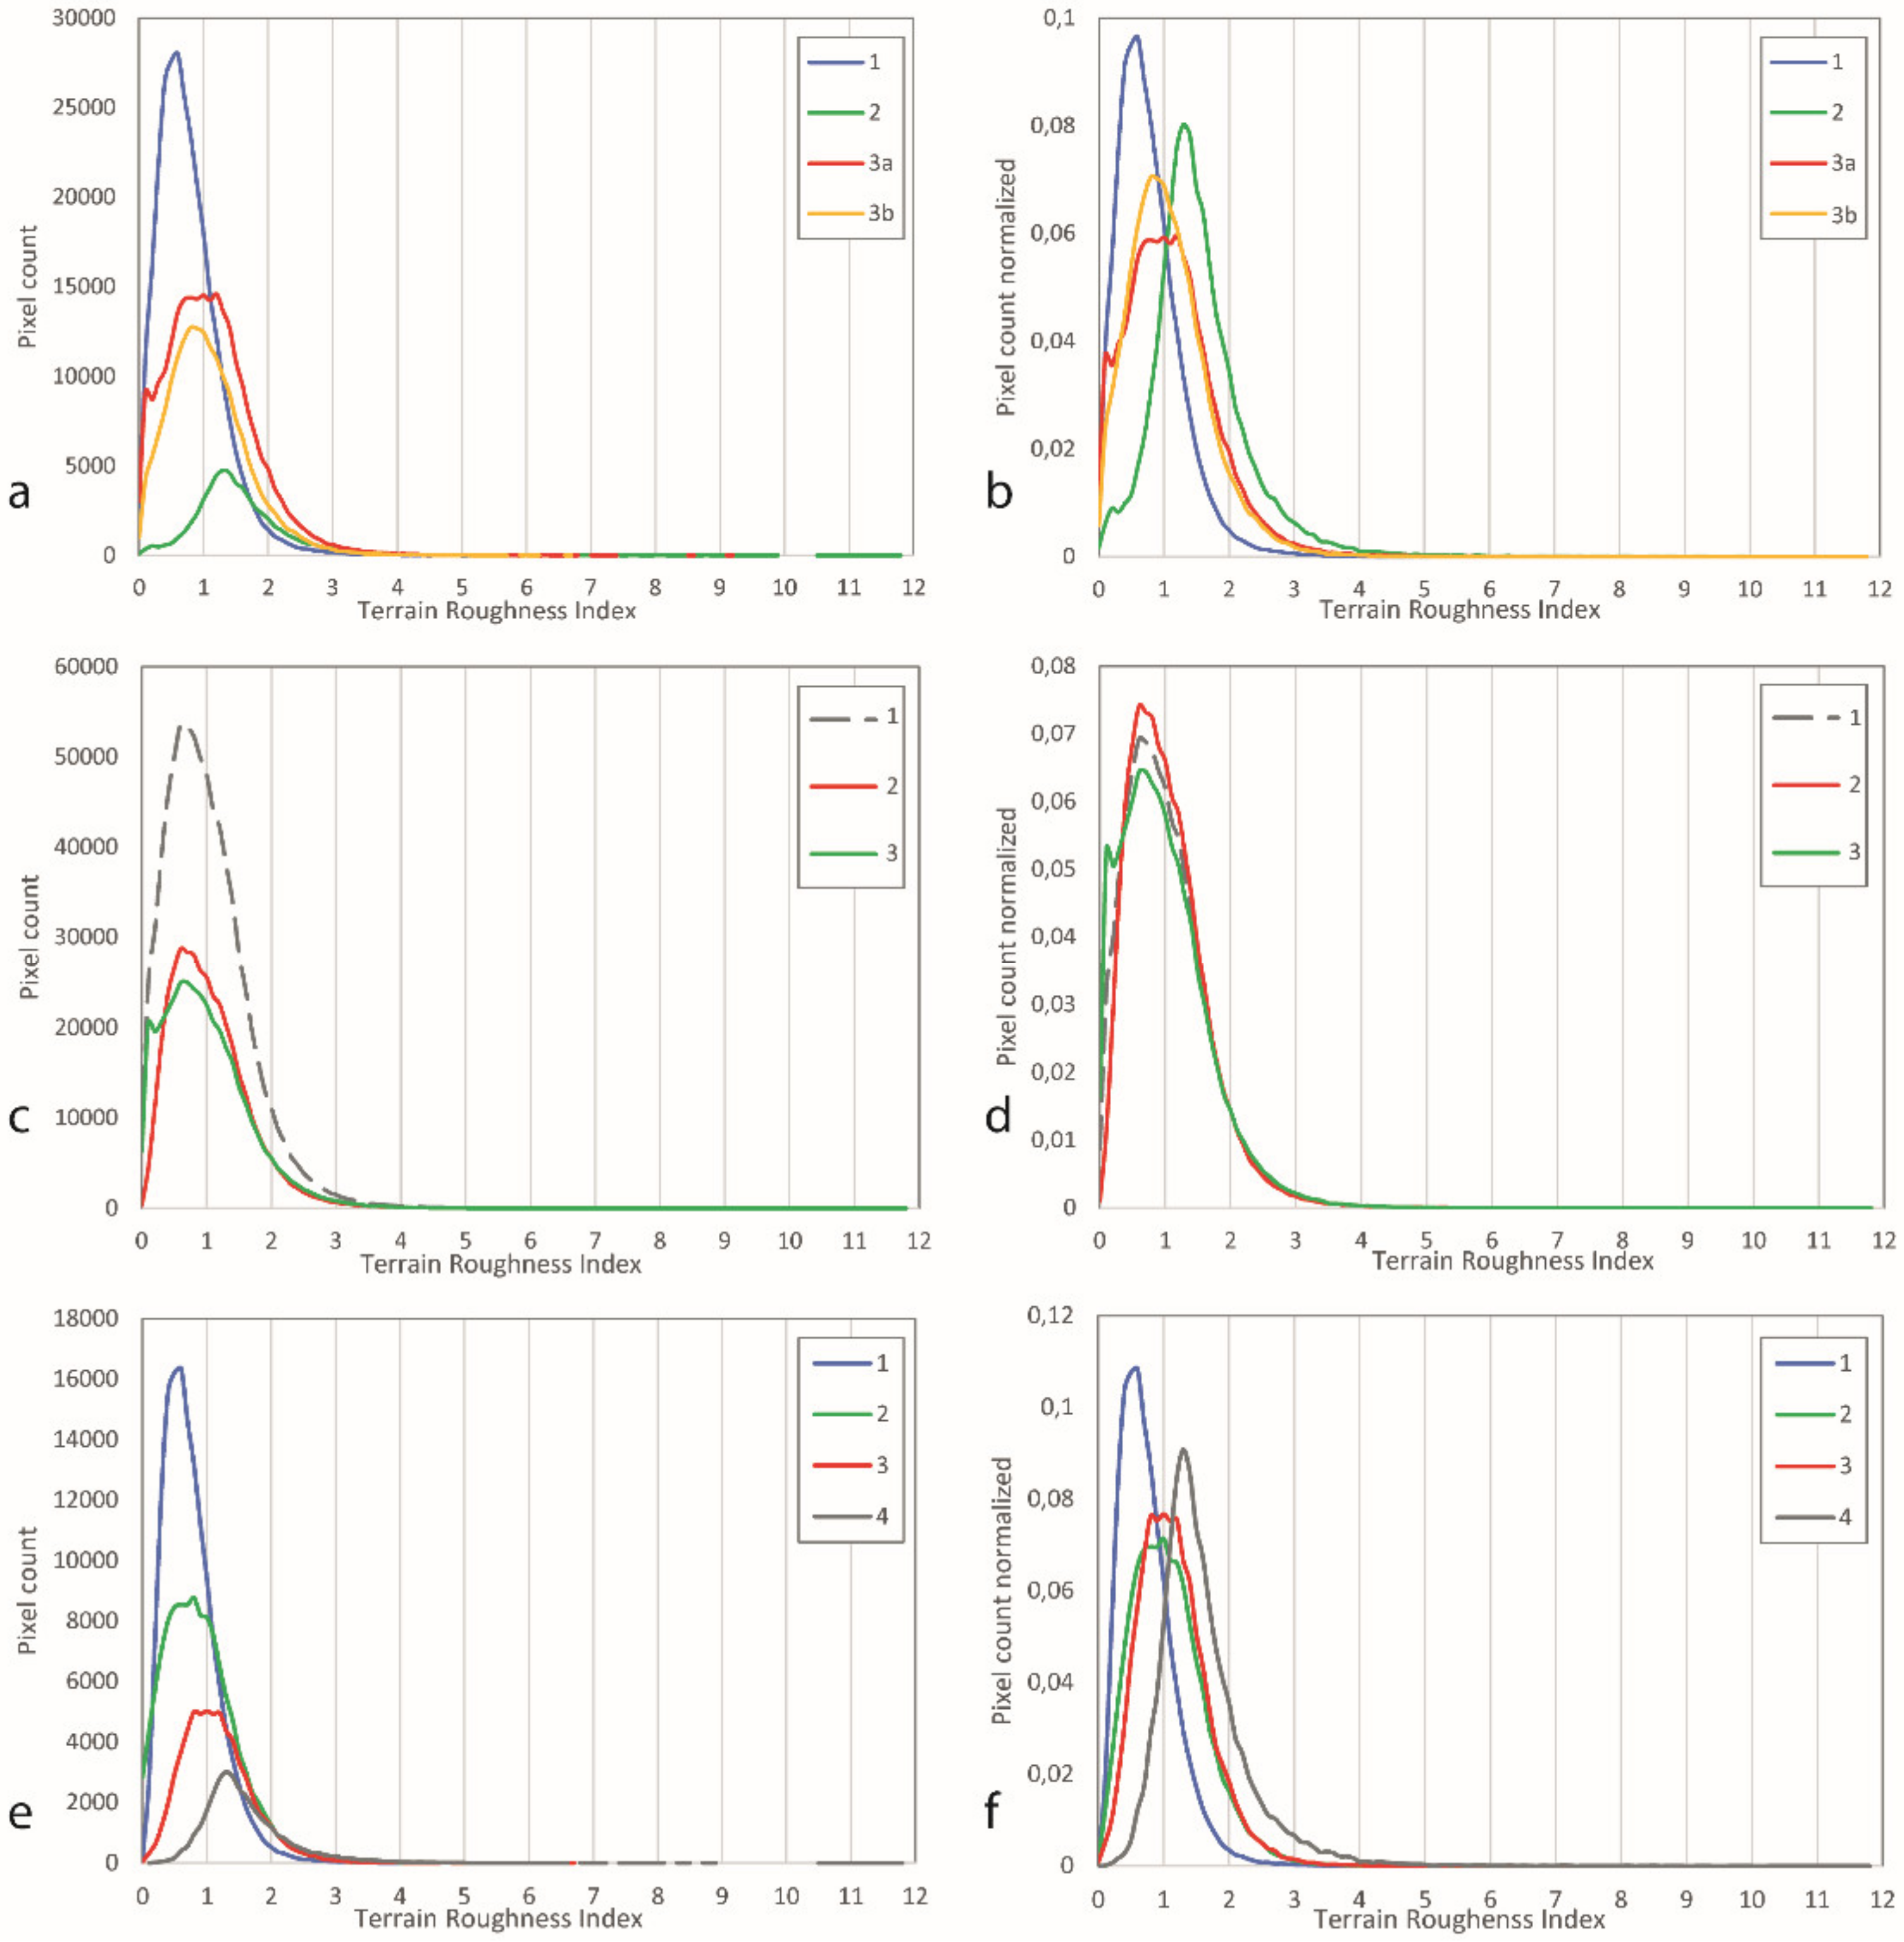
The TRI variable shows general trends comparable with the ones described for the other two metric variables (table in Figure 5d and Figure 9). Sector 1 (maximum of 5.06 m; mean of 0.82 m; median of 0.74) is clearly distinguished from sector 2, which is generally characterized by higher values (maximum of 10.74 m; mean of 1.65 m; median of 1.52) and also from sector 3 (table in Figure 5d and Figure 9a). Within this last sector, the maximum value is 9.59 m in sector 3a and 6.87 m in 3b, the mean values are 1.18 and 1.06 m, and the median values are 1.10 and 1.16 m, respectively. Standard deviation values differ somewhat from 0.51 in sector 1 to 0.80 in sector 2. Only in sector 2 is the positive kurtosis value, equal to 10.95, significantly different from the other values: 3.33 m (sector 1), 3.08 m (sector 3a), and 2.09 m (sector 3b). Skewness values are positive and range from 1.01 (sector 3b) to 2.09 m (sector 2).
Similar to the metric variables described above, the TRI values also do not vary significantly between the entire study area and the zones affected or not affected by landslides (table in Figure 5d and Figure 9c). The mean values are in the range 1.04–1.10 m, the median is about 1 m, and the standard deviation is 0.65–0.70 m. The kurtosis values are positive and range from 7.85 m for areas with landslides to 2.55 m for areas without landslides. The skewness values are comparable (from 1.16 to 1.67 m).
The landslide types are clearly in evident in the TRI value trend as well (table in Figure 5d and Figure 9e). Slides are characterized by a maximum value of 4.25 m, while areas with diffuse instability reach 10.74 m. Slumps and flows presents intermediate values of maximum values equal to 5.55 and 6.87 m, respectively. The mean values are 0.80 m for slides, 1.70 for diffuse instability, 1.15 for slumps, and 1.23 for flows. Median values differ from this value by about 0.08 m except for diffuse instability, which shows a difference equal to 0.16 m. The standard deviation values are 0.45 m for slides, 0.75 m for diffuse instability, 0.60 m for slumps, and 0.57 m for flows. The kurtosis value is positive and range from 1.46 to 3.40 m with exception of the diffuse instability zones, which show a value of 12.59 m. Additionally, skewness values are positive and vary from 0.87 m for slumps to 2.39 m for diffuse instability areas.
The trends described above are also appreciable when considering the normalized values for the case of TRI values (Figure 9b,d,f).

4.4. Cross Comparison of Morphometric Variables

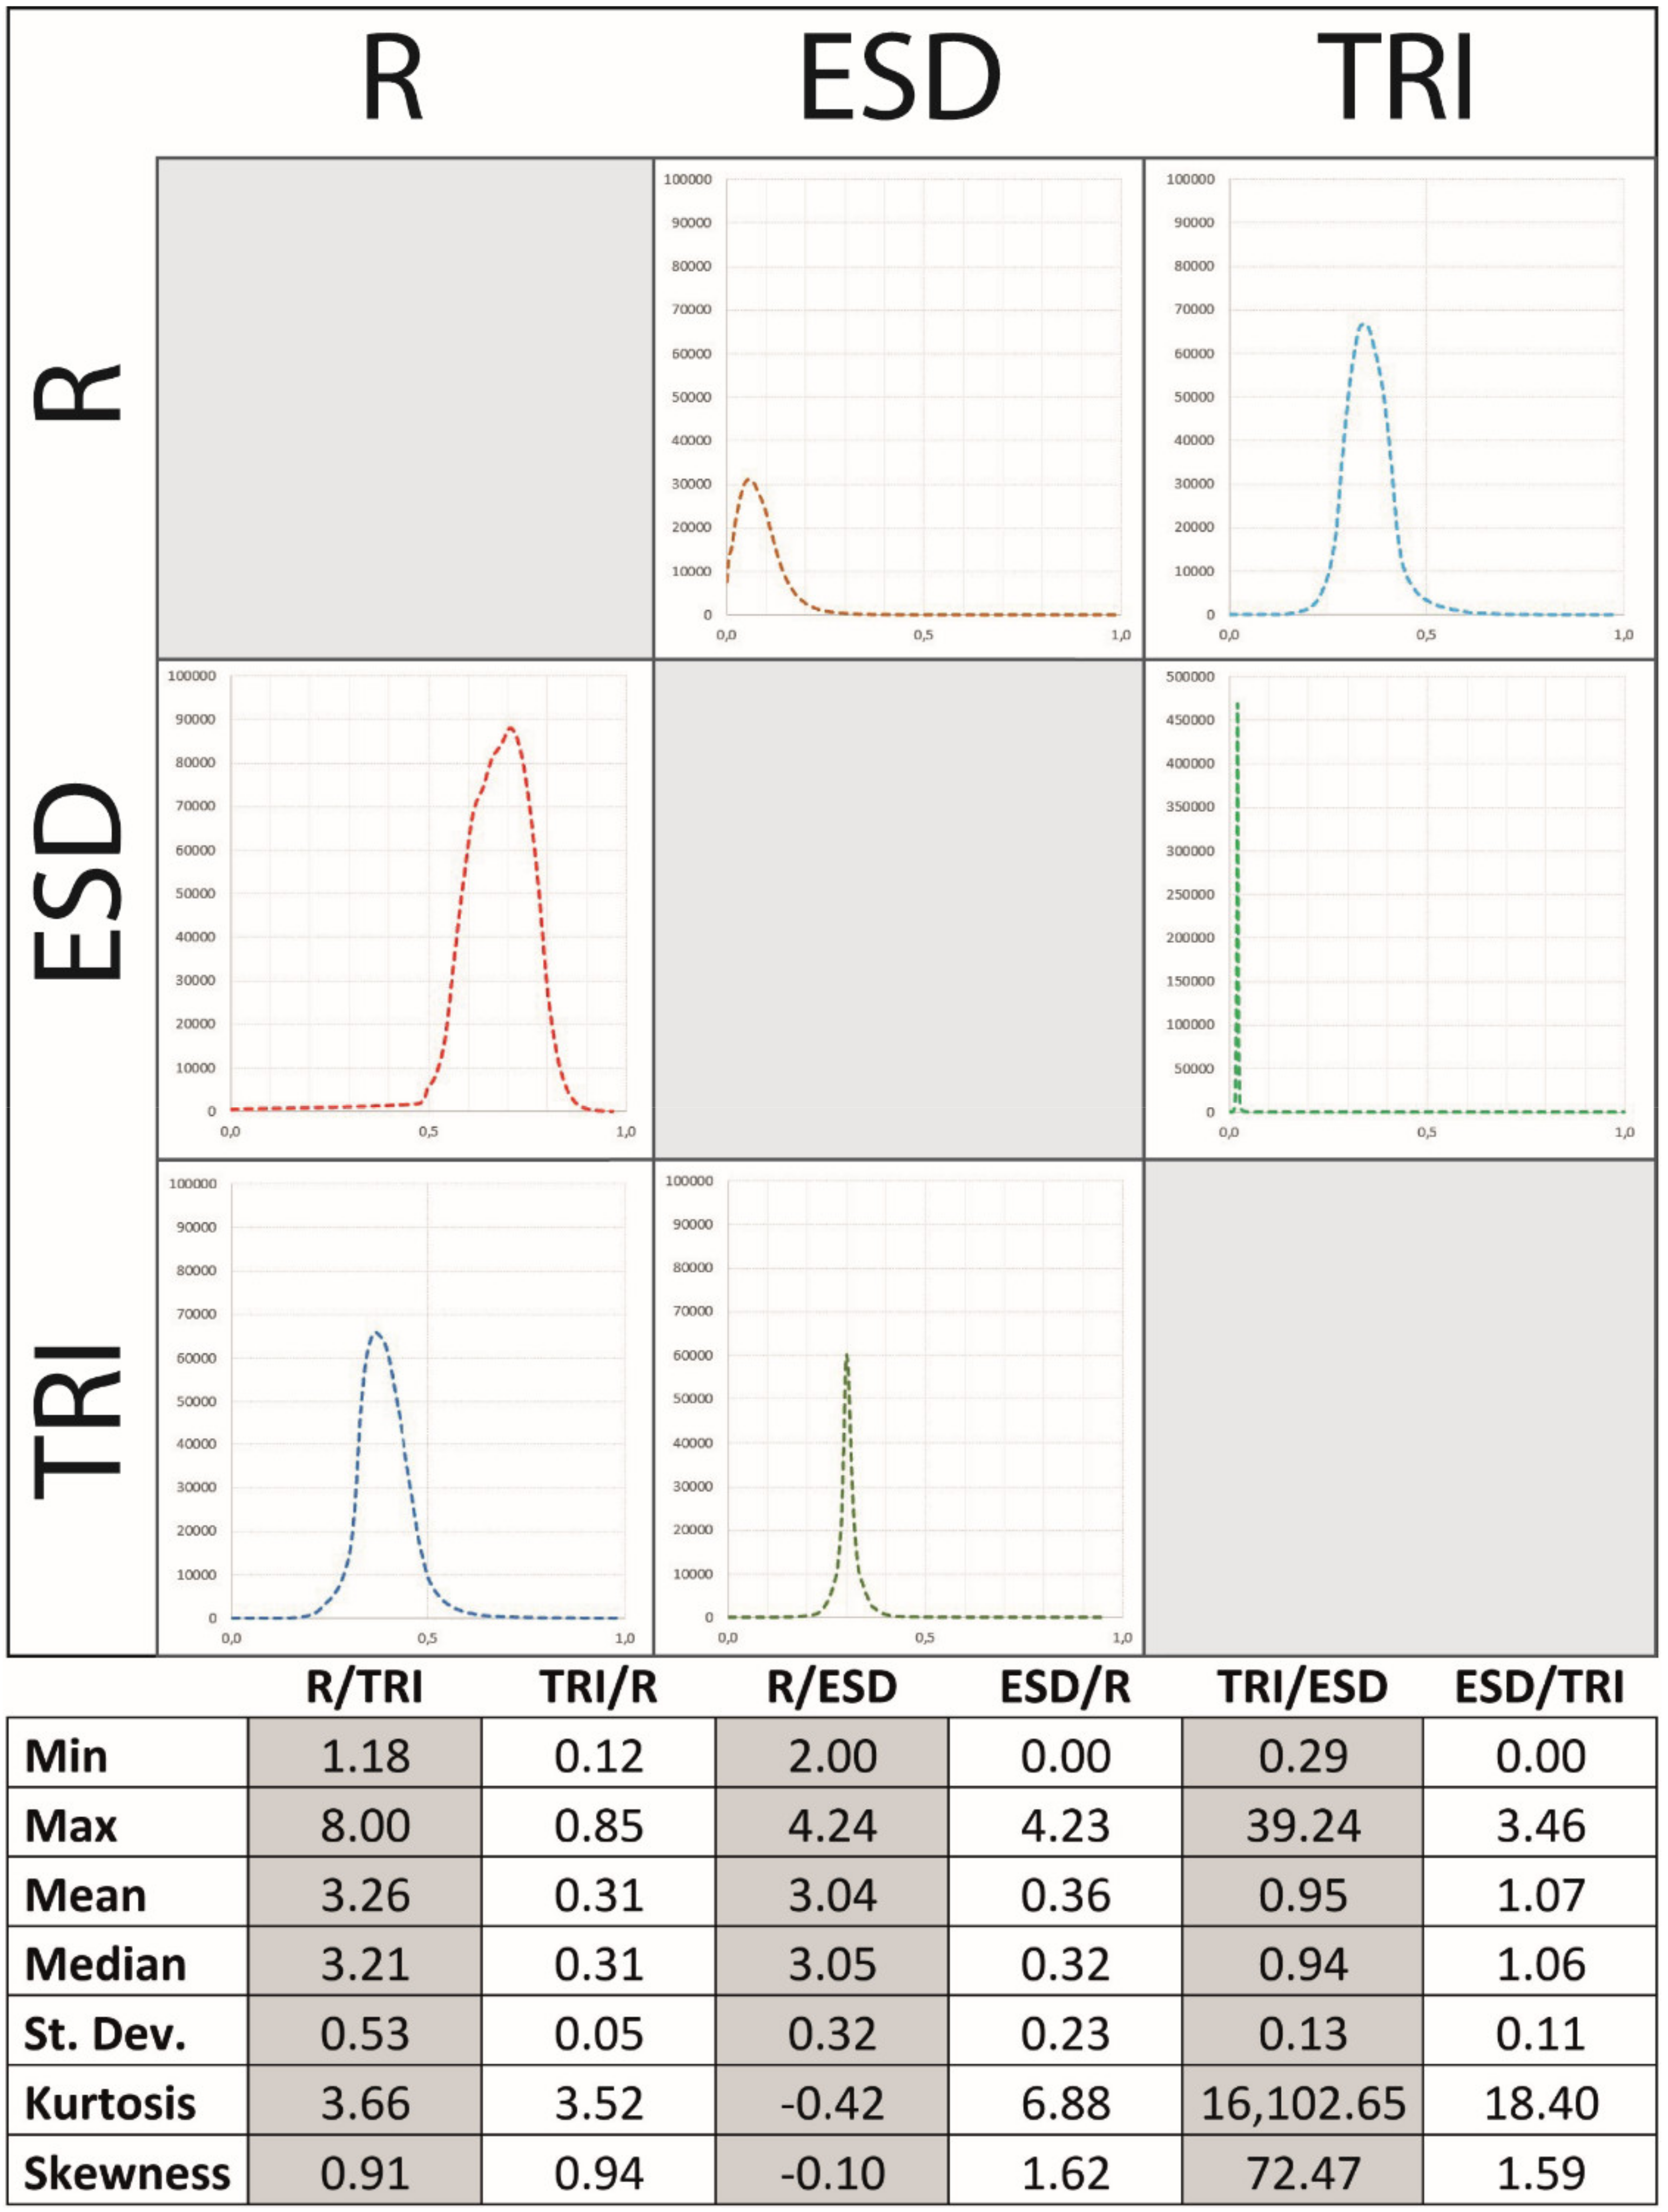
Since the visual interpretation of the maps produced for the morphometric variables together with the analysis of the statistical descriptors led to identification of comparable outputs for the R, ESD, and TRI variables, cross comparisons of these variables are also provided for assessing the degree of correlation and, eventually, assessing the effectiveness of a single variable as representative. Accordingly, two-by-two ratios between variables were evaluated on a pixel basis (Figure 10).
The graphs derived, with a normalized x-axis for smoothing the different ranges of values, clearly show the best performance in the ratios between TRI and ESD, together with good correlations for the ratios between TRI and R. The ratio TRI/ESD shows a range between 0.29 and 39.24 with a very low standard deviation of 0.13, and high values of kurtosis and skewness (16102.65 and 72.47). Otherwise, the ratio ESD/TRI has values ranging from 0 to 3.46 with a standard deviation of 0.11, kurtosis of 18.40, and skewness of 1.59. As well, the ratio R/TRI presents a range from 1.18 to 8 with a standard deviation of 0.53 and slightly positive kurtosis and skewness (3.66 and 0.91). Similar values of kurtosis and skewness are shown by the ratio TRI/R (3.52 and 0.94), which, however, shows a range from 0.12 to 0.85 and a standard deviation equal to 0.05.
The satisfactory ratio of the TRI variable with respect to both R and ESD highlight the opportunity to apply this single variable as representative of metric variables in conjunction with the slope variable.
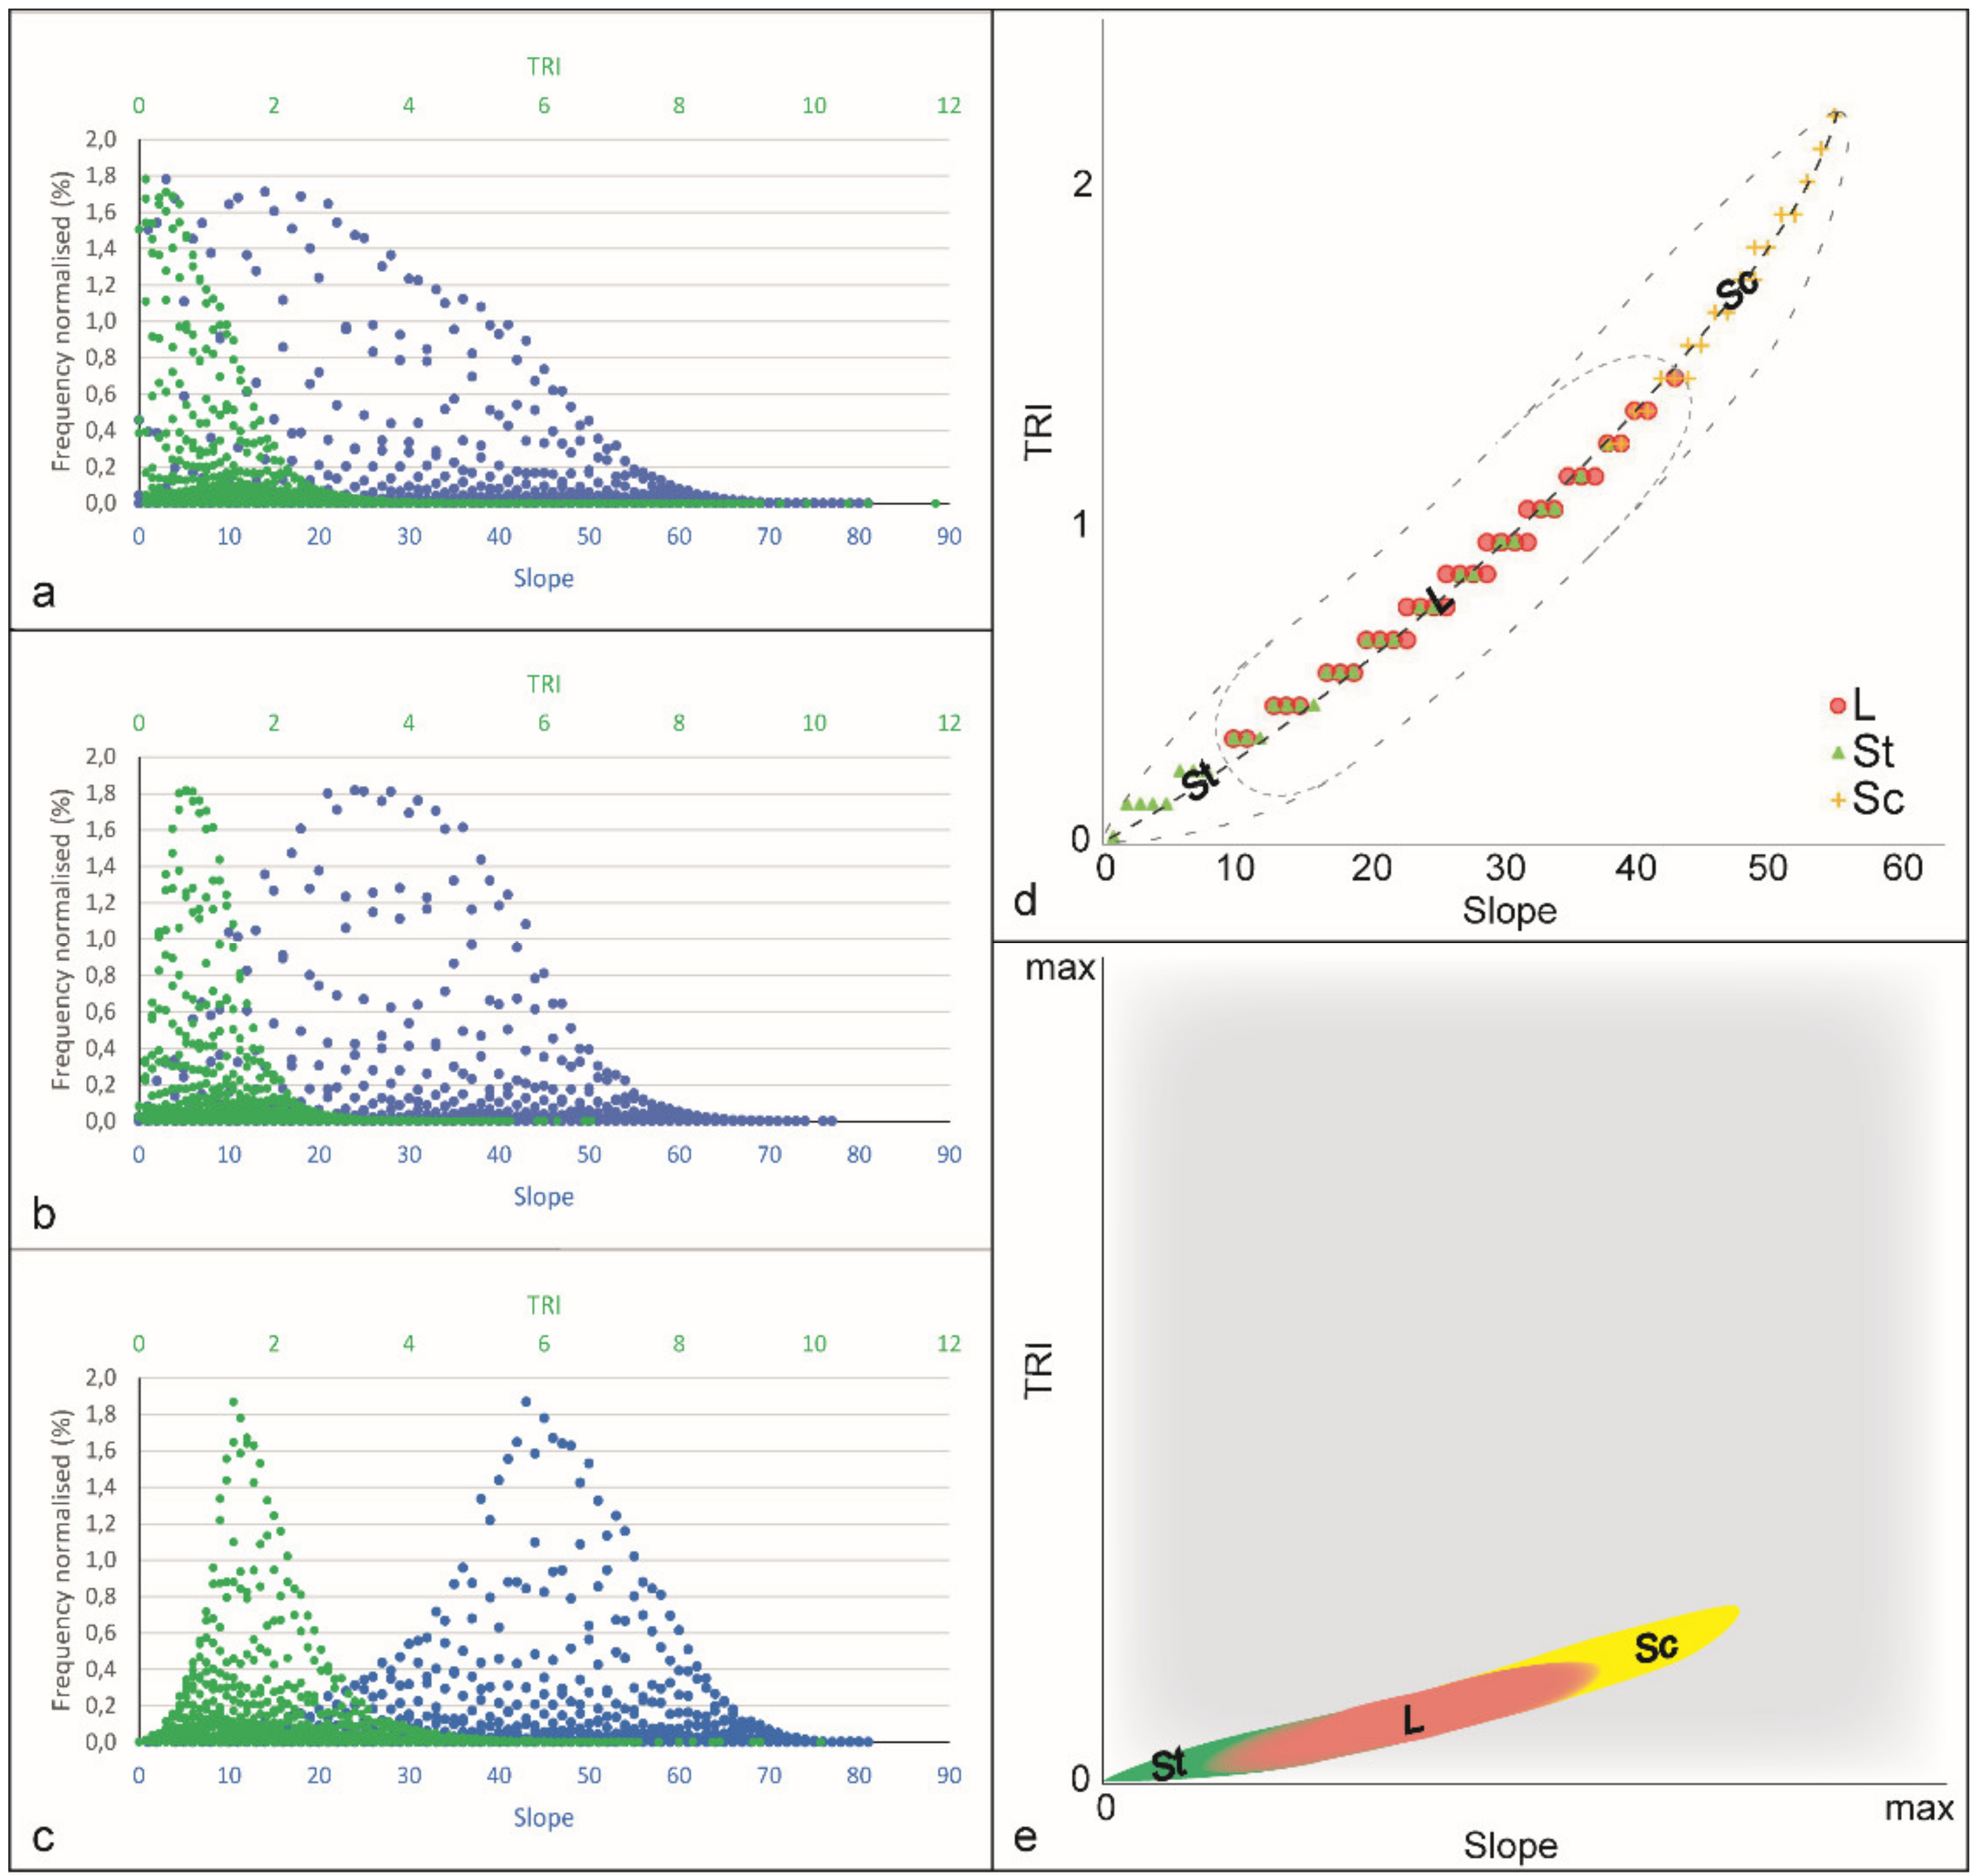
Considering these two selected variables, specific frequency peaks are clearly distinguishable if their spatial distribution is analyzed separately in stable areas, in areas affected by landslides, and in zones characterized by the presence of scarp landforms (Figure 11a–c). Therefore, the combination of TRI and slope values can act as a proxy to quantitatively discriminating and efficiently indicating the presence and absence of landslides together with areas with scarp landforms. In the Mt. San Bartolo area studied, this ratio evidently indicates the presence of these distinguishable regions, showing clustering in different sectors of the plot (Figure 11d). Stable areas are exclusive in the combination TRI < 0.3 m and slope < 10° (lower-left part of the plot). Starting from these values and up to TRI equal to 1.4 m and slope equal to 43°, the value combinations are dominated by the presence of areas affected by landslides (middle part of the plot). Beyond this threshold, the combinations of TRI and slope values are characteristic of areas with scarp landforms (upper-right part of the plot).
Constraining the correlation to the overall value range of each variable (Figure 11e), the TRI/slope ratio detected provides a general result showing the different regions in the plot, namely, stable areas (St), areas interested by landslides (L), and areas with scarp landforms (Sc).

4.5. Spatial Variation of Morphometric Variables

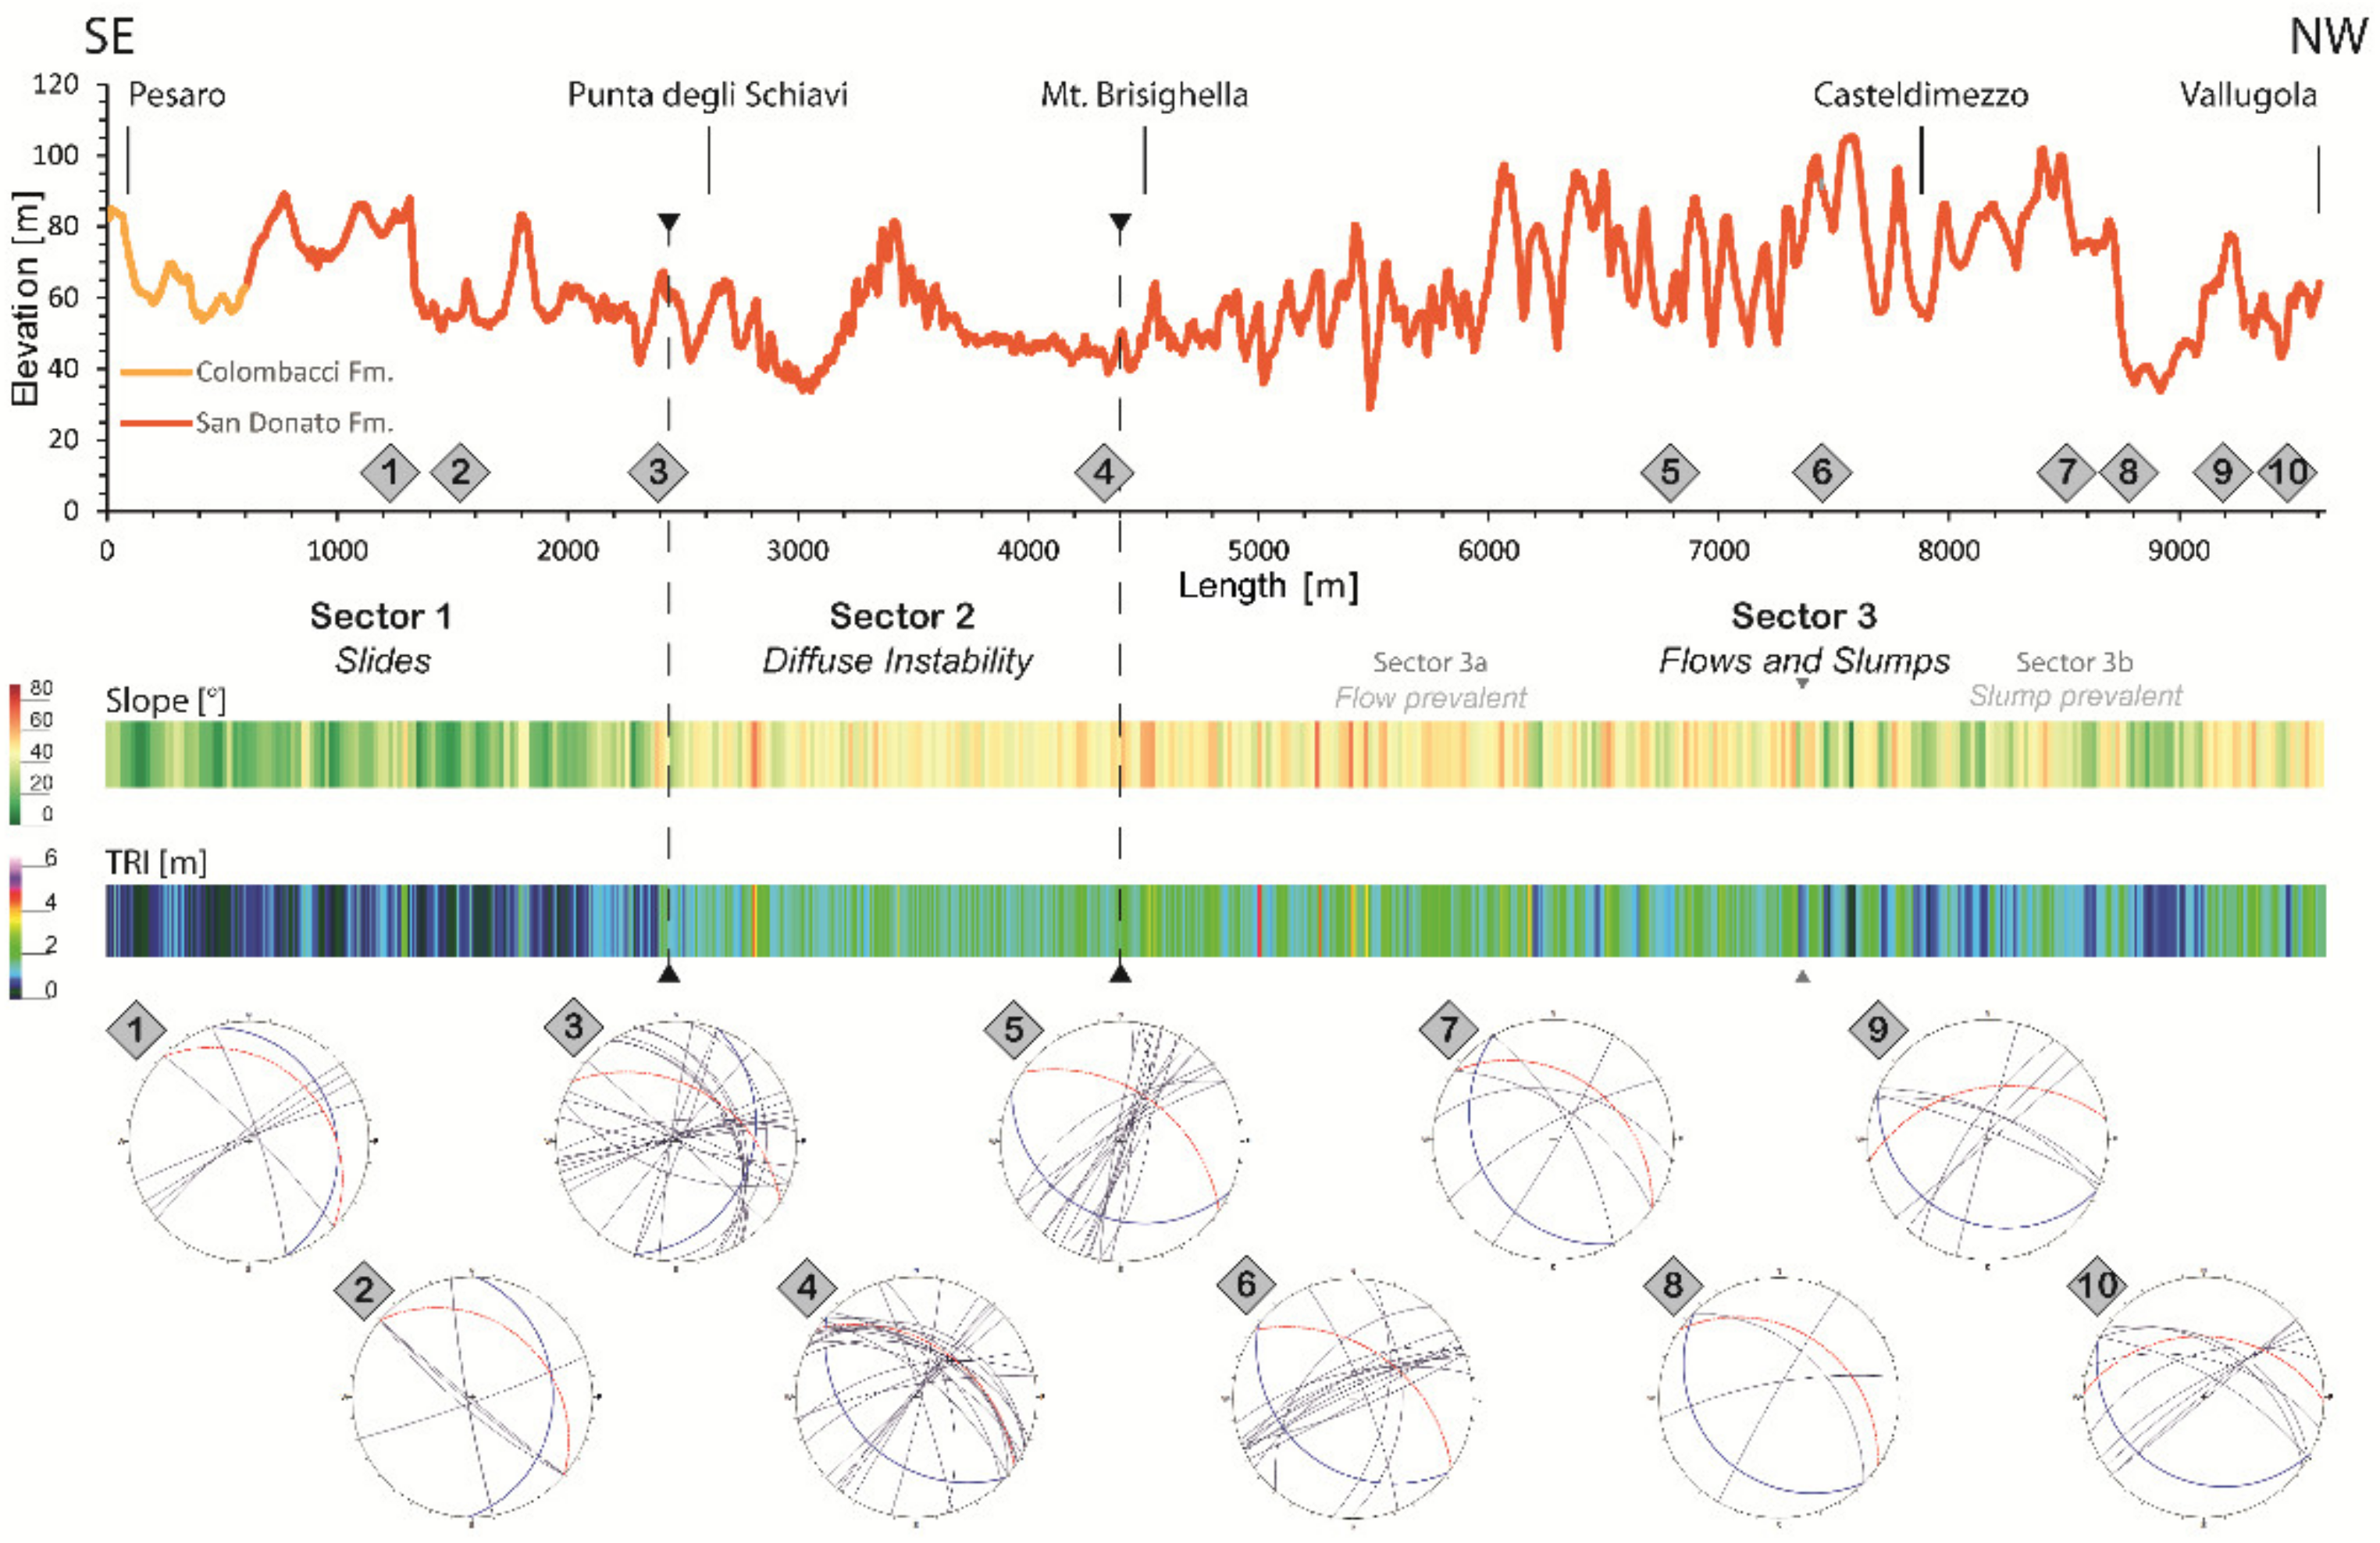
The spatial variation of the two morphometric variables selected after the cross comparison (slope and TRI), especially in relation with the presence of landslides of different type, was evaluated along a track located in the intermediate slope portion of the sea cliff (Figure 12). Performed by means of an altimetric profile along the coastline direction with a distance ranging from 50 to 160 m from the present shoreline, this analysis improved the interpretation of the gravitational landforms [6]. It is also a fundamental tool to review or confirm the sector subdivision together with their typological characterization.
The distribution of the slope and TRI values generally confirm the extension of the sectors identified by field surveys and described in Section 4.1. Up to Punta degli Schiavi, the slope variable displays values of about 20°–25° with isolated peaks reaching 40°. From Punta degli Schiavi, the slope trend appears distinctly higher with predominant values of about 40° and localized values reaching 60°–80°. Starting from Mt. Brisighella, the peak values become more frequent in a general trend with common values less than 40° and localized lower values of about 15°. Starting from Castel di Mezzo, these values of about 15°–20° became more recurrent with isolated peaks of 45°–60°.
The TRI variation is comparable to the slope variable described above, displaying low values (<1.5 m) up to Punta degli Schiavi, followed by higher values (~2 m) with isolated peaks until reaching Mt. Brisighella. From this point to Castel di Mezzo, the generalized trend continues to be characterized by TRI values of about 2 m, although with localized higher (in the first half track) and lower (in the second half track) values. From Castel di Mezzo, values >1.5 m became recurrent.
Moreover, the relationships between bedding attitude, geometry of the slope, and fracturing strongly influence the type of the landslides occurring along the Mt. San Bartolo cliff (Figure 12). Wherein dip-slope geometry is the main morphostructural setting, slide instabilities prevail (sector 1), while diffuse instabilities, flows, and slumps are common in sectors 2 and 3, where the antidip-slope relationship occurs. The rock mass fracturing seems to influence the distinction between these different gravitational landforms and consequently the general wide-ranging evolution of the coastal cliff. In sector 2, where a condition of diffuse instability prevails, various joint sets of different orientation are observable along the coastal cliff. Sector 3 shows in its southern part (sector 3a) where flows are dominant, an evident joint system crossing the bedding in NE–SW direction, while in the northern portion (sector 3b), where slumps are widespread, joints are attributable to two sets striking NE–SW and NW–SE. Fractures also control local instabilities, as in sector 1, where two joint sets, striking ENE–WSW and NW–SE, act as tension cracks for wedge blocks.

5. Discussion

Conventional field mapping of Earth surface processes and landforms along rocky coasts can be challenging due to logistic issues and site accessibility. According to [51], conventional field surveys aimed at detailed landslide inventorying are scarcely capable in terms of cost effectiveness, although it is one amongst different geomorphological techniques adopted currently in landslide identification and mapping conducted in a wide variety of environments [52]. Landslide mapping based on the visual interpretation of multiplatform remotely sensed optical imagery and hillshade maps derived from DTM can be completed efficiently by LSQ analysis, especially along rocky coasts [6]. The case study in the San Bartolo coastal area confirms the effectiveness of such an approach centered on multiple geomorphological techniques, including qualitative analysis of remotely sensed images and LSQ starting from a LiDAR-derived DTM. The extraction of quantitative information from the sea cliff topography, coupled with geomorphological interpretations based on both field and remotely sensed datasets, greatly improved the identification and mapping of gravitational phenomena. In fact, the results in the San Bartolo coastal area allowed for delimiting the zone characterized by slope instabilities and, at the same time, to identify the landslide limits other than defining their typology. In this perspective, what emerges from the San Bartolo case study confirms the findings reported in [6] for a similar case study and provides a step forward aimed at implementing a methodology useful for feature extraction [12], in particular, of gravitational landforms along coasts.
Noteworthy is the critical issue regarding the selection of the morphometric variables to be considered. In the San Bartolo case study, four variables (slope, ESD, R, and TRI) were accurately selected, considering the previous profuse scientific references [14,15,37,38], and assessed with respect to the findings of the field surveys together with their evaluation by means of cross comparisons.
The first set of analyses allowed for evaluating the visual correspondence and the characteristic distribution of significant values of each variable in relation to the presence of surveyed landslides. The plots in Figure 6, Figure 7, Figure 8 and Figure 9 suggest a specific topographic signature of the slope portions affected by different landslide typologies and, in addition, these plots show reasonably well the topographic differentiation between stable slope portions and slopes affected by landslides. The results of the subsequent analyses, shown in Figure 10, permitted quantifying the degree of correlation between morphometric variables and selecting a single variable as representative of all metric variables, here considered to be ESD, R, and TRI. Specifically, the proposed cross comparison testifies that in LSQ analysis the effective selection of significant variables is more valuable than considering numerous variables. As a consequence, just TRI was taken into consideration in conjunction with the slope variable; for these two variables selected, frequency peaks in the spatial distribution are clearly distinguishable between areas affected or not affected by landslides, and zones characterized by the presence of scarp landforms (Figure 11a–c). Consequently, the combination of slope and TRI values typify these slope features and allow for identifying a well-defined morphometric domain where the landslides concentration increases (Figure 11d). Hence, the identified domain provides an effective attempt for the preliminary identification of the topographic signature of gravitational processes (Figure 11e).
The difference in both topographic and structural settings support the recognition of different coastal sectors, though featured by the same bedrock lithological setting (Figure 12). The assessment of the spatial variation of the morphometric variables selected along a track, located along the coastline direction, allowed for confirming the characterization of the sea cliff outlined by means of field surveys. This analysis reveals a good relationship between the presence of landslides and the structural assets of the rocky mass, together with the effectiveness of LSQ analysis either as a preliminary approach or as replacement of direct field surveys when a study area is inaccessible.

6. Conclusions

Land-surface quantitative (LSQ) analysis strongly supported the investigation of the spatial distribution of gravitational landforms within the Mt. San Bartolo coastal area. The multifaceted approach, including a conventional geological–geomorphological field survey, allowed for (i) compilation of a geological–geomorphological map with special detail on gravitational landforms, such as landslides of different typology; (ii) inspection of the spatial distribution of four morphometric variables; (iii) interpretation of the descriptive statistics of the four morphometric variables, inferring the relation among the values of each variable and the gravitational landforms; (iv) exploration of the ratio among the morphometric variables, and (v) evaluation of the spatial variation of the morphometric variables in relation to the presence of landslides and the geostructural aspects of the rocky mass. The specific output of this research demonstrates, in the case study of the Mt. San Bartolo coastal relief, that LSQ analysis can be effective in supporting, both before and after, conventional field surveys for the identification and mapping of gravitational phenomena and for distinguishing sea cliff sectors affected by different landslide typologies and, more generally, by different morphodynamics due to different geostructural settings.
General findings of this research confirm the reliability of LSQ analysis starting from a high-resolution DTM, supported by qualitative interpretation of different remotely sensed optical images, as a valid and efficient tool for supporting conventional field surveys for identifying, inventorying, and mapping gravitational phenomena along rocky coasts.

Author Contributions

Conceptualization, D.P. and F.T.; methodology, D.P.; field investigation, D.P., D.T., M.M. and F.T.; formal analysis, D.P. and D.T.; funding acquisition, M.M. and F.T. All authors have read and agreed to the published version of the manuscript.

Funding

This research was funded by Marco Menichetti, Department Research Budget 2019 (University of Urbino), and by Francesco Troiani, “Geomorphic response of fluvial systems to climate change during the last glacial–interglacial cycle in the northern Apennines of Italy”, RM120172A260A846 (Sapienza—University of Rome, 2020).

Data Availability Statement

Not applicable.

Conflicts of Interest

The authors declare no conflict of interest.

References

  1. Sunamura, T. Geomorphology of Rocky Coasts; Wiley: New York, NY, USA, 1992; pp. 1–314. [Google Scholar]
  2. Furlani, S.; Pappalardo, M.; Gómez-Pujol, L.; Chelli, A. The rock coast of the Mediterranean and Black seas. In Rock Coast Geomorphology: A Global Synthesis; Kennedy, D.M., Stephenson, W.J., Naylor, L.A., Eds.; Geological Society of London: London, UK, 2014; Volume 40, pp. 89–123. [Google Scholar]
  3. Miccadei, E.; Mascioli, F.; Ricci, F.; Piacentini, T. Geomorphology of soft clastic rock coasts in the mid-western Adriatic Sea (Abruzzo, Italy). Geomorphology 2019, 324, 72–94. [Google Scholar] [CrossRef]
  4. Soldati, M.; Maquaire, O.; Zezere, J.L.; Piacentini, D.; Lissak, C. Coastline at Risk: Methods for Multi-Hazard Assessment. J. Coast. Res. 2011, 61, 335–339. [Google Scholar] [CrossRef]
  5. Gibson, A.D.; Culshaw, M.G.; Dashwood, C.; Pennington, C.V.L. Landslide management in the UK—The problem of managing hazards in a ‘low-risk’ environment. Landslides 2013, 10, 599–610. [Google Scholar] [CrossRef] [Green Version]
  6. Troiani, F.; Martino, S.; Marmoni, G.M.; Menichetti, M.; Torre, D.; Iacobucci, G.; Piacentini, D. Integrated Field Surveying and Land Surface Quantitative Analysis to Assess Landslide Proneness in the Conero Promontory Rocky Coast (Italy). Appl. Sci. 2020, 10, 4793. [Google Scholar] [CrossRef]
  7. Devoto, S.; Hastewell, L.J.; Prampolini, M.; Furlani, S. Dataset of Gravity-Induced Landforms and Sinkholes of the Northeast Coast of Malta (Central Mediterranean Sea). Data 2021, 6, 81. [Google Scholar] [CrossRef]
  8. Furlani, S.; Piacentini, D.; Troiani, F.; Biolchi, S.; Roccheggiani, M.; Tamburini, A.; Tirincanti, E.; Vaccher, V.; Antonioli, F.; Devoto, S.; et al. Tidal notches (TN) along the western Adriatic coast as markers of coastal stability during the late Holocene. Geogr. Fis. Dinam. Quat. 2018, 41, 33–46. [Google Scholar]
  9. Furlani, S. Integrating observational targets and instrumental data on rock coasts through snorkel surveys: A methodological approach. Mar. Geol. 2020, 425, 106191. [Google Scholar] [CrossRef]
  10. Mora, O.E.; Liu, J.; Lenzano, M.G.; Toth, C.; Grejner-Brzezinska, D.A. Small Landslide Susceptibility and Hazard Assessment Based on Airborne Lidar Data. Photogramm. Eng. Remote Sens. 2015, 81, 239–247. [Google Scholar] [CrossRef]
  11. Devoto, S.; Macovaz, V.; Mantovani, M.; Soldati, M.; Furlani, S. Advantages of Using UAV Digital Photogrammetry in the Study of Slow-Moving Coastal Landslides. Remote Sens. 2020, 12, 3566. [Google Scholar] [CrossRef]
  12. Sofia, G. Combining geomorphometry, feature extraction techniques and Earth-surface processes research: The way forward. Geomorphology 2020, 355, 107055. [Google Scholar] [CrossRef]
  13. Shary, P.A.; Sharaya, L.S.; Mitusov, A.V. Fundamental quantitative methods of land surface analysis. Geoderma 2002, 107, 1–32. [Google Scholar] [CrossRef]
  14. Florinsky, I.V. An illustrated introduction to general geomorphometry. Prog. Phys. Geogr. Earth Environ. 2017, 41, 723–752. [Google Scholar] [CrossRef]
  15. Amatulli, G.; McInerney, D.; Sethi, T.; Strobl, P.; Domisch, S. Geomorpho90m, empirical evaluation and accuracy assessment of global high-resolution geomorphometric layers. Sci. Data 2020, 7, 162. [Google Scholar] [CrossRef] [PubMed]
  16. Pedersen, G.B.M. Semi-automatic classification of glaciovolcanic landforms: An object-based mapping approach based on geomorphometry. J. Vulcanol. Geotherm. Res. 2016, 311, 29–40. [Google Scholar] [CrossRef] [Green Version]
  17. Granados-Bolaños, S.; Quesada-Román, A.; Alvarado, G.E. Low-cost UAV applications in dynamic tropical volcanic landforms. J. Vulcanol. Geotherm. Res. 2021, 410, 107143. [Google Scholar] [CrossRef]
  18. Cruden, D.M.; Varnes, D.J. Landslide Types and Processes. In Landslides: Investigation and Mitigation; National Academy Press: Washington, DC, USA, 1996; pp. 36–75. [Google Scholar]
  19. Hungr, O.; Leroueil, S.; Picarelli, L. The Varnes classification of landslide types, an update. Landslides 2014, 11, 167–194. [Google Scholar] [CrossRef]
  20. Coccioni, R. Verso la Gestione Integrata della Costa del Monte San Bartolo: Risultati di un Progetto Pilota; Quaderni del Centro di Geobiologia dell’Università degli Studi di Urbino “Carlo Bo”: Urbino, Italy, 2003; pp. 1–163. [Google Scholar]
  21. Elmi, C.; Gori, U. Variazioni della morfologia costiera prodotte da opere di difesa sul litorale pesarese. Mem. Soc. Geol. It. 1987, 37, 417–426. [Google Scholar]
  22. Dall’Aglio, P.L.; De Donatis, M.; Franceschelli, C.; Guerra, C.; Guerra, V.; Nesci, O.; Piacentini, D.; Savelli, D. Geomorphological and Anthropic Control of the Development of Some Adriatic Historical Towns (Italy) Since the Roman Age. Quaest. Geogr. 2017, 36, 111–123. [Google Scholar] [CrossRef] [Green Version]
  23. D’Ambra, S. Analisi Morfoevolutiva e Stabilità dei Versanti della Falesia del Colle San Bartolo (PU). Ph.D. Thesis, Università Degli Studi di Roma Tre, Rome, Italy, 2006. [Google Scholar]
  24. Rete Ondametrica Nazionale (RON). Available online: www.mareografico.it (accessed on 14 October 2021).
  25. Colantoni, P.; Mencucci, D.; Nesci, O. Coastal processes and cliff recession between Gabicce and Pesaro (northern Adriatic Sea): A case history. Geomorphology 2004, 62, 257–268. [Google Scholar] [CrossRef]
  26. Köppen, W. Das Geographische System der Klimate; Borntraeger: Berlin, Germany, 1936. [Google Scholar]
  27. Tramontana, M.; Guerrera, F. Note Illustrative Della Carta Geologica d’Italia Alla Scala 1:50.000, Foglio 268 PESARO; Istituto Superiore per la Protezione e la Ricerca Ambientale (ISPRA) e Servizio Geologico d’Italia: Rome, Italy, 2011; pp. 1–132. [Google Scholar]
  28. Roveri, M.; Boscolo Gallo, A.; Rossi, M.; Gennari, R.; Iaccarino, S.M.; Lugli, S.; Manzi, V.; Negri, A.; Rizzini, F.; Taviani, M. The Adriatic foreland record of Messinian events (Central Adriatic Sea, Italy). GeoActa 2005, 4, 139–158. [Google Scholar]
  29. Savelli, D.; Wezel, F.C. Schema geologico del Messiniano del Pesarese. Boll. Soc. Geol. Ital. 1978, 97, 165–188. [Google Scholar]
  30. Menichetti, M.; De Feyter, A.J.; Corsi, M. CROP 03—Il tratto Val Tiberina—Mare Adriatico. Sezione Geologica e caratterizzazione tettonico sedimentaria delle avanfosse della zona umbro-marchigiano-romagnola. Studi Geol. Camerti 1991, 1, 279–293. [Google Scholar]
  31. Mayer, L.; Menichetti, M.; Nesci, O.; Savelli, D. Morphotectonic approach to the drainage analysis in the North Marche region, central Italy. Quat. Int. 2003, 101–102, 157–167. [Google Scholar] [CrossRef]
  32. Elmi, C.; Nesci, O. Carta Geomorfologica del Rilievo Costiero fra Gabicce e Pesaro (Colle S. Bartolo); IRIS Università degli Studi di Urbino: Urbino, Italy, 1990. [Google Scholar]
  33. Nesci, O. Evoluzione geomorfologica della falesia costiera del monte San Bartolo (Marche Settentrionali). In Verso la Gestione Integrata Della Costa del Monte San Bartolo: Risultati di un Progetto Pilota; Coccioni, R., Ed.; Quaderni del Centro di Geobiologia dell’Università degli Studi di Urbino “Carlo Bo”: Urbino, Italy, 2003; pp. 41–53. [Google Scholar]
  34. Veggiani, A. L’arretramento Della Linea di Costa Adriatica tra Gabicce e Pesaro nell’Olocene e le Leggende Sulle Città Sommerse; Gruppo Nazionale di Geografia Fisica e Geomorfologica: Rome, Italy, 1988; pp. 61–70. [Google Scholar]
  35. Gori, U.; Luzi, M. Concorso Nazionale di Idee per la Sistemazione Urbanistica del Colle San Bartolo. Assetto Geologico, Terrestre e Marino; Progetti e Ricerche Della Città di Pesaro: Pesaro, Italy, 1978; pp. 82–119. [Google Scholar]
  36. MATTM—Ministero dell’Ambiente e della Tutela del Territorio e del Mare. Progetto Piano Straordinario di Telerilevamento. Available online: www.pcn.miniambiente.it (accessed on 14 October 2021).
  37. Wilson, J.P.; Gallant, J.C. Digital Terrain Analysis. In Terrain Analysis: Principles and Applications; Wilson, J.P., Gallant, J.C., Eds.; Wiley: New York, NY, USA, 2000; pp. 1–27. [Google Scholar]
  38. Hengl, T.; Reuter, H.I. (Eds.) Geomorphometry: Concepts, Software, Applications; Elsevier Science Publishing Co. Inc.: Amsterdam, The Netherlands, 2009; pp. 1–772. [Google Scholar]
  39. Burrough, P.A.; Mcdonnel, R.A. Principles of Geographical Information Systems, 2nd ed.; Oxford University Press: Oxford, UK, 1998; pp. 1–352. [Google Scholar]
  40. Lee, S.; Choi, J.; Min, K. Probabilistic landslide hazard mapping using GIS and remote sensing data at Boun, Korea. Int. J. Remote Sens. 2004, 25, 2037–2052. [Google Scholar] [CrossRef]
  41. Süzen, M.L.; Kaya, B.Ş. Evaluation of environmental parameters in logistic regression models for landslide susceptibility mapping. Int. J. Digit. Earth 2012, 5, 338–355. [Google Scholar] [CrossRef]
  42. Budimir, M.E.A.; Atkinson, P.M.; Lewis, H.G. A systematic review of landslide probability mapping using logistic regression. Landslides 2015, 12, 419–436. [Google Scholar] [CrossRef] [Green Version]
  43. Piacentini, D.; Devoto, S.; Mantovani, M.; Pasuto, A.; Prampolini, M.; Soldati, M. Landslide susceptibility modeling assisted by Persistent Scatterers Interferometry (PSI): An example from the northwestern coast of Malta. Nat. Hazards 2015, 78, 681–697. [Google Scholar] [CrossRef] [Green Version]
  44. Pachauri, A.K.; Pant, M. Landslide hazard mapping based on geological attributes. Eng. Geol. 1992, 32, 81–100. [Google Scholar] [CrossRef]
  45. Piacentini, D.; Troiani, F.; Soldati, M.; Notarnicola, C.; Savelli, D.; Schneiderbauer, S.; Strada, C. Statistical analysis for assessing shallow-landslide susceptibility in South Tyrol (south-eastern Alps, Italy). Geomorphology 2012, 151–152, 196–206. [Google Scholar] [CrossRef]
  46. Tasoglu, I.K.; Citiroglu, H.K.; Mekik, C. GIS-based landslide susceptibility assessment: A case study in Kelemen Valley (Yenice—Karabuk, NW Turkey). Environ. Earth Sci. 2016, 75, 1291. [Google Scholar] [CrossRef]
  47. Hong, H.; Ilia, I.; Tsangaratos, P.; Chen, W.; Xu, C. A hybrid fuzzy weight of evidence method in landslide susceptibility analysis on the Wuyuan area, China. Geomorphology 2017, 290, 1–16. [Google Scholar] [CrossRef]
  48. Pawluszek, K.; Borkowski, A. Impact of DEM-derived factors and analytical hierarchy process on landslide susceptibility mapping in the region of Rożnów Lake, Poland. Nat. Hazards 2017, 86, 919–952. [Google Scholar] [CrossRef] [Green Version]
  49. Wilson, M.F.J.; O’Connell, B.; Brown, C.; Guinan, J.C.; Grehan, A.J. Multiscale Terrain Analysis of Multibeam Bathymetry Data for Habitat Mapping on the Continental Slope. Mar. Geod. 2007, 30, 3–35. [Google Scholar] [CrossRef] [Green Version]
  50. Riley, S.; De Gloria, S.D.; Elliot, R. A terrain ruggedness index that quantifies topographic heterogeneity. Intermt. J. Sci. 1999, 5, 23–27. [Google Scholar]
  51. Guzzetti, F.; Mondini, A.C.; Cardinali, M.; Fiorucci, F.; Santangelo, M.; Chang, K.-T. Landslide inventory maps: New tools for an old problem. Earth-Sci. Rev. 2012, 112, 42–66. [Google Scholar] [CrossRef] [Green Version]
  52. Evans, I.S. Geomorphometry and landform mapping: What is a landform? Geomorphology 2012, 137, 94–106. [Google Scholar] [CrossRef]
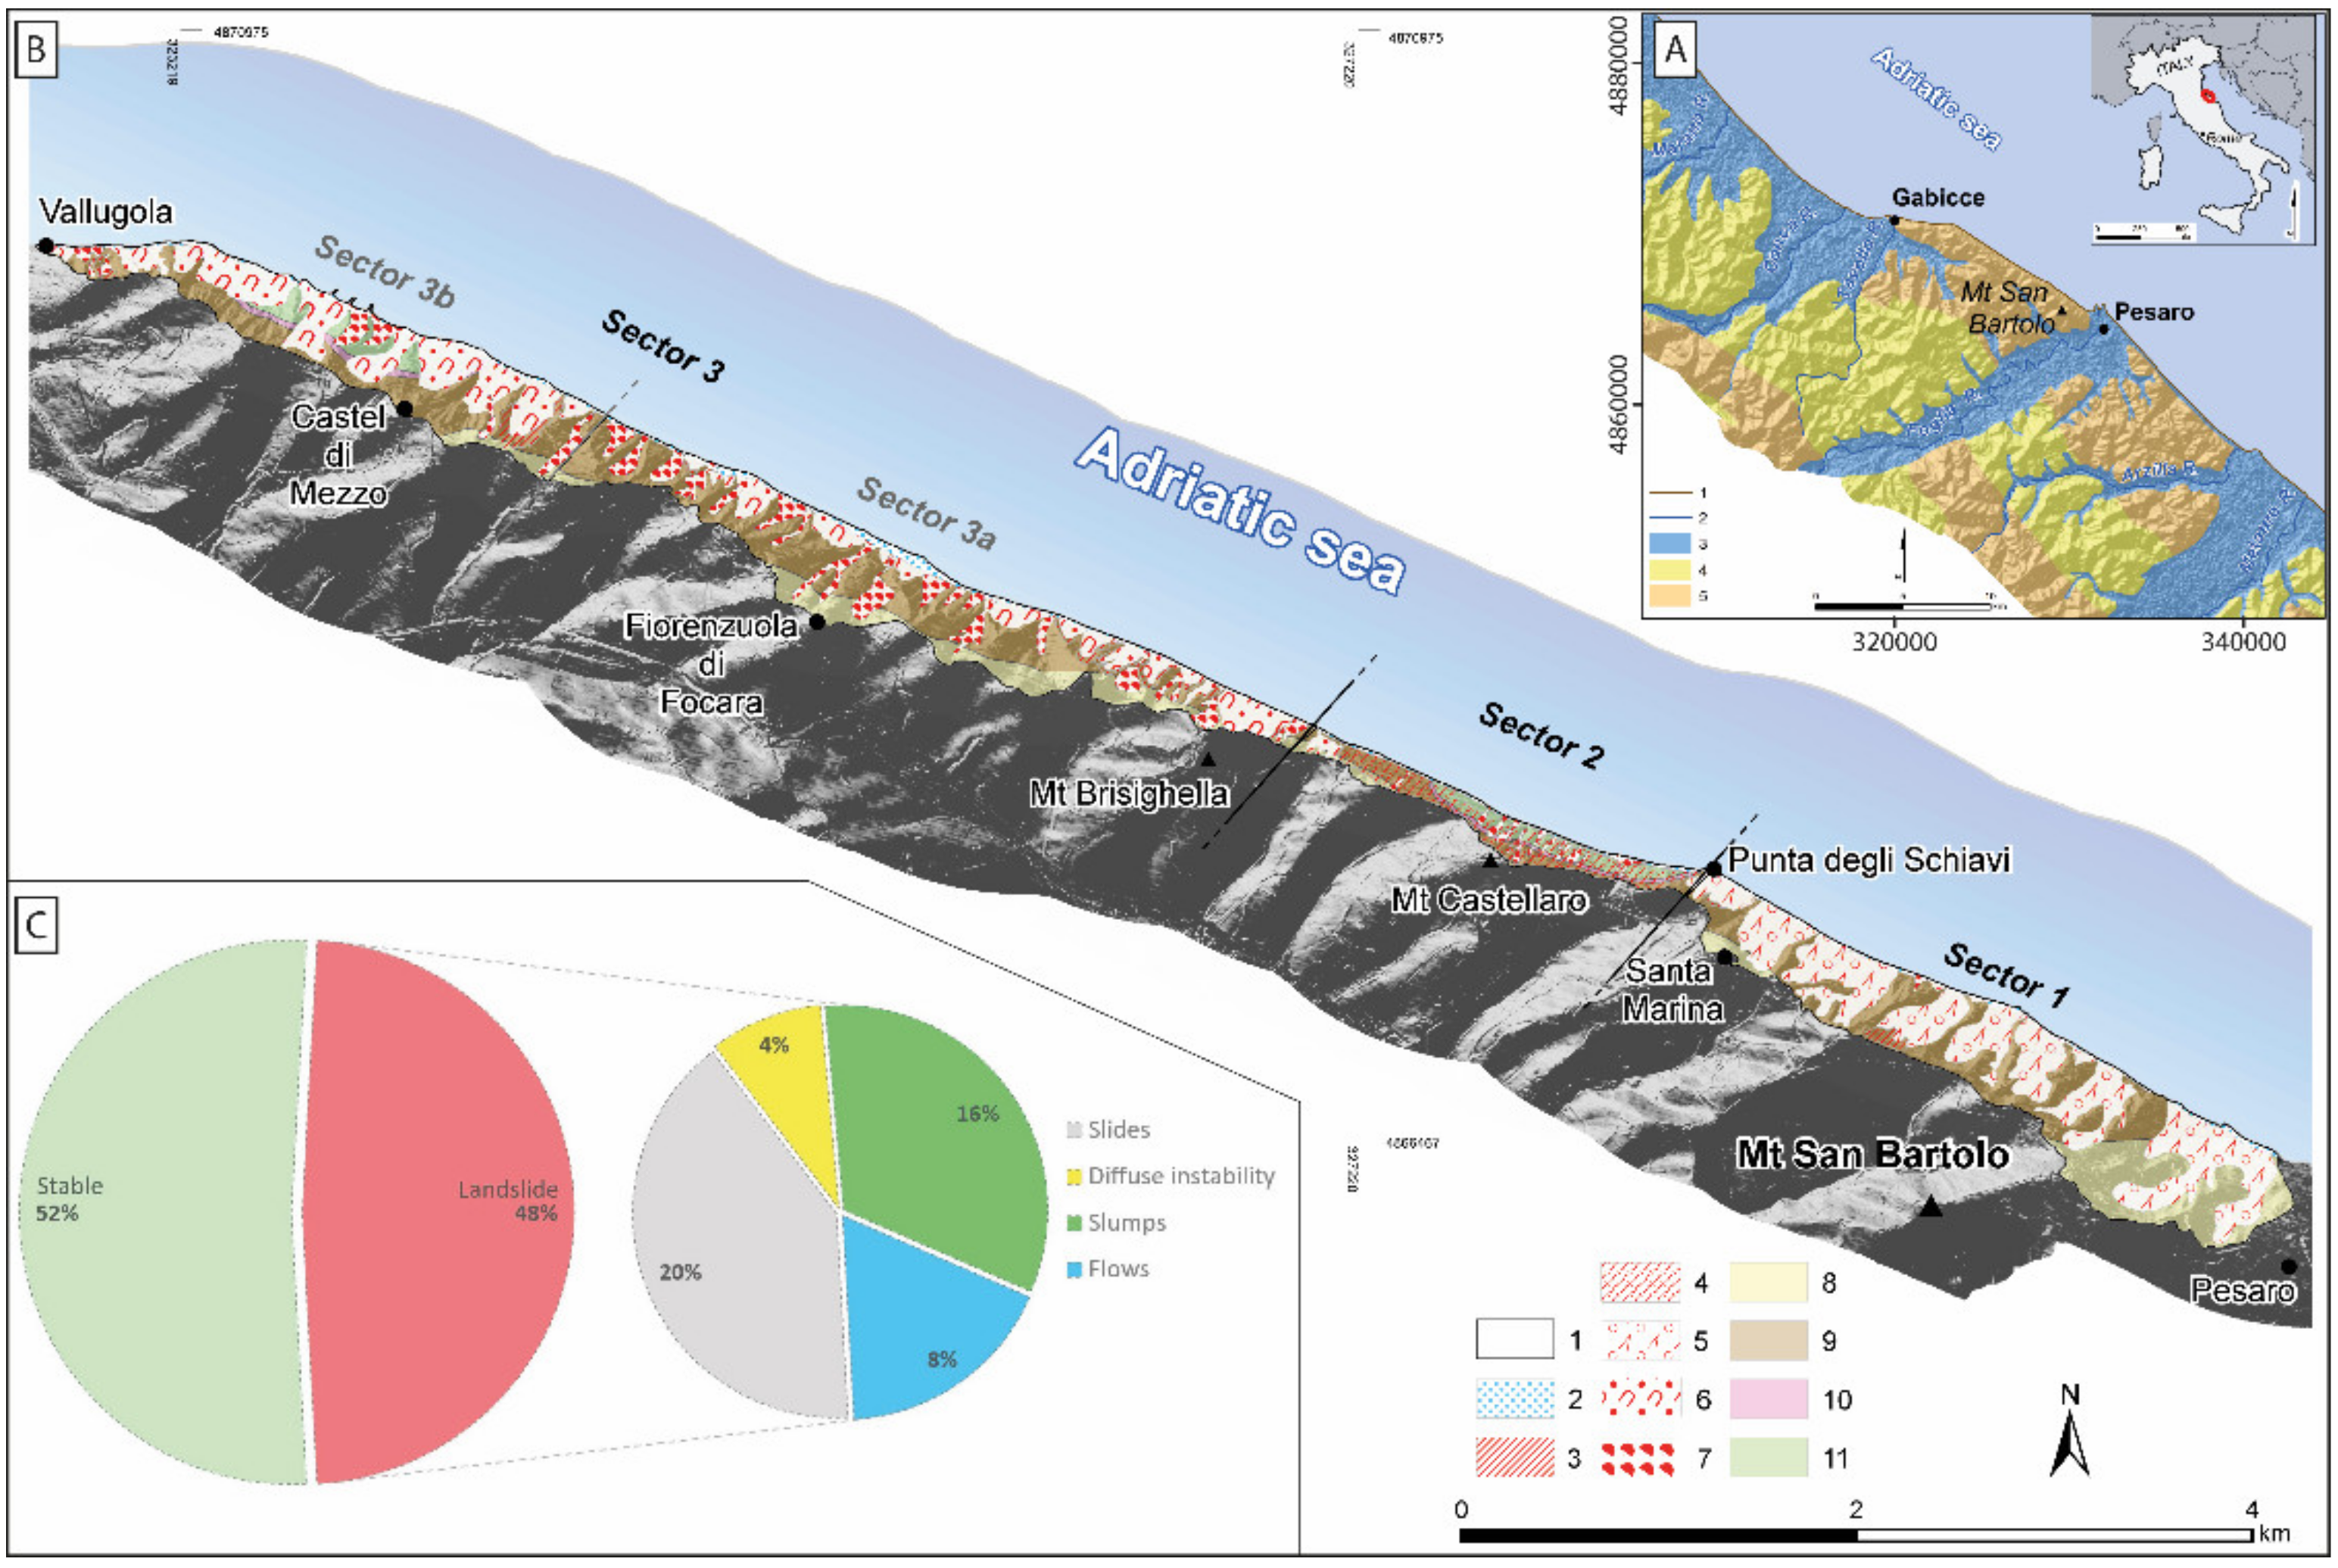
Figure 1. Setting of the Mt. San Bartolo coastal area. (A) Geological sketch of the northern Marche coastal area and inland surroundings (modified from [22]): 1, Coastline; 2, River; 3, Pleistocene–Holocene fluvial and coastal deposit; 4, Plio-Pleistocene pelitic and arenitic marine deposit; 5, Miocene marly calcareous, evaporitic, and terrigenous unit. (B) Geological and geomorphological sketch of the study area: 1, Study area; 2, Beach; 3, Landslide scarp; 4, Diffuse instability area; 5, Slide; 6, Slump; 7, Flow; 8, Colombacci Formation (Late Messinian); 9, San Donato Formation (Middle–Upper Messinian); 10, Gessoso Solfifera Formation (Lower Messinian); 11, Schlier Formation (Upper Tortonian). (C) Pie charts showing the percentage distribution of landslides and stable zones in the Mt. San Bartolo study area (on the left) and the percentage distribution of different landslide typologies occurring (on the right). (Map coordinates are in the WGS84–UTM 33 cartographic reference system).
Remotesensing 13 05012 g001
Figure 2. Sector 1 (Pesaro–Punta degli Schiavi) of the Mt. San Bartolo coastal slope. (A) Detailed geomorphological map: 1, Thrust fault; 2: Sector border; 3, Beach; 4, Landslide scarp; 5, Slide; 6, Flow; 7, Colombacci Formation; 8, San Donato Formation. (B) Panoramic view toward the south.
Remotesensing 13 05012 g002
Figure 3. Sector 2 (Punta degli Schiavi–Mt. Brisighella) of the Mt. San Bartolo coastal slope. (A) Detailed geomorphological map: 1, Thrust fault; 2, Strike-slip fault; 3, Sector border; 4, Beach; 5, Landslide scarp; 6, Diffuse instability; 7, Slide; 8, Slump; 9, Flow; 10, Colombacci Formation; 11, San Donato Formation; 12, Gessoso Solfifera Formation; 13, Schlier Formation. (B) Panoramic view toward the south.
Remotesensing 13 05012 g003
Figure 4. Sector 3 (Mt. Brisighella-Vallugola harbor) of the Mt. San Bartolo coastal slope. (A) Detailed geomorphological map of sector 3b: 1, Sector border; 2, Beach; 3, Landslide scarp; 4, Flow; 5, Slump; 6, Colombacci Formation; 7, San Donato Formation; 8, Gessoso Solfifera Formation; 9, Schlier Formation. (B) Detailed geomorphological map of sector 3a: 1, Strike-slip fault; 2, Sector border; 3, Beach; 4, Landslide scarp; 5, Slump; 6, Flow; 7, Colombacci Formation; 8, San Donato Formation. (C) Panoramic view toward the south.
Remotesensing 13 05012 g004
Figure 5. Spatial distribution of the selected morphometric variables along the Mt. San Bartolo coastal slope: slope (a), ESD (b), R (c), and TRI (d). For each variable, a descriptive statistic of the computed values is also provided (table in the right corner of each inset).
Remotesensing 13 05012 g005
Figure 6. Trends of the slope variable (a) in the sectors subdividing the study area: Pesaro–Punta degli Schiavi (1), Punta degli Schiavi–Mt. Brisighella (2), Mt. Brisighella–Castel di Mezzo (3a), and Castel di Mezzo–Vallugola (3b); (b) in the sectors subdividing the study area considering normalized values: Pesaro–Punta degli Schiavi (1), Punta degli Schiavi–Mt. Brisighella (2), Mt. Brisighella–Castel di Mezzo (3a), and Castel di Mezzo–Vallugola (3b); (c) in the total study area (1) in comparison with areas affected (2) or not affected (3) by landslides; (d) in the total study area (1) in comparison with areas affected (2) or not affected (3) by landslides considering normalized values; (e) for each landslide typology occurring in the study area: slides (1), slumps (2), flows (3), and diffuse instability (4); (f) for each landslide typology occurring in the study area considering normalized values: slides (1), slumps (2), flows (3), and diffuse instability (4).
Remotesensing 13 05012 g006
Figure 7. Trends of ESD variable: (a) in the sectors subdividing the study area: Pesaro–Punta degli Schiavi (1), Punta degli Schiavi–Mt. Brisighella (2), Mt. Brisighella–Castel di Mezzo (3a), and Castel di Mezzo–Vallugola (3b); (b) in the sectors subdividing the study area considering normalized values: Pesaro–Punta degli Schiavi (1), Punta degli Schiavi–Mt. Brisighella (2), Mt. Brisighella–Castel di Mezzo (3a), and Castel di Mezzo–Vallugola (3b); (c) in the total study area (1) in comparison with areas affected (2) or not affected (3) by landslides; (d) in the total study area (1) in comparison with areas affected (2) or not affected (3) by landslides considering normalized values; (e) for each landslide typology occurring in the study area: slides (1), slumps (2), flows (3), and diffuse instability (4); (f) for each landslide typology occurring in the study area considering normalized values: slides (1), slumps (2), flows (3), and diffuse instability (4).
Remotesensing 13 05012 g007
Figure 8. Trends of the R variable: (a) in the sectors subdividing the study area: Pesaro–Punta degli Schiavi (1), Punta degli Schiavi–Mt. Brisighella (2), Mt. Brisighella–Castel di Mezzo (3a), and Castel di Mezzo–Vallugola (3b); (b) in the sectors subdividing the study area considering normalized values: Pesaro–Punta degli Schiavi (1), Punta degli Schiavi–Mt. Brisighella (2), Mt. Brisighella–Castel di Mezzo (3a), and Castel di Mezzo–Vallugola (3b); (c) in the total study area (1) in comparison with areas affected (2) or not affected (3) by landslides; (d) in the total study area (1) in comparison with areas affected (2) or not affected (3) by landslides considering normalized values; (e) for each landslide typology occurring in the study area: slides (1), slumps (2), flows (3), and diffuse instability (4); (f) for each landslide typology occurring in the study area considering normalized values: slides (1), slumps (2), flows (3), and diffuse instability (4).
Remotesensing 13 05012 g008
Figure 9. Trends of TRI variable: (a) in the sectors subdividing the study area: Pesaro–Punta degli Schiavi (1), Punta degli Schiavi–Mt. Brisighella (2), Mt. Brisighella–Castel di Mezzo (3a), and Castel di Mezzo–Vallugola (3b); (b) in the sectors subdividing the study area considering normalized values: Pesaro–Punta degli Schiavi (1), Punta degli Schiavi–Mt. Brisighella (2), Mt. Brisighella–Castel di Mezzo (3a), and Castel di Mezzo–Vallugola (3b); (c) in the total study area (1) in comparison with areas affected (2) or not affected (3) by landslides; (d) in the total study area (1) in comparison with areas affected (2) or not affected (3) by landslides considering normalized values; (e) for each landslide typology occurring in the study area: slides (1), slumps (2), flows (3), and diffuse instability (4); (f) for each landslide typology occurring in the study area considering normalized values: slides (1), slumps (2), flows (3), and diffuse instability (4).
Remotesensing 13 05012 g009
Figure 10. Matrix showing the two-by-two joint comparisons between R, ESD, and TRI variables. The x-axis represents values normalized considering the minimum and maximum values of the ratios considered.
Remotesensing 13 05012 g010
Figure 11. TRI and slope plots: (a) scatter plot of normalized frequency in stable areas; (b) scatter plot of normalized frequency in areas intersected by landslides; (c) scatter plot of normalized frequency in areas with scarp landforms; (d) TRI vs. slope plot indicating the grouping sector of stable areas (St), areas interested by landslides (L), and areas with scarp landforms (Sc); (e) TRI vs. slope plot obtained by constraining the correlation to the overall value range of each variable and indicating the clustering sector of stable areas (St), areas interested by landslides (L), and areas with scarp landforms (Sc).
Remotesensing 13 05012 g011
Figure 12. Altimetric profile along the coastline direction correlated with lithological information (the Colombacci Fm. in orange and the San Donato Fm. in red), slope value variation, TRI value variation, sector subdivision, indication of predominant landslide typologies occurring, and the stereographic projection in the lower hemisphere of the bedding attitude (continuous thick blue line), slope geometry (dashed red line), and main joint sets (thin dark lines).
Remotesensing 13 05012 g012
Publisher’s Note: MDPI stays neutral with regard to jurisdictional claims in published maps and institutional affiliations.