Article

A Specific Emitter Identification Algorithm under Zero Sample Condition Based on Metric Learning

1
Aerospace Information Research Institute, Chinese Academy of Sciences, Beijing 100094, China
2
Key Laboratory of Network Information System Technology (NIST), Institute of Electronics, Chinese Academy of Sciences, Beijing 100190, China
3
School of Electronic, Electrical and Communication Engineering, University of Chinese Academy of Sciences, Beijing 100190, China
4
National Key Laboratory of Science and Technology on Microwave Imaging, Beijing 100190, China
*
Author to whom correspondence should be addressed.
Remote Sens. 2021, 13(23), 4919; https://doi.org/10.3390/rs13234919
Submission received: 29 October 2021 / Revised: 26 November 2021 / Accepted: 1 December 2021 / Published: 3 December 2021

Abstract

:
With the development of information technology in modern military confrontation, specific emitter identification has become a hot and difficult topic in the field of electronic warfare, especially in the field of electronic reconnaissance. Specific emitter identification requires a historical reconnaissance signal as the matching template. In order to avoid being intercepted by enemy electronic reconnaissance equipment, modern radar often has multiple sets of working parameters, such as pulse width and signal bandwidth, which change when performing different tasks and training. At this time, the collected fingerprint features cannot fully match the fingerprint template in the radar database, making the traditional specific emitter identification algorithm ineffective. Therefore, when the working parameters of enemy radar change, that is, when there is no such variable working parameter signal template in our radar database, it is a bottleneck problem in the current electronic reconnaissance field to realize the specific emitter identification. In order to solve this problem, this paper proposes a network model based on metric learning. By learning deep fingerprint features and learning a deep nonlinear metric between different sample signals, the same individual sample signals under different working parameters can be associated. Even if there are no samples under a certain kind of working parameter signal, it can still be associated with the original individual through this network model, so as to achieve the purpose of specific emitter identification. As opposed to the situation in which the traditional specific emitter identification algorithm cannot be associated with the original individual when the signal samples of changing working parameters are not collected, the algorithm proposed in this paper can better solve the problem of changing working parameters and zero samples.

Graphical Abstract

1. Introduction

With the rapid development of military technology in the world, weapon systems can emerge endlessly. However, the basic principle of “Know the enemy and know yourself, and you can fight a hundred battles with no danger of defeat” remains unchanged. In the dynamic battlefield environment, how to associate the signal detected from the complex electromagnetic environment with the emitter, the platform, and the weapon system has important military significance. The demand and concept of radar emitter fingerprint identification are generated. Radar emitter fingerprint identification began in the mid-1960s, which is generally called specific emitter identification (SEI) [1,2,3] in foreign countries. It refers to receiving electromagnetic signals from unknown radar emitters, analyzing their individual characteristics, and determining the technical level of radar, so as to uniquely identify individual radar emitters, complete an accurate threat judgment and identification of its carrying platform, and provide intelligence and support for threat analysis, identification, and warning of electronic intelligence reconnaissance systems in a complex environment.
Modern radar often has multiple sets of working parameters. When performing different tasks and training, different working parameters are used, so that we cannot easily establish a complete radar database through electronic intelligence reconnaissance. Enemy radar emitters will not only hide among a group of radar emitters of the same type or radar emitters working in the same modulation mode, but also change the working parameters of some transmitting channels, such as center frequency, pulse width, and signal bandwidth, to resist our electronic intelligence reconnaissance. Many scholars have made great progress in specific emitter identification under constant working parameter conditions. However, the research on specific emitter identification under variable working parameter conditions is still preliminary. The nonlinear characteristics of radar emitters under variable working parameter conditions will change, and the collected fingerprint features cannot fully match the usual fingerprint features, the recognition accuracy will be greatly reduced or even impossible to recognize. Specific emitter identification under variable working parameter conditions has been a major problem in the field of electronic reconnaissance for a long time. Therefore, the research on specific emitter identification under variable working parameters is of great significance.
In the field of specific emitter identification, conventional radar parameters were initially used as identification features [1], and the most typical case is the use of a pulse description word (PDW = (carrier frequency (CF), pulse amplitude (PA), pulse width (PW), time of arrival (TOA), direction of arrival (DOA))) to identify specific radar equipment. With the increasing complexity of the radar system, the waveform design becomes more and more complex, the working frequency band of radar is constantly expanding, and the working frequency bands of different radars overlap in a wider and wider range. Especially with the use of phased array radar and agile radar, the conventional radar parameters cannot provide enough effective information to meet the corresponding identification requirements [4]. The intra pulse characteristics of radar signals are increasingly used in SEI, such as envelope characteristics [5,6,7,8,9,10], instantaneous characteristics [11,12,13,14,15], and other basic parameter information, as well as time spectrum [16,17,18,19,20], high-order spectrum [21,22,23,24,25], Hilbert spectrum [26,27,28,29], and other transform domain information [30,31,32,33,34,35,36,37,38,39,40,41,42,43,44,45,46,47,48,49]. In addition, there are also studies to analyze and design fingerprint features for specific emitter identification based on the generation mechanism of fingerprint features [50,51,52]. However, the above algorithms have not discussed whether the fingerprint features will change and their changes when the radar working parameters change, but the radar working parameters change from time to time. Therefore, whether or not the fingerprint features of the above algorithms are robust needs further experimental testing. In this paper, a specific emitter identification algorithm model based on metric learning is proposed. Although the nonlinear characteristics of emitter change when the radar working parameters change, the emitter system containing these nonlinear characteristics does not change, so the change rule of these nonlinear characteristics is still traceable. On the one hand, the recognition accuracy of the classification algorithm lies in the separability of the proposed features, and on the other hand, it lies in the measurement method used to evaluate the differences between samples. The proposed model takes metric learning as the point of penetration and establishes a deep nonlinear distance metric between different working parameter sample signals of the same individual, so that even for the sample signals with unknown working parameters, it can still be better associated with the original individual than the traditional algorithm. The main contributions are summarized as follows: (1) It is proposed for the first time that when the radar working parameters change, the features extracted by the traditional recognition algorithm do not have robustness, resulting in a great reduction in the recognition accuracy. (2) Compared with the traditional algorithm, which cannot recognize the original individual under variable working parameter conditions, the proposed algorithm could achieve high recognition accuracy under the extreme condition that a certain kind of variable working parameter sample signal to be identified is not obtained, that is, under the condition of zero samples. (3) Moreover, the proposed model is trained end-to-end from scratch, with random initialization, no additional training set, and simpler (no RNNs) and faster (no fine-tuning) processing.
This paper is arranged as follows: Section 2 gives a further detailed description of the problem to be studied in this article. Section 3 focuses on the specific structure and experimental ideas of the proposed network model, reviews the data structure of variable working parameter sample signal dataset, and compares the proposed algorithm with several traditional typical recognition algorithms. Numerous experimental results are shown in this section. Section 4 discusses why the proposed model can solve the zero sample problem well. Finally, conclusions are drawn in Section 5.

2. Problem Definitions

Emitter fingerprint identification, also known as specific emitter identification, was first proposed by Northrop Grumman Company in the 1960s. It refers to the technology of extracting the information reflecting the target identity (known as “emitter fingerprint”) only through the external feature measurement of the signal, comparing the fingerprint information with the radar database to determine the specific emitter individual transmitting a given signal. Thus, it is a technique to determine which specific emitter individual is transmitting a given signal. The non-ideal characteristics of the emitter device lead to the inevitable deviation of the modulation signal, which carries the unintentional modulation containing hardware information, and there are slight differences between different emitter devices, so that unintentional modulation implies a certain “individual information”. This individual difference of the emitter is inevitable and difficult to forge due to the non-ideal characteristics of hardware and the fact that it is attached to intentional modulation, that is, an “emitter fingerprint”, which is an inherent feature of emitter hardware.
Emitter fingerprint recognition refers to extracting the characteristics representing the individual information of a specific emitter from the received time series signal for classification and recognition. In essence, it is a pattern recognition problem. Talbot et al. proposed a typical SEI system structure in 2003, as shown in Figure 1 [1]. The general processing flow is as follows: First, receive the signal through the radio frequency (RF)-receiving subsystem. Then, through the signal processing system, the received time series signals are preprocessed by filtering, denoising, pulse detection, and so on, and the signal is demodulated according to the actual demand. Next, the fingerprint features are extracted to obtain the fine features including the individual information of the emitter. Finally, compared with the radar database, the specific emitter transmitting a given signal is determined by using the classification and recognition algorithm to realize the individual recognition of the emitter.
At present, the existing research focuses on identifying individual radar emitters under the condition of fixed working parameters and the research on specific emitter identification under variable working parameter conditions is still preliminary. The existing research does not discuss whether the fingerprint features will change and their changes when the radar working parameters change. Therefore, whether or not the fingerprint features of the existing research are robust needs further experimental testing.
The typical working parameters of radar emitter mainly include center frequency, signal bandwidth, pulse width, transmission power, and modulation waveform. The center frequency of the radar is mainly determined according to the characteristics of the target, radio wave propagation conditions, antenna size, performance of high-frequency devices, measurement accuracy, and functions of the radar, etc. The signal bandwidth is mainly determined according to the ranging accuracy and distance resolution of the task. Pulse width refers to the duration of the transmitted pulse signal. It is represented by τ , which is generally between 0.05 and 20 us. It not only affects the detection capability of the radar, but also affects the range resolution. The pulse width of early radars is constant, and modern radars use signals with variable pulse widths for selection. When pulse compression technology is used, the pulse width of the transmitted pulse can reach hundreds of microseconds, which correspondingly increases the bandwidth of the signal; the value of the transmit power affects the effective power, and the larger the power, the longer the effective distance. Transmit power is divided into pulse power and average power. The output power of the radar during the pulse signal transmission is called the pulse power, and the average power refers to the average value of the transmitter output power in a period. The output power of the transmitter directly affects the power and anti-interference ability of the radar. The generation of high frequency and high power is restricted by factors such as devices, power supply capacity, and efficiency. Generally, the pulse power of early warning radars is in the order of hundreds of kilowatts to megawatts, and firepower control radars are in the order of several kilowatts to hundreds of kilowatts. Early radar transmission signals used a single pulse waveform modulation method, and modern radars often use multiple modulation waveforms for different target detection requirements.
Among the five types of typical radar working parameters, this article focuses on how to identify unknown samples when the three types of working parameters—center frequency, signal bandwidth, and pulse width—are changed and their combination changes. Although we can obtain a large number of sample signals under constant parameter conditions and some sample signals whose working parameters have changed (such as the bandwidth is expanded by 10 MHz, 15 MHz, and 20 MHz), it is impossible for us to collect all sample signals within the possible range of changes in working parameters (such as the bandwidth is expanded by 8 MHz), which is exactly the problem to be solved in this article: how to identify when the working parameters are changed and when there is no such signal sample in the radar database.

3. Methodology

3.1. Dataset

In order to provide basic conditions for theoretical analysis and practical verification for this research, it is necessary to repeatedly adjust the working parameters of different individual radar emitters to generate individual signals. Owing to the confidentiality to military systems, such complex individual signals are extremely difficult to obtain. Therefore, this research adopts simulation methods for experimental analysis. The method proposed in article [53] is selected here to establish a fingerprint-level radar emitter simulation model. This model cannot only provide fingerprint-level individual signals, but also can flexibly adjust the modulation mode and working parameters, which can fully meets the experimental needs of this research.
SystemVue is a system-level electronic simulation software of Keysight Company, which mainly realizes system-level modeling and simulation in the electronic field, including radar, communication, radio, and other fields. This software can realize digital, analog, or mixed domain, single-rate or multi-rate simulation system in the application of digital signal processing, communication equipment, and radio and control systems. It contains a variety of tool libraries, which is convenient for users to add a baseband, RF, physical layer, and other functional modules, and supports the theoretical analysis and simulation of analog circuits such as amplifiers, capacitors, and inductors. The software interface is friendly, and can be combined with C++, ADS, Xilinx, MATLAB, and other software to achieve simulation. In recent years, SystemVue has attracted more and more attention in the field of electronic simulation, especially in the field of radar communication. At present, the use of this software in the electronic field is mainly reflected in the communication system, whereas the construction and simulation of the radar system platform is less. SystemVue is a system-level design and simulation software for baseband and RF advanced architecture development. It includes a variety of simulation techniques in the time-frequency domain and baseband radio frequency domain, and can realize all linear and nonlinear behavior-level modeling and simulation of baseband and radio frequency systems. It mainly supports the simulation of the following spectrum types: (1) spectrum of signal source and carrier frequency; (2) intermodulation/harmonics: nonlinearity caused by RF devices such as mixers, amplifiers, etc.; (3) broadband noise: caused by thermal noise of RF circuit; (4) phase noise: phase noise transmitted in RF system. These functions make it very suitable for nonlinear fingerprint-level radar simulation modeling.
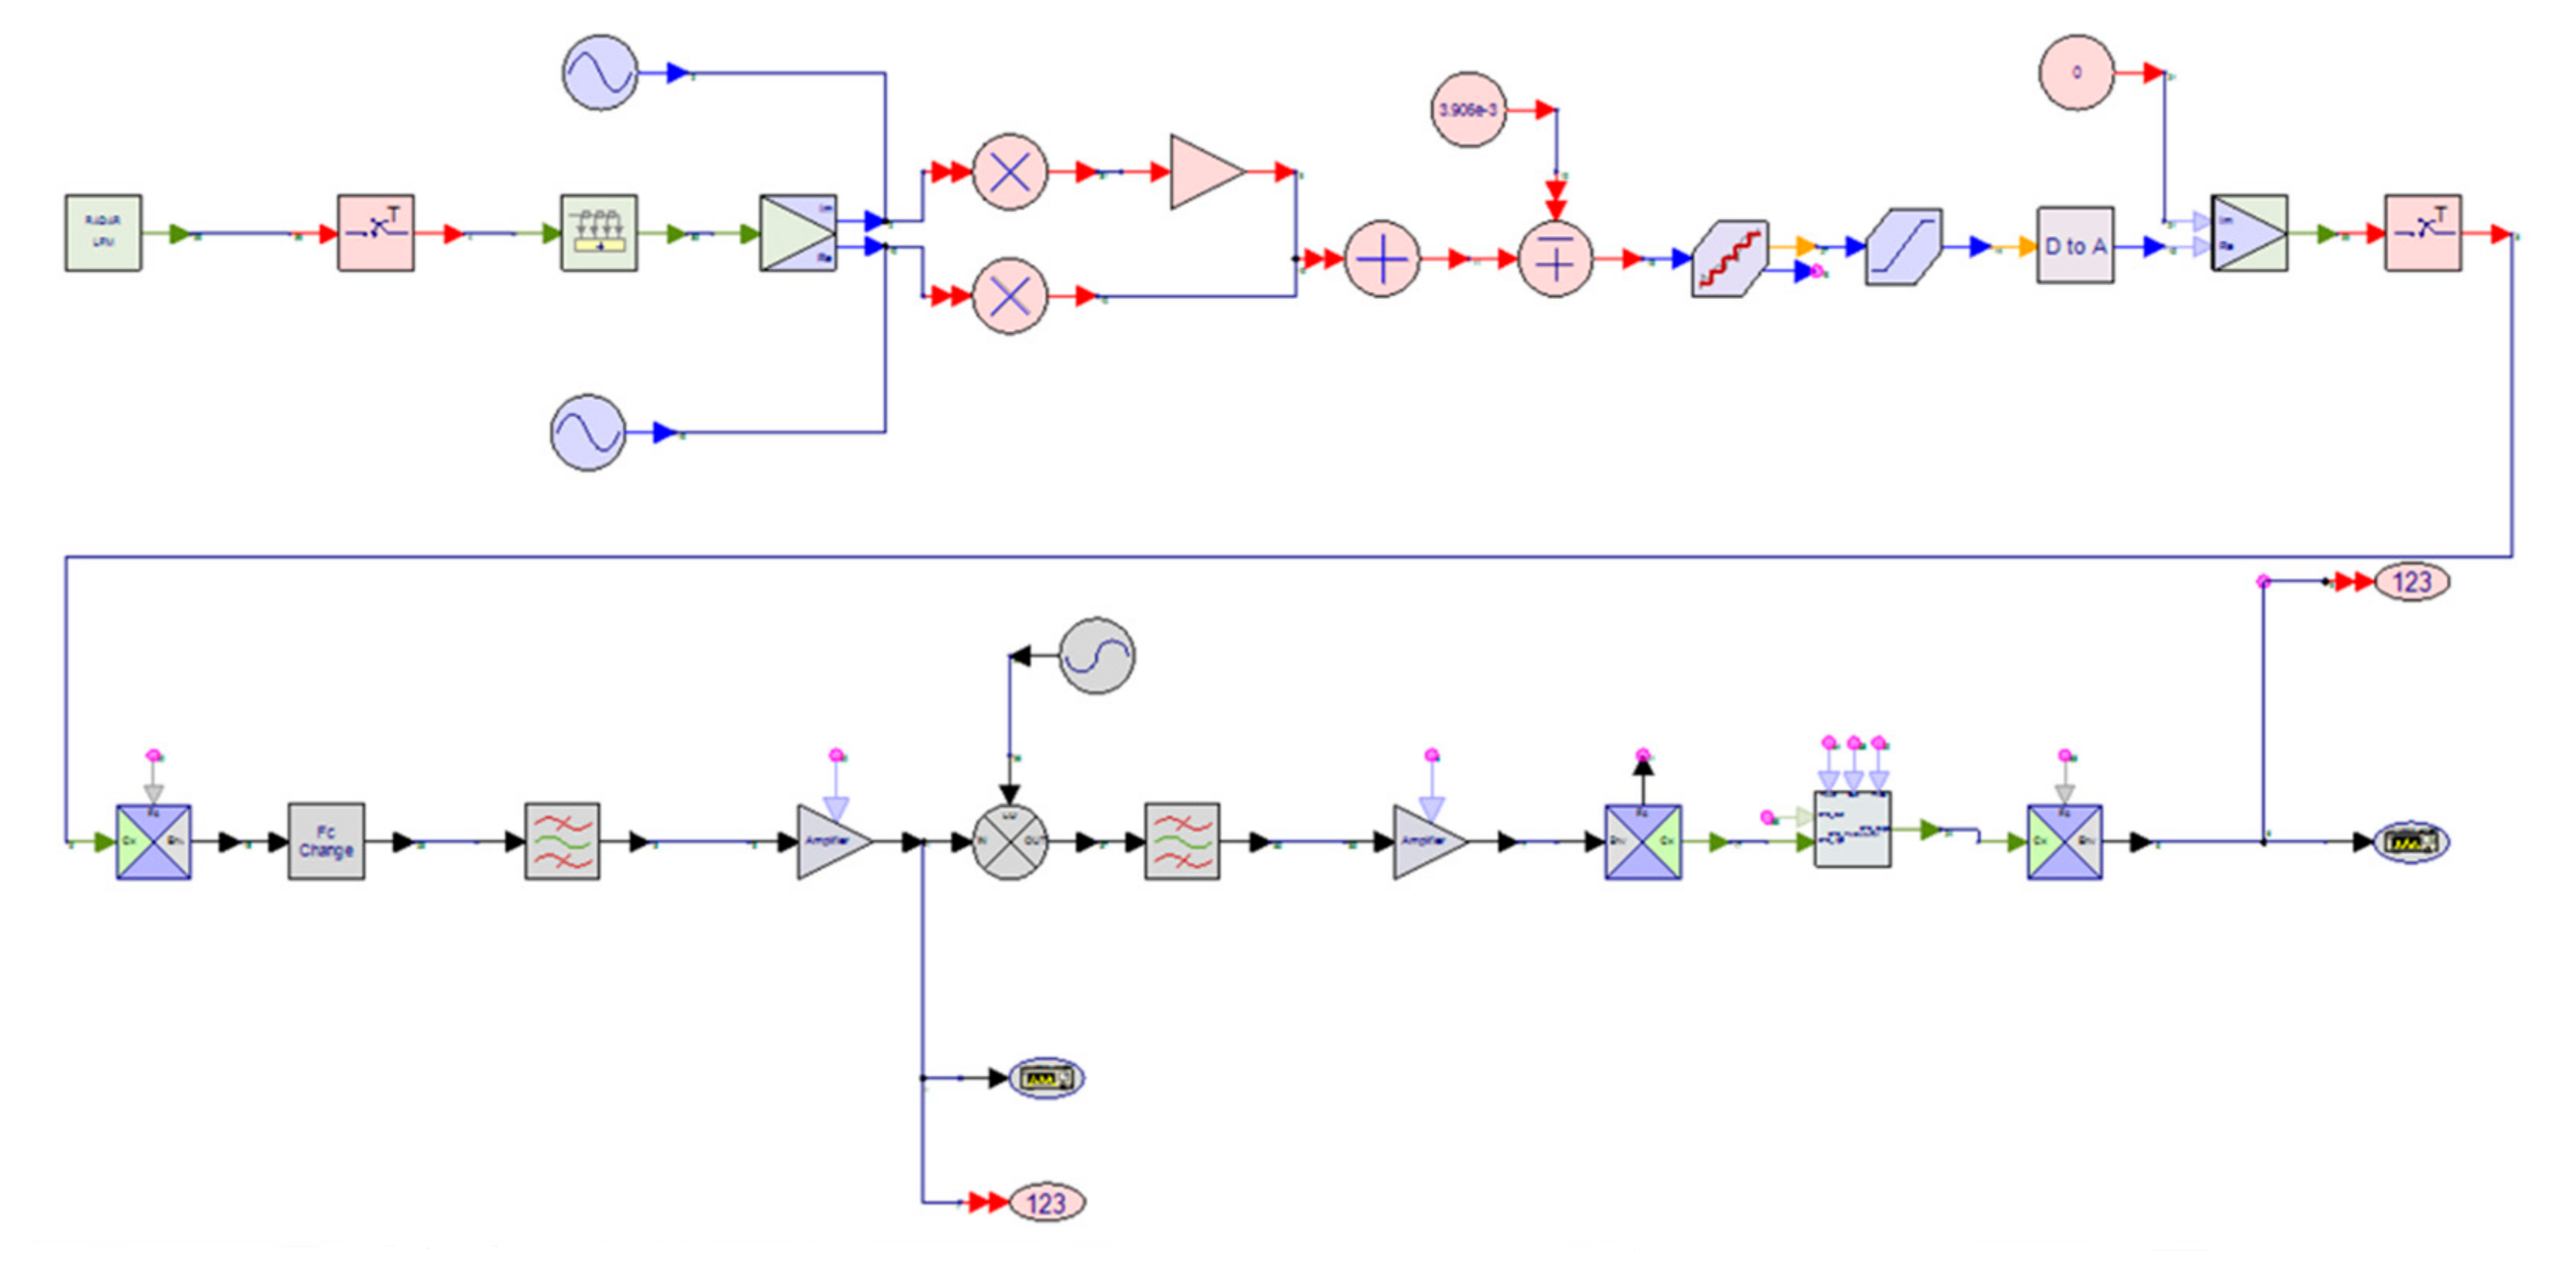
According to the working principle of the radar, the fingerprint-level radar system is designed and modeled based on the SystemVue simulation platform, as shown in the Figure 2. The upper part of the model is the signal source, and the lower part is the IF filter, IF amplifier, mixer, local oscillator, RF filter, and RF amplifier from left to right.
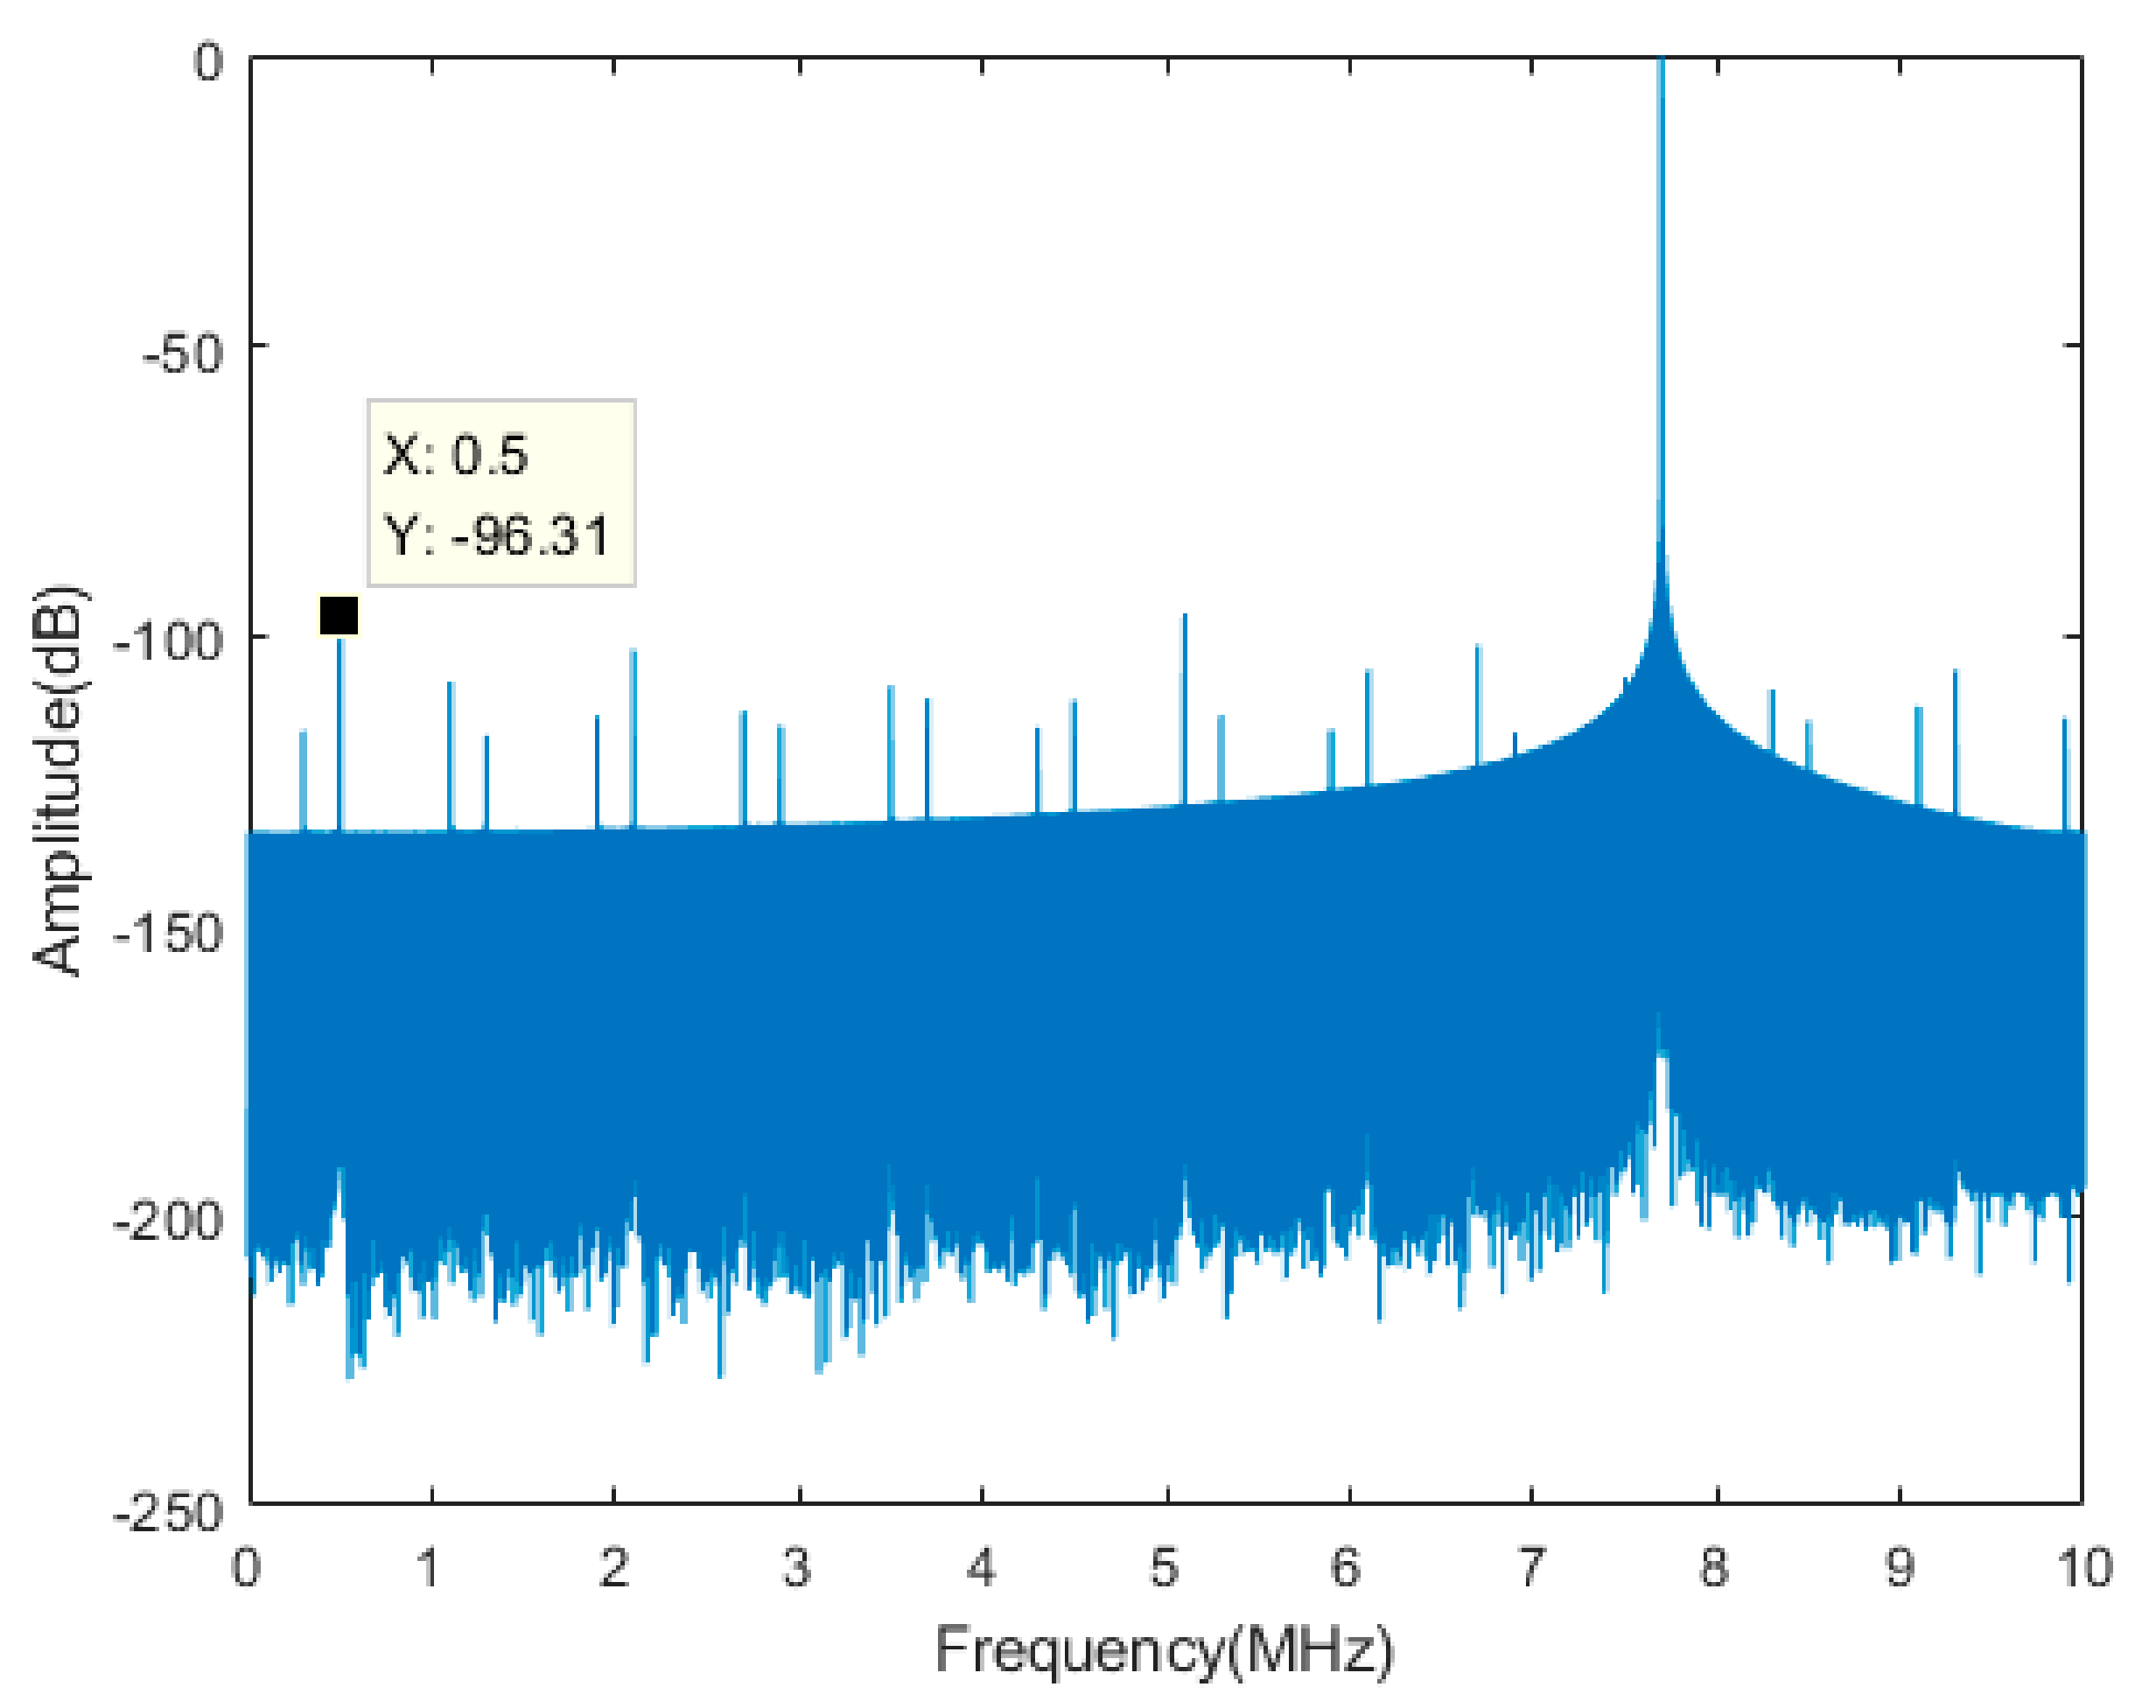
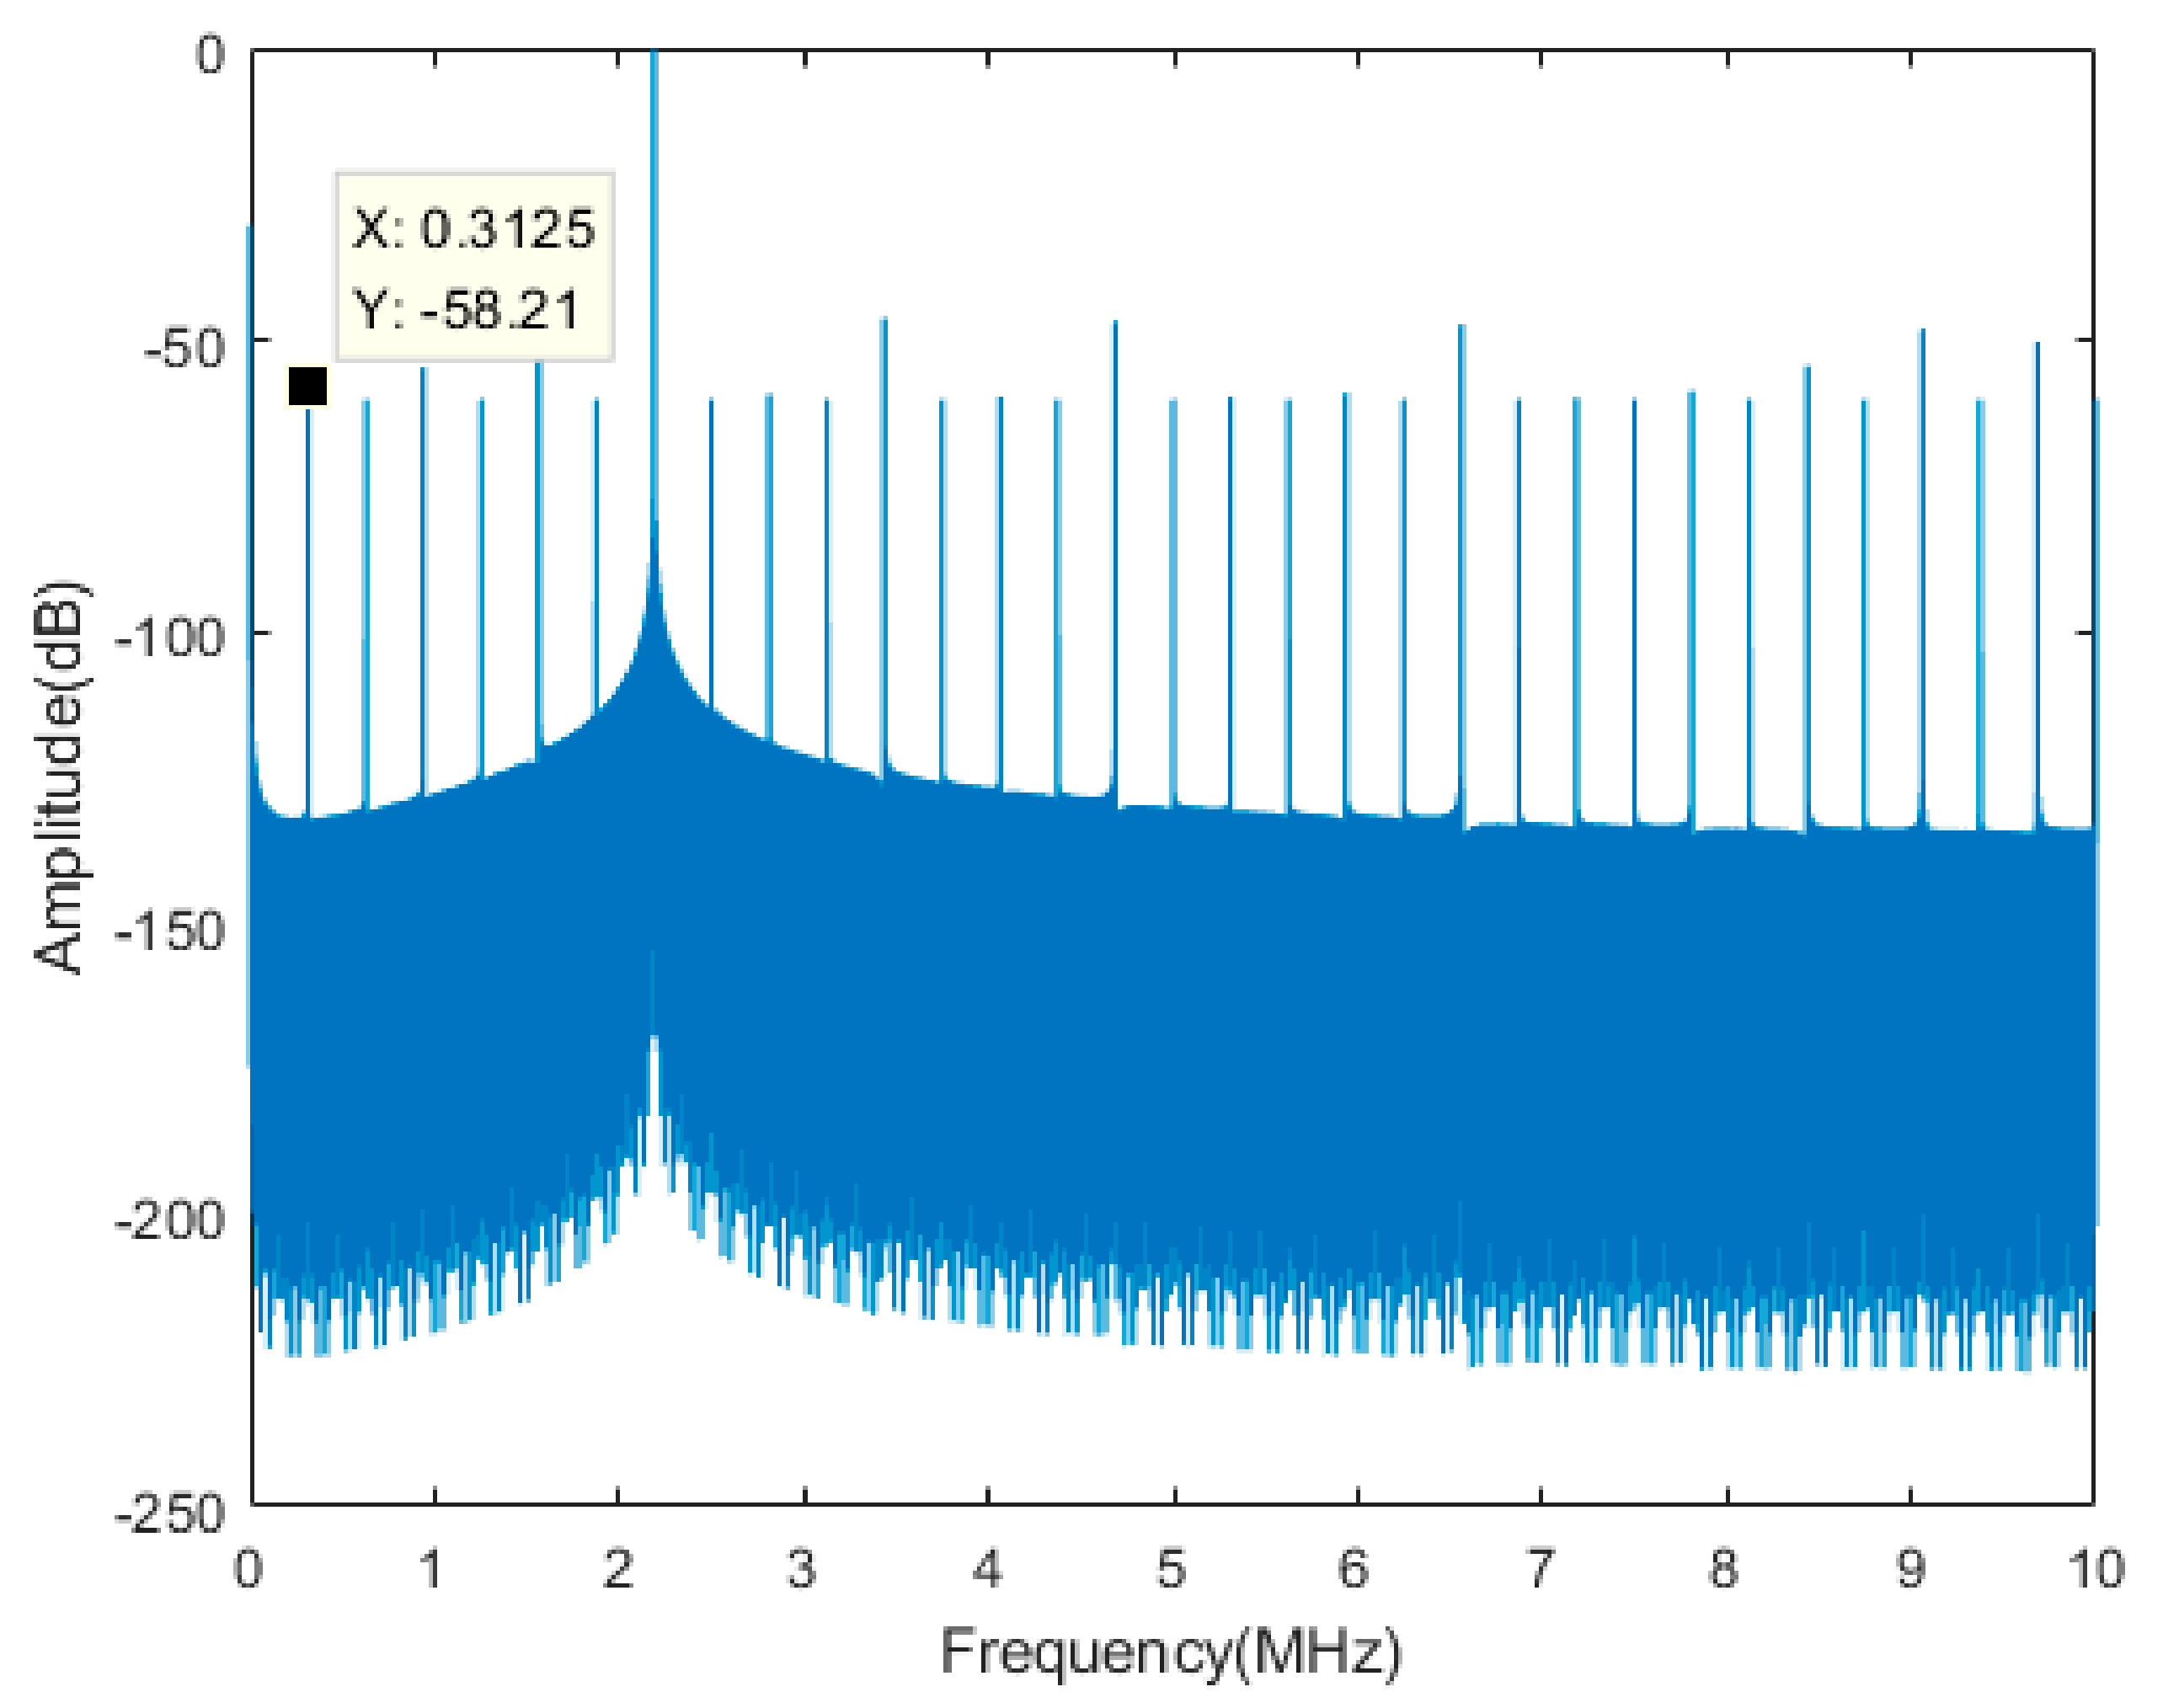
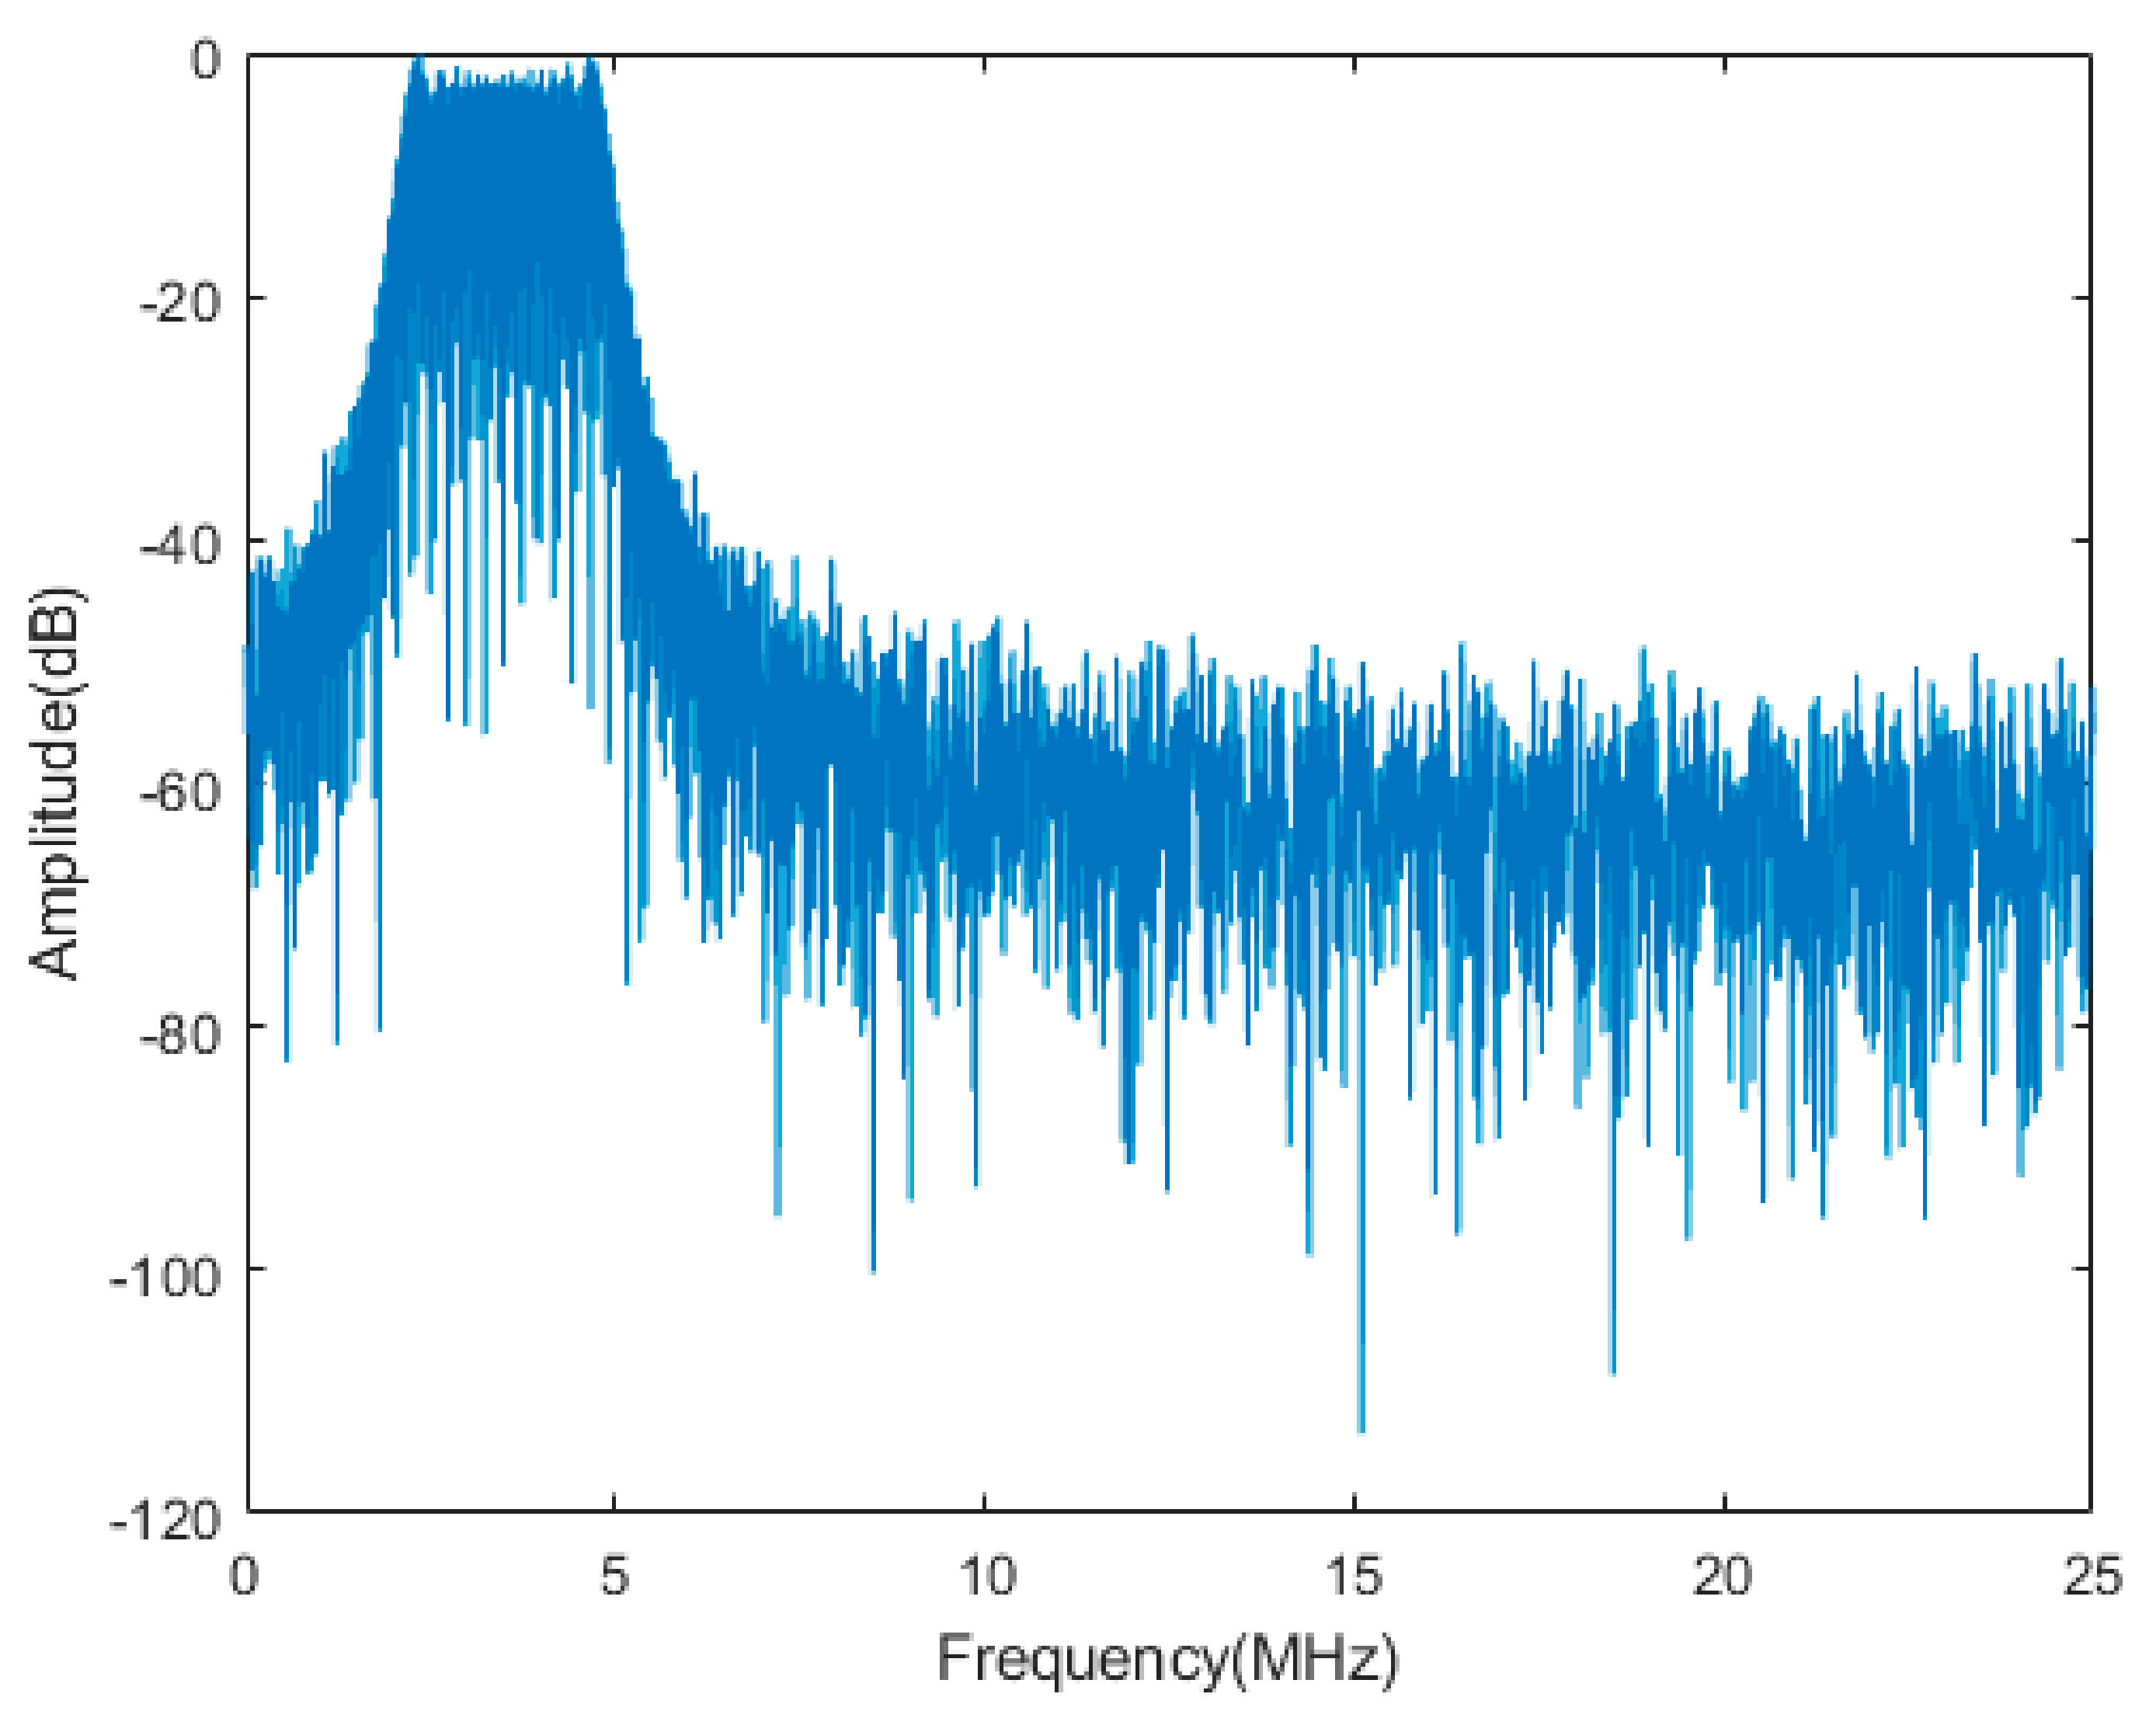
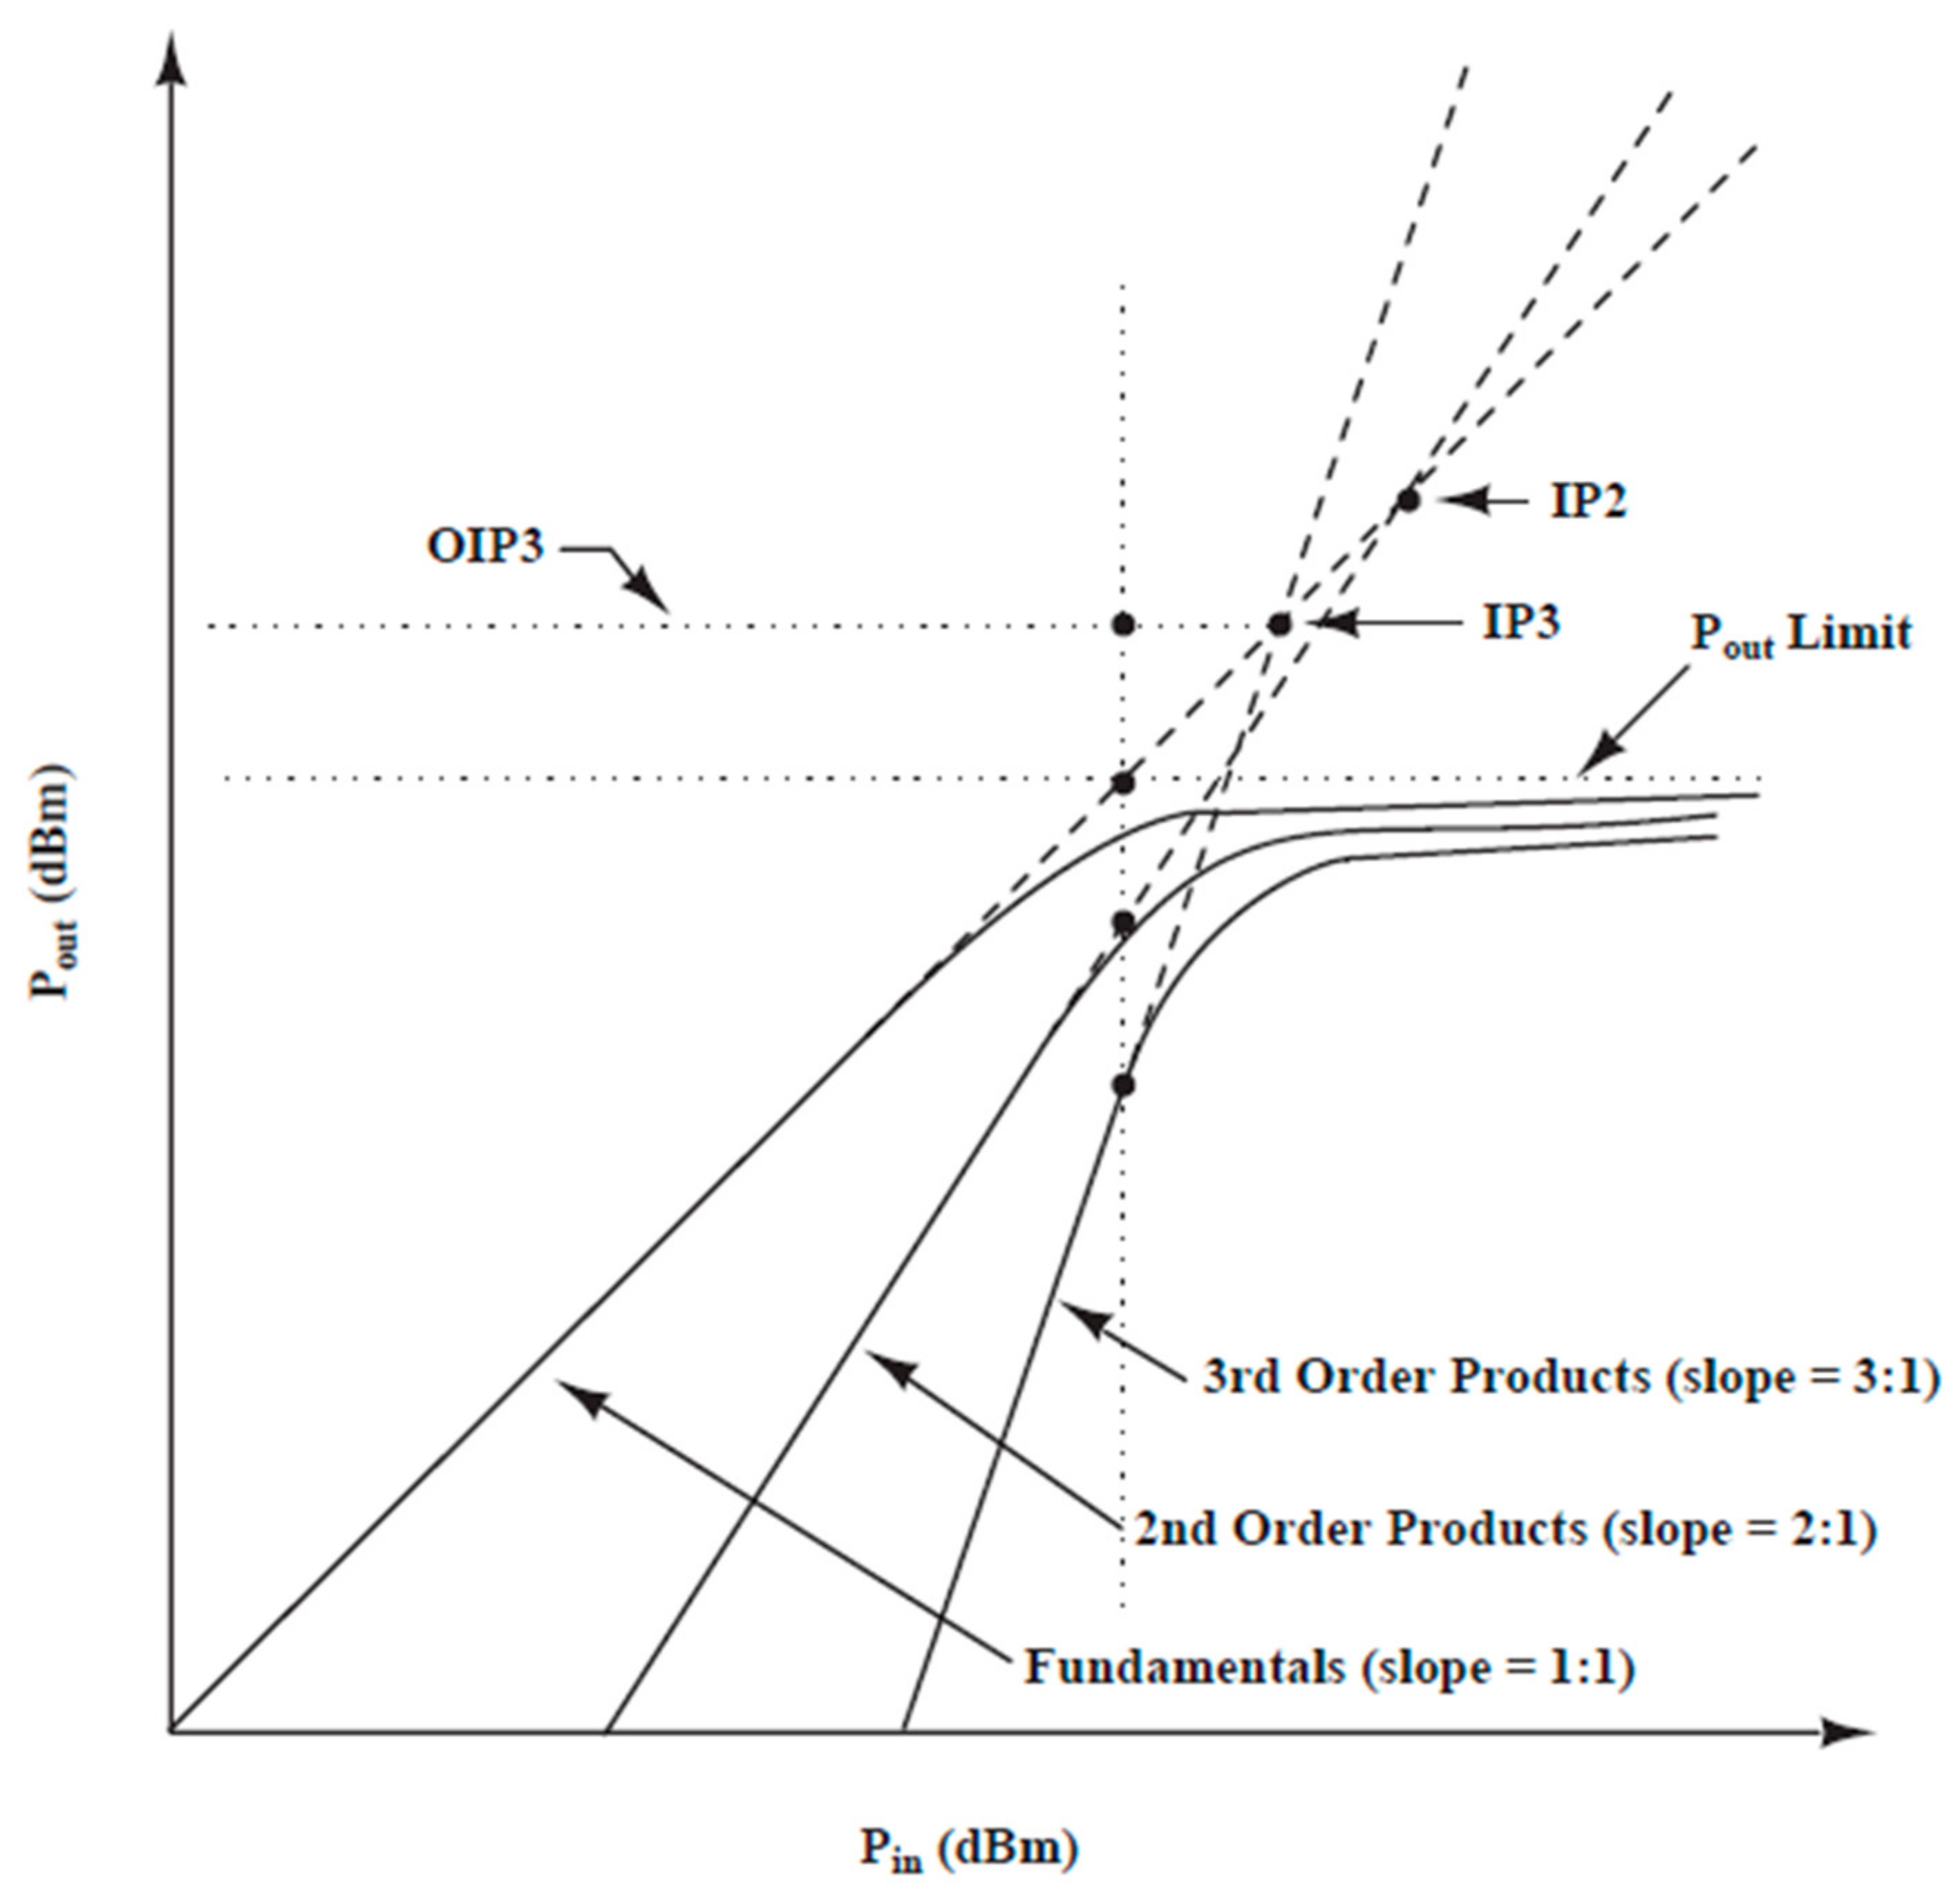
As described in Section 2, the non-ideal characteristics of the emitter device lead to the inevitable deviation of the modulation signal, which carries the unintentional modulation containing hardware information, and there are slight differences between different emitter devices, so that unintentional modulation implies a certain “individual information”. The non-ideal characteristics of radar emitters are mainly reflected in signal sources, mixers, and amplifiers. In this model, the simulation models of different radar emitter individuals are mainly realized by adjusting the design parameters of these three devices. Among them, the non-ideal characteristics of the signal source are mainly burrs, which are caused by phase truncation error and amplitude quantization error, as shown in Figure 3, Figure 4 and Figure 5. These non-ideal characteristics can be simulated by adjusting the phase truncation bits and amplitude quantization bits in the signal source. The mixer and amplifier are the core modules in the transmission channel. The mixer is responsible for moving the IF signal spectrum to the RF region, and the amplifier is responsible for amplifying the input RF signal. However, the nonlinear characteristic models of the two are consistent, as shown in Figure 6. The non-ideal characteristics of mixers and amplifiers are mainly high-order harmonics and intermodulation distortion. These non-ideal characteristics can be simulated by adjusting the 1 dB compression point, third-order truncation point, and second-order truncation point in the mixer and amplifier.
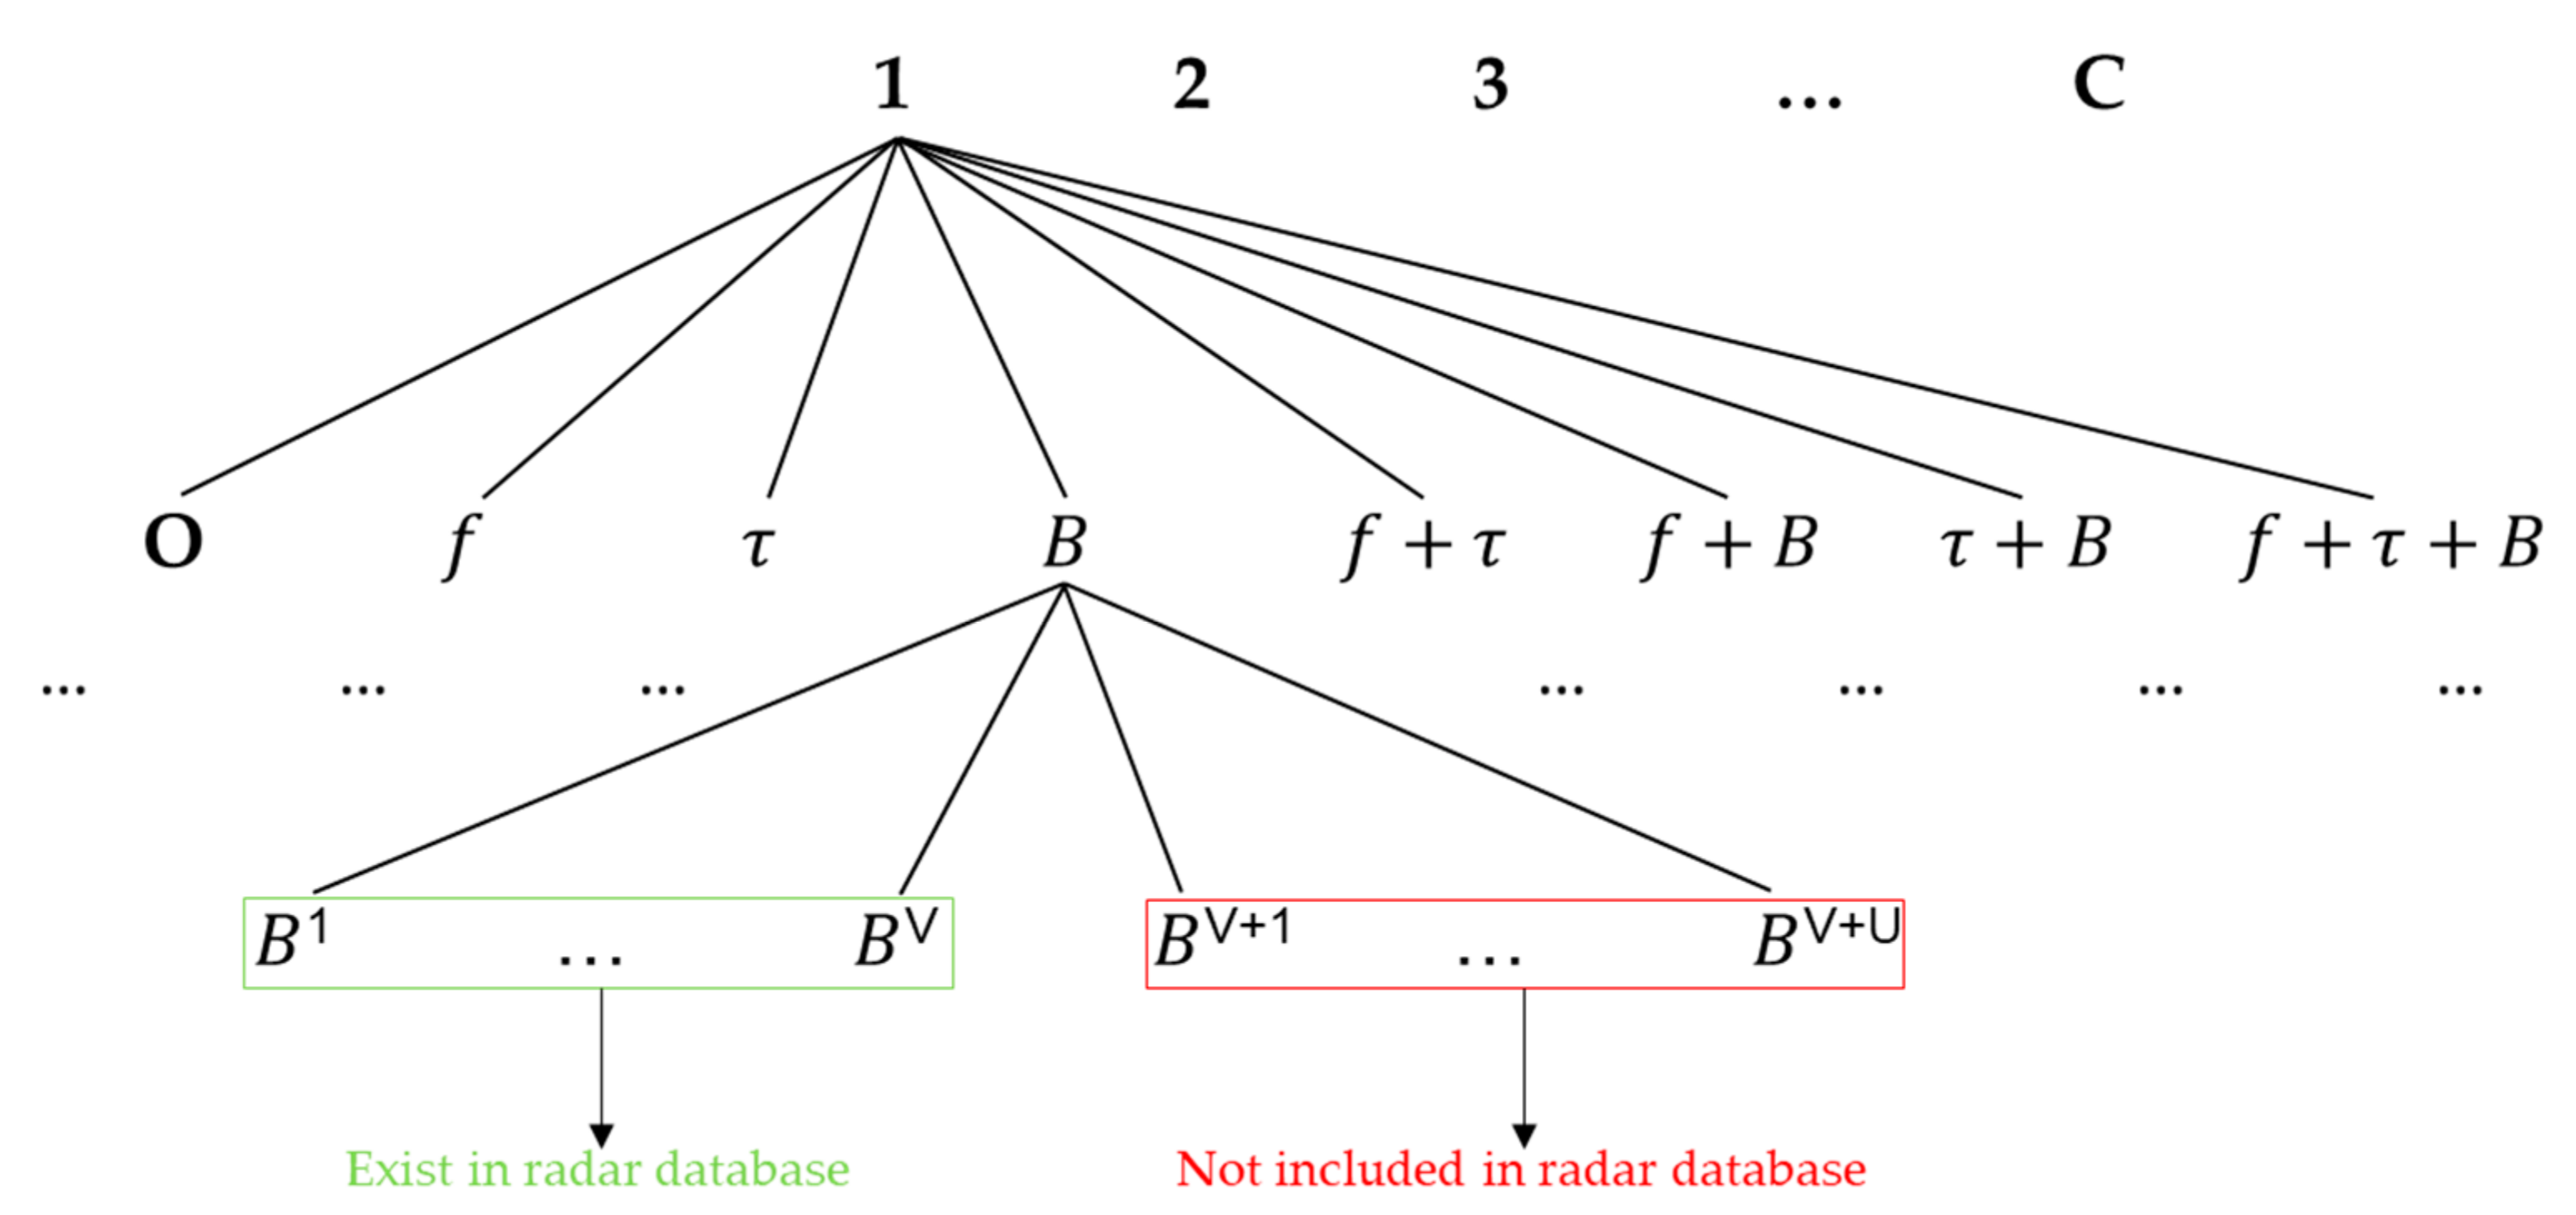
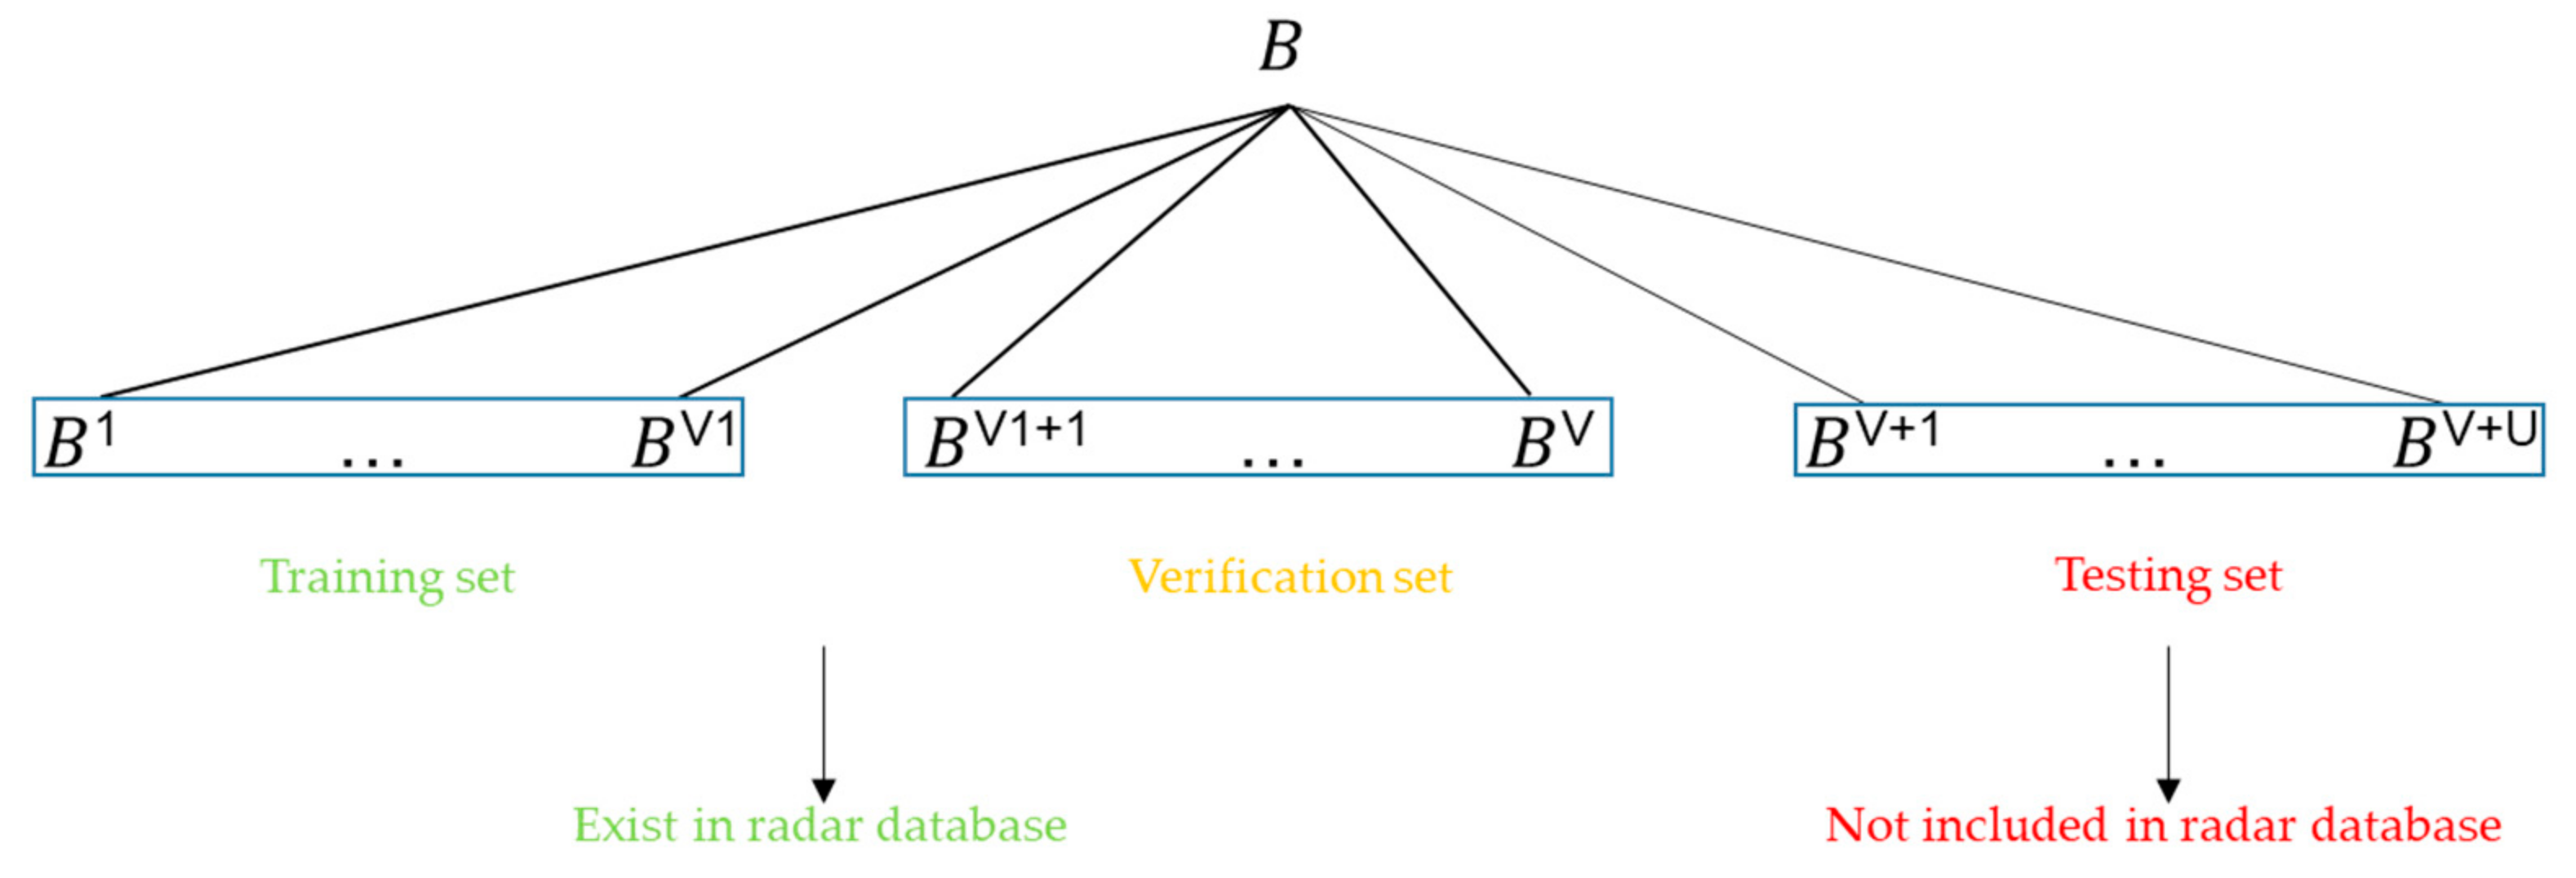
We simulated individual fingerprint-level signal datasets by adjusting design parameters such as amplitude quantization bits, phase truncation bits, second-order and third-order truncation points, and 1 dB compression points. Table 1 shows a set of the typical values of the main design parameters of the main components of a radar emitter that can characterize individual differences. On this basis, the constant working parameter and variable working parameter fingerprint-level datasets of individual signals are generated by adjusting the working parameters of center frequency, signal bandwidth, and pulse width. A total of C individual fingerprint-level signal datasets are thus generated. Each individual dataset is subdivided into a constant working parameter case and seven variable working parameter cases: center frequency change, signal bandwidth change, pulse width change, and their combinations. Each variable working parameter dataset is subdivided into W subsets according to the value of parameter change. Among them, the constant working parameter dataset is used to simulate the sample signals of fixed working parameters frequently received in the radar database, one part of the variable working parameter dataset (V subsets) is used to simulate the sample signals of variable working parameters occasionally received in the radar database, and the other part ( U subsets, where U = W V ) is used to simulate the sample signals under variable working parameter conditions that we have never received and need to identify. The dataset distribution architecture is shown in Figure 7, where the center frequency, pulse width, and signal bandwidth are represented by f , τ , and B , respectively, and O represents constant working parameters. For example, ‘ f ’ means that only the center frequency has changed, and ‘ f + τ + B ’ means that the center frequency, pulse width, and signal bandwidth have all changed at the same time. Due to space constraints, not all subsets of variable working parameter datasets are drawn. Here, let us take the dataset with bandwidth change as an example, where B 1 to B V represent V subset signals that have been received in the radar database, and B V+1 to B V+U represent U subset signals that have never been received and need to be identified.
In military applications, higher requirements are put forward on performance indicators such as radar effective distance, resolution capability, and measurement accuracy. On the one hand, in order to improve the resolution and ranging accuracy, the signal is required to have a large bandwidth, and on the other hand, in order to improve the speed resolution and speed measurement accuracy, the signal is required to have a large time width. In addition, increasing the effective distance of the radar system requires the signal to have large energy. Under the condition that the peak power of the system’s transmitting equipment is limited, large signal energy can only be obtained by increasing the time width of the signal, which requires the signal to have large time width and bandwidth product. From the signal and system theory, it is known that the time bandwidth product of an ordinary signal is a constant, so it is impossible for a signal to have a large time width and bandwidth at the same time. In order to resolve this contradiction, people have made various attempts and explorations in an effort to get a breakthrough in the radar system. The emergence of pulse compression technology effectively solves the contradiction between the effective distance of the radar system and the range resolution. The linear frequency modulation system is a kind of pulse compression technology. Its generation and processing are relatively easy, and the technology is relatively mature, and it has been widely used at present. In this research, the linear frequency modulation system is used as the modulation mode of the radar to generate fingerprint-level individual signals. More concretely, a total of five individual fingerprint-level signal datasets are generated. Each individual dataset is subdivided into constant working parameter case and seven variable working parameter cases: center frequency change, signal bandwidth change, pulse width change, and their combinations. Each variable working parameter dataset is subdivided into W subsets according to the value of parameter change, each subset has 1000 samples with a length of 1024 under different SNR conditions (10 dB, 20 dB, and 30 dB).

3.2. Network Architecture

Firstly, we divide the fingerprint-level signal datasets obtained from the above simulation models into three datasets: the training set, verification set, and testing set. Each set consists of two parts of the data. One part of the data is the constant working parameter dataset and the other part is the variable working parameter dataset, where each set has its own parameter value change space that is disjointed with the others (the training set occupies V1 subsets, and the verification set occupies the remaining V 2 = V V 1 subsets.). Among them, the variable working parameter sample signals in the training set and verification set are used to simulate the various working parameter sample signals occasionally collected in the radar database, while the testing set is used to simulate the variable working parameter sample signals that are not available in the radar database and need to be identified.
With the verification set only, we can, in principle, train a classifier to assign a class label y ^ to each sample x ^ in the testing set. However, due to the obvious differences between the fingerprint characteristics of variable working parameter sample signals with different change values, the performance of such a classifier is usually not satisfactory. Therefore, we aim to perform meta-learning on the training set, in order to extract transferrable knowledge that will allow us to perform better on the verification set, and thus classify the testing set more successfully.
In each training iteration, an episode is formed by randomly selecting K1-labeled samples from each of C classes of constant working parameter datasets in the training set as the sample set S = x i , y i i = 1 m m = K 1 × C , and randomly selecting K2 samples from each of the V1 subsets of the C classes of variable working parameter datasets in the training set as the query set Q = x j , y j j = 1 n n = K 2 × V 1 × C . This sample/query set split is designed to simulate the verification/testing set that will be encountered at test time. A model trained from the sample/query set can be fine-tuned further using the verification set, if desired. In this work we adopt such an episode-based training strategy.
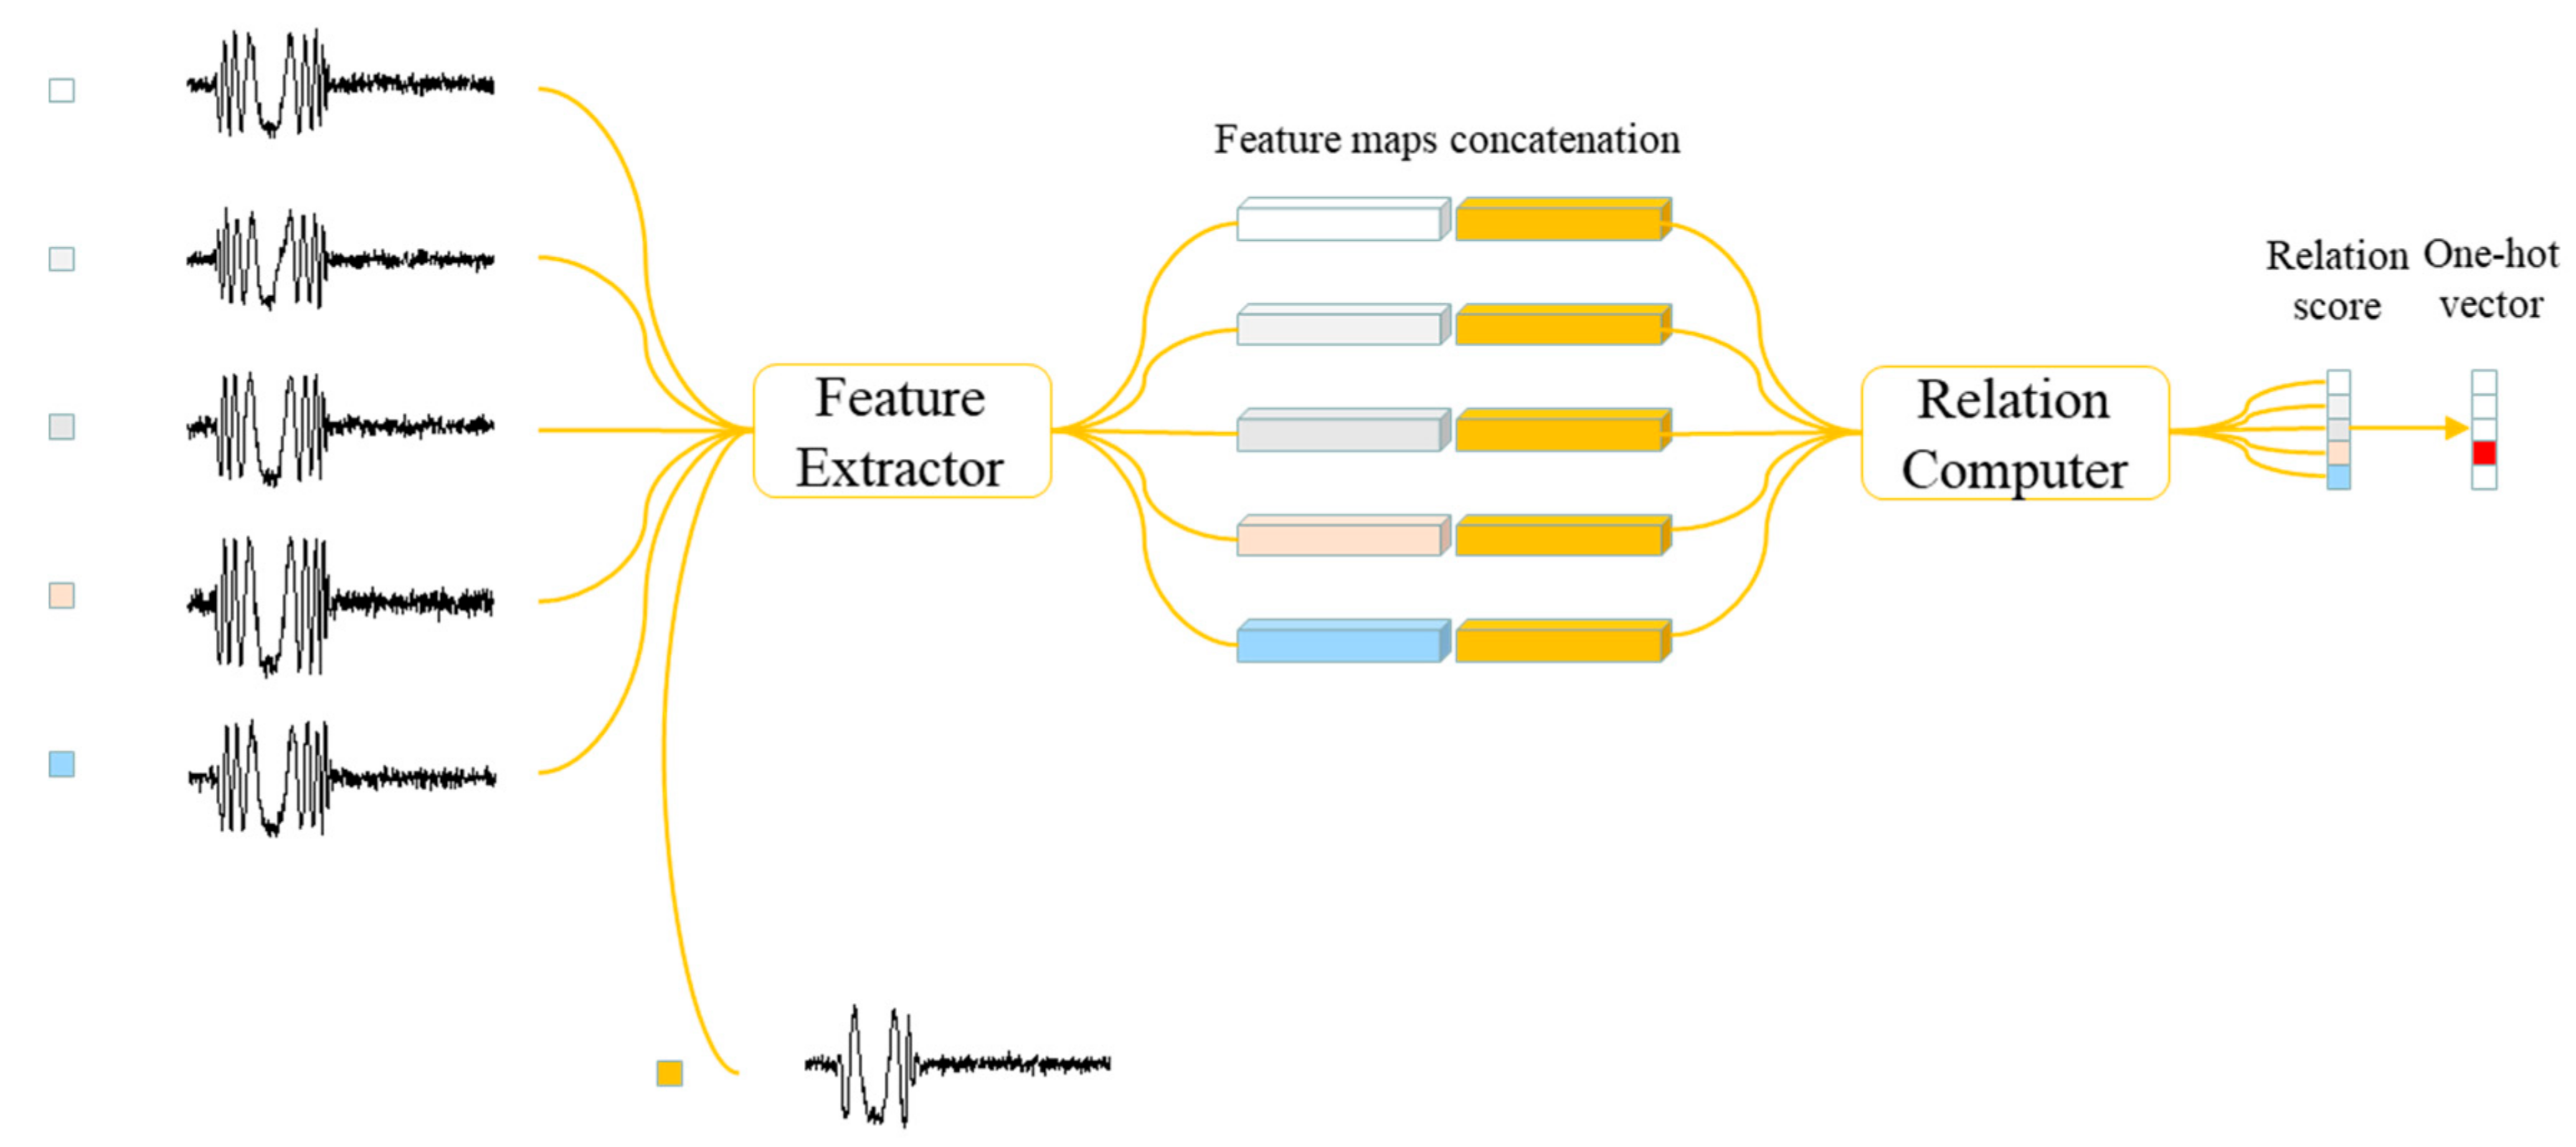
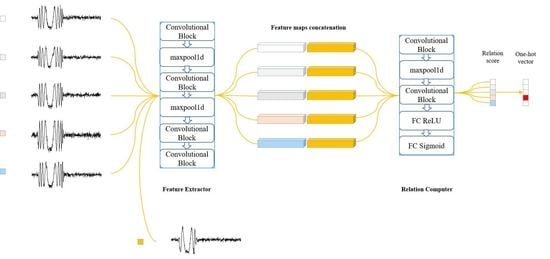
Our model consists of two modules: a Feature Extractor f φ and a Relation Computer g , as illustrated in Figure 8. Sample x j in the query set Q , and sample x i in the sample set S are fed through the Feature Extractor f φ , which produces feature maps f φ x i and f φ x j . The feature maps f φ x i and f φ x j are combined with operator C f φ x i , f φ x j , where C · , · means to concatenate the feature maps in depth.
The combined feature map of the sample and query are fed into the Relation Computer g , which eventually produces a scalar in range of 0 to 1, representing the similarity between x i and x j , which is called the relation score. Thus, for each query input x j , we could generate C relation scores r i , j between training sample set examples x i .
r i , j = g C f φ x i , f φ x j , i = 1 , 2 , , C
We use the mean square error (MSE) loss (Equation (2)) to train our model, regressing the relation score r i , j to the ground truth: matched pairs have a similarity of 1 and the mismatched pairs have a similarity of 0.
φ , argmin φ , i = 1 m j = 1 n r i , j 1 y i = = y j 2
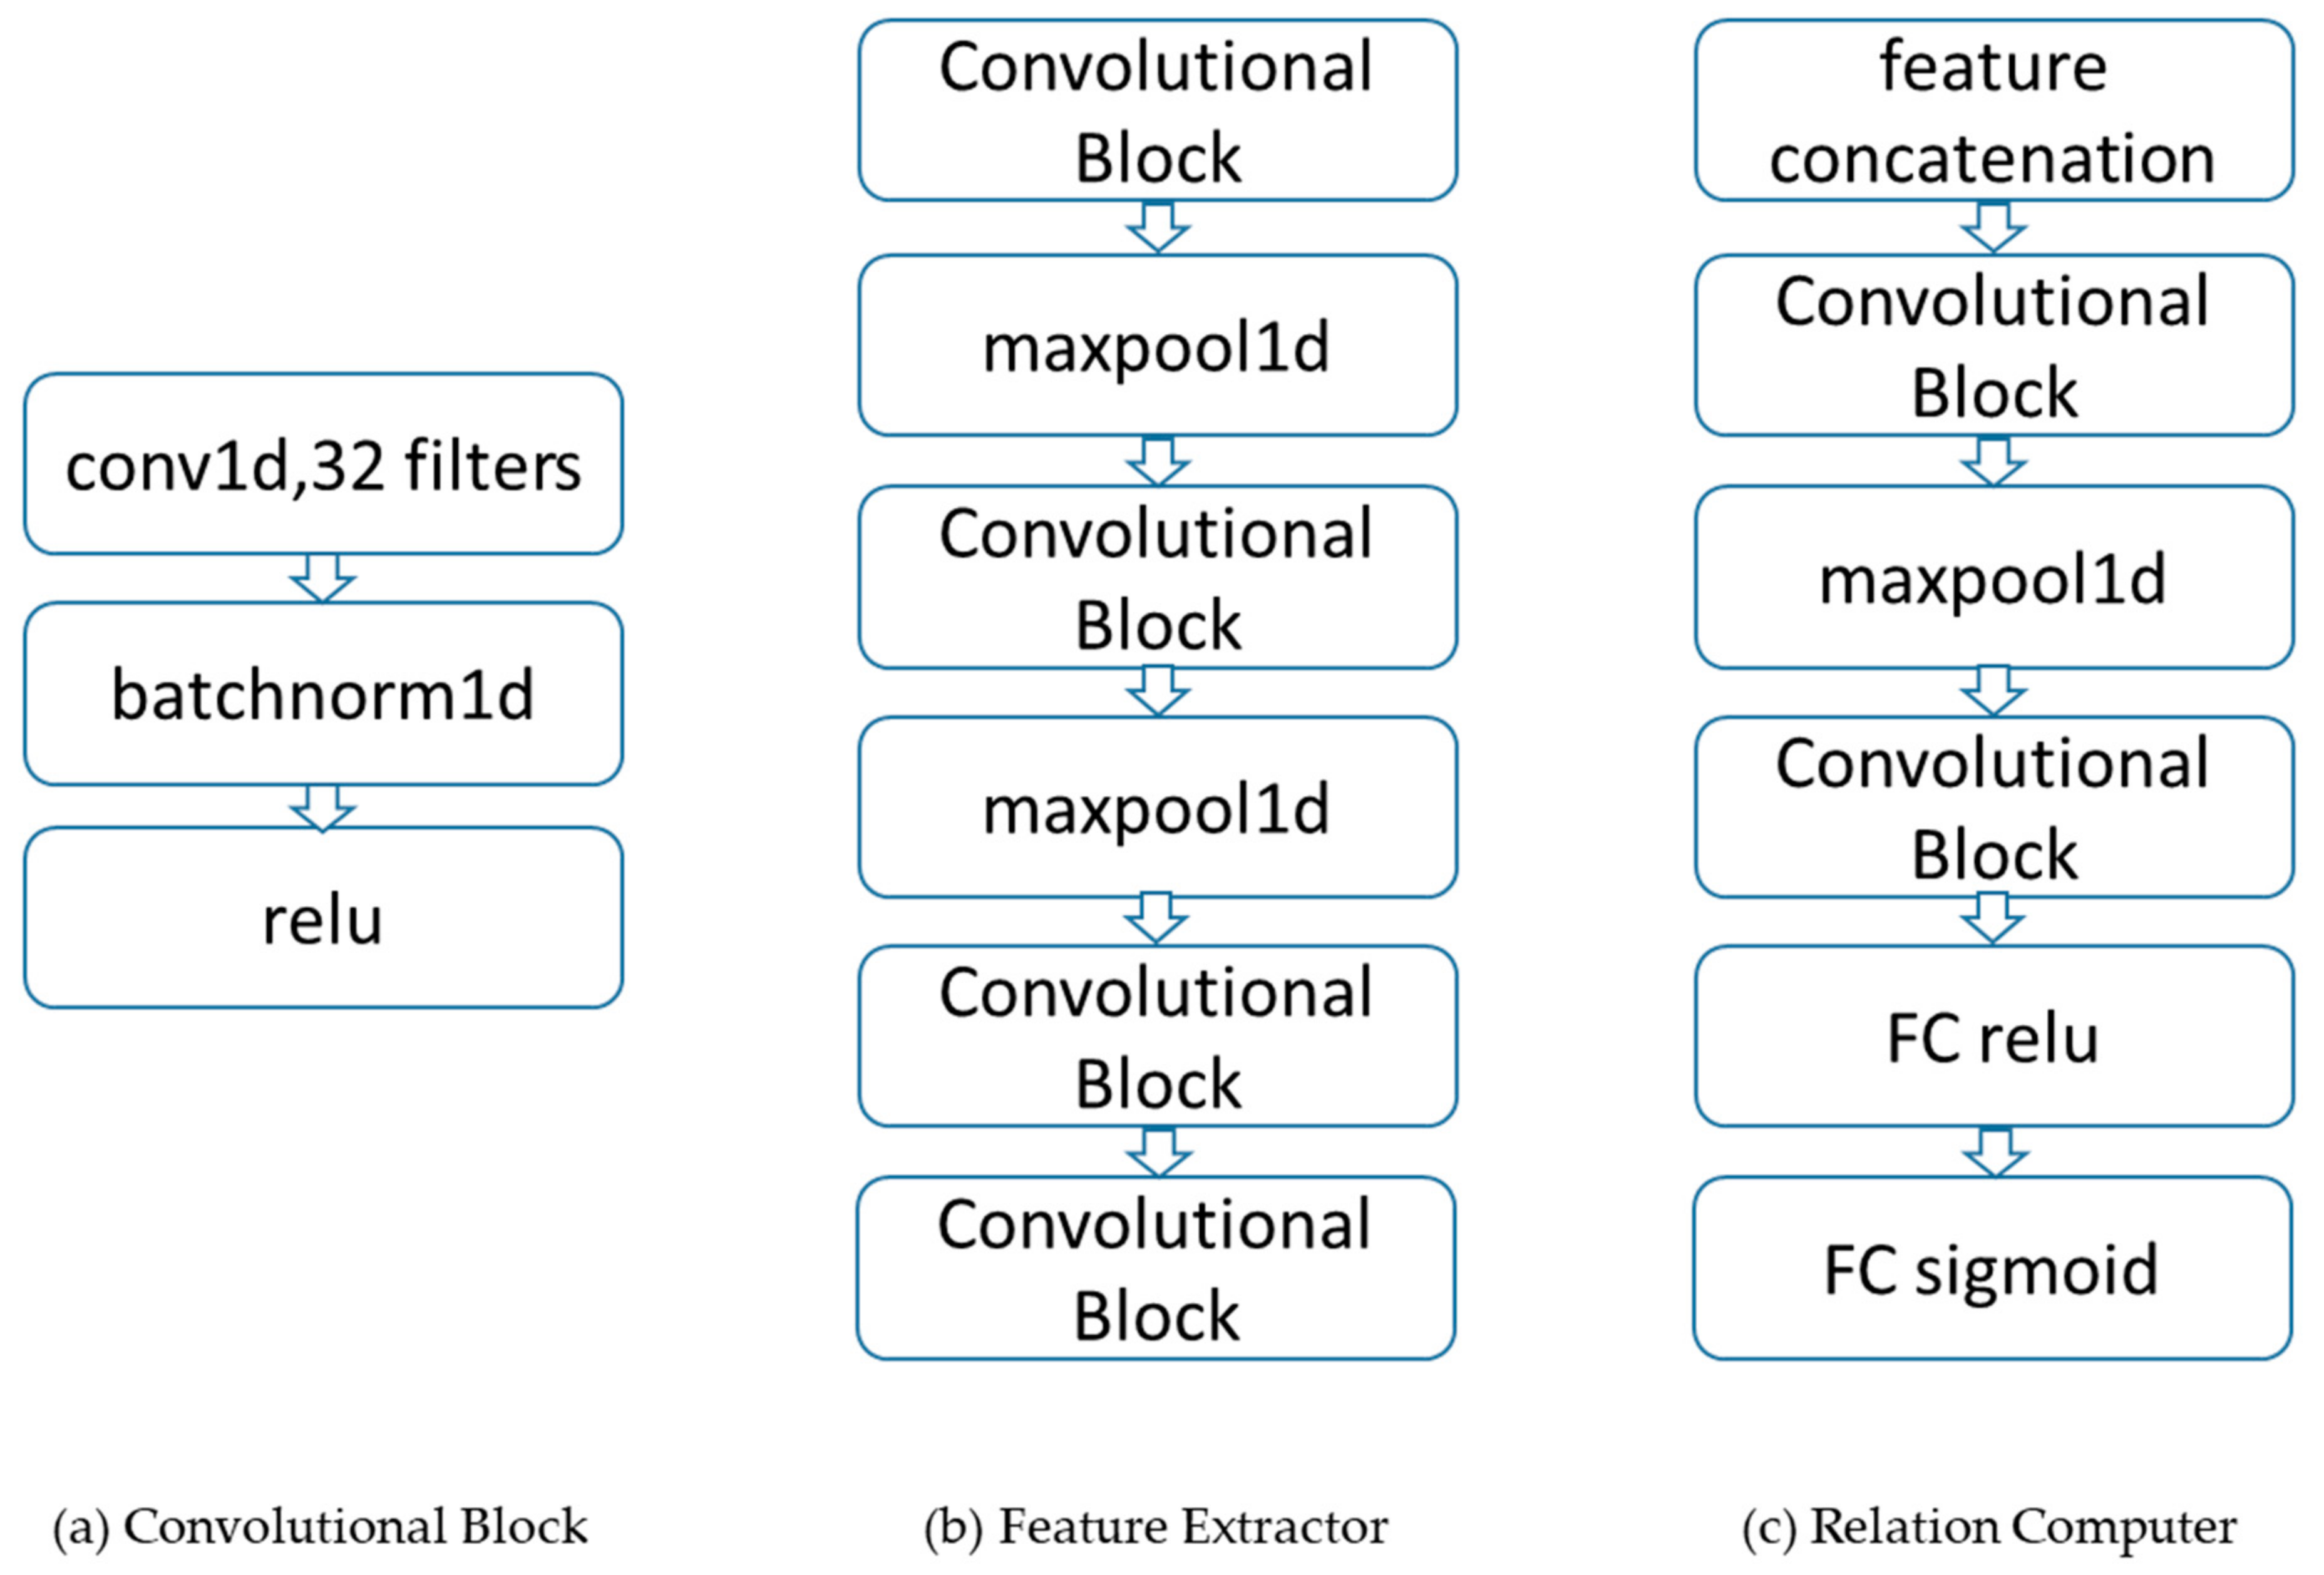
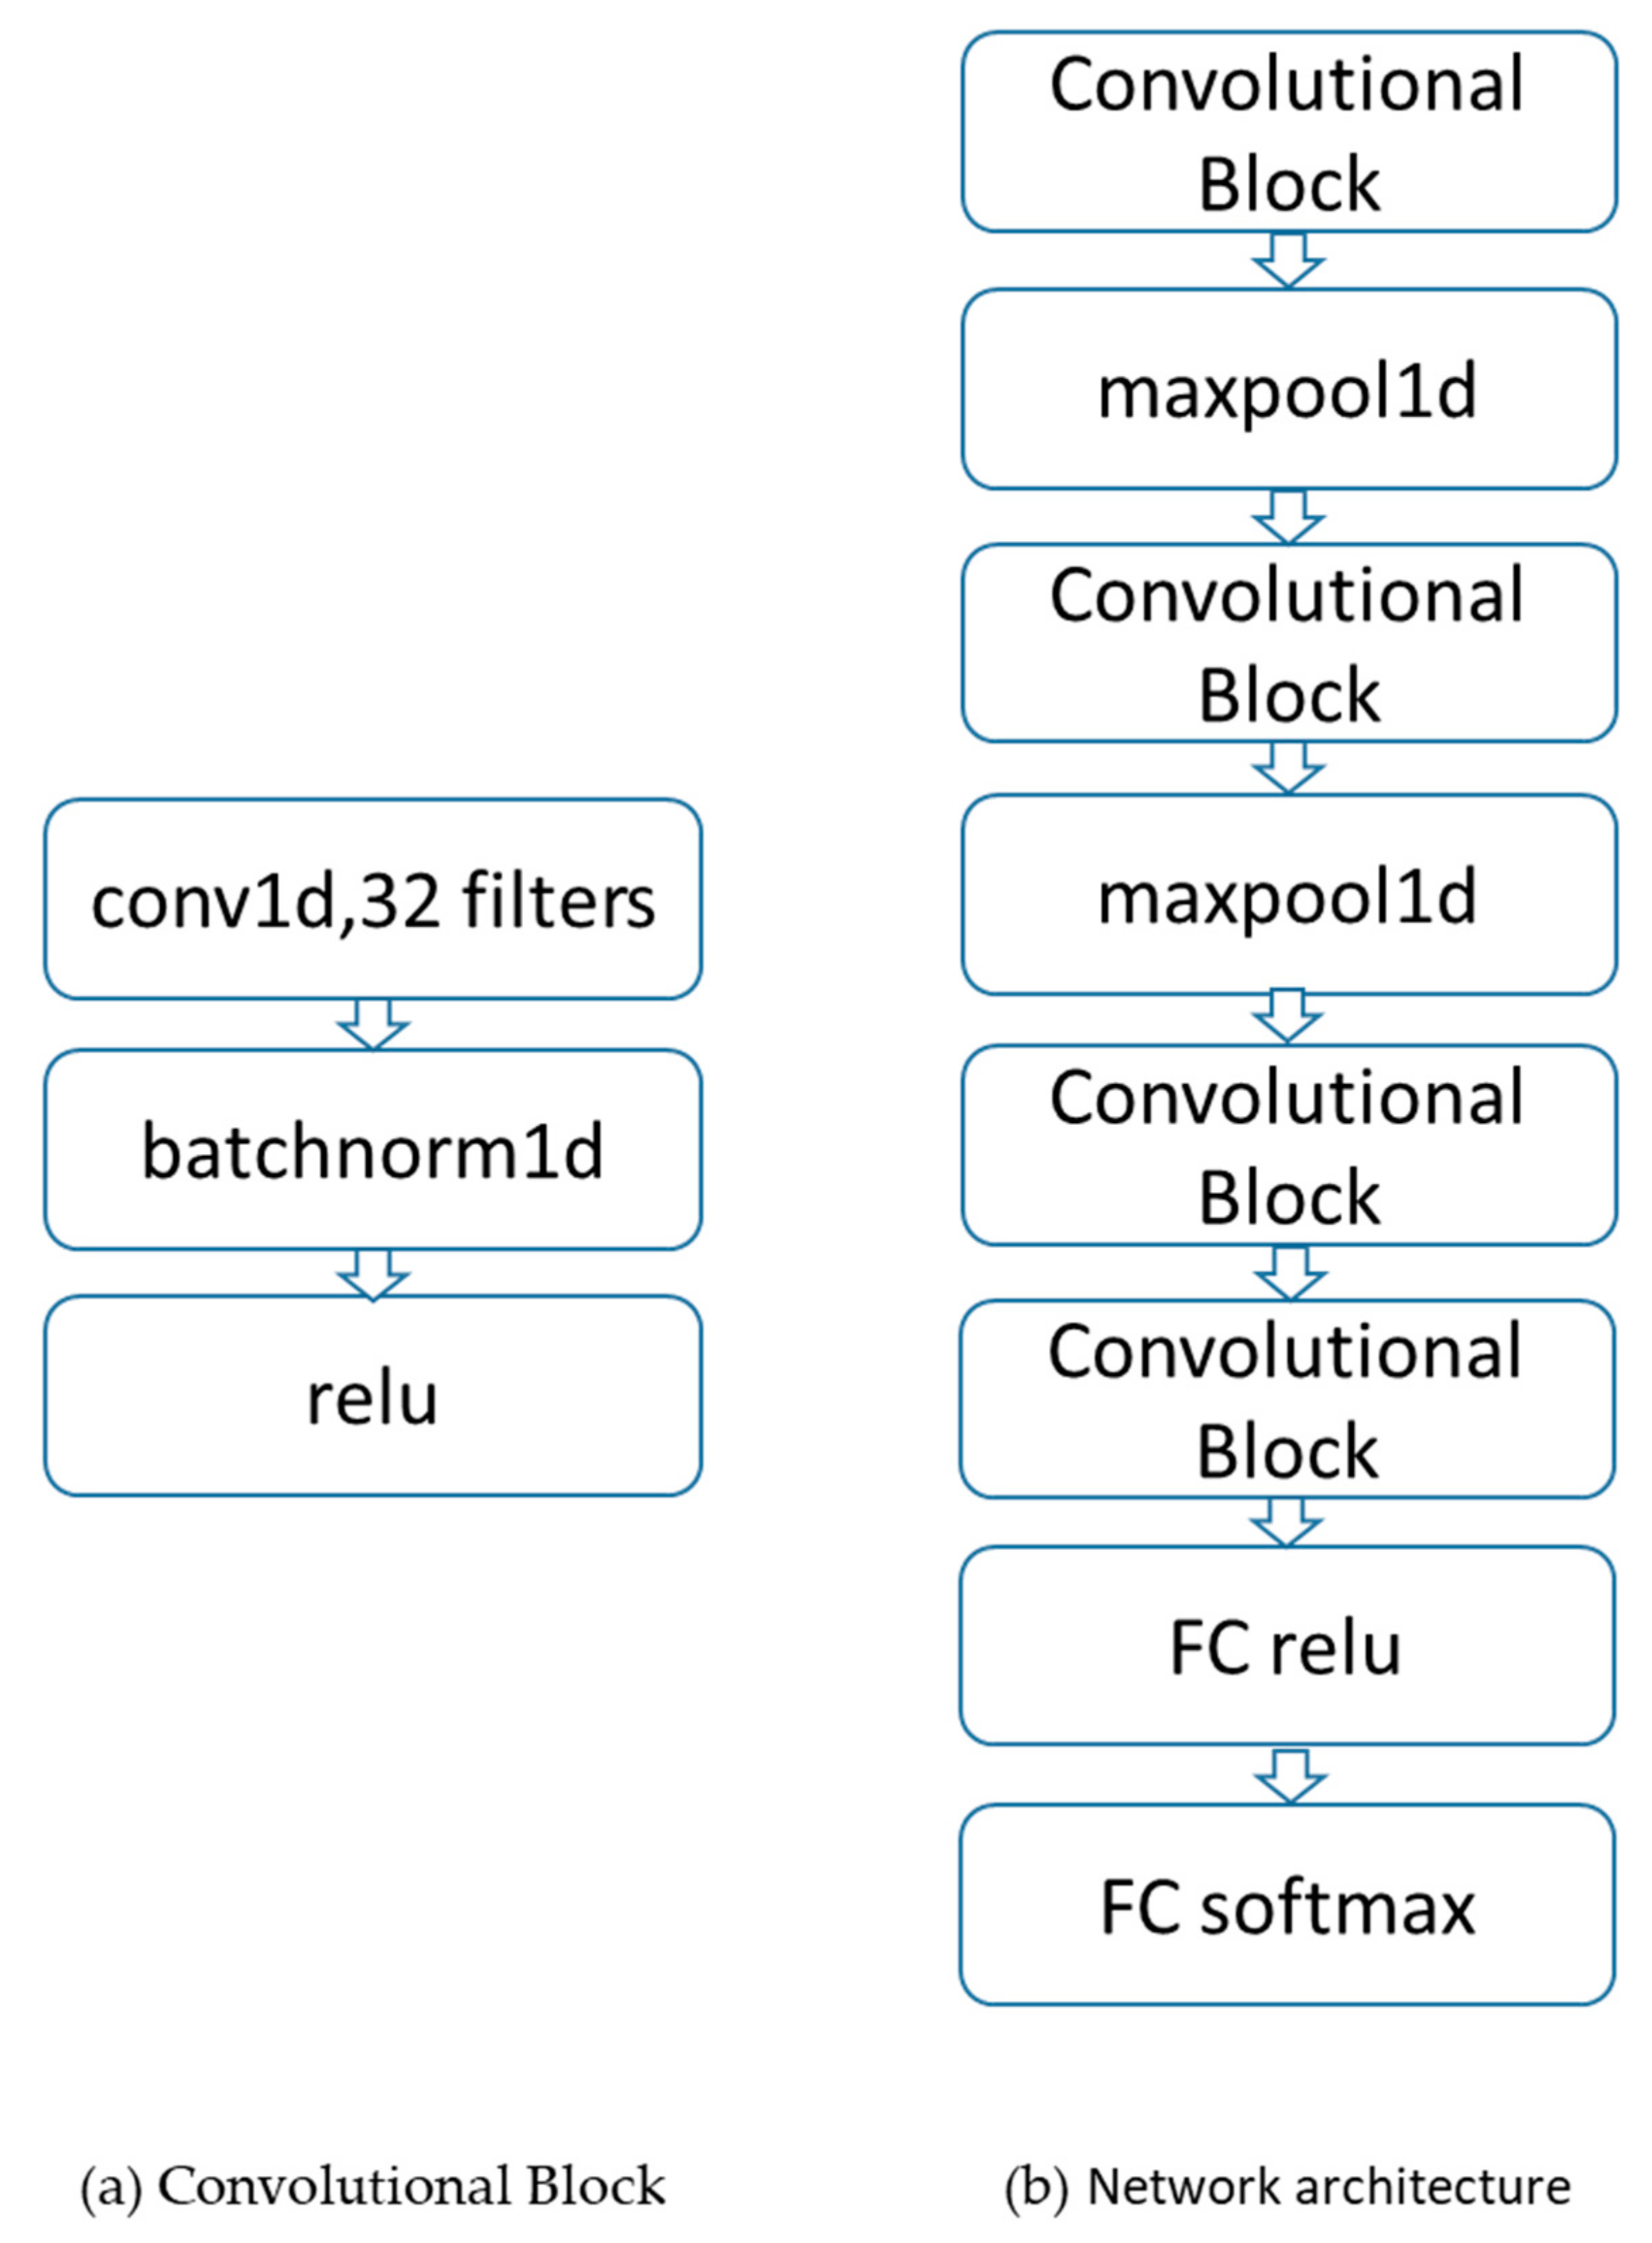
The network architecture details of Feature Extractor and Relation Computer are shown in Figure 9; more concretely, each convolutional block contains a 32-filter one-dimensional convolution whose size is 3, a batch normalization, and a ReLU nonlinearity layer, respectively. The first two blocks in Feature Extractor also contain a max-pooling layer whose size is 2, while the latter two do not. We do so because we need the output feature maps for further convolutional layers in the Relation Computer. The Relation Computer consists of two convolutional blocks and two fully connected layers. Each of the convolutional blocks is a one-dimensional convolution whose size is 3 with 32 filters followed by batch normalization, ReLU nonlinearity, and max-pooling whose size is 2. The output size of last max pooling layer is H = 32 × 64 = 2048 . The two fully connected layers are eight- and one-dimensional layers, respectively. All fully connected layers are ReLU except the output layer, which is Sigmoid, in order to generate relation scores in a reasonable range of our network architecture.

3.3. Experiments

Our model in all experiments uses Adam [54] with the initial learning rate 10 2 , annealed by half for every 10,000 episodes. The model is end-to-end trained from scratch with no additional dataset. We compare against various typical traditional algorithms for specific emitter identification as baselines to evaluate the excellent performance of our algorithm, including pulse envelope front [55], bispectral diagonal slice [56], Zero-Slice feature of ambiguity function [57], and inter pulse information parameters [58]. The following is a brief introduction of these four recognition algorithms.
I. Recognition algorithm based on similarity of pulse envelope front.
The algorithm steps are as follows:
(a)
Extracting pulse envelope by Hilbert transform;
(b)
Moving average filtering for aliasing noise;
(c)
Normalization of pulse envelope;
(d)
Extracting “standard” envelope waveform by means of averaging;
(e)
Identification by the nearest neighbor classification method.
II. Recognition algorithm based on similarity of bispectral diagonal slice.
The algorithm steps are as follows:
(a)
Segment and de-average the received signal;
(b)
Solve the third-order cumulative function of each signal;
(c)
Calculate the mean of the third-order cumulants of all signals;
(d)
Fourier transform the results of the previous step to obtain the bispectral diagonal slice;
(e)
Identification by the nearest neighbor classification method.
III. Recognition algorithm based on similarity of Zero-Slice feature of ambiguity function.
The algorithm steps are as follows:
(a)
Segment and de-average the received signal;
(b)
Calculate the autocorrelation function of each signal;
(c)
Fourier transform the results of the previous step to obtain the ambiguity function;
(d)
Let the frequency offset be 0 to obtain the Zero-Slice feature of the ambiguity function;
(e)
Identification by the nearest neighbor classification method.
IV. Recognition algorithm based on similarity of inter pulse information parameters.
The following inter pulse information parameters are calculated and the nearest neighbor classification algorithm is used to identify the radar emitter individuals:
(a)
Rising time: the time of the pulse amplitude rising from 10% to 90%;
(b)
Falling time: the time of the pulse amplitude falling from 90% to 10%;
(c)
Pulse width: the time span between two nodes with a 50% pulse amplitude;
(d)
Rising angle: the angle between the time axis and the fitting line of the rising edge of the pulse;
(e)
Falling angle: the angle between the time axis and the fitting line of the falling edge of the pulse;
(f)
Frequency modulation angle: the angle between the regression line of the frequency waveform vector and the time axis.
First, under constant working parameter conditions, we tested the recognition performance of the above typical traditional fingerprint recognition algorithms. The experimental results are shown in Table 2.
It can be seen that the above traditional algorithms have good recognition accuracy under constant working parameter conditions, especially under high signal-to-noise ratio conditions (20 dB and above). Next, the recognition accuracy of traditional algorithms was tested under seven variable working parameter conditions as described in Section 3.1, and the experimental results are shown in Table 3, where the meaning of the symbol is the same as that in Figure 7. Comparing Table 2 and Table 3, it can be seen that several traditional algorithms mentioned above have good recognition performance under constant working parameter conditions; however, because the nonlinear characteristics of the radar emitter change under the condition of the variable working parameter, the collected fingerprint features cannot fully match the usual fingerprint features, and the recognition accuracy rate is greatly reduced or even impossible to recognize the original individual.
The above traditional algorithms are specific emitter identification algorithms based on machine learning. Here, we build a convolutional neural network without the Relation Computer module for performance comparison, which we call CNN-without-RC, and as our model utilizes four convolutional blocks for the Feature Extractor module, we followed the same architecture setting for fair comparison (see Figure 10). The four convolutional blocks are exactly the same as the model we proposed, and the output size of last convolutional block is H = 32 × 256 = 8192 . The two fully connected layers are 128- and 5-dimensional layers, respectively. All fully connected layers are ReLU, except the output layer, which is Softmax, in order to generate probability values belonging to each individual.
Firstly, we tested the recognition performance of this model under constant working parameters, and the recognition accuracy was 90.9%, 96.1%, and 98.2% at 10 dB, 20 dB, and 30 dB SNR, respectively, which proves the effectiveness of this model in identifying individual radar emitters under constant working parameters. Under the variable working parameters condition, it did not distinguish whether the input individual data is a variable working parameter signal. That is, the collected constant working parameter and variable working parameter signals were not distinguished, and they were uniformly marked as the signal of an individual to train this model. Then, we tested the accuracy of the model to classify the never seen variable working parameter signals. The results are shown in Table 4, where the meaning of the symbol is the same as that in Figure 7.
It can be seen from the above experimental results that, although the model based on the convolutional neural network has good recognition accuracy under the condition of constant working parameters, its recognition accuracy is greatly reduced under the condition of variable working parameters, mainly because the fingerprint features extracted by the model that can be used to identify different individuals change when the radar working parameters change, and the model has never seen such sample signals. Even in the case of a single change of center frequency, this model still cannot effectively identify variable working parameter individuals. The reason is that the features extracted by the model from known samples are not interpretable and have poor stability, while the features extracted by the algorithm based on machine learning are interpretable. Therefore, it still has the ability to effectively identify variable working parameter individuals when there is a single change of the center frequency. The four traditional recognition algorithms based on machine learning and the recognition algorithm based on convolutional neural network proved that it is very difficult to recognize individual signals when the radar working parameters change, and there are no such signal samples in the radar database.
Next, let us talk about how our model (we call it CNN-with-RC) deals with the zero sample problem. As described in Section 3.1, each individual dataset is subdivided into a constant working parameter case and seven various working parameter cases: center frequency change, signal bandwidth change, pulse width change, and their combinations.
Here, let us take the dataset with bandwidth change as an example; the dataset distribution architecture is shown in Figure 11, where B 1 to B V represent V subset signals that have been received in the radar database, and B V+1 to B V+U represent U subset signals that have never been received and need to be identified.
In each training iteration, an episode is formed by randomly selecting K1-labeled samples from each of C classes of constant working parameter datasets in the training set as the sample set S = x i , y i i = 1 m m = K 1 × C , and randomly selecting K2 samples from each of the V1 subsets of the C classes of variable working parameter datasets in the training set as the query set Q = x j , y j j = 1 n n = K 2 × V 1 × C , where K 1 = K 2 × V 1 , in order to establish the learnable nonlinear distance metric between the constant working parameters and variable working parameters of the same individual from one-to-one training. This means, for example, that there are K 1 × C + K 2 × V 1 × C images in one training episode/mini-batch for the experiments. Our model is end-to-end trained from scratch, with random initialization and no additional training set.
Since we are dealing with the zero sample problem, that is, although the sample signals to be identified still belongs to a specific individual, its fingerprint characteristics change due to changes in its working parameters, and such sample signals have never been collected in the radar database, thus relying only on supervised learning can easily lead to the overfitting of established metrics in the training mode. Therefore, it is necessary to make the established metrics more transferable in verification mode. In each verifying iteration, an episode is also formed by randomly selecting K 1 -labeled samples from each of the C classes of constant working parameter datasets in the verification set as the sample set S = x i , y i i = 1 m m = K 1 × C , and randomly selecting K 2 samples from each of the V2 subsets of the C classes of variable working parameter datasets in the verification set as the query set Q = x j , y j j = 1 n n = K 2 × V 2 × C , where K 1 = K 2 × V 2 . The same as training mode, there are K 1 × C + K 2 × V 2 × C images in one verifying episode/mini-batch for the experiments. The verification set is used for monitoring generalization performance only.
We computed classification accuracies on the above datasets by averaging over 1000 randomly generated episodes from the testing set. The results are shown in Table 5, where the meaning of the symbol is the same as that in Figure 7. We achieved state-of-the-art performance under all experimental settings with higher averaged accuracies.

4. Discussion

Why can the proposed model solve the zero sample problem well? Although the nonlinear characteristics of the emitter change when the radar working parameters change, the emitter system containing these nonlinear characteristics does not change, so the change rule of these nonlinear characteristics is still traceable. On the one hand, the recognition accuracy of the classification algorithm lies in the separability of the proposed features, and on the other hand, it lies in the measurement method used to evaluate the differences between samples. Traditional specific emitter identification algorithms use fixed pre-specified distance metrics, such as Euclidean or Cosine distance metrics, to perform classification, because the fingerprint features that can be used for identification change with the change of working parameters, but the metric used for measurement and evaluation does not change, and the recognition accuracy is greatly reduced. The proposed model takes metric learning as the point of penetration and establishes a deep nonlinear distance metric between different working parameter sample signals of the same individual, so that even for the sample signals with unknown working parameters, it can still be better associated with the original individual than the traditional algorithm. In contrast to traditional algorithms’ fixed metric, our model can be seen as both learning deep fingerprint features and learning a deep nonlinear metric. These are mutually tuned end-to-end to support each other in this study. After all, this study deals with the problem of zero samples, relying only on supervised learning can easily lead to the overfitting of established metrics in the training mode. Therefore, on the one hand, it is necessary to verify whether the model is overfitted under the verification model, and on the other hand, it is necessary to avoid the excessive complexity of the network and prevent the model from overfitting in the training mode, resulting in the inability to learn a universal metric to identify new variable working parameter samples. Therefore, our model is completely composed of simple and fast feed forward CNNs.

5. Conclusions

It is proposed for the first time that when the radar working parameters change, the features extracted by the traditional specific emitter identification algorithm do not have robustness, resulting in a great reduction in the recognition accuracy. We propose a model to solve this zero sample problem in the variable working parameter scene of specific emitter identification. In contrast to traditional algorithms’ fixed metric, our model can better identify matching/mismatching pairs by deep learning a nonlinear similarity metric jointly with the deep fingerprint features. This approach is very simple and produces state-of-the-art results.

Author Contributions

Conceptualization, P.M., C.D., and W.R.; Methodology, P.M. and C.D.; Software, P.M.; Validation, P.M.; Formal analysis, P.M.; Investigation, P.M.; Resources, G.X.; Data curation, P.M.; Writing—original draft preparation, P.M.; Writing—review and editing, C.D. and W.R.; Visualization, P.M.; Supervision, C.D.; Project administration, G.X.;. All authors have read and agreed to the published version of the manuscript.

Funding

This research received no external funding.

Institutional Review Board Statement

Not applicable.

Informed Consent Statement

Not applicable.

Data Availability Statement

The data presented in this study are all simulated by the model we proposed.

Acknowledgments

We express our thanks to the editors and anonymous reviewers for their valuable comments.

Conflicts of Interest

The authors declare no conflict of interest.

References

  1. Talbot, K.I.; Duley, P.R.; Hyatt, M.H. Specific Emitter Identification and Verification. Technol. Rev. J. Spring/Summer. 2003, pp. 113–133. Available online: http://jmfriedt.org/phase_digital/03SS_KTalbot.pdf (accessed on 12 June 2021).
  2. Xu, D. Research on Mechanism and Methodology of Specific Emitter Identification. Ph.D. Thesis, National University of Defense Technology, Changsha, China, 2008. [Google Scholar]
  3. He, M. Radar Countermeasure Information Processing, 1st ed.; Tsinghua University Press: Beijing, China, 2010. [Google Scholar]
  4. Langley, L.E. Specific emitter identification (SEI) and classical parameter fusion technology. In Proceedings of the WESCON’93, San Francisco, CA, USA, 28–30 September 1993; pp. 377–381. [Google Scholar]
  5. Wang, H.; Zhao, G.; Wang, Y. A specific emitter identification method based on front edge waveform of radar signal envelop. Aerosp. Electron. Warf. 2009, 25, 35–38. [Google Scholar]
  6. Liu, X.; Luo, P.; Li, G. Radar emitter individual identification based on fitting angle features and SVM. Comput. Eng. Appl. 2011, 47, 281–284. [Google Scholar]
  7. Xu, S.; Xu, L.; Xu, Z.; Huang, B. Individual radio transmitter identification based on spurious modulation characteristics of signal envelop. In Proceedings of the 2008 IEEE Military Communications Conference, San Diego, CA, USA, 16–19 November 2008; pp. 1–5. [Google Scholar]
  8. Zhang, G.; Huang, K.; Jiang, W.; Zhou, Y. Emitter feature extract method based on signal envelope. Syst. Eng. Electron. 2006, 28, 795–798. [Google Scholar]
  9. Rehman, S.U.; Sowerby, K.; Coghill, C. RF fingerprint extraction from the energy envelope of an instantaneous transient signal. In Proceedings of the 2012 Australian Communications Theory Workshop (AusCTW), Wellington, New Zealand, 30 January–2 February 2012; pp. 90–95. [Google Scholar]
  10. Wu, L.; Zhao, Y.; Feng, M.; Abdalla, F.Y.; Ullah, H. Specific emitter identification using IMF-DNA with a joint feature selection algorithm. Electronics 2019, 8, 934. [Google Scholar] [CrossRef] [Green Version]
  11. Feng, Z.; Zhang, D.; Zuo, M.J. Adaptive mode decomposition methods and their applications in signal analysis for machinery fault diagnosis: A review with examples. IEEE Access 2017, 5, 24301–24331. [Google Scholar] [CrossRef]
  12. Hall, J.; Barbeau, M.; Kranakis, E. Enhancing intrusion detection in wireless networks using radio frequency fingerprinting. In Proceedings of the IASTED International Conference on Communications, Internet, and Information Technology, St. Thomas, US Virgin Islands, USA, 22–24 November 2004; pp. 201–206. [Google Scholar]
  13. Hall, J.; Barbeau, M.; Kranakis, E. Detecting rogue devices in Bluetooth networks using radio frequency fingerprinting. In Proceedings of the 3rd IASTED International Conference on Communications and Computer Networks, Lima, Peru, 4–6 October 2006; pp. 108–113. [Google Scholar]
  14. Huang, Y.; Zheng, H. FSK radio fingerprints extraction based on distortions of instantaneous frequency. Telecommun. Eng. 2013, 53, 868–872. [Google Scholar]
  15. Padilla, P.; Padilla, J.L.; Valenzuela-Valdés, J.F. Radiofrequency identification of wireless devices based on RF fingerprinting. Electron. Lett. 2013, 49, 1409–1410. [Google Scholar] [CrossRef]
  16. Ye, W.; Yu, Z. Signal recognition method based on joint time-frequency radiant source. Electron. Inf. Warf. Technology 2018, 33, 16–19. [Google Scholar]
  17. Flamant, J.; Le Bihan, N.; Chainais, P. Time-frequency analysis of bivariate signals. Appl. Comput. Harmon. Anal. 2019, 46, 351–383. [Google Scholar] [CrossRef] [Green Version]
  18. Bertoncini, C.; Rudd, K.; Nousain, B.; Hinders, M. Wavelet fingerprinting of Radio-Frequency IDentification (RFID) tags. IEEE Trans. Ind. Electron. 2012, 59, 4843–4850. [Google Scholar] [CrossRef]
  19. Hippenstiel, R.D. Wavelet Based Approach to Transmitter Identification; NPS-EC-95-014; 1995. Available online: https://apps.dtic.mil/sti/citations/ADA304459 (accessed on 3 May 2021).
  20. Gao, J.; Kong, W.; Liu, J. Research on emitter modulation recognition of the adaptive PCA based on time-frequency analysis. Appl. Sci. Technol. 2018, 45, 33–37. [Google Scholar]
  21. Xie, Z.; Xu, L.; Ni, G.; Wang, Y. A new feature vector using selected line spectra for pulsar signal bispectrum characteristic analysis and recognition. Chin. J. Astron. Astrophys. 2007, 7, 565–571. [Google Scholar] [CrossRef]
  22. Cai, Z.; Li, J. Study of transmitter individual identification based on bispectra. J. Commun. 2007, 28, 75–79. [Google Scholar]
  23. Wang, H.; Zhang, T. Extraction algorithm of communication signal characteristics based on improved bispectra and time-domain Analysis. J. Signal Process. 2017, 33, 864–871. [Google Scholar]
  24. Yang, J.; Lu, X.; Zhou, Y. Transmitter individual identification based on polyspectra and support Vector Machine. Comput. Simul. 2010, 27, 349–353. [Google Scholar]
  25. Gong, Y.; Hu, G.; Pan, Z. Radio transmitter identification based on bispectra with tensor representation. In Proceedings of the 2010 2nd International Conference on Computer Engineering and Technology, Chengdu, China, 16–18 April 2010; Volume 3, pp. 294–298. [Google Scholar]
  26. Wang, H.; Zhang, T.; Meng, F. Specific emitter identification based on time-frequency domain characteristic. J. Inf. Eng. Univ. 2018, 19, 23–29. [Google Scholar]
  27. Wang, L. Analysis of subtle characteristics of low-frequency radiation. Master Thesis, Nanjing University of Aeronautics and Astronautics, Nanjing, China, 2014. [Google Scholar]
  28. Gui, Y.; Yang, J.; Lv, J. A fractal feature extraction algorithm based on empirical mode decomposition. J. Detect. Control. 2016, 38, 104–108. [Google Scholar]
  29. Zhang, J.; Wang, F.; Dobre, O.A.; Zhong, Z. Specific emitter identification via Hilbert-Huang transform in single-hop and relaying scenarios. IEEE Trans. Inf. Forensics Secur. 2016, 11, 1192–1205. [Google Scholar] [CrossRef]
  30. Huang, N.E.; Shen, Z.; Long, S.R.; Wu, M.C.; Shih, H.H.; Zheng, Q.; Yen, N.; Tung, C.C.; Liu, H.H. The empirical mode decomposition and the Hilbert spectrum for nonlinear and non-stationary time series analysis. Proc. R. Soc. A: Math. Phys. Eng. Sci. 1998, 454, 903–995. [Google Scholar] [CrossRef]
  31. Song, C.; Xu, J.; Zhan, Y. A method for specific emitter identification based on empirical mode decomposition. In Proceedings of the 2010 IEEE International Conference on Wireless Communications, Networking and Information Security, Beijing, China, 25–27 June 2010; pp. 54–57. [Google Scholar]
  32. Ha, Z.; Liu, X.; Cai, Q.; Wang, L. Study of specific emitter identification for ATC transponder. Electron. Inf. Warf. Technol. 2012, 27, 1–5. [Google Scholar]
  33. Liang, J.; Huang, Z.; Yuan, Y.; Huang, G.Q. A method based on empirical mode decomposition for identifying transmitter individuals. J. CAEIT 2013, 8, 393–397. [Google Scholar]
  34. Frei, M.G.; Osorio, I. Intrinsic time-scale decomposition: Time-frequency-energy analysis and real-time filtering of non-stationary signals. Proc. R. Soc. A: Math. Phys. Eng. Sci. 2007, 463, 321–342. [Google Scholar] [CrossRef]
  35. Li, X.; Duan, T.; Xu, W. ITD-based identification of signal fine features. J. Inf. Eng. Univ. 2014, 15, 570–575. [Google Scholar]
  36. Gui, Y.; Yang, J.; Lyu, J. Feature extraction algorithm based on intrinsic time-scale decomposition model for communication transmitter. Appl. Res. Comput. 2017, 34, 1172–1175. [Google Scholar]
  37. Ren, D.; Zhang, T.; Han, J. Approach of specific communication emitter identification combining ITD and nonlinear analysis. J. Signal Process. 2018, 34, 331–339. [Google Scholar]
  38. Ren, D.; Zhang, T.; Han, J.; Wang, H.H. Specific emitter identification based on ITD and texture analysis. J. Commun. 2017, 38, 160–168. [Google Scholar]
  39. Martis, R.J.; Acharya, U.R.; Tan, J.H.; Petznick, A.; Tong, L.; Chua, C.K.; Ng, E.Y.K. Application of Intrinsic Time-scale Decomposition (ITD) to EEG signals for automated seizure prediction. Int. J. Neural Syst. 2013, 23, 1350023. [Google Scholar] [CrossRef]
  40. An, X.; Jiang, D.; Chen, J.; Liu, C. Application of the intrinsic time-scale decomposition method to fault diagnosis of wind turbine bearing. J. Vib. Control. 2012, 18, 240–245. [Google Scholar] [CrossRef]
  41. Xu, Y.; Xie, Z.; Cui, L.; Wang, J. The feature extraction method of gear magnetic memory signal. Adv. Mater. Res. 2013, 819, 206–211. [Google Scholar] [CrossRef]
  42. Dragomiretskiy, K.; Zosso, D. Variational mode decomposition. IEEE Trans. Signal Process. 2014, 62, 531–544. [Google Scholar] [CrossRef]
  43. Chen, S.; Zheng, X. Research on mechanical fault diagnosis method of circuit breaker based on VMD energy entropy and support vector machine. Heilongjiang Electr. Power 2019, 41, 60–63. [Google Scholar]
  44. Meng, Q. Nonlinear Dynamical Time Series Analysis Methods and Its Application. Ph.D. Thesis, Shandong University, Shandong, China, 2008. [Google Scholar]
  45. Carroll, T.L. A nonlinear dynamics method for signal identification. Chaos: Interdiscip. J. Nonlinear Sci. 2007, 17, 023109. [Google Scholar] [CrossRef]
  46. Yuan, Y. Research on Key Technology of Communication Specific Emitter Identification. Ph.D. Thesis, National University of Defense Technology, Changsha, China, 2014. [Google Scholar]
  47. Zhu, S. Research on Applications of Chaotic Signal Processing in Specific Emitter Identification. Ph.D. Thesis, School of Information and Communication, Chengdu, China, 2018. [Google Scholar]
  48. Bihl, T.J.; Bauer, K.W.; Temple, M.A. Feature selection for RF fingerprinting with multiple discriminant analysis and using ZigBee device emissions. IEEE Trans. Inf. Forensics Secur. 2016, 11, 1862–1874. [Google Scholar] [CrossRef]
  49. Zhu, S.; Gan, L. Specific emitter identification based on visibility graph entropy. Chin. Phys. Lett. 2018, 35, 030501. [Google Scholar] [CrossRef]
  50. Xu, D.; Xu, H.; Lu, Q. A specific emitter identification method based on self-excitation oscillator model. Signal Process. 2008, 24, 122–126. [Google Scholar]
  51. Xu, Z.; Chen, Z.; Wang, J.; Xu, Y.L.; Kong, L. An improved method for emitter identification based on character of power amplifier. J. Nanjing Univ. Posts Telecommun. Nat. Sci. 2013, 33, 54–58. [Google Scholar]
  52. Huang, Y.; Zheng, H. Emitter fingerprint feature extraction method based on characteristics of phase noise. Comput. Simul. 2013, 30, 182–185. [Google Scholar]
  53. Man, P.; Ding, C.; Ren, W.; Xu, G. A Nonlinear Fingerprint-Level Radar Simulation Modeling Method for Specific Emitter Identification. Electronics 2021, 10, 1030. [Google Scholar] [CrossRef]
  54. Kingma, D.; Ba, J. Adam: A Method for Stochastic Optimization. Computer Science. 2014. Available online: https://arxiv.org/abs/1412.6980 (accessed on 12 January 2021).
  55. Fan, Y. The Feature Extraction of Radar Source and Radar Individual Identification. Master Thesis, Xidian University, Xi’an, China, 2017. [Google Scholar]
  56. Ren, L. Research on Emitter Fingerprint Identification and Fine Feature Extraction. Master Thesis, Harbin Engineering University, Harbin, China, 2012. [Google Scholar]
  57. Wang, L. On Methods for Specific Radar Emitter Identification. Ph.D. Thesis, Xidian University, Xi’an, China, 2011. [Google Scholar]
  58. Chen, J. Features Selection and Specific Emitter Identification of Radar. Master Thesis, Xidian University, Xi’an, China, 2013. [Google Scholar]
Figure 1. Structural diagram of typical system for specific emitter identification.
Remotesensing 13 04919 g001
Figure 2. Fingerprint-level radar system modeling.
Remotesensing 13 04919 g002
Figure 3. Spurious phase truncation error in the signal source.
Remotesensing 13 04919 g003
Figure 4. Spurious amplitude quantization error without phase truncation in the signal source.
Remotesensing 13 04919 g004
Figure 5. LFM signal spectrum considering both the phase truncation error and amplitude quantization error in the signal source.
Remotesensing 13 04919 g005
Figure 6. Non-ideal characteristic model of the mixer and amplifier.
Remotesensing 13 04919 g006
Figure 7. The distribution architecture of the datasets.
Remotesensing 13 04919 g007
Figure 8. Network architecture for a zero sample problem with one query example.
Remotesensing 13 04919 g008
Figure 9. Network architecture details of Feature Extractor (b) and Relation Computer (c), which are composed of elements including convolutional blocks (a).
Remotesensing 13 04919 g009
Figure 10. Network architecture details of the CNN-without-RC model.
Remotesensing 13 04919 g010
Figure 11. The distribution architecture of training set, verification set, and testing set.
Remotesensing 13 04919 g011
Table 1. A set of typical values of the main design parameters of the main components of a radar emitter.
ComponentsMain Design ParametersTypical Values
Signal SourcePhase truncation bits12
Amplitude quantization bits10
Integral nonlinearity3 LSB
Differential nonlinearity0.5 LSB
MixerSuppression of the alternate output sideband−200 dB
RF to output rejection−200 dB
LO to output rejection−200 dB
LO to RF isolation−200 dB
RF to LO isolation−200 dB
Second-order truncation points40 dBm
Third-order truncation points25 dBm
Amplifier1 dB compression points17 dBm
Second-order truncation points20 dBm
Third-order truncation points35 dBm
Local OscillatorPhase noise[−85, −105, −110, −115, −135]
Table 2. Accuracy of traditional algorithms under constant working parameter conditions.
Changes in Working ParametersSignal-to-Noise RatioAlgorithm [55]Algorithm [56]Algorithm [57]Algorithm [58]
constant30 dB92.2%89.9%99.8%100.0%
20 dB67.8%67.4%87.8%90.1%
10 dB37.2%37.0%56.0%35.0%
Table 3. Accuracy of traditional algorithms under various working parameter conditions.
Changes in Working ParametersSignal-to-Noise RatioAlgorithm [55]Algorithm [56]Algorithm [57]Algorithm [58]
f 30 dB88.2%88.4%100%99.8%
20 dB61.0%57.8%91.2%87.54%
10 dB37.8%30.4%57.6%36.6%
τ 30 dB46.2%UnrecognizedUnrecognizedUnrecognized
20 dB32.2%
10 dB23.8%
B 30 dBUnrecognizedUnrecognizedUnrecognized28.1%
20 dB26.0%
10 dB24.5%
f + τ 30 dBUnrecognized21.2%UnrecognizedUnrecognized
20 dB27.6%
10 dB31.2%
f + B 30 dBUnrecognizedUnrecognizedUnrecognized20.1%
20 dB23.2%
10 dB24.6%
τ + B 30 dB22.3%UnrecognizedUnrecognized20.4%
20 dB25.5%23.2%
10 dB30.0%26.9%
f + τ + B 30 dB21.2% UnrecognizedUnrecognizedUnrecognized
20 dB25.4%
10 dB29.8%
Table 4. Accuracy of the CNN-without-RC model under various working parameter conditions.
Signal-to-Noise Ratio f τ B f   +   τ f   +   B τ   +   B f   +   τ   +   B
10 dB 39.2%33.5%26.8%36.2%35.1%31.3%29.1%
20 dB 49.6%41.2%30.0%45.1%45.9%40.0%28.4%
30 dB 51.2%43.3%40.9%48.4%48.6%43.5%30.3%
Table 5. Accuracy of the CNN-with-RC model under various working parameter conditions.
Signal-to-Noise Ratio f τ B f   +   τ f   +   B τ   +   B f   +   τ   +   B
10 dB 100.0%77.6%78.4%72.8%71.4%92.2%70.2%
20 dB 100.0%82.4%92.4%78.0%80.5%96.6%73.6%
30 dB 100.0%96.2%99.2%83.4%84.5%99.8%81.3%
Publisher’s Note: MDPI stays neutral with regard to jurisdictional claims in published maps and institutional affiliations.