1. Introduction
The importance of digital models of building environments has been steadily increasing in recent years [
1,
2]. Currently, many building projects are planned digitally in 3D using Building Information Modeling (BIM) techniques [
3]. Thus, a valid digital three-dimensional model arises along with the construction of the respective building, which can be profitably used during all the stages of its life cycle, i.e., usage and maintenance, e.g., in the context of facility management, changes and modifications of the building, and eventually, dismantling [
4,
5,
6,
7]. However, in the case of older, already existing buildings, three-dimensional digital models often do not exist and two-dimensional plans are often faulty or outdated. Manually reconstructing digital models (as-is BIM models) for such buildings is a tedious and time-consuming process [
8,
9].
However, there currently exists a broad range of sensor systems that can be deployed in the task of accurately mapping indoor environments [
10,
11,
12,
13]. Terrestrial Laser Scanners (TLSs), for instance, can provide a high geometric accuracy of acquisition depending on the respective conditions, e.g., in terms of surface characteristics and scanning geometry [
14,
15]. In order to achieve a complete capture of an environment, however, multiple scans have to be conducted from different positions. Especially in the case of mapping the interior of building structures, this can be quite cumbersome as the device needs to be set up at numerous positions, while the resulting scans subsequently need to be aligned in a common coordinate system.
Mobile mapping systems, however, alleviate these restrictions by continuously tracking their own position and orientation with respect to an initial pose. Indoor mapping geometries acquired over time can thus be projected successively into a common coordinate system while the operator can achieve a complete scene capture by walking through the scene. Mobile mapping systems encompass, e.g., trolley-based (such as NavVis (
https://www.navvis.com/m6, accessed on 22 November 2021)) or backpack-mounted sensors [
16,
17,
18,
19], or even UAV-based systems [
20], as well as hand-carried (e.g., Leica BLK2GO (
https://blk2go.com, accessed on 22 November 2021)) or head-worn devices (e.g., Microsoft HoloLens (
https://www.microsoft.com/de-de/hololens, accessed on 22 November 2021)). In particular, the Microsoft HoloLens designed as an Augmented Reality (AR) system offers the additional advantage of directly visualizing the already captured geometries within the view of the operator, facilitating the complete coverage of an indoor environment.
While conventional TLS or mobile laser scanning systems provide indoor mapping data in the form of point clouds, some consumer-grade systems such as, e.g., the mentioned Microsoft HoloLens or the Matterport system (
https://matterport.com/, accessed on 22 November 2021), sometimes provide indoor mapping data in the form of preprocessed, condensed triangle meshes. Such triangle meshes being a derived product from the primary point-based measurements were found to still provide sufficient accuracy for a wide range of applications [
21,
22], while being significantly more compact in terms of data size and, thus, more efficient in terms of the required processing time.
This broad range of available indoor mapping systems can provide an ample database for the digital, three-dimensional reconstruction of built indoor environments. Instead of having to take individual distance measurements in the respective building or having to bridge the mental gap between conventional, two-dimensional floor plans and the three-dimensional modeling environment, indoor mapping data representing existent buildings can be loaded directly into the modeling environment. However, the manual digital reconstruction on the basis of indoor mapping data can still be a time-consuming endeavor. Hence, automating this process has become the focus of a currently quite active field of research [
23,
24,
25].
While recent approaches in the field of automated indoor reconstruction are becoming more flexible regarding the building structure represented by the indoor mapping data [
26,
27,
28,
29,
30,
31], restricting assumptions about the building structure are still oftentimes applied. A frequently applied simplification in this context is the Manhattan World assumption, which was for instance relied on in the indoor reconstruction approaches presented in [
32,
33,
34,
35].
The Manhattan World assumption, as first proposed by Coughlan and Yuille [
36,
37], presupposes all surfaces to be perpendicular to one of the three coordinate axes. Applied to the context of building structures, this assumption thus prohibits curved room surfaces, as well as surfaces being oriented diagonally with respect to the main building structure, i.e., diagonal walls or slanted ceilings. The Manhattan World assumption was later extended to the Atlanta World assumption by Schindler and Dellaert [
38], which weakens the Manhattan World assumption by permitting vertical surfaces to have arbitrary angles around a common vertical coordinate axis, while horizontal surfaces are still expected to be perpendicular to the vertical axis. Thus, an Atlanta World structure can be regarded as a composition of multiple Manhattan World structures varying by a rotation around a common (vertical) coordinate axis. Besides in the context of indoor reconstruction, the Manhattan World assumption, as well as the weaker Atlanta World assumption have been used in a range of other application fields such as point cloud segmentation [
39,
40,
41], the extraction of road structures from low-resolution airborne imagery [
42], or for stabilization and drift reduction in the context of Visual Odomentry (VO) [
41,
43,
44] and Simultaneous Localization and Mapping (SLAM) [
45,
46,
47,
48].
The fact that a given indoor reconstruction approach relies on the Manhattan World assumption does not only imply that the building structure to be reconstructed itself must be compliant with the Manhattan World assumption. Rather, this also implies that the geometric representation of the respective building in the indoor mapping data must be correctly aligned with the coordinate axes in accordance with the definition of the Manhattan World assumption, i.e., that the surfaces pertaining to the three main directions (or six when considering oriented directions) are aligned with the three axes of the respective local coordinate system in which the data are given.
In the context of indoor mapping, however, the pose of the captured building structure with respect to the coordinate axes does not necessarily fulfill this requirement. Frequently, the local coordinate system is determined by the initial pose of the indoor mapping system at the beginning of the mapping process. Thus, the orientation of the indoor mapping data can deviate from the Manhattan World assumption by a rotation around the vertical coordinate axis even if the mapped building structure itself is totally compliant with the Manhattan World assumption. Moreover, the orientation of the vertical axis itself can also deviate from its optimal orientation according to the Manhattan World assumption, i.e., being perpendicular to horizontal ceiling and floor surfaces. This is generally not the case when a leveled mounting of the respective indoor mapping sensor is used, e.g., in the case of tripod-mounted systems such as TLS or trolley-based systems. In the case of hand-held or head-worn indoor mapping systems where a perfectly leveled orientation at the start of the indoor mapping process cannot be guaranteed, an eventual misalignment of the indoor mapping data with respect to the vertical coordinate axis needs to be taken into account.
Aligning the Manhattan World structure of an indoor mapping dataset with the local coordinate axes—horizontally and, depending on the used indoor mapping system, also vertically—is thus a necessary preprocessing step for automated indoor reconstruction approaches that rely on the Manhattan World assumption. Moreover, such an alignment process—also known as pose normalization [
49]—can still be a reasonable choice, even if the respective indoor reconstruction method does not presuppose a Manhattan World-compliant building structure. This is for instance the case when a respective indoor reconstruction approach makes use of a voxel grid or octree representation of the input data [
50,
51,
52,
53]. Even if a voxel-based indoor reconstruction approach is able to handle building structures deviating from the Manhattan World assumption, having room surfaces aligned with the coordinate axes and thus with the voxel grid will result in a cleaner and visually more appealing reconstruction in the voxel space. Furthermore, spatially discretizing data that are not aligned with the coordinate axes can lead to aliasing effects, which can impede a successful reconstruction process [
49,
54,
55]. Besides, pose normalization often—but not necessarily always, depending on the respective building structure—results in a minimal axis-aligned bounding box circumscribing the indoor mapping data and thus to the reduced memory size of the voxel grid structure.
Lastly, pose normalization of indoor mapping data can also be of benefit in the context of the coregistration of multiple datasets representing the same indoor environment that are to be aligned with each other [
56,
57,
58]. The respective datasets to be aligned can be acquired by different sensor systems or at different times, e.g., in the context of change detection [
59,
60,
61]. While pose normalization with respect to a Manhattan World structure does not entirely solve this problem as the ambiguity of rotations of multiples of 90
around the vertical axis remains, it nonetheless can be reasonable to apply pose normalization when coregistering indoor mapping datasets as it reduces the problem to finding the correct one of only four possible states per dataset.
The same arguments speaking in favor of pose normalization—even if an indoor reconstruction approach does not necessarily depend on it—also hold true for the case of building structures that are only partly compliant with the Manhattan World assumption. Thus, a pose normalization approach should be robust against a substantial amount of the given indoor mapping geometries deviating from the Manhattan World structure of the building. Particularly in the case of building environments that contain multiple Manhattan World structures with different orientations with respect to rotations around a common vertical axis (i.e., Atlanta World), the dominant Manhattan World structure (e.g., in terms of the largest fraction of supporting geometries) should be used for alignment with the coordinate axes. In situations where multiple Manhattan World structures have about the same support, it might be reasonable to detect them all and create multiple solutions for a valid pose normalization.
In a more general context, a range of pose normalization approaches has been presented, which aim at aligning arbitrary three-dimensional objects with the coordinate axes. In this case, the concerned objects do not necessarily represent building structures [
62,
63,
64,
65,
66,
67,
68,
69]. These approaches are mainly motivated by the need to design rotation-invariant shape descriptors in the context of shape retrieval, i.e., finding all similar three-dimensional objects to a given query shape from a large database of 3D objects [
70,
71].
In this context, variations of the Principal Component Analysis (PCA) algorithm [
72] are often used [
62,
63,
64,
67]. Furthermore, symmetries in the geometry of the respective object are often exploited as well [
64,
65,
67]. Other approaches rely on the geometric property of rectilinearity [
66,
68] or aim to minimize the size of a surface-oriented bounding box circumscribing the target object [
69].
More specifically concerning building structures, a recent pose normalization approach makes use of point density histograms, discretizing and aggregating the points of an indoor mapping point cloud along the direction of one of the horizontal coordinate axes [
49,
54]. The optimal horizontal alignment of the point cloud is determined by maximizing the size and distinctness of peaks in this histogram varying with the rotation around the vertical axis.
Other approaches, including the one proposed in this paper, do not discretize the data with respect to their position, but with respect to their orientation [
73,
74,
75,
76]. This is conducted on the Extended Gaussian Image (EGI) [
77], which consists of the normal vectors of the individual indoor mapping geometries projected on the unit sphere. Besides its application in the context of pose normalization, the EGI is also frequently applied to the segmentation of point clouds [
39,
41,
78,
79,
80] or plane detection [
81], in particular with regard to building structures.
In a straightforward approach, for instance, the points in the EGI are subjected to a k-means clustering [
82,
83] to determine three clusters corresponding to the main directions of the Manhattan World structure, while disregarding the absolute orientation of the normal vectors (i.e., projecting them all in the same hemisphere) [
74,
75]. This, however, is not robust to deviations of the indoor mapping point cloud from an ideal Manhattan World structure. In contrast, using DBSCAN [
84] for clustering on the EGI has been proposed [
76], which is more robust, as it does not fix the number of clusters to exactly three. This allows for the presence of surfaces deviating from an ideal Manhattan World system. The proposed approach however only aims at detecting dominant planes to remove them from the point cloud and does not assemble the detected orientation clusters into Manhattan World structures. In another approach, dominant horizontal directions are detected by projecting the normal vectors to the horizontal plane and binning the resulting angles to a horizontal reference coordinate axis in a similar manner to the approach presented in this paper [
73].
All of the approaches mentioned above only concern themselves with determining an orientation around the vertical axis to achieve an alignment of the Manhattan World structure of an indoor mapping dataset with the axes of a reference coordinate system. To the best of our knowledge, no approach to pose normalization of indoor mapping point clouds or triangle meshes has yet been proposed that aims at determining an optimal alignment with respect to the orientation of the vertical axis as well. Furthermore, the presented approaches do not address the topic of robustness to deviations of the respective building structure from an ideal Manhattan World scenario or the presence of multiple Manhattan World structures in the same building.
In this work, we present a novel pose-normalization method for indoor mapping point clouds and triangle meshes that is robust to the represented building structures being only partly compliant with the Manhattan World assumption. In case there are multiple major Manhattan World structures present in the data, the dominant one is detected and used for alignment. Besides the horizontal alignment of the Manhattan World structure with the coordinate system axes, vertical alignment is also supported for cases where the deployed indoor mapping system is not leveled and the resulting dataset is thus misaligned with respect to the vertical coordinate axis. In this context, we presumed that the indoor mapping dataset is coarsely leveled to within ±30° of the optimal vertical direction, which can usually be expected to be the case for hand-held or head-worn mobile indoor mapping systems. We furthermore presupposed the individual indoor mapping geometries to have normal vectors, which however do not need to be consistently oriented and can thus be easily determined as a preprocessing step for point clouds, while triangle meshes already have normal vectors inherent in the geometries of the individual triangles. Our implementation of the proposed pose normalization approach along with the code for the presented quantitative evaluation on publicly available indoor mapping datasets is made available to the public at
https://github.com/huepat/im-posenorm (accessed on 22 November 2021).
The presented approach for pose normalization is described in
Section 2 along with a method to resolve the ambiguity of a rotation of multiples of 90
around the vertical axis and the procedure applied for the quantitative evaluation. The results of this evaluation procedure applied to several publicly available indoor mapping point clouds and triangle meshes are subsequently presented in
Section 3 and discussed in detail in
Section 4. Finally, in
Section 5, we provide concluding remarks and an outlook for future research.
2. Materials and Methods
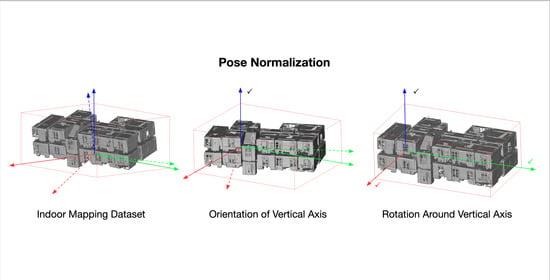
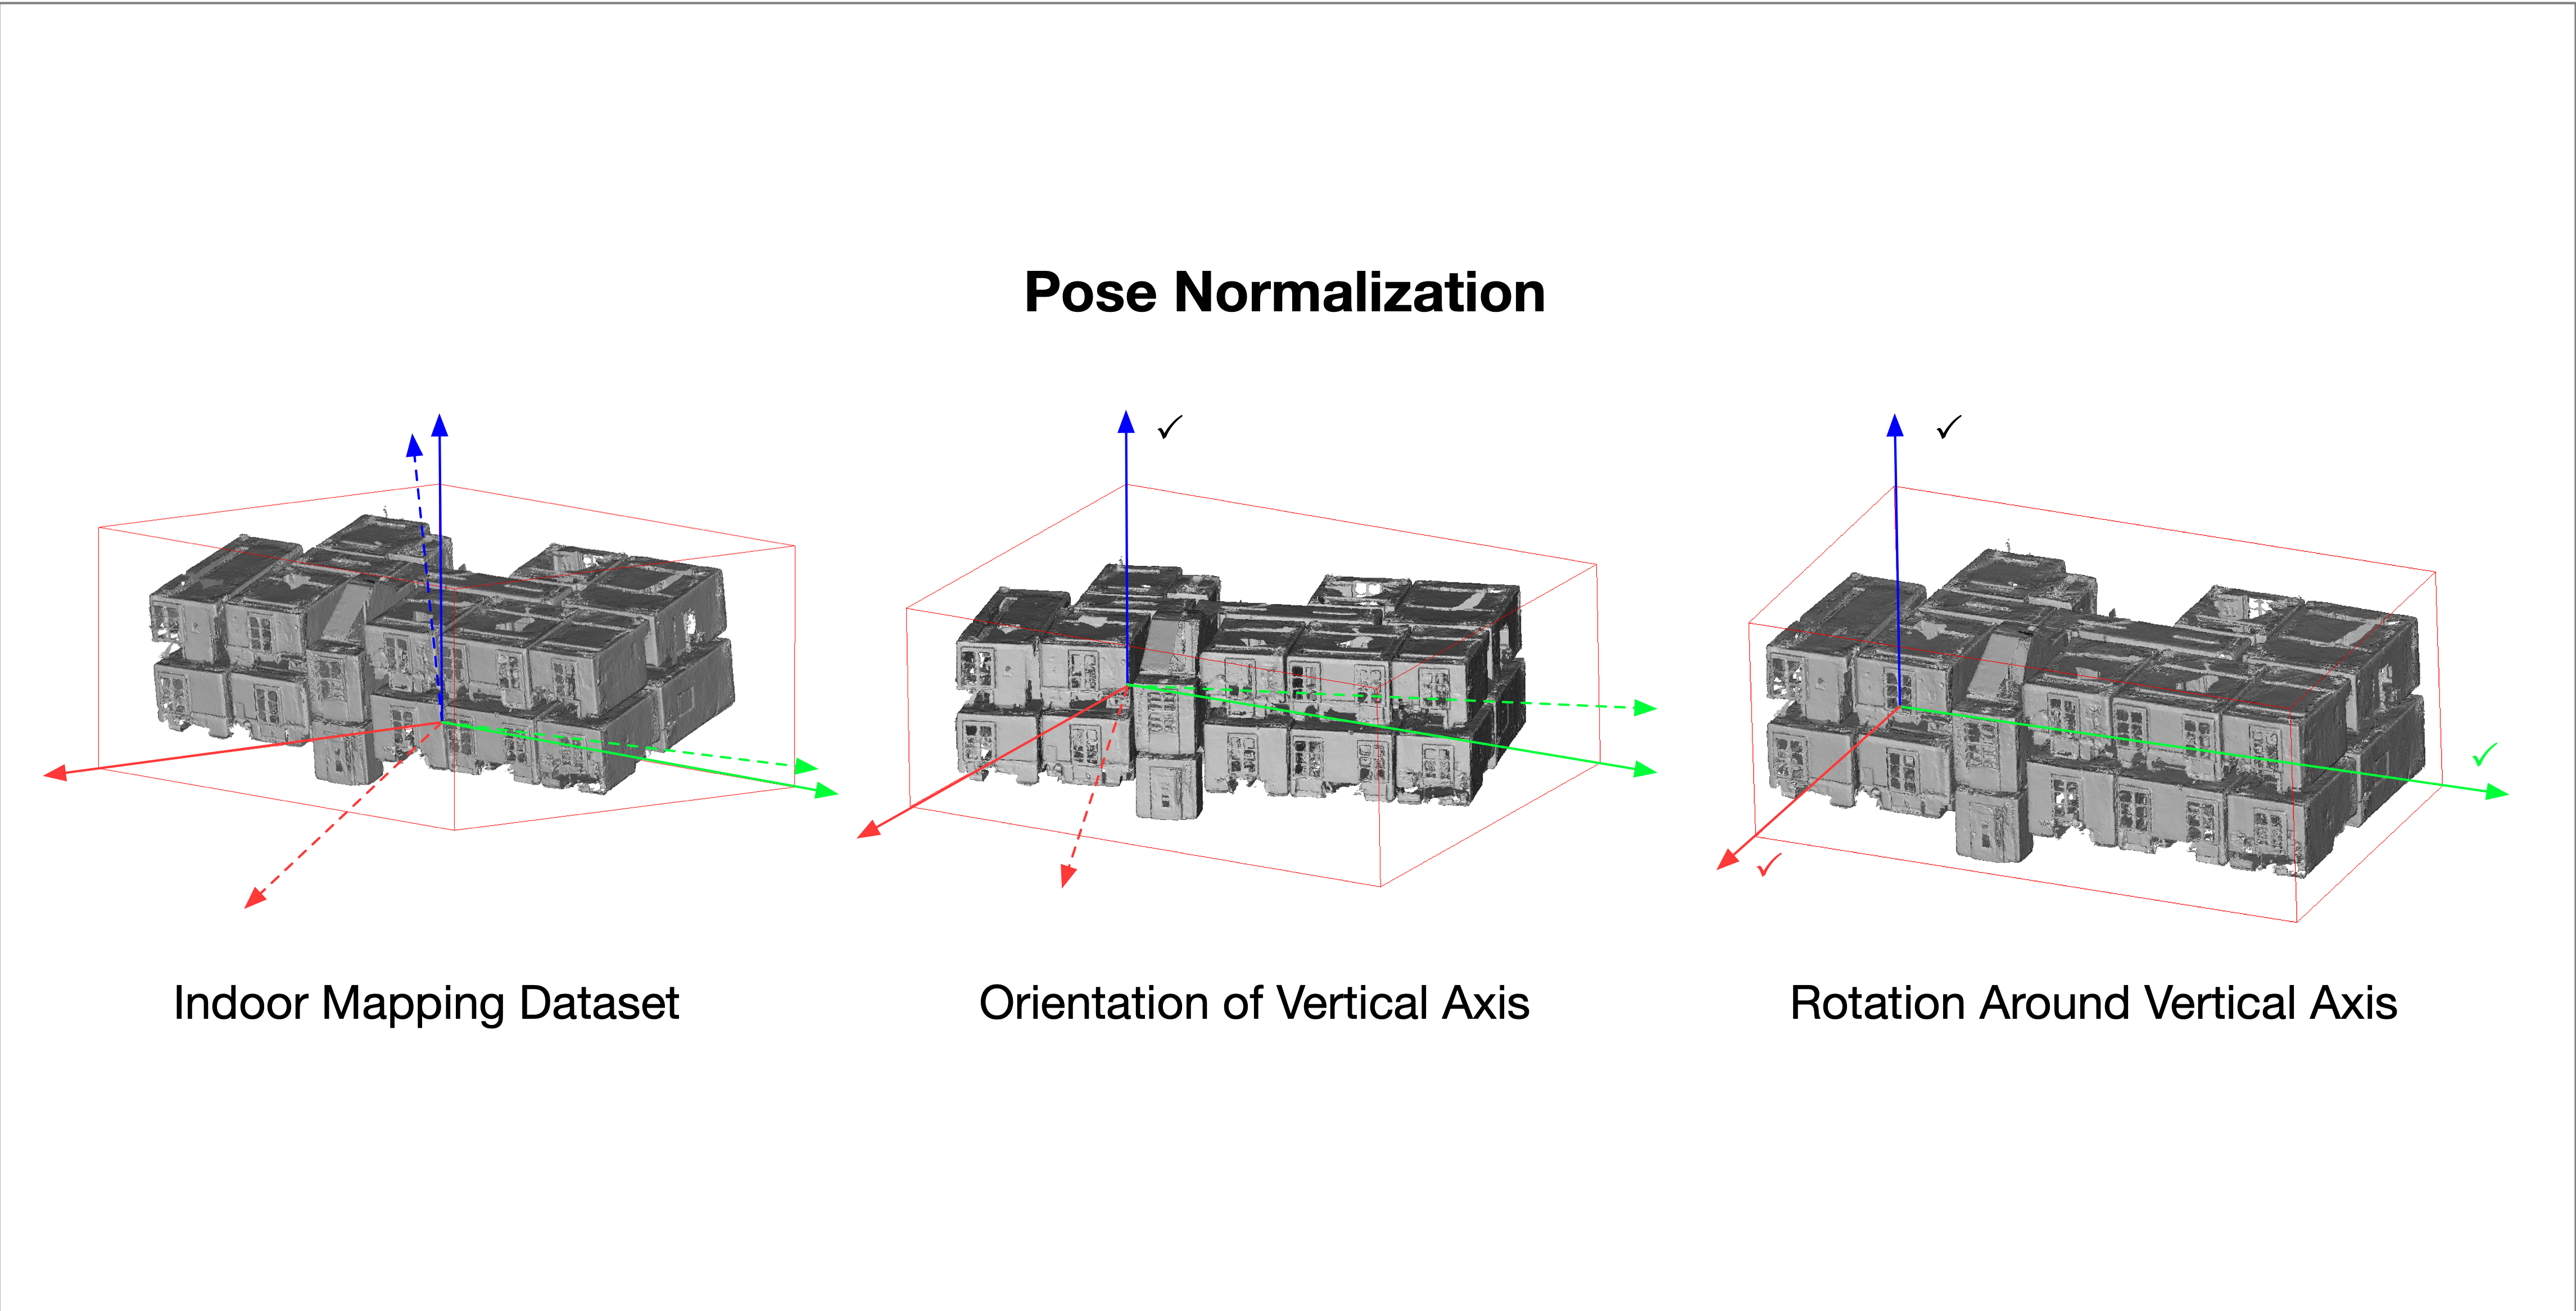
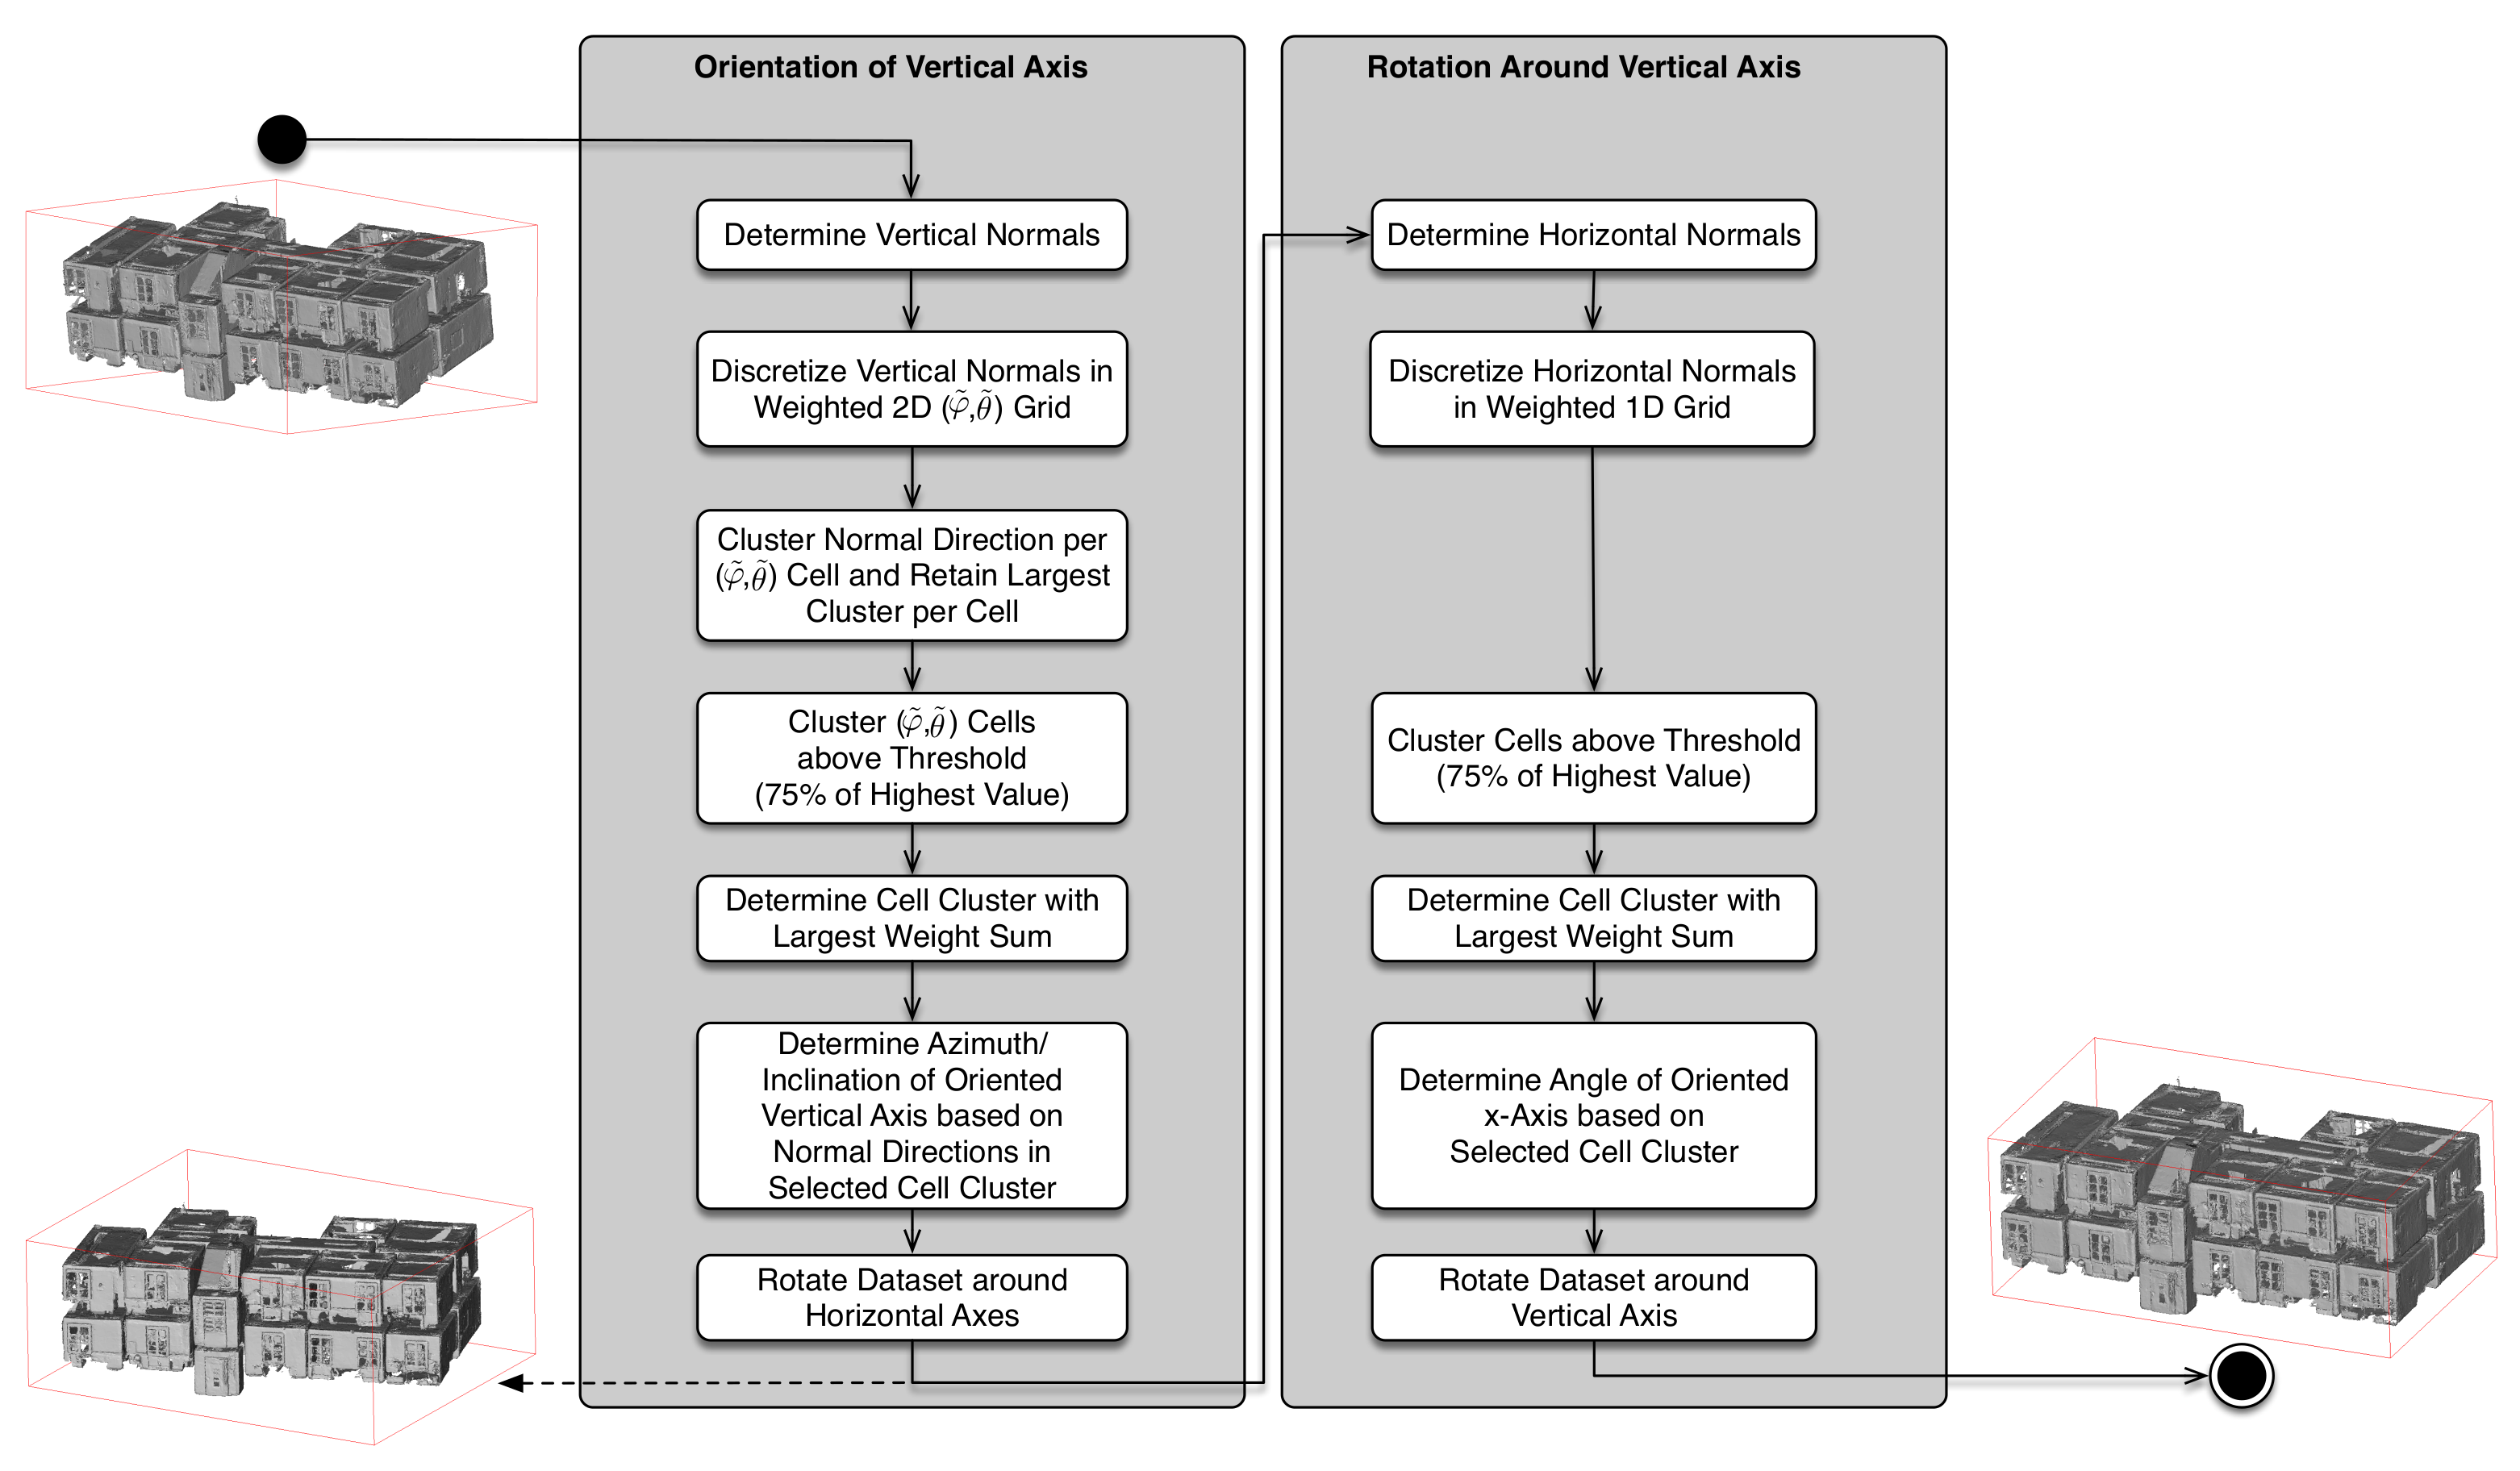
In this section, we present a novel method for automatic pose normalization of indoor mapping point clouds or triangle meshes that represent building structures that are at least partially compliant with the Manhattan World assumption. The presented method aims at rotating the given indoor mapping geometries to a pose with respect to the surrounding coordinate system for which the largest possible fraction of normal vectors is aligned with the three Cartesian coordinate axes. This comprises an optional leveling step to orient horizontal surfaces such as floors and ceilings to be orthogonal to a chosen vertical axis if this is not already achieved by the data-acquisition process (e.g., by using leveled tripod or trolley-mounted acquisition systems). Subsequently, a second step determines the optimal rotation angle around this vertical axis in order to align the largest possible fraction of the building surfaces with the horizontal pair of orthogonal coordinate axes. The workflow of the proposed method is visually summarized in
Figure 1.
The presented method is applicable to all kinds of indoor mapping point clouds and triangle meshes. However, we assumed the individual geometric primitives comprising the input data to have normal vectors. While these are intrinsically given for the individual triangles comprising a triangle mesh, the individual points of indoor mapping point clouds do not generally have normal vectors. These can however be easily determined by means of established methods such as in [
85,
86,
87,
88], which we assumed in this work as a necessary preprocessing step. Note that these normal vectors need not be oriented, i.e., pointing consistently towards the inside or outside of the building. Determining such oriented normals for indoor mapping point clouds is a more complex task compared to just determining unoriented normals based on local neighborhoods [
89]. However, as normal vectors contribute to the same Manhattan World structure regardless of their orientation, only their direction is of importance. Furthermore, we assumed the input data to be at least coarsely leveled, i.e., we assumed the represented building structures to be coarsely aligned with the vertical axis within the range of ±30
.
In the following, denotes the i-th normal vector of N given input geometries (i.e., points or triangles), while, in the scope of this paper, denotes the dot product of two 3D vectors. Furthermore, the vector determining the initial vertical axis of the coordinate system in which the indoor mapping data are represented is denoted by , while the initial horizontal axes are denoted by and . The orientation of these initial axes in the input data is however only vertical/horizontal within ±30 w.r.t. the represented building geometry. Aligning these axes of the local coordinate system with the building geometry in such a way that is optimally vertical w.r.t. the building is the aim of the presented method.
Different indoor mapping systems use different definitions of the respective local coordinate system, i.e., the
axis need not necessarily equal
(with
denoting the transpose operation in the scope of this paper). Thus, the vectors of the
and
axes are to be chosen by the user as an input parameter to the presented method. The chosen vectors are checked for orthogonality, and
is determined as:
In the following,
Section 2.1 first presents the proposed method for determining an optimal rotation around the vertical axis in order to horizontally align the indoor mapping data with the coordinate system in case the dataset is already vertically aligned in relation to the vertical axis. A suitable method for ensuring this vertical alignment that can be applied as a preprocessing step to datasets that are only coarsely aligned with the vertical direction (±30
) is subsequently presented in
Section 2.2. As the proposed method for determining the rotation around the vertical axis is ambiguous with regard to multiples of 90
,
Section 2.3 presents an approach to solve this ambiguity. Lastly,
Section 2.4 presents the evaluation methodology applied in this study, and
Section 2.5 gives an overview of the datasets used for the evaluation.
2.1. Rotation around the Vertical Axis
In this section, we preliminarily assumed that the given indoor mapping data (comprised of triangles or points) is already leveled with regard to a chosen vertical axis (that does not necessarily need to equal ). Thus, only one rotation angle around this vertical axis is to be determined in order to align the two horizontal axes of the coordinate system with the horizontal directions of the dominant Manhattan World structure underlying the respective building represented by the input data.
In case the given input data are not entirely compliant with the Manhattan World assumption, a best-possible solution in terms of the alignment of all normal vectors with the horizontal coordinate axes is to be found. Even indoor mapping data that represent building structures entirely compliant with the Manhattan World assumption can have a significant amount of normal vector directions deviating from the directions of the respective Manhattan World system. These deviating normal vector directions can be caused by the actual unevenness of walls, by noise inherent in the data acquisition and normal determination, as well as by clutter such as furniture objects being present in the indoor mapping data, in addition to the building structure itself.
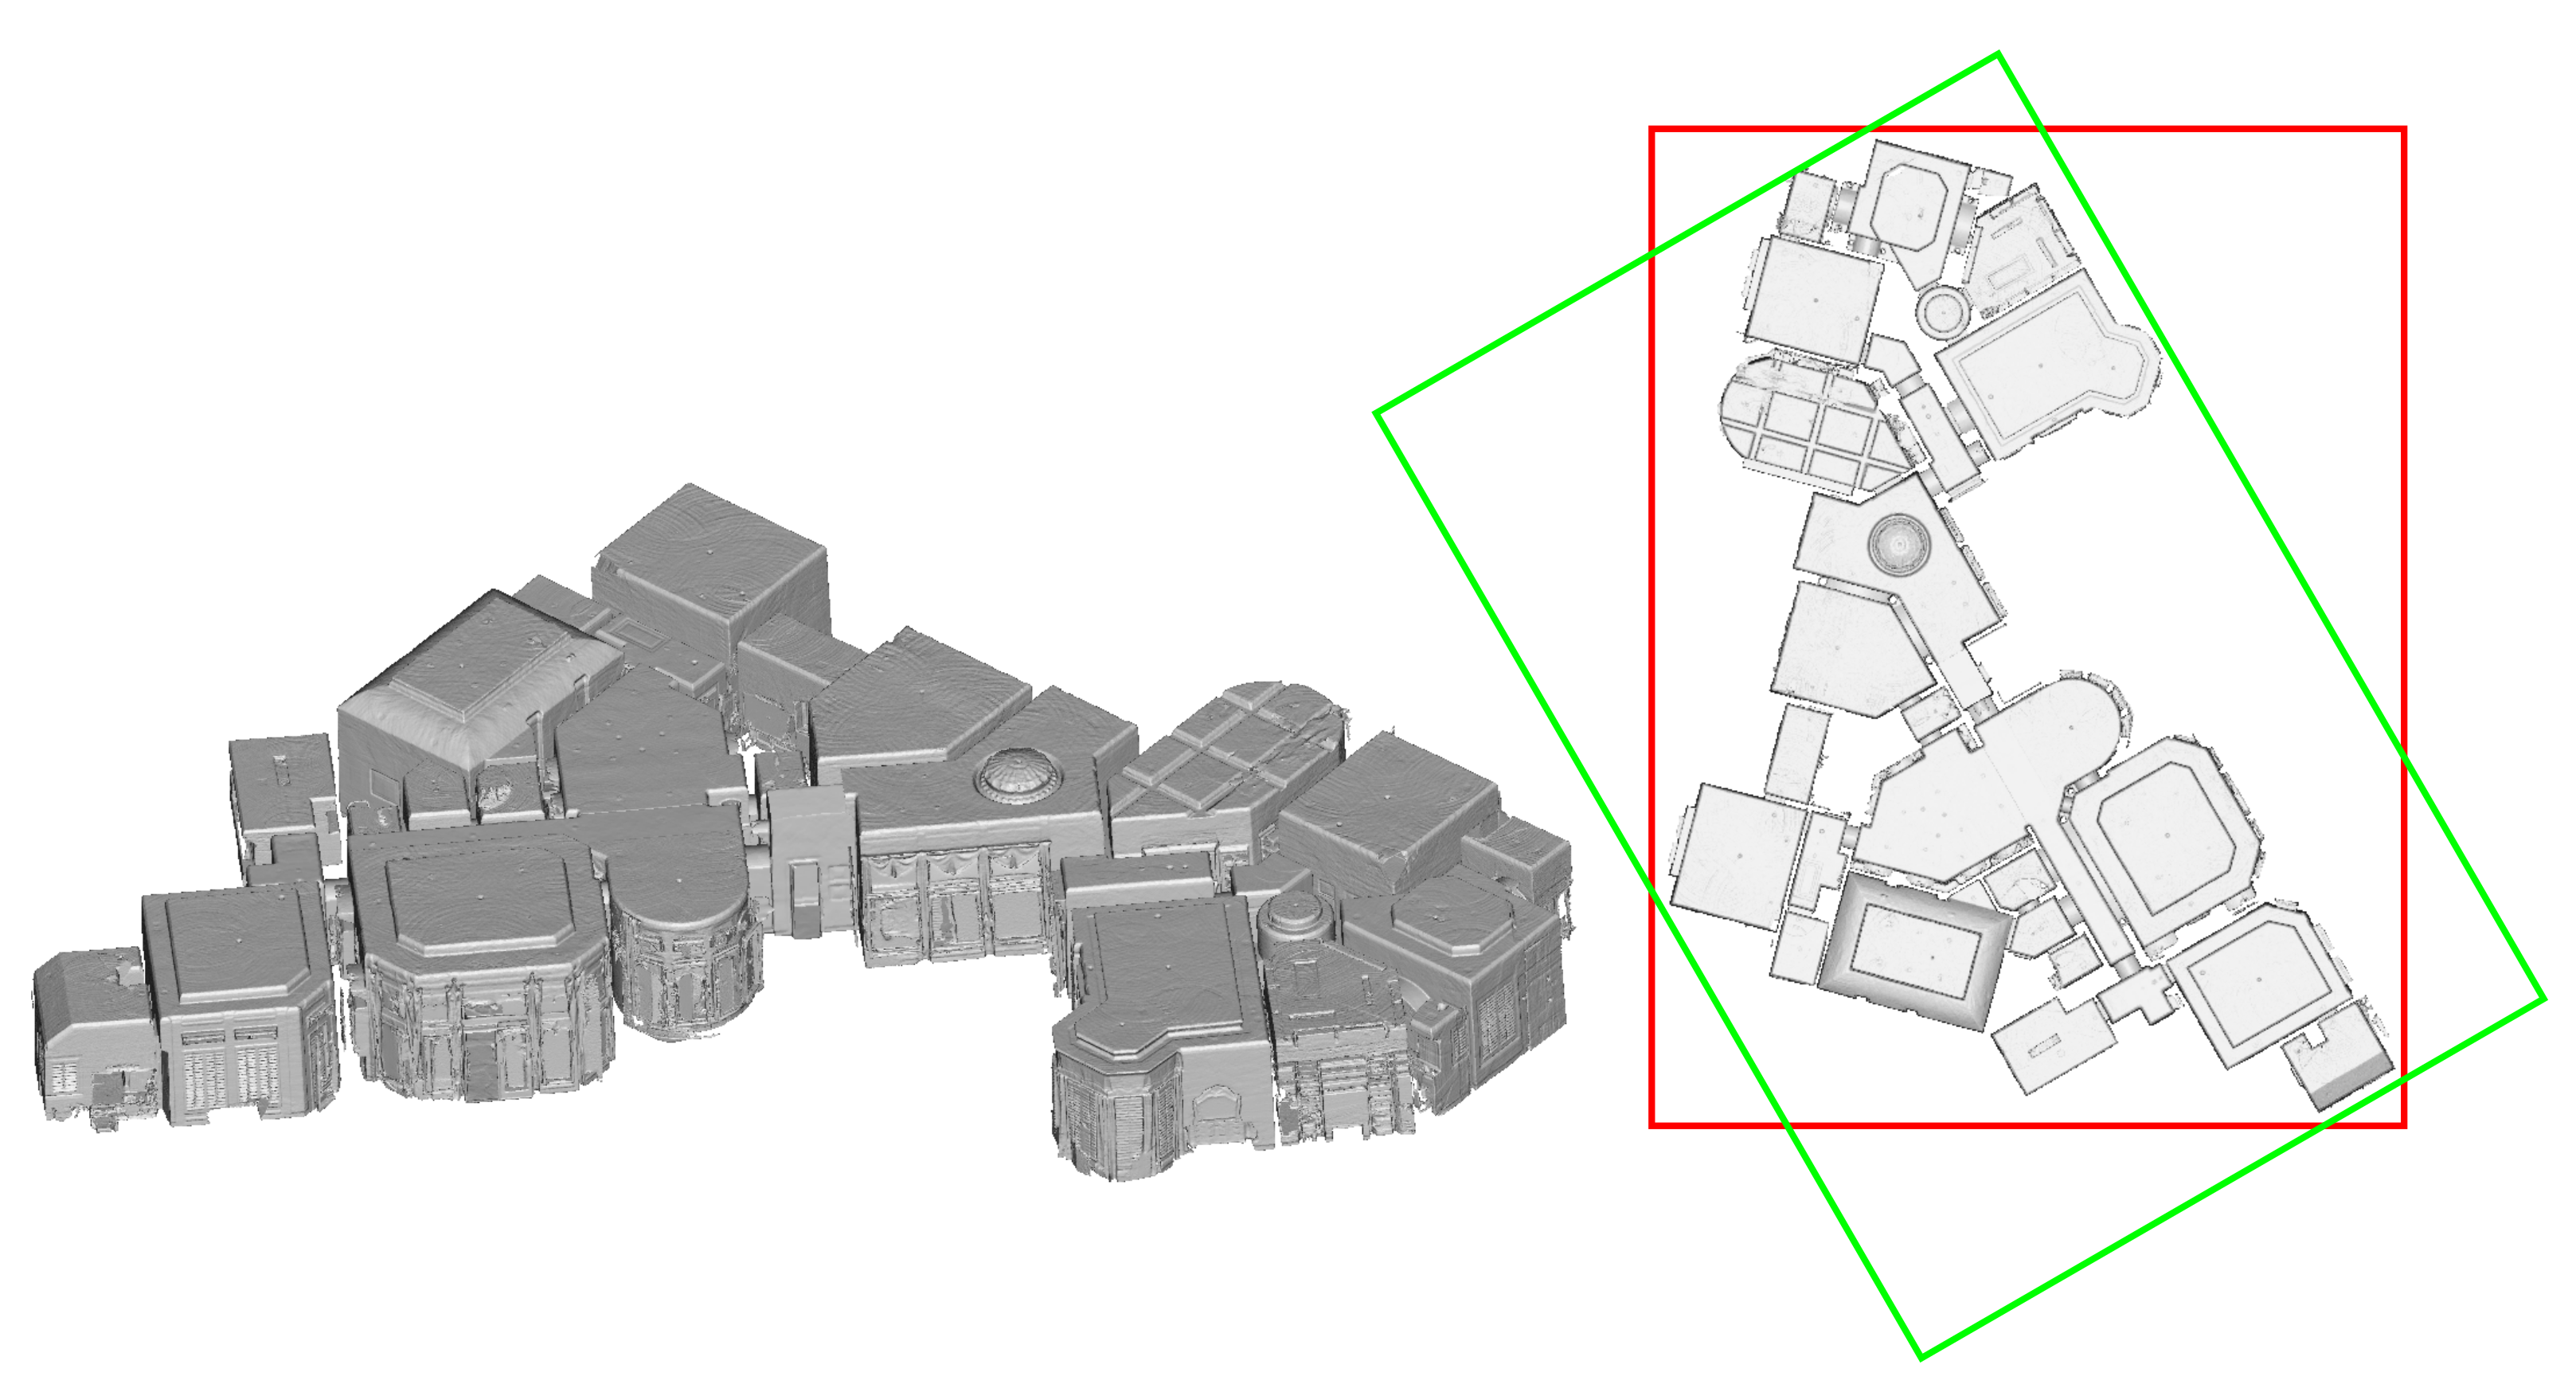
Besides being robust against these restrictions, the presented method is also applicable to building structures that are only partially Manhattan World conforming. Building structures with multiple Manhattan World systems such as the one depicted in
Figure 2 are aligned according to the respective Manhattan World system supported by the largest fraction of normal vector directions.
Thus, the task at hand is to determine an angle of rotation around the vertical axis
that leads to the largest positive fraction of normal vectors being aligned with the horizontal axes
and
. To this aim, we first filtered the normal vectors that can be considered coarsely horizontal with respect to the vertical axis
. For this, we considered all
normal vectors
that are within the range of ±45
of a horizontal orientation; thus:
where
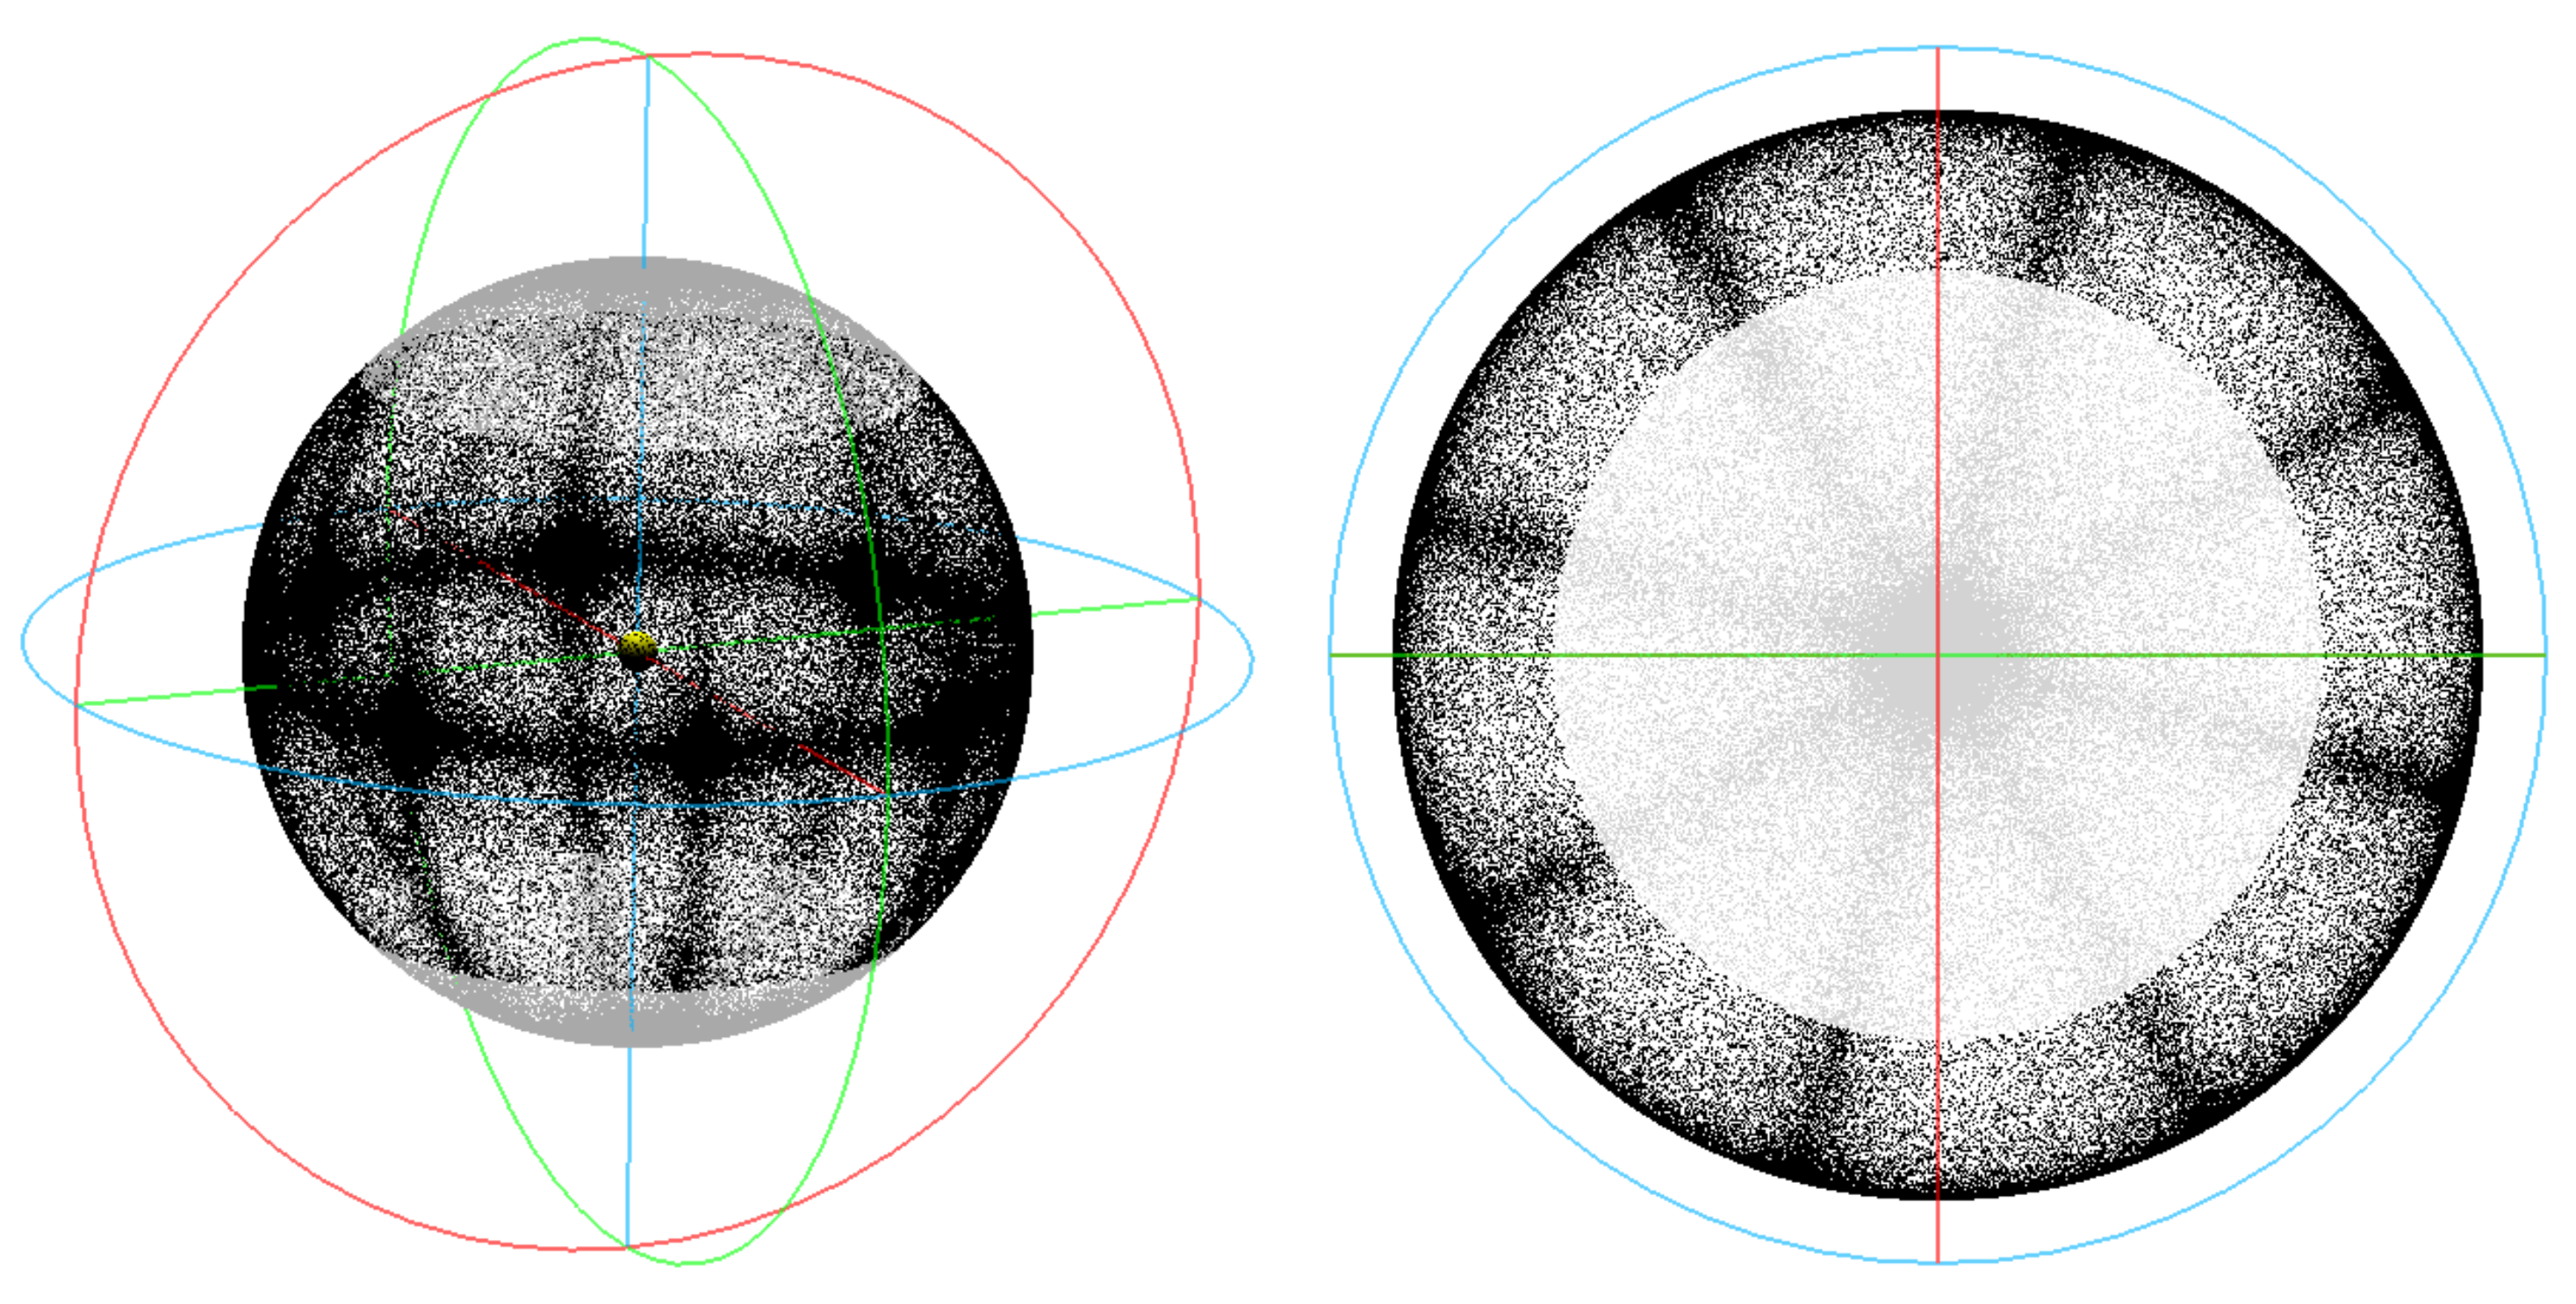
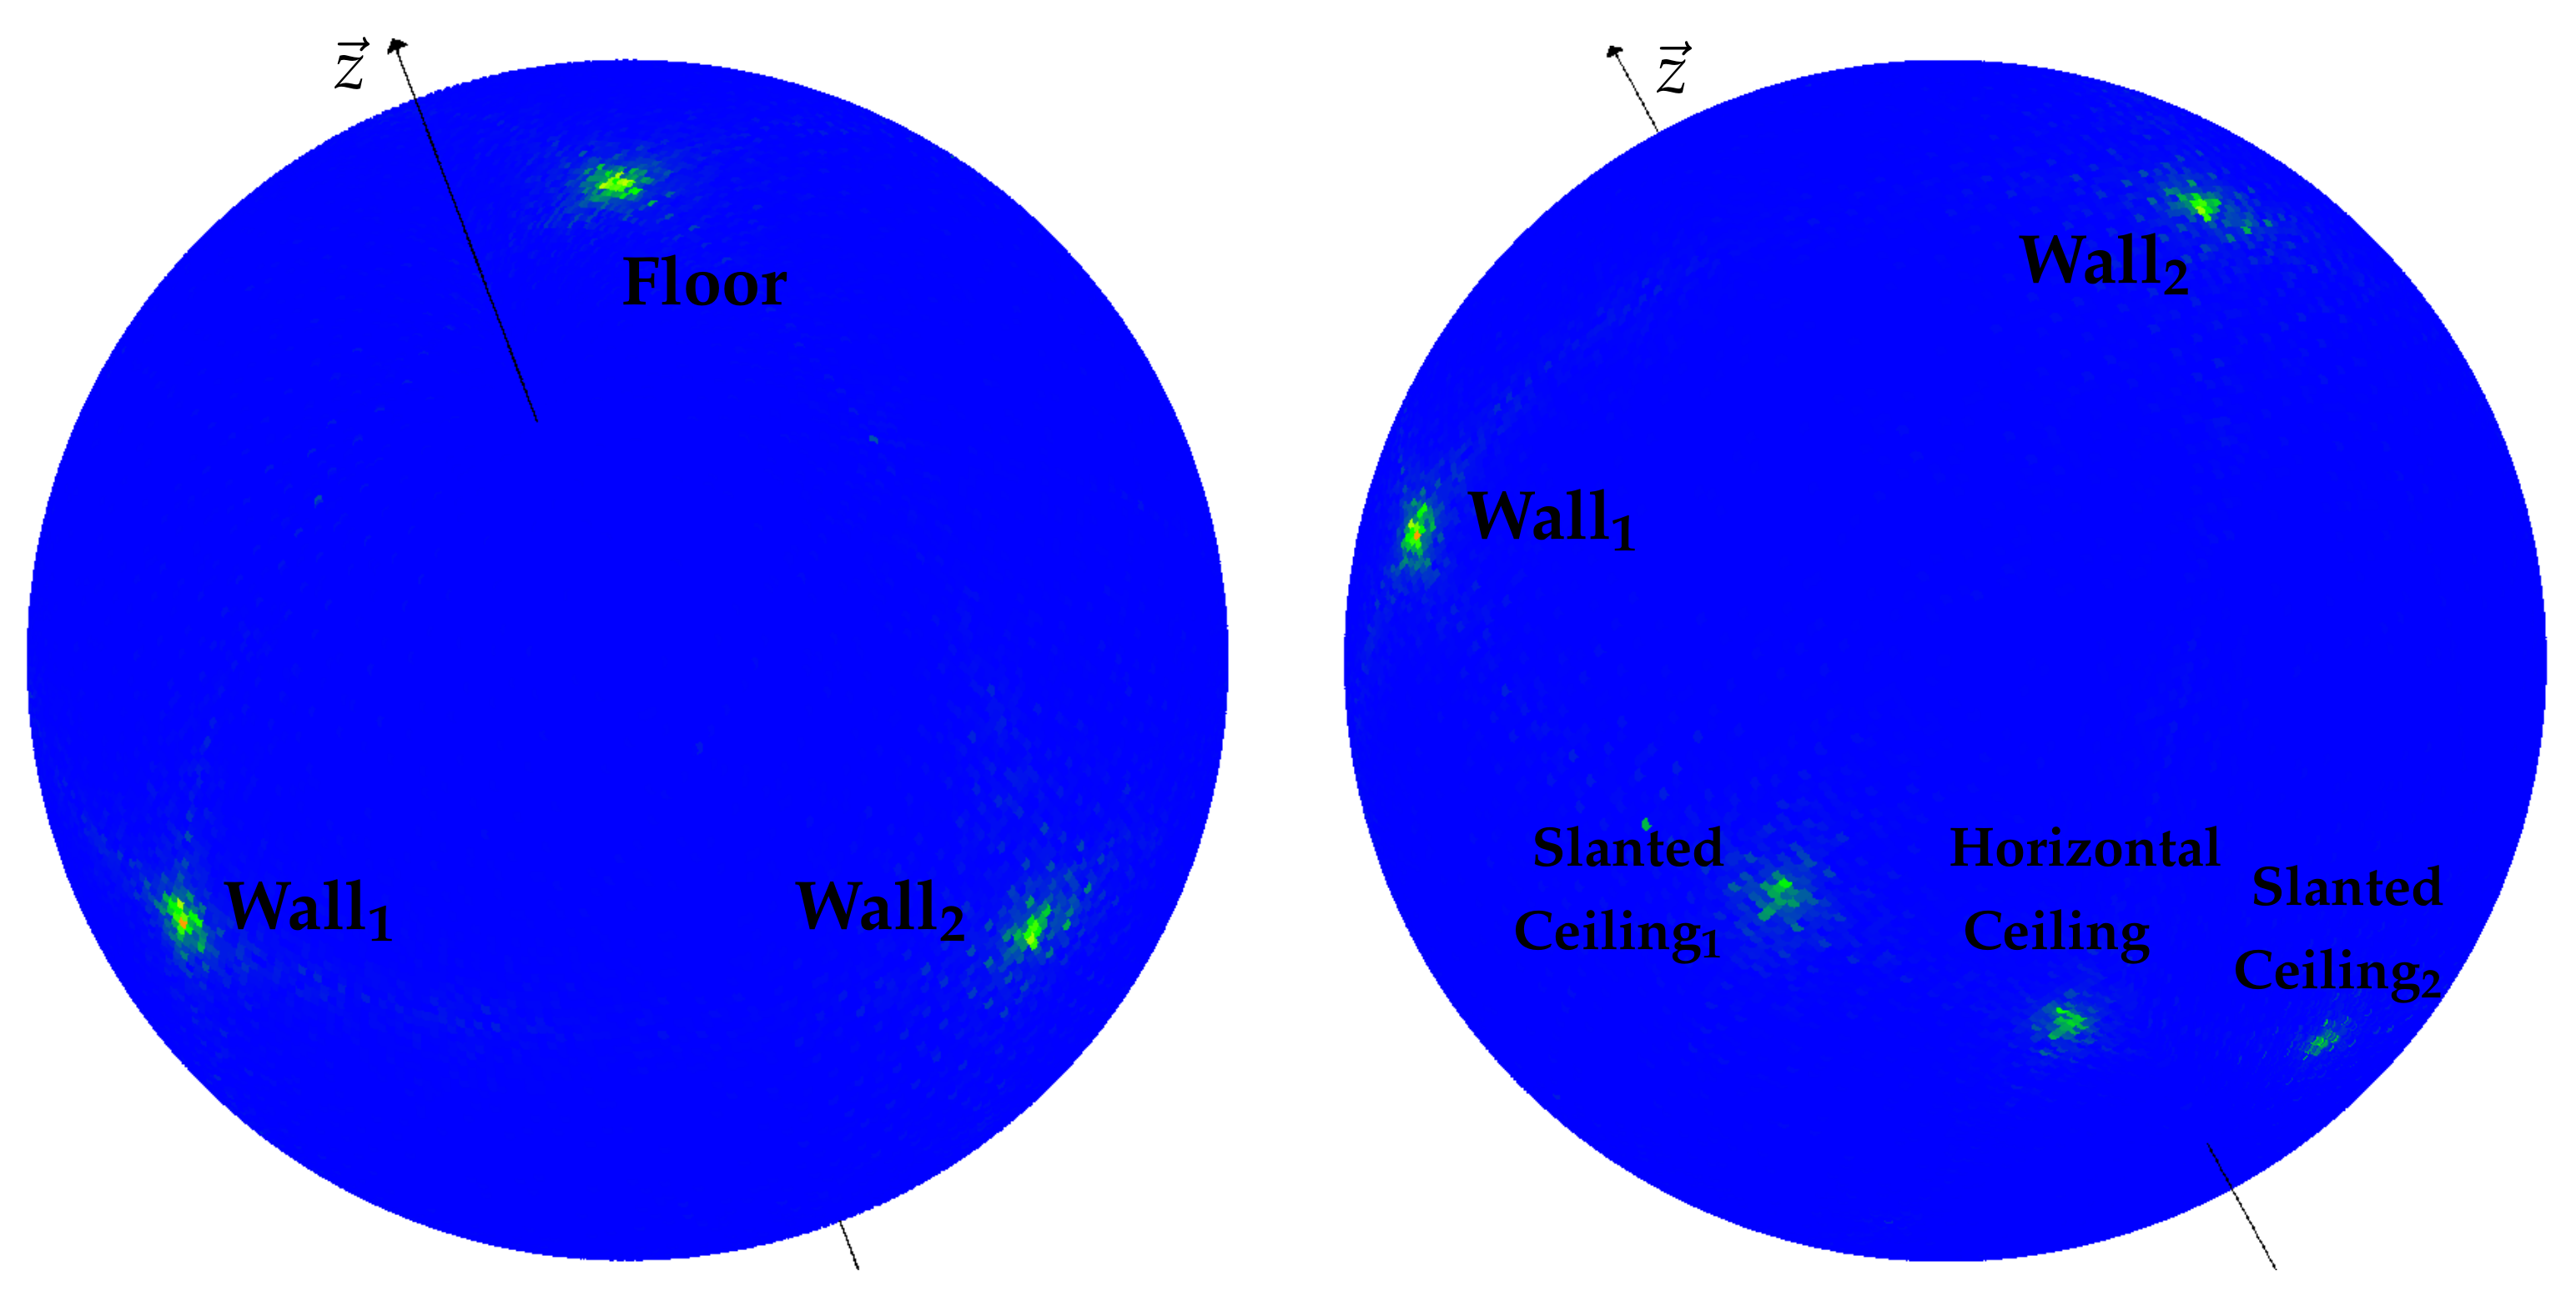
denotes the smallest angle between two 3D vectors. For the indoor mapping mesh depicted in
Figure 2, the corresponding horizontal normal vectors
are depicted in the form of an extended Gaussian image in
Figure 3. In this example, the triangle mesh of
Figure 2 is rotated by 30
around the vertical axis relative to the ground truth pose aligned with the dominant Manhattan World structure.
These horizontal normal vectors
can subsequently be projected to the horizontal plane formed by the horizontal axes
and
by:
where their respective angles to the reference direction of
around
as the axis of rotation:
can be determined.
The problem at hand can be formulated as determining the rotation angle
around the vertical axis that minimizes the sum of angular distances of each horizontal normal vector to the respectively nearest horizontal coordinate axis, i.e.,
Here, the angular distances of each angle to the nearest horizontal axis are weighted by factor . This factor can be constantly set to 1 for the points of an indoor mapping point cloud. In the case of triangle meshes, however, it allows weighing the individual triangles by their respective area, as larger triangles imply a larger quantity of points in a corresponding point cloud representation.
Equation (
5) is not analytically solvable. It can however be solved numerically by derivative-free minimization methods such as, e.g., Brent minimization [
91]. This, however, does not scale well with the size of the input data, as all the angles derived from the horizontal normal vectors need to be iterated in each step of the respective numeric method. Particularly in the case of indoor mapping point clouds, the amount of geometric primitives and thus of angles to be processed can reach a tremendous size.
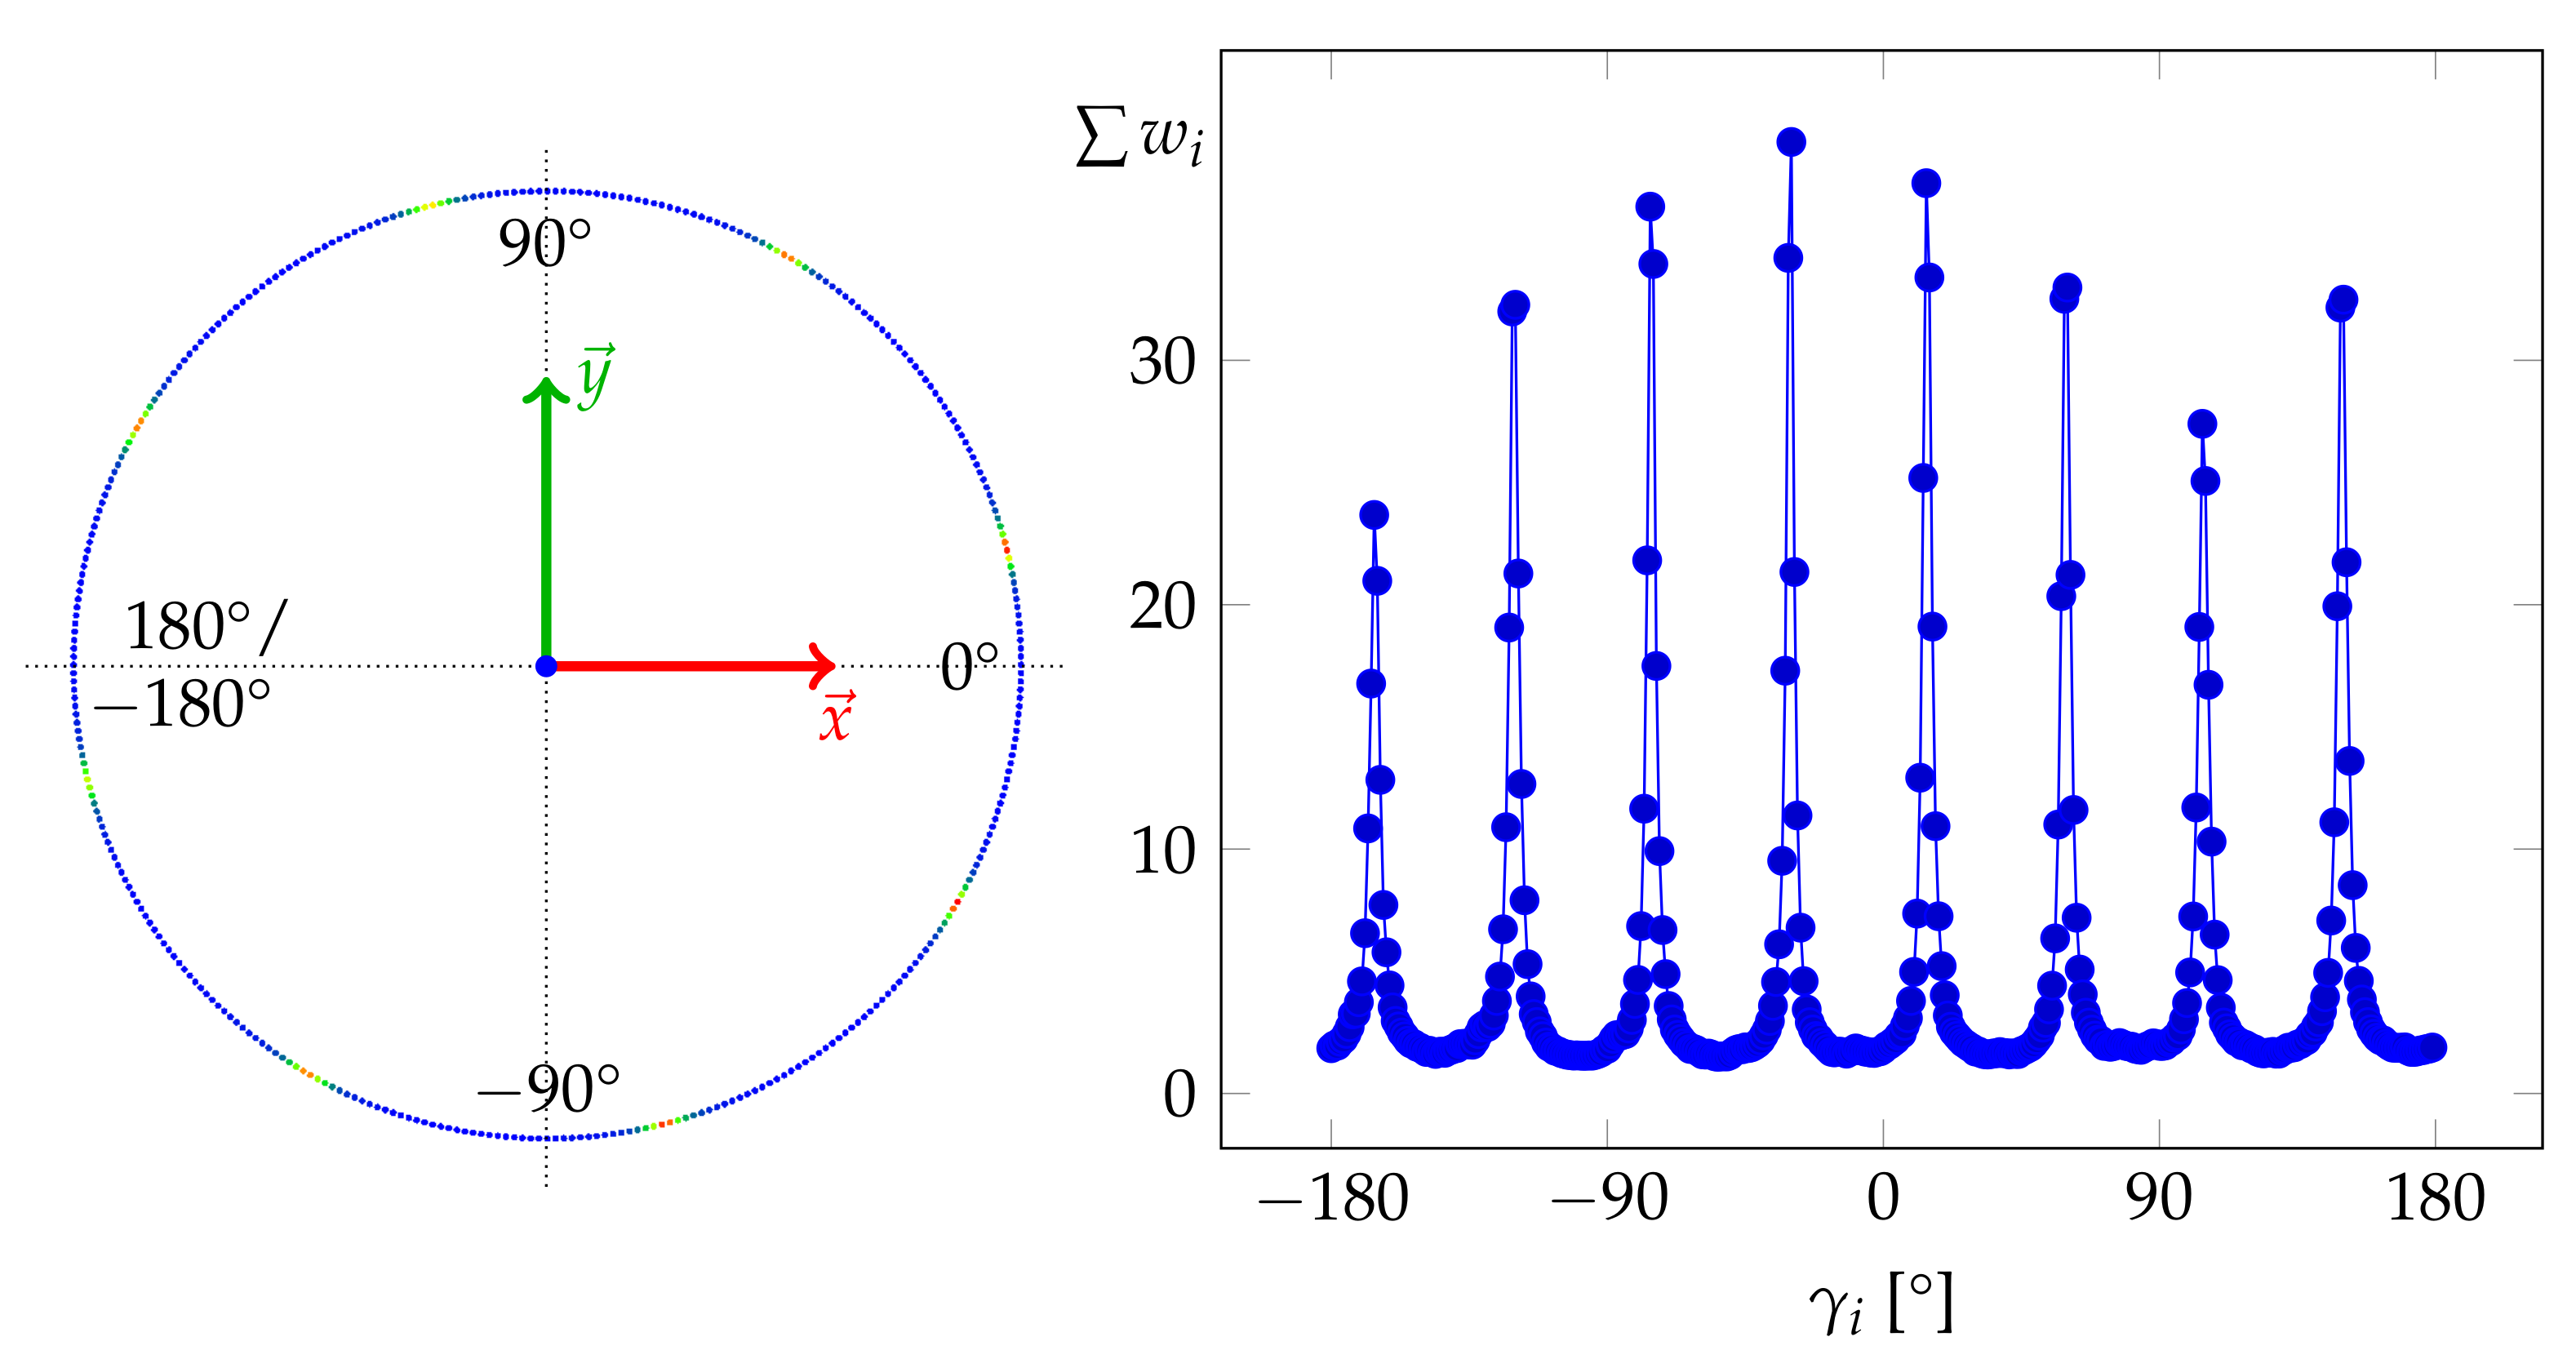
Consequently, in this work, we propose an approach that discretizes the input data into a one-dimensional grid of fixed resolution by means of which the angle of rotation for aligning the input data with the horizontal coordinate system can be determined noniteratively in one step. In this context, a resolution of 1 proved to be suitable for a coarse initial determination of the rotation angle for horizontal alignment, which can subsequently be refined. For each angle , the respective grid cell is determined, which is incremented by the respective weight , which again is constantly 1 for points of point clouds, but in the case of triangle meshes, weights the respective angle by the area of the corresponding triangle.
Figure 4 visualizes such a one-dimensional grid representation of the horizontal angles
over the full circle of 360
for the mesh presented in
Figure 2. The peaks in the summarized weights per grid cell correspond to the eight horizontal main directions of the two Manhattan World systems present in the dataset depicted in
Figure 2.
To decide about the dominance of the two Manhattan World systems involved and to determine the corresponding rotation angle for an alignment of the input data with it, the weights of the involved grid cells need to be summarized over all peaks pertaining to the same Manhattan World system. To this end, the peaks belonging to the same Manhattan World system and thus having an angular difference of a multiple of 90
between each other need to be identified and associated. Thus, we map the angles
to
by:
and:
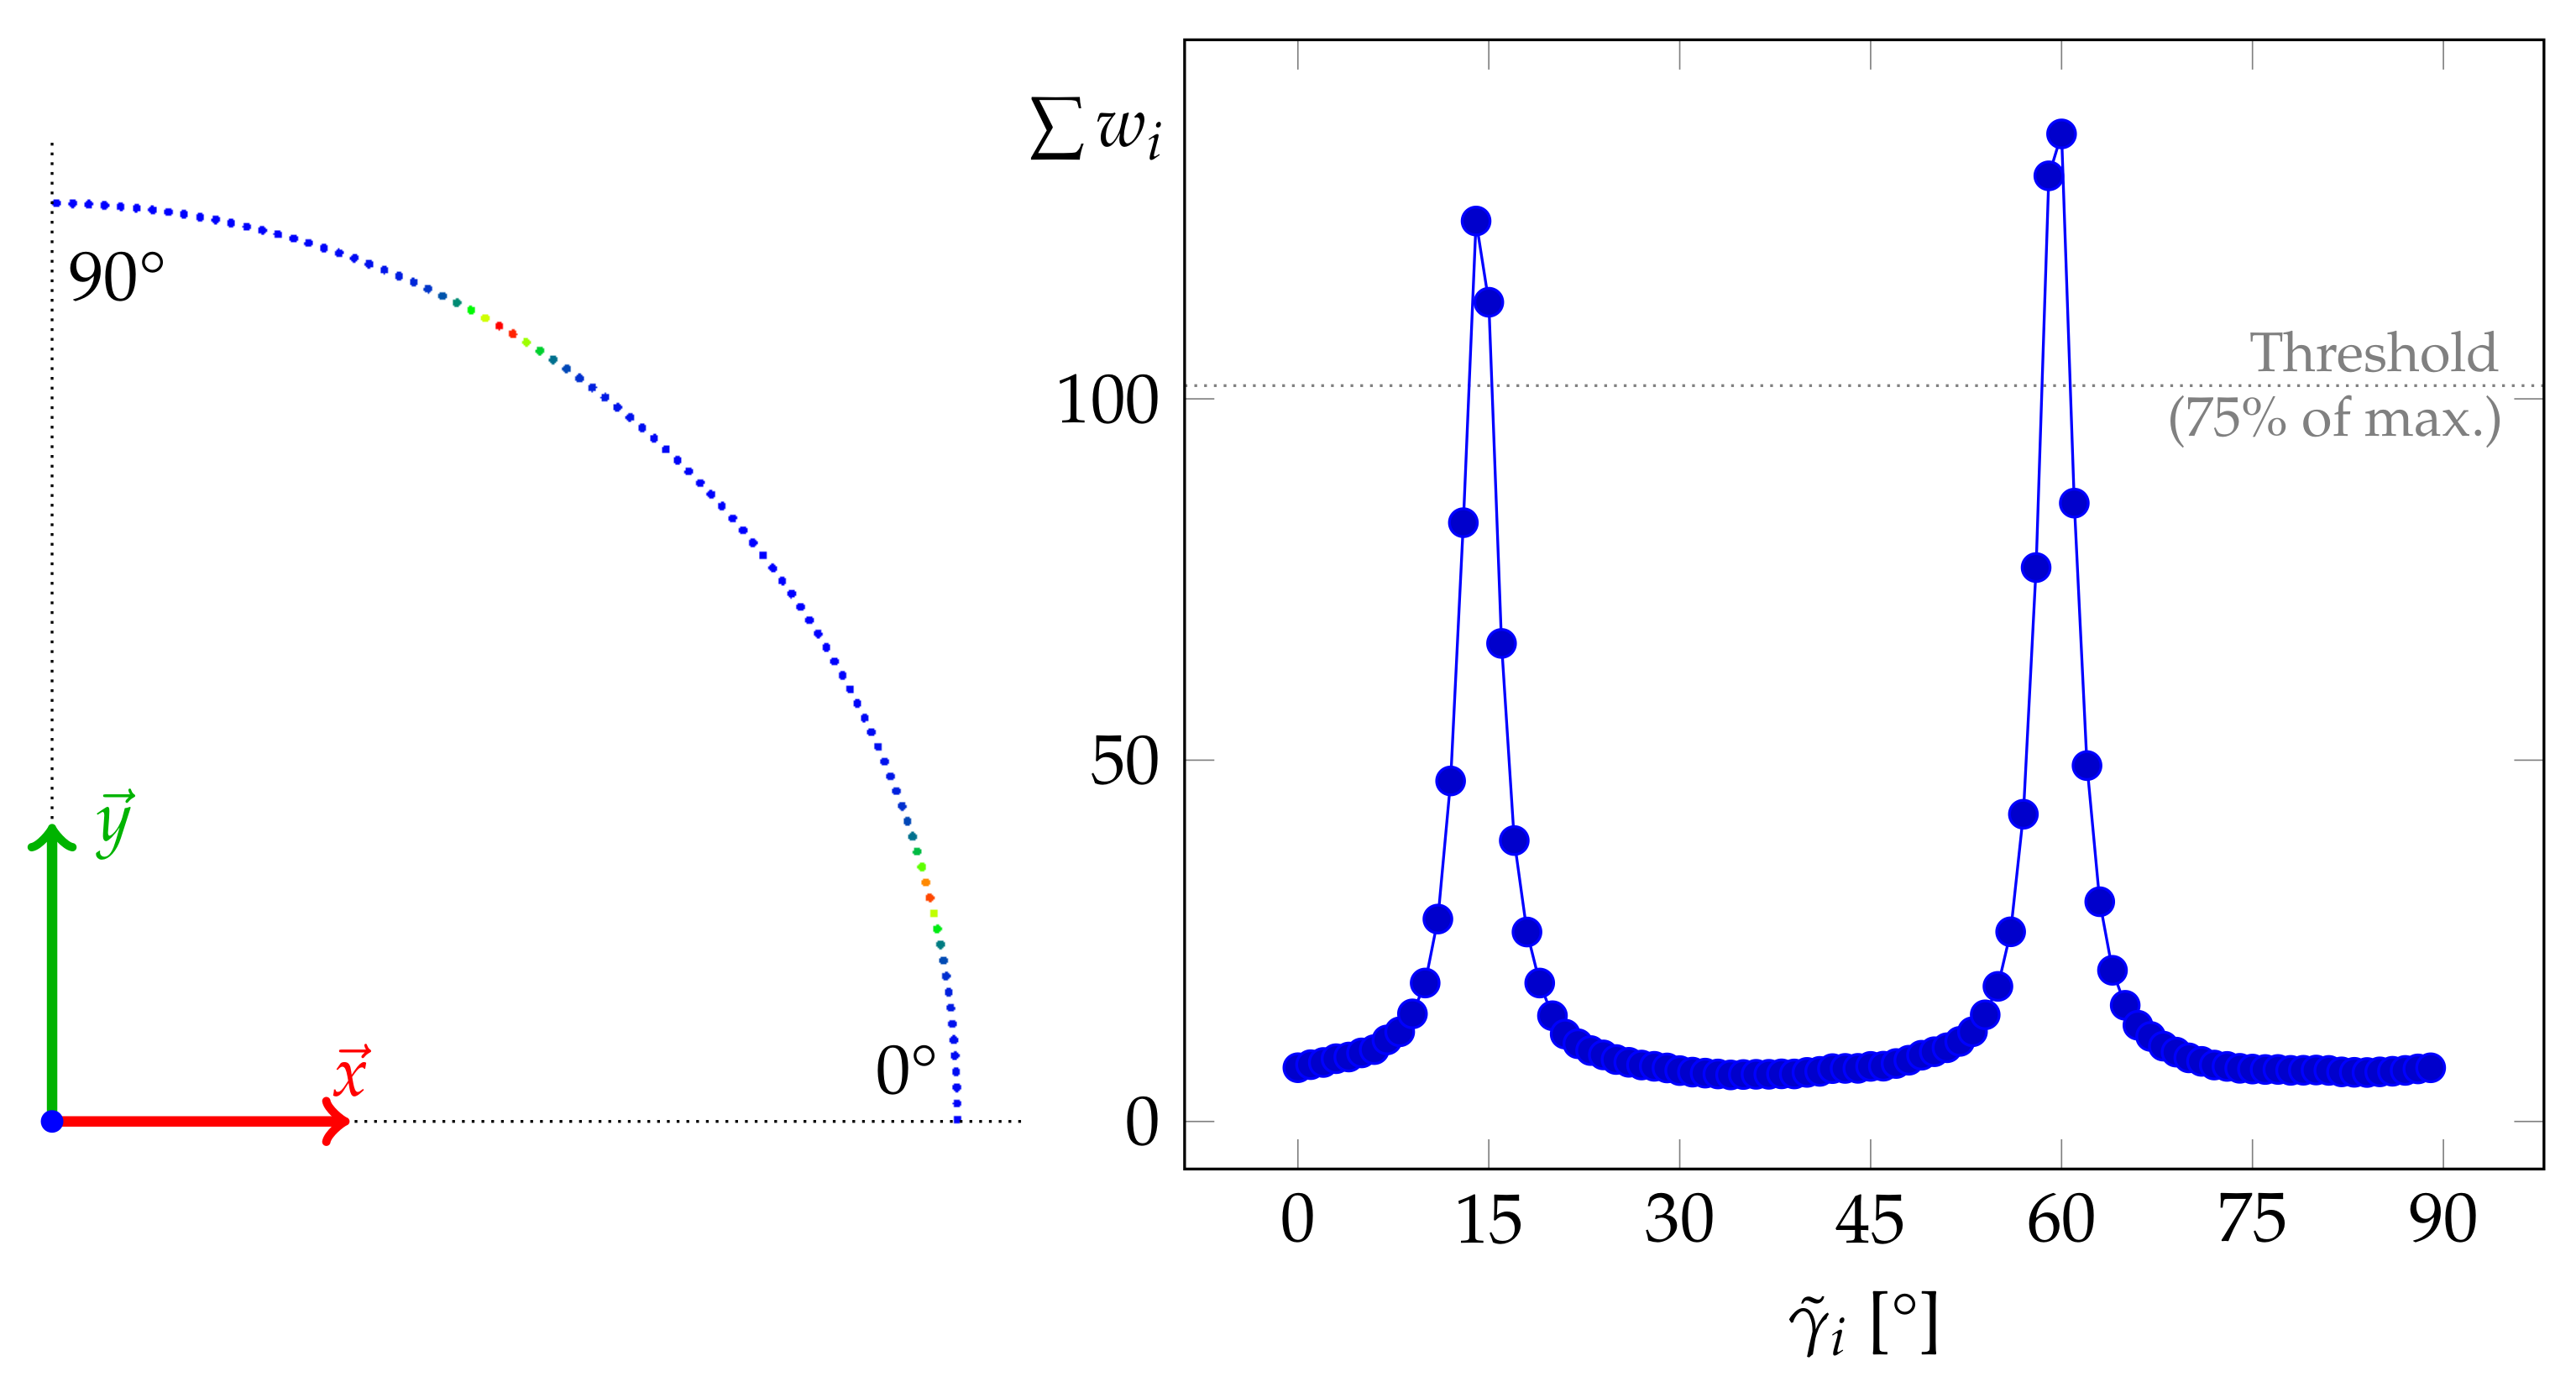
The discretized grid representation of the angles
thus needs only a quarter of the size in comparison to discretizing the angles
with the same resolution. Furthermore, the resulting grid as visualized in
Figure 5 enables the coarse initial determination of the rotation angle
. To this end, the weight sums per grid cell are thresholded with a threshold value of 0.75-times the maximal weight sum of the whole grid and subsequently clustered. While clustering, the fact that clusters can extend over the discontinuity between 0
and 90
needs to be taken into account.
Finally, the grid cell cluster with the largest weight summarized over the contained cells is selected, and
is determined as the weighted average of the angle values corresponding to the cluster cells (with 1
resolution) weighted by their respective weight sum values.
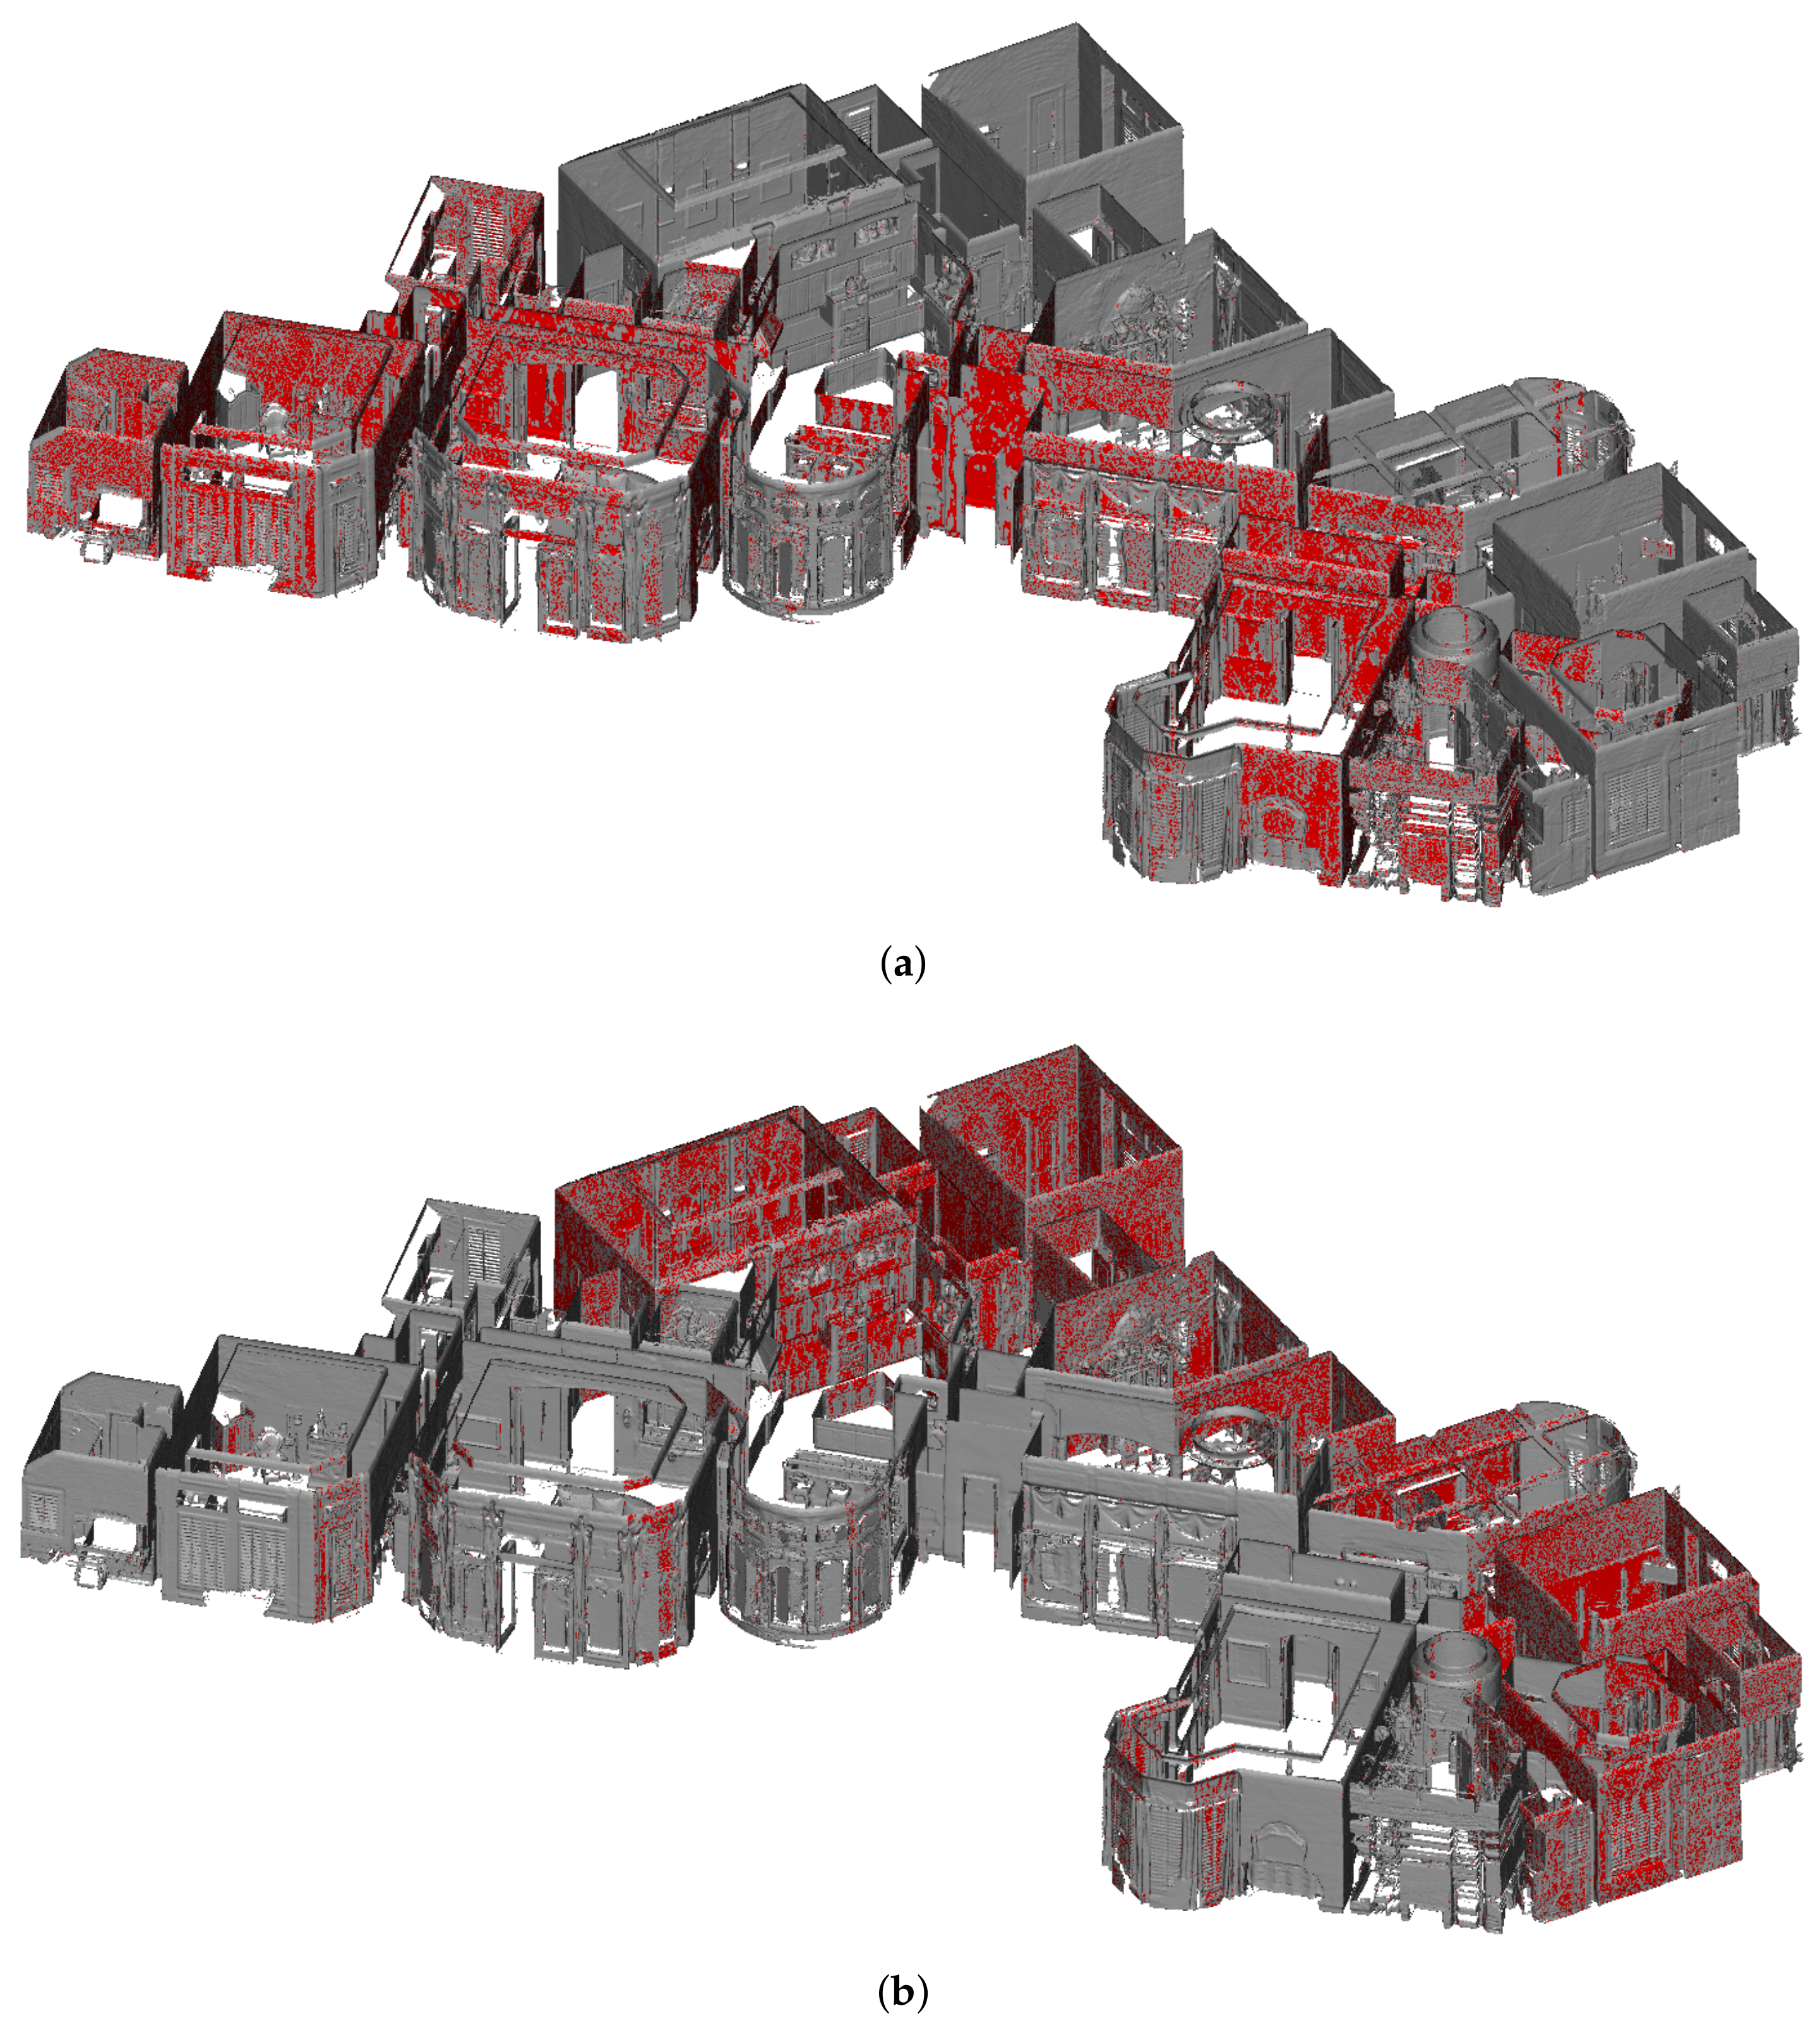
Figure 6a shows the horizontal triangle mesh faces of
Figure 2 corresponding to the largest peak at 60
in
Figure 5 that determines the dominant Manhattan World system of that dataset. The faces corresponding to the second peak at 15
in
Figure 5 are visualized in
Figure 6b.
The resulting value for can subsequently be further refined by determining the weighted median over all within a certain angular distance of the initial value for while applying the weights . A threshold of 5 was found to be suitable for this task.
Finally, the indoor mapping data can be rotated by the thusly refined angle around the vertical axis to achieve the alignment of the building geometry with the horizontal coordinate axes. In the case of a triangle mesh, it is sufficient to rotate the vertices of the triangles, as the respective normal vectors of the rotated triangles can be calculated on the basis of the triangle geometry. In the case of point clouds, however, the respective normal vectors of the points need to be explicitly updated along with the coordinates of the points.
2.2. Orientation of the Vertical Axis
In the preceding
Section 2.1, the rotation around the vertical axis was determined under the assumption that the vertical axis is perfectly leveled with respect to the building structure, i.e., that it is orthogonal to horizontal floor and ceiling surfaces. In the case of tripod-mounted indoor mapping systems such as terrestrial laser scanners, this assumption is justified as these devices are typically leveled before usage. However, in the case of mobile indoor mapping systems such as hand-held or head-worn devices, this is generally not the case. In these cases, the coordinate system of the indoor mapping data is often defined by the initial pose of the mobile mapping device when starting the data acquisition process. In consideration of the typical usage postures of such mobile systems, it can be assumed that the respective vertical axis of the coordinate system is still roughly pointing upwards within the range of ±30
. If this is not the case, a coarse leveling within this range can easily be conducted manually.
To justify the assumption made in the previous section, this section presents an approach for automatically leveling indoor mapping point clouds or triangle meshes where a chosen vertical axis corresponds coarsely within ±30 with the actual upwards direction of the building structure standing orthogonally on horizontal floor surfaces. As in the preceding section, the input data for conducting this alignment of the input mapping data with the coordinate system are again the N normal vectors of the individual geometric primitives comprising the indoor mapping data (i.e., points or triangles).
Analogous to Equation (
5), we can formulate the task of vertically aligning the indoor mapping geometries with the coordinate system axis
as:
where
are the
normal vectors that are vertically oriented within the range:
and
again is a weighting factor, being constant for points of a point cloud, but corresponding to the respective triangle area for the faces of a triangle mesh. Furthermore,
denotes a
rotation matrix determined by two rotation angles
and
around the two horizontal coordinate axes
and
, respectively. Note that in Equation (
9), we use an angular range of
for filtering vertical normal vector directions, which is larger than the assumed range of the coarse initial leveling of the input data within
. This wider angular range was applied because the horizontal building surfaces that are initially leveled within
can have a certain amount of variation in the directions of the respective normal vectors in noisy indoor mapping data, as acquired for instance with the Microsoft HoloLens.
The aim of Equation (
8) is to find the optimal vertical axis
as a vector:
in the initially given coordinate system that has a minimal sum of angles to the vertical normals
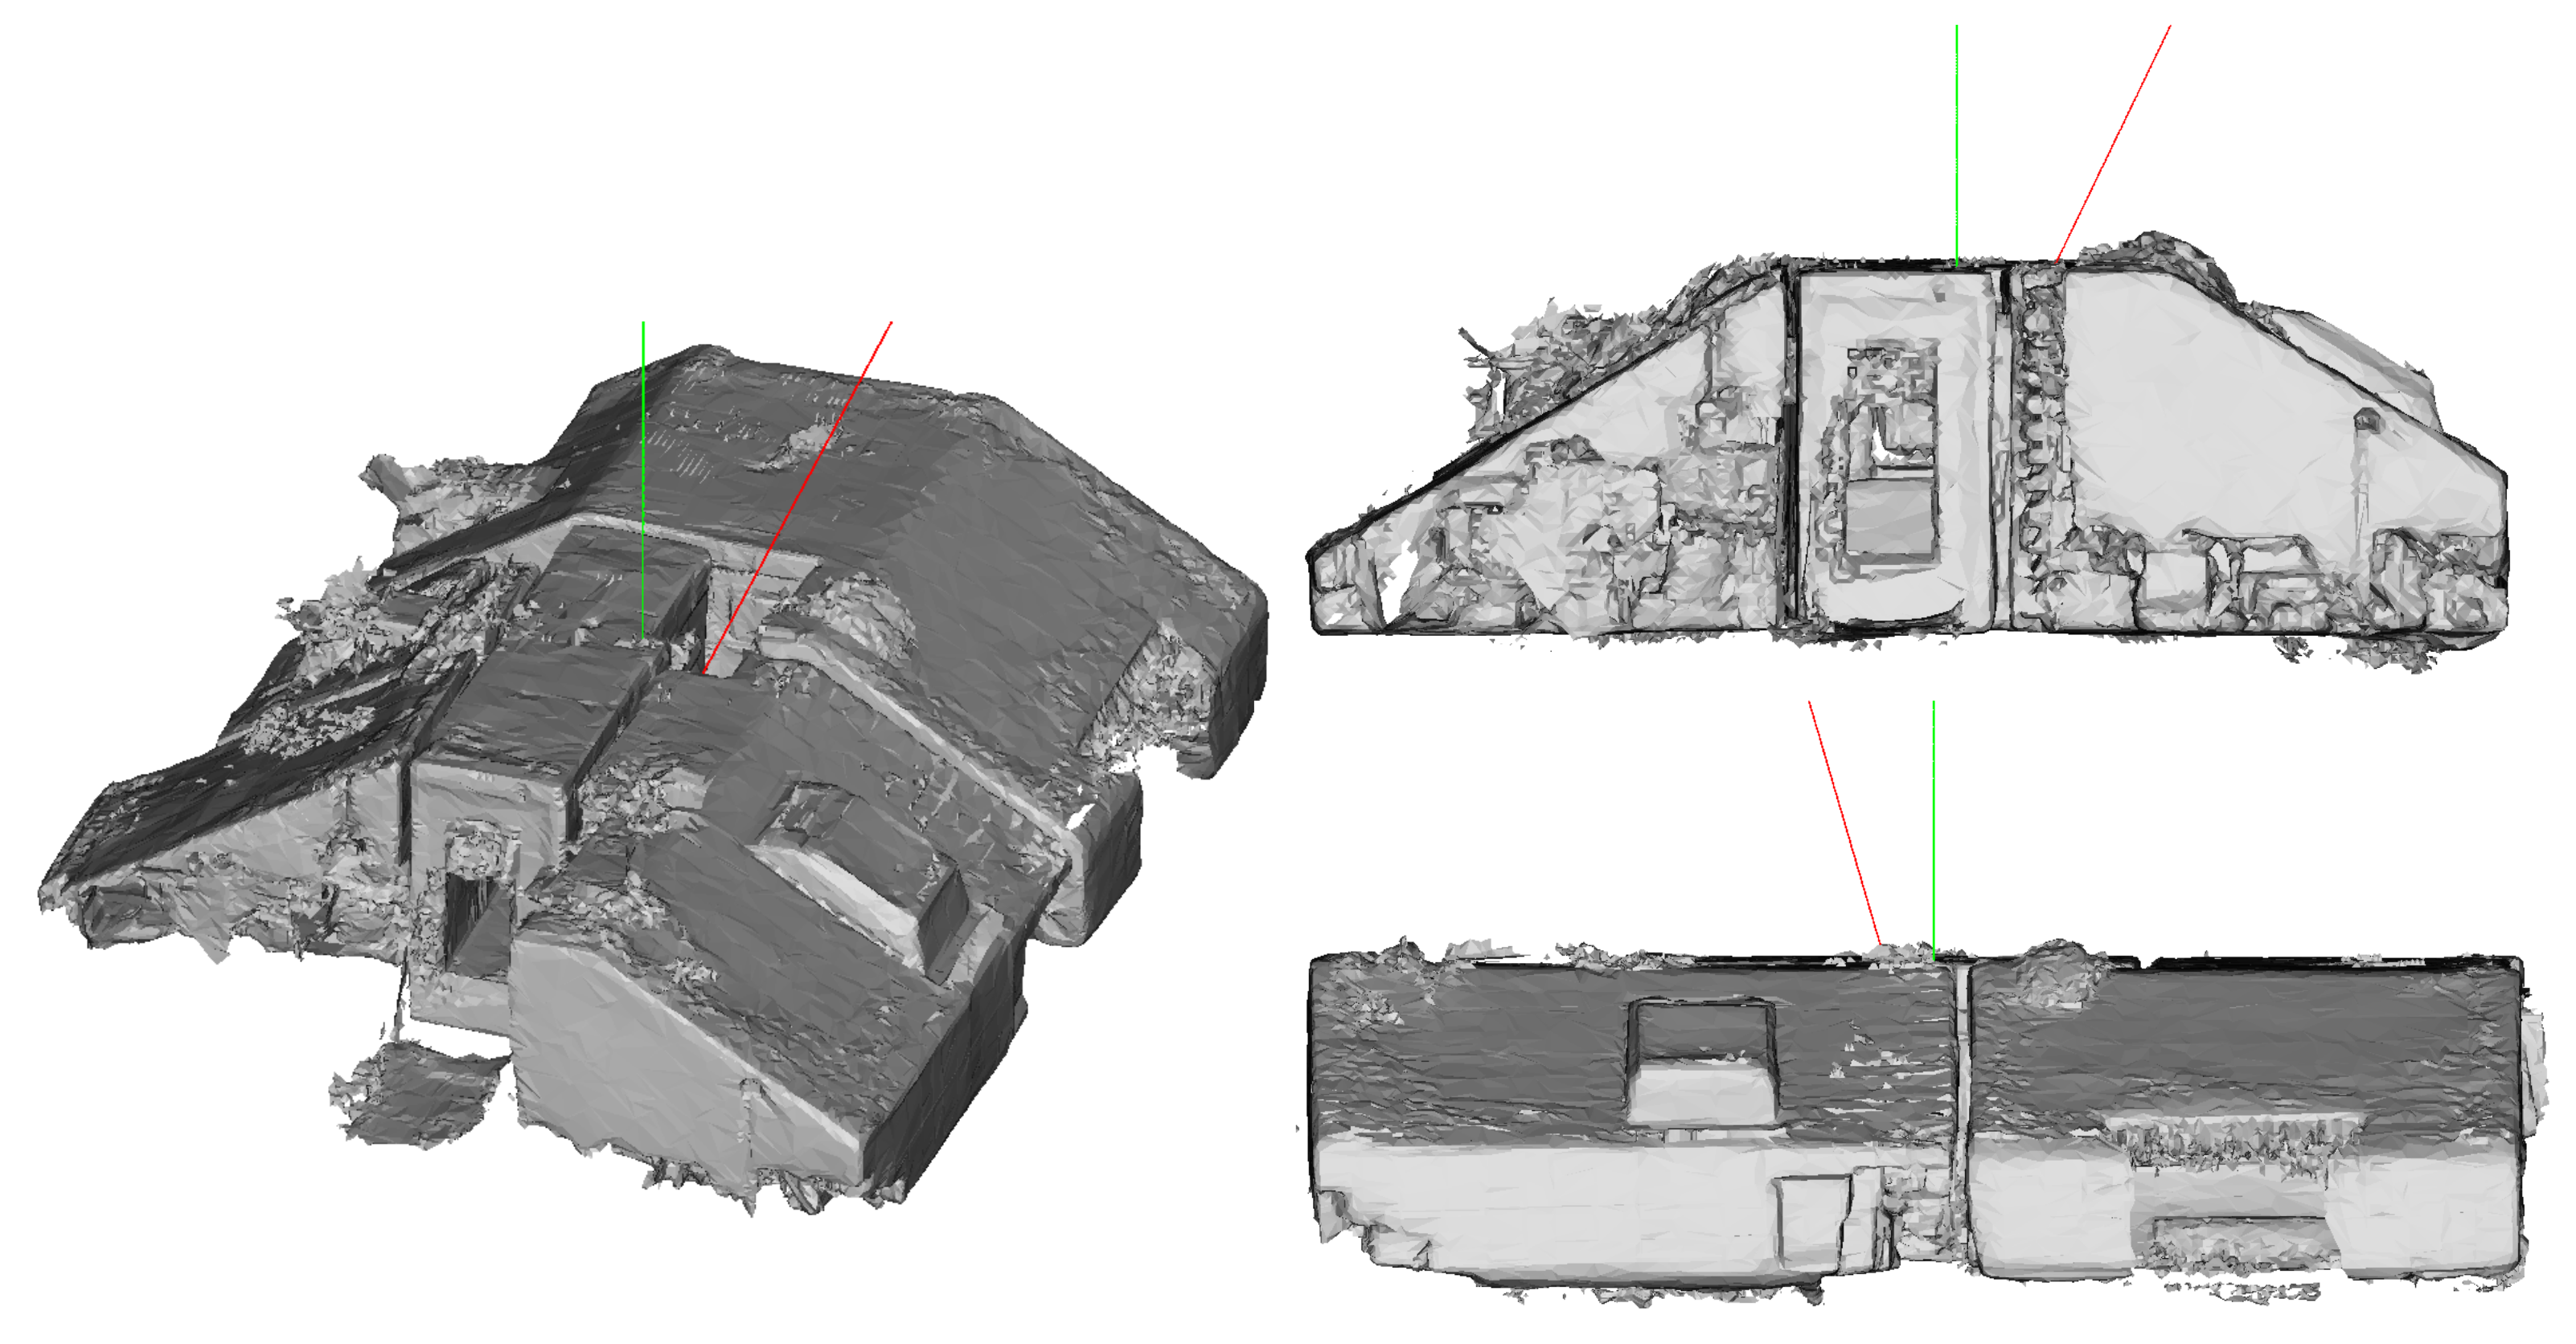
. This optimal vertical axis
, as well as the initial vertical axis
are exemplarily depicted in
Figure 7 for a building with slanted ceilings only coarsely aligned with the actual vertical direction.
As already was the case with Equation (
5) in
Section 2.1, Equation (
8) is not analytically solvable. Solving Equation (
8) numerically is even more inefficient than in the case of Equation (
5), as here, a two-dimensional minimization is concerned. Thus, as in the case of determining the rotation angle around the vertical axis in
Section 2.1, we again sought to formulate the problem at hand as the task of searching a maximum peak within a discrete grid representation of the relevant input elements.
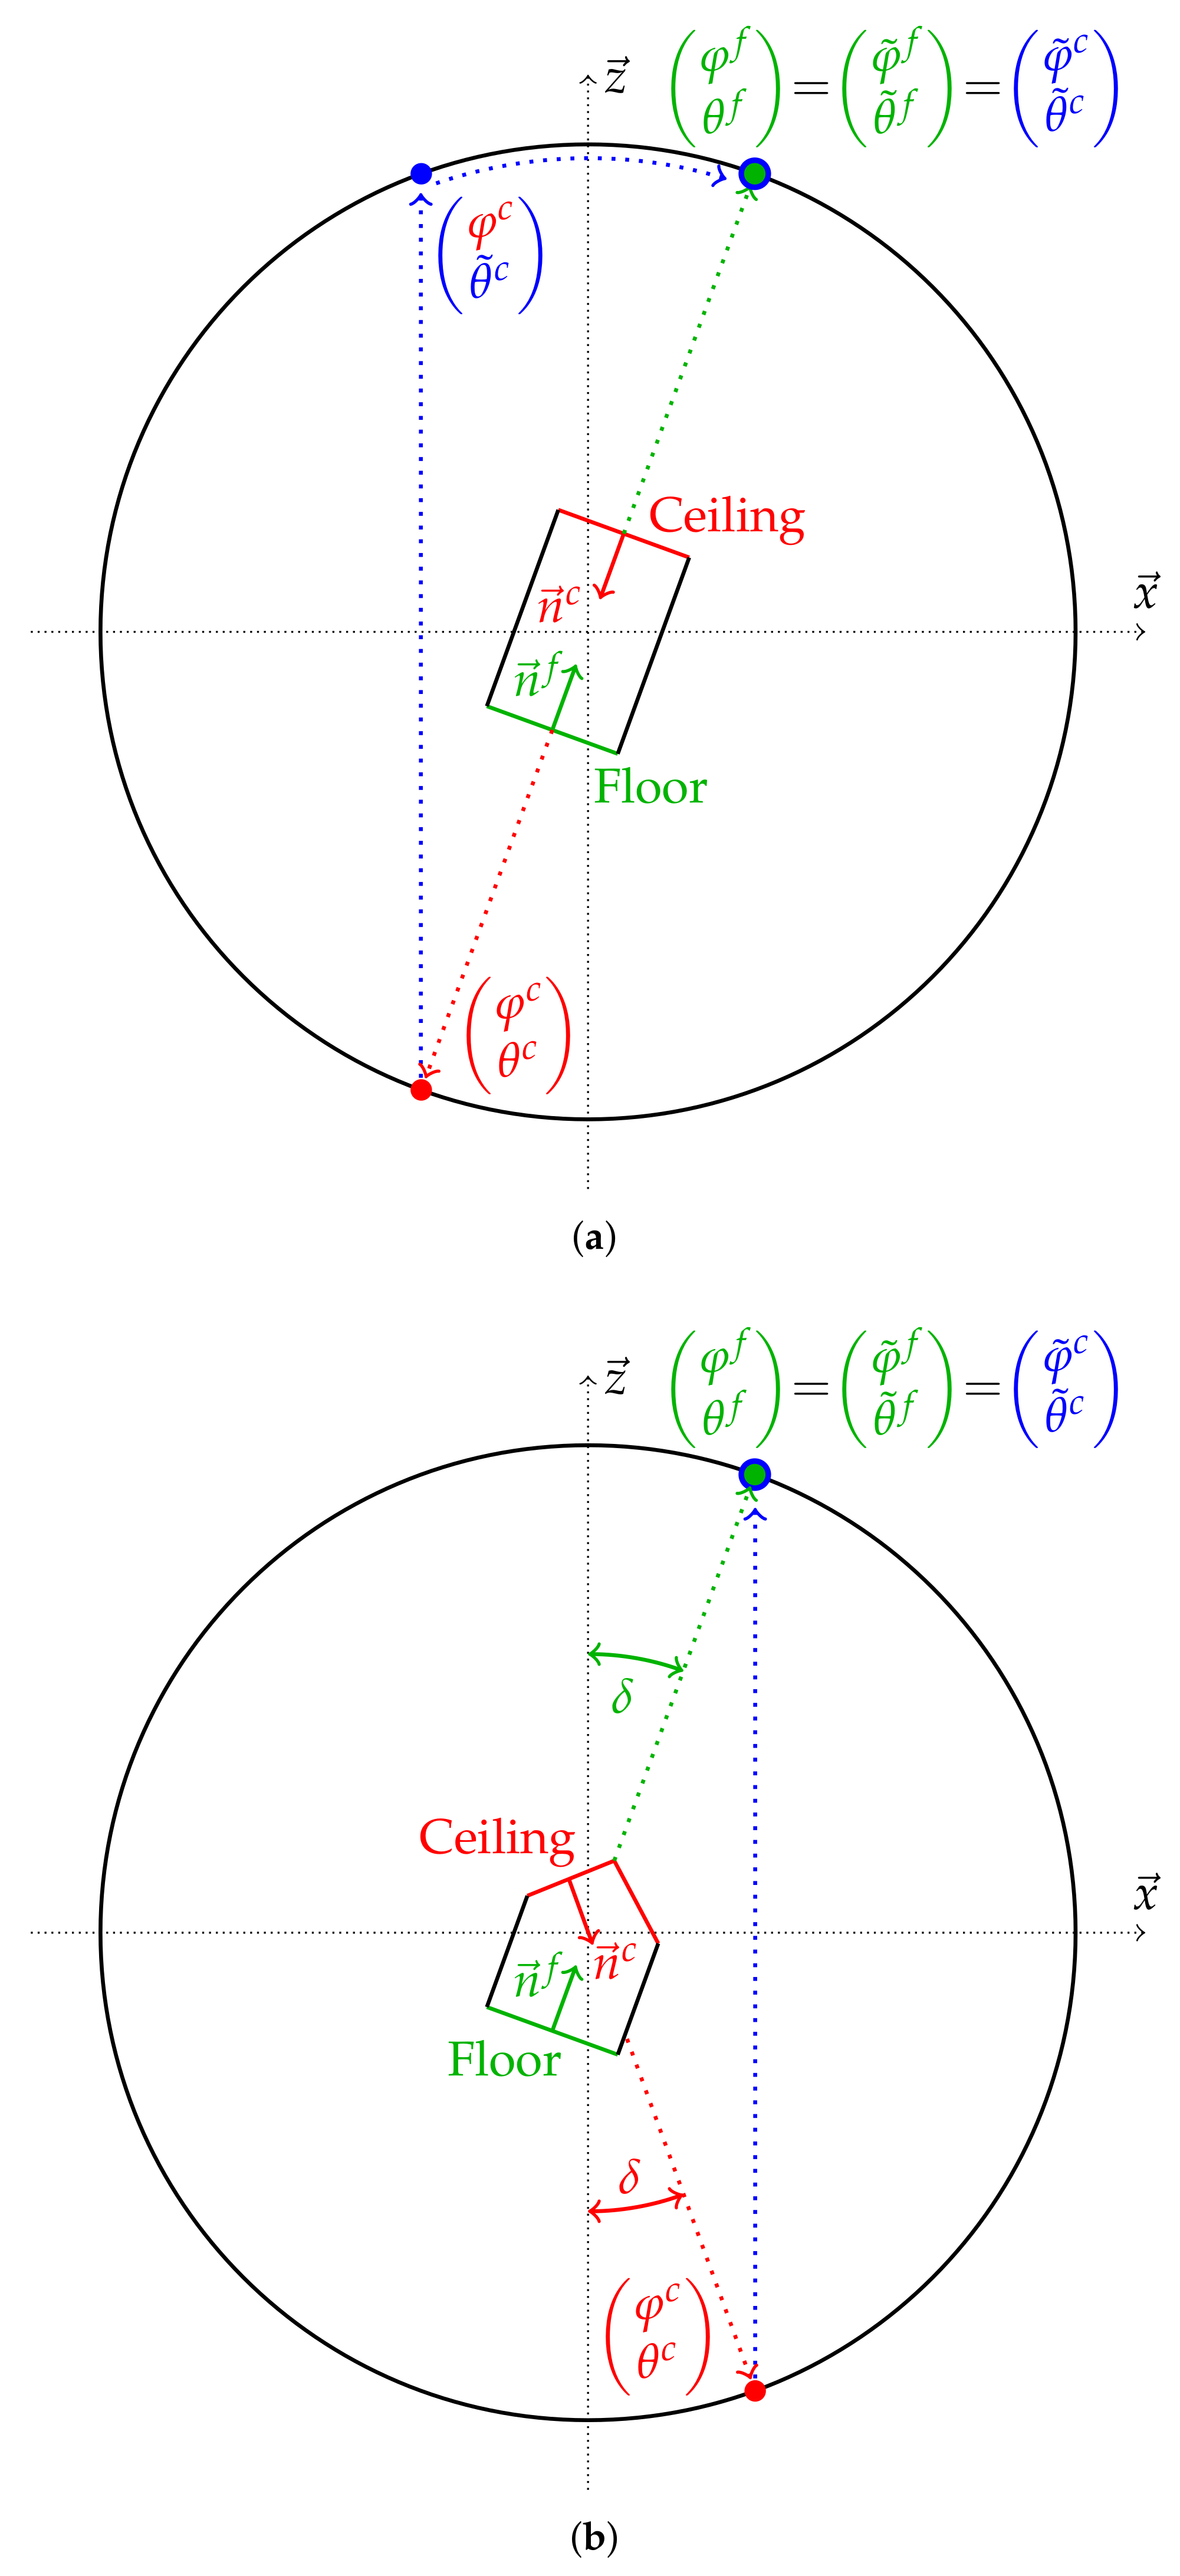
The relevant input elements in this case are the three-dimensional vertical normal vectors . However, the problem at hand is actually two-dimensional, as a rotation around the two horizontal axes and by the rotation angles and is sufficient for aligning the vertical axis with the optimal vertical direction .
In an alternative formulation, this can also be considered as the task of finding the position of the optimal vertical direction
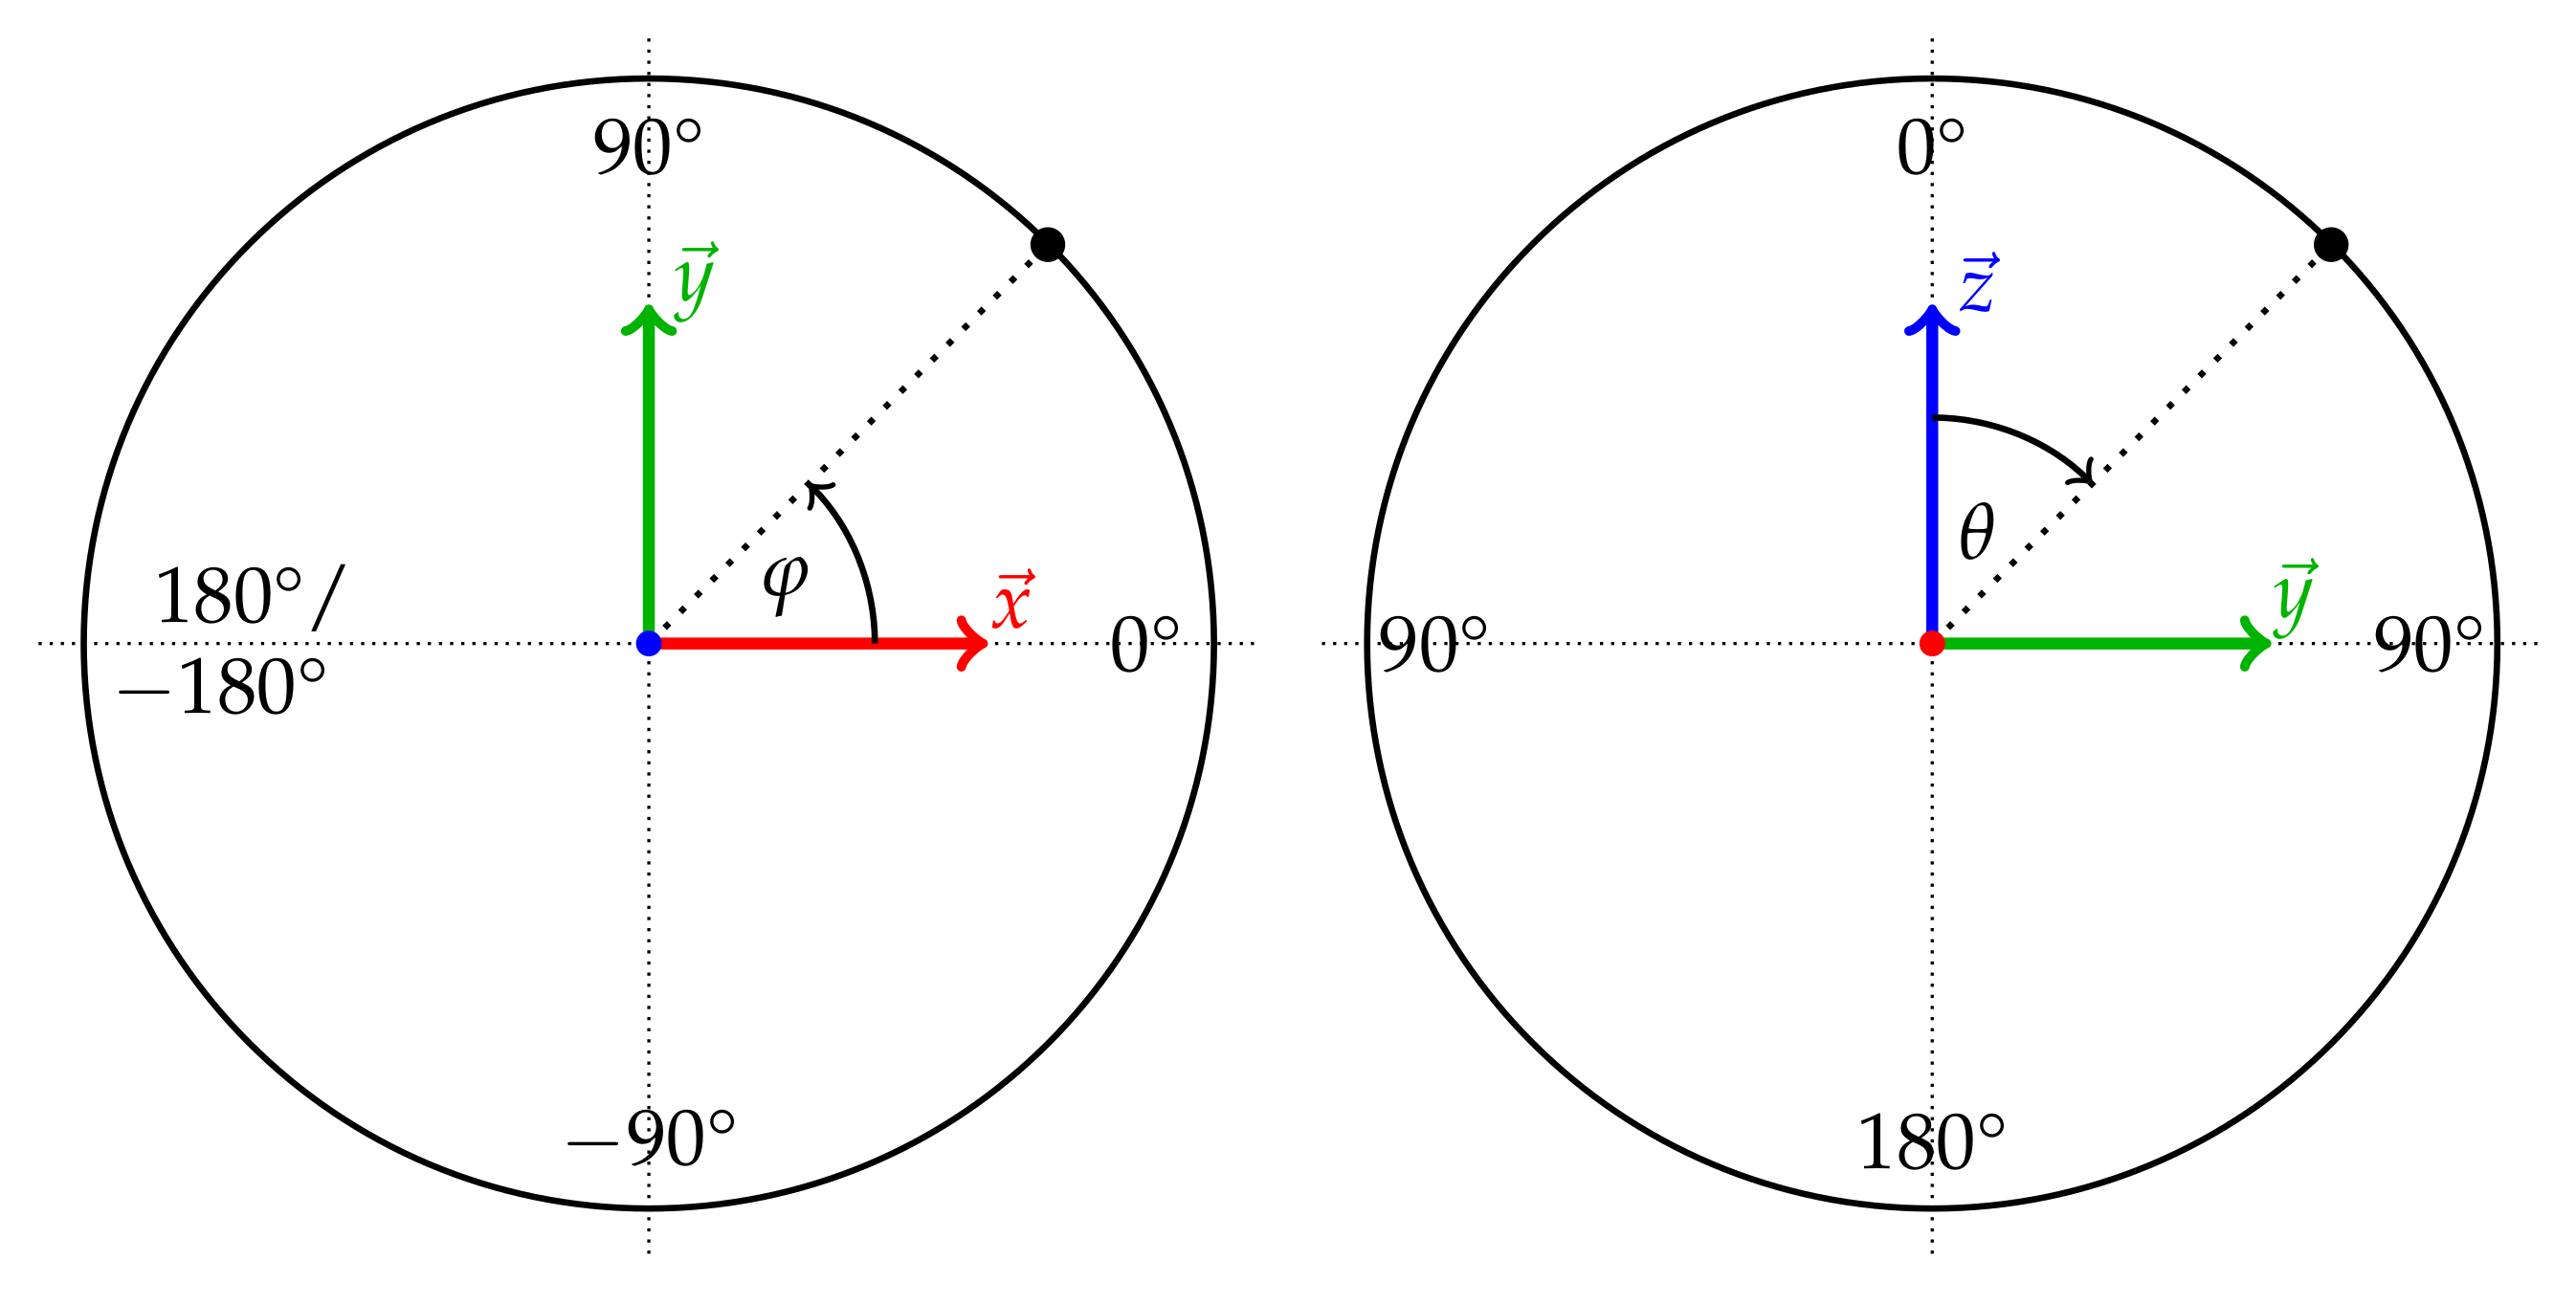
on the surface of a unit sphere, i.e., within the extended Gaussian image. The orientation of a normal vector with respect to the coordinate system can be expressed via the polar angles’ azimuth:
and inclination:
indicating the position of a respective normal vector
on the unit sphere. The definition of the azimuth and inclination with respect to the coordinate system is further illustrated in
Figure 8.
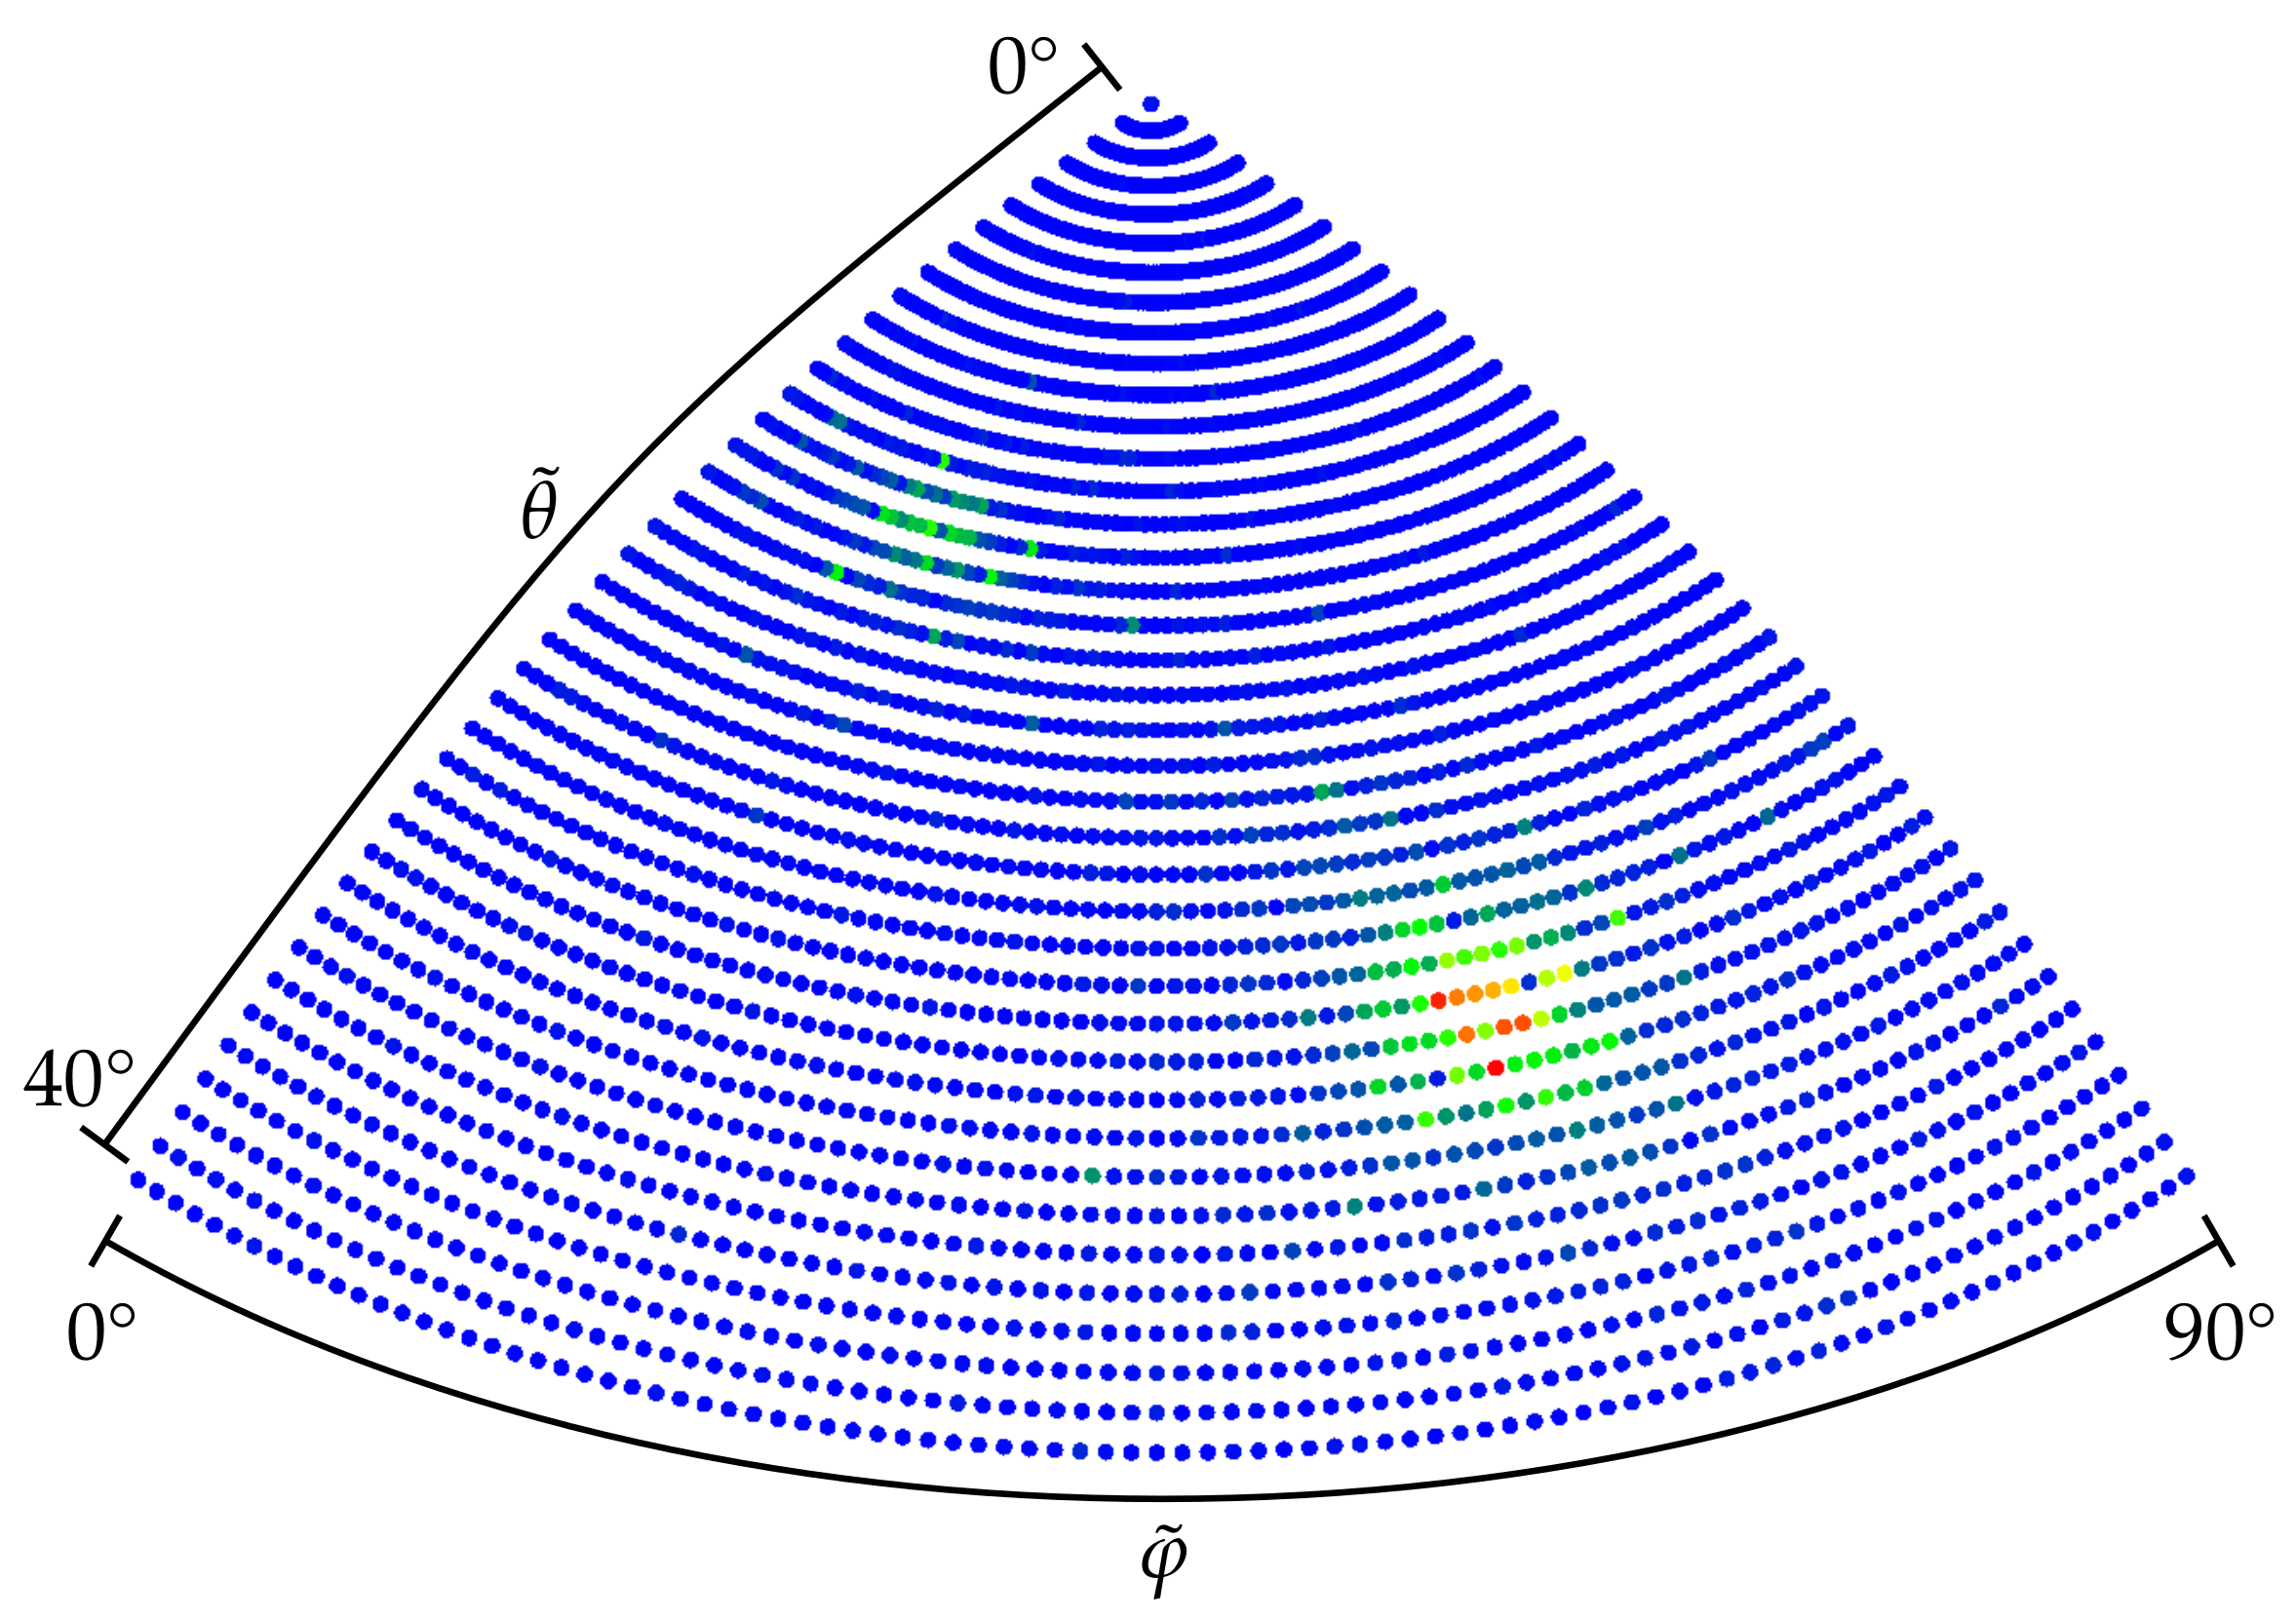
This representation allowed us to construct a two-dimensional azimuth/inclination grid analogous to the approach presented in
Section 2.1, whose cells are weighted by the summarized weights
of the contained normal vectors
. Such a grid of a resolution of 1
extending over the whole unit sphere is depicted in
Figure 9, corresponding to the exemplary case presented in
Figure 7.
As before in
Section 2.1, we wanted to transform this grid over the full range of the sphere surface to a smaller grid where the weights of cells pertaining to opposing normal vectors become accumulated. This is achieved by:
and:
while restricting the extension of the grid in the dimension of the inclination to the range of
and, thus, only considering the vertical normal vectors
. A schematic visualization of this transformation is depicted in
Figure 10a, while
Figure 11 shows the resulting two-dimensional azimuth/inclination grid corresponding to the dataset presented in
Figure 7.
Subsequently, peaks with cell grid weights above a threshold of 75% of the highest weight value are again clustered as in the case of the one-dimensional grid of
Section 2.1. While doing so, however, not only the azimuth discontinuity between 0
and 90
needs to be considered, but also the pole point at a 0
inclination, where all azimuth values merge into one and the same grid cell.
While in the case of the one-dimensional grid of
Section 2.1, the grid cell indices could be directly mapped to the angles by multiplication with the grid resolution, here, it is not possible to infer the direction of the optimal vertical axis from grid cell indices as the transformed azimuth values
are ambiguous by multiples of 90
. This ambiguousness also exists in
Section 2.1. However, it did not affect the correctness of the resulting horizontal alignment, as the case here.
Thus, to be able to deduce correct directions from peaks in the two-dimensional grid, the respective normal vectors
need to be hashed per grid cell. Therefore, the correct direction of the vertical axis can be initialized by a weighted average of all the hashed normal directions weighted by their respective
value of the cluster with the largest summarized weight. In doing so, normal vectors pointing downwards need to be corrected by inverting the direction to point upwards when calculating the weighted average vector. As in
Section 2.1, the initial result is further refined by a weighted median of all normal vectors within ±5
of the coarsely determined resulting vertical axis.
Besides the need to deduce the correct direction from the detected maximum peak grid cells, there is a second reason to hash normal directions per grid cell. As illustrated in
Figure 10b, two normal vectors that are oriented by the same angle around the vertical axis
in a way that the axis
is the angle bisector between both normals become projected to the same
grid cell by Equations (
13) and (
14). On the one hand, this can distort the weight sums of the individual grid cells that are used for peak detection. On the other hand, the presence of normal vectors with deviating orientations beyond the ambiguity of ±180
between opposing surfaces can severely distort the initial determination of the vertical direction from the largest peak in the grid.
For this reason, a cluster analysis was conducted among the hashed normal vectors per grid cell. In doing so, all the normal vectors in a grid cell are assigned to clusters. A normal vector can be assigned to an existing cluster if its direction coincides within ±2 with the average direction of the cluster (with the consideration of an ambiguity of ±180). Else, the respective normal vector initializes a new cluster. Finally, for each grid cell, only the largest cluster of normals is retained, while the others are discarded. The grid cell weights and the hashed normal vectors are adapted accordingly.
2.3. Unambiguousness of the Rotation around the Vertical Axis
The alignment of indoor mapping point clouds or triangle meshes along the coordinate axes as described in the preceding
Section 2.1 and
Section 2.2 is ambiguous with respect to a rotation around the vertical axis by multiples of 90
. This is per se not a problem, as the aim of the presented approach is to align the indoor mapping data with respect to their Manhattan World structure, which inherently implies this ambiguity of four possible rotations around the vertical axis, i.e., all four possible result poses are equally valid in hindsight for the stated aim.
However, in some situations, it can be desirable to derive an unambiguous pose of the indoor mapping data. For instance, this can be the case when multiple indoor mapping results of the same building environment are to be aligned by the proposed method. These multiple datasets of the same building can, e.g., be obtained by different indoor mapping systems or be acquired at different times in the context of change detection.
For this reason, we present a simple method for resolving the ambiguity in the rotation around the vertical axis by reproducibly choosing one of the four possible horizontal orientations. The proposed method presents a straightforward solution that does not require any semantic interpretation of the indoor mapping data or any elaborate analysis. It can however fail in cases of building layouts that are highly symmetric with respect to the four inherent Manhattan World directions. We furthermore presupposed that two datasets to be aligned unambiguously by this method cover approximately the same section of an indoor environment. If this is not the case, an approach that incorporates semantic knowledge of the represented indoor environment would be more promising. In this context, constellations of detected openings such as doors or windows could, for instance, be used.
Currently, however, we propose to resolve the unambiguousness between the four possible horizontal orientations by first aligning one of the two possible horizontal Manhattan World directions with the chosen reference axis that corresponds to a larger extent of the bounding box of the respective dataset in this horizontal direction, i.e., the longer horizontal edges of the bounding box should be parallel with the axis. This is quite straightforward, but can fail in cases where the bounding box is nearly quadratic.
The ambiguity is now reduced to a rotation of 180. To resolve this, we propose to consider the weighted count of indoor mapping geometries in both proximal 10% sections of the bounding box in the direction and to choose the rotation for which the proximal 10% section of the bounding box pointing towards the positive axis has the higher weight sum. In this context, the indoor mapping geometries are again weighted by a constant in the case of points of point clouds and by the triangle area in the case of triangle mesh faces. This approach will fail when the amount of mapped indoor structures in both proximal sections of the bounding box along the axis are about equal.
2.4. Evaluation Method
Quantitatively evaluating the proposed method is fortunately quite straightforward, as ground truth data can be easily obtained. If an indoor mapping dataset is not already correctly aligned with the coordinate system axes in the sense of the aim of this study, it can be aligned manually without great effort. A thusly aligned dataset can then be rotated to an arbitrary pose within the defined range applicable for the presented method. For this, a ground truth rotation matrix is created, determined by the rotation angles around the horizontal axes and , respectively, and an arbitrary rotation around the vertical axis . To create , the rotation by around the vertical axis is applied first and then successively the rotations by and around the respective horizontal axis.
Finally, the method presented in
Section 2.1 and
Section 2.2 is applied to the rotated dataset, which should return the rotated dataset back to its aligned state. The resulting
rotation matrix
is constituted by:
where first
is determined by aligning the rotated dataset vertically with the vertical axis as described in
Section 2.2, and subsequently, the rotation
around the vertical axis is determined as described in
Section 2.1.
As an evaluation metric, the angular difference
between the vector of the ground truth axis
and the resulting vector:
is determined by:
as well as the analogous angular difference
for the horizontal axis
. In case of horizontal deviation
, the ambiguity of valid rotations around the vertical axis by multiples of 90
needs to be considered. To this aim, we iteratively applied:
until
.
The proposed evaluation metrics and can be determined for multiple randomly chosen rotations within the mentioned ranges of for the horizontal axes and for the vertical axis in sufficient quantity to allow for a statistical analysis.
2.5. Used Materials
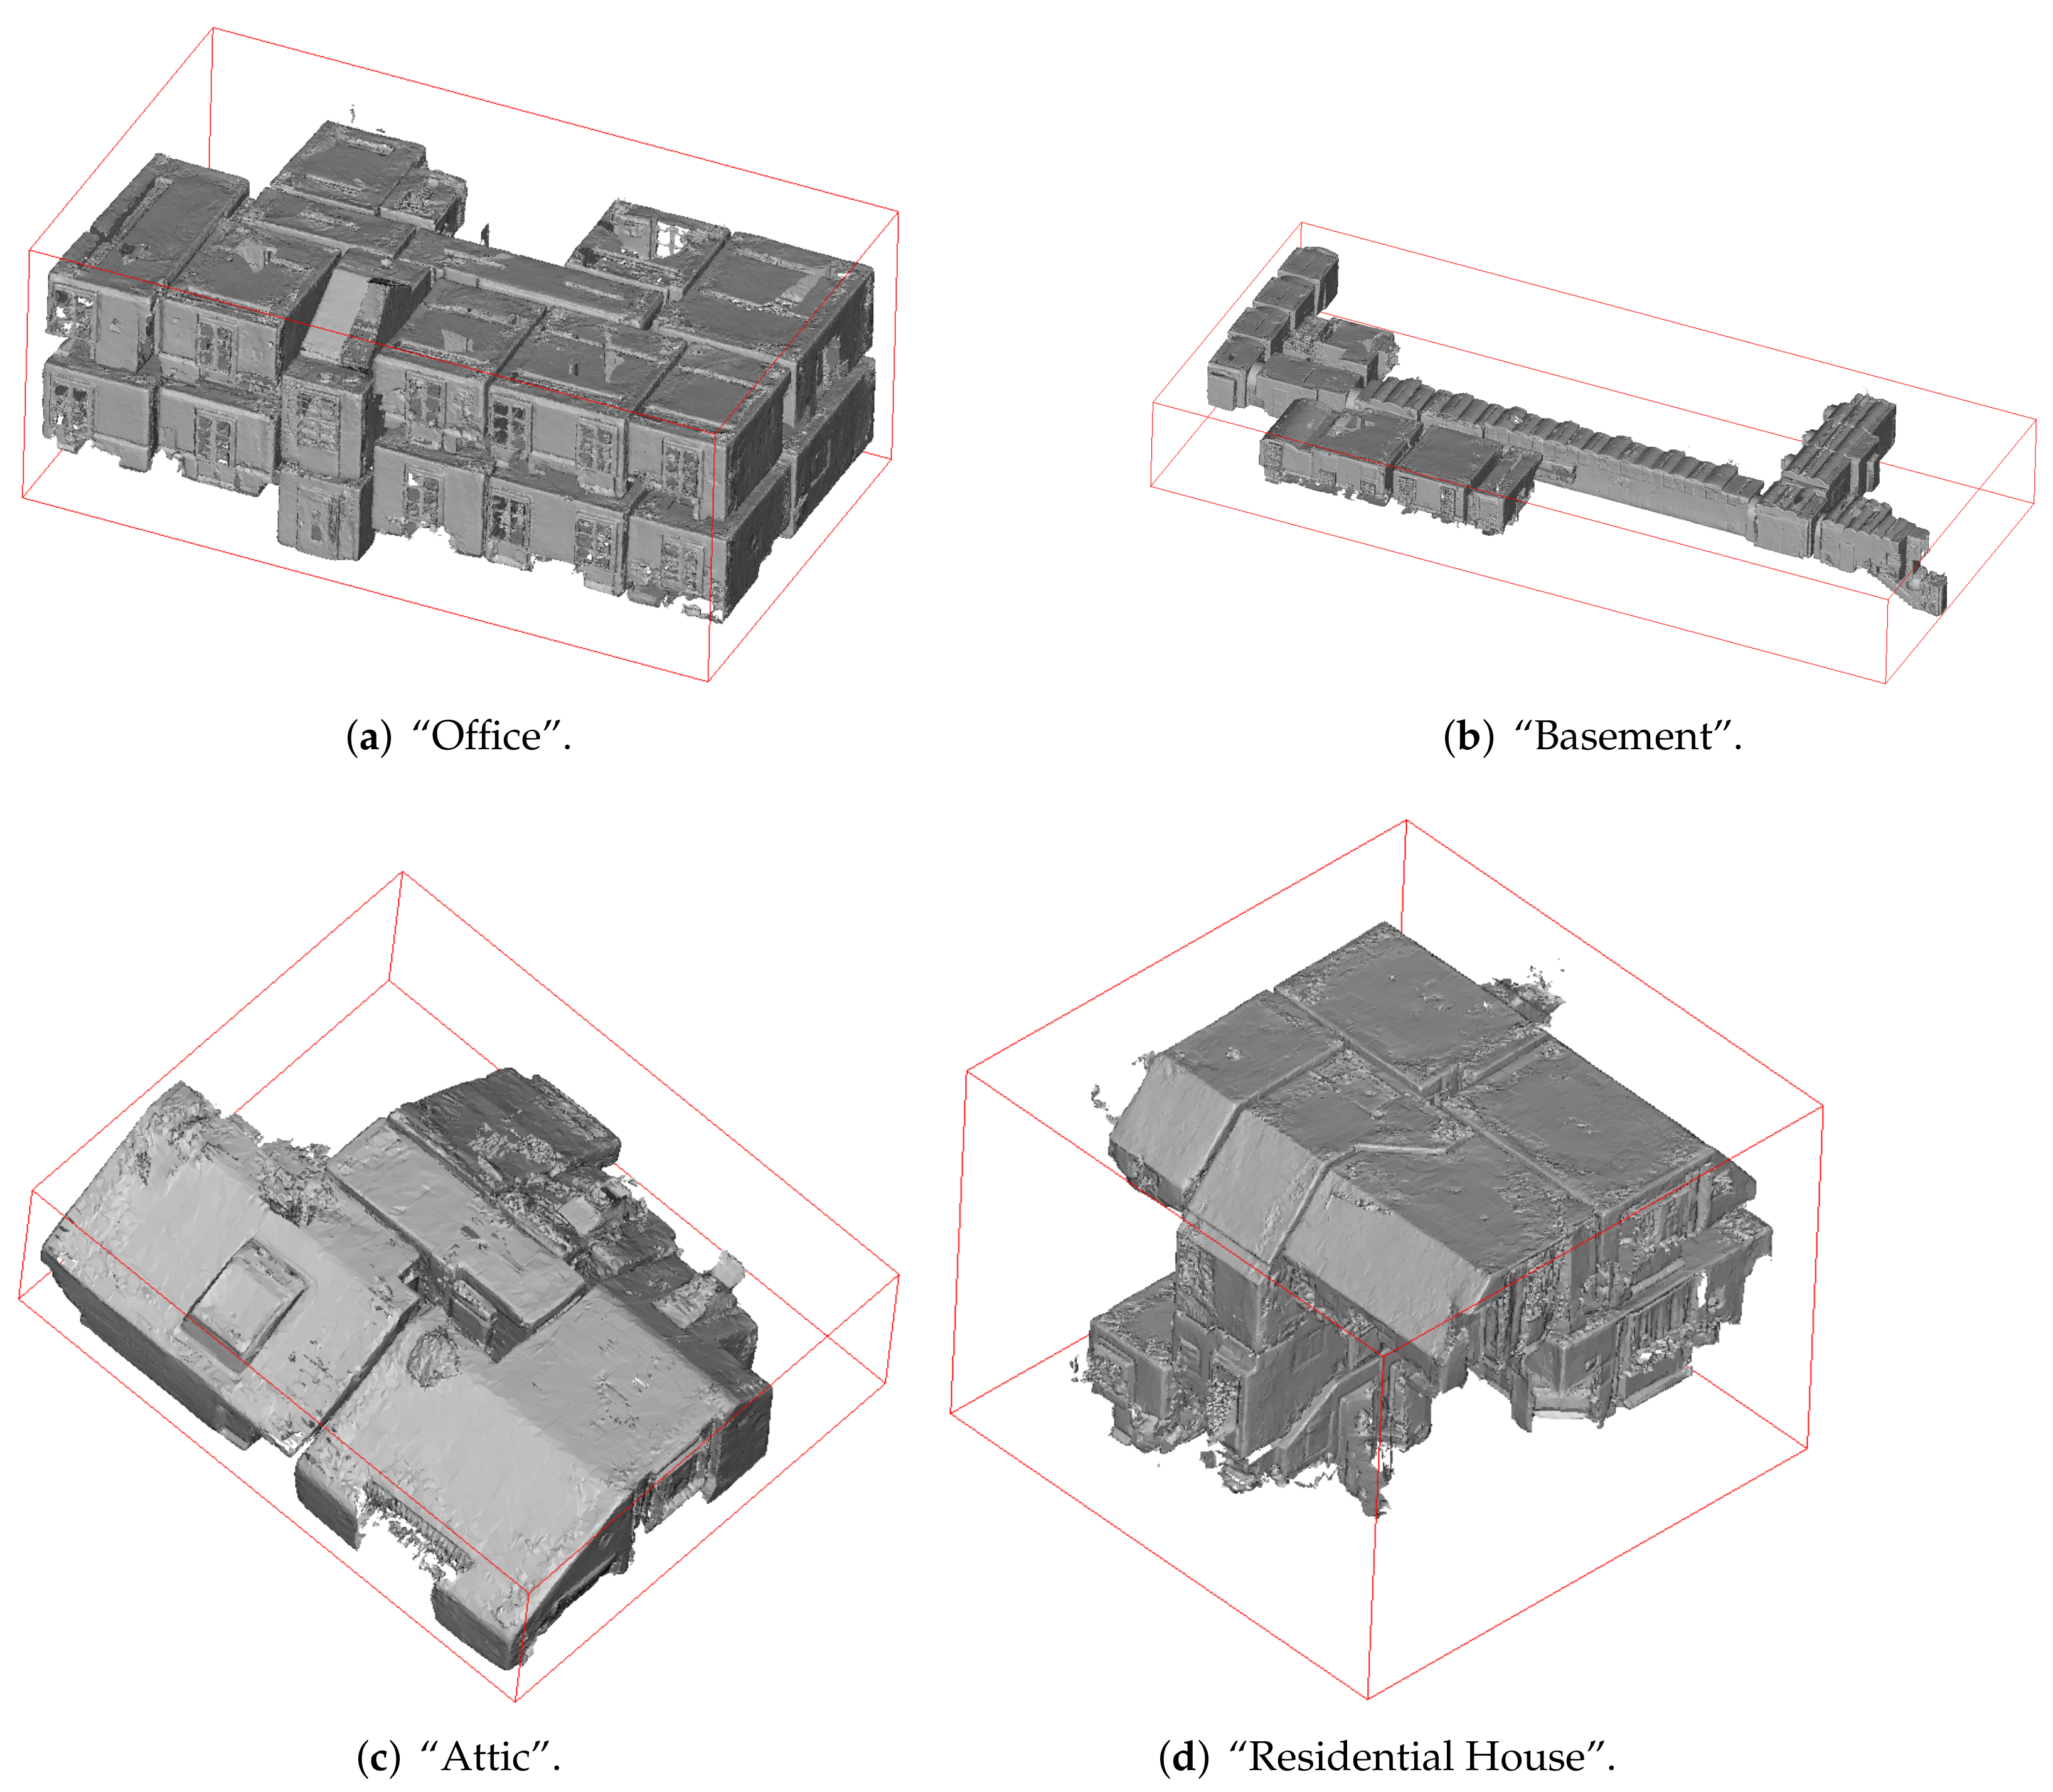
For evaluation purposes, a range of different publicly available datasets of varying complexity were considered. Firstly, the four triangle meshes of the dataset presented in [
31] were used to this aim. These triangle meshes are depicted in
Figure 12 along with 3D bounding boxes indicating their respective ground truth pose. They were acquired by means of the augmented reality headset Microsoft HoloLens, providing coarse triangle meshes of its indoor environment. In studies evaluating this device for the use case of indoor mapping, its triangle meshes were found to be accurate in the range of a few centimeters in comparison to ground truth data acquired by a terrestrial laser scanner [
92,
93,
94].
The poses in relation to the local coordinate system of these datasets as they are published were determined by the pose-normalization procedure presented here. Thus, for evaluation purposes, we manually aligned the datasets with the axes of the local coordinate system and used these manually derived poses as the ground truth within the scope of the evaluation presented here.
All four represented indoor environments show a clearly defined Manhattan World structure. While the dataset “Office” has mostly horizontal ceiling surfaces with the exception of the stairwell, the datasets “Attic” and “Residential House” datasets have slanted ceiling surfaces. The dataset “Basement”, on the other hand, shows a range of different barrel-shaped ceilings.
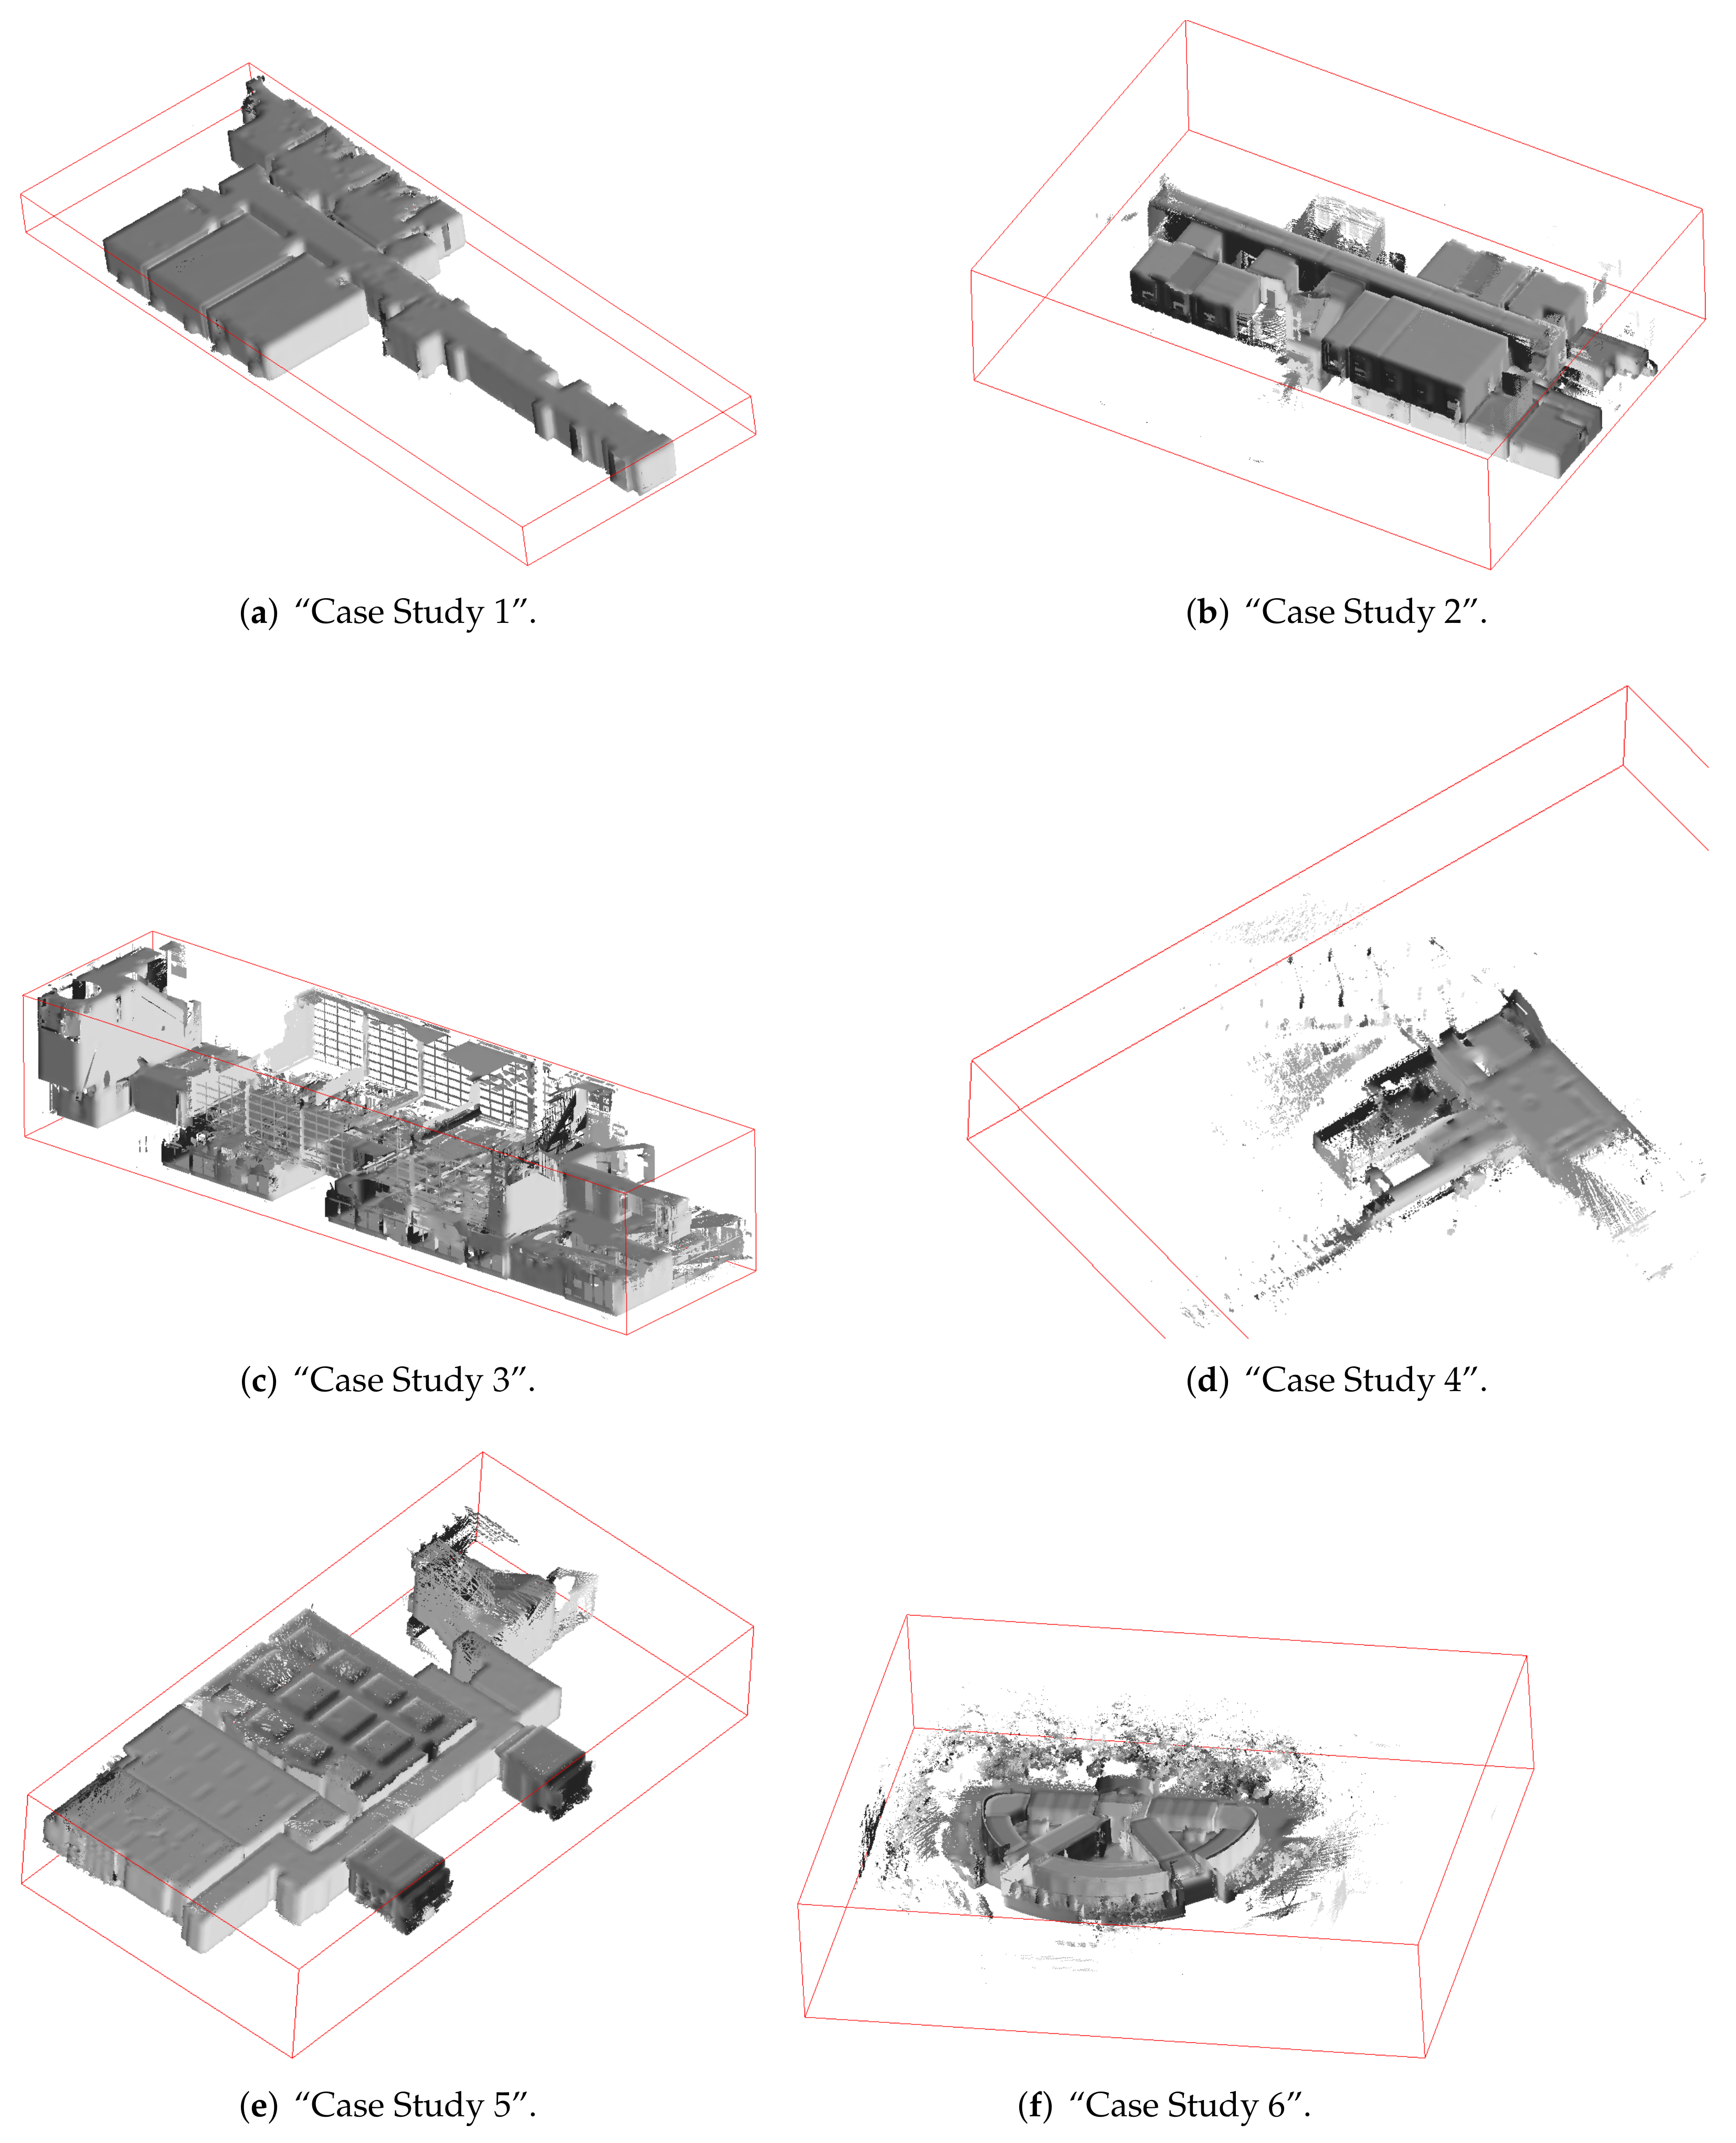
Furthermore, the six indoor mapping point clouds of the ISPRS Indoor Modeling Benchmark dataset presented in [
95,
96] were used for evaluation purposes. These point clouds as visualized in
Figure 13 were acquired by means of different indoor mapping systems with a broad variety of sensor characteristics regarding accuracy and noise. Furthermore, the represented indoor environments are characterized by varying amounts of clutter.
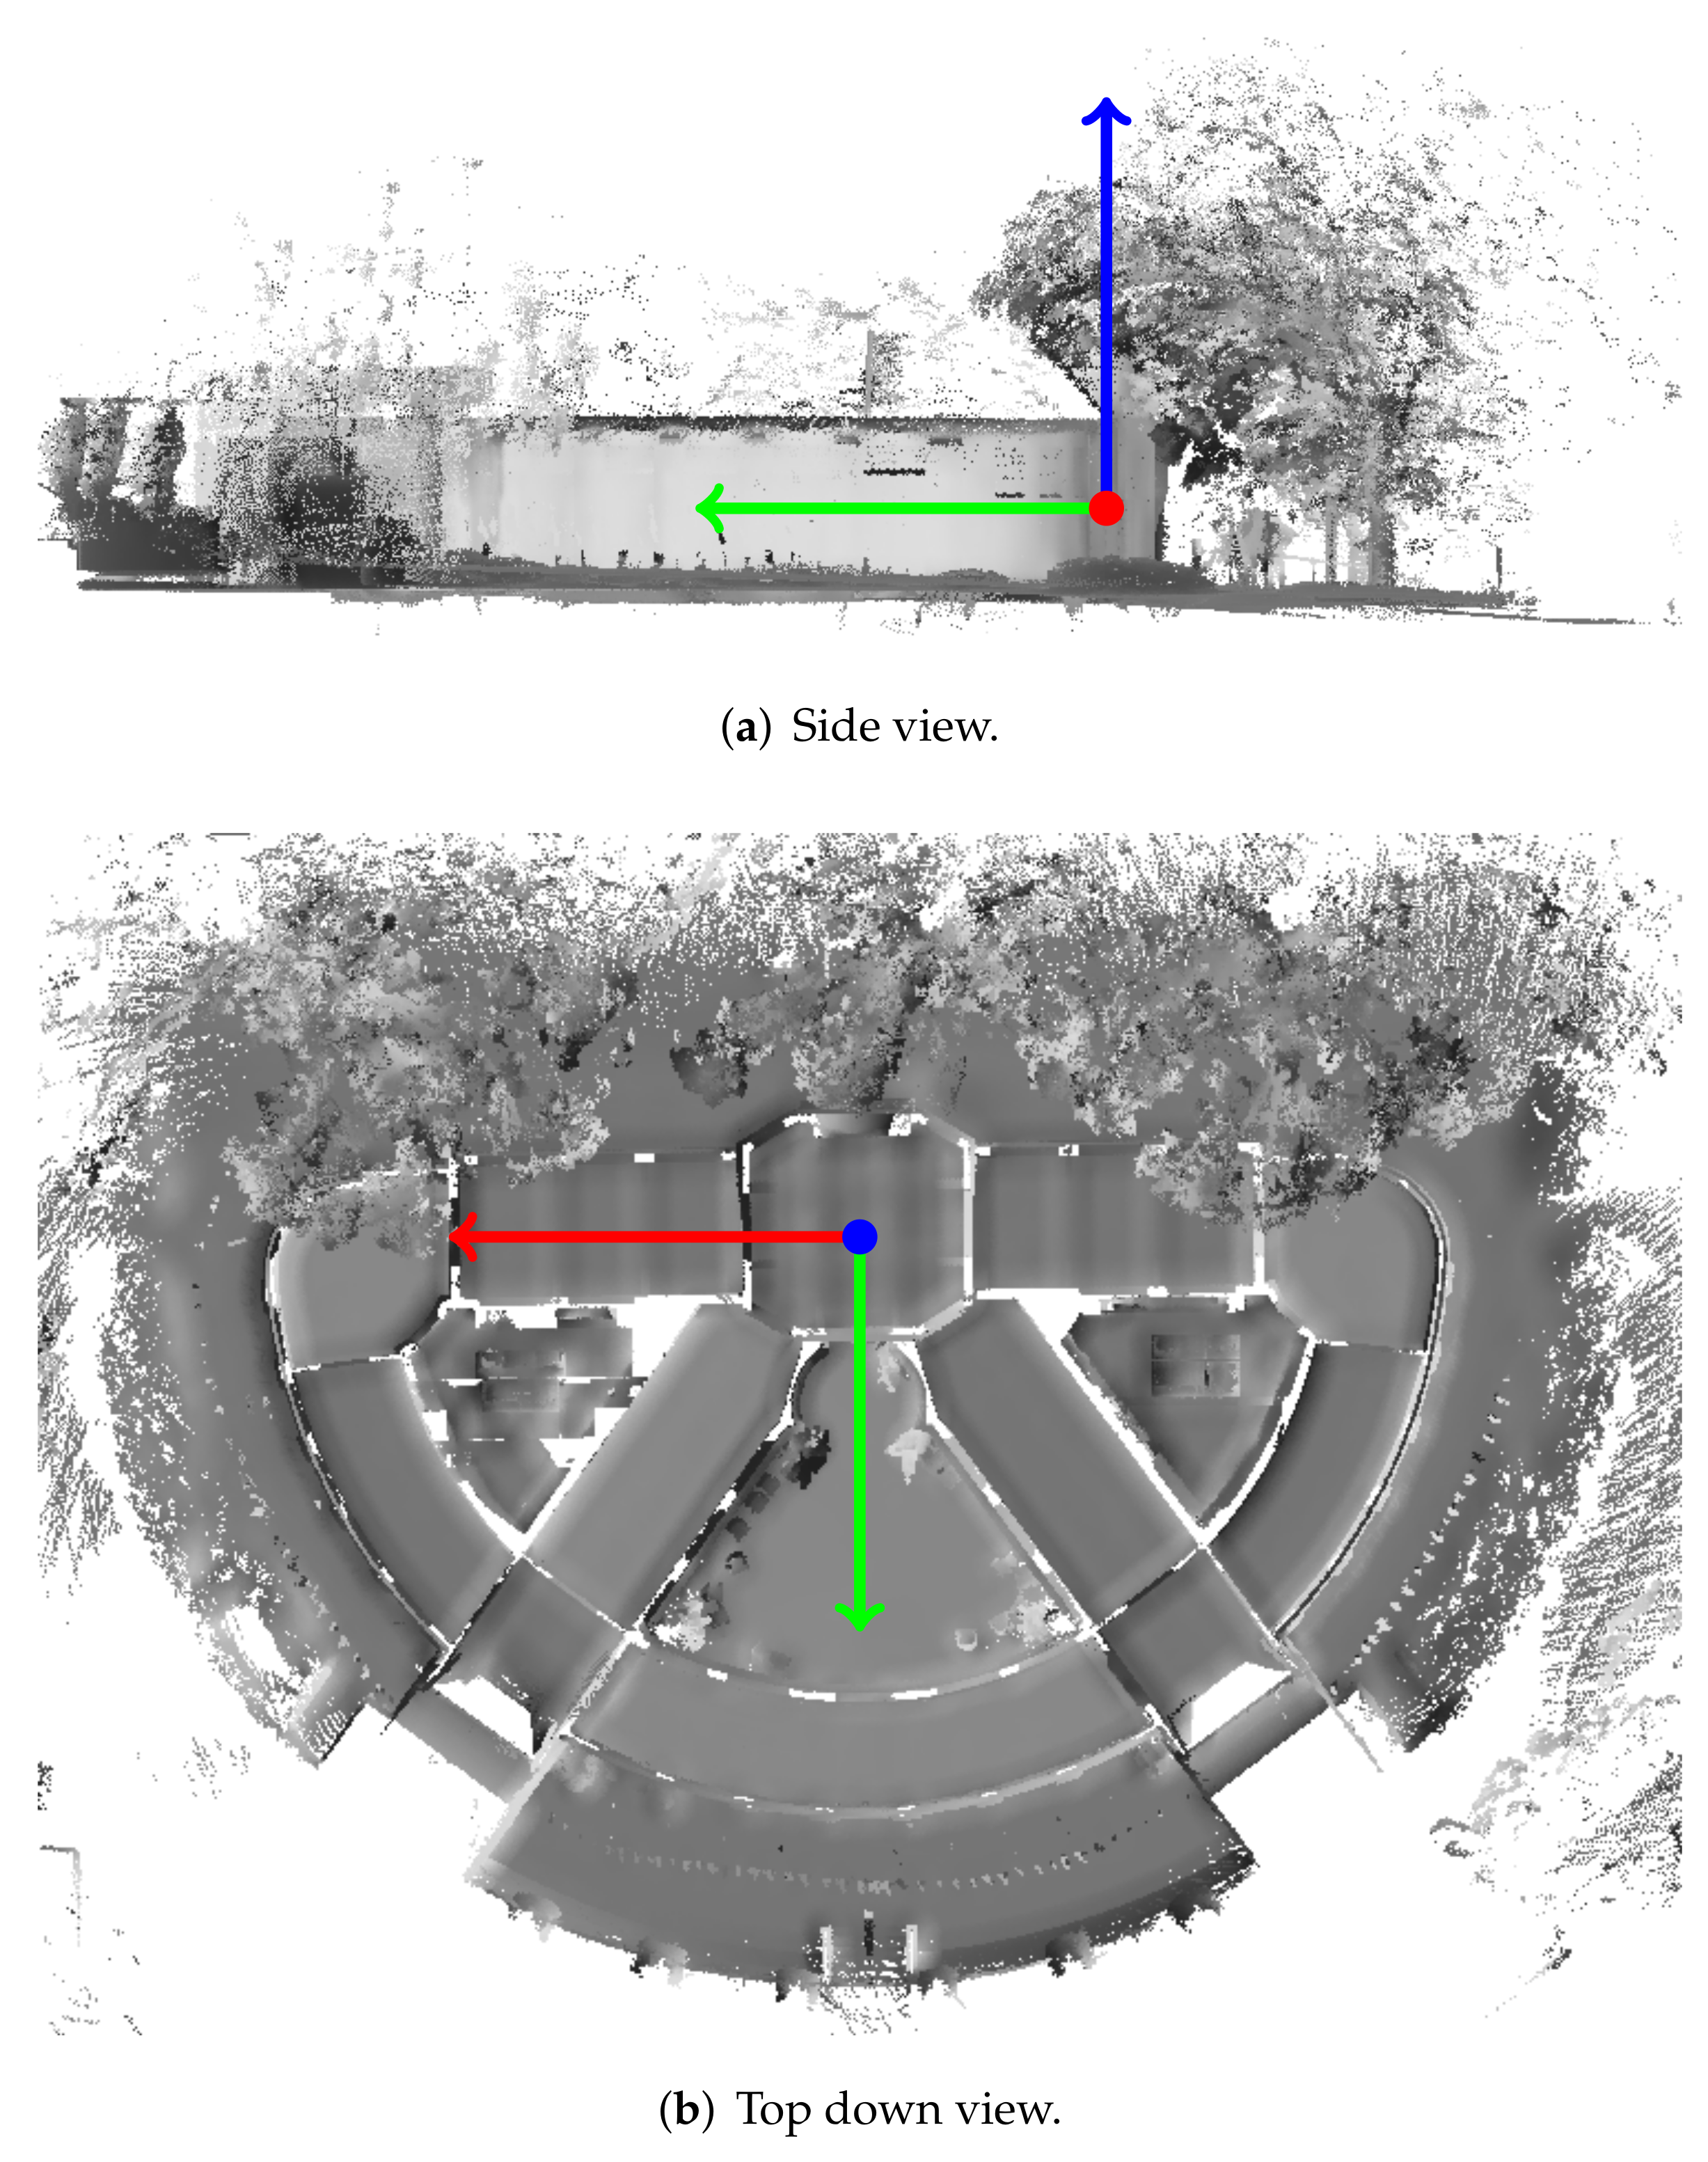
While the other five datasets mostly adhere to the Manhattan World assumption, the dataset “Case Study 6” has a high amount of horizontally curved wall surfaces and rooms oriented diagonally with respect to the dominant Manhattan World structure defined by three rooms. Furthermore, the point cloud includes a part of the surrounding outdoor terrain with uneven topography and vegetation. As the dataset “Case Study 6” is quite challenging with respect to the aim of this work, it is depicted in more detail in
Figure 14.
The point clouds of the ISPRS benchmark dataset as they are published are already aligned with the coordinate axes, in accordance with the aim of this work. Thus, the poses of the point clouds could directly be used as ground truth poses without any manual adjustment. Contrary to triangle meshes, however, point clouds do not intrinsically provide a normal vector per point. Instead, the normal vector can be calculated for each point from a subset of respectively neighboring points. This is also the case with the point clouds of the ISPRS Indoor Modeling Benchmark. We thus computed normal vectors for the points after subsampling the point clouds with a resolution of 2 cm using CloudCompare 2.10-alpha [
97] (subsampling method “Space” with 2 cm as the minimal space between points for subsampling and surface approximation “Plane” with default parameters for normal estimation).
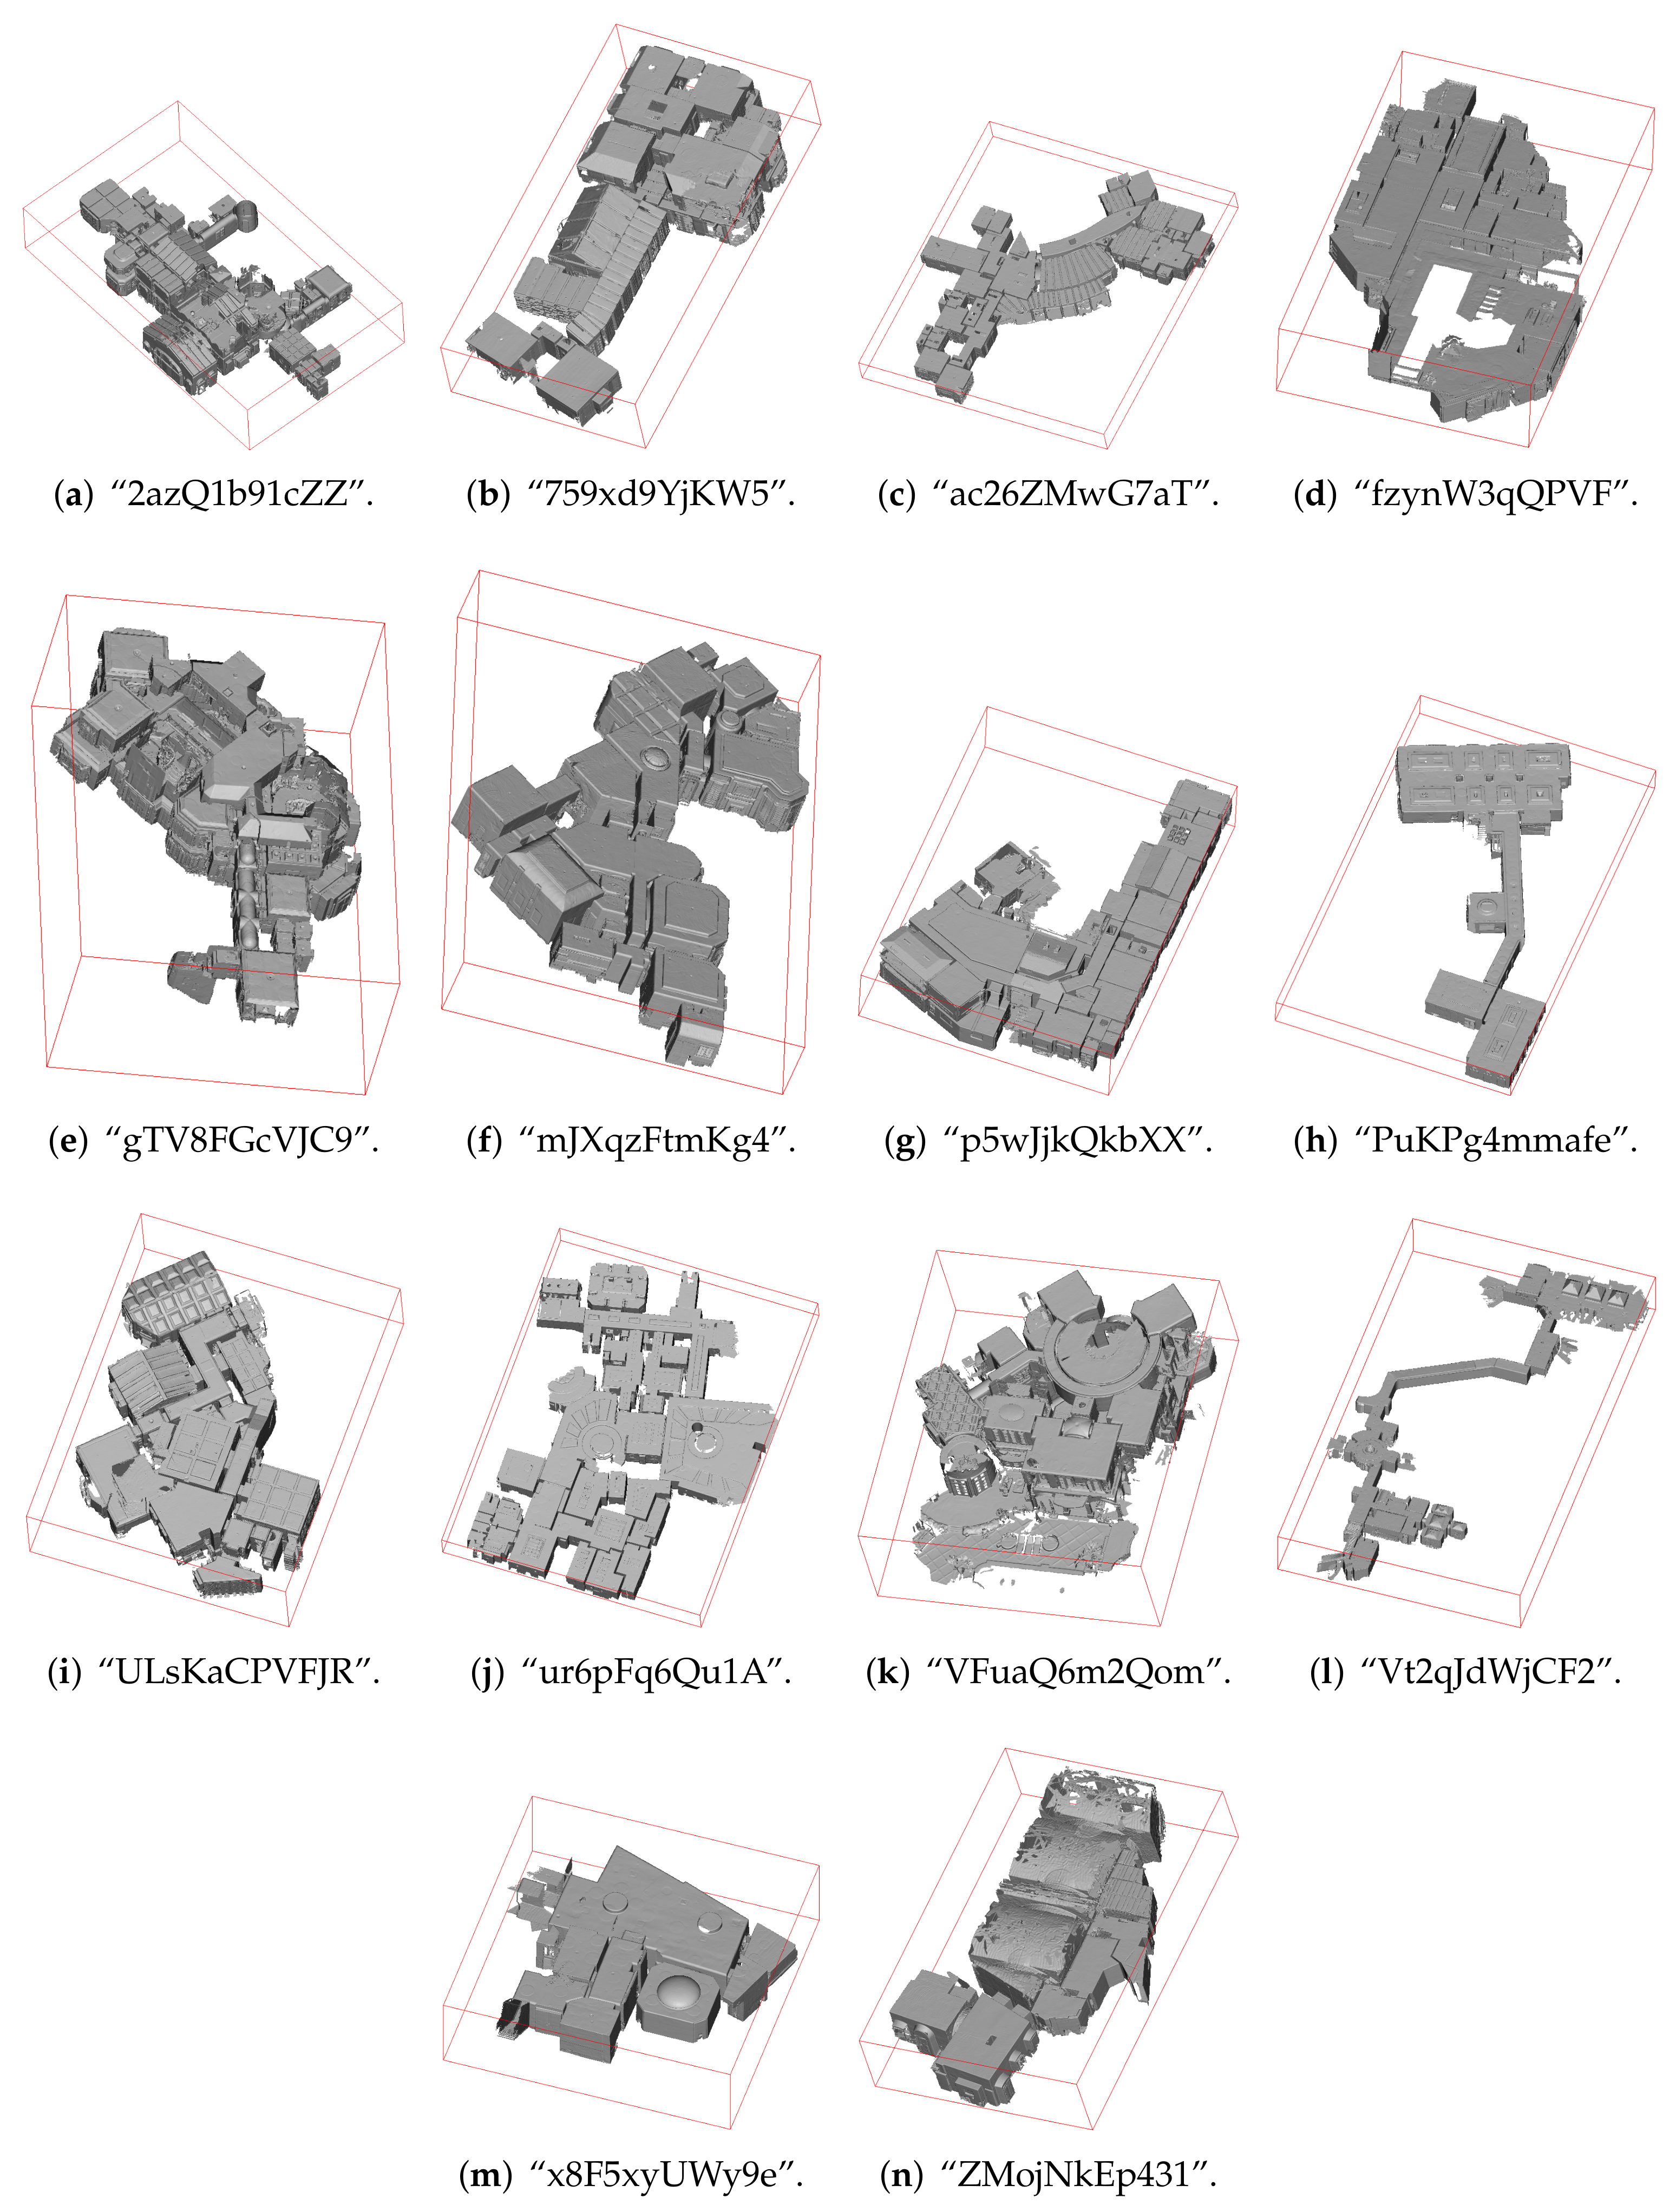
Lastly, we also considered some triangle meshes from the Matterport3D dataset [
90]. Matterport3D includes 90 triangle meshes of various kinds of indoor environments acquired with the trolley-mounted Matterport indoor mapping system consisting of multiple RGBD cameras. Among the represented indoor environments are some for which the proposed alignment approach is not applicable, as they are not subject to any clearly identifiable Manhattan World structure. Many others do have a clearly identifiable Manhattan World structure, but are to a large extent comparable to general building layouts already covered by the HoloLens triangle meshes or ISPRS point clouds used in the scope of this evaluation.
We thus selected 14 triangle meshes from the Matterport3D dataset that we deemed particularly interesting and challenging in the context of pose normalization. This, for instance, comprises triangle meshes representing indoor environments that contain more than one underlying Manhattan World system, such as the one already presented in
Figure 2. In these cases, the presented alignment method is supposed to align the triangle mesh with the most dominant of the Manhattan World structures at hand being supported by the largest fraction of geometries. The 14 selected triangle meshes from the Matterport3D dataset are depicted in
Figure 15.
As with the ISPRS benchmark point clouds, we again treated the poses of the triangle meshes as they are published as ground truth alignments without any manual adjustments. To what extent this decision is justified will be discussed in
Section 4.
4. Discussion
Taking a closer look at the evaluation results presented in
Table 1, the overall quite low values for the horizontal and vertical angular deviations
and
with equally low standard deviations indicate that the proposed alignment method works quite well for a large range of different indoor mapping point clouds and triangle meshes with randomly varying input rotations within the defined bounds. The consistently larger
and
values for the triangle meshes acquired with the Microsoft HoloLens may be attributable to them being less accurate and more affected by noise. Triangles pertaining to an actually smooth planar room surface show a considerable variation in the normal vector direction. However, the reported
and
values for these datasets are still mostly below 1
.
Some datasets however showed significantly higher averaged values for
or
, sometimes with the corresponding standard deviation being significantly raised as well. These outliers are marked red in
Table 1 and will be discussed in more detail in the following paragraphs. To analyze these cases, we take a closer look at the distribution of the individual 50 deviations constituting the respective mean value and standard deviation.
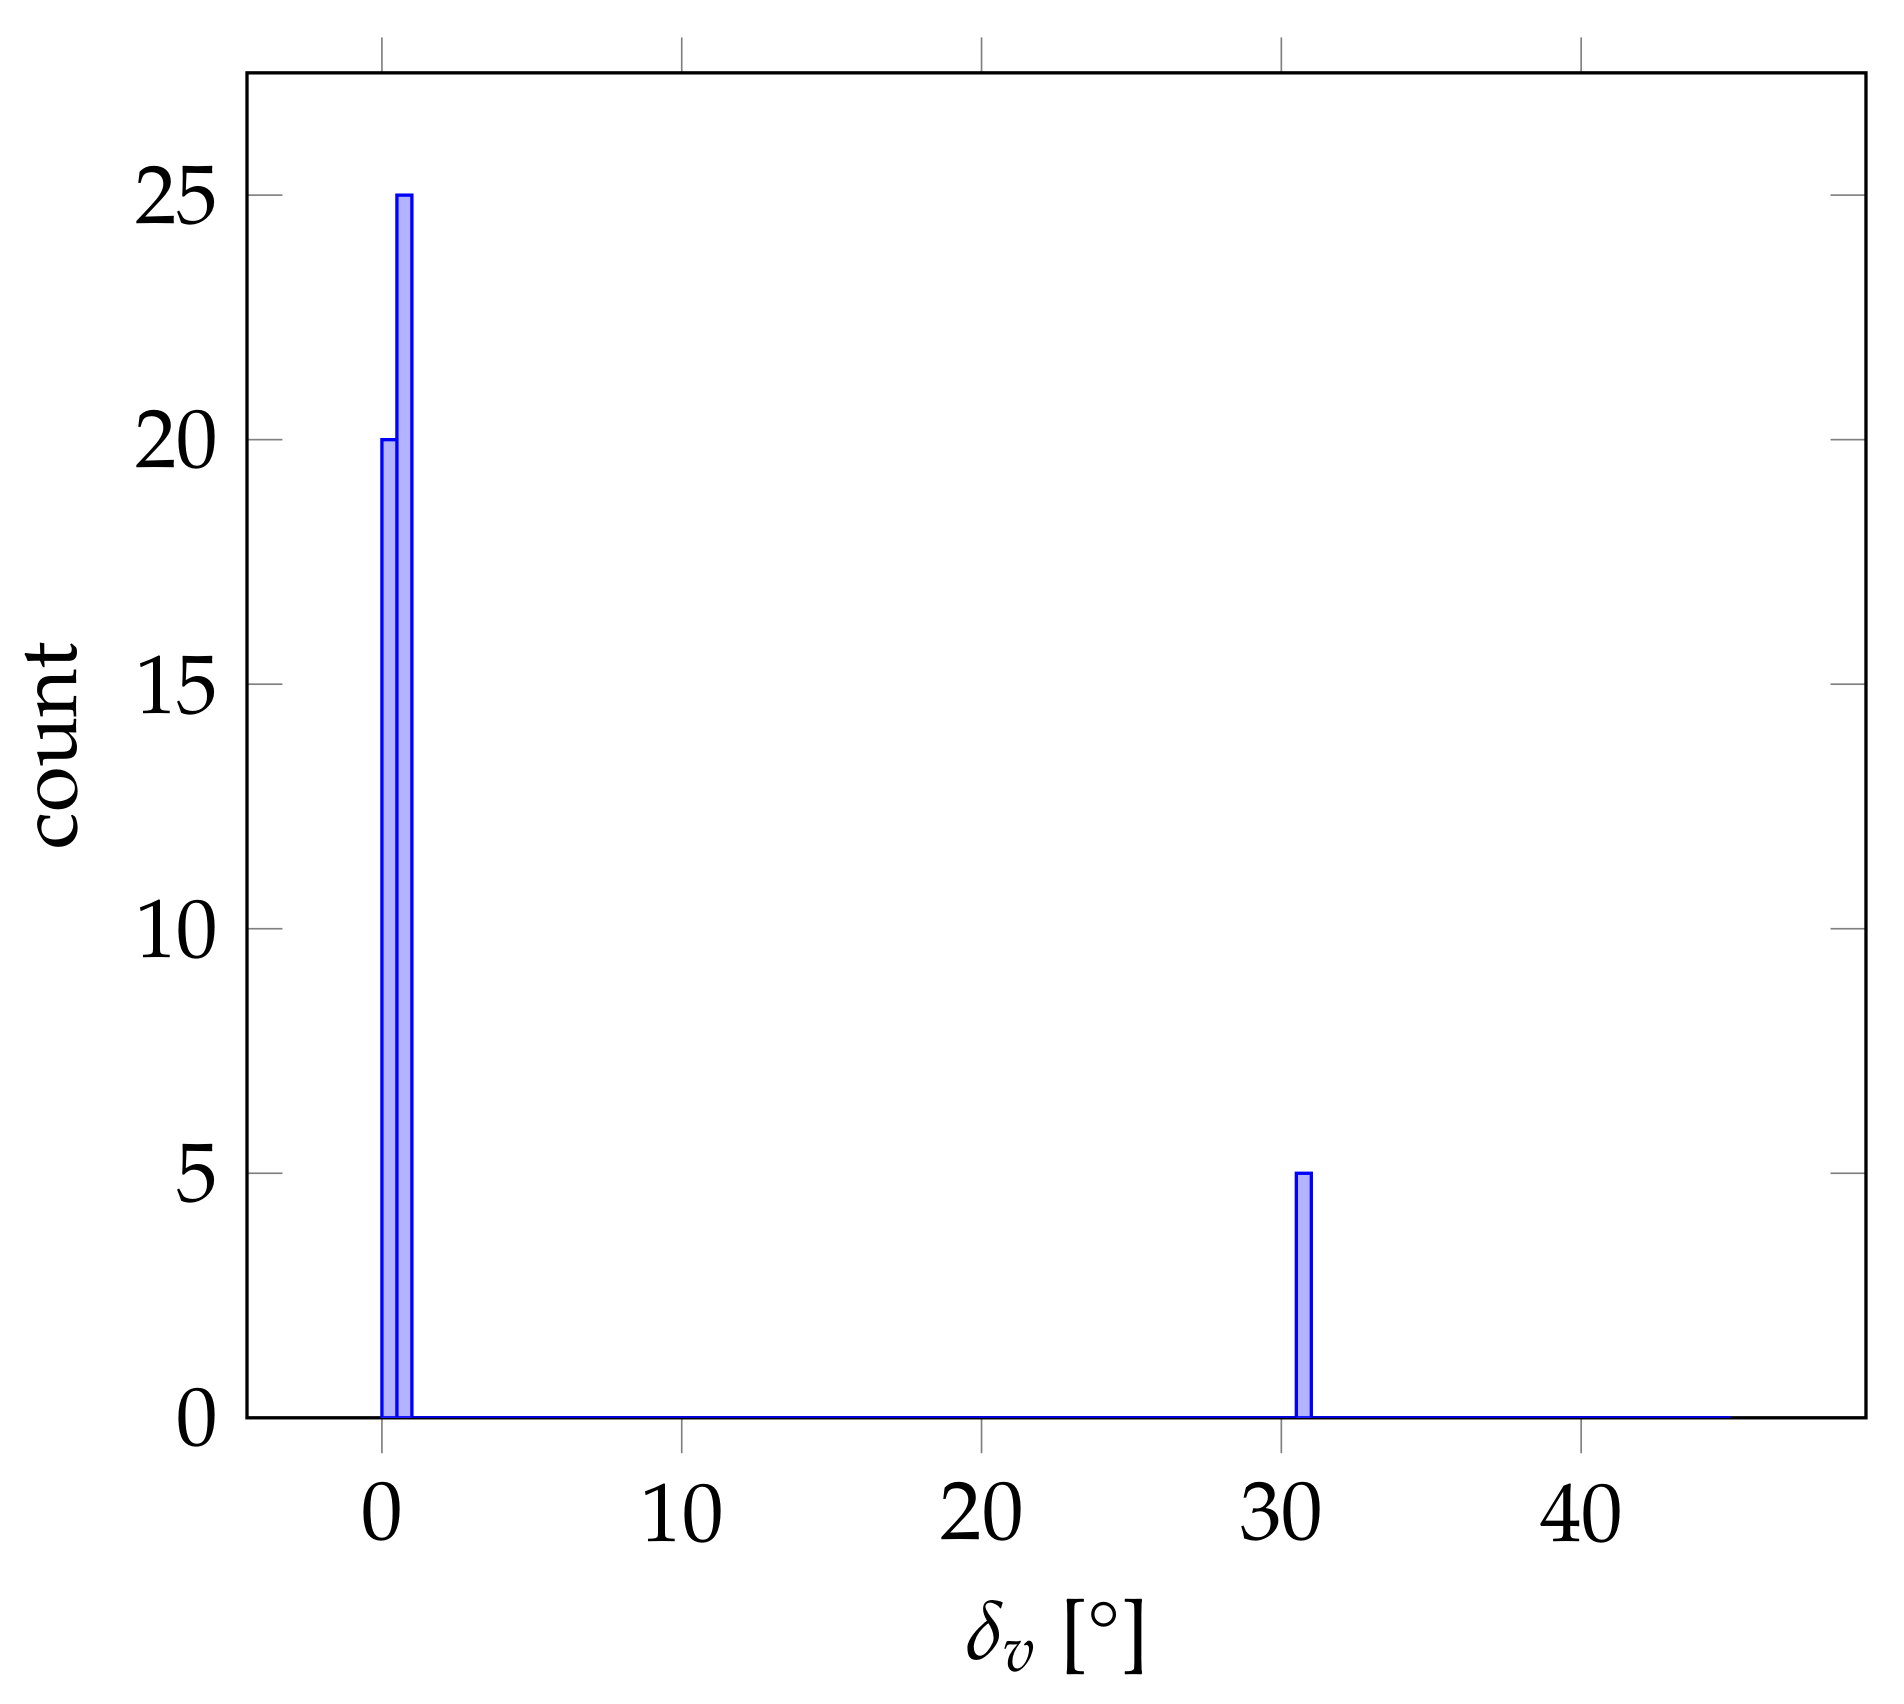
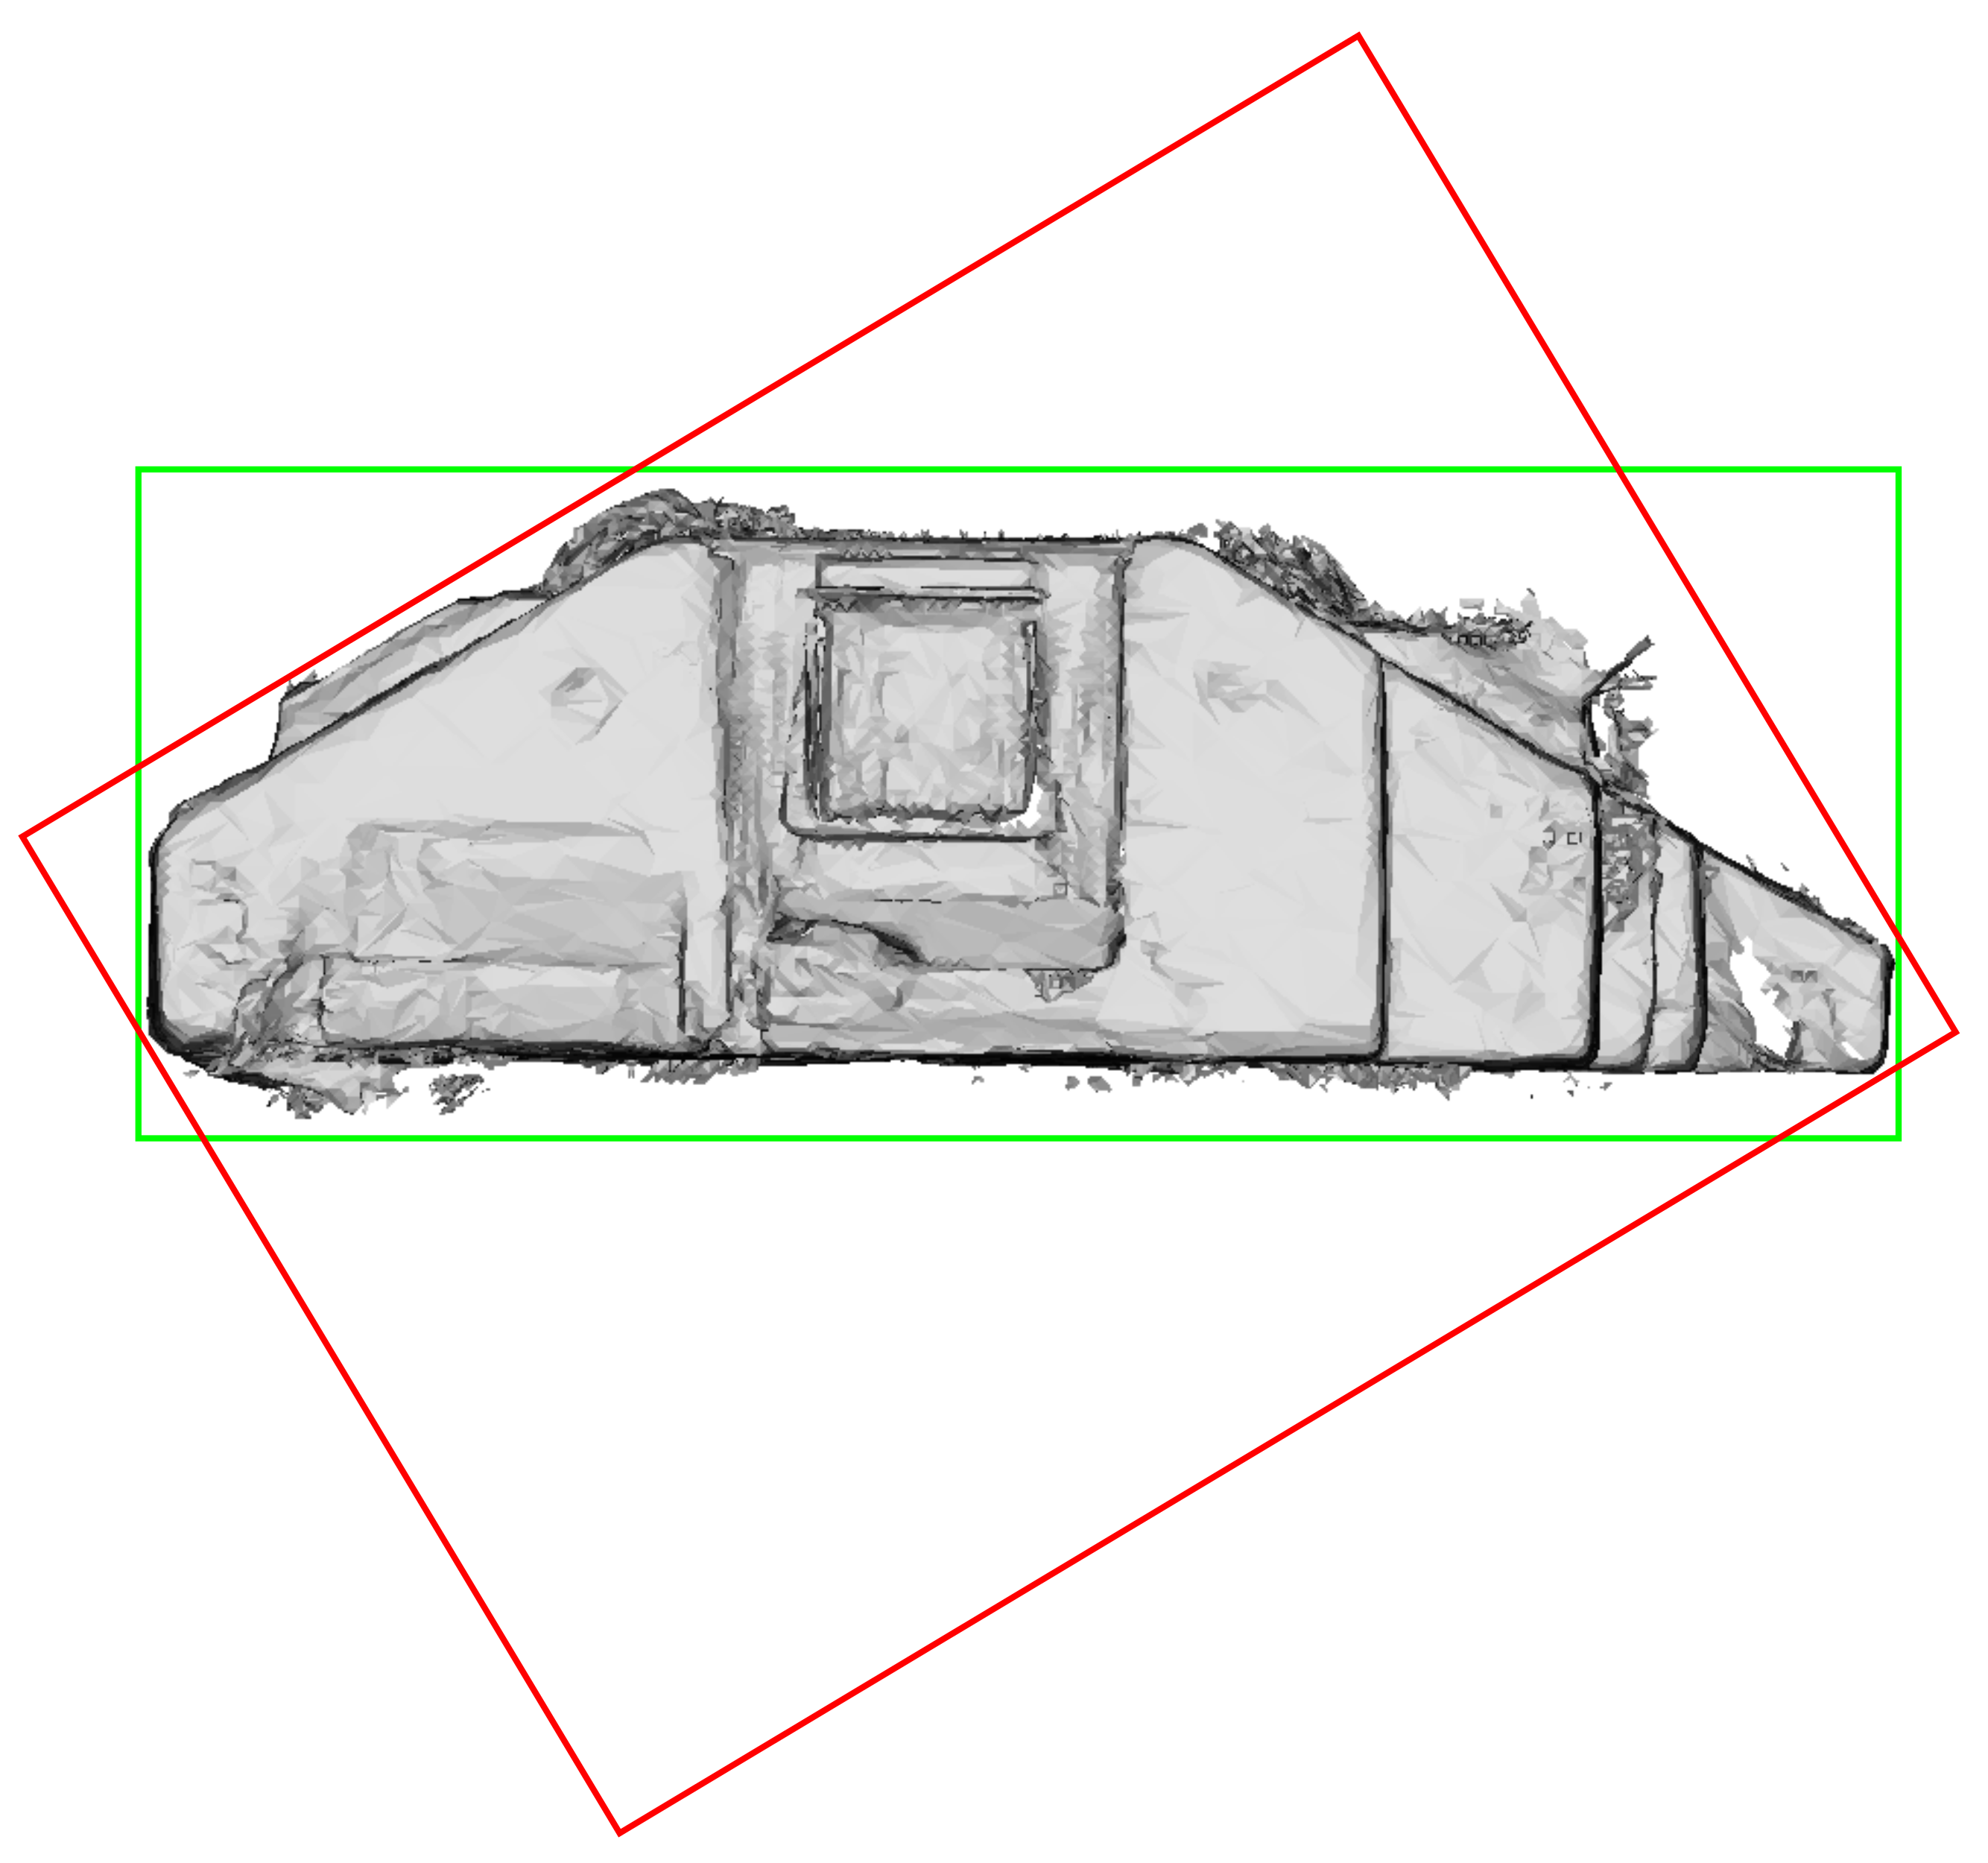
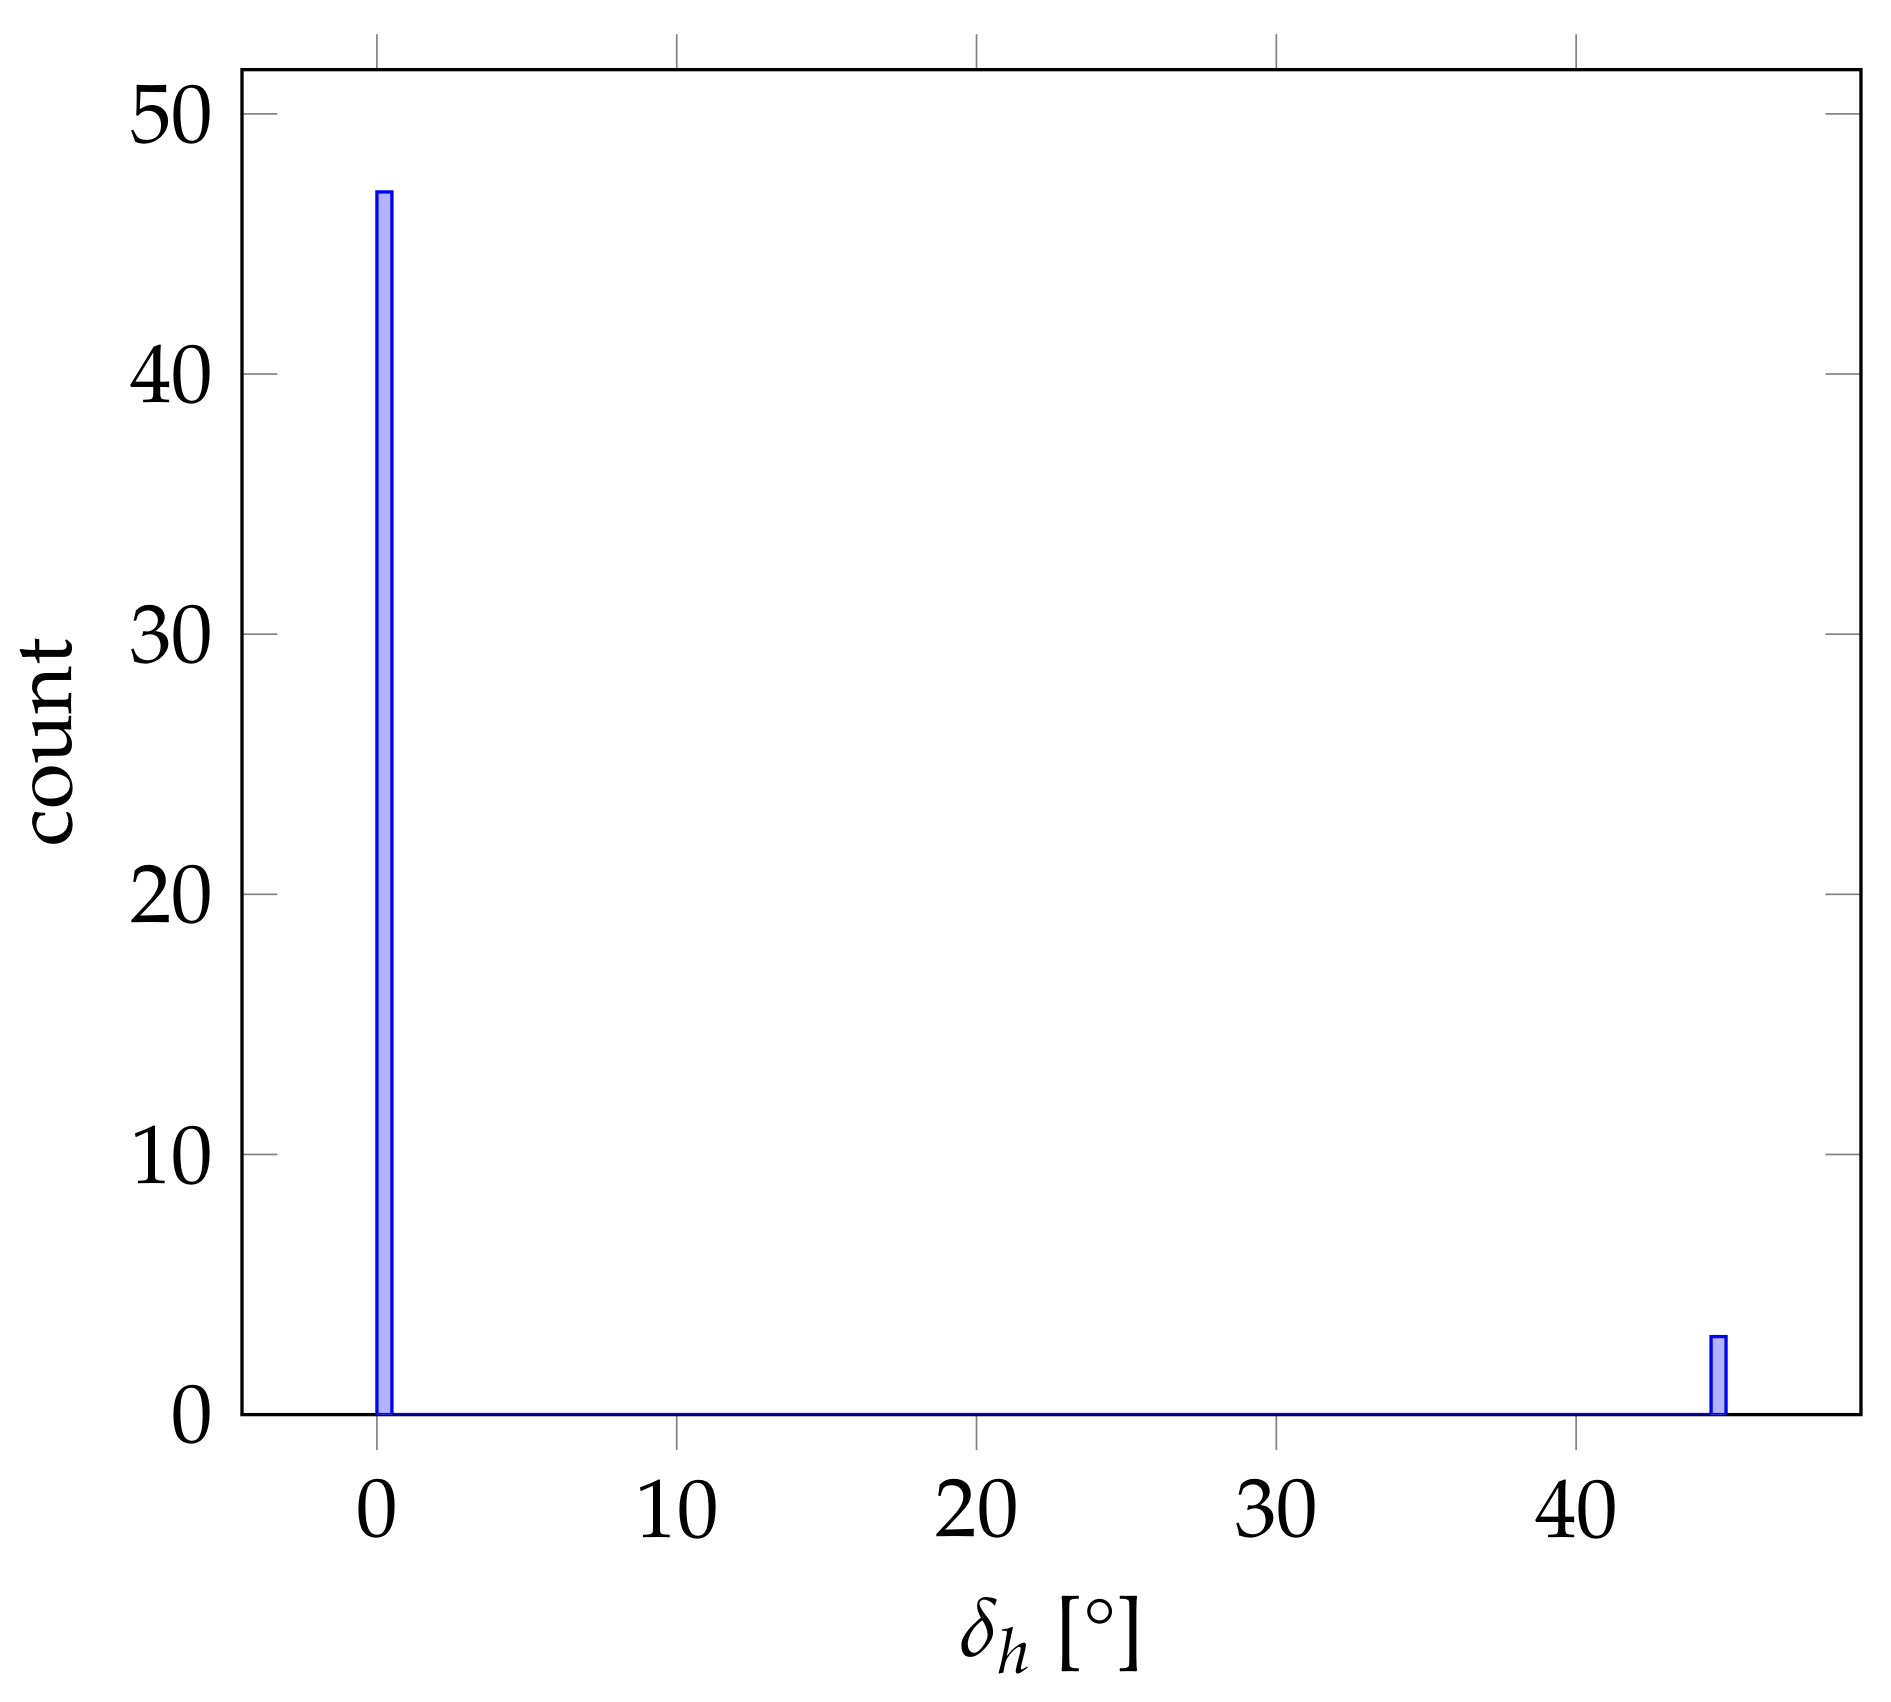
In the case of the HoloLens triangle mesh “Attic”, for instance, the histogram of
values depicted in
Figure 16 indicate that the heightened mean and standard deviation values for the angular deviation in the vertical alignment were not caused by a large variability in the resulting vertical alignment. The vertical orientations resulting from the evaluated alignment method rather fluctuated between two clearly defined states, one being the correct vertical orientation according to the ground truth pose at around 0
angular deviation
of the vertical axis supported by 45 of the 50 measurements. The other state is a vertical orientation with an angular deviation of about 30
occurring in the remaining five measurements. As visualized by the red box in
Figure 17, this corresponds to an alignment where the vertical axis is oriented orthogonally to one of the slanted ceiling surfaces.
This is the only case where the vertical alignment did not work satisfyingly in all 50 samples for all the datasets used in the evaluation. We suspect that the misalignments occurring sporadically on this dataset can be ascribed to the noisy surfaces of the HoloLens triangle meshes. The triangles comprising the large horizontal floor surface for instance differ significantly in the direction of their normal vectors. Thus, only a fraction of the triangles comprising the floor actually corresponds to the proper vertical direction with respect to the applied resolution of 1. Depending on the input rotation, a peak caused by a slanted ceiling surface with a not insignificant area in comparison to horizontal surfaces such as in the case of the dataset at hand representing only the attic story may thus induce a larger peak and consequently a misalignment. In cases such as this, applying an angular resolution of more than 1 may be more appropriate to prevent such misalignments.
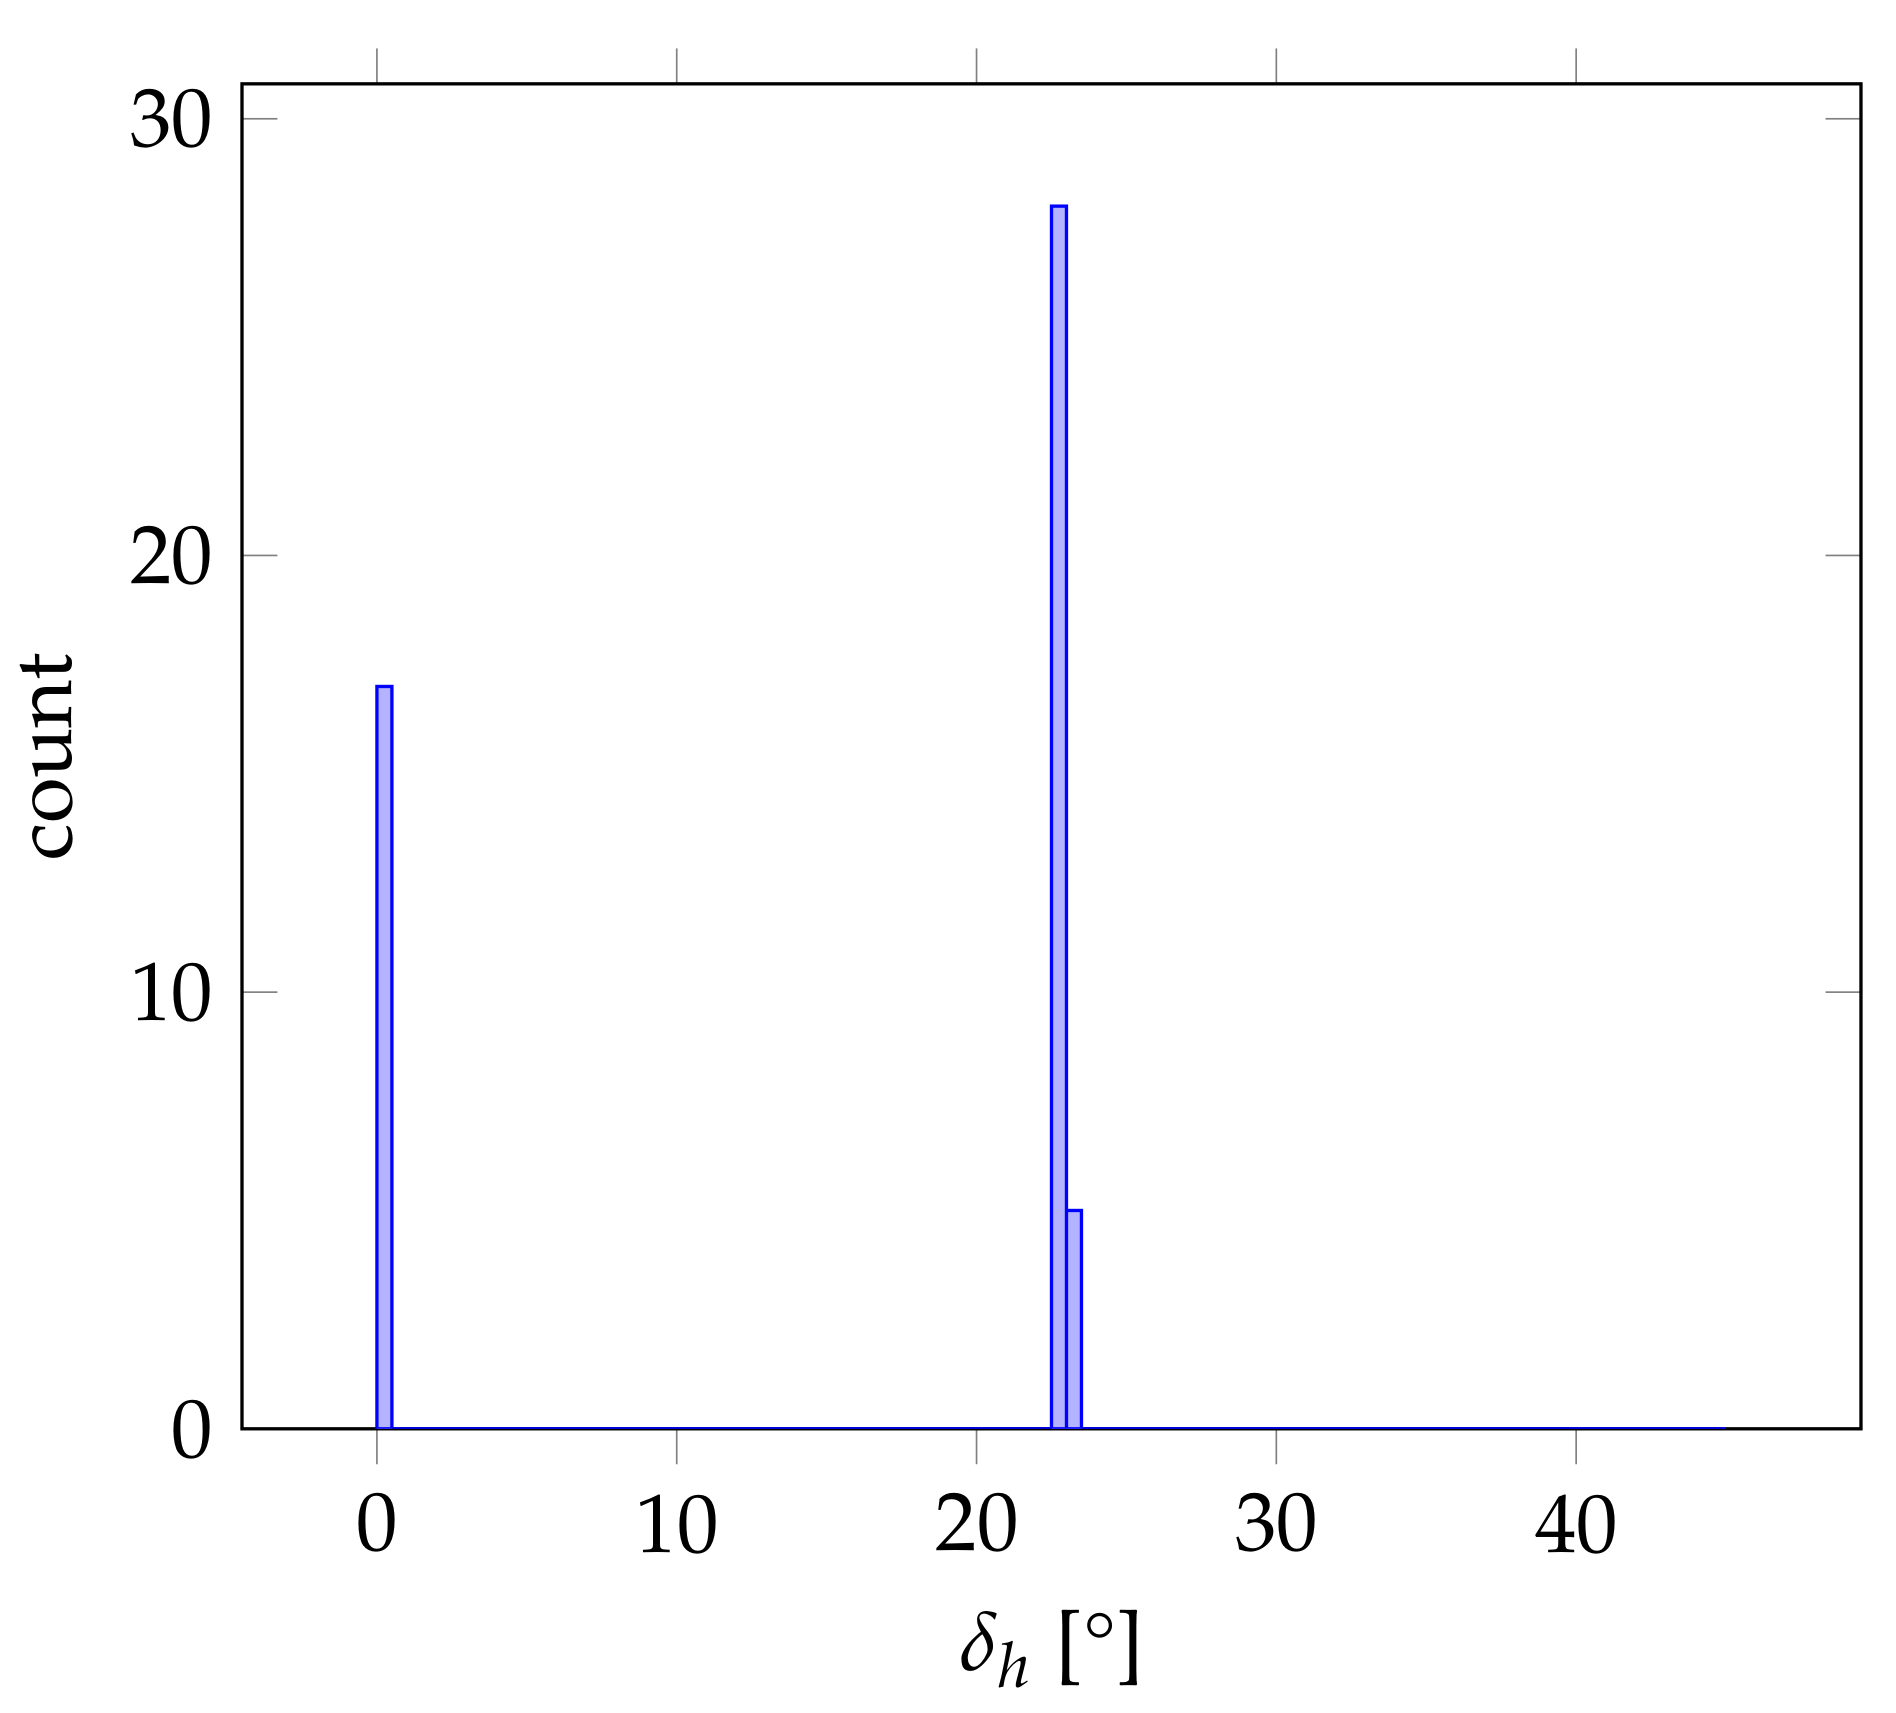
Besides the discussed outlier in the vertical alignment, some outliers in the horizontal alignment do exist. The Matterport3D datasets “mJXqzFtmKg4” and “PuKPg4mmafe” for instance show heightened average
values along with high standard deviations. The histograms showing the distribution of all 50
values are again depicted in
Figure 18 and
Figure 19, respectively. As in the case before, it is apparent that the alignment results fluctuated between two states depending on the input rotation for both cases, while each time, one peak at 0
corresponds to the correct horizontal alignment according to the respective ground truth pose. As can be seen in
Figure 20 and
Figure 21, the respective second peak corresponds in both cases to a valid second Manhattan World structure present in the respective indoor environment.
In the case of the dataset “mJXqzFtmKg4”, this seems immediately plausible, as both Manhattan World structures present in the indoor environment are supported by a comparable amount of geometries, as was already demonstrated in
Figure 5 and
Figure 6. Thus, different input rotations may result in slightly different discretizations within the grid of 1
resolution, sometimes favoring one and sometimes the other Manhattan World structure as having the largest peak of summarized geometry weights.
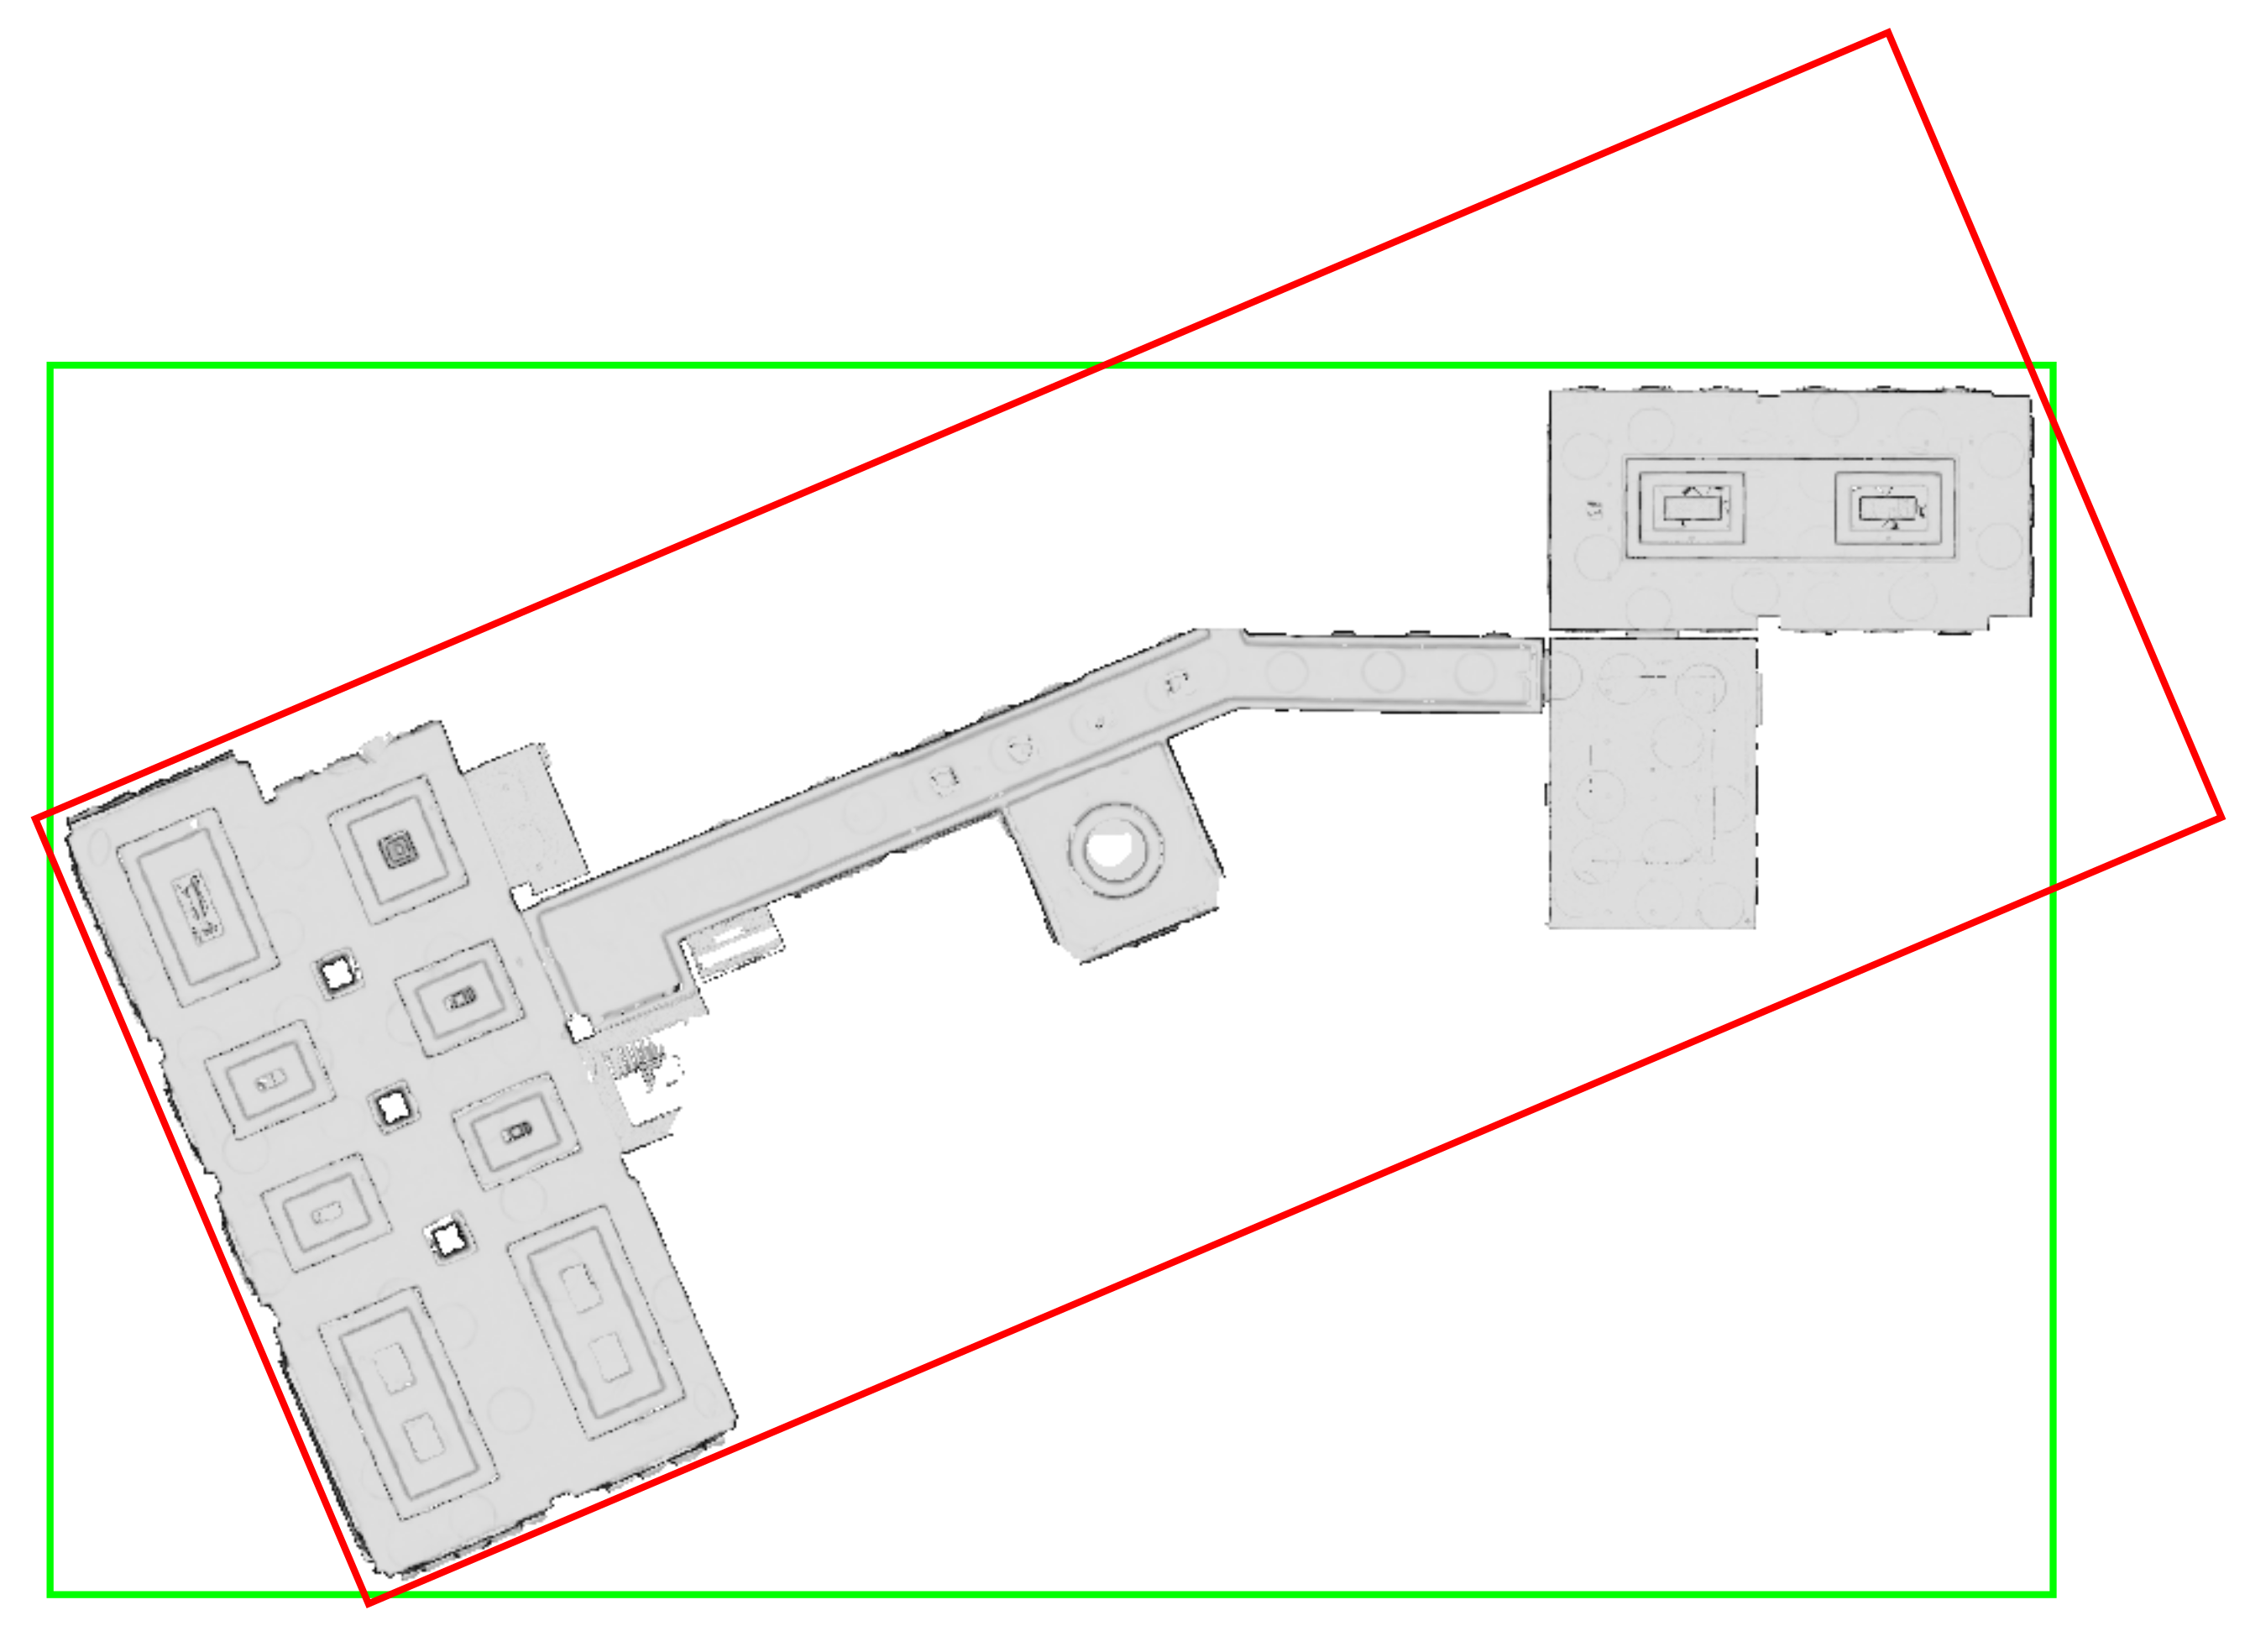
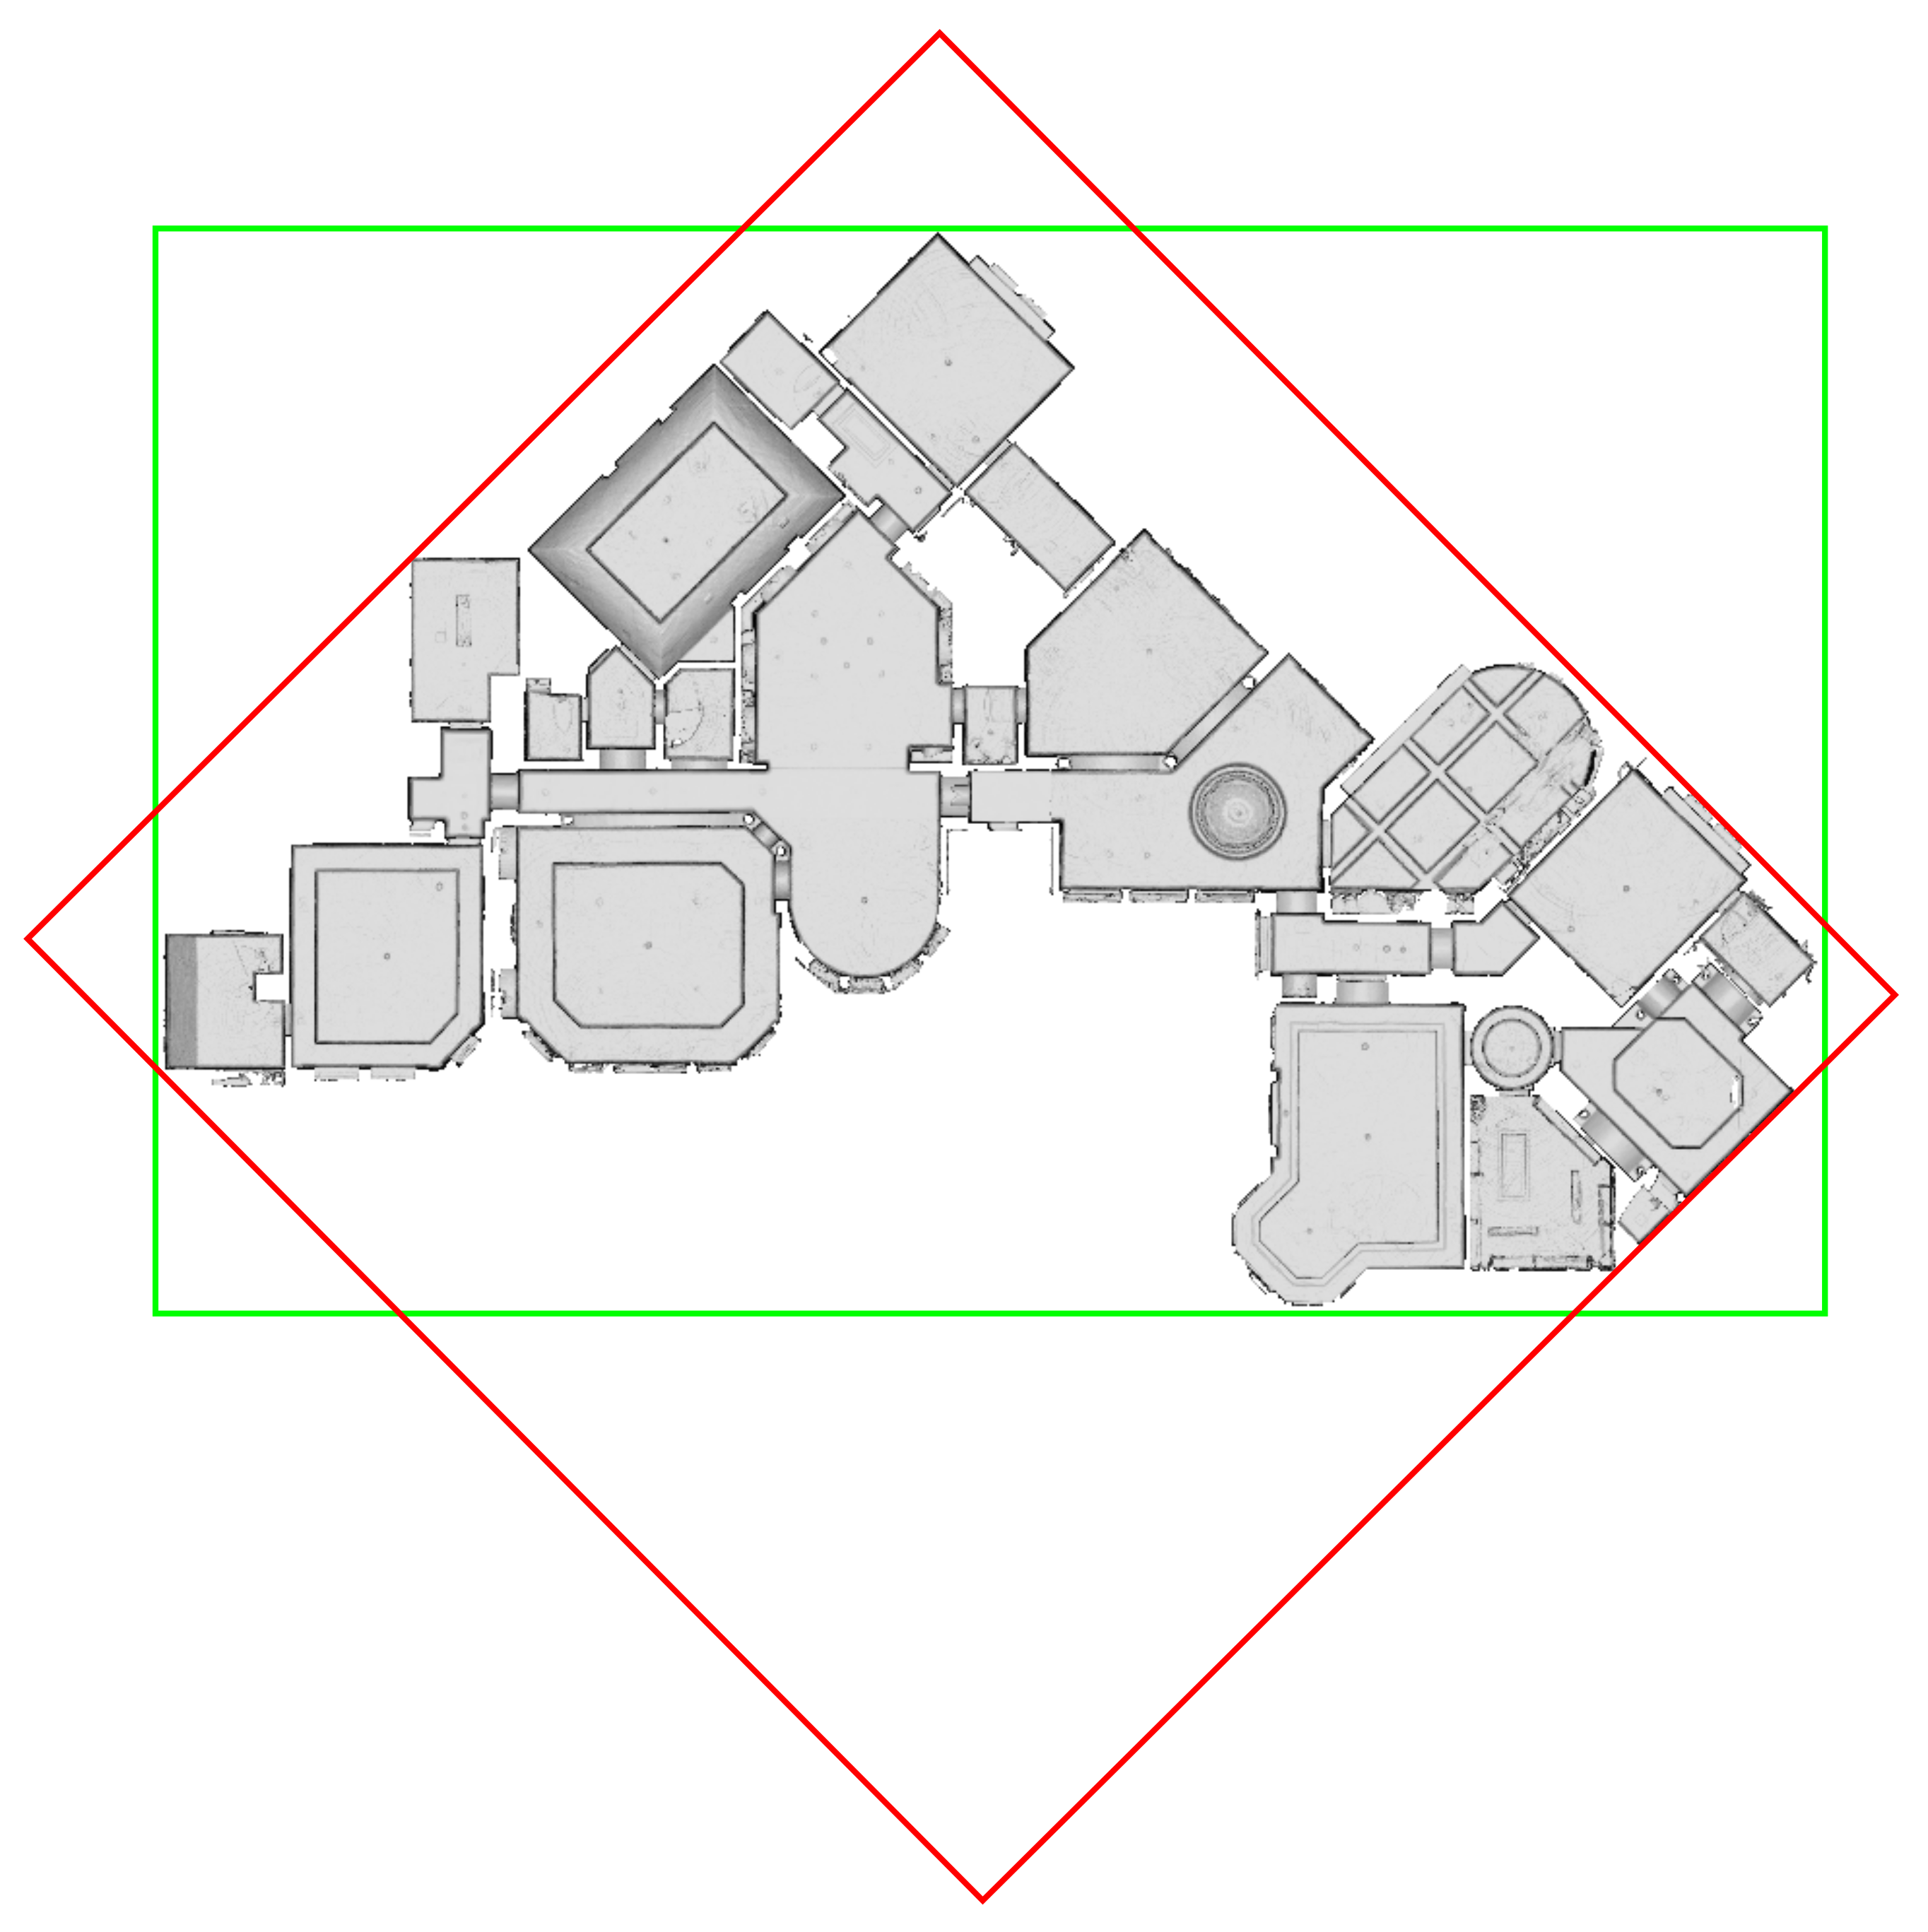
In the case of the dataset “PuKPg4mmafe”, however, the two Manhattan World structures present in the indoor environment apparently do not seem to be supported by an approximately equal fraction of geometries. Instead, the upper right section in
Figure 21 constituting the one Manhattan World structure seems to be far smaller than the section on the lower left constituting the other Manhattan World structure. In this case, the ground truth pose of the triangle mesh as published in [
90] is aligned with the apparently smaller Manhattan World structure. It is thus not surprising that in the evaluation, a majority of measurements resulted in high
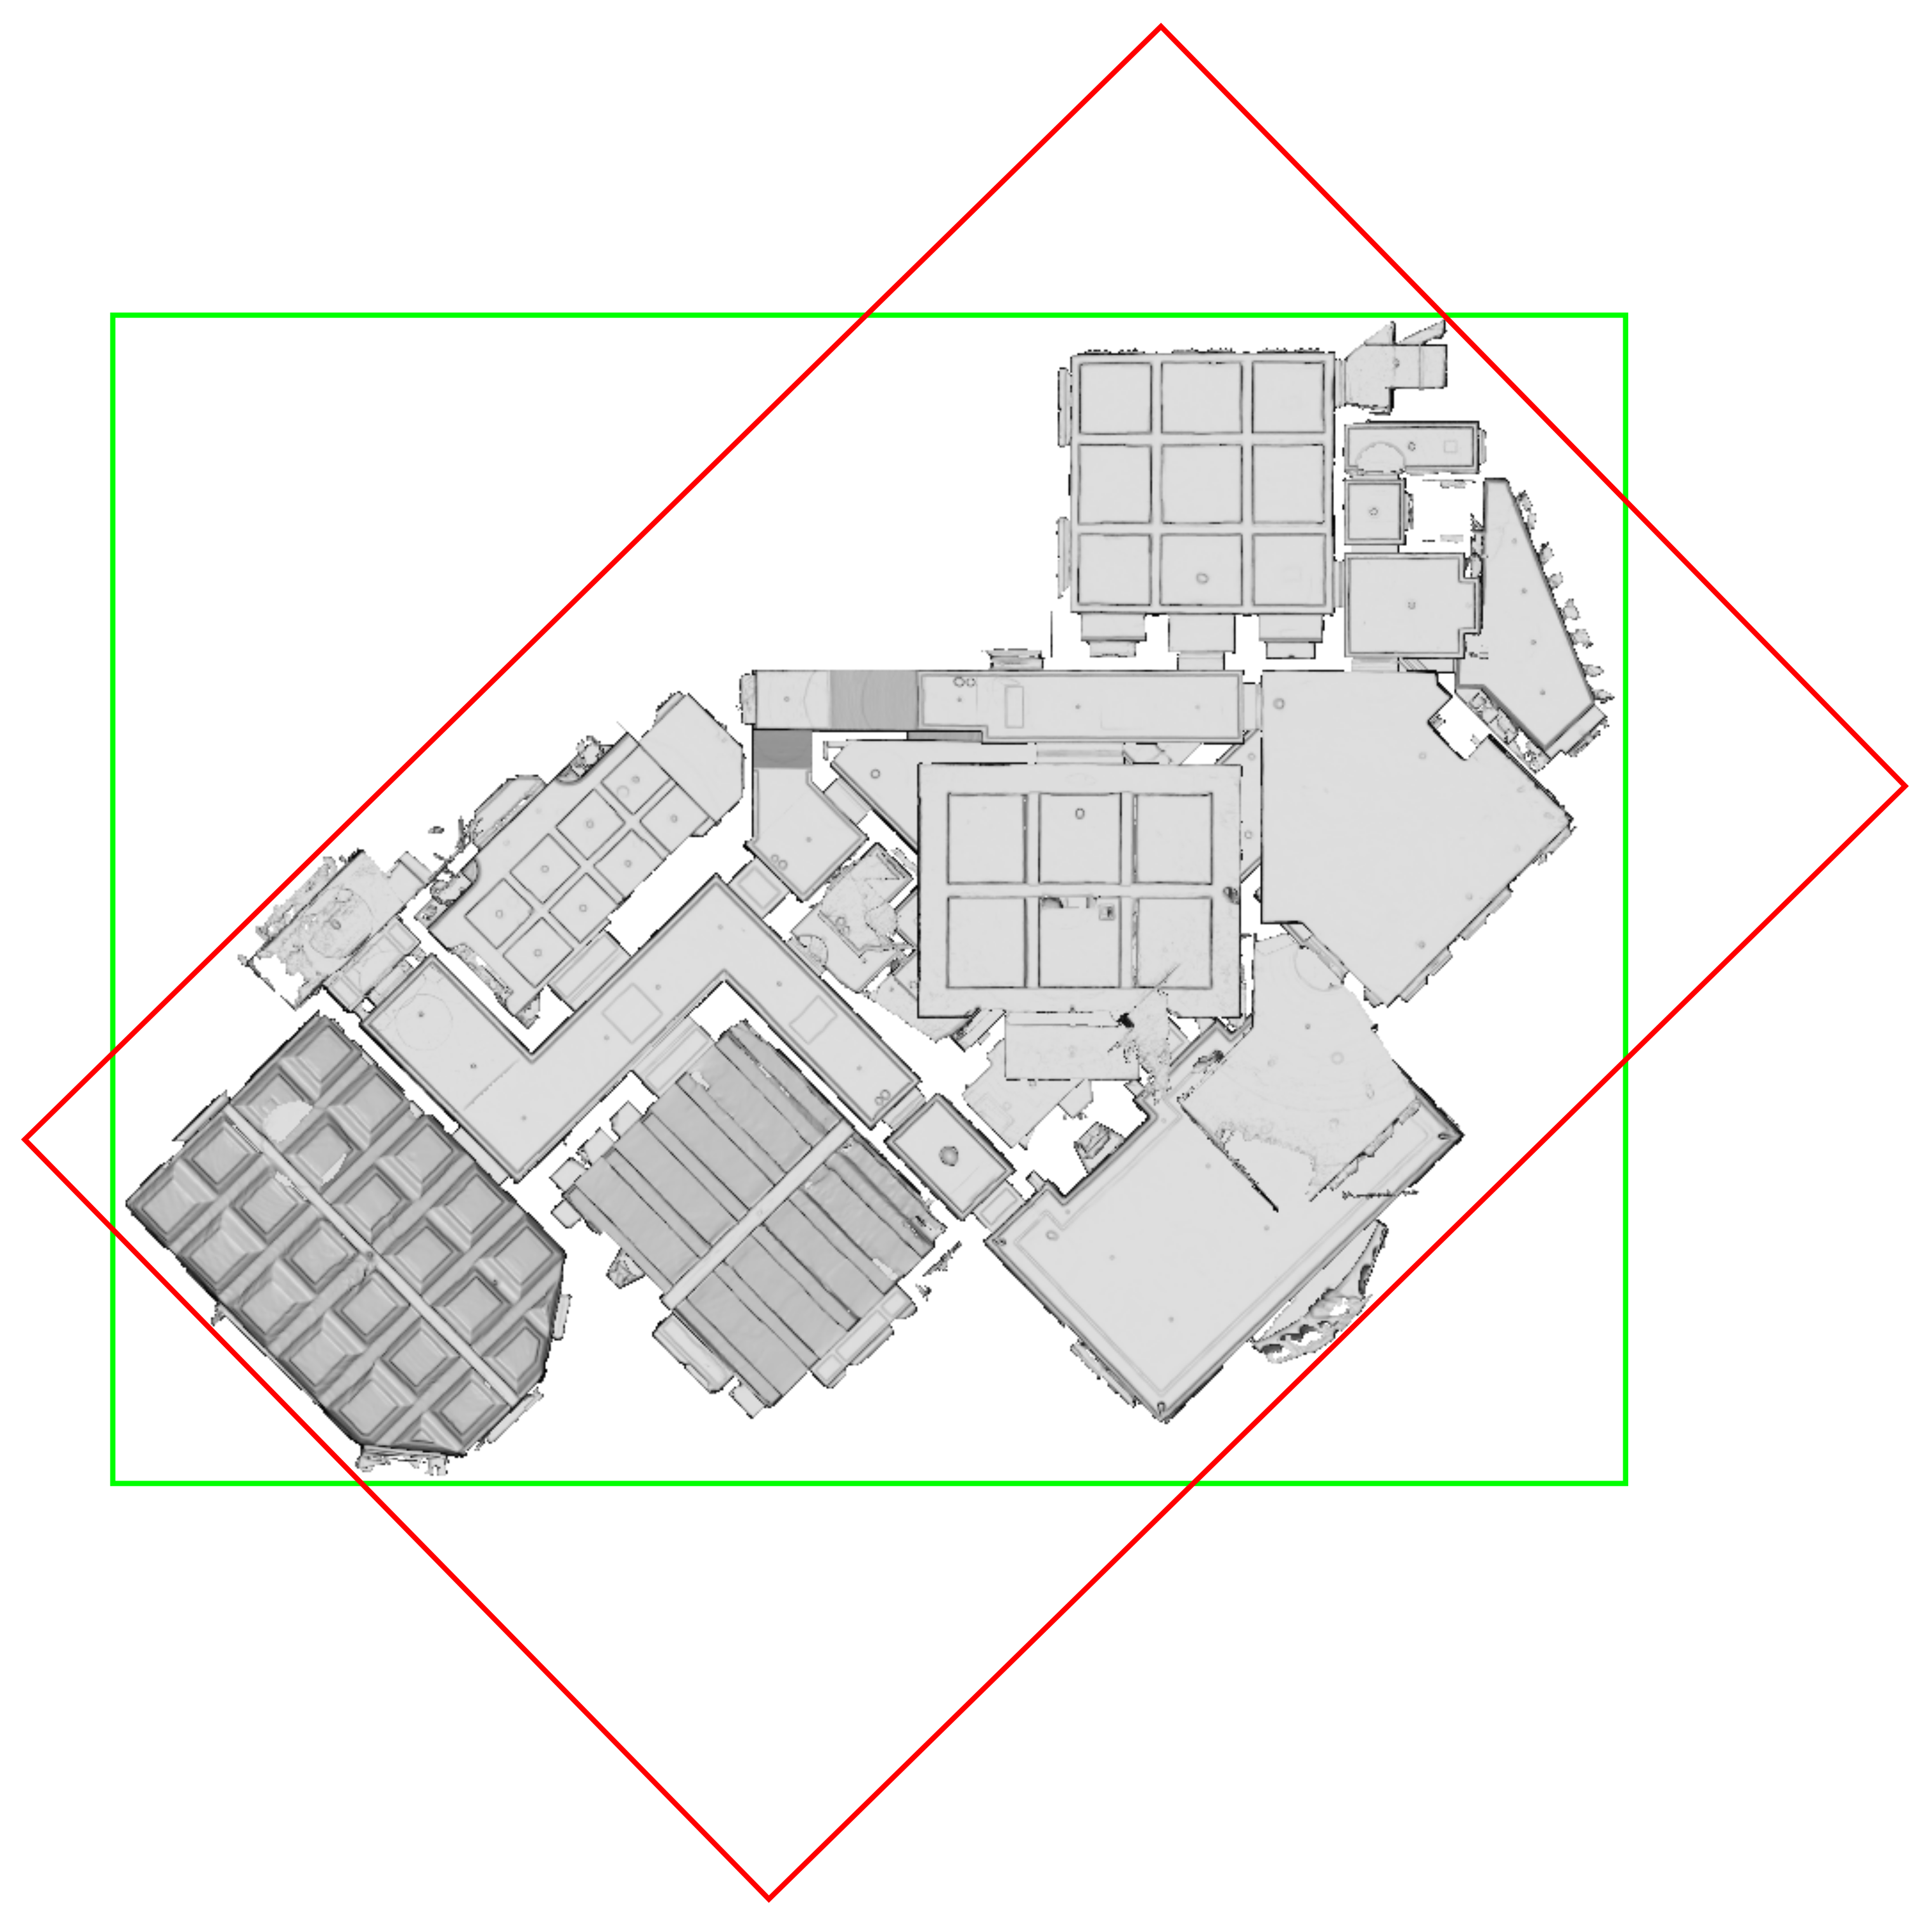
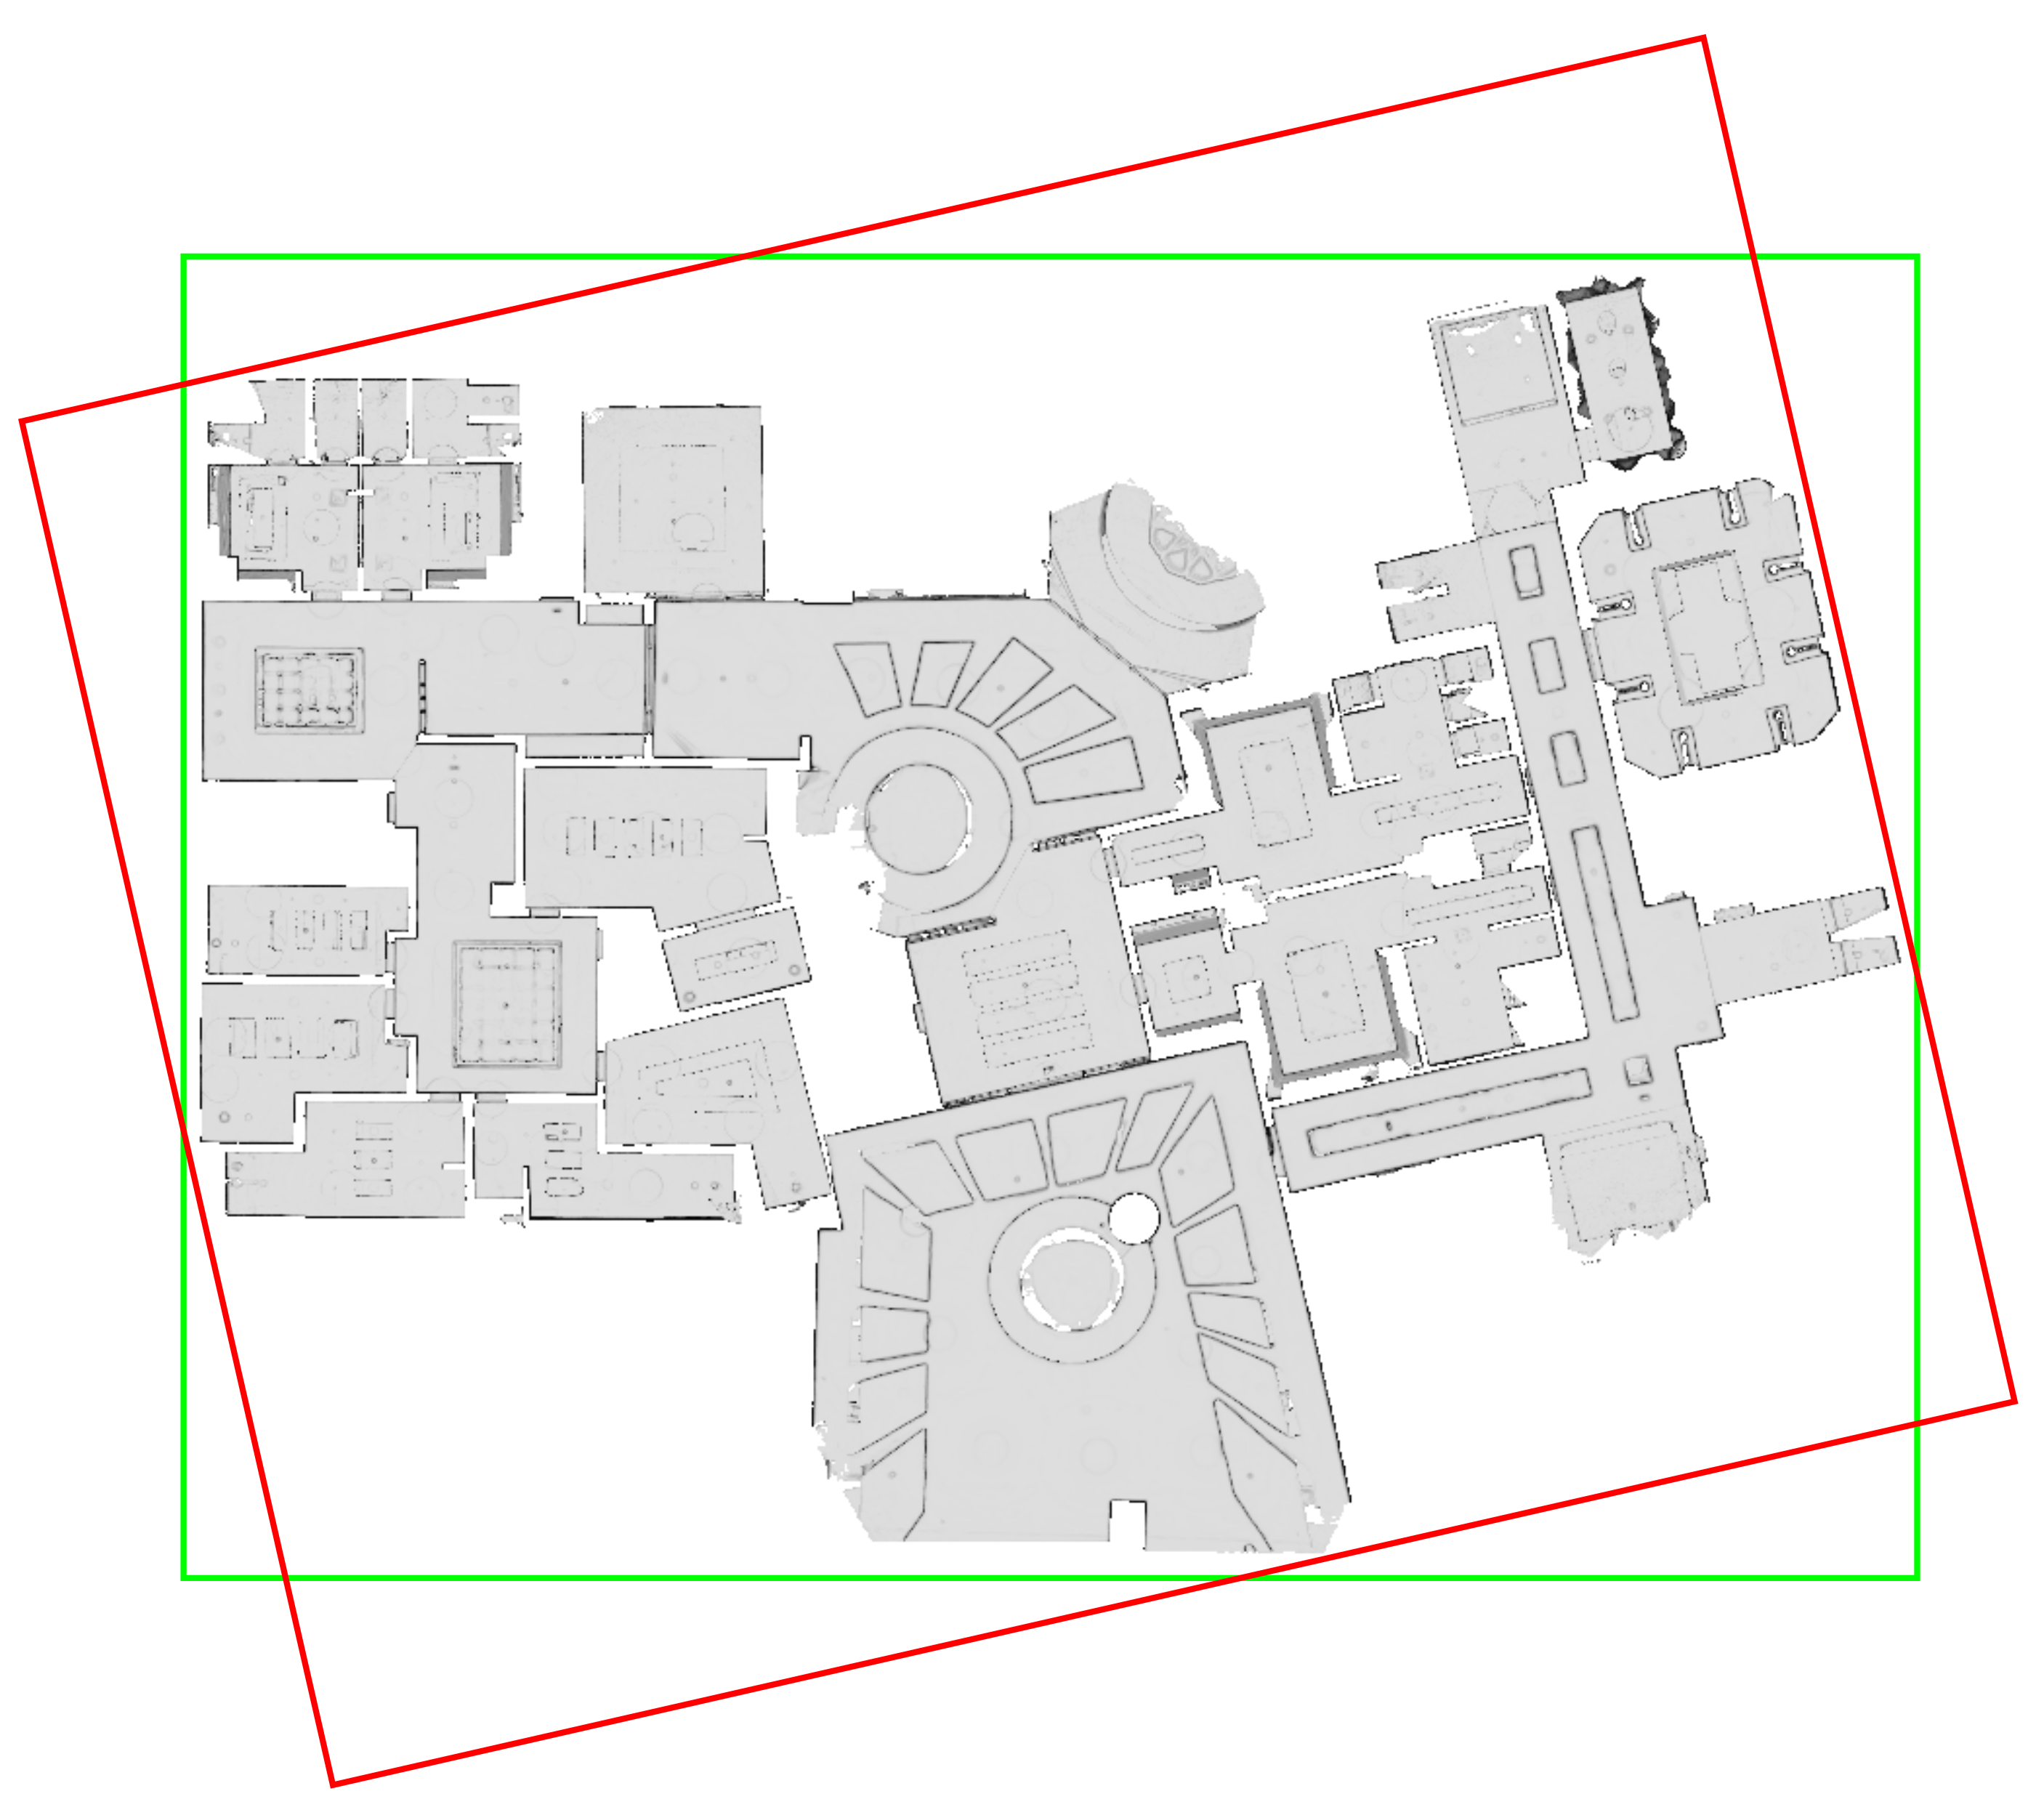
deviations, as the evaluated alignment method favors the larger Manhattan World structure. However, it is surprising that a significant fraction of 17 of the 50 randomly chosen input rotations resulted in a horizontal alignment along the apparently significantly smaller Manhattan World structure.
This situation may be explainable by taking a closer look at the walls constituting the respective Manhattan World structures. As can be seen in
Figure 22, the smaller Manhattan World section on the right-hand side consists of wall surfaces that are generally smooth and completely covered with geometries. In case of the larger section on the left, however, the wall surfaces comprise large window openings that are not represented by geometries, as the Matterport system used for the acquisition of this dataset cannot capture transparent glass surfaces. Furthermore, large parts of the actually represented wall surfaces are covered with curtains or other structures, resulting in inhomogeneous normal vector directions. In consideration of this, it seems plausible that the actual support for both Manhattan World structures present in the building could be approximately equal and the applied alignment method could thus be prone to fluctuate between both Manhattan World systems with varying input rotations.
Besides these two cases discussed so far, there are two further datasets with high average horizontal angular alignment deviations in the evaluation results reported in
Table 1. These are the triangle meshes “ULsKaCPVFJR” and “ur6pFq6Qu1A”, which are also part of the Matterport3D dataset. Unlike the cases discussed before, these however only show heightened mean values for
, while the respective standard deviations are low in a range comparable to the other Matterport3D triangle meshes where the evaluated alignment method proved to be consistently successful.
This suggests that the proposed method consistently results in the same horizontal orientation for all 50 input rotations for both datasets. The respective resulting alignment however deviates from the assumed ground truth pose in the rotation around the vertical axis. This is further illustrated by
Figure 23 and
Figure 24, where it is easily discernible that the depicted buildings again respectively contain two Manhattan World structures and that the evaluated alignment method consistently chooses the respective other Manhattan World structure that does not coincide with the ground truth pose.
Arguably, it is disputable which of the two Manhattan World structures respectively present in the datasets is the “correct” one, as again, in these two examples, both seem to encompass more or less the same fraction of the represented building environment, and it is not readily discernible which is the dominant one. Nevertheless, our proposed method proved to find a reasonable alignment with high accuracy in almost all cases with the only exception being the vertical alignment of the HoloLens triangle mesh “Attic”. In all other cases where the resulting pose deviates from the ground truth pose, the resulting alignment is still reasonable in the sense that it corresponds to another Manhattan World structure inherent in the respective dataset that is readily identifiable by a human observer, even if it may differ from the given ground truth pose corresponding to another alternative Manhattan World structure.
Besides aligning an indoor mapping dataset with the dominant Manhattan World structure supported by the largest fraction of geometries, the proposed method can easily be augmented to identify all major Manhattan World structures along with the respective sets of associated geometries. Among other possible fields of application that will be briefly discussed in the following
Section 5, this allows for providing multiple possible alternatives for alignment to the user to choose from in cases where multiple major Manhattan World structures are present in the dataset at hand and it is not readily apparent which among these to use for alignment.


